Essay

Analysis of Water Source Conservation Driving Factors Based on Machine Learning

1
Department of Urban and Rural Planning, Solux College of Architecture and Design Arts, University of South China, Hengyang 421001, China
2
Hunan Provincial Engineering Research Center for Healthy City Construction, Key Laboratory of Eco-Regional Urban Planning and Management in Hengyang, Department of Urban and Rural Planning, Songlin College of Architecture and Design Arts, University of South China, Hengyang 421001, China
3
Key Discipline Laboratory for National Defense of Biotechnology in Uranium Mining and Hydrometallurgy, University of South China, Hengyang 421001, China
*
Authors to whom correspondence should be addressed.
These authors contributed equally to this work.
Sustainability 2025, 17(4), 1713; https://doi.org/10.3390/su17041713
Submission received: 8 January 2025 / Revised: 9 February 2025 / Accepted: 10 February 2025 / Published: 18 February 2025

Abstract

:
This study focuses on the spatiotemporal dynamic changes in water retention capacity and the nonlinear research of its influencing factors. By using the InVEST model, the changing trends of water retention capacity in different regions and at various time scales were analyzed. Based on this, the results were further examined using the CatBoost model with SHAP (SHapley Additive exPlanations) analysis and PDP (Partial Dependence Plot) analysis. The results show the following: (1) From 2003 to 2023, the water conservation capacity first increased and then decreased, and spatially, the water conservation capacity of the mountainous area in the west of the Yiluo River Basin and Xionger Mountain in the middle part of the basin increased as a whole. At the same time, the forest land in the basin contributed more than 60% of the water conservation capacity. (2) Precipitation is the most significant driving factor for water conservation in the basin, and plant water content, soil type, and temperature are also the main driving factors for water conservation in the Yiluo River Basin. (3) The interaction between temperature and other influencing factors can significantly improve water conservation. This research not only provides scientific evidence for understanding the driving mechanisms of water conservation but also offers references for water resource management and ecological protection planning.

1. Introduction

Water resources are crucial for sustainable human social development. The increasingly prominent issue of water scarcity emphasizes the importance of sustainable water cycle development [1]. Water conservation, referring to an ecosystem’s ability to intercept, store, and regulate precipitation during the water cycle, involves multiple processes, including rainfall interception, evaporation, and infiltration [2]. It plays a vital role in terrestrial ecosystem services [3], affecting regional water cycles and resource allocation [4], while also positively contributing to regional climate regulation and soil conservation [5]. Therefore, identifying key driving factors of watershed water conservation capacity positively impacts optimizing regional water cycles and enhancing regional ecosystem services.
Water conservation calculation primarily involves two approaches: hydrological models such as SWAT [6], VIC [7], SCS-CN [8], and Terrain Lab models [9], which calculate water conservation based on rainfall storage methods; and ecosystem service assessment models like InVEST, which estimate vegetation and soil water retention processes based on water vapor balance [10]. Currently, InVEST and SWAT models are widely used [11,12,13], with InVEST capable of estimating regional water conservation under limited data conditions, offering simpler operation [14]. According to current research, InVEST model calculations of water conservation have been extensively applied in various regional analyses, including the following: studying spatial changes in the water conservation of Dongting Lake (DT) and Poyang Lake (PY) wetlands and analyzing the spatial heterogeneity driving mechanisms of homogeneous wetland water conservation [15]; using the InVEST model to study the evolution of water retention in the Qilian Mountain area; the water conservation function of the region exhibits significant spatial variability, gradually increasing from northwest to southeast [16]; studying climate change impacts on water conservation capacity in the Upper Mekong River Basin (UMRB) [17]; and simulating future water conservation in the Three-River Source Region (TRSR) [18]. Numerous studies confirm the InVEST model’s advantages in regional water conservation capability assessment.
Current research on the driving factors of water conservation lacks the explanation and analysis of nonlinear results. According to the existing research, the analysis of the driving factors of water conservation mainly uses geographical detectors [19] and other statistical analysis methods [20,21,22,23], and tends to study typical areas and the influence of specific driving factors [24,25,26,27]. For instance, the impact of lithology on water conservation in the karst areas of southern China has been analyzed [28], and the roles of annual precipitation and land use in water conservation have been emphasized in Yunnan Province and the Qilian Mountain area [29,30]. Research results on the driving factors of water conservation in the Qinghai–Tibet Plateau region have highlighted precipitation and NDVI as key characteristic factors [31]. These findings have laid the foundation for further research on the mechanisms of action of typical areas and specific driving factors. However, geographical detectors and other linear analysis methods are mainly used to identify the degree of influence of driving factors and the main influencing factors [32,33], and they do not adequately explain the mechanisms of influence of these factors. There is a lack of in-depth analysis on how driving factors affect water conservation, and the results of the analysis of driving factors for water conservation in the Yellow River Basin also indicate the existence of nonlinear relationships between water conservation and driving factors [34], which also highlights the inadequacies of current analyses of the driving factors of water conservation [35].
Machine learning models can capture and model complex nonlinear relationships between inputs and outputs, such as those demonstrated by models like Random Forest [36], LightGBM [37], and XGBoost [38], which have shown significant performance in dealing with nonlinear relationships. To explain the results of machine learning, SHAP (SHapley Additive exPlanations) analysis [39] and PDP (Partial Dependence Plot) analysis are used for interpretability analysis of machine learning model results. For example, machine learning models have been used to quantify the relative contribution rates of geographical environments and vegetation characteristics to the susceptibility of shallow landslides in the eastern mountainous areas of Sichuan [40]; XGBoost–SHAP models have been applied to analyze the driving factors of ecosystem service changes in the karst areas of southeastern Yunnan [41]; Random Forest (RF) + PDP interpretability analysis has been used to quantify the driving factors of the urban environment on surface temperatures in the central urban area of Shanghai [42]; and single features and interaction features have been explained for local factors influencing floods [43]. These studies have proven the reliability of using machine learning for driving factor analysis. Therefore, this article uses machine learning models to analyze the driving factors of water conservation, supplementing the current lack of research on nonlinear relationships in water conservation.
The Yiluo River Basin, as a first-class tributary of the Yellow River [44] and a water conservation area [45], is significant for ecological protection and water resource management. This article uses the InVEST model to quantitatively analyze changes in water conservation in the Yiluo River Basin from 2003 to 2023. Based on this, a relationship model between water conservation as the dependent variable and driving factors is constructed using the machine learning algorithm CatBoost. Subsequently, SHAP and PDP methods are applied to interpret the model results. The purpose of our research is, based on the derived variable of water conservation in the Yiluo River Basin, to achieve nonlinear research on the driving factors of water conservation through the application of machine learning algorithms. The research results fill the current gap in nonlinear research on the driving factors of water conservation and also provide a scientific basis for regional ecological protection and water resource management, promoting the sustainable and healthy development of the river basin.

2. Methods and Materials

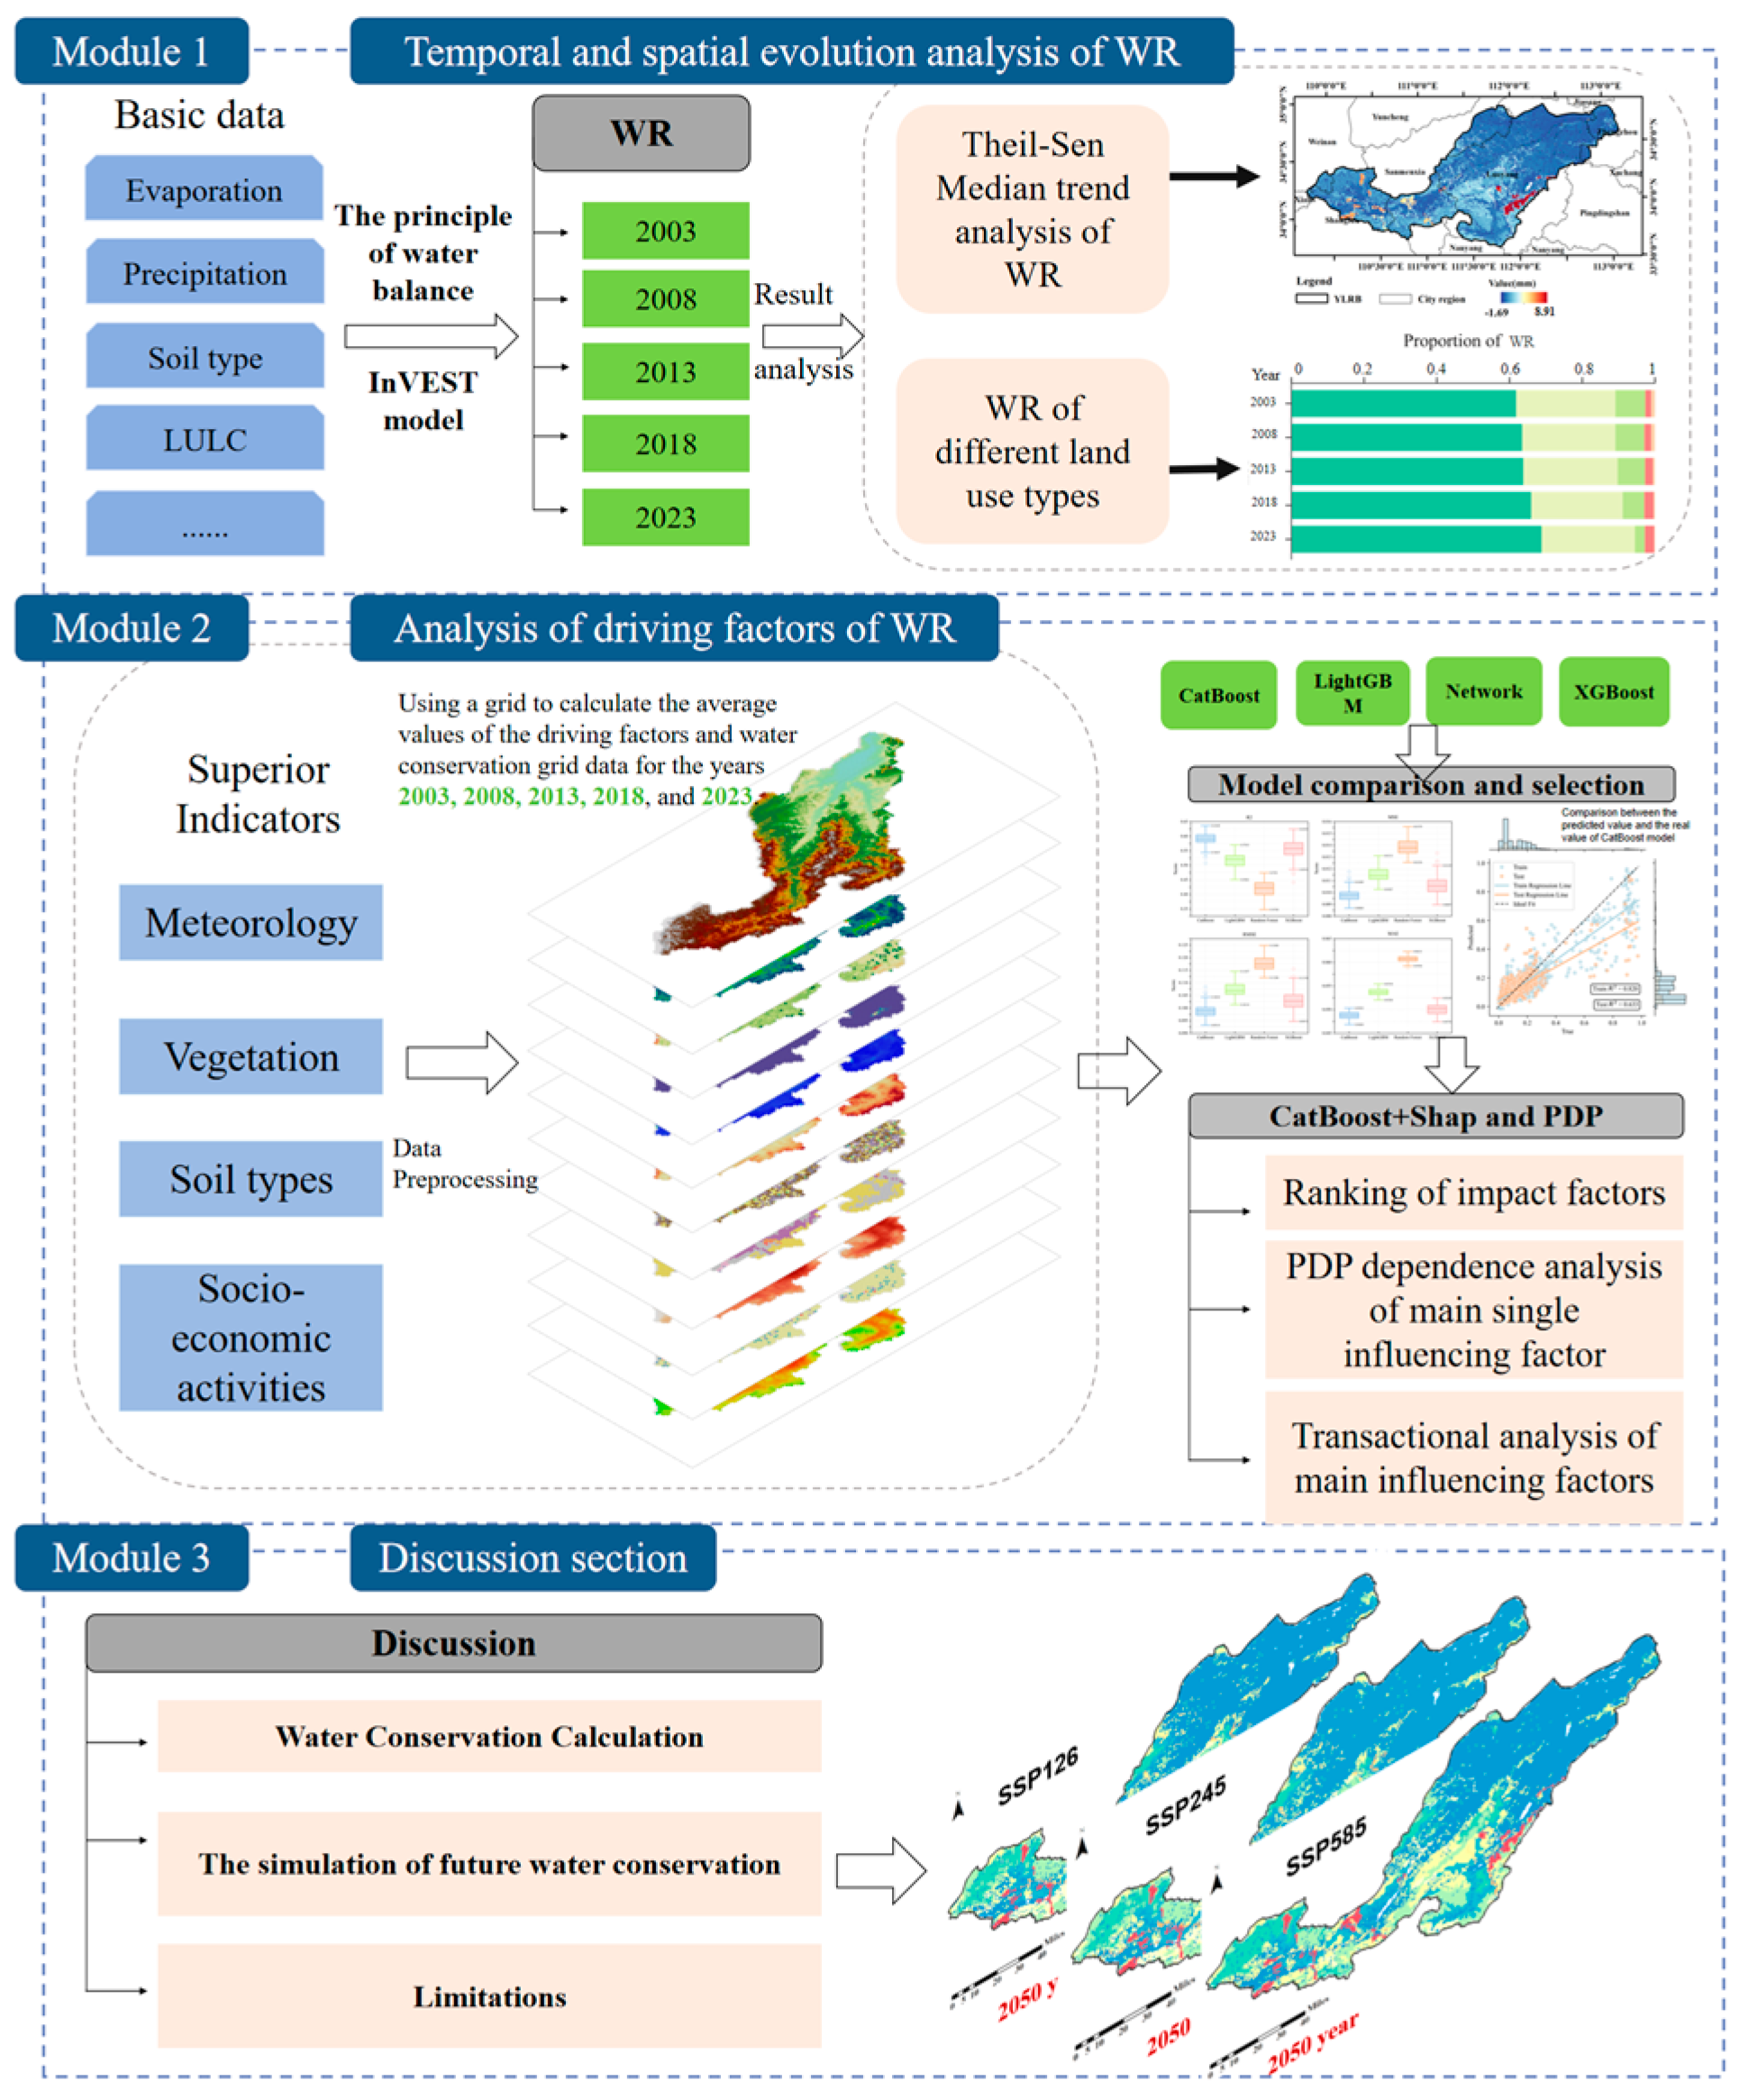
2.1. Research Framework

The framework of this paper is divided into three parts. In the first part, the dependent variable water conservation is obtained through InVEST model. The second part is divided into three sections: 1. screening impact factors and data processing; 2. after comparing multiple models, the CatBoost model is selected as the basic model; 3. a visual analysis of the nonlinear relationship between environmental factors and oxygen content of water sources in the basin by SHAP and PDP. The third part predicts the oxygen content of water sources in 2050 based on the analysis of driving factors.
This study is mainly divided into the following three parts, as shown in Figure 1.

2.2. Spatiotemporal Evolution Analysis of Water Retention

InVEST Model

The InVEST model is an ecosystem decision support system jointly developed by Stanford University, The Nature Conservancy, and the World Wildlife Fund [46]. Based on water balance principles, the model calculates water retention by subtracting actual evapotranspiration from precipitation to obtain water yield. Water retention is derived after adjusting water yield using a topographic index, soil saturated hydraulic conductivity, and the flow velocity coefficient. Compared to similar models, InVEST is applicable to watersheds of various scales, offering broader applicability and operational convenience. The calculation formula is as follows [47]:
W R = m i n 1 , 249 V × m i n 1 , 0.9 × T I 3 × m i n 1 , K S 300 × Y
where W R is the water yield (mm); K S is the soil saturated hydraulic conductivity (cm/d), calculated according to Equation (2), obtained by using Neuro Theta 1.0; V is the velocity coefficient; T I is the topographic index, dimensionless, calculated according to Equation (3); Y is the water yield, calculated through Equation (4).
The soil saturated hydraulic conductivity is calculated using the Cosby soil transmission formula:
K s = 1.148 × 10 0.6 + 1.26 × 10 2 c 2 6.4 × 10 3 c 1
where K s represents the soil’s saturated hydraulic conductivity (m/d); c 1 and c 2 denote the respective percentages of clay and sand content in the soil. The topographic index is derived from the watershed’s DEM, with the formula being
T I = l g D S × P
where D is the number of catchment grid cells, dimensionless; S is the soil depth (mm); and P is the percentage slope, calculated from the watershed DEM.
Y = 1 A E T x p x p x
where A E T x represents the actual evapotranspiration of grid cell x (mm); and p x represents the annual precipitation of grid cell x (mm).

2.3. Analysis Methods for Water Retention Driving Factors

2.3.1. Machine Learning Model

(1)
CatBoost
CatBoost is an efficient gradient boosting framework (GBDT) that enhances model predictive capability by combining multiple weak learners (typically decision trees). It features advantages in handling categorical features and reducing overfitting, providing efficient and interpretable models particularly suitable for classification and regression tasks. CatBoost has a significant advantage over XGBoost and LightGBM when it comes to handling categorical features. Unlike traditional gradient boosting models, CatBoost uses only partial training data in each iteration to avoid prediction bias from direct target value dependency. Through ordered boosting, CatBoost updates the model based on the historical sequence of data. When processing ordered target statistics, it calculates specific statistics for each category based on previous data, with detailed calculation formulas available in reference [48].
x i k = j = 1 p 1 x σ j , k = x σ p , k Y σ j + a · P j = 1 p 1 x σ j , k = x σ p , k Y σ j + a
where a is weight coefficient (a > 0); P is the prior term added.
(2)
LightGBM
A high-efficiency gradient boosting framework (GBDT) that, in each iteration, builds decision trees (Bagging) to successively fit the residuals of the previous model, thereby enhancing accuracy. It offers good training efficiency and effectiveness in classification tasks. Compared to the gradient boosting framework (GBDT), LightGBM introduces histograms to accelerate the construction of decision trees; it divides feature values into multiple intervals (bins) to build histograms, which increases training speed. Moreover, in the selection of splitting at leaf nodes, LightGBM uses a leaf growth strategy (Leaf-wise Growth) that prioritizes splitting the leaf with the largest error.
(3)
XGBoost
Also based on the gradient boosting framework (GBDT), it enhances performance by introducing regularization, accelerating training, and enabling parallel computation. The introduction of regularization considers not only the fitting error but also the depth of the decision trees, effectively preventing overfitting and improving the model’s generalization ability. XGBoost incorporates column sampling to ensure the accuracy of training results while accelerating the training process.
(4)
Random Forest
In classification tasks, it classifies by integrating the prediction results of multiple decision trees (Bagging). Each decision tree is relatively independent and classifies input samples to produce a class label. The overall result output is the majority of all tree predictions, selecting the class label that appears most frequently as the classification result. The relative independence of the decision trees helps reduce overfitting, but the characteristics of the Random Forest ensemble model also make it difficult to explain the decision-making process as easily as a single decision tree, and it has higher memory consumption.

2.3.2. SHAP Analysis

The SHAP (SHapley Additive exPlanations) method, derived from the Shapley value concept in cooperative game theory, aims to fairly allocate participants’ benefits in cooperation. This method applies this concept to machine learning, particularly for explaining “black box” model predictions by calculating each feature’s contribution to prediction results. It establishes an additive explanation model, treating all features as “contributors”, with each feature in every prediction sample corresponding to a SHAP value indicating its influence on predictions. The specific formula is [49]
ϕ P = S { x 1 , , x p } \ { x p } S ! P S 1 ! P ! f S { x p } f S
where ϕ P represents the Shapley value of feature p; S denotes the subset of feature variables included in the model; x p is the value vector of feature p; P refers to the total number of input features; f S refers to the predicted output of feature values in set S; f(x) is the linear function of feature variable Shapley values.

2.3.3. PDP Correlation Analysis

PDP analysis places more emphasis on the analysis of local features and can perform marginal analysis on the interaction of univariate or bivariate variables [50]. PDP analysis demonstrates the impact of one or two feature variables on model prediction results, showing approximately linear, monotonic, or more complex relationships, and clearly indicating positive or negative correlations between independent and dependent variables. By marginalizing other features, PDP analysis reveals relationships between features of interest and prediction results, analyzing the marginal effects of independent variables on dependent variables. Compared to SHAP’s global or local interpretations, PDP analysis focuses more on local variable interpretation. Therefore, this study employs PDPs (Partial Dependence Plots) to complement the local interpretation aspects of SHAP analysis. The specific formula is [51]
f ^ s x s = E X C = f ( ^ x s , X C ) f ( ^ x s , X C )   d P ( X C )
where x s is the currently analyzed feature, X C represents remaining features, and partial dependence operates by marginalizing f ^ output over the distribution of features in set c.

2.4. Data Sources

2.4.1. Water Conservation Data Sources

This study utilized fundamental data, including land use data, precipitation data, evapotranspiration data, Digital Elevation Model (DEM) data, and soil data. The detailed data sources are shown in Table 1.

2.4.2. Impact Factor Data Sources

This study draws upon domestic and international research findings regarding the influences of topography, soil, meteorology, and socioeconomic activities on water conservation [60,61,62]. The data sources are detailed in Table 2.

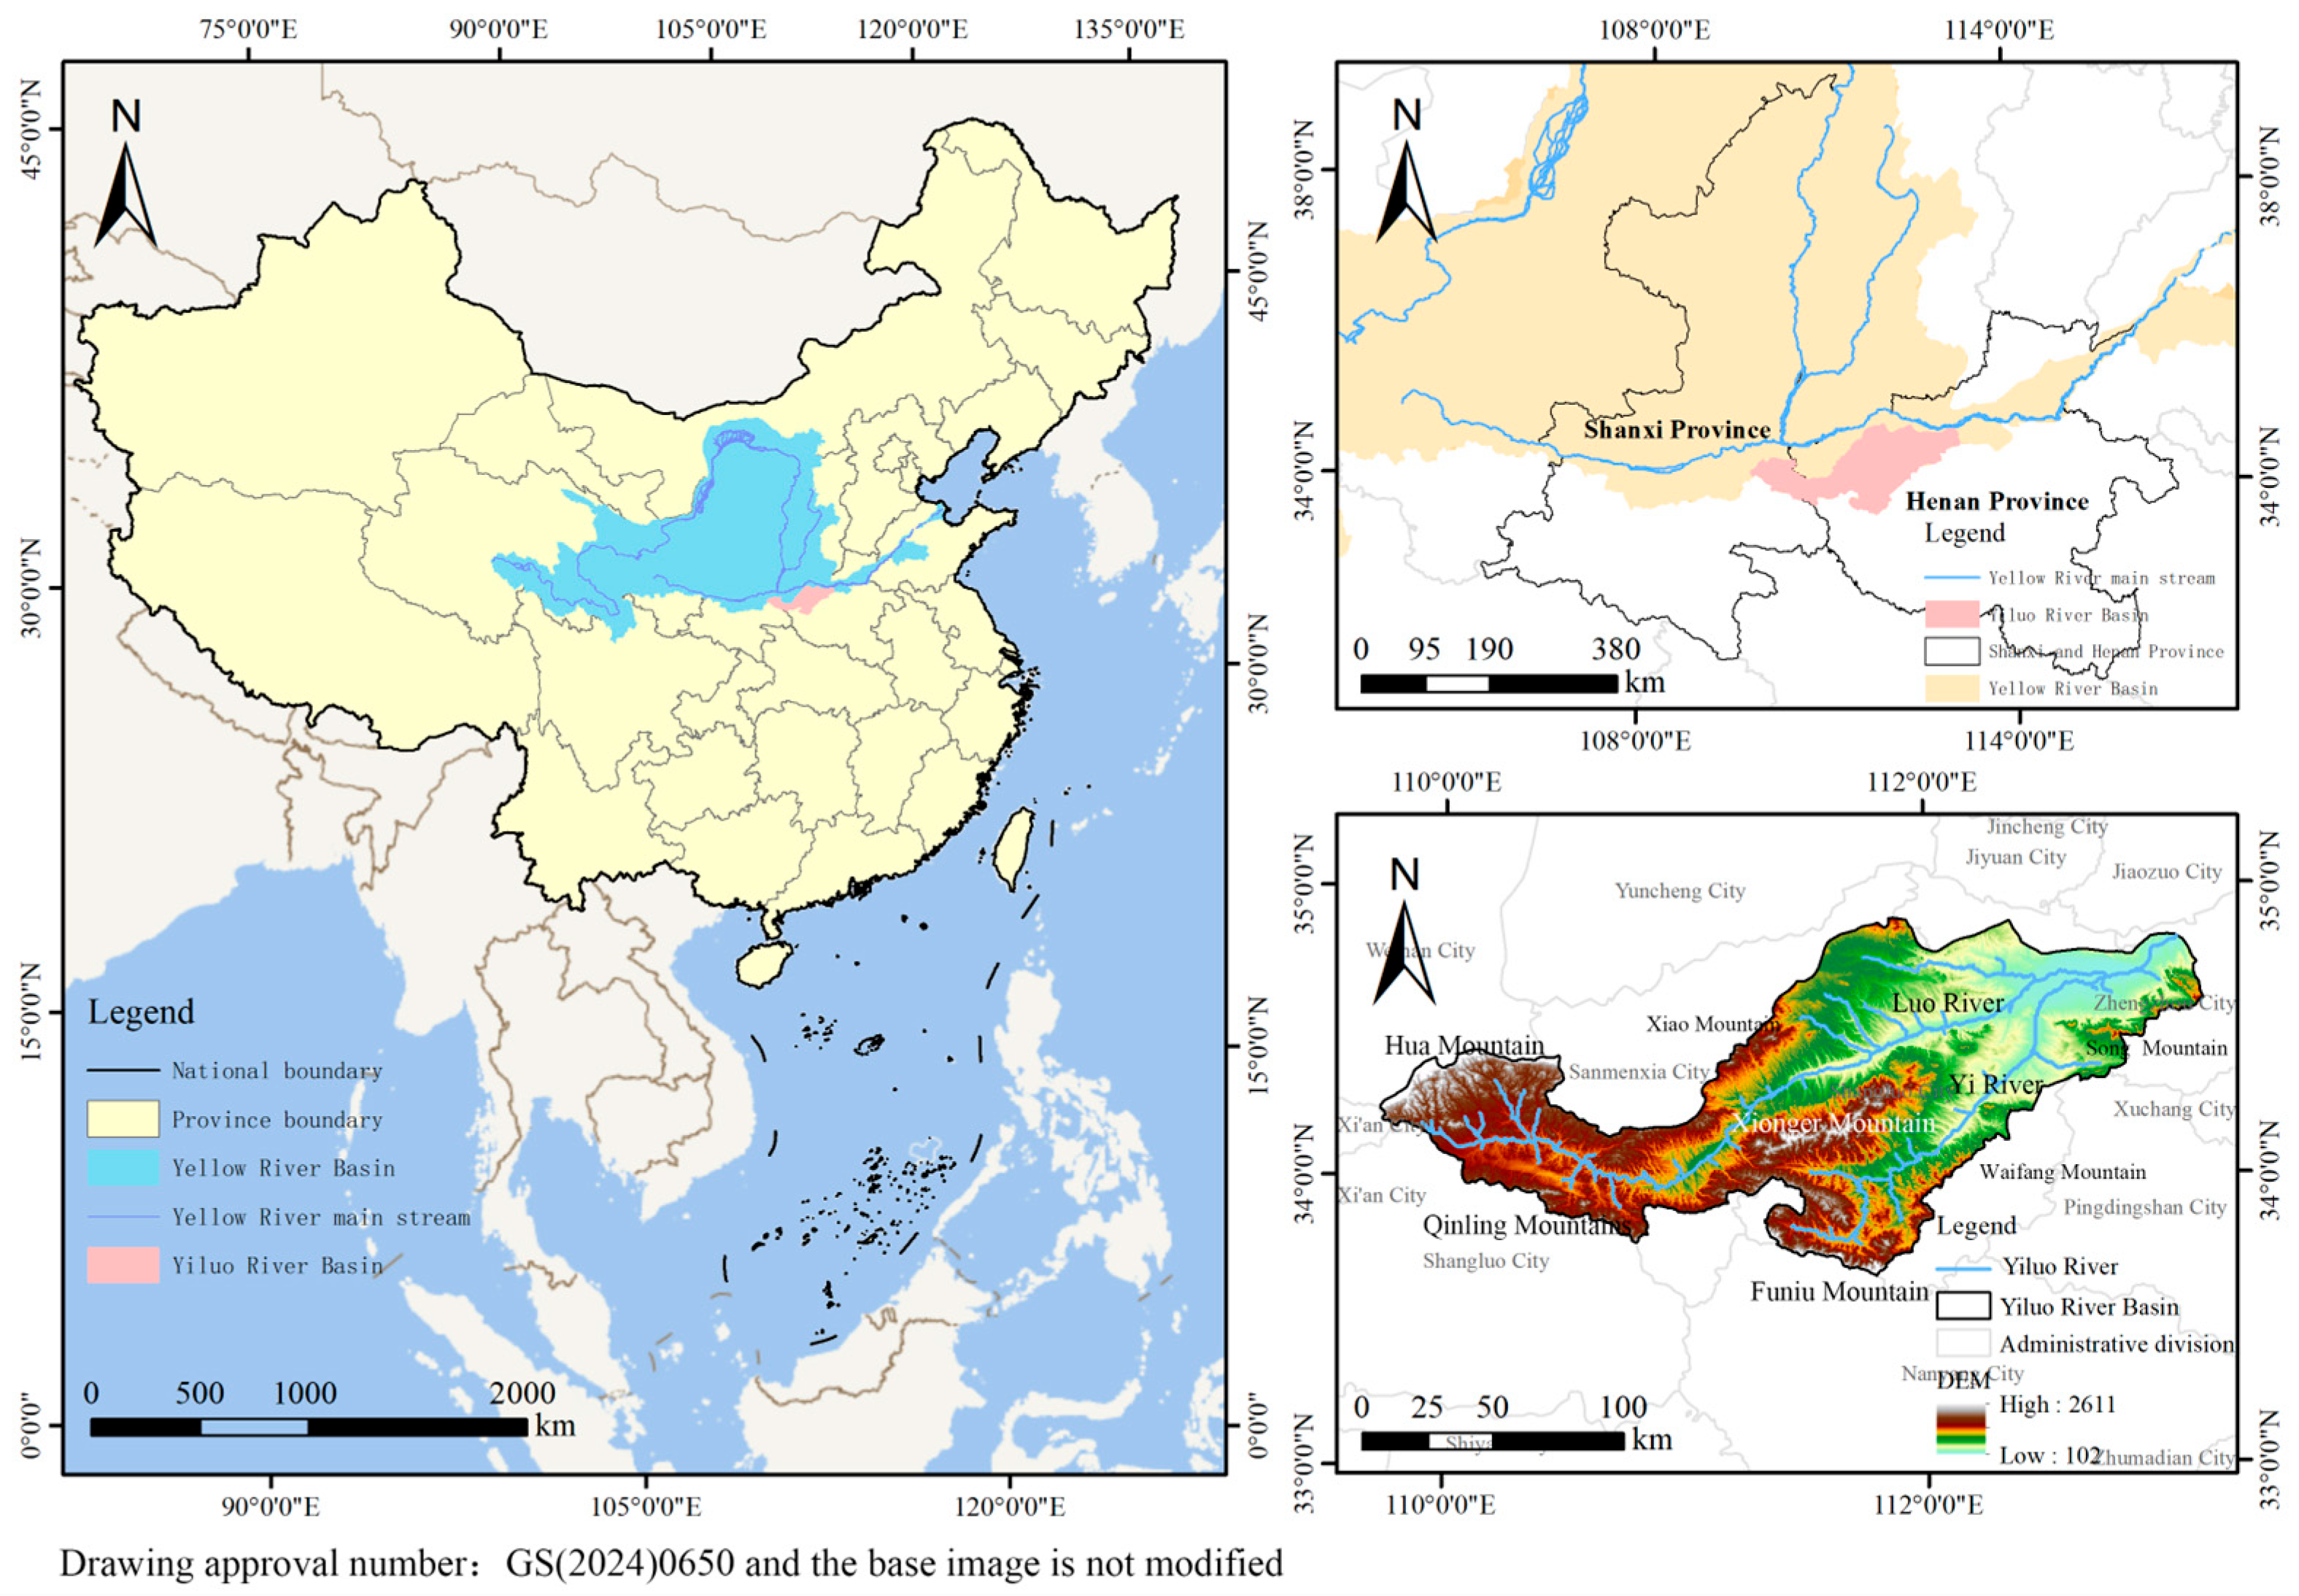
3. Study Area Overview

The Yiluo River Basin is located at the boundary between the middle and lower reaches of the Yellow River, spanning the second and third terrain steps of China. The terrain descends from west to east with steep northern slopes and gentle southern slopes, having an elevation difference of 2543.6 m. The complex topography comprises 52.4% mountains, 39.7% loess hills, and 7.9% alluvial plains (valleys). Mountain ranges, including Mount Hua, Mount Xiao, Qinling Mountains, Xiong’er Mountains, and Funiu Mountains, extend from north to south. The basin has a humid to semi-humid continental monsoon climate, characterized by hot, rainy summers and cold, snowy winters, with an average annual precipitation of approximately 660 mm [66]. The basin spans the western Henan and eastern Shaanxi provinces and is bounded by Mount Hua and Mount Xiao to the north, with the Funiu Mountains separating it from the Yangtze River system to the south, and it is adjacent to Waifang Mountain and the Huai River to the east, covering an area of approximately 18,600 square kilometers. The Yiluo River is formed by the confluence of the Luo River and Yi River, with the Luo River being the main stem originating from Mupengou in Luonan City, Shaanxi Province (or the southern foot of Mount Hua), and the Yi River originating from the Xiong’er Mountains. The two rivers converge in the Luoyang Plain before flowing into the Yellow River. Therefore, the Yiluo River Basin possesses unique natural conditions and research advantages for studying water conservation capacity (Figure 2).

4. Results

4.1. Spatiotemporal Evolution Analysis of Water Conservation

4.1.1. Verification of Water Retention Simulation Accuracy

The InVEST model employed in this study features a region-specific parameter, the Z value (seasonal precipitation constant), which necessitates adjustment to validate the simulation outcomes. The Z value is fine-tuned by computing the water yield coefficient, with an inverse relationship between the Z value and water yield. Referring to the “Comprehensive Plan for the Yiluo River Basin” [67], the mean annual water yield coefficient derived from the long-term water yield and rainfall data of the Yiluo River is 0.259. The InVEST model calculates an average water yield coefficient of approximately 0.263. The close alignment of these results underscores the model’s high precision in water yield simulation, thereby boosting the dependability of the water retention simulation [68].

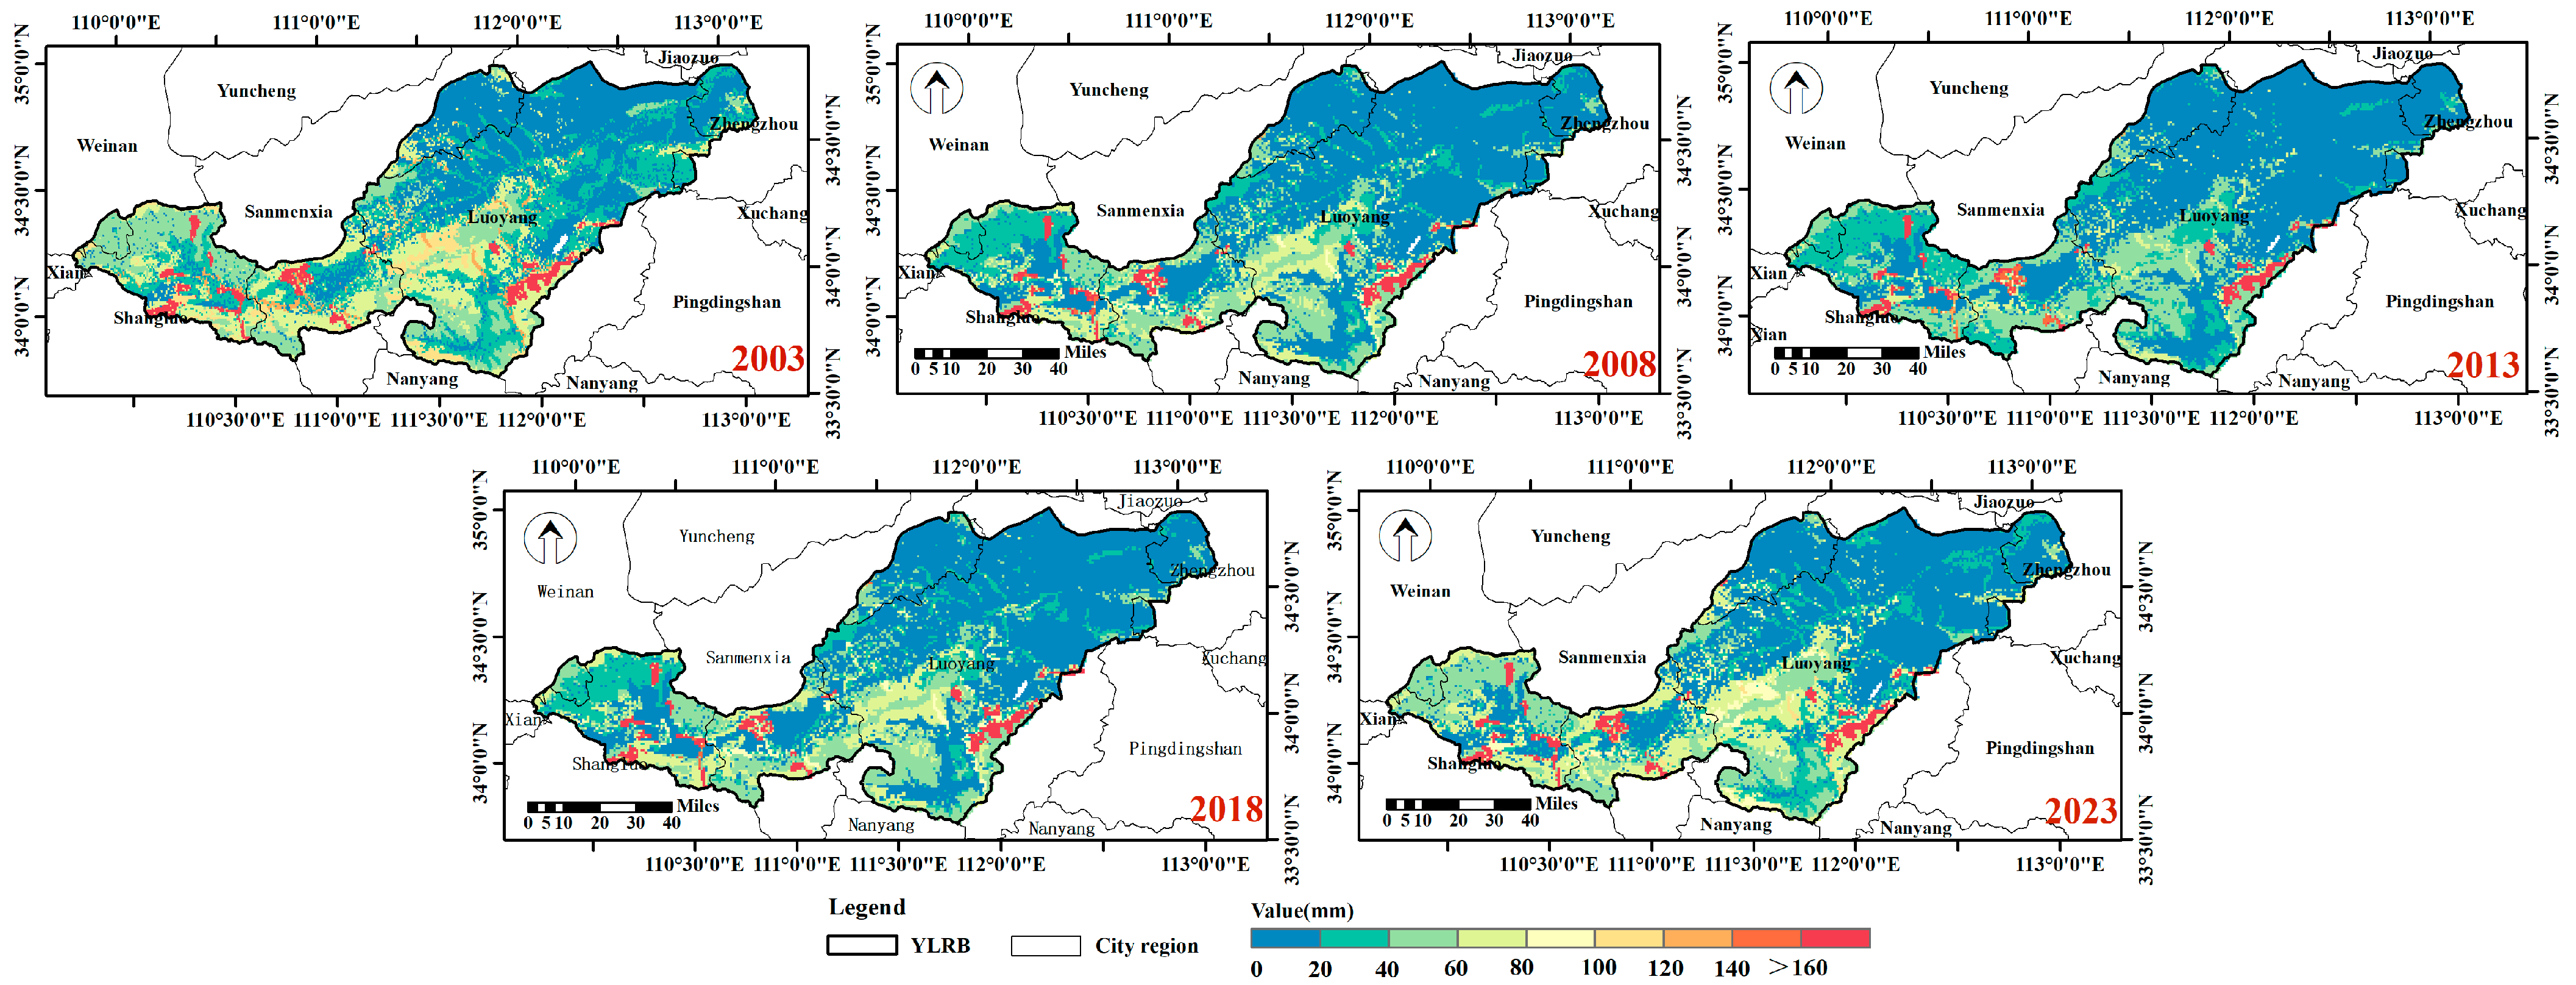
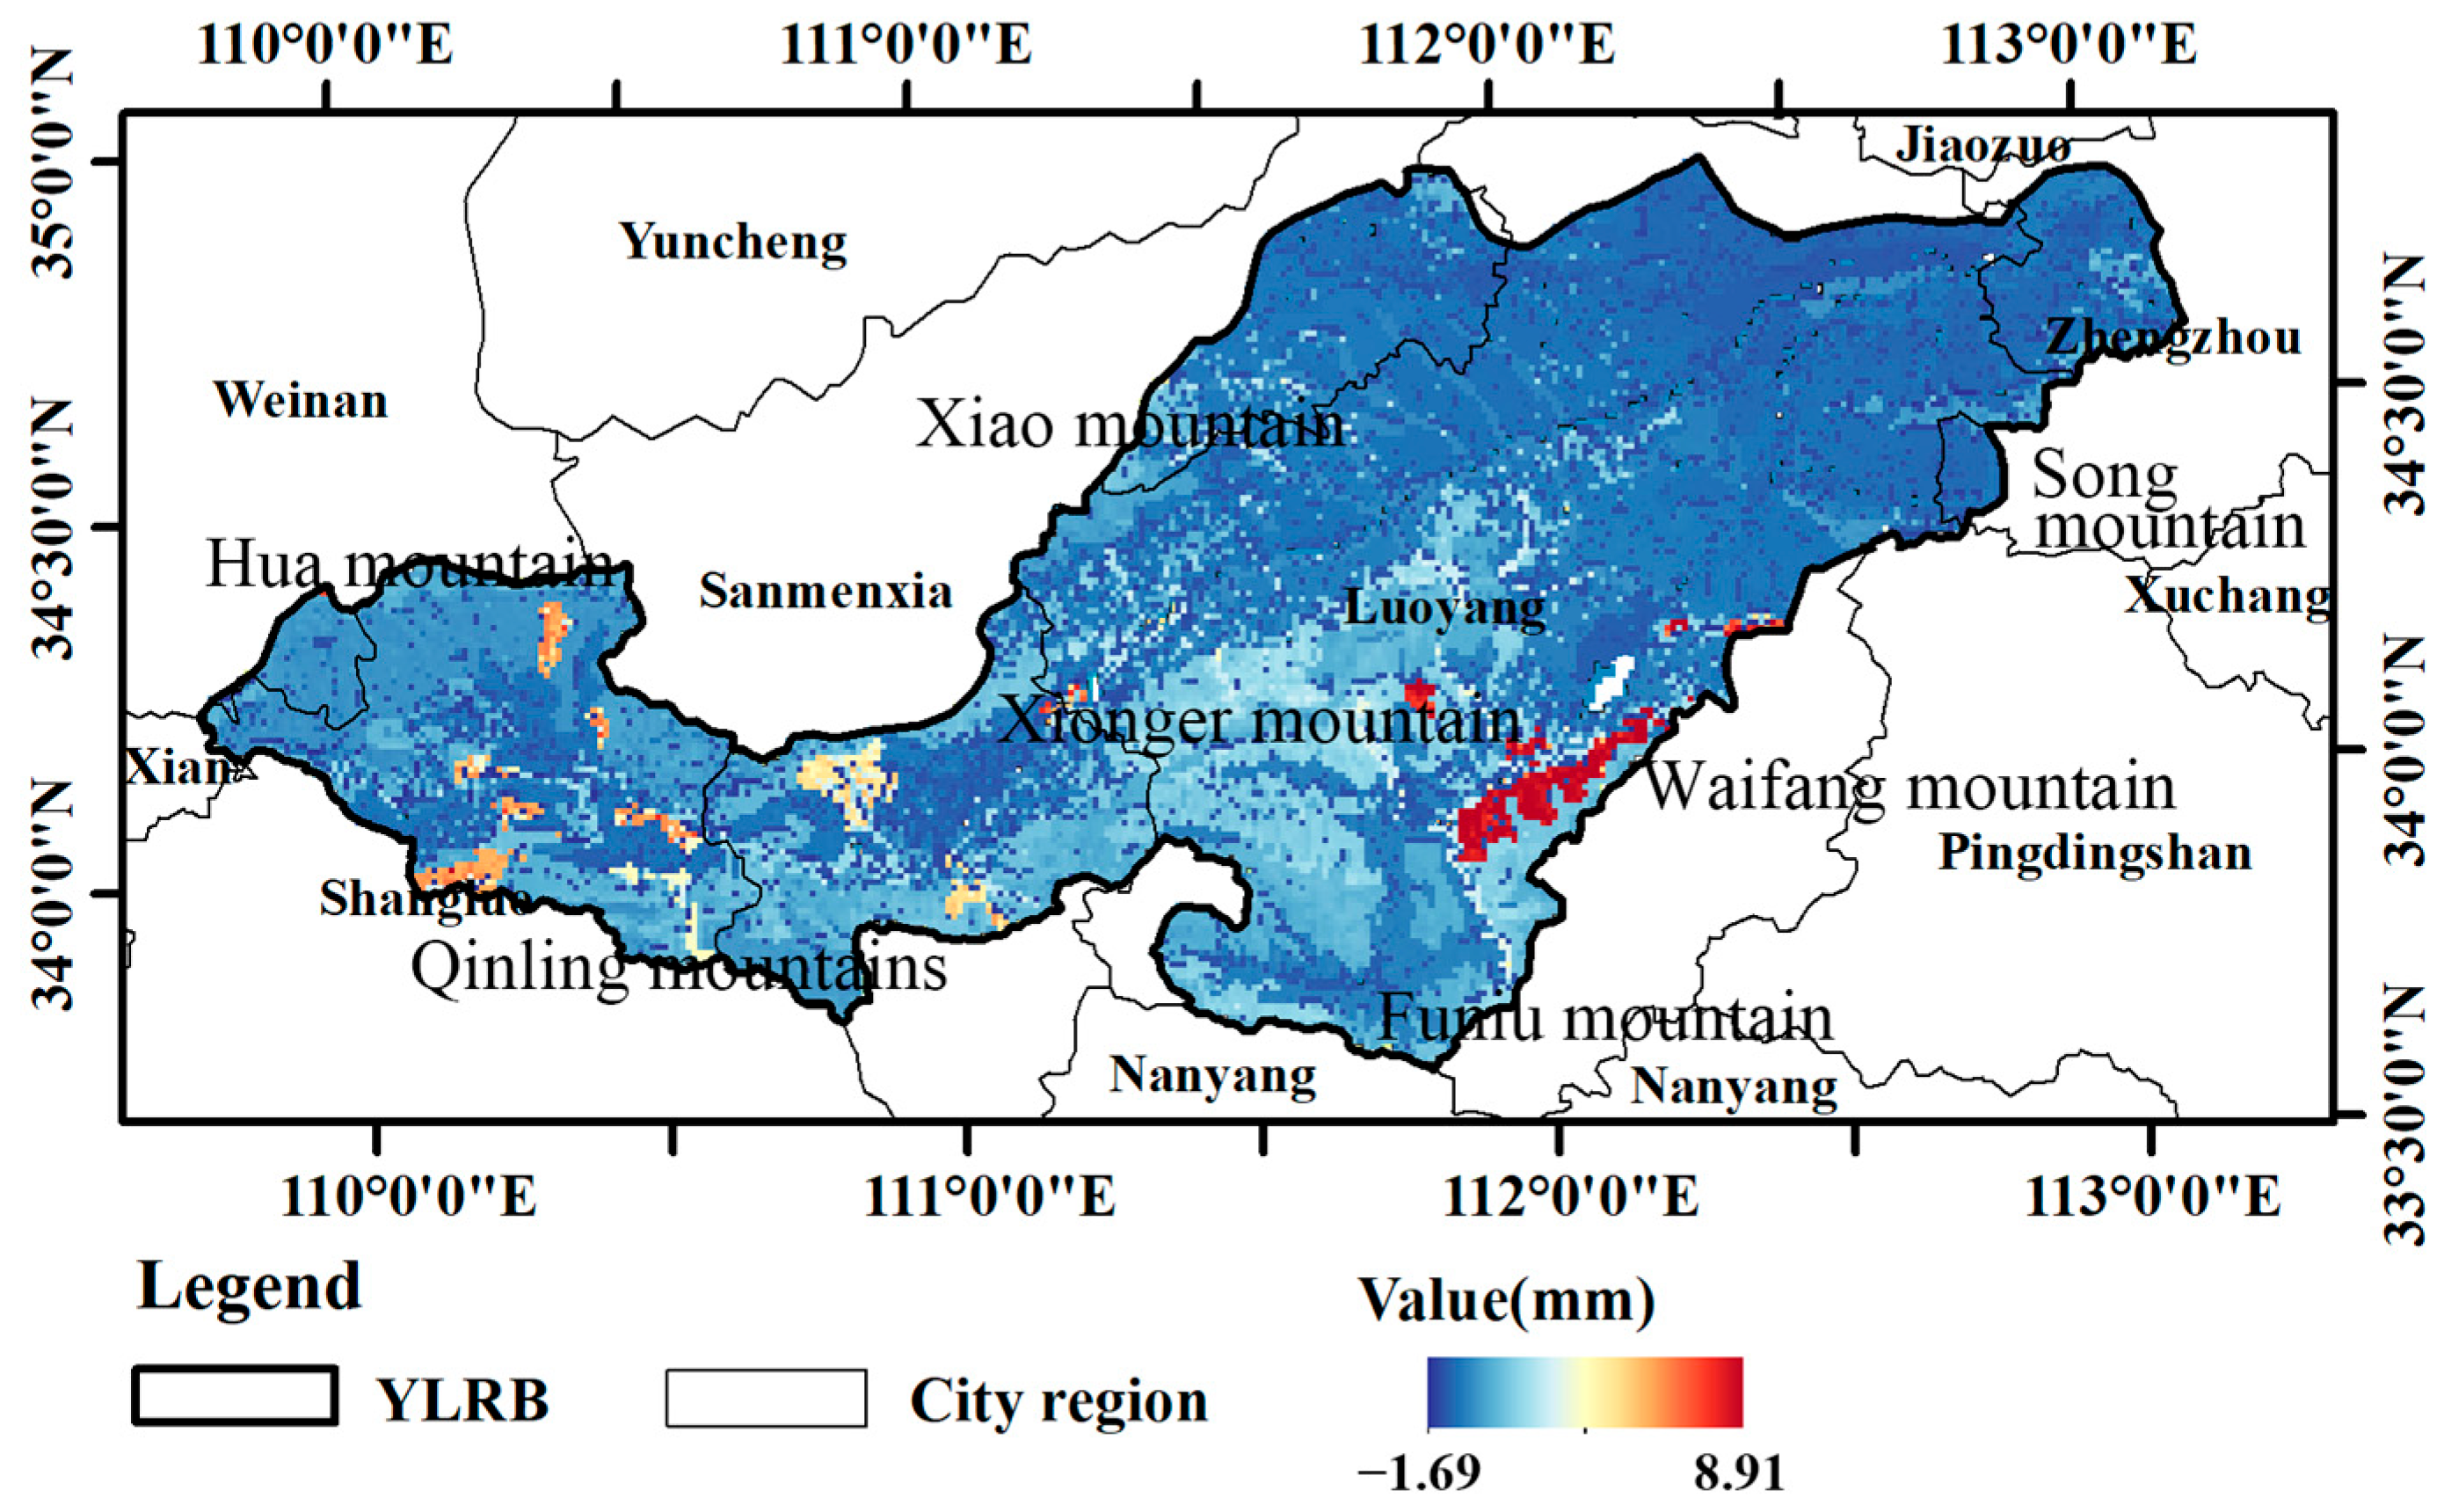
4.1.2. Spatial Evolution Characteristics of Water Conservation

Using the InVEST model to analyze water conservation in the Yiluo River Basin for 2003, 2008, 2013, 2018, and 2023, statistical analysis shows that the average water conservation from 2003 to 2023 was 9.8 mm (Figure 3). While significant interannual variations exist in the basin’s water conservation, it remained generally stable. The highest water conservation value was recorded in 2003 at 261,796 mm, while 2013 and 2018 showed decreases compared to 2003, particularly in 2013, when it dropped to 141,277 mm. Subsequently, the values rebounded to 161,918 mm and 193,985 mm in 2018 and 2023, respectively, while 2008 recorded 163,103 mm. The results show that the environment also shows an overall trend from destruction to recovery [69], By analyzing water harvesting, we can identify changes in the ecological environment of the watershed, make a reliable assessment of the development of the watershed [70], and formulate policies for the sustainable development of the region in a changing environment.
Spatially, higher water conservation values can be observed in the southeastern side of Xionger Mountain, the northern side of Funiu Mountain, and areas such as the Waifang Mountain, particularly in the southwestern mountainous region of Luoyang City. These can be attributed to their extensive forest coverage and high vegetation density. Meanwhile, rapid urbanization has negatively impacted water conservation along both banks of the Yi and Luo Rivers, showing a declining trend. This decline was particularly pronounced along the Luo River banks between 2008 and 2013 (Figure 3).
Using the Theil–Sen slope estimation, a robust non-parametric statistical method [71], a trend analysis of water conservation from 2003 to 2023 revealed spatial evolution characteristics over time (Figure 4). Significant increases in water conservation were observed in the southeastern foothills of the Xionger Mountains, the northern Funiu Mountains, and the western Waifang Mountain (located in the eastern Qinling Mountains). These foothill regions, characterized by abundant precipitation and extensive forest coverage, not only provide water storage space but also enhance air humidity through plant transpiration, promoting water resource circulation and conservation [72]. In contrast, urban centers, including Luoyang City, showed declining water conservation trends. Notably, Luoyang’s urban area expanded from 120 km2 in 2003 to 660 km2 in 2023. This change likely relates to land use modifications and hydrological–geological alterations from urbanization, reflecting the environmental protection challenges in urban development [73].

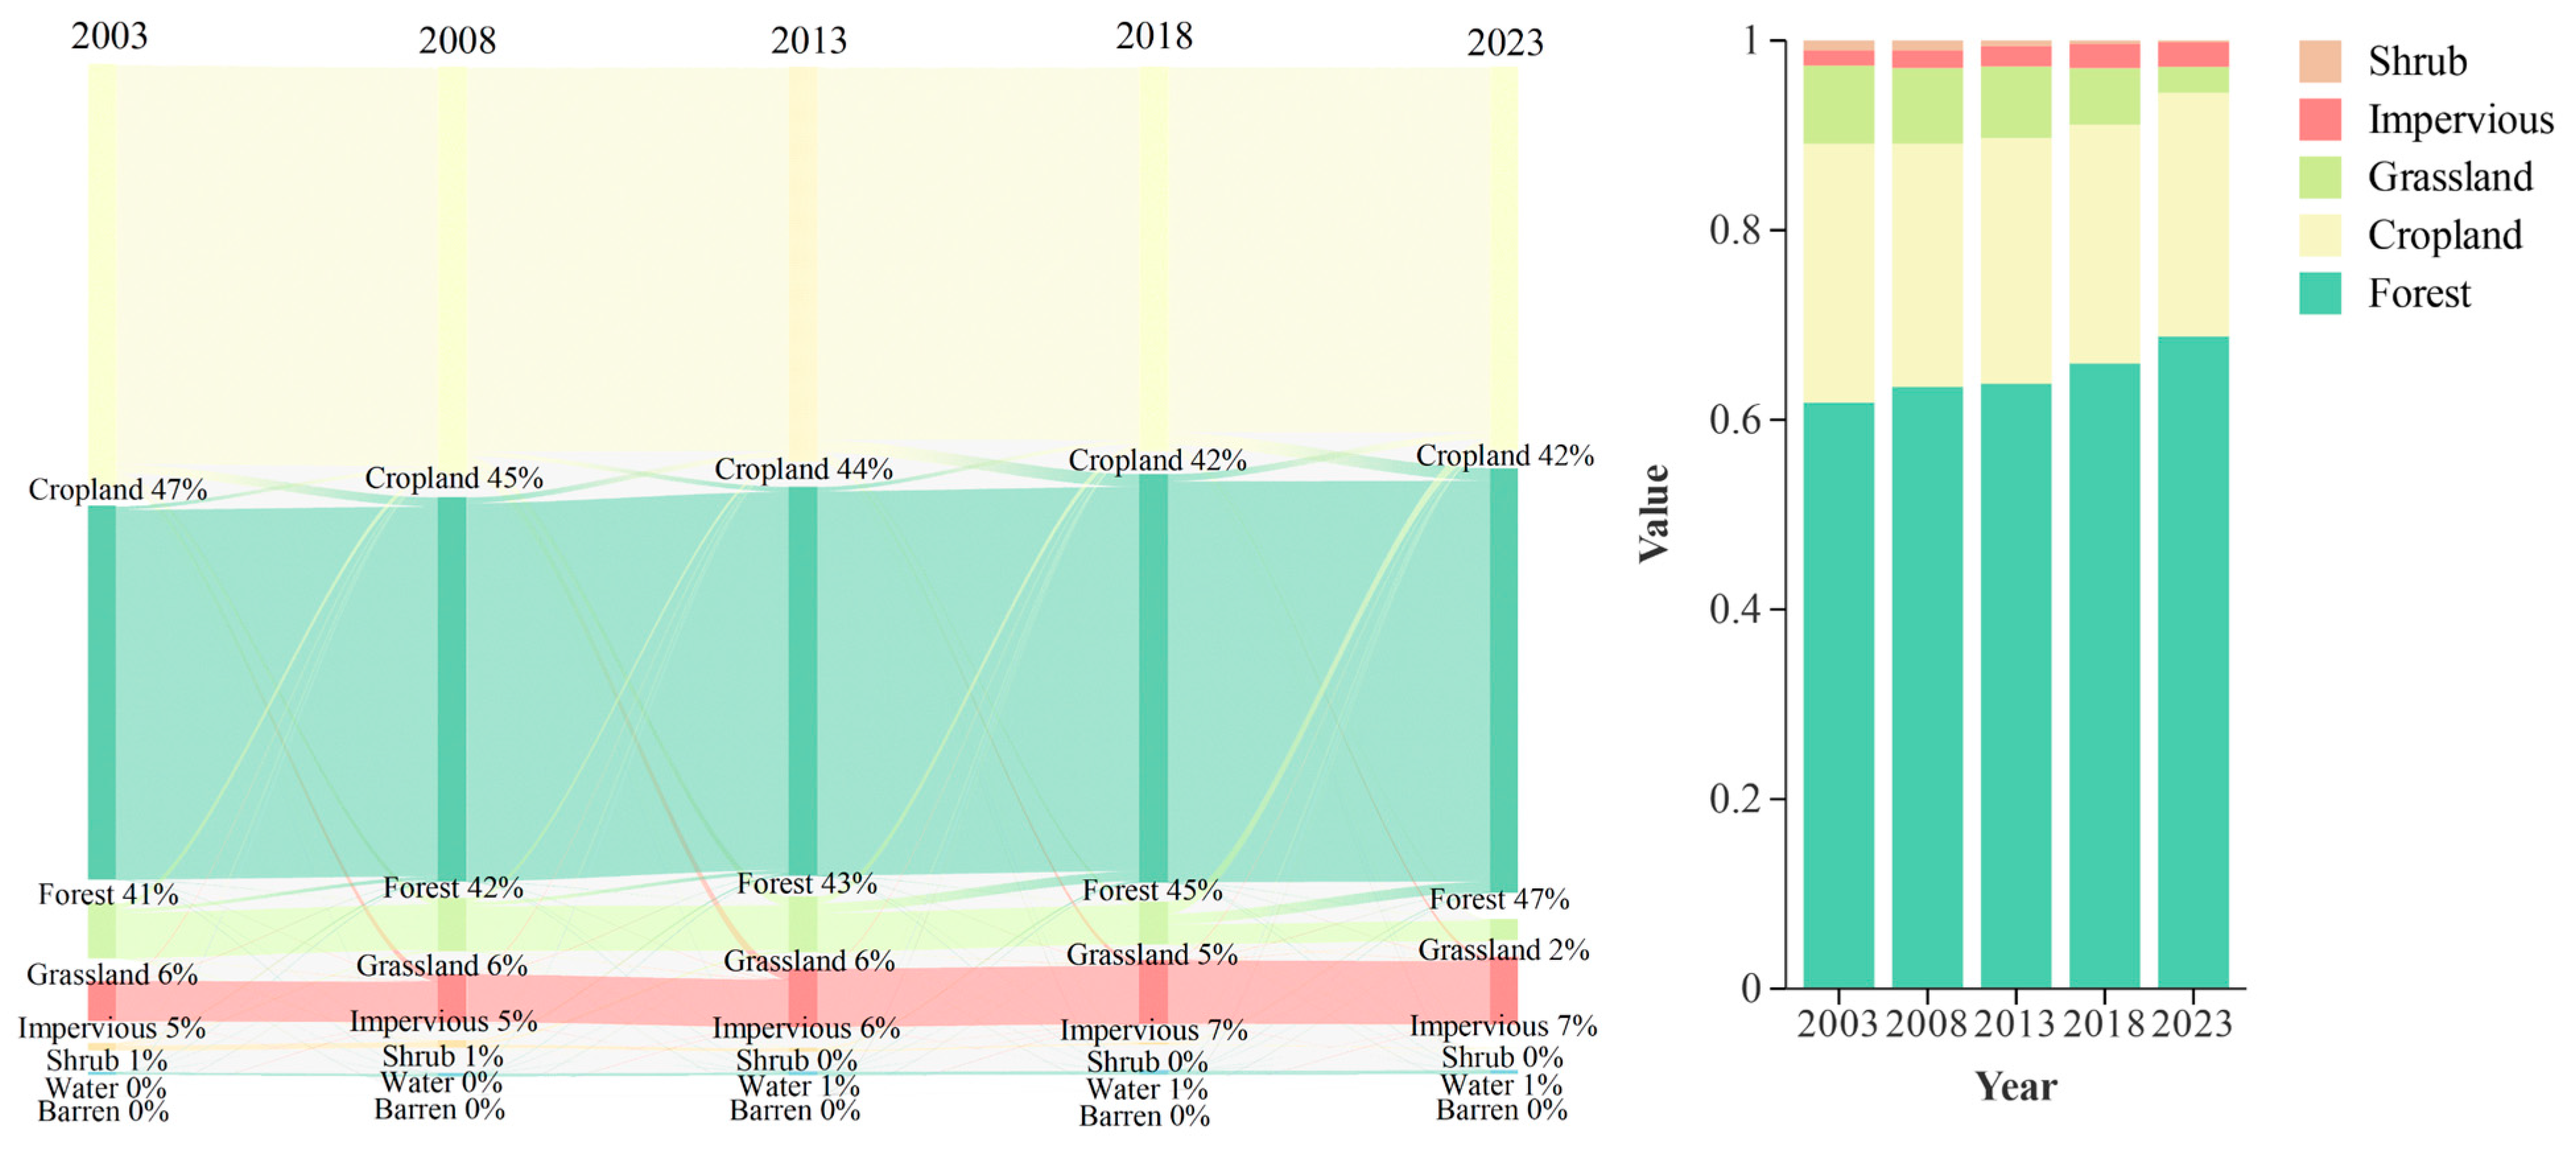
4.1.3. Temporal Evolution of Water Conservation in Different Land Use Types

The water conservation differences among various land use types in the Ili River Basin are significant (Figure 5). Forest land shows particularly positive effects, with its area continuously increasing since 2003, reaching 45% by 2018, surpassing farmland’s 42%; the water conservation contribution from forest lands increased from 60% in 2003 to 67.4% in 2023, indicating that increased forest coverage effectively enhances watershed water and soil conservation capacity, reflecting the success of the Grain for Green Project [74]. Agricultural land’s water conservation capacity is less than half that of forest land, showing a relatively weak water conservation ability. Meanwhile, urbanization has led to increased impervious surfaces, reducing rainwater infiltration and soil moisture while increasing surface runoff, thus weakening the watershed’s water conservation capacity. Except for shrubland, all other land use types showed increasing trends in water conservation. The basin’s water conservation primarily comes from forest land, cropland, and grassland, consistent with Jinghong Liu et al.’s findings [75].

4.2. Driving Factors Analysis

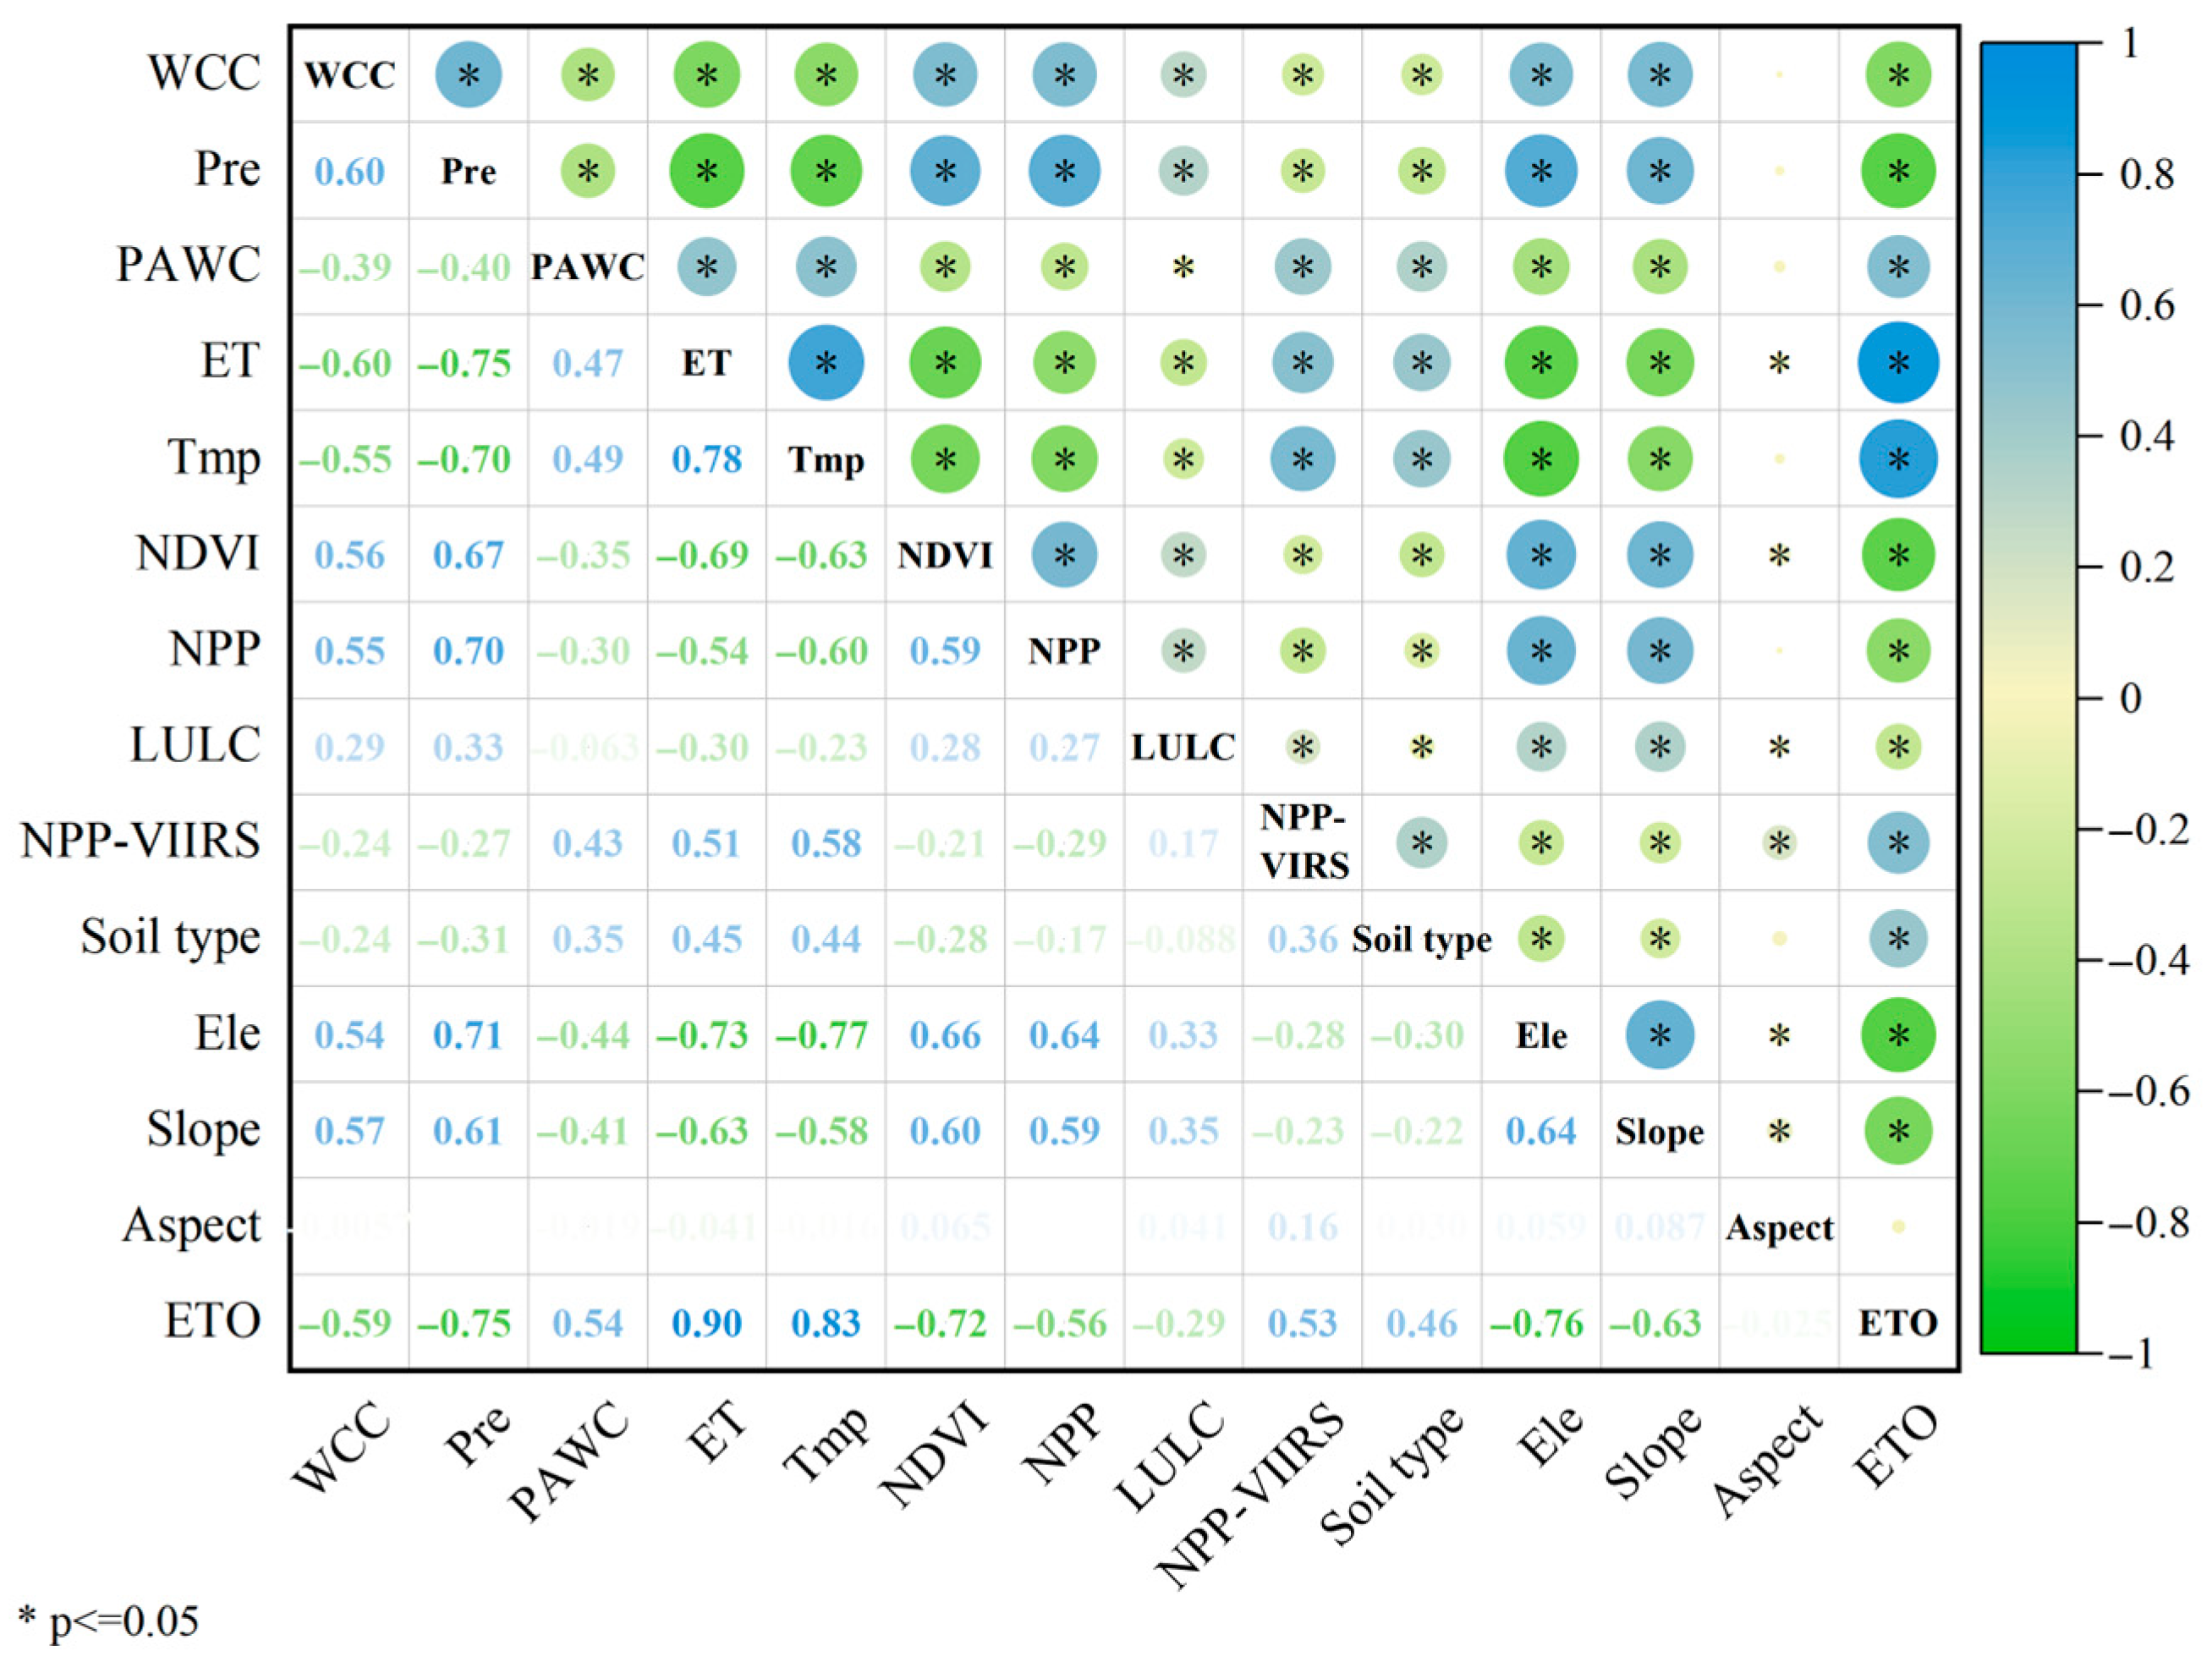
4.2.1. Selection of Impact Factors and Data Preprocessing

This study analyzed 13 key impact factors across topographical, soil, meteorological, and socioeconomic dimensions. Although nonlinear machine learning models do not require traditional correlation analysis, Spearman correlation analysis was conducted to enhance model accuracy and interpretability (Figure 6). Generally, correlation coefficients exceeding 0.8 indicate potential collinearity. After eliminating variables with excessively high or low correlation coefficients, crop evapotranspiration and aspect were excluded, leaving 11 variables for analysis.
Data preprocessing involved unifying influencing factors and water conservation amounts to the WGS_1984_World_Mercator coordinate system, resampling to a 2000 × 2000 grid, and then using a grid to calculate the average values of the driving factors and water conservation grid data for the years 2003, 2008, 2013, 2018, and 2023. Finally, the extracted tabular data was exported as input data for the model.

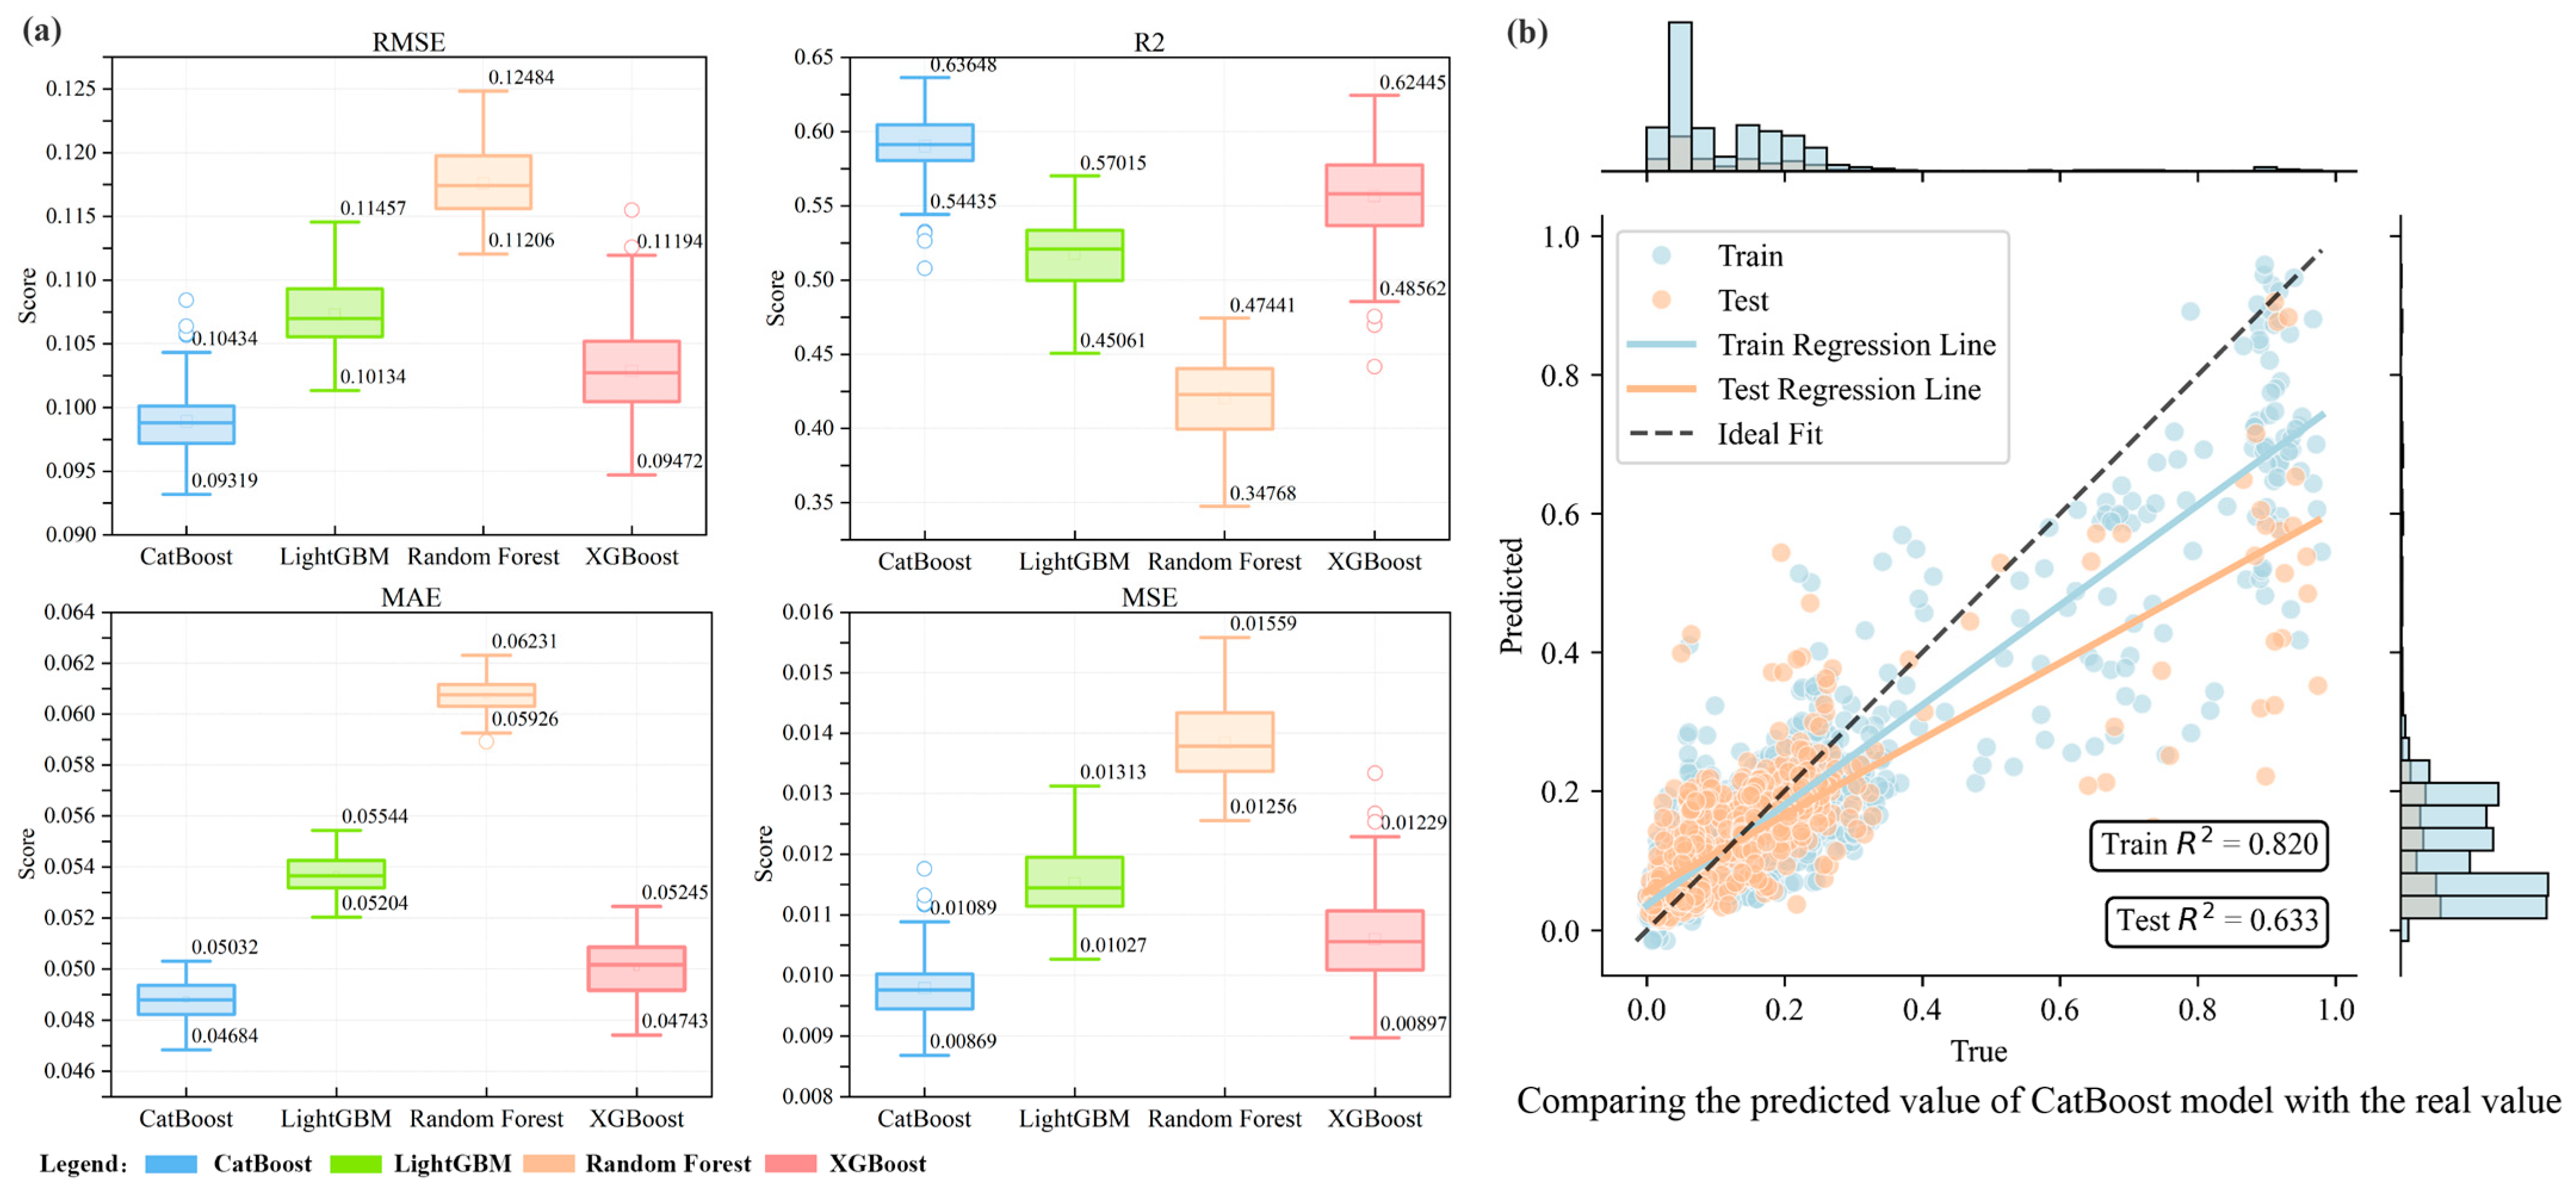
4.2.2. Optimal Model Selection

In this study, we selected four models for comparative analysis—CatBoost, RF, XGBoost, and LightGBM—to choose the optimal model as the foundational model for analyzing the driving factors of regional water conservation. Of the impact factor data, 75% was used for training and 25% for validation. Model performance was evaluated using four metrics: coefficient of determination (R2), root mean square error (RMSE), mean square error (MSE), and mean absolute error (MAE), and the performance distribution of each model on these metrics was shown through a boxplot. The boxplot helped us visually compare the strengths and weaknesses of different models, as shown in Figure 7. Compared to other algorithms, CatBoost has the highest result (0.82), and the lowest RMSE, MAPE, and MAE on all metrics, demonstrating its robustness. Therefore, CatBoost was selected as the base model for SHAP and PDP interpretative analyses. Through SHAP and PDP interpretive analyses, we can deeply understand the model’s prediction results and explore the main influencing factors and the complex linear relationships of the influencing factors in the model predictions.

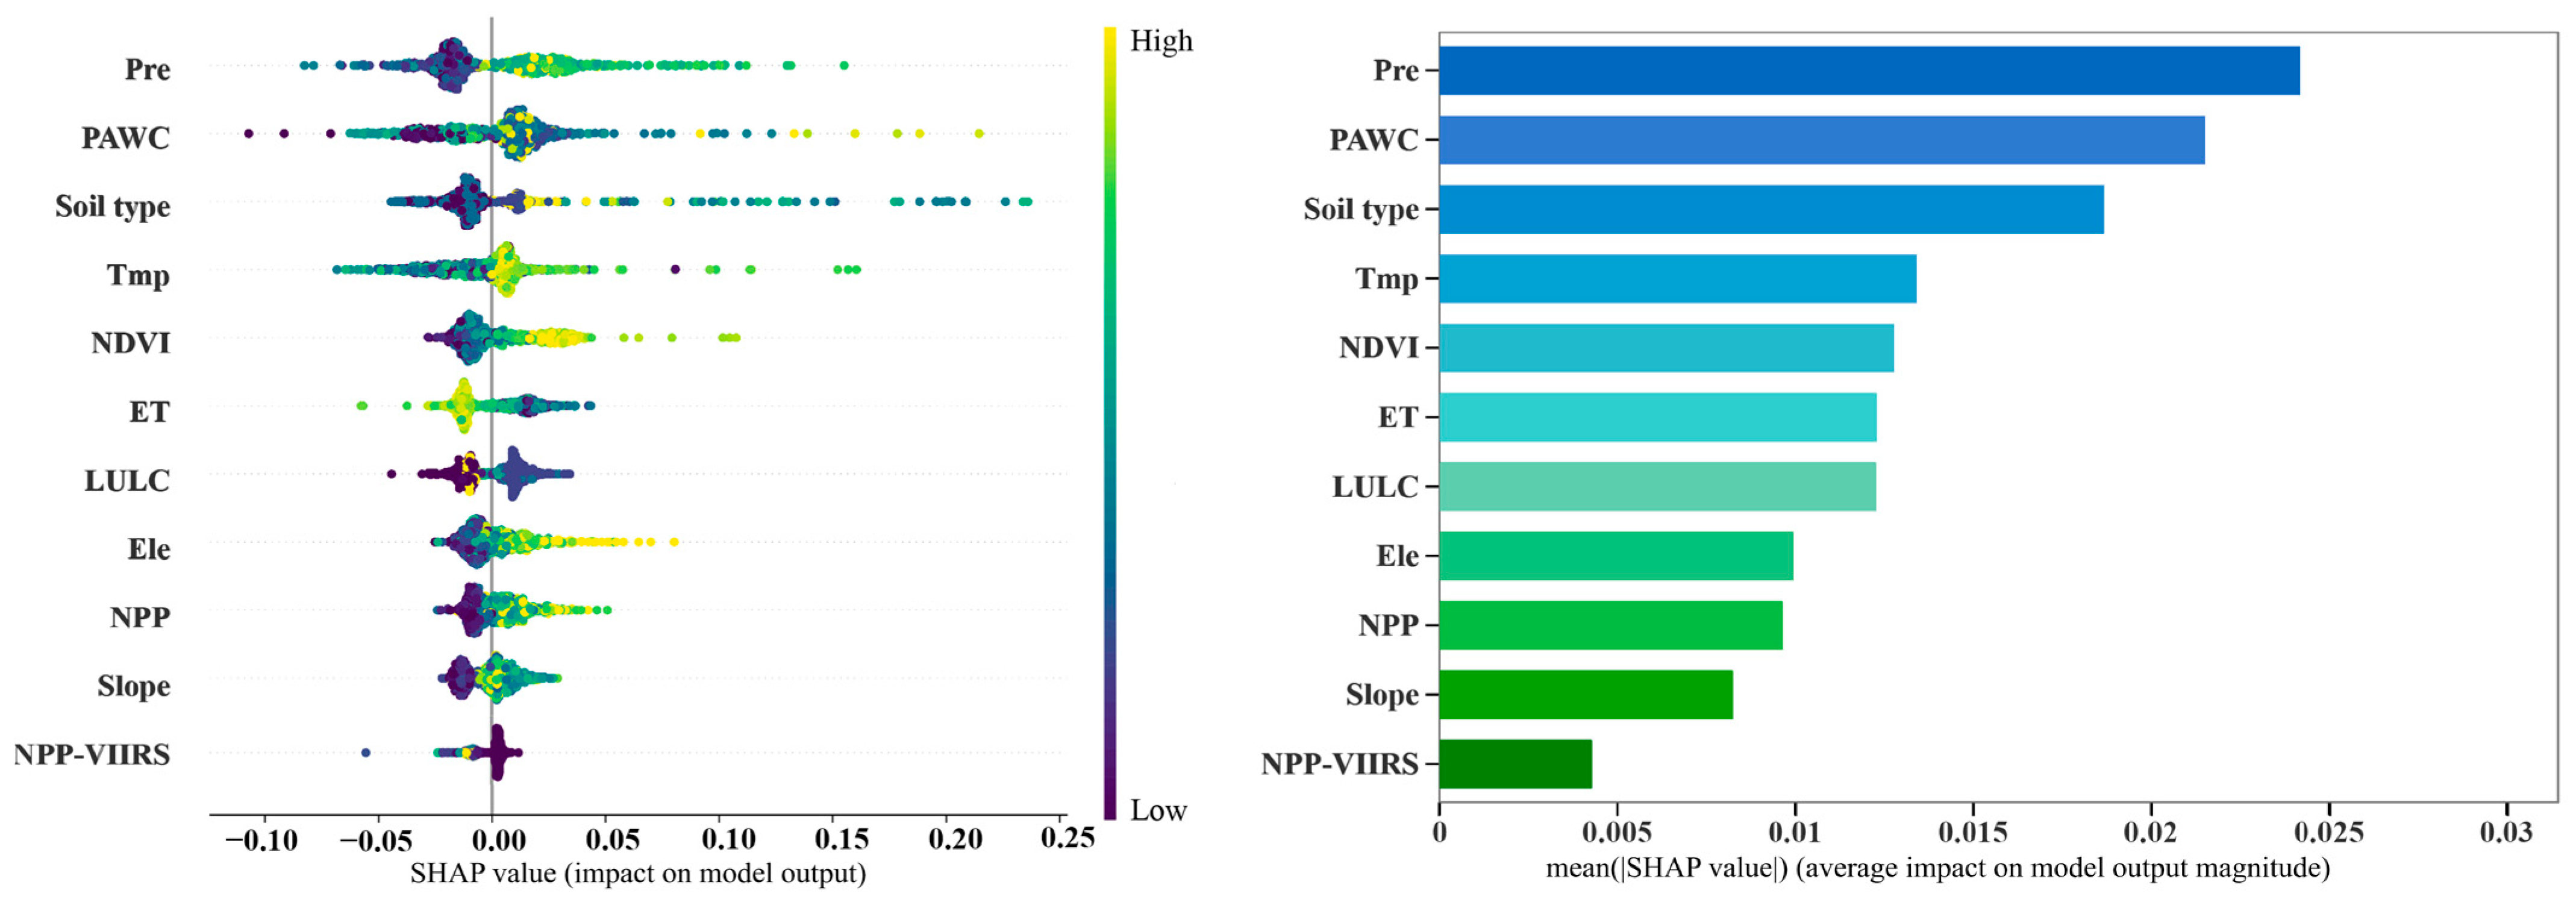
4.2.3. Importance Ranking and Impact Analysis of Influence Factors

The SHAP value visualization for the overall sample (Figure 8) intuitively demonstrates the impact level of each input feature on water conservation. Each data point represents a sample, with color intensity corresponding to value magnitude. Feature importance is reflected by position in the chart, with higher positions indicating greater importance. Positive SHAP values indicate positive influence on prediction results, while negative values indicate negative influence.
The top six factors affecting water conservation (WR) include precipitation, plant water content, soil type, temperature, normalized vegetation index, and evapotranspiration. Among the 11 influence factors, positive influence factors include precipitation, soil type, land use, vegetation coverage, slope, elevation, and vegetation net primary productivity; negative influence factors include evapotranspiration, temperature, and nighttime light index.
Precipitation SHAP values mainly range between 0.01 to 0.03 and −0.01 to −0.03, with maximum values approaching 0.02, indicating that increased precipitation helps improve water conservation. Soil type SHAP values are widely distributed, reaching up to 0.3, showing a significant impact on water conservation capacity. Vegetation coverage SHAP values are evenly distributed between 0.00 and 0.05, suggesting that higher vegetation coverage leads to greater water conservation capacity. The positive effect of the high proportion of forest land in the Yiluo River Basin on water conservation is reflected through the positive impact of land use. Temperature SHAP values concentrate between 0 and 0.02, showing a minimal contribution to water retention. Evapotranspiration SHAP values cluster in the −0.01 to −0.02 range, indicating that increased evaporation reduces water conservation. The nighttime light index reflects human activity intensity, with its negative effect showing reduced water conservation in areas of intensive human activity, reflecting the negative impact of human activities on water conservation [76].
The impact mechanism of plant water content on water conservation is complex, requiring in-depth analysis using PDP single-factor dependency plots. Research shows that precipitation, soil type, and plant water content make significant contributions to water conservation, while evapotranspiration has an inhibitory effect. These findings provide a more detailed and in-depth analysis and scientific support for water resource management decisions.

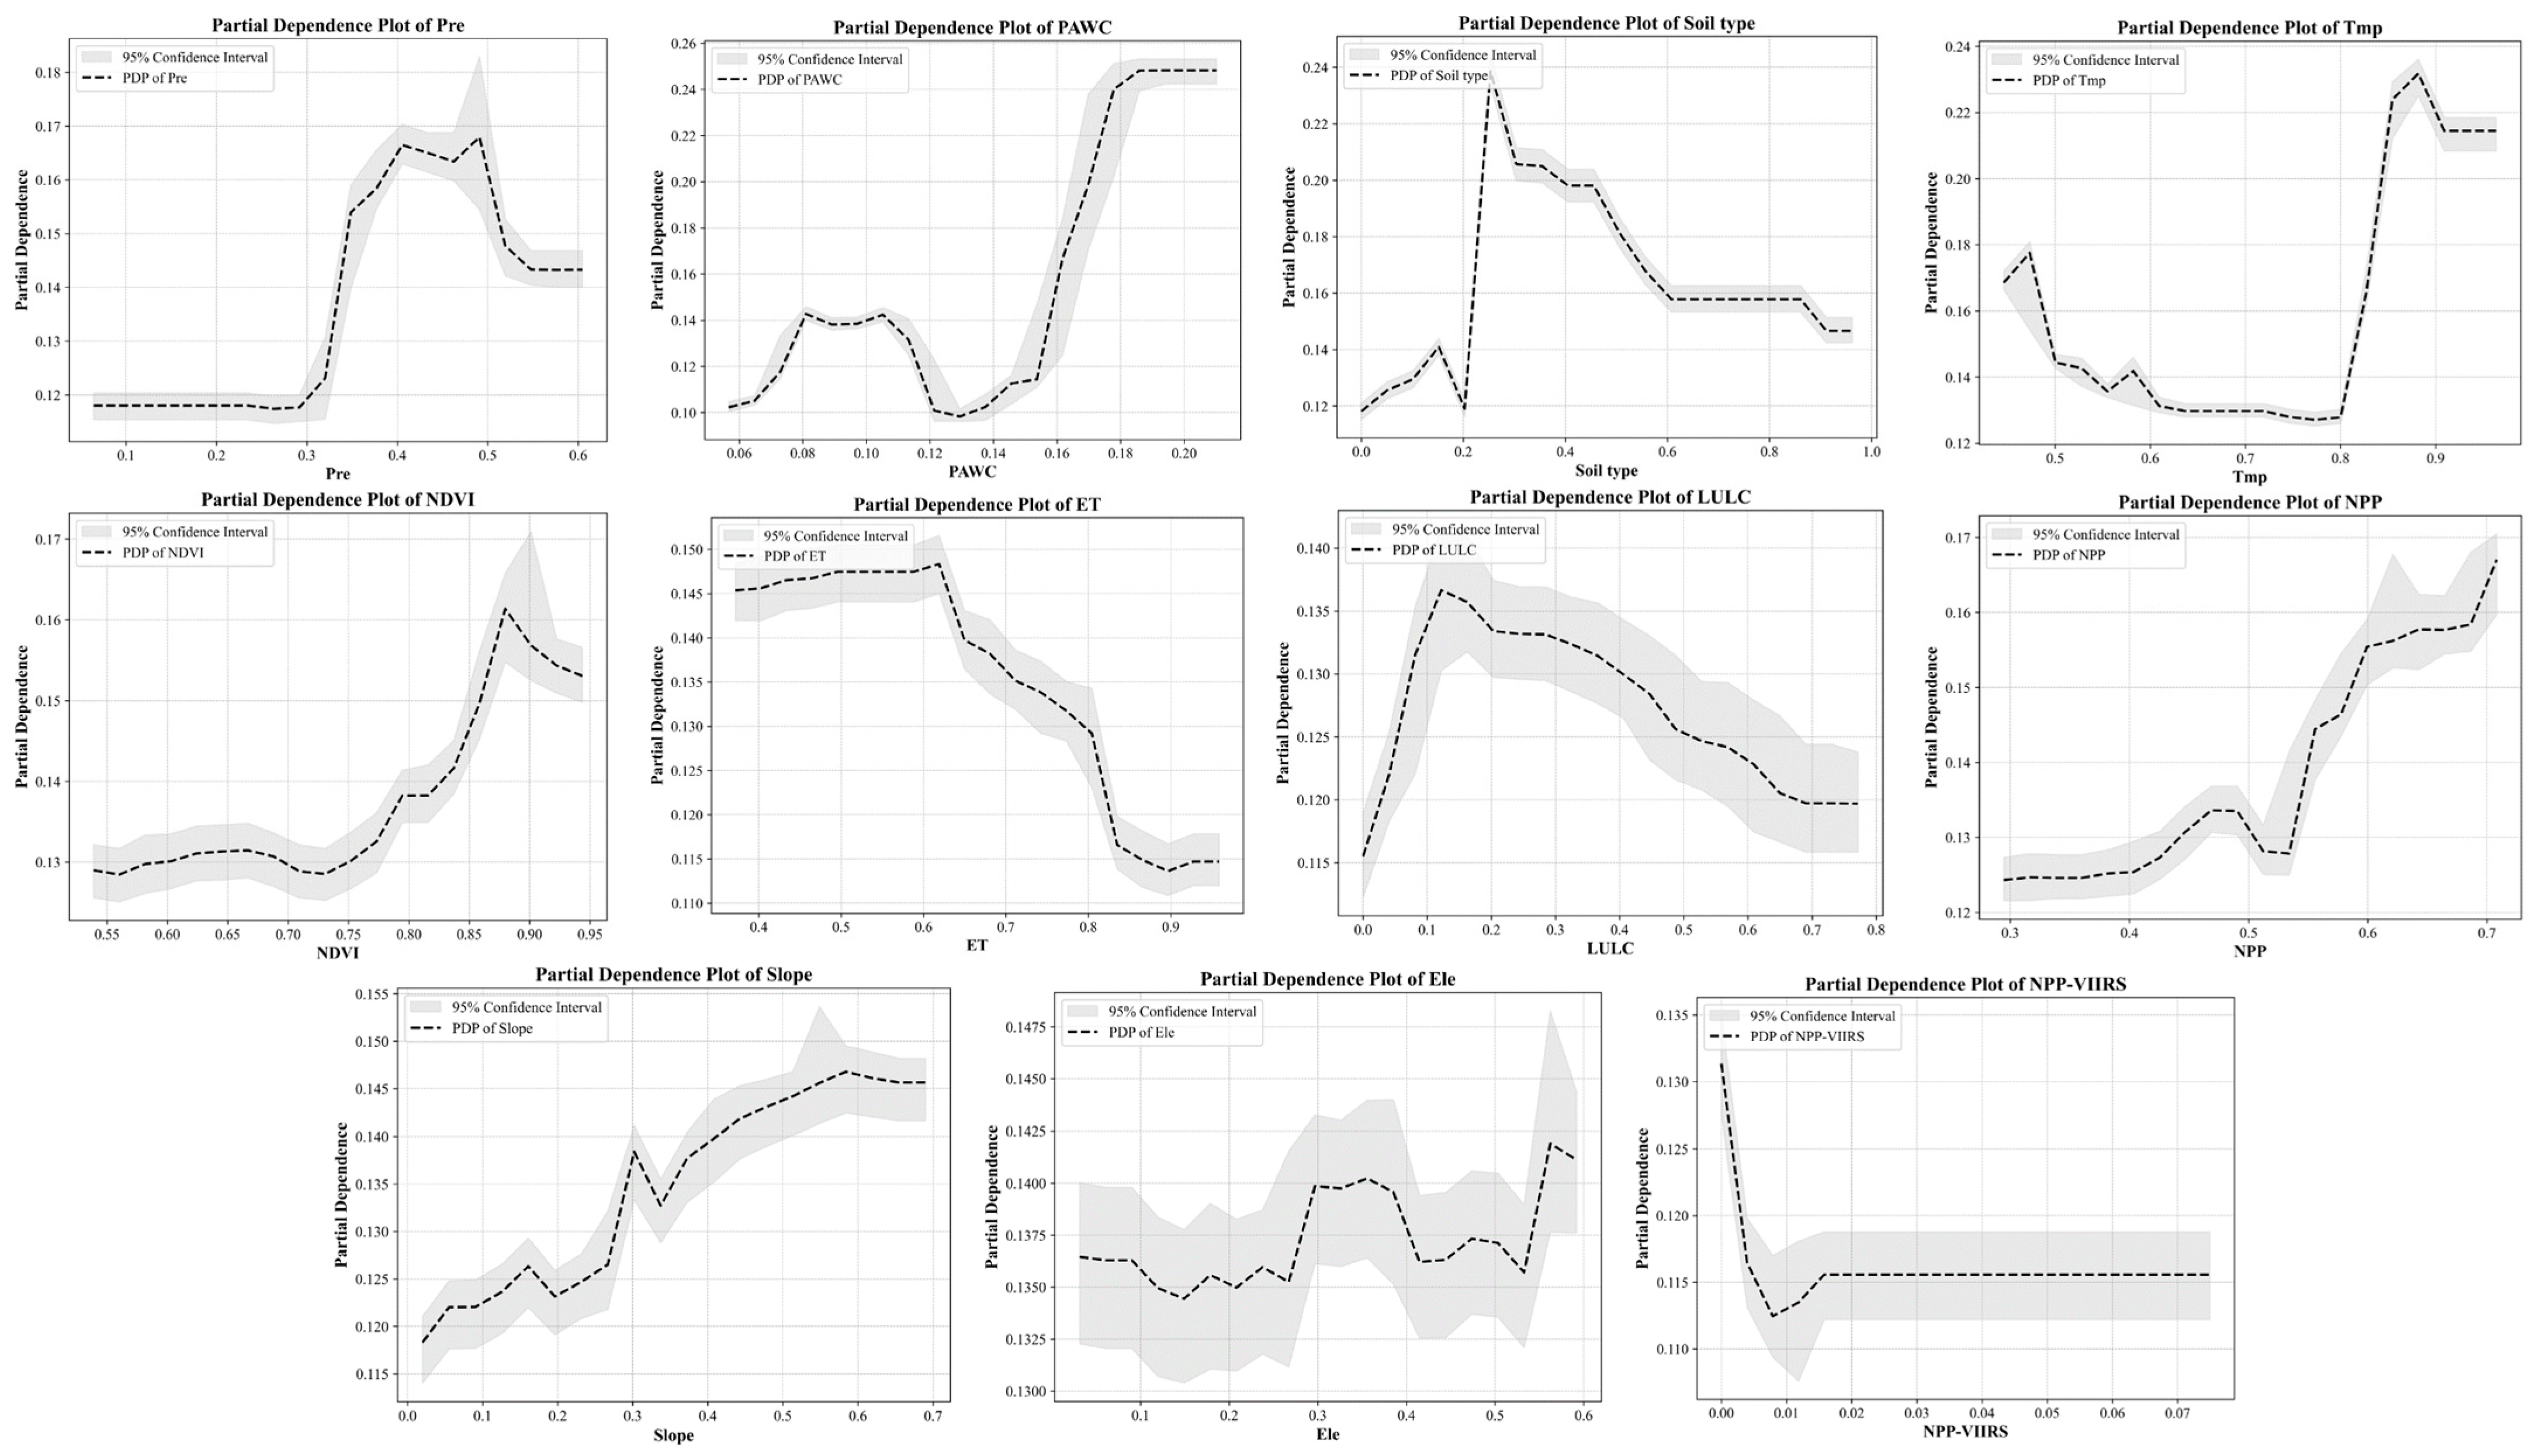
4.2.4. Single-Factor Importance Ranking and Impact Analysis

Through PDP analysis of the relationship between independent variables and water conservation (dependent variable), the mechanisms of various impact factors were revealed (Figure 9), with analysis focusing on the top six ranked variables.
Precipitation shows a maximum contribution to water conservation between 0.4 and 0.5, as rainfall effectively increases soil moisture content and promotes vegetation growth and recovery. Plant water content and soil type show particularly complex effects on water conservation and exhibit complex nonlinear relationships.
Plant water content shows alternating positive and negative effects on water conservation within the 0.09–0.16 range, while maintaining a positive effect within the 0.16–0.8 range, as plants contribute to water conservation through self-regulation of water utilization.
Soil type shows negative impacts on water conservation within the 0–0.06 and 0.18–0.41 ranges, indicating poor water retention and permeability in these soils, while showing positive effects within the 0.06–0.18 and 0.41–1.00 ranges, where loose soil texture provides better permeability and adsorption capacity, enhancing water conservation function [77].
Temperature’s contribution to water conservation first decreases then increases, with minimum contribution at 0.8. Higher temperatures lead to increased vegetation transpiration and soil and water surface evaporation, affecting regional water conservation capacity.
The normalized vegetation index is a crucial indicator of vegetation coverage conditions. Increased vegetation coverage can enhance soil water retention capacity, regulate regional climate, and reduce surface runoff, thus improving the water conservation capacity [78].
Evapotranspiration’s negative impact on water conservation is manifested through enhanced water cycle acceleration and increased potential evaporation, meaning more water consumption and reduced watershed water conservation [79].
Land use, elevation, vegetation net primary productivity, slope, and nighttime light data also show nonlinear effects on the dependent variable. Analyzing these nonlinear relationships helps us better understand how various factors influence water conservation capacity and make informed decisions regarding land management and water resource protection.

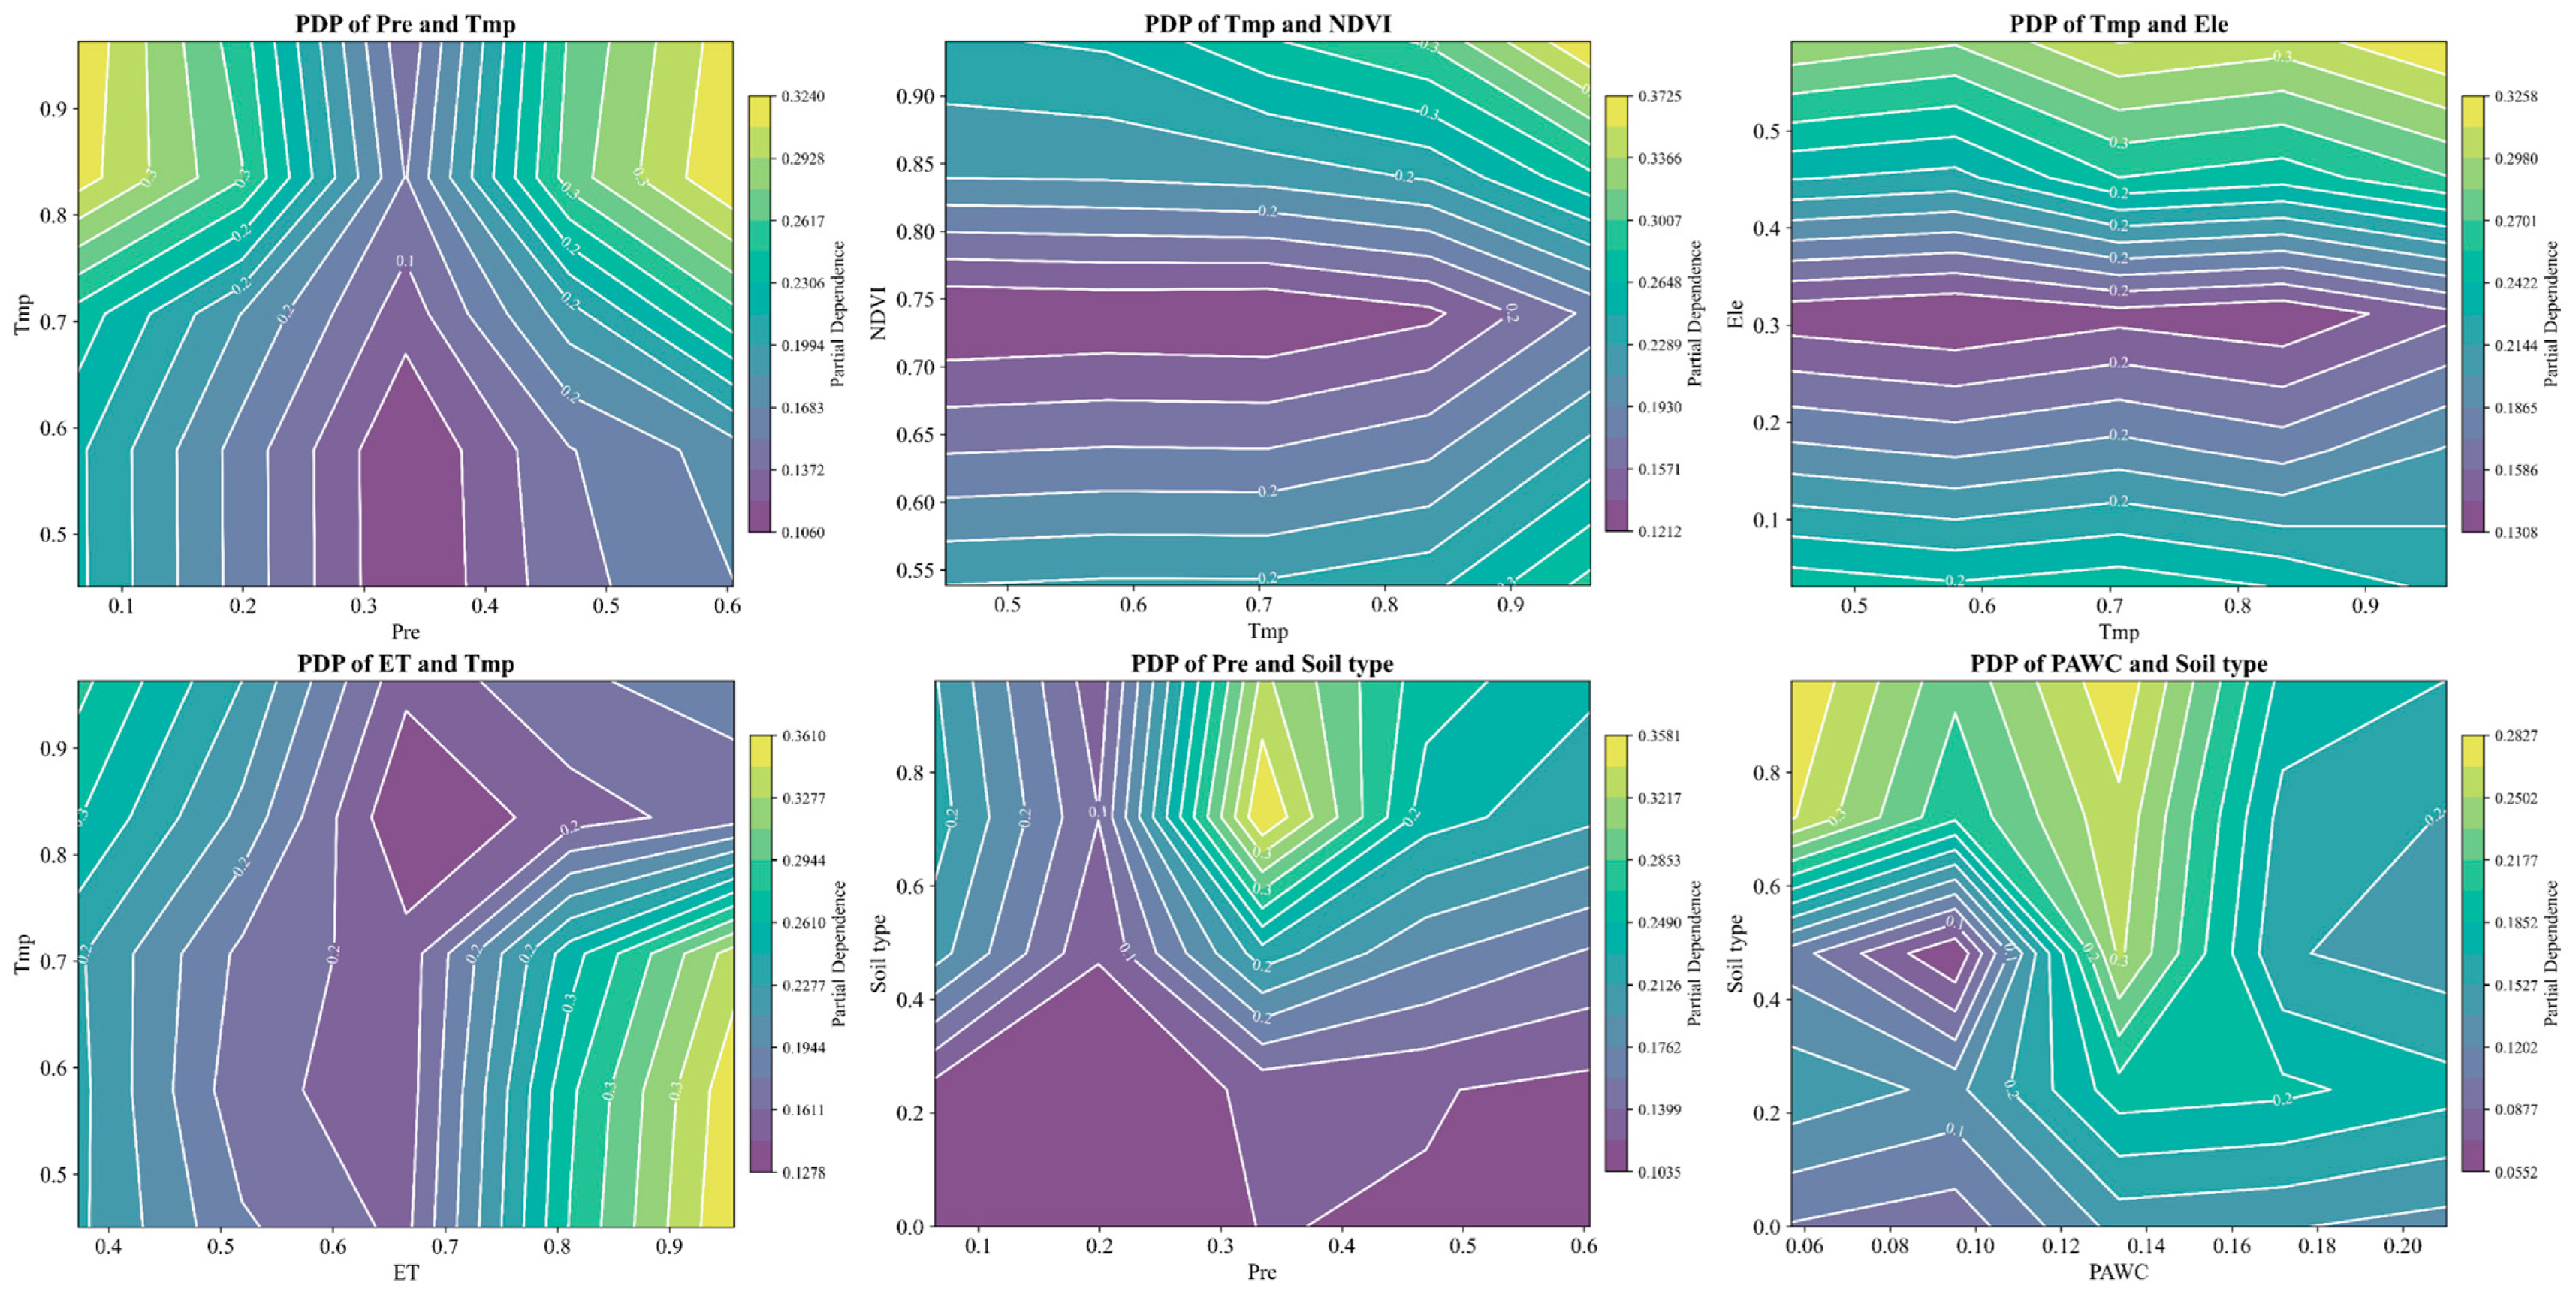
4.2.5. Impact of Factor Interactions on Water Conservation

The study analyzed interactions among 11 impact factors, revealing significant contributions to water conservation (WR) from interactions between temperature and precipitation, temperature and normalized vegetation index, temperature and elevation, temperature and evapotranspiration, precipitation and soil type, and plant water content and soil type (Figure 10). The PDP analysis demonstrates the impact of different feature combinations on prediction results. The x and y axes of the Partial Dependence Plots (PDPs) represent the value ranges of two features, while contour lines show predicted values under specific feature combinations. By analyzing the trend of contour lines and the density of contours, one can deduce which combinations of features contribute the most to predicting water conservation and the sensitivity of interactions between driving factors (Figure 11).
The interaction detection results are listed here:
(1)
In the precipitation range of 0.26 to 0.45 mm, the interactive effect of precipitation and temperature on water conservation shows a decreasing trend, likely due to increased soil saturation reducing precipitation’s positive impact. In contrast, when precipitation approaches 0 or 0.6 mm and temperature rises, water conservation capacity significantly increases, possibly related to soil conditions in unsaturated precipitation areas. Under rising temperatures, soil conditions favor plant growth, increasing plant water content and enhancing water conservation function.
(2)
In the precipitation–soil type interaction, with 0.2 and 0.22 as boundaries, the interactive effect on water conservation reaches critical points. Beyond these points, as precipitation and soil type values increase, their interactive contribution to water retention increases.
(3)
Within the 0.70–0.75 range of the normalized vegetation index, the interactive effect of temperature and vegetation index on water conservation decreases. Outside this range, water conservation improves with rising temperatures, indicating that temperature increase may become the primary factor affecting water retention under high vegetation coverage.
(4)
In the temperature–elevation interaction, when soil type is at a specific value (approximately 0.3), temperature changes have an insignificant impact on watershed water retention. However, when elevation exceeds this threshold, the temperature–elevation interaction begins to significantly affect water conservation, as increased elevation leads to more precipitation, promoting vegetation growth. Additionally, rising temperatures stimulate vegetation growth and water content, further increasing water conservation.
(5)
The interactions between soil type and both precipitation and plant water content are more complex. Notably, the interaction between soil type and plant water content is highly significant, offering new perspectives for urban green space planning and urban blue-green pattern construction.
These interaction detection results reveal how different factors jointly influence water conservation. Besides precipitation’s dominant influence, temperature’s interactions with other factors significantly enhance contributions to water conservation, showing similar interactive trends. These findings help us better understand water conservation’s influencing factors, provide more accurate parameters for future predictions, and offer a scientific basis for climate change adaptation strategies and water resource management decisions [80].

5. Discussion

5.1. Water Conservation Calculation

This study uses the water balance method and an InVEST water yield module to calculate water conservation, which was widely applied in areas lacking parameters. Parameter settings in different regions affect final water conservation results. Water yield normally exceeds water conservation, with the latter accounting for approximately 9% of the former. For example, research in the Yangxi River watershed shows watershed water conservation sometimes exceeding water yield [81]. In the modified water conservation formula, the flow velocity coefficient, soil saturation rate, and topographic index are key control indicators, with regional differences significantly affecting water conservation assessment.

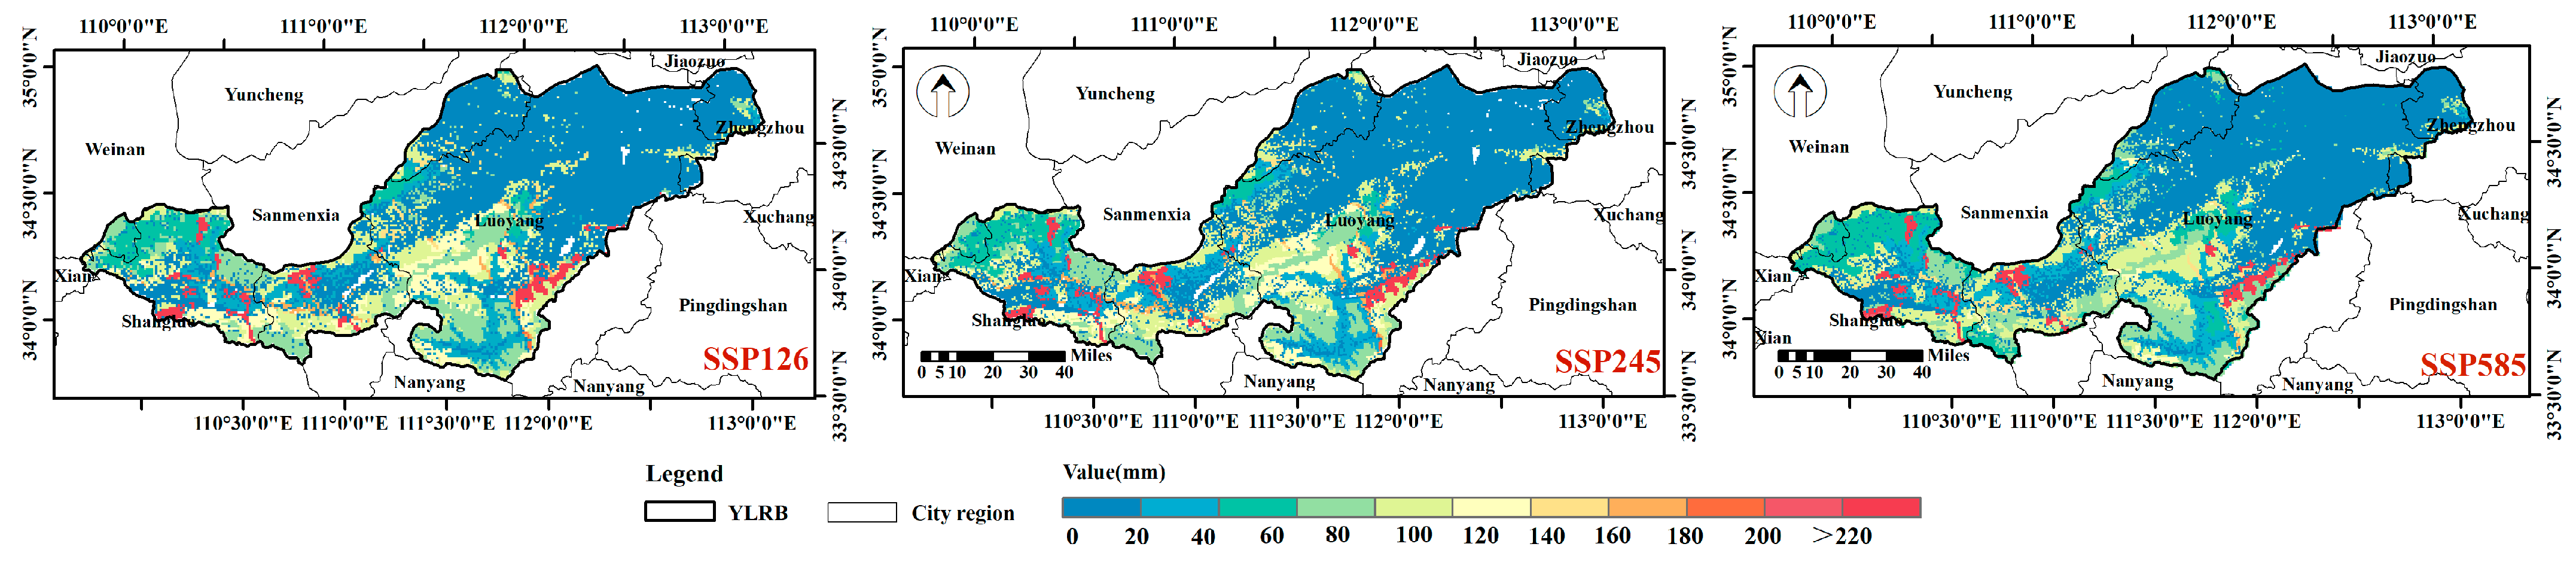
5.2. Future Water Conservation Simulation

The analysis of water conservation drivers shows climate factors’ significant impact. Their influence will become more complex in the future with climate change and increasing human activities. Therefore, the BCC-CSM2-MR model was chosen to simulate the water conservation capacity of the Yiluo River Basin in the year 2050 under three scenarios: SSP1-2.6, SSP2-4.5, and SSP5-8.5 (Figure 12). These scenarios, part of Shared Socioeconomic Pathways, represent different social development and greenhouse gas emission trajectories [82].
Under the SSP1-2.6 scenario, total water conservation reaches 11.01 mm, with forest land accounting for 49%, representing a sustainable development pathway. Reduced greenhouse gas emissions and effective resource management help maintain vegetation coverage and enhance water conservation. The SSP5-8.5 scenario assumes high emissions and resource consumption, leading to land degradation and ecosystem damage. Urbanization increases land demand, with urban impervious surfaces reaching 12.8%, potentially causing deforestation and land use changes, reducing vegetation coverage, and decreasing water conservation to 9.56 mm. The SSP2-4.5 scenario, as a middle development pathway, reflects moderate land resource demands for economic and social development. This scenario assumes future development will continue following historical patterns, with forest land accounting for 44% and water conservation at 10.8 mm, showing effective water resource protection measures between SSP1-2.6 and SSP5-8.5 levels.
Future water conservation predictions under these three pathways indicate that under the SSP5-8.5 scenario, policy regulation and land resource management should be implemented to strengthen watershed ecological protection and landscape planning, prioritizing natural restoration over excessive human intervention to achieve sustainable watershed development [83]. Under the SSP1-2.6 and SSP2-4.5 scenarios, the Yiluo River’s water conservation shows no significant changes. It indicates that the current ecological environment quality of the Yiluo River Basin is relatively high, and the area of ecological land use in the Yiluo River Basin accounts for a dominant proportion (having exceeded 50%), with a favorable regional development trend. However, further environmental protection, improved governance systems, and enhanced ecological quality are still required to provide solid ecological support for the socioeconomic development of the basin.

5.3. Limitations

Although this paper fills the gap in the nonlinear research of the driving factors of water conservation, there are still certain limitations. The study is insufficient in analyzing the dynamic influencing factors of water conservation and fails to deeply explore the responses and changing characteristics of these dynamic factors to water conservation over time. Additionally, the analysis of the driving factors of water conservation does not thoroughly examine the socioeconomic factors, and the selected socioeconomic factors are relatively few. In future studies on the driving factors of water conservation, socioeconomic factors should also be given significant consideration. These issues should be further addressed in future research.

6. Conclusions

This study used the Yiluo River Basin as a case study, employing the InVEST model’s water yield module to predict water yield from 2003 to 2023. Water conservation was calculated using ArcGIS 10.8, and driving factors were explored through SHAP and PDP analysis methods. The study found that climate change, land use changes, and human activities are the main factors affecting water conservation in the Yiluo River Basin:
(1)
Water conservation in the Yiluo River Basin experienced fluctuations, peaking in 2003 and reaching its lowest point in 2013. Areas with extensive forest coverage, such as Luanchuan County and Song County, maintained high water conservation capacity. The watershed’s water conservation mainly came from forest land, cropland, and grassland. Furthermore, forest land contributed over 60% of the water conservation in the Yiluo River Basin. Conversely, central urban areas along both banks of the Luo River saw reduced water conservation capacity due to the rapid expansion of impervious surfaces during urbanization.
(2)
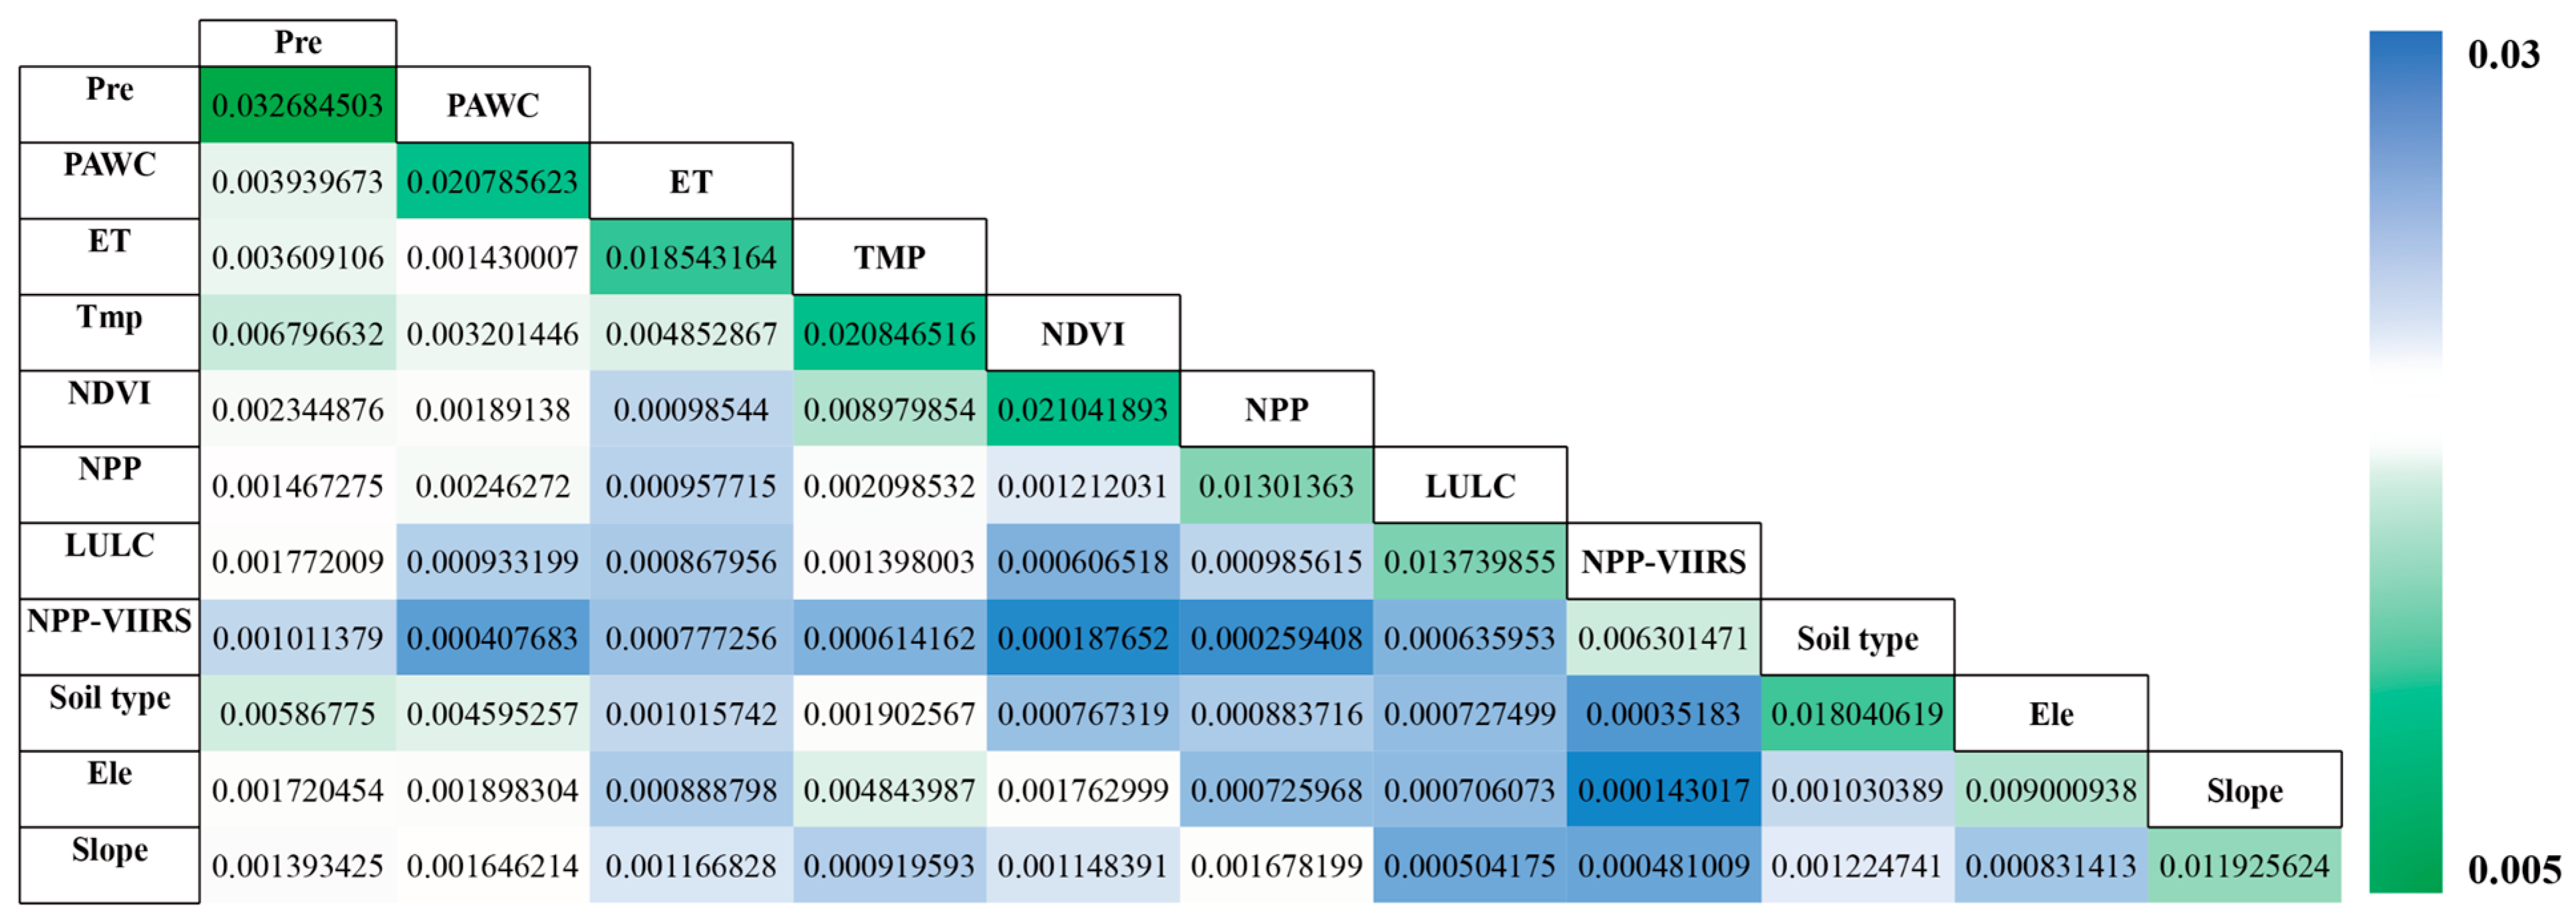
SHAP and PDP analysis and quantification of driving factors showed that annual rainfall, plant water content, and soil type are the main factors affecting water conservation. Through the single-factor PDP analysis, soil type in particular showed a complex nonlinear effect on water conservation, as different soil types vary in water retention and permeability capabilities. Loose soil texture enhances permeability and adsorption capacity, improving water conservation function; conversely, dense soil impedes water retention. These factors show nonlinear relationships with water conservation. PDP analysis for two-factor interaction detection also found that temperature shows the most significant interactive effects with precipitation, elevation, normalized vegetation index, and evapotranspiration, displaying similar trends.
(3)
This study did not fully analyze dynamic impact factors of water conservation, lacking a discussion of temporal series for dynamic factors. At the same time, the exploration of socioeconomic factors should be supplemented in future research.
This study supplements the deficiency in nonlinear research on the driving factors of water conservation. To a certain extent, the research results reflect the changes in human activities and the natural background characteristics of the basin, and provide scientific support for regional ecological environment protection and water resource management, which is of great significance to the sustainable development of the basin. The research methods also provide references for related fields or interdisciplinary research.

Author Contributions

Conceptualization, Y.J. and Z.Z.; methodology, Y.J. and C.H.; software, Y.J. and Z.Z.; validation, Z.Z.; formal analysis, Y.J. and Z.Z.; investigation, Y.J., Z.Z. and C.H.; resources, C.H. and S.X.; data curation, Y.J.; writing—original draft preparation, Y.J.; writing—review and editing, Z.Z.; visualization, Y.J. and Z.Z.; supervision, C.H. and S.X.; project administration, C.H. and S.X.; funding acquisition, C.H. and S.X. All authors have read and agreed to the published version of the manuscript.

Funding

This research was funded by National Natural Science Foundation of China, grant number: U1867221 and Nanhua University Doctoral Scientific Research Start-Up Fund, grant number: 190xQD0.

Conflicts of Interest

The authors declare no conflict of interest.

References

  1. Tian, P.; Lu, H.; Feng, W.; Guan, Y.; Xue, Y. Large decrease in streamflow and sediment load of Qinghai–Tibetan Plateau driven by future climate change: A case study in Lhasa River Basin. Catena 2020, 187, 104340. [Google Scholar] [CrossRef]
  2. Hu, W.; Li, G.; Gao, Z.; Jia, G.; Wang, Z.; Li, Y. Assessment of the impact of the Poplar Ecological Retreat Project on water conservation in the Dongting Lake wetland region using the InVEST model. Sci. Total Environ. 2020, 733, 139423. [Google Scholar] [CrossRef] [PubMed]
  3. Costanza, R.; d’Arge, R.; De Groot, R.; Farber, S.; Grasso, M.; Hannon, B.; Limburg, K.; Naeem, S.; O’Neill, R.V.; Paruelo, J.; et al. The value of the world’s ecosystem services and natural capital. Nature 1997, 387, 253–260. [Google Scholar] [CrossRef]
  4. Nedkov, S.; Campagne, S.; Borisova, B.; Krpec, P.; Prodanova, H.; Kokkoris, I.P.; Hristova, D.; Clec’h, S.L.; Santos-Martin, F.; Burkhard, B.; et al. Modeling water regulation ecosystem services: A review in the context of ecosystem accounting. Ecosyst. Serv. 2022, 56, 101458. [Google Scholar] [CrossRef]
  5. Bai, Y.; Ochuodho, T.O.; Yang, J. Impact of land use and climate change on water-related ecosystem services in Kentucky, USA. Ecol. Indic. 2019, 102, 51–64. [Google Scholar] [CrossRef]
  6. Jia, Y.; Jin, J.; Wang, Y.; Guo, X.; Du, E.; Wang, G. Evaluating the Spatiotemporal Distributions of Water Conservation in the Yiluo River Basin under a Changing Environment. Water 2024, 16, 2320. [Google Scholar] [CrossRef]
  7. Zhao, Q.; Ding, Y.; Wang, J.; Gao, H.; Zhang, S.; Zhao, C.; Xu, J.; Han, H.; Shangguan, D. Projecting climate change impacts on hydrological processes on the Tibetan Plateau with model calibration against the glacier inventory data and observed streamflow. J. Hydrol. 2019, 573, 60–81. [Google Scholar] [CrossRef]
  8. Wang, C.; Hou, Y.; Zhang, J.; Chen, W. Assessing the groundwater loss risk in Beijing based on ecosystem service supply and demand and the influencing factors. Sci. Total Environ. 2023, 872, 162255. [Google Scholar] [CrossRef] [PubMed]
  9. Chen, J.M.; Chen, X.; Ju, W.; Geng, X. Distributed hydrological model for mapping evapotranspiration using remote sensing inputs. J. Hydrol. 2005, 305, 15–39. [Google Scholar] [CrossRef]
  10. Donohue, R.J.; Roderick, M.L.; McVicar, T.R. Roots, storms and soil pores: Incorporating key ecohydrological processes into Budyko’s hydrological model. J. Hydrol. 2012, 436–437, 35–50. [Google Scholar] [CrossRef]
  11. Li, M.; Liang, D.; Xia, J.; Song, J.; Cheng, D.; Wu, J.; Cao, Y.; Sun, H.; Li, Q. Evaluation of water conservation function of Danjiang River Basin in Qinling Mountains, China based on InVEST model. J. Environ. Manag. 2021, 286, 112212. [Google Scholar] [CrossRef]
  12. Zhang, G.; Wu, Y.; Li, H.; Zhao, W.; Wang, F.; Chen, J.; Sivakumar, B.; Liu, S.; Qiu, L.; Wang, W. Assessment of water retention variation and risk warning under climate change in an inner headwater basin in the 21st century. J. Hydrol. 2022, 615, 128717. [Google Scholar] [CrossRef]
  13. Wang, Y.; Wang, H.; Liu, G.; Zhang, J.; Fang, Z. Factors driving water yield ecosystem services in the Yellow River Economic Belt, China: Spatial heterogeneity and spatial spillover perspectives. J. Environ. Manag. 2022, 317, 115477. [Google Scholar] [CrossRef]
  14. Cong, W.; Sun, X.; Guo, H.; Shan, R. Comparison of the SWAT and InVEST models to determine hydrological ecosystem service spatial patterns, priorities and trade-offs in a complex basin. Ecol. Indic. 2020, 112, 106089. [Google Scholar] [CrossRef]
  15. Hu, W.; Li, G.; Li, Z. Spatial and temporal evolution characteristics of the water conservation function and its driving factors in regional lake wetlands—Two types of homogeneous lakes as examples. Ecol. Indic. 2021, 130, 108069. [Google Scholar] [CrossRef]
  16. Sun, J.; Ni, C.; Wang, M. Analysis of Water Conservation Trends and Drivers in an Alpine Region: A Case Study of the Qilian Mountains. Remote Sens. 2023, 15, 4611. [Google Scholar] [CrossRef]
  17. Luo, Y.; Cao, Z.; Zhao, X.; Wu, C. Climate Change Contributions to Water Conservation Capacity in the Upper Mekong River Basin. Water 2024, 16, 2601. [Google Scholar] [CrossRef]
  18. Liu, Z.; Di, Z.; Zhang, W.; Sun, H.; Tian, X.; Meng, H.; Liu, J. The Historical and Future Variations of Water Conservation in the Three-River Source Region (TRSR) Based on the Soil and Water Assessment Tool Model. Atmosphere 2024, 15, 889. [Google Scholar] [CrossRef]
  19. Wang, J.F.; Zhang, T.L.; Fu, B.J. A measure of spatial stratified heterogeneity. Ecol. Indic. 2016, 67, 250–256. [Google Scholar] [CrossRef]
  20. Wang, J.; Xu, C. Geodetector: Principle and Prospective. Acta Geogr. Sin. 2017, 72, 116–134. [Google Scholar] [CrossRef]
  21. Xue, J.; Li, Z.; Du, F.; Ruan, J.; Gui, J. Dynamics changes and prediction of ecosystem services in the Qinghai-Tibet Plateau, western China. Glob. Ecol. Conserv. 2023, 47, e02674. [Google Scholar] [CrossRef]
  22. Zhao, G.; Tian, S.; Liang, S.; Jing, Y.; Chen, R.; Wang, W.; Han, B. Dynamic evolution trend and driving mechanisms of water conservation in the Yellow River Basin, China. Sci. Rep. 2024, 14, 26304. [Google Scholar] [CrossRef] [PubMed]
  23. Li, Y.; Chen, P.; Niu, Y.; Liang, Y.; Wei, T. Dynamics and attributions of ecosystem water yields in China from 2001 to 2020. Ecol. Indic. 2022, 143, 109373. [Google Scholar] [CrossRef]
  24. Lang, Y.; Song, W.; Deng, X. Projected land use changes impacts on water yields in the karst mountain areas of China. Phys. Chem. Earth Parts A/B/C 2018, 104, 66–75. [Google Scholar] [CrossRef]
  25. Wang, J.; Wu, T.; Li, Q.; Wang, S. Quantifying the effect of environmental drivers on water conservation variation in the eastern Loess Plateau, China. Ecol. Indic. 2021, 125, 107493. [Google Scholar] [CrossRef]
  26. Hu, J.; Wu, Y.; Wang, L.; Sun, P.; Zhao, F.; Jin, Z.; Wang, Y.; Qiu, L.; Lian, Y. Impacts of land-use conversions on the water cycle in a typical watershed in the southern Chinese Loess Plateau. J. Hydrol. 2021, 593, 125741. [Google Scholar] [CrossRef]
  27. Gong, S.; Xiao, Y.; Xiao, Y.; Zhang, L.; Ouyang, Z. Driving forces and their effects on water conservation services in forest ecosystems in China. Chin. Geogr. Sci. 2017, 27, 216–228. [Google Scholar] [CrossRef]
  28. Li, Y.; Luo, H. Trade-off/synergistic changes in ecosystem services and geographical detection of its driving factors in typical karst areas in southern China. Ecol. Indic. 2023, 154, 110811. [Google Scholar] [CrossRef]
  29. Sun, L.; Yu, H.; Sun, M.; Wang, Y. Coupled impacts of climate and land use changes on regional ecosystem services. J. Environ. Manag. 2023, 326, 116753. [Google Scholar] [CrossRef]
  30. Gao, X.; Huang, X.X.; Chang, S.H.; Dang, Q.W.; Wen, R.Y.; Lo, K.; Li, J.; Yan, A. Long-term improvements in water conservation functions at Qilian Mountain National Park, northwest China. J. Mt. Sci. 2023, 20, 2885–2897. [Google Scholar] [CrossRef]
  31. Wang, Y.; Ye, A.; Peng, D.; Miao, C.; Di, Z.; Gong, W. Spatiotemporal variations in water conservation function of the Tibetan Plateau under climate change based on InVEST model. J. Hydrol. Reg. Stud. 2022, 41, 101064. [Google Scholar] [CrossRef]
  32. Guo, Y.; Wu, Z.; Zheng, Z.; Li, X. An optimal multivariate-stratification geographical detector model for revealing the impact of multi-factor combinations on the dependent variable. GISci. Remote Sens. 2024, 61, 2422941. [Google Scholar] [CrossRef]
  33. Wang, J.; Haining, R.; Zhang, T.; Xu, C.; Hu, M.; Yin, Q.; Li, L.; Zhou, C.; Li, G.; Chen, H. Statistical modeling of spatially stratified heterogeneous data. Ann. Am. Assoc. Geogr. 2024, 114, 499–519. [Google Scholar] [CrossRef]
  34. Chen, G.; Zuo, D.; Xu, Z.; Wang, G.; Han, Y.; Peng, D.; Pang, B.; Abbaspour, K.C.; Yang, H. Changes in water conservation and possible causes in the Yellow River Basin of China during the recent four decades. J. Hydrol. 2024, 637, 131314. [Google Scholar] [CrossRef]
  35. Zhu, J.J.; Yang, M.; Ren, Z.J. Machine learning in environmental research: Common pitfalls and best practices. Environ. Sci. Technol. 2023, 57, 17671–17689. [Google Scholar] [CrossRef] [PubMed]
  36. Wang, Z.; Fu, B.; Wu, X.; Wang, S.; Li, Y.; Feng, Y.; Zhang, L.; Hu, Y.; Cheng, L.; Li, B. Distinguishing trajectories and drivers of vegetated ecosystems in China’s Loess Plateau. Earth’s Future 2024, 12, e2023EF003769. [Google Scholar] [CrossRef]
  37. Yuan, Y.; Li, C.; Geng, X.; Yu, Z.; Fan, Z.; Wang, X. Natural-anthropogenic environment interactively causes the surface urban heat island intensity variations in global climate zones. Environ. Int. 2022, 170, 107574. [Google Scholar] [CrossRef]
  38. Quan, Y.; Hutjes, R.W.; Biemans, H.; Zhang, F.; Chen, X.; Chen, X. Patterns and drivers of carbon stock change in ecological restoration regions: A case study of upper Yangtze River Basin, China. J. Environ. Manag. 2023, 348, 119376. [Google Scholar] [CrossRef] [PubMed]
  39. Shapley, L.S. 17. A value for n-person games. In Contributions to the Theory of Games, Volume II; Princeton University Press: Princeton, NJ, USA, 1953; pp. 307–318. ISBN 9781400881970. [Google Scholar] [CrossRef]
  40. Zhang, L.; Guo, Z.; Qi, S.; Zhao, T.; Wu, B.; Li, P. Landslide susceptibility evaluation and determination of critical influencing factors in eastern Sichuan mountainous area, China. Ecol. Indic. 2024, 169, 112911. [Google Scholar] [CrossRef]
  41. Zhou, B.; Chen, G.; Yu, H.; Zhao, J.; Yin, Y. Revealing the Nonlinear Impact of Human Activities and Climate Change on Ecosystem Services in the Karst Region of Southeastern Yunnan Using the XGBoost–SHAP Model. Forests 2024, 15, 1420. [Google Scholar] [CrossRef]
  42. Wang, Q.; Wang, X.; Zhou, Y.; Liu, D.; Wang, H. The dominant factors and influence of urban characteristics on land surface temperature using random forest algorithm. Sustain. Cities Soc. 2022, 79, 103722. [Google Scholar] [CrossRef]
  43. Zhou, S.; Jia, W.; Wang, M.; Liu, Z.; Wang, Y.; Wu, Z. Synergistic assessment of multi-scenario urban waterlogging through data-driven decoupling analysis in high-density urban areas: A case study in Shenzhen, China. J. Environ. Manag. 2024, 369, 122330. [Google Scholar] [CrossRef]
  44. Gan, R.; Xu, M.; Yang, F.; Zuo, Q.; Zhang, X. The assessment of baseflow separation method and baseflow characteristics in the Yiluo River basin, China. Environ. Earth Sci. 2022, 81, 323. [Google Scholar] [CrossRef]
  45. Yao, B.; Niu, C.W.; Jia, Y.W.; Yan, X.; Wang, D.D. Evolution of precipitation, temperature and runoff in the Yellow River water conservation area over the past 60 a and its influence on water conservation. Acta Mt. Sin. 2023, 41, 41–55+18. [Google Scholar] [CrossRef]
  46. Xue, J.; Li, Z.; Feng, Q.; Gui, J.; Zhang, B. Construction of ecological conservation pattern based on ecosystem services of Three River Headwaters, Western China. Glob. Ecol. Conserv. 2023, 44, e02491. [Google Scholar] [CrossRef]
  47. Dennedy-Frank, P.J.; Muenich, R.L.; Chaubey, I.; Ziv, G. Comparing two tools for ecosystem service assessments regarding water resources decisions. J. Environ. Manag. 2016, 177, 331–340. [Google Scholar] [CrossRef]
  48. Prokhorenkova, L.; Gusev, G.; Vorobev, A.; Dorogush, A.V.; Gulin, A. CatBoost: Unbiased boosting with categorical features. In Proceedings of the Advances in Neural Information Processing Systems 31 (NeurIPS 2018), Montréal, QC, Canada, 3–8 December 2018; Volume 31. [Google Scholar] [CrossRef]
  49. Li, Z. Extracting spatial effects from machine learning model using local interpretation method: An example of SHAP and XGBoost. Comput. Environ. Urban Syst. 2022, 96, 101845. [Google Scholar] [CrossRef]
  50. Li, Z.; Shi, H.; Yang, X.; Tang, H. Investigating the nonlinear relationship between surface solar radiation and its influencing factors in North China Plain using interpretable machine learning. Atmos. Res. 2022, 280, 106406. [Google Scholar] [CrossRef]
  51. Rui, J. Exploring the association between the settlement environment and residents’ positive sentiments in urban villages and formal settlements in Shenzhen. Sustain. Cities Soc. 2023, 98, 104851. [Google Scholar] [CrossRef]
  52. Yang, J.; Huang, X. The 30 m Annual Land Cover Datasets and Its Dynamics in China from 1990 to 2021. Available online: https://doi.org/10.5281/zenodo.5816591 (accessed on 2 February 2024).
  53. The National Tibetan Plateau Data Center. Available online: https://data.tpdc.ac.cn (accessed on 5 February 2024).
  54. Yan, F.; Shangguan, W.; Zhang, J.; Hu, B. Depth-to-bedrock map of China at a spatial resolution of 100 m. Sci. Data 2020, 7, 2. [Google Scholar] [CrossRef] [PubMed]
  55. Zhou, W.; Liu, G.; Pan, J.; Feng, X. Distribution of available soil water capacity in China. J. Geogr. Sci. 2005, 15, 3–12. [Google Scholar] [CrossRef]
  56. Harmonized World Soils Database Version 2.0. Available online: https://gaez.fao.org/pages/hwsd (accessed on 7 February 2024).
  57. Resources and Environmental Sciences, Chinese Academy of Sciences. Available online: http://www.resdc.cn (accessed on 12 February 2024).
  58. Earth System Grid Federation. Available online: https://esgf-node.llnl.gov/projects/cmip6/ (accessed on 12 April 2024).
  59. Luo, M.; Hu, G.; Chen, G.; Liu, X.; Hou, H.; Li, X. 1 km land use/land cover change of China under comprehensive socioeconomic and climate scenarios for 2020–2100. Sci. Data 2022, 9, 110. [Google Scholar] [CrossRef] [PubMed]
  60. Han, Y.; Zuo, D.; Xu, Z.; Wang, G.; Peng, D.; Pang, B.; Yang, H. Attributing the Impacts of Vegetation and Climate Changes on the Spatial Heterogeneity of Terrestrial Water Storage over the Tibetan Plateau. Remote Sens. 2022, 15, 117. [Google Scholar] [CrossRef]
  61. Guan, D.; Chen, S.; Zhang, Y.; Liu, Z.; Peng, G.; Zhou, L. Influencing factors and the establishment of a basin ecological compensation mechanism from the perspective of water conservation: A case study of the upper Yangtze River in China. J. Clean. Prod. 2024, 456, 142332. [Google Scholar] [CrossRef]
  62. Li, M.; Di, Z.; Yao, Y.; Ma, Q. Variations in water conservation function and attributions in the Three-River Source Region of the Qinghai–Tibet Plateau based on the SWAT model. Agric. For. Meteorol. 2024, 349, 109956. [Google Scholar] [CrossRef]
  63. Gao, J.; Shi, Y.; Zhang, H.; Chen, X.; Zhang, W.; Shen, W.; Xiao, T.; Zhang, Y. China Regional 250 m Normalized Difference Vegetation Index Data Set (2000–2023). National Tibetan Plateau/Third Pole Environment Data Center. Available online: https://cstr.cn/18406.11.Terre.tpdc.300328 (accessed on 2 March 2024).
  64. NASA EOSDIS Land Processes Distributed Active Archive Center. Available online: https://doi.org/10.5067/MODIS/MOD17A3HGF.061 (accessed on 3 March 2024).
  65. National Earth System Science Data Center, National Science & Technology Infrastructure of China. Available online: http://www.geodata.cn (accessed on 2 February 2024).
  66. Zuo, D.; Chen, G.; Wang, G.; Xu, Z.; Han, Y.; Peng, D.; Pang, B.; Abbaspour, K.C.; Yang, H. Assessment of changes in water conservation capacity under land degradation neutrality effects in a typical watershed of Yellow River Basin, China. Ecol. Indic. 2023, 148, 110145. [Google Scholar] [CrossRef]
  67. Huang, Y.; He, Z.; Zhang, X.; Li, J. Study on Environmental Impact of Integrated Planning in Yiluo River Basin; Yellow River Conservancy Press: Zhengzhou City, China, 2019; ISBN 9787550925656. [Google Scholar]
  68. Hou, J.; Yan, D.; Qin, T.; Liu, S.; Yan, S.; Li, J.; Abebe, S.A.; Cao, X. Evolution and attribution of the water yield coefficient in the Yiluo river basin. Front. Environ. Sci. 2022, 10, 1067318. [Google Scholar] [CrossRef]
  69. Wang, J.; Zhou, J.; Ma, D.; Zhao, X.; Wei, W.; Liu, C.; Zhang, D.; Wang, C. Impact of ecological restoration project on water conservation function of qilian mountains based on inVEST model—A case study of the upper reaches of Shiyang River Basin. Land 2023, 12, 1850. [Google Scholar] [CrossRef]
  70. Bhowmik, R.; Sharif, A.; Anwar, A.; Syed, Q.R.; Cong, P.T.; Ha, N.N. Does environmental policy stringency alter the natural resources-emissions nexus? Evidence from G-7 countries. Geosci. Front. 2024, 15, 101874. [Google Scholar] [CrossRef]
  71. Sen, P.K. Estimates of the regression coefficient based on Kendall’s tau. J. Am. Stat. Assoc. 1968, 63, 1379–1389. [Google Scholar] [CrossRef]
  72. Cui, J.; Ding, J.; Lian, X.; Wei, Z.; Li, S.; Peng, J.; Poyatos, R.; Wang, T.; Piao, S. Observational constraints and attribution of global plant transpiration changes over the past four decades. Geophys. Res. Lett. 2024, 51, e2024GL108302. [Google Scholar] [CrossRef]
  73. Guo, C.; Gao, J.; Zhou, B.; Yang, J. Factors of the ecosystem service value in water conservation areas considering the natural environment and human activities: A case study of Funiu mountain, China. Int. J. Environ. Res. Public Health 2021, 18, 11074. [Google Scholar] [CrossRef]
  74. Wang, H.; Sun, F.; Xia, J.; Liu, W. Impact of LUCC on streamflow based on the SWAT model over the Wei River basin on the Loess Plateau in China. Hydrol. Earth Syst. Sci. 2017, 21, 1929–1945. [Google Scholar] [CrossRef]
  75. Liu, J.; Zheng, X.; Fan, J.; Zhao, L. Evaluation of the value of water retention service in the middle and upper reaches of Hunhe River based on SWAT Model. Chin. J. Appl. Ecol. 2021, 32, 3905–3912. [Google Scholar] [CrossRef]
  76. Wu, F.; Yang, X.; Cui, Z.; Ren, L.; Jiang, S.; Liu, Y.; Yuan, S. The impact of human activities on blue-green water resources and quantification of water resource scarcity in the Yangtze River Basin. Sci. Total Environ. 2024, 909, 168550. [Google Scholar] [CrossRef] [PubMed]
  77. Xu, H.J.; Zhao, C.Y.; Wang, X.P.; Chen, S.Y.; Shan, S.Y.; Chen, T.; Qi, X.L. Spatial differentiation of determinants for water conservation dynamics in a dryland mountain. J. Clean. Prod. 2022, 362, 132574. [Google Scholar] [CrossRef]
  78. Wu, S.; Zhou, W.; Yan, K.; Zhang, X. Response of the water conservation function to vegetation dynamics in the Qinghai–Tibetan Plateau based on MODIS products. IEEE J. Sel. Top. Appl. Earth Obs. Remote Sens. 2020, 13, 1675–1686. [Google Scholar] [CrossRef]
  79. Shuai, Y.; Tian, Y.; Shao, C.; Huang, J.; Gu, L.; Zhang, Q.; Zhao, R. Potential variation of evapotranspiration induced by typical vegetation changes in Northwest China. Land 2022, 11, 808. [Google Scholar] [CrossRef]
  80. Jia, G.; Hu, W.; Zhang, B.; Li, G.; Shen, S.; Gao, Z.; Li, Y. Assessing impacts of the Ecological Retreat project on water conservation in the Yellow River Basin. Sci. Total Environ. 2022, 828, 154483. [Google Scholar] [CrossRef]
  81. Liu, S.; Chen, J.; Guan, S.; Cui, J. Impact of land use change on water conservation function in Yangxi River Basin based on InVEST model. Sci. Technol. Eng. 2022, 22, 4746–4751. [Google Scholar]
  82. Liu, J.; Zhou, J.; He, Q. Impact of China’s Permanent Basic Farmland Protection Redline and Ecological Protection Redline on Water Conservation in the Loess Gully Region. Land 2024, 13, 1424. [Google Scholar] [CrossRef]
  83. Xue, J.; Li, Z.; Feng, Q.; Gui, J.; Zhang, B. Spatiotemporal variations of water conservation and its influencing factors in ecological barrier region, Qinghai-Tibet Plateau. J. Hydrol. Reg. Stud. 2022, 42, 101164. [Google Scholar] [CrossRef]
Figure 1. Technology roadmap.
Sustainability 17 01713 g001
Figure 2. Location of the Yiluo River Basin in the Yellow River Basin and elevation distribution.
Sustainability 17 01713 g002
Figure 3. Spatial distributions of the water conservation in the Yiluo River Basin (2003, 2008, 2013, 2018, and 2023).
Sustainability 17 01713 g003
Figure 4. Spatial variation trend of water conservation in the Yiluo River Basin (2003–2023).
Sustainability 17 01713 g004
Figure 5. Transitions in land use types and proportions of water conservation in the Yiluo River Basin (2003, 2008, 2013, 2018 and 2023).
Sustainability 17 01713 g005
Figure 6. Spearman correlation analysis between water conservation and impact factors.
Sustainability 17 01713 g006
Figure 7. Comparing Models and Selecting the Optimal Model. (a) Boxplots for different models on R2, RMSE, MSE, and MAE. (b) As the optimal model, actboost is based on the scatter plot and fitting line of the comparison between the simulation results and the observation results of a single test data set.
Sustainability 17 01713 g007
Figure 8. Overall importance ranking of water conservation impact factors.
Sustainability 17 01713 g008
Figure 9. Nonlinear relationship between environmental variables and water conservation in watershed.
Sustainability 17 01713 g009
Figure 10. Interaction mean values for water conservation impact factors.
Sustainability 17 01713 g010
Figure 11. Interaction effects of important environmental variables and water conservation in watershed.
Sustainability 17 01713 g011
Figure 12. Water conservation predictions for 2050 under different scenarios in the Yiluo River Basin.
Sustainability 17 01713 g012
Table 1. Basic data sources for water conservation calculation.
Specific DataYearsResolutionSource
Land use/land cover maps2003, 2008, 2013,
2018, 2023
30 mThe 30 m annual land cover’s datasets and its dynamics in China from 1990 to 2021: CLCD [52], https://doi.org/10.5281/zenodo.8176941, (accessed on 2 February 2024).
Precipitation/evapotranspiration2003, 2008, 2013,
2018, 2023
1 kmPrecipitation and evapotranspiration data included were obtained from the National Tibetan Plateau Science Data Center [53], https://data.tpdc.ac.cn, (accessed on 5 February 2024).
Root-restricting layer depth 1 kmDepth-to-bedrock map of China at a spatial resolution of 100 meters [54], https://doi.org/10.6084/m9.figshare.11358929, (accessed on 10 February 2024).
Plant available water content2003, 2008, 2013,
2018, 2023
1 kmThe downloaded soil data were used to calculate the effective water content of plants according to the following formula [55]:
P A W C = 54.509 0.132 T S A N 0.003 T S A N 2 0.055 T S I L 0.006 T S I L 2 0.738 T C L A + 0.007 T C L A 2 2.688 T O M + 0.501 ( T O M ) 2
where PAWC is plant available water content, T S A N is soil sand content, T S I L is soil silt content, T C L A is soil clay content, and T O M is soil organic matter content.
Soil data 1 kmSoil data from the World Soil Database: HWSD v2.0 [56], https://gaez.fao.org/pages/hwsd (accessed on 7 February 2024).
Elevation 30 mThe dataset is provided by the Data Center for Resources and Environmental Sciences, Chinese Academy of Sciences (RESDC) [57], http://www.resdc.cn, (accessed on 12 February 2024).
Future climate data20501.12° × 1.12°ERA5-CMIP6 climate projections [58], https://esgf-node.llnl.gov/projects/cmip6/, (accessed on 12 April 2024).
Future land use data20501 kmObtained from Gridded 1 km Land Use/Land Cover Change Projections of China Under Comprehensive SSP-RCP Scenarios [59], http://www.geosimulation.cn/, (accessed on 16 April 2024).
Table 2. Impact factors and data sources.
Factor TypeImpact FactorsYearsResolutionData Source
TopographySlope 30 mThe data are provided by the Data Center for Resources and Environmental Sciences, Chinese Academy of Sciences (RESDC) [57], http://www.resdc.cn, (accessed on 12 February 2024).
Aspect 30 m
Elevation 30 m
SoilSoil Type 1 kmSoil data from the World Soil Database, HWSD v2.0 [56], https://gaez.fao.org/pages/hwsd, (accessed on 7 February 2024).
VegetationPlant Water Content2003, 2008, 2013,
2018, 2023
1 kmThe data are calculated by the InVEST model.
Crop Evapotranspiration2003, 2008, 2013,
2018, 2023
1 km
Normalized Difference Vegetation Index2003, 2008, 2013,
2018, 2023
250 mObtained from National Tibetan Plateau, China regional 250 m normalized difference vegetation index dataset (2000–2023) [63], https://cstr.cn/18406.11.Terre.tpdc.300328, (accessed on 2 March 2024).
Net Primary Productivity2003, 2008, 2013,
2018, 2023
500 mNASA EOSDIS Land Processes Distributed Active Archive Center [64], https://doi.org/10.5067/MODIS/MOD17A3HGF.061, (accessed on 3 March 2024).
SocioeconomicLand Use Classification Data2003, 2008, 2013,
2018, 2023
30 mThe 30 m annual land cover’s datasets and its dynamics in China from 1990 to 2021: CLCD [52], https://doi.org/10.5281/zenodo.8176941, (accessed on 2 February 2024).
Nighttime Light Data2003, 2008, 2013,
2018, 2023
500 mThe National Earth System Science Data Center, National Science and Technology Infrastructure of China [65], http://www.geodata.cn, (accessed on 2 February 2024).
MeteorologicalPrecipitation2003, 2008, 2013,
2018, 2023
1000 mPrecipitation, temperature, and evapotranspiration data were included, obtained from the National Tibet an Plateau Science Data Center [54], https://data.tpdc.ac.cn, (accessed on 5 February 2024).
Evapotranspiration2003, 2008, 2013,
2018, 2023
1000 m
Temperature2003, 2008, 2013,
2018, 2023
1000 m
Disclaimer/Publisher’s Note: The statements, opinions and data contained in all publications are solely those of the individual author(s) and contributor(s) and not of MDPI and/or the editor(s). MDPI and/or the editor(s) disclaim responsibility for any injury to people or property resulting from any ideas, methods, instructions or products referred to in the content.

