Article

Life Cycle Assessment of a Composite Prototype Battery Enclosure for Electric Vehicles

by
Paolo De Sio
1,
Marica Gaito
2,
Vitantonio Esperto
2,
Ersilia Cozzolino
1,
Antonello Astarita
1 and
Fausto Tucci
2,*
1
Department of Chemical, Materials and Industrial Production Engineering, University of Naples “Federico II”, 80125 Naples, NA, Italy
2
Department of Industrial Engineering, University of Salerno, 84084 Fisciano, SA, Italy
*
Author to whom correspondence should be addressed.
Sustainability 2025, 17(4), 1579; https://doi.org/10.3390/su17041579
Submission received: 30 December 2024 / Revised: 3 February 2025 / Accepted: 6 February 2025 / Published: 14 February 2025
(This article belongs to the Special Issue Resource Sustainability: Sustainable Materials and Green Engineering)

Abstract

:
The use of lightweight components in automobiles started a new chapter in the automotive sector due to the renewable energy and sustainability increasing the overall efficiency of vehicles. As vehicle weight is directly linked to energy consumption, reducing mass through advanced materials can significantly decrease energy usage and emissions over the vehicle’s lifetime. This present study aims to conduct a preliminary life cycle assessment (LCA) of a prototype battery pack manufactured using pultruded composite materials with a volume fraction of 50% glass fibers and a volume fraction of 50% nylon 6 (PA6) matrix by quantifying the CO2 emissions and cumulative energy demand (CED) associated with each stage of the battery pack’s life cycle, encompassing production, usage, and end-of-life recycling. The results of the EuCia Eco Impact Calculator and from the literature reveal that the raw materials extraction and use phases are the most energy-intensive and contribute mainly to the environmental footprint of the battery pack. For a single battery pack for EV, the CED is 13,629.9 MJ, and the CO2 eq emissions during production are 1323.9 kg. These results highlight the need for innovations in material sourcing and design strategies to mitigate these impacts. Moreover, the variations in recycling methods were assessed using a sensitivity analysis to understand how they affect the overall environmental impact of the system. Specifically, shifting from mechanical recycling to pyrolysis results in an increase of 4% to 19% of the total CO2 emissions (kg CO2). Future goals include building a laboratory-scale model based on the prototype described in this paper to compare the environmental impacts considering equal mechanical properties with alternatives currently used in the automotive industry, such as aluminum and steel alloys.

1. Introduction

Internal combustion cars have high harmful gas emissions during use when compared to electric cars [1]. Thus, in the last decade, governments have mandated mitigating their environmental impact with respect to greenhouse gasses and have adopted new strategies to accelerate the availability of electric vehicles (EVs) to make the transition to zero-emission transportation easier [2]. Shifting to electric vehicles, which have numerous advantages for reducing air pollution, is in line with current climate challenges. In fact, electric vehicles have significant energy and environmental benefits over traditional fossil vehicles [3]. Reducing vehicle weight is key to improving efficiency and minimizing greenhouse gas emissions in the automotive sector [4]. Electric vehicles represent a breakthrough in the emerging green economy and are making great strides. The battery compartment is a key element of these vehicles; it contains electric batteries, typically composed of lithium cells; its sophisticated and unique design ensures structural stability and passenger safety, making it a focal point of our discussion on sustainable automotive design [5].
The battery pack is in the battery compartment, a space within the vehicle that must be designed to support the battery modules without compromising their functionality over time and if subjected to accidents [6]. In fact, the location of the battery pack within the vehicle can significantly affect dynamic performance. To optimize this, the battery pack should be positioned as close to the ground as possible to reduce the vehicle’s center of gravity. Proper positioning is also critical for vehicle packaging and occupant ergonomics [6]. The battery housing is typically situated beneath the passenger compartment floor to mitigate these potential adverse effects. This configuration enhances battery protection during a side impact and facilitates easier servicing and maintenance. In the new battery electric vehicle (BEV) design, integrating the battery pack’s housing with the vehicle floor creates a sandwich structure, which can improve the vehicle body’s overall stiffness (both torsional and bending) and enhance the acoustic insulation of the passenger compartment. The compartment is often fortified with additional safety systems such as structural reinforcements or fireproofing materials [7]. The battery cells should be kept within the optimal temperature range of 25 °C to 35 °C either by heating or cooling. This is vital for minimizing aging effects and extending the battery’s operational lifespan [6].
Resistance to deformation and vibrations are mechanical characteristics that must be paid attention to for the safety of the battery pack. Low mechanical performance could compromise the battery’s integrity, potentially leading to safety hazards. A lighter vehicle is preferable because it saves space for other components and increases space for batteries, thus improving the range of electric vehicles [5]. The battery typically represents more than a quarter of the total vehicle weight in electric vehicles, reaching a mass close to 700 kg when considering both the batteries and their casing. Therefore, it is essential to also focus on the structure of the battery pack to reduce its complexity, use innovative materials, and reduce costs while simultaneously improving performance [7]. To address these critical issues, studies have been conducted to evaluate the practical design of the battery pack and its components through the integration of the best materials, assessment of the state of health (SOH), assembly configurations, thermal cooling (air and liquid), mechanical safety, and recycling [5].
The battery pack, a crucial component of electric vehicles, is composed of four main structural pieces, namely the top cover, bottom cover, internal structure, and side impact protection structure. In the most effective designs, the battery and housing significantly bolster the vehicle’s structure and ability to absorb the energy of an impact. The pultruded composites have unique properties and play a pivotal role in enhancing the safety of the battery compartment and providing a reliable solution [8]. Indeed, pultrusion is a manufacturing process to produce anisotropic composite profiles with constant cross-section and is characterized by a high compaction of the reinforcement [9]. The schematics of a thermoplastic tape pultrusion process is depicted in Figure 1.
The conventionally used materials are high-strength steel, which offers good impact and abrasion resistance, and aluminum alloys, which are light and corrosion-resistant.
Chi Hoon et al. [10] have been developing a battery enclosure for an electric vehicle in composite. In particular, they have been using glass fibers (15% in weight), carbon fibers (25% in weight), and PA 6 (60% in weight), obtaining a weight reduction of 31% of battery enclosure.
Composite materials, particularly thermoplastic matrix composites, are gaining more attention in various industries. These materials are versatile and efficient and can be recycled in some cases. Composite materials have several advantages over other types of common materials, being lighter, providing greater design freedom with improved space efficiency, allowing for quicker assembly, being corrosion-free, having a longer service life, and with specific formulations, offering better flame resistance. These benefits help increase the sustainability of the vehicle and improve its performance and safety. A prime example is a plug-in hybrid electric vehicle built in China. It uses a thermoplastic polypropylene compound instead of aluminum for its battery case cover, resulting in weight savings and a reduced environmental footprint [11]. This progress in material innovation is an opportunity for the future of sustainable automotive design.
The demand for EVs is increasing every day, and the improvement of their efficiency and mass/cost balance has become a crucial aspect from a global point of view. However, there is an evident shift in focus towards two other pivotal aspects, namely sustainability and the impact on the automotive assembly process. Fiber-reinforced polymers play an even more important role in the choice of materials to be used in the manufacturing of vehicle parts [12]. This wider choice of materials to be used could be a game changer for automotive engineers, materials scientists, and sustainability experts to contribute to the future of automotive design.
It is paramount to assess the overall environmental impact of all vehicle components, studying the phases from production to disposal through a complete life cycle assessment (LCA); this includes the materials used in the battery compartment, their production processes, the energy consumed during manufacturing, and the potential for recycling or reusing these materials at the end of the vehicle’s life. Firstly, an LCA of the materials is needed to assess the use of pultruded composite materials in the construction of the battery compartment. In the study of battery packs for electric vehicles, several studies are concerned with composite materials, and different software programs are typically used to experiment with different options. For example, Ma, Q. et al. [8] studied a new approach to designing and manufacturing battery packs for electric vehicles using carbon fiber composites. The focus is to optimize both the design and the manufacturing processes to enhance the performance and efficiency of the battery packs. Finally, ANSYS version 2021 has been adopted to assess the structure made by the vacuum-assisted resin infusion [8].
This study focuses on the preliminary LCA of a prototype battery pack made in composite materials. The material composition of the battery pack is 50% glass fiber volume fraction and 50% nylon 6 (PA6) matrix. The main impact categories chosen are kg of CO2 emitted and cumulative energy demand (CED), which are two critical indicators often used to assess the sustainability of materials and production processes. The analysis covers from the extraction and processing of raw materials to production by pultrusion, use, and finally, recycling.

2. Materials and Methods

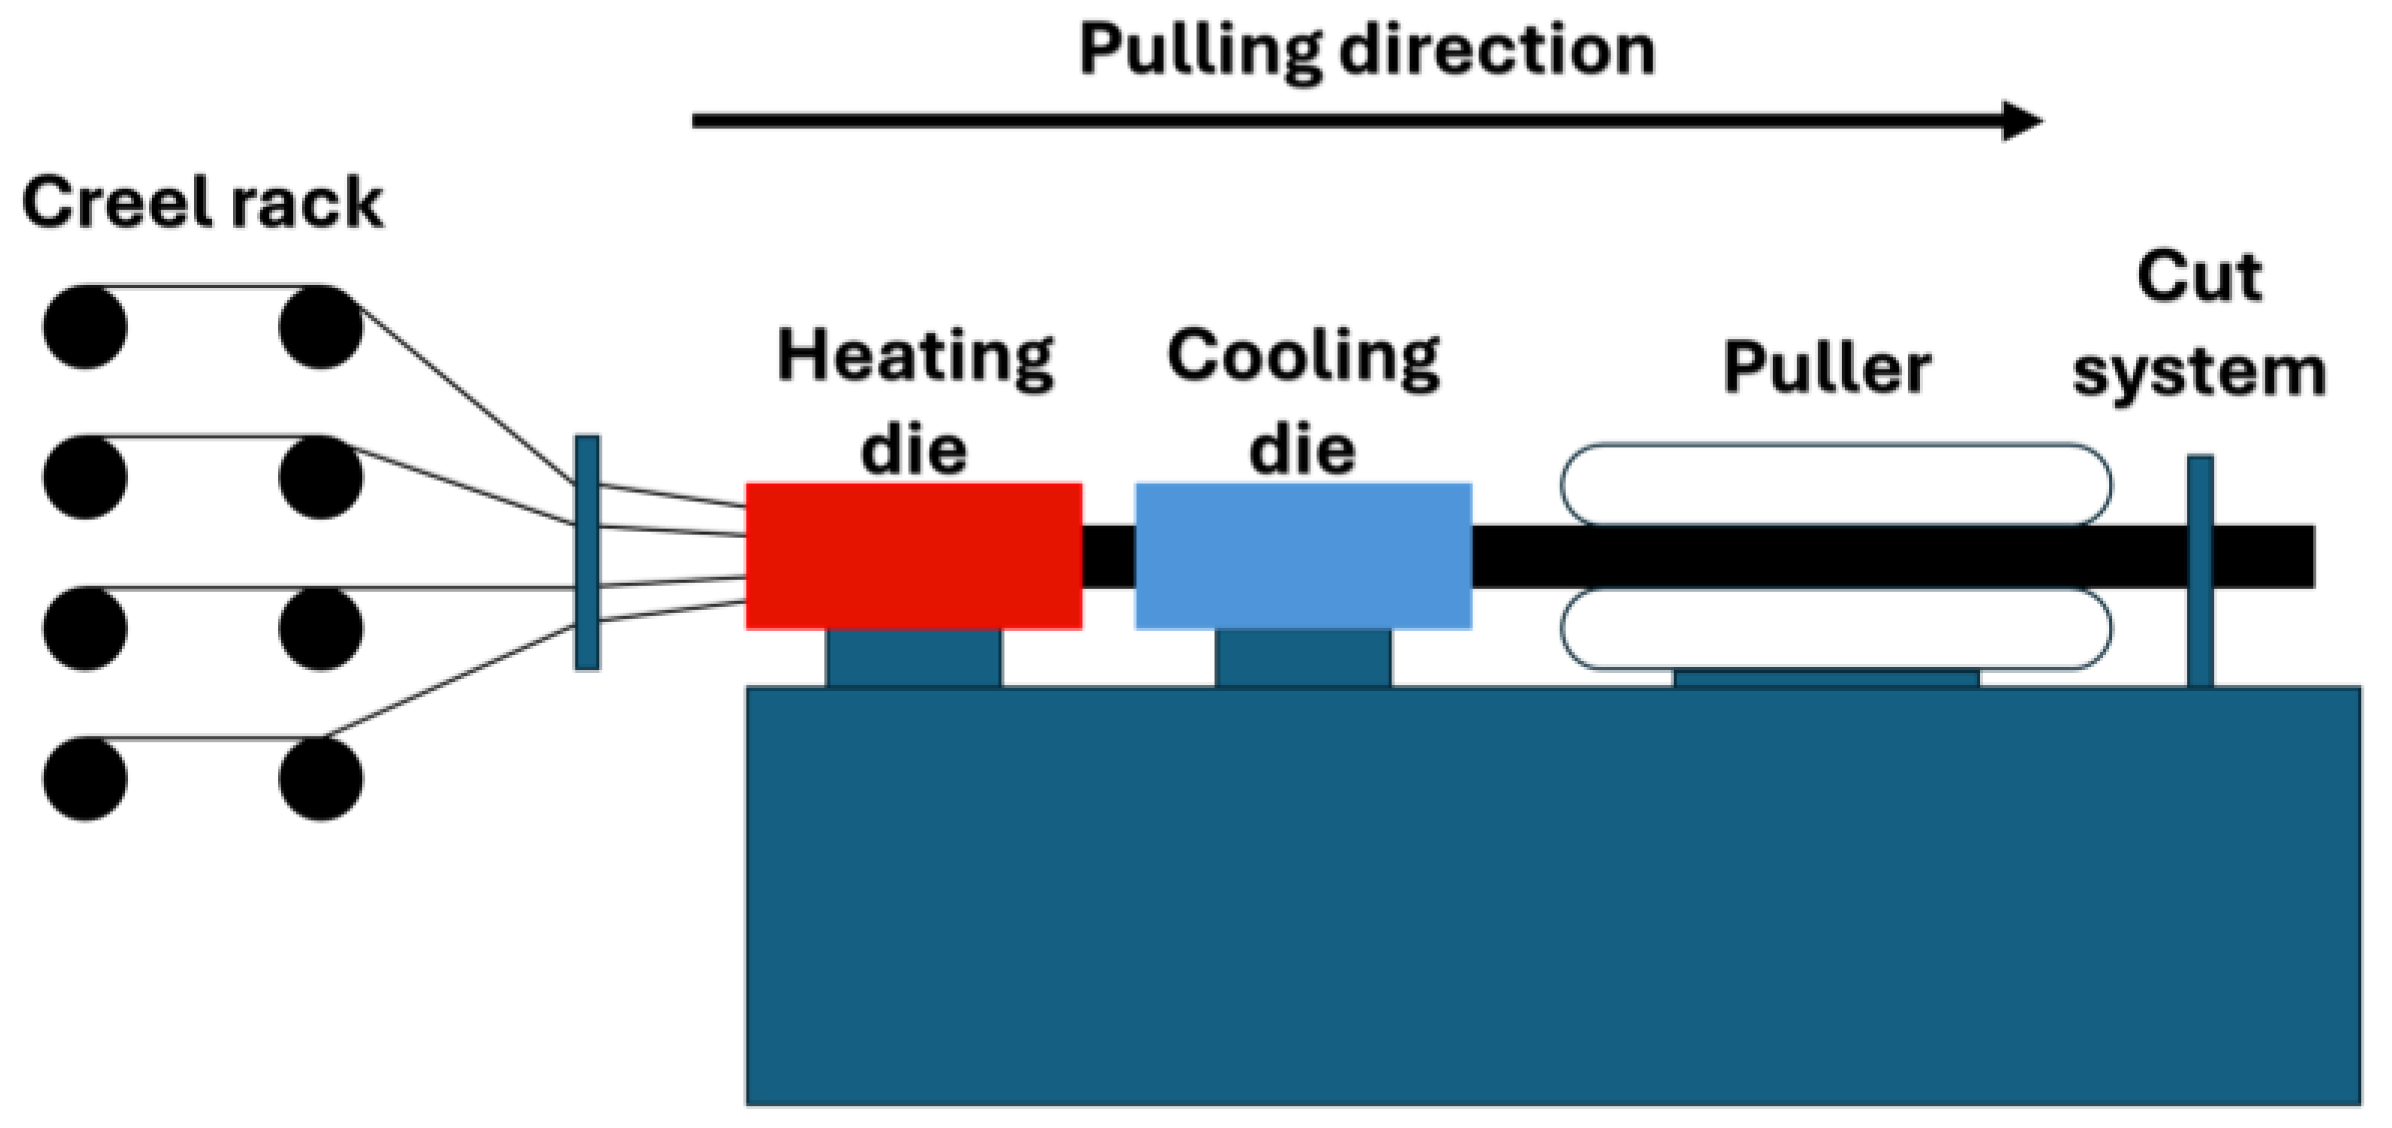
2.1. Battery Pack Case Prototype

The model is based on the Tesla Model 3 battery pack architecture [13]. This design is known for its efficiency and compactness. Using the software SOLIDWORKS® 2024, the battery pack enclosure was modeled and developed for the pultrusion process, securing an organized layout and a high structural performance.
Pultrusion is a continuous process useful for manufacturing constant-section composites with a relatively longer length; it enables production with a high degree of automation and lower production costs. This process allows for the production of composite profiles with tailored properties, such as mechanical, electrical, chemical, or fire-resistant characteristics, making it ideal for several applications [14]. In thermoplastic pultrusion, the polymer is melted by thermal energy to impregnate the fibers, and the resulting profile is then cooled to fix its shape, compacting into lightweight high-strength profiles. The pultrusion of thermoplastic relies on thermal melting rather than chemical polymerization, resulting in a faster and more environmentally friendly production [9]. The battery pack can be reconfigured by varying the length of the profiles to accommodate more modules. By doing so, the production process does not vary, as would have been the case with the molds.
The battery enclosure architecture is divided to accommodate four modules. There are two different types of modules [13] as follows:
  • Two outer modules (25s1p).
  • Two middle modules (28s1p).
These modules were connected in a 106s1p configuration for a total of 106 cells in series.
Stock et al. [15] defined that in LFP (lithium iron phosphate) batteries, each individual cell, as shown in Figure 2, has dimensions of 63 × 82 × 280 mm and weighs 3.163 kg. Considering the total number of cells that make up the battery pack, the total weight of battery cells is 328.6 kg [13].
To enhance manufacturability through the pultrusion process, the battery enclosure shown in Figure 3 includes the following:
  • Battery housing, engineered to securely and precisely house the four modules. The internal slots optimize space utilization, minimize voids, and improve manufacturing efficiency.
  • Battery cover, designed to provide mechanical and environmental protection by closing the system.
  • Structural support, included to ensure the secure attachment of the system to the vehicle’s framework and to guarantee stability and integration during the operation.
Table 1 summarizes the components of the system and their respective quantities and the mass of each individual component.
The compact layout (overall dimensions: 1800 × 1200 × 118 mm) of the project allows for easy access to the modules for maintenance while maintaining optimal internal organization due to its shape.
All battery enclosure components were designed like a pultruded composite consisting of a volume fraction of 50% E-Glass fibers and 50% NYLON 6 (PA6). This material provides an excellent balance between lightweight properties, mechanical strength, and manufacturability.

2.2. Life Cycle Assessment

According to ISO 14040 [16] and ISO 14044 standards [17], the life cycle assessment (LCA) framework consists of the following four main parts [18], schematically represented in Figure 4:
  • Goal and scope definition;
  • Life cycle inventory;
  • Impact assessment;
  • Result interpretation.

Goal and Scope Definition

The main objective of the study is to evaluate the environmental performance of a battery enclosure for electric vehicles (EVs) made of composite materials. The composite enclosures are manufactured through the pultrusion of continuous glass fibers impregnated with a thermoplastic matrix (PA 6). This process produces lightweight and corrosion-resistant components with excellent mechanical properties.
For this study, the following assumptions have been made: the battery pack’s lifespan is projected to be 8 years, with a total average distance of 300,000 km covered throughout its entire life cycle. Additionally, assembly stages are not considered because they are supposed to be negligible compared to the main production stage, and the battery enclosure is completely recycled.
The functional unit was defined as a 1 EV battery enclosure (1800 mm × 1200 mm × 118 mm), designed to store and protect the batteries (55 kWh). The system boundaries, represented in Figure 5, include all life cycle stages, from cradle to grave, including the following:
  • Raw material extraction and transportation: resource extraction for glass fibers and thermoplastics.
  • Manufacturing: Enclosure enclosure fabrication using the processes described above.
  • Use phase: Enclosure enclosure performance during vehicle operation, focusing on weight and energy consumption.
  • End-of-life: Recyclingrecycling, considering the recovery of the whole battery enclosure.
This study excludes product storage and transportation because of the difficulty in finding reliable and accurate data. As noted above, inter-stage transportation data vary widely depending on various factors, such as distance, mode of transportation, and logistical factors, while storage conditions are influenced by environmental and operational factors. In addition, the assembly stage was not considered, as it is assumed to contribute negligibly to the overall environmental impact compared to the production and use stages. This exclusion is in line with the principle of focusing on the most significant parts of the life cycle. Although this decision helps simplify the analysis, it is important to recognize that both transportation and storage could introduce some degree of variability into the overall results, particularly in cases where these stages play a more important role.
In future research, the use of transport and storage data could provide an even more accurate and comprehensive analysis of the entire process.
The collection of primary data is a key step to ensuring the reliability of life cycle assessment. However, since this study focuses on a prototype, data availability is limited. The data collected are the result of combining the following two sources, as reported in Table 2:
  • LCA databases: EuCIA’s Eco Impact Calculator for composites was used for data on raw material extraction and standardized manufacturing processes.
  • The scientific literature: additional information regarding the use phase and the environmental impacts of recycling rates was obtained from relevant studies.

2.3. Life Cycle Inventory

A life cycle inventory analysis involves the compilation and quantification of input and output flows for a given product system throughout its entire lifecycle or individual processes.

2.3.1. Extraction and Production Stage Inventory

Once the battery pack was dimensioned and with the total mass and fiber volume fraction (Vf = 50%) determined, the EuCia tool (v1.1.1) was used to estimate the environmental impact associated with the production of each component.

2.3.2. Use Stage Inventory

The total capacity of the power battery is 55 kWh with an energy consumption of 13.3 kWh/100 km [22]. The energy efficiency of the battery during a complete charge–discharge cycle is 91% (μ × γ) [23]. The number of charge and discharge cycles allows for a range of 300,000–500,000 km. The vehicle mass, excluding the battery enclosure, is assumed to be 1500 kg. The energy consumption of the battery pack during use is attributed to the usage phase of the power battery using the mass allocation principle. The calculation formula is presented according to the literature [20] as follows:
E e v = Q · L · m b p μ · γ · 100 · M c + m b p
In the equation, energy consumption during the use phase of the vehicle is represented by Eev, power consumption per hundred kilometers is denoted as Q (in kWh), and the driving distance of the vehicle is symbolized by L (in km). Charging efficiency is represented by μ, while discharging efficiency is γ. The mass of the battery enclosure without cells is referred to as mbp (in kg), and the mass of the entire vehicle excluding the battery enclosure is referred to as Mc (in kg).

2.3.3. Recycle Stage Inventory

By Lunetto et al. [21], the mechanical recycling of fiberglass composites has a specific energy consumption ranging from 0.4 to 5 MJ/kg. An important hypothesis is that the whole battery enclosure will be recycled. In the absence of direct data on the specific consumption for a glass/PA6 composite, the worst-case scenario was assumed. For a functional unit, the mass amount is 87.55 kg; thus, the associated energy consumption for this process can be calculated according to the product of mass for the upper bound of specific energy consumption (SEC) for mechanical recycling (437.75 MJ).

2.4. Impact Assessment Methodology

Environmental impacts were evaluated using the EuCia Eco impact calculator. By combining the characteristics of the materials with those of the sector of interest, criteria are defined, such as LCA compatibility and coverage of sustainability impacts [24]. The indicators are as follows:
  • Carbon footprint (CF): it calculates the total CO2 and other greenhouse gases (GHGs) associated with an activity or product. In the CF calculation, all GHGs regulated by the Kyoto Protocol (CO2, CH4, N2O, SF6) are considered through the global warming potential (GWP100) of each one, which represents the ratio between the warming caused by the specific GHG in a particular interval of time and the warming caused in the same period by the same amount of CO2 [25].
  • Energy consumption: it calculates the total amount of energy used to produce goods and can include different forms of energy, such as electricity, natural gas, oil, coal, and other non-renewable and renewable energy sources (solar, wind, ocean, hydropower, hydrogen from renewable sources, biofuels, geothermal, biomass) [24]. Both primary and secondary energy were included in this study.

3. Results

The environmental assessment of the battery enclosure reveals key insights into its carbon footprint, energy consumption, and life cycle impacts. The carbon footprint calculated using the Greenhouse Gas Protocol (v1.02) amounts to 308.11 kg CO2 per battery enclosure. In percentages, 85% is attributed to the extraction and transportation of raw materials, while only 15% can be attributed to the pultrusion process. Moreover, EuCIA’s tool was used to calculate environmental impacts using the ILCD 2011 midpoint+ method (v1.09). This tool allowed for the assessment of several indicators, including climate change, human toxicity, and eutrophication. Table 3 shows all environmental impacts using the ILCD 2011 midpoint+ method (v1.09).
As shown in Figure 6, due to EuCia’s tool, to produce one battery enclosure, the cumulative energy demand (CED), determined with the Cumulative Energy Demand v1.11 methodology, amounts to 4488.52 MJ. These findings underline the energy-intensive nature of material extraction and processing compared to the manufacturing stage.
As outlined in the previous sections, it is possible to calculate the energy requirements and CO2 emissions for each phase of the battery enclosure’s life cycle, including the usage and recycling stages. For the usage phase, CED results in 2418 kWh (8704 MJ), while the recycling phase for the entire battery pack demands 437.75 MJ. Thus, the total CED amounts to 13,629.9 MJ. To calculate the kg of CO2 equivalents generated by energy consumption, the electricity consumption for use and recycling phases is considered, referencing the European Union average value of 0.4 kg CO2/kWh [26].

4. Discussion

Figure 6 and Figure 7 indicate that the raw materials extraction and the usage phase contribute the most significant environmental impacts, both in terms of energy consumption and CO2 emissions. Instead, production and especially the recycling phase demonstrate the potential for significant environmental benefits. To mitigate the impacts associated with the extraction and processing of virgin raw materials, recycling and using recycled material plays a crucial role in mitigating the impacts associated with the extraction and processing of virgin raw materials.

4.1. Sensitivity Analysis

Two recycling methods were considered for a sensitivity analysis to understand how much the choice of method affects the total impact. In particular, the study focuses on mechanical recycling and pyrolysis, which differ not only in the process but mainly in the specific energy consumption (SEC) required, directly affecting the total energy use during recycling and the associated environmental impacts. The purpose of the analysis is to provide a clearer view of the trade-offs between recycling processes, with a focus on energy efficiency and sustainability.

Energy Consumption Comparison

By Lunetto et al. [21], SECs were derived for both processes, which as shown in Table 4, are expressed in MJ per kilogram of recycled material. The ranges were identified for each method.
These values indicate the more energy-intensive nature of pyrolysis, which, although it offers the potential for higher quality material recovery than mechanical recycling, results in substantially greater energy demand. However, it should be mentioned how in both processes, there is a loss of quality that does not allow for the same performance as virgin material. However, while mechanical recycling crushes long fibers into shorter fibers, pyrolysis allows long fibers to be obtained as output.
The energy consumption was calculated for the functional unit that weighs 87.55 kg of composite material, which is the mass under consideration for recycling in this study. At its lowest energy consumption (0.4 MJ/kg), mechanical recycling requires only 35.02 MJ for recycling 87.55 kg of GFRP, while pyrolysis, even at its minimum SEC (3 MJ/kg), consumes 262.65 MJ for the same amount of material. The energy consumption evaluated with the upper bound of mechanical recycling, 437.75 MJ, is also much lower than the maximum of pyrolysis, 2626.50 MJ.
Therefore, the mechanical recycling method is generally preferred from an energy consumption point of view, particularly in decision-making scenarios, where the critical factor is energy efficiency. To assess the environmental impacts in the worst-case scenario, the total energy consumed by the recycling process was calculated using the highest SEC values reported for pyrolysis.
The choice to perform this analysis stems from the goal of identifying the outcomes that are the most resource-intensive, providing an approximate estimate of the energy requirements. Figure 8 shows the effect of pyrolysis, the method chosen for recycling, providing information on the contribution of the recycling process to the overall environmental impact of the battery pack. In the worst-case scenario, the impact of recycling increases to 19% of the environmental load in terms of kg of total lifecycle CO2. This shows the critical role of choosing energy-efficient recycling methods to minimize the overall environmental footprint, especially in scenarios where high energy consumption could outweigh the benefits of material recovery. It is necessary to assess how the pyrolysis process has significant environmental implications due to higher energy consumption. In fact, increased energy consumption results in increased carbon emissions. This is accentuated in the pyrolysis process because the energy required does not come from renewable sources.
Contrary to pyrolysis, mechanical recycling has opportunities to produce a smaller carbon footprint linked to lower energy demand. The choice of method to be used in specific industrial contexts is influenced by the quality of the recycled material and its performance in high-performance applications, which put these types of materials in a position to be emphasized. Sensitivity analysis outlines the importance of consideration of both energy consumption and material quality recovery when evaluating recycling methods. Although mechanical recycling is the most energy-efficient method, pyrolysis may be considered in cases where the recovery of high-quality material is critical despite higher energy costs, such as in the case of carbon fiber. According to the analysis of Rosario Fonte et al. [27], both recycling processes attract considerable interest in the market. However, private companies currently focus on mechanical grinding, which may be because this process is 3.4 times less expensive than other recycling methods. In addition, materials recycled by this method also find use in large industries, such as cement clinkers. Financial considerations play a key role: the minimum required to support the mechanical grinding process is EUR 90 per ton, while for pyrolysis, the cost is six times higher, reaching 540 euros per ton.

5. Conclusions

The LCA of the battery pack prototype developed by the pultrusion process makes it evident that the extraction of raw materials and usage phases are the most significant contributors to the overall environmental impact. This finding is linked to both the energy required for raw material processing and the use associated with the product throughout its life. The emissions of CO2 and CED related to raw material processing are critical challenges to address to improve the system’s sustainability.
Instead, the production of components and the end-of-life phase have the lowest environmental impact. Focusing on material recycling, the results suggest the potential for significant reductions in impacts associated with the extraction and processing of primary resources to realize other products in composites. This highlights the role of recycling and the use of recycled materials as an effective strategy for improving the sustainability of composite materials. The selected process is a low-impact option, as evidenced by its relatively small contribution to the overall environmental impact. Promoting advanced recycling technologies and integrating circular economy approaches into the design of products using composite materials is essential.
Future developments will involve the laboratory-scale production of this battery pack prototype to evaluate the mechanical properties and measure environmental impacts derived from primary data acquisition. This will facilitate a comparison with alternative solutions commonly used in the automotive industry, such as steel and aluminum. It will be necessary to conduct a comparative analysis under equivalent mechanical strength requirements to show a more accurate assessment of the differences in environmental impact, energy efficiency, and general performance. This approach could provide a solid framework for identifying the most promising solutions within the context of sustainable industrial applications.

Author Contributions

Conceptualization, P.D.S., M.G. and F.T.; methodology, P.D.S., E.C. and V.E.; software, E.C. and A.A.; formal analysis, P.D.S., E.C. and A.A.; investigation, P.D.S., M.G. and V.E.; resources, A.A. and F.T.; data curation, P.D.S. and V.E.; writing—original draft preparation, P.D.S.; writing—review and editing, V.E. and F.T.; visualization, P.D.S.; supervision, A.A. and F.T.; funding acquisition, A.A. All authors have read and agreed to the published version of the manuscript.

Funding

The authors acknowledge the Italian Ministry for Enterprises and Made in Italy (Ministero per le Imprese e per il Made in Italy) for funding this research activity through the grant “S.M.@. P.S. (Smart Mobilities Advanced Production System)”, grant number F/310126/01-05/X56. The authors also acknowledge the Italian Ministry for University and Research (Ministero dell’Università e della RIcerca) for funding this research activity through the grant “PRIN 2022—GREENER” 2022WF78T3, CUP E53D23003830006. The authors acknowledge the project “National Centre for Sustainable Mobility” (cod. CN00000023—CUP D43C22001190001)—National Recovery and Resilience Plan PNRR—Italian Ministry of University and Research.

Institutional Review Board Statement

Not applicable.

Informed Consent Statement

Not applicable.

Data Availability Statement

The data presented in this study are available upon request from the corresponding author.

Conflicts of Interest

The authors declare no conflicts of interest.

References

  1. Ma, H.; Balthasar, F.; Tait, N.; Riera-Palou, X.; Harrison, A. A New Comparison between the Life Cycle Greenhouse Gas Emissions of Battery Electric Vehicles and Internal Combustion Vehicles. Energy Policy 2012, 44, 160–173. [Google Scholar] [CrossRef]
  2. Moradloo, N.; Mahdinia, I.; Khattak, A. Charging into the Future: Unraveling the Factors Shaping Electric Adoption and Addressing Heterogeneity. SAE Int. J. Sustain. Transp. Energy Environ. Policy 2024, 6, 13. [Google Scholar] [CrossRef]
  3. Silvestri, L.; De Santis, M.; Falcucci, G.; Serao, P.; Bella, G. Evaluation of Battery Power Losses During the LCA Use Phase of Electric Vehicles: An Experimental Analysis of Different Li-Ion Battery Chemistries. SAE Int. J. Adv. Curr. Pract. Mobil. 2023, 6, 2059–2065. [Google Scholar] [CrossRef]
  4. Pradeep, S.A.; Deshpande, A.M.; Shah, B.; Khan, S.; Farahani, S.; Sternberg, J.; Li, G.; Pilla, S. Advancing Automotive Light-Weighting:Material–Process–Microstructure–Performance (MP2) Relationships of Supercritical Injection of PP–Graphene Nanocomposite Foams and Over-Molding. SAE Int. J. Sustain. Transp. Energy Environ. Policy 2024, 5. [Google Scholar] [CrossRef]
  5. Azzopardi, B.; Hapid, A.; Kaleg, S.; Sudirja; Onggo, D.; Budiman, A.C. Recent Advances in Battery Pack Polymer Composites. Energies 2023, 16, 6223. [Google Scholar] [CrossRef]
  6. Khajepour, A.; Fallah, S.; Goodarzi, A. Electric and Hybrid Vehicles: Technologies, Modeling and Control—A Mechatronic Approach; Wiley: Hoboken, NJ, USA, 2014; pp. 1–45. ISBN 978-1-118-34151-3. [Google Scholar]
  7. Belingardi, G.; Scattina, A. Battery Pack and Underbody: Integration in the Structure Design for Battery Electric Vehicles—Challenges and Solutions. Vehicles 2023, 5, 498–514. [Google Scholar] [CrossRef]
  8. Ma, Q.; Fan, D.; Qin, X.; Gan, X.; Cai, M. Parallel Optimization of Design and Manufacturing—Carbon Fiber Battery Pack for Electric Vehicles. Mech. Adv. Mater. Struct. 2022, 31, 2289–2306. [Google Scholar] [CrossRef]
  9. Minchenkov, K.; Vedernikov, A.; Safonov, A.; Akhatov, I. Thermoplastic Pultrusion: A Review. Polymers 2021, 13, 180. [Google Scholar] [CrossRef] [PubMed]
  10. Choi, C.H.; Cho, J.M.; Kil, Y.; Yoon, Y. Development of Polymer Composite Battery Pack Case for an Electric Vehicle. In Proceedings of the SAE Technical Papers, SAE 2013 World Congress and Exhibition, Detroit, MI, USA, 16 April 2013; Volume 2, pp. 1–8. [Google Scholar]
  11. Wazeer, A.; Das, A.; Abeykoon, C.; Sinha, A.; Karmakar, A. Composites for Electric Vehicles and Automotive Sector: A Review. Green Energy Intell. Transp. 2023, 2, 100043. [Google Scholar] [CrossRef]
  12. Liu, Z.; Zhu, C.; Zhu, P.; Chen, W. Reliability-Based Design Optimization of Composite Battery Box Based on Modified Particle Swarm Optimization Algorithm. Compos. Struct. 2018, 204, 239–255. [Google Scholar] [CrossRef]
  13. Nigel Tesla LFP Model 3. Available online: https://www.batterydesign.net/tesla-lfp-model-3/ (accessed on 10 November 2024).
  14. Carlone, P.; Baran, I.; Hattel, J.H.; Palazzo, G.S. Computational Approaches for Modeling the Multiphysics in Pultrusion Process. Adv. Mech. Eng. 2013, 5, 301875. [Google Scholar] [CrossRef]
  15. Stock, S.; Hagemeister, J.; Grabmann, S.; Kriegler, J.; Keilhofer, J.; Ank, M.; Dickmanns, J.L.S.; Schreiber, M.; Konwitschny, F.; Wassiliadis, N.; et al. Cell Teardown and Characterization of an Automotive Prismatic LFP Battery. Electrochim. Acta 2023, 471, 143341. [Google Scholar] [CrossRef]
  16. ISO 14040 2006; Environmental Management—Life Cycle Assessment—Principles and Framework. International Organization for Standardization: Geneva, Switzerland, 2006; pp. 1–20.
  17. ISO 14044 2006; Environmental management—Life cycle assessment—Requirements and guidelines. International Organization for Standardization: Geneva, Switzerland, 2006; pp. 1–46.
  18. Curran, M.A. Life Cycle Assessment: A Review of the Methodology and Its Application to Sustainability. Curr. Opin. Chem. Eng. 2013, 2, 273–277. [Google Scholar] [CrossRef]
  19. EuCia. Eco Impact Calculator For Composites. Available online: https://ecocalculator.eucia.eu/ (accessed on 21 November 2024).
  20. Li, X.; Zhang, Y.; Liao, Y.; Yu, G. Environmental Impact Assessment of Battery Boxes Based on Lightweight Material Substitution. Sci. Rep. 2024, 14, 2594. [Google Scholar] [CrossRef]
  21. Lunetto, V.; Galati, M.; Settineri, L.; Iuliano, L. Sustainability in the Manufacturing of Composite Materials: A Literature Review and Directions for Future Research. J. Manuf. Process 2023, 85, 858–874. [Google Scholar] [CrossRef]
  22. TESLA. Consumo Energetico Del Veicolo. Available online: https://www.tesla.com/it_it/support/power-consumption (accessed on 4 December 2024).
  23. Allgemeine Artikel Model 3 with LFP Cells: The Big Nextmove Winter Test. Available online: https://nextmove.de/model-3-with-lfp-cells-the-big-nextmove-winter-test/ (accessed on 4 December 2024).
  24. Martin Hirschnitz-Garbers (Ecologic Institute) Tanja Srebotnjak (Ecologic Institute) Ecologic Briefs Integrating Resource Efficiency, Greening of Industrial Production and Green Industries-Scoping of and Recommendations for Effective Indicators. Available online: https://www.ecologic.eu/sites/default/files/project/2013/PolicyBrief_EcologicInstitute_20121018_final_A4.pdf (accessed on 22 November 2024).
  25. Veleva, V.; Ellenbecker, M. Indicators of Sustainable Production: Framework and Methodology. J. Clean. Prod. 2001, 9, 519–549. [Google Scholar] [CrossRef]
  26. Istituto Superiore per la Protezione e la Ricerca Ambientale Tabelle per calcolo degli indicatori. Available online: https://www.isprambiente.gov.it/files/emas/tabellepercalcolodegliindicatori.pdf (accessed on 4 December 2024).
  27. Fonte, R.; Xydis, G. Wind Turbine Blade Recycling: An Evaluation of the European Market Potential for Recycled Composite Materials. J. Environ. Manag. 2021, 287, 112269. [Google Scholar] [CrossRef] [PubMed]
Figure 1. Schematic view of thermoplastic pultrusion.
Sustainability 17 01579 g001
Figure 2. Three-dimensional view and dimensions of LFP cell.
Sustainability 17 01579 g002
Figure 3. Three-dimensional exploded assembly drawing of battery enclosure.
Sustainability 17 01579 g003
Figure 4. Stages of a life cycle assessment (LCA), from ISO 14040.
Sustainability 17 01579 g004
Figure 5. System boundaries of the life cycle assessment.
Sustainability 17 01579 g005
Figure 6. Percentage distribution of CED across each life cycle phase of the battery pack, highlighting the contributions from material extraction, production, usage, and recycling.
Sustainability 17 01579 g006
Figure 7. Percentage distribution of kg CO2 across each life cycle phase of the battery pack, highlighting the contributions from material extraction, production, usage, and recycling.
Sustainability 17 01579 g007
Figure 8. Percentage distribution of kg CO2eq across each life cycle phase of the battery pack, highlighting the contributions from material extraction, production, usage, and recycling with the pyrolysis process.
Sustainability 17 01579 g008
Table 1. Components of battery enclosure.
ComponentMass [kg]Quantity
Battery housing39.352
Battery cover2.062
Structural supports1.184
Total 87.55-
Table 2. Data collection.
StageSource
Raw materialEuCIA Eco Impact Calculator for composites [19]
ProductionEuCIA Eco Impact Calculator for composites [19]
UseThe literature [20]
RecyclingThe literature [21]
Table 3. The total score of 1 battery pack is calculated with the ILCD 2011 midpoint+ (v1,09)/EU27 2010 with equal weighting methodology.
Impact CategoryAmountUnit
Climate change3.04 × 102kg CO2 eq
Ozone depletion8.87 × 10⁻6kg CFC-11 eq
Human toxicity, non-cancer effects1.82 × 10⁻5CTuh
Human toxicity, cancer effects3.21 × 10⁻6CTuh
Particulate matter1.15 × 10⁻1kg PM2.5 eq
Ionizing radiation HH1.68 × 101kBq U235 eq
Ionizing radiation E (interim)5.71 × 10⁻5CTUe
Freshwater ecotoxicity5.63 × 102CTUe
Photochemical ozone formation1.68kg NMVOC eq
Acidification9.78 × 10⁻1molc H+ eq
Terrestrial eutrophication2.06molc N eq
Freshwater eutrophication1.43 × 10⁻2kg P eq
Marine eutrophication2.86 × 10⁻1kg N eq
Land use9.89 × 101kg C deficit
Water resource depletion−4.77m3 water eq
Mineral, fossil and ren resource depletion2.55 × 10⁻3kg Sb eq
Table 4. Specific energy consumption (SEC) values for different recycling methods.
MethodSEC [MJ/kg]
Mechanical Recycling (GFRP)0.4–5.0
Pyrolysis3–30
Disclaimer/Publisher’s Note: The statements, opinions and data contained in all publications are solely those of the individual author(s) and contributor(s) and not of MDPI and/or the editor(s). MDPI and/or the editor(s) disclaim responsibility for any injury to people or property resulting from any ideas, methods, instructions or products referred to in the content.

