Article

Carbon Footprint Comparison of Rapeseed and Palm Oil: Impact of Land Use and Fertilizers

1
Department of Soil Science and Land Resource Management, Faculty of Agriculture, IPB University, Bogor 16680, Indonesia
2
Agronomy and Soil Science Research Department, Indonesian Oil Palm Research Institute (IOPRI), Medan 20158, Indonesia
3
Natural Resources and Environmental Management Science, Graduate School, IPB University, Bogor 16129, Indonesia
*
Author to whom correspondence should be addressed.
Sustainability 2025, 17(4), 1521; https://doi.org/10.3390/su17041521
Submission received: 24 December 2024 / Revised: 30 January 2025 / Accepted: 31 January 2025 / Published: 12 February 2025
(This article belongs to the Special Issue Resource Price Fluctuations and Sustainable Growth)

Abstract

:
Palm oil is being criticized as an unsustainable product by the EU due to its association with deforestation and high carbon emissions. However, the producers in Indonesia do not acknowledge the criticisms. Therefore, this study aimed to compare the carbon footprint of a representative EU-produced vegetable oil, rapeseed oil, with Indonesian palm oil. The analysis is divided into two stages, namely (a) land use conversion (LUC) as well as (b) plantation and oil processing. LUC entailed the conversion of native vegetation, such as forest areas and grassland, to vegetable oil crops. The carbon opportunity cost was used to account for the LUC contribution to the carbon footprint. For plantation and oil processing stages, the LCA SIMAPRO was adopted. The results showed that when vegetable oil replaced high-carbon-storage vegetation such as forests, the LUC carbon footprint of rapeseed oil and palm oil production were 2.09 and 1.49 t CO2eq t−1 oil, respectively. Replacing low-carbon-storage vegetation, namely shrub/grassland, led to 0.05 and −0.43 t CO2eq t−1 of repressed and palm oils, respectively. Based on the LCA SIMAPRO, the carbon footprints of plantation and oil processing stages were 1.05 and 0.88 t CO2eq t−1 oil for rapeseed and palm oils, respectively. The cultivation of oil palm in peatland generated a higher total carbon footprint (i.e., combined LUC and plantation and oil processing stages) than rapeseed oil (13.8 to 3.14 t CO2eq t−1 oil). However, in non-peatland areas, the total carbon footprint of palm oil was lower than rapeseed oil (2.37 to 3.14 t CO2eq t−1 oil) when replacing tropical forest and temperate forest vegetation, respectively. The total footprint was 1.2 to 0.45 t CO2eq t−1 oil when both replaced shrub/grassland. The higher productivity of oil palm and lower fertilizer requirement contributed primarily to the lower carbon footprint in non-peatland areas.

1. Introduction

Approximately 85% of the world’s vegetable oil is produced from only four types of crops, namely oil palm, soybean, rapeseed, and sunflower [1,2]. Oil palm is cultivated in tropical zones, while other oil crops are mainly grown in temperate climates [3]. Rapeseed, soy, and palm oil are currently the most widely used in biodiesel production [4].
The European union (EU) is the main producer of rapeseed in the world, with a volume of 19.5 million metric tons per year [5]. In Europe, rapeseed is primarily grown as a winter crop [6]. In 2014, the average yields were 4.5 t/ha and 3.7 t/ha in Germany and France, respectively [7]. Based on observation, Germany has the most suitable land for cultivation [8].
Oil palm is the most criticized vegetable oil crop due to its association with deforestation and high carbon footprint [9,10]. The product from Indonesia faces increased trade restrictions in the EU. For example, the Renewable Energy Directive (RED II) mandated that biofuels comply with strict sustainability criteria, including achieving greenhouse gas emission reductions compared to fossil fuels. In response, palm oil growers in Indonesia perceived the restrictions as a systematic effort to discredit their product in the global market. The growers contended that (a) only 16% of oil palm were associated with deforestation [11,12]; (b) palm oil, as the most productive vegetable oil, had the least potential impact on land conversion; (c) global vegetable oil production, now reaching a total area of 335 Mha, has historically contributed to deforestation; and (d) the Indonesian government has implemented a moratorium of oil palm development in forest and peatland areas since 2018.
Discussions regarding palm oil and its associated deforestation have persisted for years with no sign of resolution in the near future. The objective of this study is to compare the carbon footprint of rapeseed oil, a key vegetable oil in the EU, with that of Indonesian palm oil. The hypothesis is that palm oil does not have a higher carbon footprint than rapeseed oil due to its greater productivity and lower fertilizer requirement.
The carbon footprint of vegetable oil is divided into two stages, namely (a) land use conversion (LUC) as well as (b) plantation and oil processing. Focusing solely on LUC can drive away attention from opportunities to manage carbon footprint during plantation and oil processing, though its contribution remains significant. This study applies the carbon storage opportunity cost approach to quantify the impact of the first stage [13,14]. The method calculates specific carbon stock change when native vegetation is replaced by oil crops. The change is considered a carbon storage opportunity cost when land remains in agricultural use long term. According to [13,14], this approach offers a more realistic assessment by enabling (a) a comparison of carbon storage potential in native vegetation across different climatic and ecosystem zones; (b) a comparison of the carbon cost of agricultural land occupation between crop systems, regardless of when LUC occurred; and (c) consideration that continuous agricultural land use prevents carbon sequestration. This study does not reduce the importance of LUC to carbon footprints but adopted a fairer approach for the assessment, accounting for all contributors to GHG footprint to support more effective emission management.
In the case of Indonesian palm oil, using carbon opportunity cost is now more relevant due to the following reasons: (a) most plantations in the country are in the second or third generation, implying that oil palm replanting is no longer associated with new deforestation; (b) the government has implemented a moratorium on oil palm development in forest and peatland areas since 2018, restricting new plantation to non-forested areas; and (c) certification schemes such as the Roundtable on Sustainable Palm Oil (RSPO) and International Sustainability and Carbon Certification (ISCC) prohibit plantations established after 2005 and 2008, respectively, from qualifying when associated with deforestation [15].
Major pail oil companies present carbon footprints in an annual sustainability report [16]. Several guidelines for calculating GHG emissions in Crude Palm Oil (CPO) production include the RSPO [17], ISCC [18], and the Greenhouse Gas Protocol and Science-Based Target Initiative Forest, Land, and Agriculture [19]. Differences in methodologies significantly impact the emission estimates [20]. Oil palm companies in Indonesia generally use the RSPO PalmGHG calculator to determine carbon footprints [21]. In addition to methodological variations, differences in input data used for Life Cycle Assessments (LCAs) also influence the results. For example, each plantation applies different fertilizer rates and oil productivity, which impact emissions. Therefore, carbon footprint studies should always be accompanied by uncertainty metrics and sensitivity analyses [22,23].
The difference between this study and previous reports on carbon footprints includes (a) incorporating carbon opportunity cost in LUC analysis, facilitating a fairer approach in GHG assessments, (b) analyzing the fertilizer contribution, and (c) assessing uncertainty using the Monte Carlo method and comparing with previous studies

2. Materials and Methods

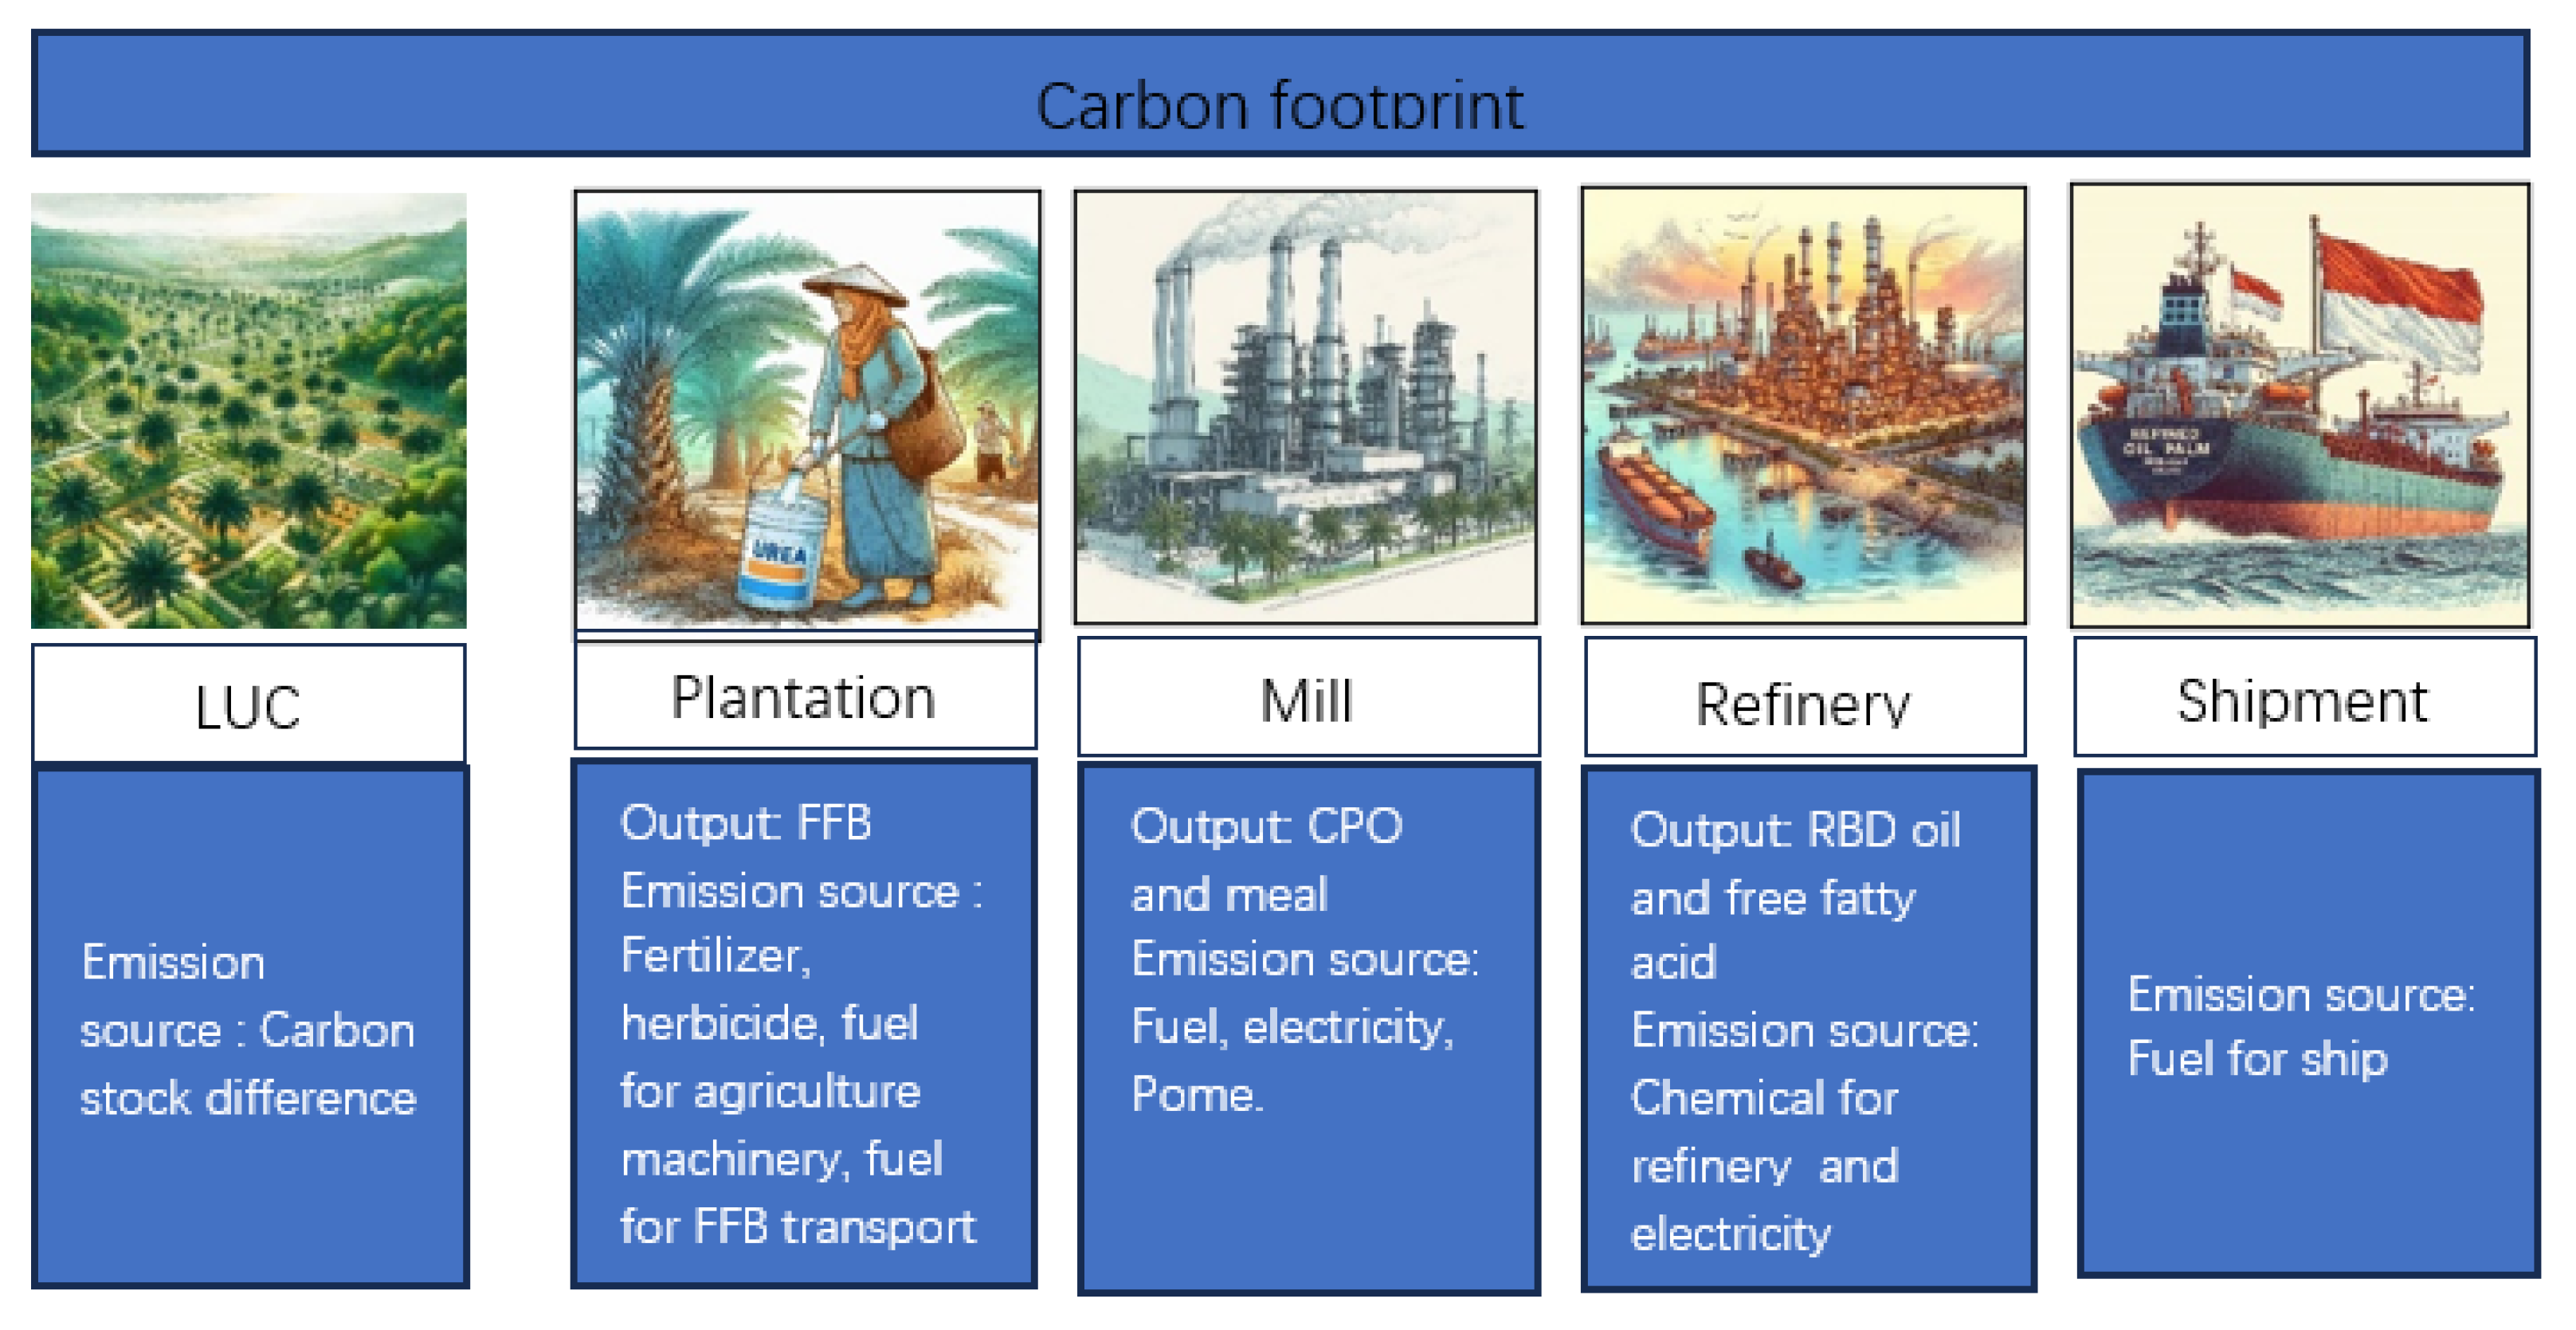
2.1. System Boundary

This study adopted a Cradle-to-Gate boundary, a Life Cycle Assessment approach that evaluated the environmental impact of a product from the very beginning (the “cradle”) to the point of exiting the factory (“gate”). The carbon footprint of vegetable oils was divided into 2 stages, namely (a) LUC as well as (b) plantation and processing, which included plantation, mill, refinery, and shipment to EU, as presented in Figure 1. Refined oil was used for the comparison instead of crude due to the differences in impurity and the free fatty acids removed during refining [2].

2.2. LUC Stage

The carbon storage opportunity method was applied to determine the carbon footprint of land conversion [13]. This approach relied on two important assumptions, namely (a) agriculture land set aside for regeneration restores carbon to native levels within 100 years, and (b) the fallow period has minimal impact on carbon storage since biomass degradation is offset by regrowth in the next cycle. Based on the 1st assumption, a 100 year period is considered sufficient for forests to restore aboveground carbon stocks. This assumption applies to most forest systems in the world [24,25]. Subsequently, carbon stock change values were divided by a factor of 100 to facilitate the distribution annually. Multi-cropping systems were excluded since oil palm intercropping is uncommon. Among possible multi-cropping options such as maize and barley, rapeseed had the highest carbon storage potential, making its exclusion inconsequential.
The carbon storage opportunity approach required the identification of native land use before conversion to vegetable oil crops. Conversion sources included native forest vegetation or other agricultural land such as cereal or legume fields. In this approach, the actual land use type was less important than the potential carbon storage when the land was set aside for regeneration. Native land use was classified into high (forest and peatland—HCS)- and low (grassland or shrub—LCS)-carbon-storage vegetation. In the EU, rapeseed oil production can take place on temperate forests or grasslands, while in Indonesia, palm oil cultivation may occur on secondary forests, peatlands, or shrubs. Currently, converting peatland to palm oil cultivation is restricted due to the following reasons: (a) NDPE (No Deforestation and Peat Exploitation) commitment and, (b) the Indonesian government moratorium on new oil palm development. These regulations prevented new plantation development on peatlands. The existing oil palms were allowed to continue for only one growth cycle.

2.3. Plantation and Oil Processing Stages

The carbon footprint analysis followed the LCA approach, adhering to the principles and framework outlined in SNI ISO 14040:2016 [26], and comprised several key steps. These included (1) a Life Cycle Inventory, identifying emission sources, and (2) a Life Cycle Impact Assessment, calculated using the Emission Factor (EF). The carbon footprints of the plantation and oil processing stages were assessed using LCA SIMAPRO, with the EF from the Ecoinvent 3 database.
Inventory data collected for the plantation and oil processing stages were (a) Fresh Fruit Bunch (FFB) productivity, (b) fertilizer and pesticide uses, (c) fossil fuels for transportation and plantation machinery (tractions), and (d) fuel use in mills. The data for oil palm productivity and fertilizer were collected from Sumatera and Kalimantan, Indonesia, covering 33 plantations in North Sumatra, 50 in Riau, and 74 in West Kalimantan, including both large-scale and smallholder plantations. Fuel consumption for machinery and product transportation (FFB, mill, and ship) was sourced from various journals.
For rapeseed, inventory data, including fossil fuels use for transportation and farm machinery, were collected from 50 statistical publications and journals. To account for data variations, a Monte Carlo simulation was used to estimate uncertainty and sensitivity in carbon footprint calculations. The results were compared with several companies’ sustainability reports on GHG emissions.

3. Results

3.1. LUC Stage Carbon Footprint

The functional unit for carbon footprint comparison is expressed in CO2eq per ton of oil. Palm oil, the most productive vegetable oil, served as the reference for comparison, with a yield of 3.6 t oil ha−1. In the EU, producing an equivalent amount of vegetable oil from rapeseed requires an area of 2.6 ha (Table 1). The carbon opportunity cost is calculated using the formula LUC_CFCO2eq/t_oil = ((Area_equivalent_ha/3.6) × (Cstock_Nat_LU − Cstock_Veg_Oil) × 3.66))/100, where LUC_CFCO2eq/t_oil is the carbon footprint of the LUC stage in CO2eq t−1 oil amortized to 100 years, Area_equivalent_ha is the area equivalent (ha) required to produce 3.6 t oil; in this case, oil palm productivity (3.6 t oil ha−1) was used as a reference, Cstock_Nat_LU is the carbon stock of native land use per ha, and Cstock_Veg_Oil is the carbon stock of vegetable oil crops per ha.
For example, assuming the temperate forest as the native vegetation of rapeseed oil, then the carbon opportunity cost per t oil was ((2.6 ha × (84 − 5) t C ha−1)/3.6 t = 57.1 t C or = 209 t CO2 t−1 oil = 2.09 t CO2eq t−1 oil amortized to 100 years (see Table 1 row 3). Assuming the grassland as the native land use of rapeseed oil, the carbon opportunity cost per t oil was 0,05 t CO2eq t−1 oil amortized to 100 years, as presented in Table 1 row 5. In Indonesia, producing 3.6 t vegetable oil requires only an area of 1 ha oil palm. Assuming tropical forest as a native land use of palm oil, the carbon opportunity cost per t oil was ((1 ha × (230 − 77) t C ha−1)/3.6 t = 42.5 t C or = 155.6 t CO2 t−1 oil = 1.56 t CO2eq t−1 oil amortized to 100 years. Considering scrubland as the native land use for palm oil, the carbon opportunity cost per t oil was −0.43 t CO2eq/t amortized over 100 years, as shown in Table 1, row 1, signifying carbon sequestration.

3.2. Plantation and Oil Processing Stages’ Carbon Footprint

3.2.1. Life-Cycle Inventory

Oil palm, as a perennial crop, requires a low energy input. Land preparation occurs once in a 25-year life cycle. Meanwhile, rapeseed is a high-energy input crop because, every year, land needs to be prepared with agricultural machinery and sown seeds.
Palm oil extraction demands significant energy, but oil palm residues, such as palm press fiber and palm kernel shell, serve as fuel for heat and power generation. From one ton of FFB, approximately 140 kg of fiber and 65 kg of shell are obtained [31]. A mill required 28.6 GJ ha−1 yr−1, while 50 GJ ha−1 yr−1 of renewable energy was generated from the residue combustions. This surplus reduced external fuel dependency [31]. Emissions from transportation include moving FFB from plantations to mills. It is based on a truck capacity of 10 tons of FFB and a standard fuel efficiency of 2.9 km ton L−1 diesel fuel. The distance between palm oil plantations and the mill in Riau and Kalimantan was 2–100 km [16]. The minimum, maximum, and average values of palm oil’s life cycle inventory used in the LCA SIMAPRO are presented in Table 2.
The average level of fertilizer for big plantations in Indonesia is 154, 81, and 190 kg N ha−1 of N, P, and K, respectively. The use of synthetic N fertilizer in agriculture was a major source of nitrous oxide emissions [39]. Based on an experiment in Jambi Sumatra [38], the soil N2O emissions for oil palm were 3.2 ± 0.9 kg ha−1 yr−1 with a N fertilization level of 136 kg ha−1 yr−1.
In Germany, nitrogen fertilizer application reaches up to 250 kg N ha−1 and 180 kg N ha−1 for winter and spring rapeseeds, respectively [40]. According to [41], typical rapeseed farms in Europe applied 175–240 kg of N. The P2O5 application rate for winter and spring rapeseed cultivated in Germany was 80–100 kg ha−1 [40]. In The Netherlands, the nitrogen and P2O5 application rates ranged from 200 to 250 kg N ha−1 and 55 to 70 kg ha−1, respectively, with a yield of 3.9 and 4.0 t ha−1 [42]. Potassium application in Germany reached 120 kg ha−1 and 180–220 kg ha−1 K2O fertilizer for spring and winter rapeseeds, respectively [40]. For plant protection, winter and spring rapeseed required 5 and 6.6 L ha−1, respectively [31]. The minimum, maximum, and average values for rapeseed oil’s life cycle inventory used in the LCA SIMAPRO are presented in Table 3.

3.2.2. Carbon Footprint Using LCA SIMAPRO

For this study, the functional unit is defined as a ton of refined oil, as crude is not substitutable in a one-to-one ratio. It was important to acknowledge that all units were expressed in CO2eq.
During processing in mills, rapeseed and palm oils had co-products including (a) rapeseed oil meal, (b) palm kernel cake, (c) palm kernel oil, and (d) free fatty acid. The allocation methods used to account for the contribution of the co-products were (a) mass and (b) economic allocation. The method allocated a carbon footprint to the product and co-product (s) based on each market value. In the LCA, allocation determined how emissions were assigned to different outputs of the process, as detailed in Table 4.
Based on the LCA SIMAPRO, the allocated carbon footprint for the plantation and oil processing stages are 1.05 and 0.88 t CO2eq t−1 oil for rapeseed and palm oil, respectively, as shown in Table 5. When all stages, namely LUC, plantation, and oil processing, were considered together, the total carbon footprint of rapeseed oil was higher than palm oil, reaching 3.14 to 2.37 CO2eq t−1 oil when replacing high carbon storage vegetation and 1.2 to 0.45 CO2eq/t when replacing low carbon storage vegetation. The emission value for palm oil includes the shipment to the EU, as shown in Table 5. Higher productivity was a key contributor to the lower carbon footprint.
Nitrogen fertilizer and N2O are the key factors contributing to 42% and 85% of GHG emissions in palm oil and rapeseed oil, respectively. In the current discussion, the issues of GHG footprint were dominantly attributed to LUC while paying less attention to other important factors such as fertilizer application. The management of nitrogen fertilizer application during the plantation stages plays a key role in reducing the GHG footprint in vegetable oil crops. In the case of palm oil, methane from palm oil mill effluent (POME) is the second most important contributor to its carbon footprint (41%). Oil extraction had a minimal impact on GHG emissions, as the required energy can be produced by fibers and shells.

3.3. Sensitivity Analysis

Uncertainties in carbon footprint analysis arise from data inaccuracies, sampling limitations, and model assumptions. Sensitivity analysis identifies the most influential variables and assesses changes due to slight data variations. A single-parameter sensitivity analysis varies one input while keeping others constant. Nitrogen fertilizer application is among the most sensitive variables due to multiple influencing factors [55]. As shown in Table 5, nitrogen fertilizer and N2O emissions significantly impact the carbon footprint. The baseline difference in the allocated carbon footprint between palm and rapeseed oil is 166 kg CO2eq (Table 5). A ±20% variation in nitrogen fertilizer and N2O emissions alters the footprint by 74 and 22 kg CO2-eq for palm oil and 230 and 20 kg CO2eq for rapeseed oil (Table 6). For palm oil, a ±20% variation in nitrogen fertilizer remains below the baseline difference (74 vs. 166 kg CO2eq). In contrast, for rapeseed oil, a variation exceeding ±14% raises the footprint beyond the baseline (175 vs. 166 kg CO2eq). Therefore, palm oil consistently has a lower carbon footprint when data variations were within ±14%.

4. Discussion

Rapeseed oil cultivation requires more fertilizer than palm oil, averaging 175 and 154 kg ha−1 yr−1, respectively. Nitrogen fertilizer and associated N2O emissions account for 85% of greenhouse gas emissions in rapeseed oil production and 42% in palm oil.
The carbon footprint of rapeseed oil in this study is in line with previous results. This similarity is due to the simpler and more homogeneous life cycle inventory compared to oil palm. Investigations by [31] in Ireland and [22] in Latvia reported values of 1923 and 1334 kg CO2eq, respectively, while this study estimates 1494 kg CO2eq, which falls within the same order of magnitude.
For palm oil, the calculated carbon footprint is generally higher than in other studies, as presented in Table 7, primarily due to differences in the treatment of biogenic carbon. This analysis assumes that carbon sequestered in harvested fruits is neutral, as the CO2 absorbed during growth is released at the processing and use stages [56]. However, non-harvested biomass, such as palm tree biomass, is factored into the carbon opportunity cost calculation. Carbon sequestration is already considered in the LUC stage by subtracting it from native land carbon storage, as shown in column ‘d’ in Table 1.
Most oil palm companies in Indonesia use the RSPO PalmGHG Calculator tool to calculate carbon emissions for sustainability reports. The RSPO PalmGHG Calculator includes carbon sequestration during the GHG calculation in the plantation stage [32,57]. The calculated crop sequestration in palm oil can be up to −1.28 t CO2eq t−1 oil, resulting in a lower carbon footprint or even becoming negative [58].
Oil palm has a high net primary productivity (NPP), with harvested fruits as the largest contributor [27,59]. However, in the context of Global Warming Potential (GWP), these fruits do not serve as permanent carbon storage. Since the GWP is typically assessed over a 100-year period, biogenic carbon in harvested fruits is released at various stages. In palm oil production, biomass components such as fiber and kernel are burned for energy in mills, releasing CO2 into the atmosphere. Empty bunches used as compost also emit CO2 during decomposition, while POME releases CH4. A significant portion of sequestered biogenic carbon returns to the atmosphere within a decade. Given this short cycle, considering crop-based carbon sequestration as neutral in GWP assessments is reasonable. Therefore, carbon sequestration should be excluded from carbon footprint calculations at the plantation stage.
Regarding the LUC carbon footprint, palm oil sustainability indicators currently focus on deforestation. However, government regulations such as NDPE policies, the moratorium on new plantations in high conservation value (HCVA) and high carbon stock (HCSA) areas, as well as certification restrictions are reducing the relevance of LUC in future GHG management. Additionally, as more oil palm plantations in Indonesia enter the second-generation cycle, the preceding land use is classified as non-forest, justifying further dissociation from deforestation concerns. With deforestation becoming less relevant, managing GHG emissions from nitrogen fertilizer use and POME, which account for 80% of emissions, becomes a priority. Sustainability efforts should focus on plantation and oil processing stages, particularly fertilizer application and POME treatment. The same applies to rapeseed oil, where fertilizer and agrochemicals contribute to 85% of total emissions. In this context, the European Union Deforestation Regulation (EUDR) will not contribute significantly to reducing the carbon footprint of vegetable oils.

5. Conclusions

In conclusion, oil palm grown on peatland had a higher carbon footprint than rapeseed oil. When cultivated in non-peatland areas, its footprint was lower, supporting the hypothesis that the emissions of palm oil were not inherently greater. This lower footprint was due to the higher productivity and lower fertilizer requirements.
In the plantation stage, the N fertilizer was the largest contributor to emissions for both palm and rapeseed oil. For palm oil, POME was the second largest contributor to carbon footprint in the oil processing stage mill. Stricter government regulation regarding oil palm development in high-carbon storage areas (forest and peatland), alongside the replanting of second-generation palms, are expected to further reduce the impact of the LUC stage in the future. Mitigation efforts should focus on intercropping, agroforestry, and using oil processing byproducts. For accurate comparisons, biogenic carbon sequestration should be excluded from footprint calculations.

Author Contributions

Conceptualization, S.T.; methodology, S.T.; software, S.T. and Y.K.; validation, I.P. and N.H.D.; formal analysis, S.T.; investigation, S.T., I.P. and N.H.D.; resources, S.T.; data curation, S.T., I.P., N.H.D. and Y.K.; writing—original draft preparation, S.T.; writing—review and editing, S.T. and I.P.; visualization, S.T.; supervision, S.T.; project administration, S.T.; funding acquisition, S.T. All authors have read and agreed to the published version of the manuscript.

Funding

This research was funded by the Indonesian Endowment Fund for Education (LPDP) through the Equity Program (DAPT), specifically under the international study collaboration scheme/Riset Kolaborasi Internasional (Ri-Koin) (Grant No. 578/IT3.D10/PT.01.03/P/B/2023).

Institutional Review Board Statement

Not applicable.

Informed Consent Statement

Not applicable.

Data Availability Statement

The original contributions presented in this study are included in the article. Further inquiries can be directed to the corresponding author.

Acknowledgments

We would like to express our gratitude for the study funding provided by the Indonesian Endowment Fund for Education (LPDP) through the Equity Program (DAPT).

Conflicts of Interest

The authors declare no conflicts of interest.

References

  1. FAO. The State of Food and Agriculture. Making Agrifood Systems More Resilient to Shocks and Stresses; FAO Publishing: Rome, Italy, 2021. [Google Scholar] [CrossRef]
  2. Schmidt, J.H. Life cycle assessment of five vegetable oils. J. Clean. Prod. 2015, 87, 130–138. [Google Scholar] [CrossRef]
  3. Uusitalo, V.; Väisänen, S.; Havukainen, J.; Havukainen, M.; Soukka, R.; Luoranen, M. Carbon footprint of renewable diesel from palm oil, jatropha oil, and rapeseed oil. Renew. Energy 2014, 69, 103–113. [Google Scholar] [CrossRef]
  4. Lukovic, N.; Knezevic-Jugovic, Z.; Bezbradica, D. Biodiesel fuel production by enzymatic transesterification of oils: Recent trends, challenges, and future perspectives. In Alternative Fuel; Manzanera, M., Ed.; Books on Demand: Norderstedt, Germany, 2011; pp. 47–72. [Google Scholar]
  5. Statista. Production of Major Vegetable Oils Worldwide from 2012/2013 to 2022/2023. 2023. Available online: https://www.statista.com/statistics/263933/production-of-vegetable-oils-worldwide-since-2000/ (accessed on 1 June 2024).
  6. Singh, B.P. Biofuel Crop Sustainability; Wiley-Blackwel: Hoboken, NJ, USA, 2013; ISBN 978-0-470-96304-3. [Google Scholar]
  7. Faostat. Available online: http://www.fao.org/faostat/en/#home (accessed on 11 December 2024).
  8. Van Duren, I.; Voinov, A.; Arodudu, O.; Firrisa, M.T. Where to produce rapeseed biodiesel and why? Mapping European rapeseed energy efficiency. Renew. Energy 2015, 74, 49–59. [Google Scholar] [CrossRef]
  9. Vijay, V.; Pimm, S.L.; Jenkins, C.N.; Smith, S.J. The Impacts of Oil Palm on Recent Deforestation and Biodiversity Loss. PLoS ONE 2016, 11, e0159668. [Google Scholar] [CrossRef]
  10. Teng, S.; Khong, K.W.; Norbani, C.H. Palm oil and its environmental impacts: A big data analytics study. J. Clean. Prod. 2020, 274, 122901. [Google Scholar] [CrossRef]
  11. Meijaard, E.; Garcia-Ulloa, J.; Sheil, D.; Wich, S.A.; Carlson, K.M.; Juffe-Bignoli, D.; Brooks, T.M. (Eds.) Oil Palm and Biodiversity. A Situation Analysis by the IUCN Oil Palm Task Force; IUCN: Gland, Switzerland, 2018; Volume 13, 116p. [Google Scholar]
  12. Bakhtiar, I.; Suradiredja, D.; Santoso, H.; Saputra, W. Hutan Kita Bersawit; Yayasan KEHATI: South Jakarta, Indonesia, 2019; ISBN 978-623-7041-01-6. [Google Scholar]
  13. Searchinger, T.D.; Wirsenius, S.; Beringer, T.; Dumas, P. Assessing the efficiency of changes in land use for mitigating climate change. Nature 2018, 564, 249–253. [Google Scholar] [CrossRef]
  14. Alcock, T.D.; Salt, D.E.; Wilson, P.; Ramsden, S.J. More sustainable vegetable oil: Balancing productivity with carbon storage opportunities. Sci. Total Environ. 2022, 829, 154539. [Google Scholar] [CrossRef]
  15. Peteru, S.; Komarudin, H.; Brady, M. Sustainability Certifications, Approaches, and Tools for Oil Palm in Indonesia and Malaysia. European Forest Institute 2022. Available online: https://www.cifor-icraf.org/knowledge/publication/8756/ (accessed on 2 June 2024).
  16. Traction Energy Asia. Greenhouse Gas Emissions from Biodiesel Production in Indonesia Based on Life Cycle Analysis. 2019. Available online: https://tractionenergy.asia/ (accessed on 2 June 2024).
  17. RSPO. Cultivating Sustainability for People and Planet. 2023. Available online: https://rspo.org/ (accessed on 5 June 2024).
  18. ISCC. Solutions for Sustainable and Deforestation. 2023. Available online: https://www.iscc-system.org/ (accessed on 8 April 2024).
  19. GHG. We Set the Standards to Measure and Manage Emissions. 2023. Available online: https://ghgprotocol.org/ (accessed on 6 June 2024).
  20. Amri, N.N.; Anwar, S.; Jupesta, J.; Sahari, B. Differences in greenhouse gas emission calculation guidelines for palm oil and its implication on mitigation planning. IOP Conf. Ser. Earth Environ. Sci. 2023, 1266, 012066. [Google Scholar] [CrossRef]
  21. Walker, S.M.; McMurray, A.; Rinaldy, F.; Brown, K.; Karsiwulan, D. Compilation of Best Management Practices to Reduce Total Emissions from Palm Oil Production; Report to: Roundtable on Sustainable Palm Oil (RSPO); Winrock International: Little Rock, AR, USA, 2018. [Google Scholar]
  22. Fridrihsone, A.; Romagnoli, F.; Cabulis, U. Environmental Life Cycle Assessment of Rapeseed and Rapeseed Oil Produced in Northern Europe: A Latvian Case Study. Sustainability 2020, 12, 5699. [Google Scholar] [CrossRef]
  23. Malça, J.; Freire, F. Uncertainty analysis in biofuel systems: An application to the life cycle of rapeseed oil. J. Ind. Ecol. 2010, 14, 322–334. [Google Scholar] [CrossRef]
  24. Poorter, L.; Bongers, F.; Aide, T.M.; Almeyda Zambrano, A.M.; Balvanera, P.; Becknell, J.M.; Boukili, V.; Brancalion, P.H.; Broadbent, E.N.; Chazdon, R.L.; et al. Biomass resilience of neotropical secondary forests. Nature 2016, 530, 211–214. [Google Scholar] [CrossRef] [PubMed]
  25. Bernal, B.; Murray, L.T.; Pearson, T.R.H. Global carbon dioxide removal rates from forest landscape restoration activities. Carbon Balance Manag. 2018, 13, 22. [Google Scholar] [CrossRef] [PubMed]
  26. SNI ISO 14040:2016; Code for Environmental Management—Life Cycle Assesment. Guideline for LCA Reporting. Directorate General of Pollution and Environmental Damage Control, Ministry of Environment and Forestry, Indonesia: Jakarta, Indonesia. ISO: Geneva, Switzerland, 2021.
  27. Guillaume, T.; Kotowska, M.M.; Hertel, D.; Knohl, A.; Krashevska, V.; Murtilaksono, K.; Scheu, S.; Kuzyakov, Y. Carbon costs and benefits of Indonesian rainforest conversion to plantations. Nat. Commun. 2018, 9, 2388. [Google Scholar] [CrossRef] [PubMed]
  28. Khasanah, N.; van Noordwijk, M.; Ningsih, H. Aboveground carbon stocks in oil palm plantations and the threshold for carbon-neutral vegetation conversion on mineral soils. Cogent Environ. Sci. 2015, 1, 1119964. [Google Scholar] [CrossRef]
  29. Khasanah, N.; van Noordwijk, M.; Ningsih, H.; Rahayu, S. Carbon neutral? No change in mineral soil carbon stock under oil palm plantations derived from forest or non-forest in Indonesia. Agric. Ecosyst. Environ. 2015, 211, 195–206. [Google Scholar] [CrossRef]
  30. IPCC (Intergovernmental Panel on Climate Change). N2O emissions from managed soils and CO2 emissions from lime and urea application. In IPCC Guidelines for National Greenhouse Gas Inventories; Eggleston, H.S., Buendia, L., Miwa, K., Ngara, T., Tanabe, K., Eds.; Institute for Global Environmental Strategies: Hayama, Japan, 2006; Volume 4. [Google Scholar]
  31. Thamsiriroj, T.; Murphy, J.D. Is it better to import palm oil from Thailand to produce biodiesel in Ireland than to produce biodiesel from indigenous Irish rape seed? Appl. Energy 2009, 86, 595–604. [Google Scholar] [CrossRef]
  32. Chase, L.D.C.; Henson, I.E. A detailed greenhouse gas budget for palm oil production. Int. J. Agric. Sustain. 2010, 8, 199–214. [Google Scholar] [CrossRef]
  33. Choo, Y.M.; Muhamad, H.; Hashim, Z.; Subramaniam, V.; Puah, C.W.; Tan, Y.A. Determination of GHG contributions by subsystems in the oil palm supply chain using the LCA approach. Int. J. Life Cycle Assess. 2011, 16, 669–681. [Google Scholar] [CrossRef]
  34. Schmidt, J. Life Cycle Assessment of Rapeseed Oil and Palm Oil. Ph.D. Thesis, Department of Planning and Development, Aalborg University, Aalborg, Denmark, 2007. [Google Scholar]
  35. Aziz, N.I.H.A.; Hanafiah, M.M. Life cycle analysis of biogas production from anaerobic digestion of palm oil mill effluent. Renew. Energy 2019, 145, 847–857. [Google Scholar] [CrossRef]
  36. Brinkman Consultancy. Greenhouse Gas Emissions from Palm Oil Production Literature Review and Proposals from the RSPO Working Group on Greenhouse Gases; Final Report 2009; RSPO: Kuala Lumpur, Malaysia, 2009. [Google Scholar]
  37. Hong, W.O. Review on Carbon Footprint of the Palm Oil Industry: Insights into Recent Developments. Int. J. Sustain. Dev. Plan. 2023, 18, 447–455. [Google Scholar] [CrossRef]
  38. Stiegler, C.; Koebsch, F.; Ali, A.A.; June, T.; Veldkamp, E.; Corre, M.D.; Koks, J.; Tjoa, A.; Knohl, A. Temporal variation in nitrous oxide (N2O) fluxes from an oil palm plantation in Indonesia: An ecosystem-scale analysis. Bioenergy 2023, 15, 1221–1239. [Google Scholar] [CrossRef]
  39. Iriarte, A.; Rieradevall, J.; Gabarrell, X. Life cycle assessment of sunflower and rapeseed as energy crops under Chilean conditions. J. Clean. Prod. 2010, 18, 336–345. [Google Scholar] [CrossRef]
  40. El Bassam, N. Handbook of Bioenergy Crops: A Complete Reference to Species, Development, 1st ed.; Earthscan: London, UK, 2010. [Google Scholar]
  41. Arthey, T. Challenges and Perspectives in Global Rapeseed Production; Agri-Benchmark: Braunschweig, Germany, 2020. [Google Scholar]
  42. Marinussen, M.; van Kernebeek, H.; Broekema, R.; Groen, E.; Kool, A.; van Zeist, W.J.; Dolman, M.; Blonk, H. LCI Data for the Calculation Tool Feedprint for Greenhouse Gas Emissions of Feed Production and Utilization Cultivation Oil Seeds and Oil Fruits; Crushing Industry: Turkistan, Kazakhstan, 2012; p. 66. [Google Scholar]
  43. Richter, R. Prozesskosten in Ausgewählten Produktionsverfahren in Sachsen-Anhalt; Landesanstalt für Landwirtschaft und Gartenbau Sachsen-Anhalt: Bernburg, Germany, 2016. [Google Scholar]
  44. Statistische Ämter des Bundes und der Länder, Deutschland. 2023. Available online: https://www.statistikportal.de/en/node/106 (accessed on 7 April 2024).
  45. Malça, J.; Coelho, A.; Freire, F. Environmental life-cycle assessment of rapeseed-based biodiesel: Alternative cultivation systems and locations. Appl. Energy 2014, 114, 837–844. [Google Scholar] [CrossRef]
  46. Lachmann, N. Makronährstoffdüngung im Winterraps; RAPOOL-RING GmbH: Isernhagen, Germany, 2022; Available online: www.rapool.de (accessed on 6 May 2024).
  47. Dalgaard, R.; Schmidt, J.; Halberg, N.; Christensen, P.; Thrane, M.; Pengue, W.A. LCA of Soybean Meal. Int. J. LCA 2008, 13, 240–254. [Google Scholar] [CrossRef]
  48. Gupta, R.; McRoberts, R.; Yu, Z.; Smith, C.; Sloan, W.; You, S. Life cycle assessment of biodiesel production from rapeseed oil: Influence of process parameters. Bioresour. Technol. 2022, 360, 127532. [Google Scholar] [CrossRef]
  49. LfL [Bayerische Landesanstalt für Landwirtschaft]. Anbauempfehlungen für Winterraps; LfL: Freising, Germany, 2011; Available online: www.LfL.bayern.de (accessed on 6 June 2024).
  50. O’keeffe, S.; Majer, S.; Drache, C.; Franko, U.; Thran, D. Modelling biodiesel production within a regional context—A comparison with RED Benchmark. Renew. Energy 2017, 108, 355–370. [Google Scholar] [CrossRef]
  51. Poor, J.; Nemecek, T. Reducing food’s environmental impacts through producers and consumers. Science 2018, 360, 987–991. [Google Scholar] [CrossRef]
  52. Queiros, J.; Malça, J.; Freire, F. Environmental life-cycle assessment of rapeseed produced in Central Europe: Addressing alternative fertilization and management practices. J. Clean. Prod. 2015, 99, 266–274. [Google Scholar] [CrossRef]
  53. Available online: https://www.kws.com/de/de/beratung/bestandesfuehrung/duengung/duengung-raps/ (accessed on 9 April 2024).
  54. Silalertruksa, T.; Gheewala, S.H. Environmental sustainability assessment of palm biodiesel production in Thailand. Energy 2012, 43, 306–314. [Google Scholar] [CrossRef]
  55. Larson, E. A review of life-cycle analysis studies on liquid biofuel systems for the transport sector. Energy Sustain. Dev. 2006, 10, 109–126. [Google Scholar] [CrossRef]
  56. Schmidt, J.; De Rosa, M. Certified palm oil reduces greenhouse gas emissions compared to non-certified. J. Clean. Prod. 2020, 277, 124045. [Google Scholar] [CrossRef]
  57. Ramirez-Contreras, N.E.; Munar-Florez, D.A.; Garcia-Nunez, J.A.; Mosquera-Montoya, M.; Faaij, A.P.C. The GHG emissions and economic performance of the Colombian palm oil sector; current status and long-term perspectives. J. Clean. Prod. 2020, 258, 120757. [Google Scholar] [CrossRef]
  58. Tiong, L.G.; Cai, H. Calculating GHG Emission in Oil Palm Using PalmGHG. Planter 2017, 93, 167–276. [Google Scholar]
  59. Meijide, A.; de la Rua, C.; Guillaume, T.; Röll, A.; Hassler, E.; Stiegler, C.; Knohl, A. Measured greenhouse gas budgets challenge emission savings from palm-oil biodiesel. Nat. Commun. 2020, 11, 1089. [Google Scholar] [CrossRef]
Figure 1. Boundary for the vegetable oil carbon footprint assessment.
Sustainability 17 01521 g001
Table 1. Carbon opportunity costs the production of 1 ton of vegetable oils (palm oil and rapeseed oil).
Area Equivalent (ha)Biogenic Carbon for an Area EquivalentC Stock Change from Native to Oil Cropt CO2eq t−1 Oil (Amortized to 100 Years)
Oil Crop
(t C)
Native Land Use
(t C ha−1)
t C ha−1t C t−1 Oilkg CO2-eq kg−1 Oil
abcd = (c − b) × ae = d/3.6f = e × 3.66f/100
177 g1 (Oil palm)34.4 (Shrub) g2−42.6−11.8−43.18−0.43
230 g3 (Tropical forest)15342.5155.61.56
230 g3 + 1200 h
(Peat swamp forest)
1353375.81375.513.76
2.6 i5 j (Rapeseed)84 (Temperate forest) k205.457.12092.09
6.8 (Grassland) l4.681.34.760.05
Remarks: a = area equivalent (ha) required to produce 3.6 t oil—in this case, we use oil palm productivity (3.6 t oil ha−1) as a reference; b and c = biogenic carbon stock/ha for vegetable oils and native land use, respectively; d = change of carbon stock from native land use to vegetable oil crop; e = converting t C ha−1 to t C t−1 oil; f = converting t C t−1 oil to t CO2 eq t−1 oil; g1, g2, g3, j, k, l = biogenic carbon of oil palm, shrub, tropical forest, rapeseed, temperate forest, and grassland per ha, respectively [14,27,28,29]; h = peat emission in 100 years [30]: 44 t CO2eq ha−1 yr−1 × 100 year/3.68 = 1200 t C ha−1; i = area (ha) equivalent of rapeseed required to produce 3.6 t vegetable oil.
Table 2. Input, with ranges, used in LCA SIMAPRO for oil palm big plantation (all units are in kg ha−1 yr−1 except electricity and heat, which are in Kwh and MJ ha−1 yr−1, respectively).
ComponentDescriptionAverage (min–max)Sources
YieldFFB22,000 (18,000–26,000)Field survey
CPO4400 (3760–5320)Field survey
RPO3960 (3380–4790)Field survey
PKO560 (480–680)Field survey
Pome14,960 (1090–15,430)
FuelPlantation machinery65 (40–89)[31] (55 kg); [32] (89 kg);
[33] (40 kg)
CultivationN154 (123–185)Field survey
P as P2O581 (65–97)Field survey
K as K2O190 (152−228)Field survey
Herbicide2.0 (1.6–2.4)Field survey
Mg as MgO52.0(41.6–62.4)Field survey
RefineryBleaching earth17.8[34]
NaOH11.5[34]
Phosphoric acid0.9[34]
Heat (steam)1298.8 MJ[34]
Electricity138.6 KWh[34]
Fuel-Product Transport10t truck (farm to mill)31.6[16]
30t truck (mill to refinery)5.5[16]
2400t ship to EU415[31]
Emission to airCH4122.4[33] (11.9 kg CH4/t POME), [35] (9.9 kg CH4/t POME),
[36] (625–1467 kg CO2/t CPO),
[37] (637–1131 kg CO2/t CPO); [16] (436 kg CO2/t CPO)
N2O3.2[38]
Table 3. Input, with ranges, used in LCA SIMAPRO for rapeseed oil (values are given in kg ha−1 yr−1 per ton refined oil except for electricity and heat, which are in Kwh and MJ ha−1 yr−1, respectively).
ComponentDescriptionAverage
(min–max)
References
YieldSeed3750 (3000–4500)(1) [43] (Germany; 3.79 tons seed);
(2) [44] (3.98 ton seed)
(3) [31] (Ireland: 4.11 ton seed)
(4) [45] (3.75 ton seed);
CRO1500 (1200–1800)
Meal2250 (1800–2700)[45] (60% meal–40% Oil)
CultivationN175 (130–220)(1) Field Survey (Germany; N = 160 kg; K = 40 kg);
(2) [46] (Germany; N = 130 kg ha−1. K = 50 kg ha−1, P = 135 kg; S = 30 kg)
(3) [43] (Germany; N = 175 kg);
(4) [41] (Germany; N = 208 kg);
(5) [47] (N = 167 kg, P = 24 kg, K = 77 kg)
(6) [22] (Latvia; N = 220 kg ha−1, P2O5 = 61 kg ha−1, K2O ha−1 = 129 kg; S = 59 kg)
(7) [22] (Latvia; N = 220 kg/ha, P2O5 = 61 kg ha−1, K2O ha−1 = 129 kg)
(8) [48] (UK; N = 135 kg ha−1, P2O5 = 72 kg ha−1, K2O = 62 kg; S = 63 kg)
(9) [49] 2011 (N = 210 kg)
(10) [45] (Germany; N = 153 kg, P2O5 = 44 kg ha−1, K2O ha−1 = 33 kg)
(11) [50] (N = 176 kg, P = 63 kg
(12) [51] (2018) (N = 176 kg)
(13) [52] (Germany; N = 155 kg, P2O5 = 44 kg ha−1, K2O ha−1 = 92 kg)
(14) [53]
(15) [34] (N = 140 kg, P = 57 kg, K = 99 kg)
P as P2O571 (24–117)
K as K2O82 (33–130)
S47 (30–63)
Pesticide2.5 (2–3.4)Field Survey Germany; [22,48] (3.4 L).
Emission to airN2O1.9 (1.7–2.0)[31] (1.7 kg); [22] (1.73 kg)
Fuel (Traction)Agricultural machinery82 (41–122)[31] (99 kg); [45] (Germany; 80 kg); [52] (57 kg), [22] (41 kg), [48] UK: 122 kg); [52] (70 kg)
Mill (drying and pressing)37 (18–55)[31] (55 kg); [48] (24.4 kg); [22] (18 kg); [45] (34 kg); [52] (32 kg); [34] (18 kg)
Transport24 t tuck fuel from farm to mill/refinery33.7(26.9–40.4)[22]
Material Use RefineryBleaching earth13.50[34]
NaOH3.2[34]
Phosphoric acid1.2[34]
Sulphuric acid2.9[34]
Heat339 MJ[34] (MJ)
Electricity43.3[34] (KWh)
NaoH20 (16–24)[31] (16 kg); [54] (24 kg)
Fuel32
Table 4. Economic allocation for oil and meal.
ProductPrice (US $/t)One Growing Cycle Oil Yield (t ha−1)Allocation
Palm oil5708282%
Palm Kernel oil6581112%
Palm Kernel meal98122%
Palm Fatty acid6323.74%
Rapeseed oil8400.670%
Rapeseed meal2470.930%
Table 5. LCA component and carbon footprint (kg CO2eq t−1 oil).
LCA ComponentsSmallholder Palm OilCompany Palm OilRapeseed
Non-AllocatedAllocatedNon-AllocatedAllocatedNon-AllocatedAllocated
PlantationFertilizer and herbicideN367300.9370.9304.11168817.6
N2O11090.275.662.099.869.9
P2O540.132.929.424.168.548.0
K2O53.343.756.946.724.817.4
Mg and Herbicide16.913.911.59.414.410.1
Fuel 15.312.513.210.833.123.2
Sub-Total 602.6494.1557.5457.21408.6986.0
MillFuel 4.33.510.825.417.8
POMECH4436357.5436357.500.0
Sub-Total 440.3361.0437358.325.417.8
RefineryChemical 4.53.74.43.64.12.9
Electricity 36.129.636.129.629.820.9
Heat 38.531.638.631.726.618.6
Sub-Total 79.164.979.164.960.542.4
Shipment 82.968.056.546.300.0
Total 11229201073.6880.41494.51046.2
Table 6. Carbon footprint changes from baseline value due to the data input variation in fertilizer N and N2O (kg CO2eq).
Data Input Variation
Fertilizer NN2O Emission
±10%±15%±20%±10%±15%±20%
Smallholder oil palm±37±56±74±11±1722
Big company oil palm±37±56±74±7±1114
Rapeseed±120±175±230±10±1520
Table 7. Carbon footprint in plantation stage from other studies.
Oil Palm CompanyEmission (t CO2eq t−1 Oil)MethodSource
V0.49PalmGHG Calculator[16] (p. 12;20;36)
W0.40PalmGHG Calculator[16] (p. 13;20;36)
Y0.54PalmGHG Calculator[16] (p. 15;20;36)
Z0.34PalmGHG Calculator[16] (p. 17;20;36)
This study0.56LCA SIMAPROTable 5
Disclaimer/Publisher’s Note: The statements, opinions and data contained in all publications are solely those of the individual author(s) and contributor(s) and not of MDPI and/or the editor(s). MDPI and/or the editor(s) disclaim responsibility for any injury to people or property resulting from any ideas, methods, instructions or products referred to in the content.

