Article

The Relationship Between Riparian Soil Nutrients and Water Quality in Inlet Sections of Lakes: A Case Study of the Kherlen River

1
Water Conservancy and Civil Engineering College, Inner Mongolia Agricultural University, Hohhot 010018, China
2
Inner Mongolia Water Resource Protection and Utilization Key Laboratory, Hohhot 010018, China
3
Hulunbuir Academy of Inland Lakes in Northern Cold and Arid Areas, Hulunbuir 021008, China
4
College of Ecology and Environment, Inner Mongolia University, Hohhot 010021, China
*
Author to whom correspondence should be addressed.
Sustainability 2025, 17(4), 1367; https://doi.org/10.3390/su17041367
Submission received: 8 January 2025 / Revised: 2 February 2025 / Accepted: 4 February 2025 / Published: 7 February 2025

Abstract

:
This study uses the Kherlen River as a case study to investigate the relationship between soil nutrients in riparian zones and water quality in inlet sections of lakes. Field sampling and experimental analyses were conducted during the high-water period (July) of 2023. An investigation was conducted on both the water quality of the river segments entering the lake and the soil nutrients. Methods such as the comprehensive water quality index (WQI), spatial heterogeneity analysis, and gray relational analysis were employed to assess water quality, soil nutrient characteristics, and their interrelationships, respectively. The results indicated that during the high-water period, the average concentrations of the permanganate index (CODMn), total nitrogen (TN), total phosphorus (TP), and dichromate oxidizability (CODCr) in the Kherlen River exceeded the Class V surface water quality standard thresholds. The overall WQI of the Kherlen River was 22.54, reflecting generally poor water quality, with a Global Moran’s I of 0.21, indicating a spatially clustered distribution. In the watershed, the Global Moran’s I values for pH values, TOC, TN, and TP at soil depths of 0–10 cm and 10–20 cm were 0.52, 0.90, 0.86, and 0.94 and 0.51, 0.57, 0.77, and 0.78, respectively. A significant positive correlation was found among soil nutrients, exhibiting a strong spatial aggregation characteristic, with nutrient concentrations decreasing with increasing soil depth. Moreover, the WQI of the Kherlen River demonstrated a significant correlation (R2 > 0.6) with soil nutrient indicators, underscoring the substantial impact of riparian soil nutrients on river water quality. Based on these findings, targeted water management and ecological restoration measures are proposed to improve the water quality of the Kherlen River and Hulun Lake, providing new insights and scientific evidence for the restoration and sustainable development of lake ecosystems.

1. Introduction

Rivers, as integral components of natural ecosystems, are essential in sustaining ecosystem equilibrium, facilitating the self-purification of water resources, regulating the climate, and mitigating flood risks [1]. However, the escalating threats posed by global warming and intensified anthropogenic activities have exacerbated the vulnerability of river ecosystems, primarily manifesting in the contraction of riverine areas, the deterioration of water quality, and the exacerbation of water pollution. These issues not only jeopardize ecological security but also disrupt human socioeconomic activities [2]. As a transitional interface between aquatic and terrestrial ecosystems, the riparian zone plays a pivotal role in conserving river biodiversity, filtering pollutants, and safeguarding water quality [3]. The soil within these riparian zones is a crucial ecological element, influencing both water quality and the broader ecological health of the riparian environment, thereby ensuring the resilience and integrity of the river ecosystem [4]. Over-urbanization and extensive agricultural activities contribute to the accumulation of sediment, nutrients, and chemicals in riparian zone soils and rivers, thereby degrading stream water quality and biodiversity [5]. Concurrently, climate change is expected to intensify these adverse effects through drought, global warming, and more frequent storm events [6]. Consequently, the monitoring and assessment of river water quality, riparian soil nutrient composition, and the exploration of the interactions between riparian soils and water quality have become focal points for both academic research and practical environmental management, particularly in the restoration of degraded lake ecosystems.
Hulun Lake, the fourth largest freshwater lake in China, is situated in the cold and arid region of northern China. It plays a critical role in preserving the biodiversity of the Hulun Buir grassland and enriching both animal and plant resources [7]. As one of the primary recharge sources of Hulun Lake, Kherlen River’s environment has deteriorated in recent years due to human activities and climate change, leading to river disconnection, declining water levels, and insufficient water supply, significantly impacting the evolution of the ecological environment of Hulun Lake. Numerous studies have been conducted on the water quality and eutrophication status of Hulun Lake in recent years. Wu et al. [8] posited that chemical oxygen demand (COD), total nitrogen (TN), and total phosphorus (TP) were the primary determinants of water quality in Hulun Lake. Ren et al. [9] identified TN and TP as the principal factors influencing the water quality of Hulun Lake.
As crucial components of a lake ecosystem, the quality and composition of riparian soils play a pivotal role in maintaining its balance and succession [10]. Elements such as nitrogen and phosphorus in the soil enter the aquatic system through rainfall, leaching, and runoff, becoming major contributors to nonpoint source pollution in the basin [11]. A study of riparian zones with varying conservation measures in Iowa found that riparian forest buffer strips, grass filter strips, and grazing strips provided significant benefits in mitigating riparian soil loss and associated total phosphorus loads in river soils [12]. Wang et al. [13] analyzed changes in groundwater dynamics and their influence on soil water and salinity under subsurface pipe salt discharge conditions in the Yinchuan area. Their study found that soil salinity and groundwater salinity exhibited synchronous fluctuations and an exponential relationship, with a corresponding model established. A study by Li et al. [14] showed that the regional distribution of soil total organic carbon (TOC), TN, and TP concentrations in the Yuanli River Basin, along the West Dongting Lake, varies, with soil organic carbon (SOC) concentrations differing at various sedimentary depths. The spatial heterogeneity of soil nutrients is a critical factor influencing the wetland ecosystem throughout the entire shoreline area. Zhu et al. [15] analyzed the water-level-fluctuating zone of Hulun Lake and its three main inflow rivers using an in situ soil column experiment method, elucidating the release dynamics of carbon, nitrogen, and phosphorus in the soil. By analyzing the spatial distribution of phosphorus in the soil, sediment, and water of Hulun Lake, Lu et al. [16] identified the sedimentary source of particulate phosphorus in the basin’s sediments. Currently, research on the water quality of Hulun Lake predominantly focuses on the influence of water environmental factors on its water quality, with limited studies addressing the comprehensive water quality index, the characteristics of riparian zone soil nutrients, and their interrelations. In comparison to traditional, singular water quality assessment methods, the combined analysis of both factors allows for a more systematic and comprehensive evaluation of the lake ecosystem’s status, providing a theoretical foundation for water pollution control in the Kherlen River Basin.
The diffusion of pollutants, particularly nitrogen and phosphorus, is the primary driving force behind water pollution [17]. Nutrients in the soil, particularly nitrogen and phosphorus, enter the lake via surface runoff and soil erosion, thereby increasing the nutrient load and contributing to eutrophication [18]. Analyzing and evaluating water quality and riparian soil nutrient monitoring data are crucial for further identifying regional water quality levels and their influencing factors. The comprehensive water quality index method provides a clear and efficient reflection of the basin’s overall status, enabling both qualitative and quantitative evaluation of water quality in the section. Spatial autocorrelation is employed to analyze spatial distribution patterns and dependence levels; however, its application in environmental studies remains limited, primarily focusing on air and soil pollution research [19]. Gray correlation analysis standardizes the data sequences and compares the correlations between each sequence and the reference sequence [20]. Based on these considerations, this study utilized measured data on water quality indicators and soil nutrients from the riparian zone of the Kherlen River during the high-water period (July) to uncover the characteristics and spatial variations in water quality factors in the river. The comprehensive water quality index method was employed to assess the water quality level of the Kherlen River. Additionally, spatial autocorrelation analysis was employed to characterize the results of water quality evaluation and the aggregation patterns of soil nutrients at both global and local scales, revealing the spatial distribution patterns and dependencies of water quality and soil nutrients in the Kherlen River Basin. The gray correlation method was employed to identify the primary driving factors of water quality changes from the perspective of soil nutrient content, aiming to provide a scientific basis and data support for managing water quality pollution and environmental issues in the Kherlen River and Hulun Lake, thereby offering valuable insights for policy formulation related to the water ecological environment in Hulun Lake.

2. Materials and Methods
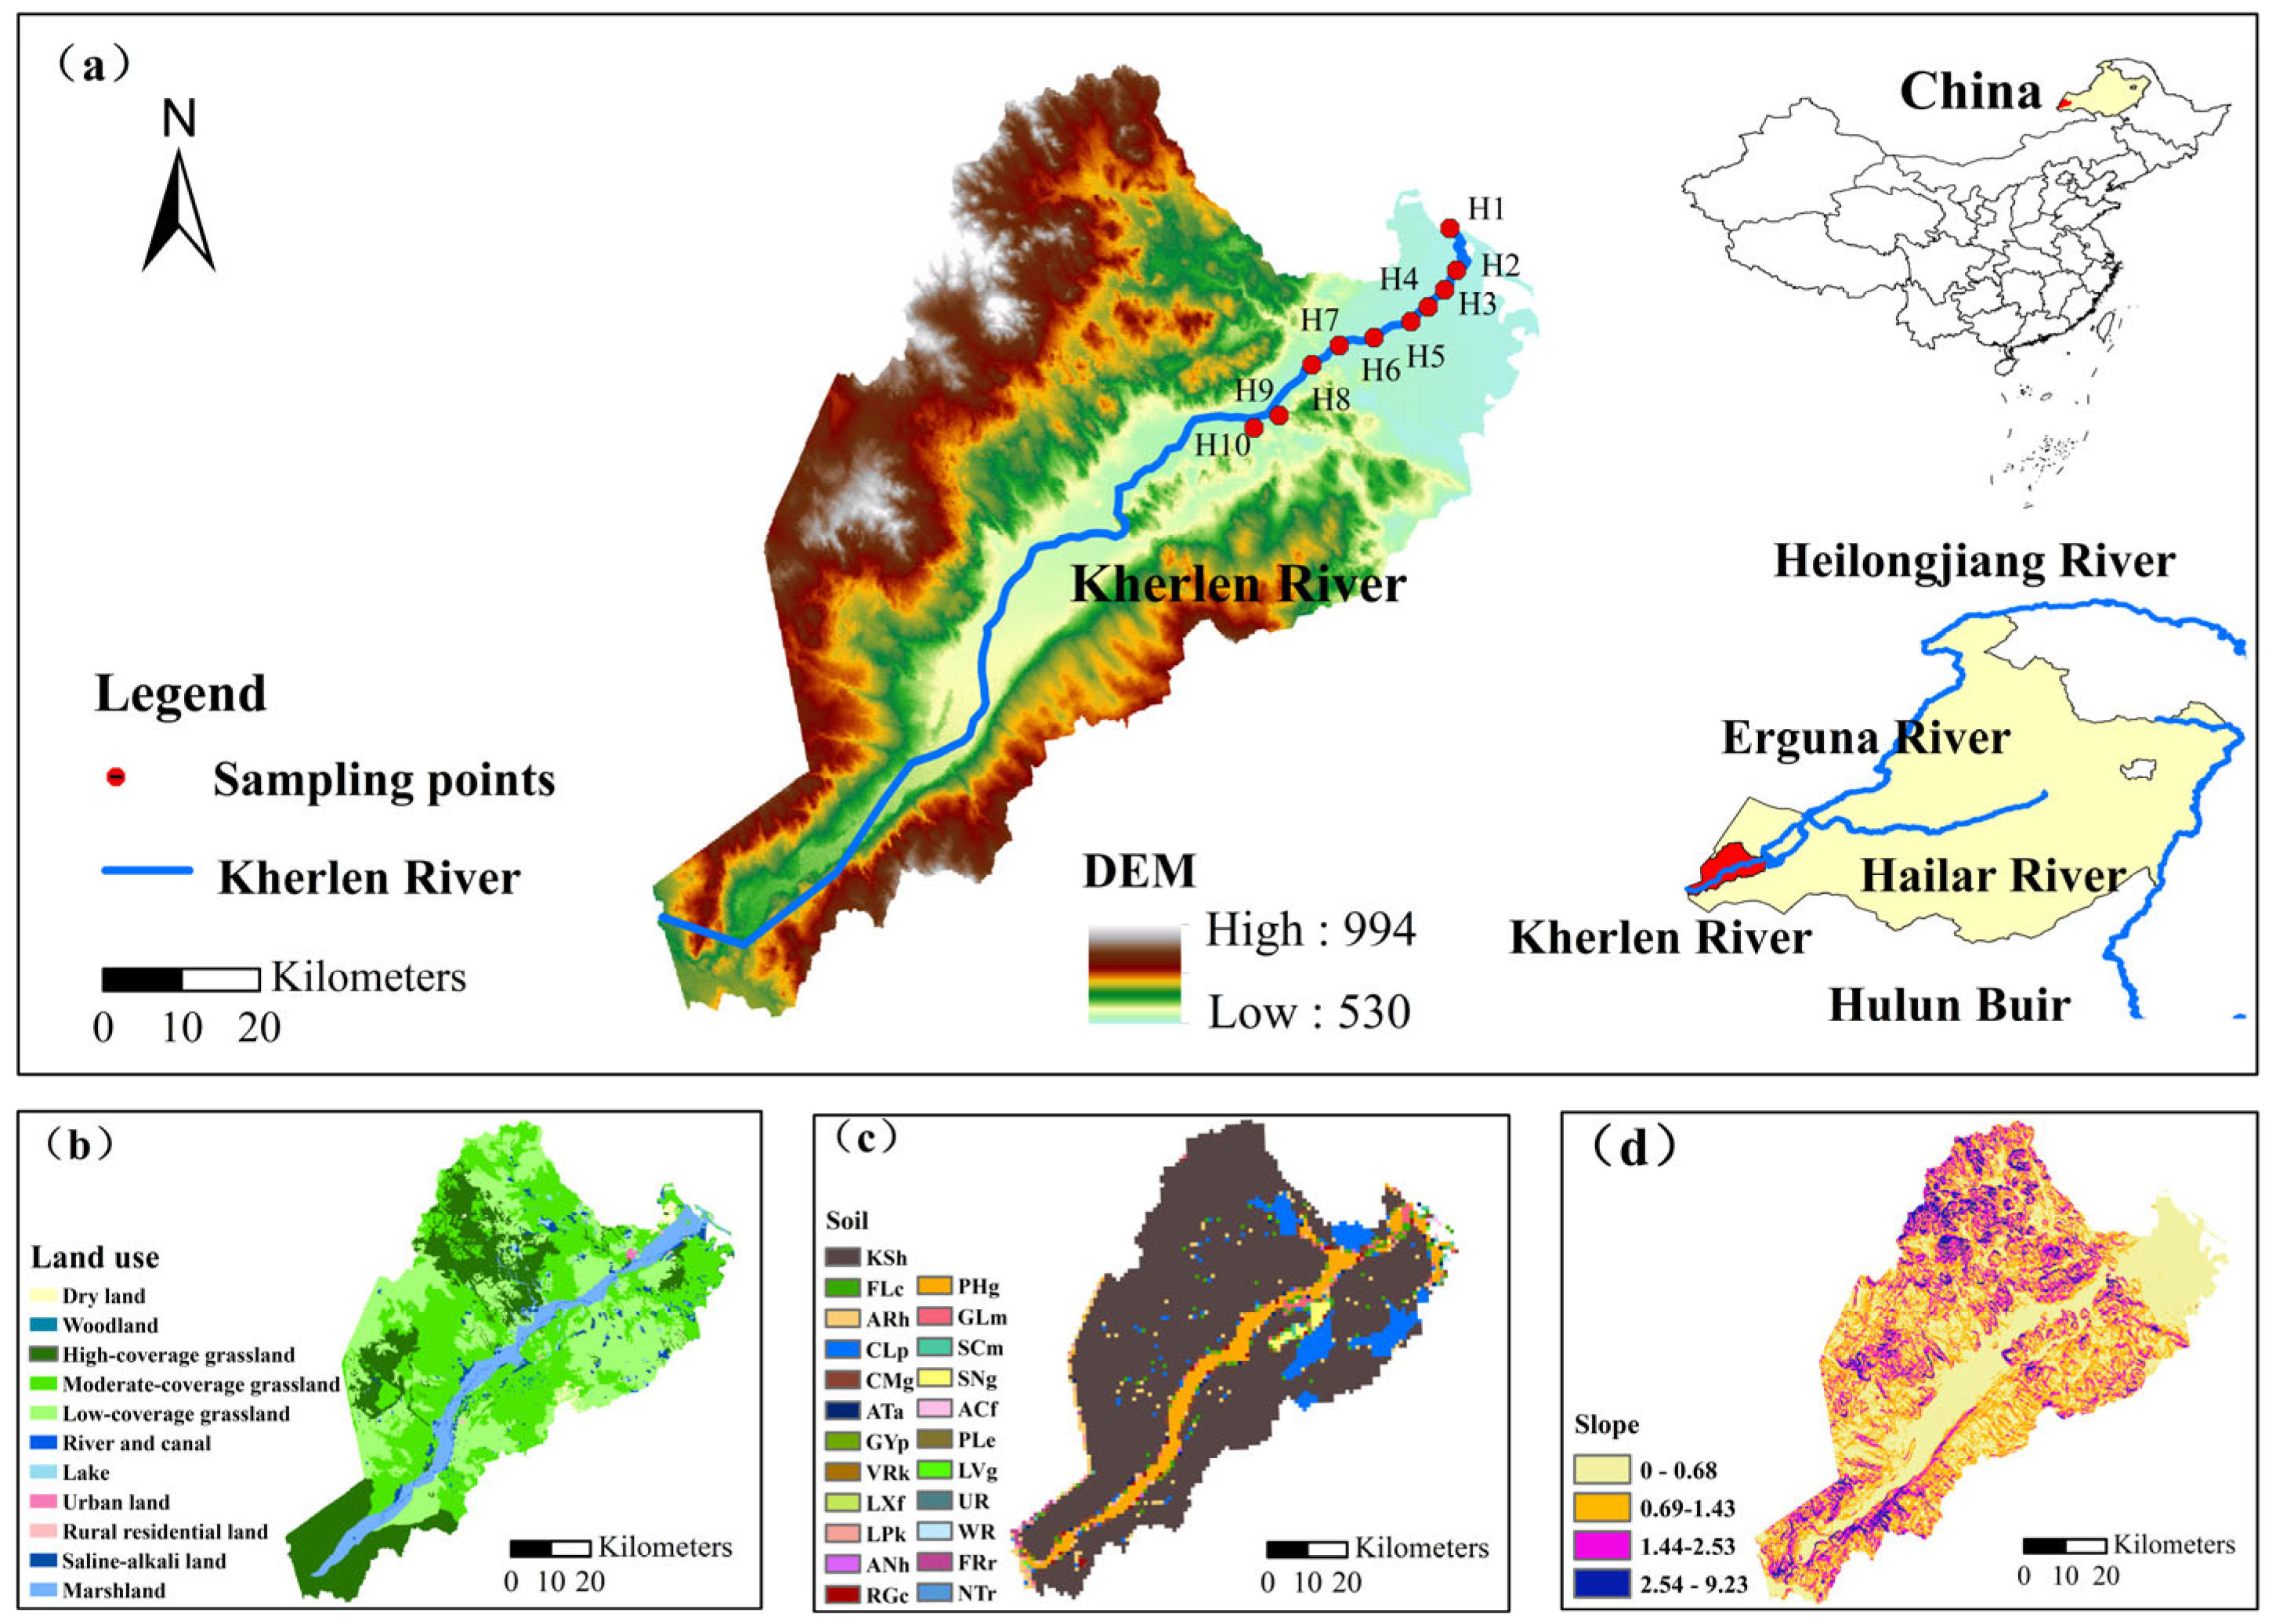
2.1. Study Area

The Kherlen River (107°25′~117°24′ E, 46°2′~49°40′ N) originates in the eastern foothills of the Kent Mountains in Mongolia. Flowing from west to east, it enters Hulun Lake in China via the New Barag Right Banner of the Hulun Buir League. It serves as one of the primary supply rivers for Hulun Lake. The Kherlen River spans a total length of 1264 km, with 206 km located in China, and its basin covers an area of approximately 7153 km2. The annual average temperature is approximately 0.5 °C, with an average annual precipitation of about 245 mm (primarily concentrated in July and August). The water depth is limited to 0.9 m during the dry season and 1.93 m during the wet season. The Kherlen River Basin is situated in the mid to high latitudes of Eurasia and is characterized by a typical temperate continental monsoon climate. The river is disconnected for much of the year, with water volume peaking in summer and autumn [21]. As a typical grassland river, the soil structure of the coastal meadow steppe is loose and infertile, primarily composed of sandy soils and sandy loams.

2.2. Sample Collection and Determination

In this study, a total of ten representative and evenly distributed sampling points were selected for two surveys and sample collections of water and soil from the Kherlen River into the lake during the high-water period (July) of 2023 (Figure 1). According to ‘the classification of land use status’, the land types were partially integrated and reclassified. The land use types in the basin were divided into six categories—cultivated land, forest land, grassland, water area, construction land, and unused land—accounting for 5.97%, 0.20%, 87.55%, 1.15%, 0.20%, and 10.29%, respectively. When the water level was stable, the sampling bottle was submerged to collect samples at a depth of 10–20 cm, with three replicate samples taken at each sampling point. The determination of water quality index data involved both field measurements and laboratory analyses. Water temperature (WT), pH values, salinity (Sal), oxidation reduction potential (ORP), and total dissolved solid (TDS) were monitored in situ in the field using a multi-parameter water quality detector (YSI). The remaining water quality indicators—total nitrogen (TN), total phosphorus (TP), ammonia nitrogen (NH4+-N), dichromate oxidizability (CODCr), permanganate index (CODMn), nitrate nitrogen (NO3-N), fluoride (F), and nitrite (NIT)—were measured in the laboratory following pretreatment. The measurement methods for the above indicators are outlined in the “Water and Wastewater Monitoring and Analysis Method”.
The soil sampling points follow a triangular line segment distribution method, with soil layers at depths of 0–10 cm and 10–20 cm sampled separately. Three samples were collected from each soil layer to ensure the reliability of the data. A total of 60 soil samples were collected, with the samples from each collection mixed to ensure they represent the soil characteristics of the corresponding area. The soil samples were placed in numbered self-sealing bags and transported to the laboratory. After the soil samples were dried, fine roots and impurities were removed, and the samples were ground and sieved. TN, TP, SOC, and pH values were subsequently measured [22].

2.3. The Water Quality Index (WQI)

The comprehensive water quality evaluation method was employed to assess water quality. The comprehensive water quality index (WQI) integrates various water quality parameters into a single evaluation index, providing a more simplified and efficient reflection of the basin’s overall condition, and it is particularly suitable for long-term basin-wide water quality assessments [23]. The calculation formula is as follows:
W Q I = i = 1 n C i P i i = 1 n P i
In the formula, n represents the total number of water quality parameters; ci is the standardized score of the water quality factor i, according to the “Surface Water Environmental Quality Standard”; and pi is the weight of the water quality factor i, with a minimum value of 1 and a maximum value of 4 [24]. The WQI value is determined by weighting the scores of each index. WQI values ranging from 0 to 100 are categorized into five grades [25]: poor (0 ≤ WQI ≤ 25), general (25 < WQI ≤ 50), moderate (50 < WQI ≤ 70), good (70 < WQI ≤ 90), and excellent (WQI > 90). In this study, TP, TN, CODMn, CODCr, and NH3-N were selected as the evaluation parameters to calculate the WQI value. The values for each parameter are presented in Table 1.

2.4. Spatial Autocorrelation Analysis

In this research, spatial autocorrelation analysis was employed to examine the aggregation characteristics of the WQI and the spatial distribution of soil nutrient indices within the 2 km buffer zone of the Kherlen River Basin. Spatial autocorrelation analysis is a spatial statistical method that reveals the characteristics of spatial elements and their interdependence and assesses the degree of aggregation or dispersion of attribute values across different geographical locations [26]. Currently, spatial autocorrelation analysis is widely applied in fields such as agriculture, geography, and environmental sciences, as it effectively captures the spatial heterogeneity and temporal variation in regional indicators [27]. The measure of spatial autocorrelation is Moran’s I, which includes both Global Moran’s I and Local Moran’s I [28].
  • Global Moran’s I is an index used to measure the degree of aggregation or dispersion of geographical elements within the entire study area. When I-G > 0, it indicates that the elements are positively correlated. When I-G < 0, it suggests a negative correlation between the elements. When I-G = 0, it indicates that the elements are not correlated in the spatial region, meaning they are randomly distributed across the space. The calculation formula is as follows:
    I g l o b a l = i = 1 n j = 1 n w i j x i x ¯ x j x ¯ s 2 i = 1 n j = 1 n w i j
    s 2 = 1 n i = 1 n x i x ¯ 2
In the formula, Iglobal represents the Global Moran’s I; n is the number of spatial units; xi and xj denote the attribute values of spatial units i and j; wij is the spatial weight matrix; and s2 represents the variance.
  • Local Moran’s I can further identify the local aggregation or dispersion characteristics of spatial elements and solve the problem of local spatial heterogeneity ignored by the Global Moran index, so as to more accurately determine the aggregation area of element distribution. When Il > 0, it shows that there is a positive spatial autocorrelation between the elements and the adjacent elements, that is, local spatial agglomeration. When Il < 0, it shows a negative spatial autocorrelation, that is, local spatial dispersion. The calculation formula is as follows:
    I l o c a l = x i x ¯ s 2 j = 1 n w i j x i x ¯ , i j
In the formula, Ilocal represents Local Moran’s I.

2.5. Gray Relation Analysis

Gray relation analysis is a statistical method used to assess the degree of correlation among multiple factors [29]. It is commonly employed to analyze multivariate sequence data, measure the relative influence of variables affected by other factors, and uncover their internal correlations [30]. The method is based on the standardized data sequence curve of each variable and evaluates the correlation degree by measuring the similarity between the comparison sequence and the reference sequence [31]. The value of the gray correlation degree ranges from 0 to 1. The closer the gray correlation degree is to 1, the stronger the correlation between the comparison and reference sequences. The closer the value is to 0, the weaker the correlation. Gray correlation analysis is a method used to determine the degree of correlation by assessing the relationships among various factors within the system. Its advantage lies in not requiring large volumes of data or strict distribution patterns for the data. Consequently, gray correlation analysis is extensively utilized in various research fields. The specific steps of the analysis method are as follows:
In the first step, the reference sequence and comparison sequence are identified. In this study, the WQI of the Kherlen River Basin in the high-water period of 2023 is used as the reference sequence, and the soil pH value and nutrient content are used as the comparison sequence:
X 0 = ( x 0 1 ,   x 0 2 ,     T , x 0 ( m ) )
X 1 X 2 X n = x 1 1 x 2 1 x n 1 x 1 2 x 2 2 x n 2 x 1 m x 2 m x n m
where n is the number of system characteristic behavior sequences and m is the number of indicators.
In the second step, the standardization and normalization of the raw data were carried out. Here, normalized calculation was used, and the formula is as follows:
y i j = x i j min 1 i m x i j max 1 i m x i j min 1 i m x i j
In the formula, xij represents the raw data of the j-th indicator for the i-th sample; yij is the normalized data of xij, with values ranging from [0, 1]; i denotes the number of evaluation indicators under each criterion, where i = 1, 2, 3, …, m; and j represents the number of elements under each criterion, where j = 1, 2, 3, …, n.
In the third step, the gray relational coefficient between the comparison sequence and the reference sequence is calculated:
m i n = m i n i m i n j y 0 k y j k
m a x = m a x i m a x j y 0 k y j k
ξ i j k = m i n + ρ m a x i j k + ρ m a x
In this formula, ∆min represents the minimum difference between the i-th variable sequence and the reference sequence; ∆max represents the maximum difference between the i-th variable sequence and the reference sequence; ξij(k) denotes the gray relational coefficient at the k-th point; and ρ is the distinguishing coefficient, set at 0.5.
In the fourth step, the average value of the gray relational coefficient sequence is obtained, and the gray relational degree for each indicator is computed, as follows:
R i j = 1 n k = 1 n ξ i j k
In this formula, n represents the number of data indicators.

2.6. Data Processing

The analysis of fundamental data was performed using Microsoft Excel 2021 and SPSS26.0. Spatial autocorrelation analysis of the WQI and soil nutrient indicators was conducted using Geodal 20. Additionally, Arcgis10.7 and Origin2021 were employed for data mapping and visualization of spatial distribution.

3. Results

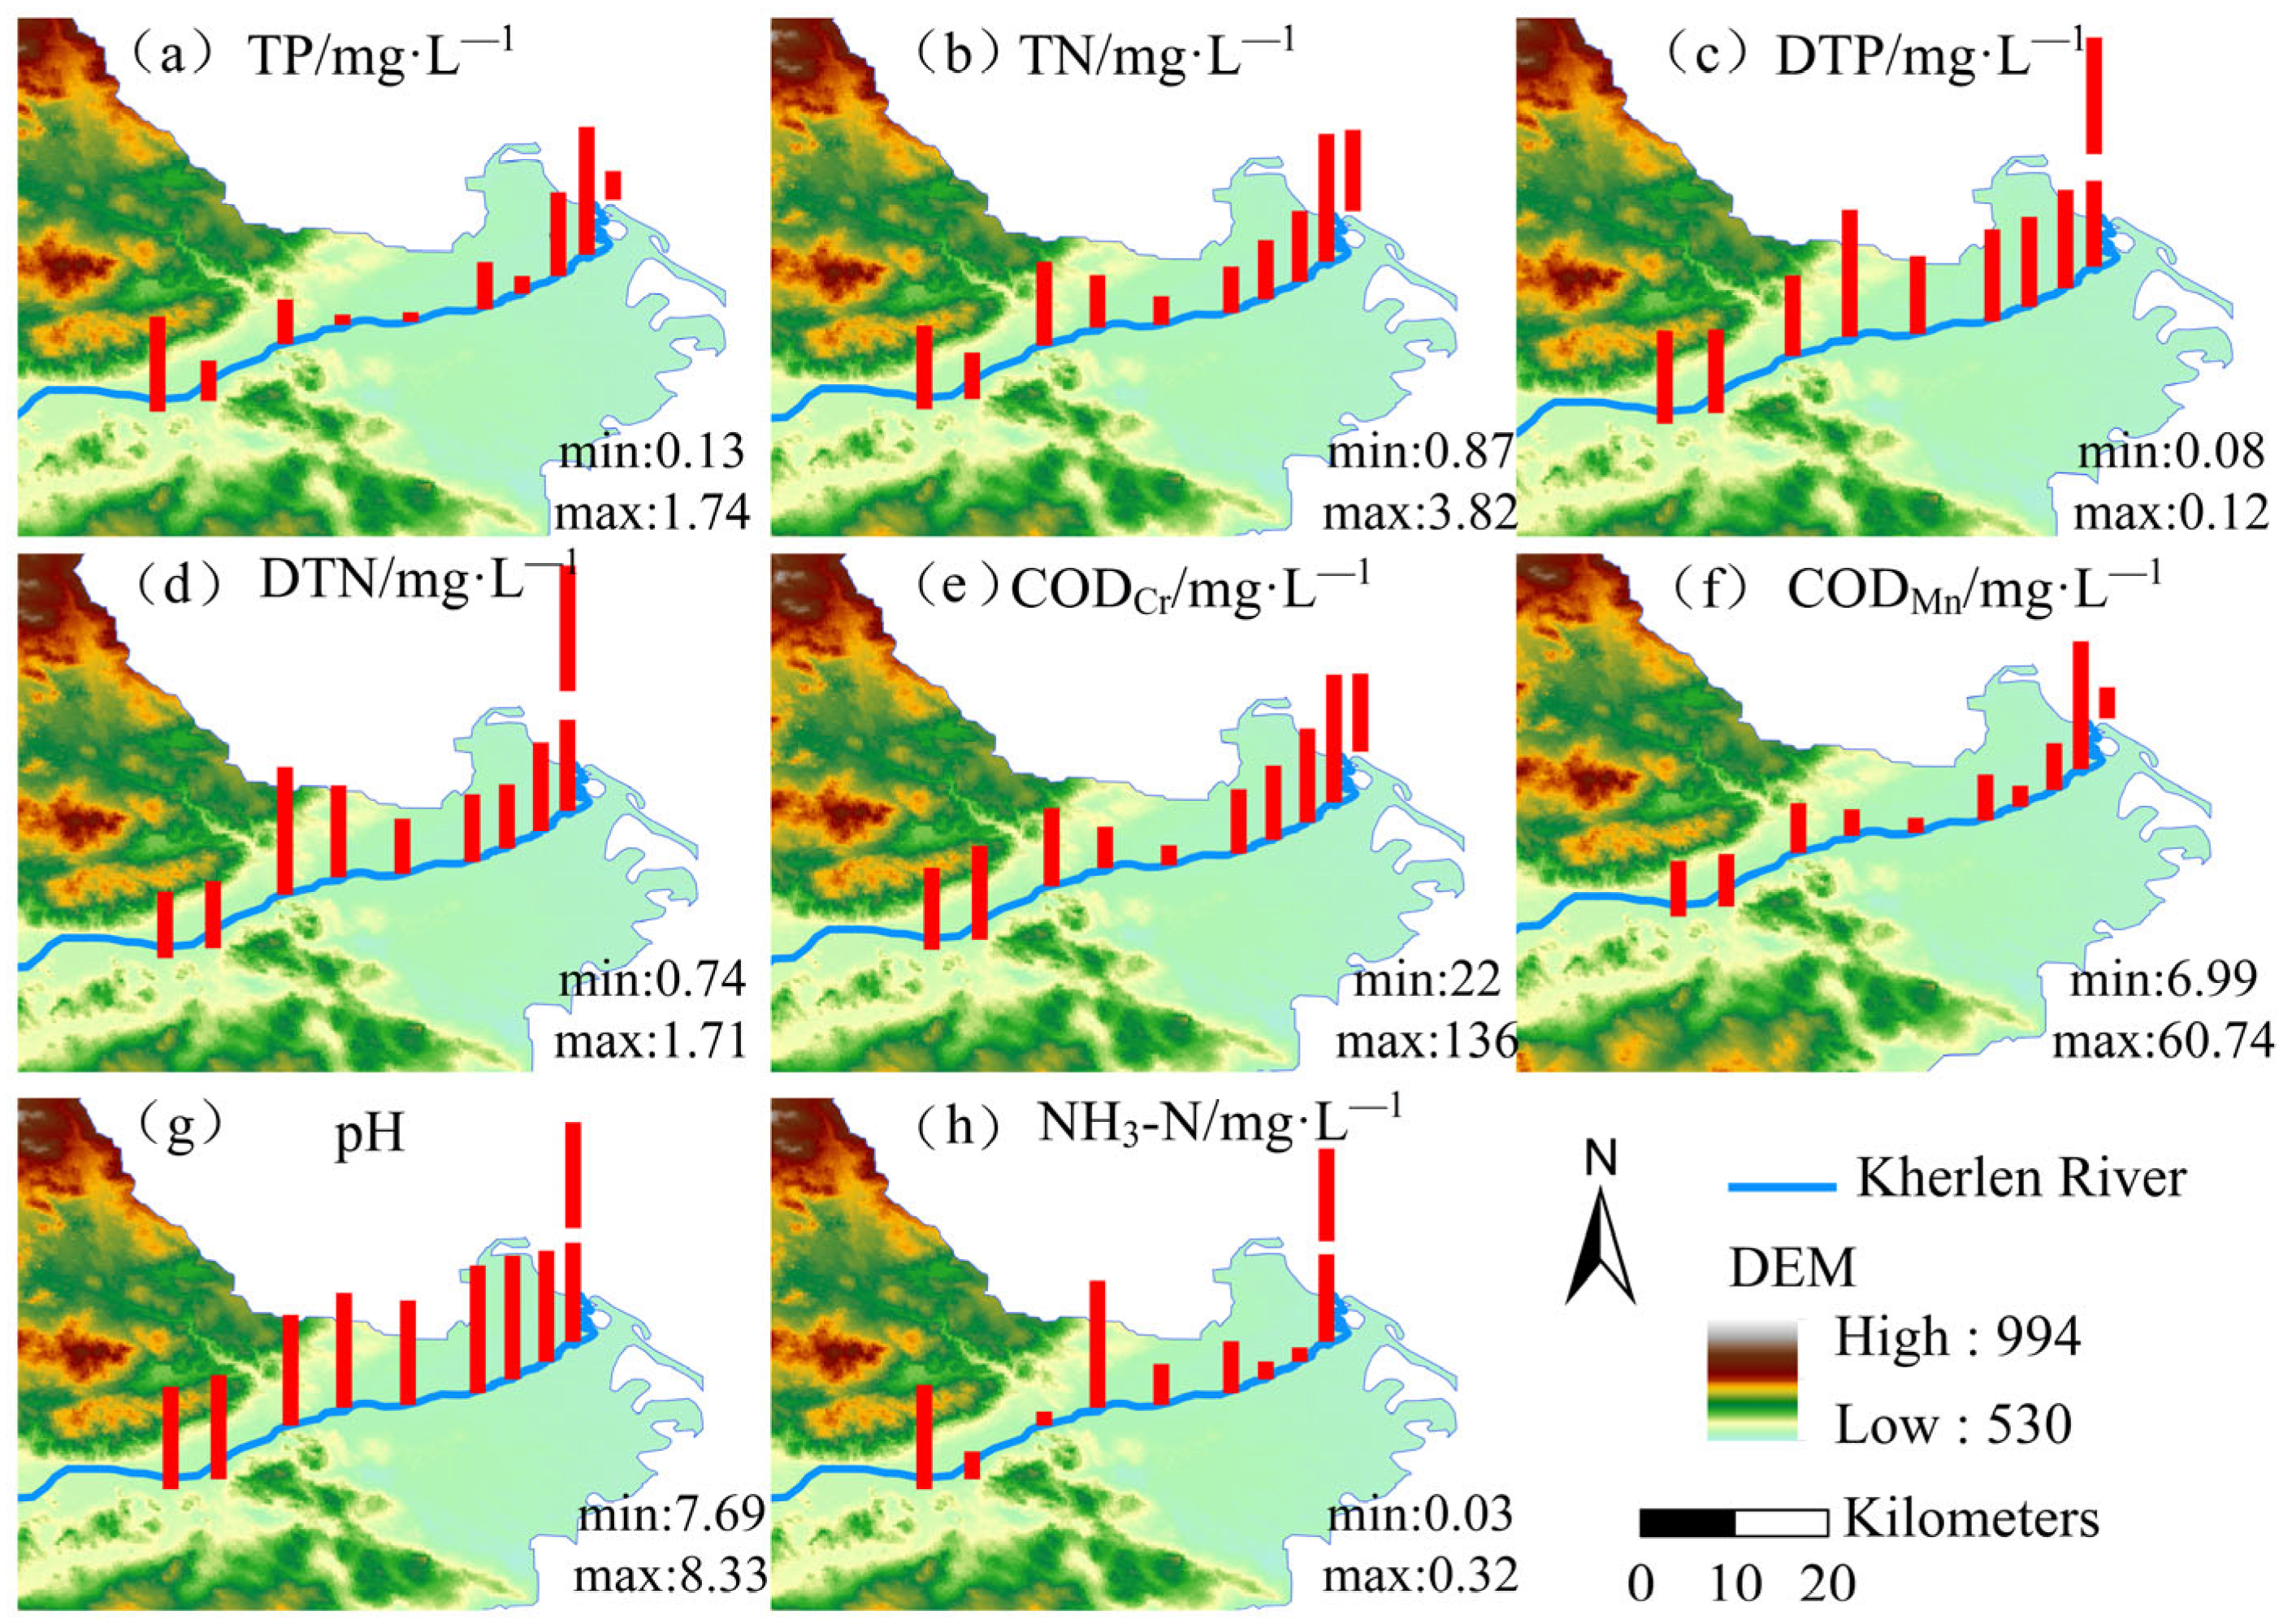
3.1. Characterization and Spatial Distribution of Water Quality Factors in Lake Inlet Reaches

Table 2 presents the average values and the measured ranges of water quality factors for the Kherlen River during the high-water period of 2023. The water quality is generally weakly alkaline. The average fluoride and ammonia nitrogen concentrations adhere to the national Class I standard, while the average concentrations of CODMn, TN, TP, and CODCr exceed the Class V surface water quality limits.
As shown in Figure 2, the pH values and DTP concentrations in the study area during the summer did not exhibit significant fluctuations. The TP concentration fluctuated significantly from H1 to H10, especially at points H2, H3, and H10, where concentrations were 4.33, 2.83, and 3.25 times higher, respectively, than the Class V water quality standard limit. The trends of TN and CODCr concentrations were similar, both showing an increase from H1 to H10, followed by a decrease and then another increase. Both parameters exceeded the limits significantly. The DIP concentration initially decreased, then increased, and finally decreased from H1 to H10, with the highest value of 1.71 mg·L⁻1 observed at point H8. The CODMn concentration showed a trend of initially decreasing and then increasing from H1 to H10, with the highest value of 60.74 mg·L⁻1 recorded at H2 near the river’s entrance to the lake, which is 4.05 times higher than the Class V water quality standard limit. The NH3-N concentration was generally low, showing a pattern of first decreasing, then increasing, followed by another decrease and an increase again, from the river’s entrance to the lake to points further away.

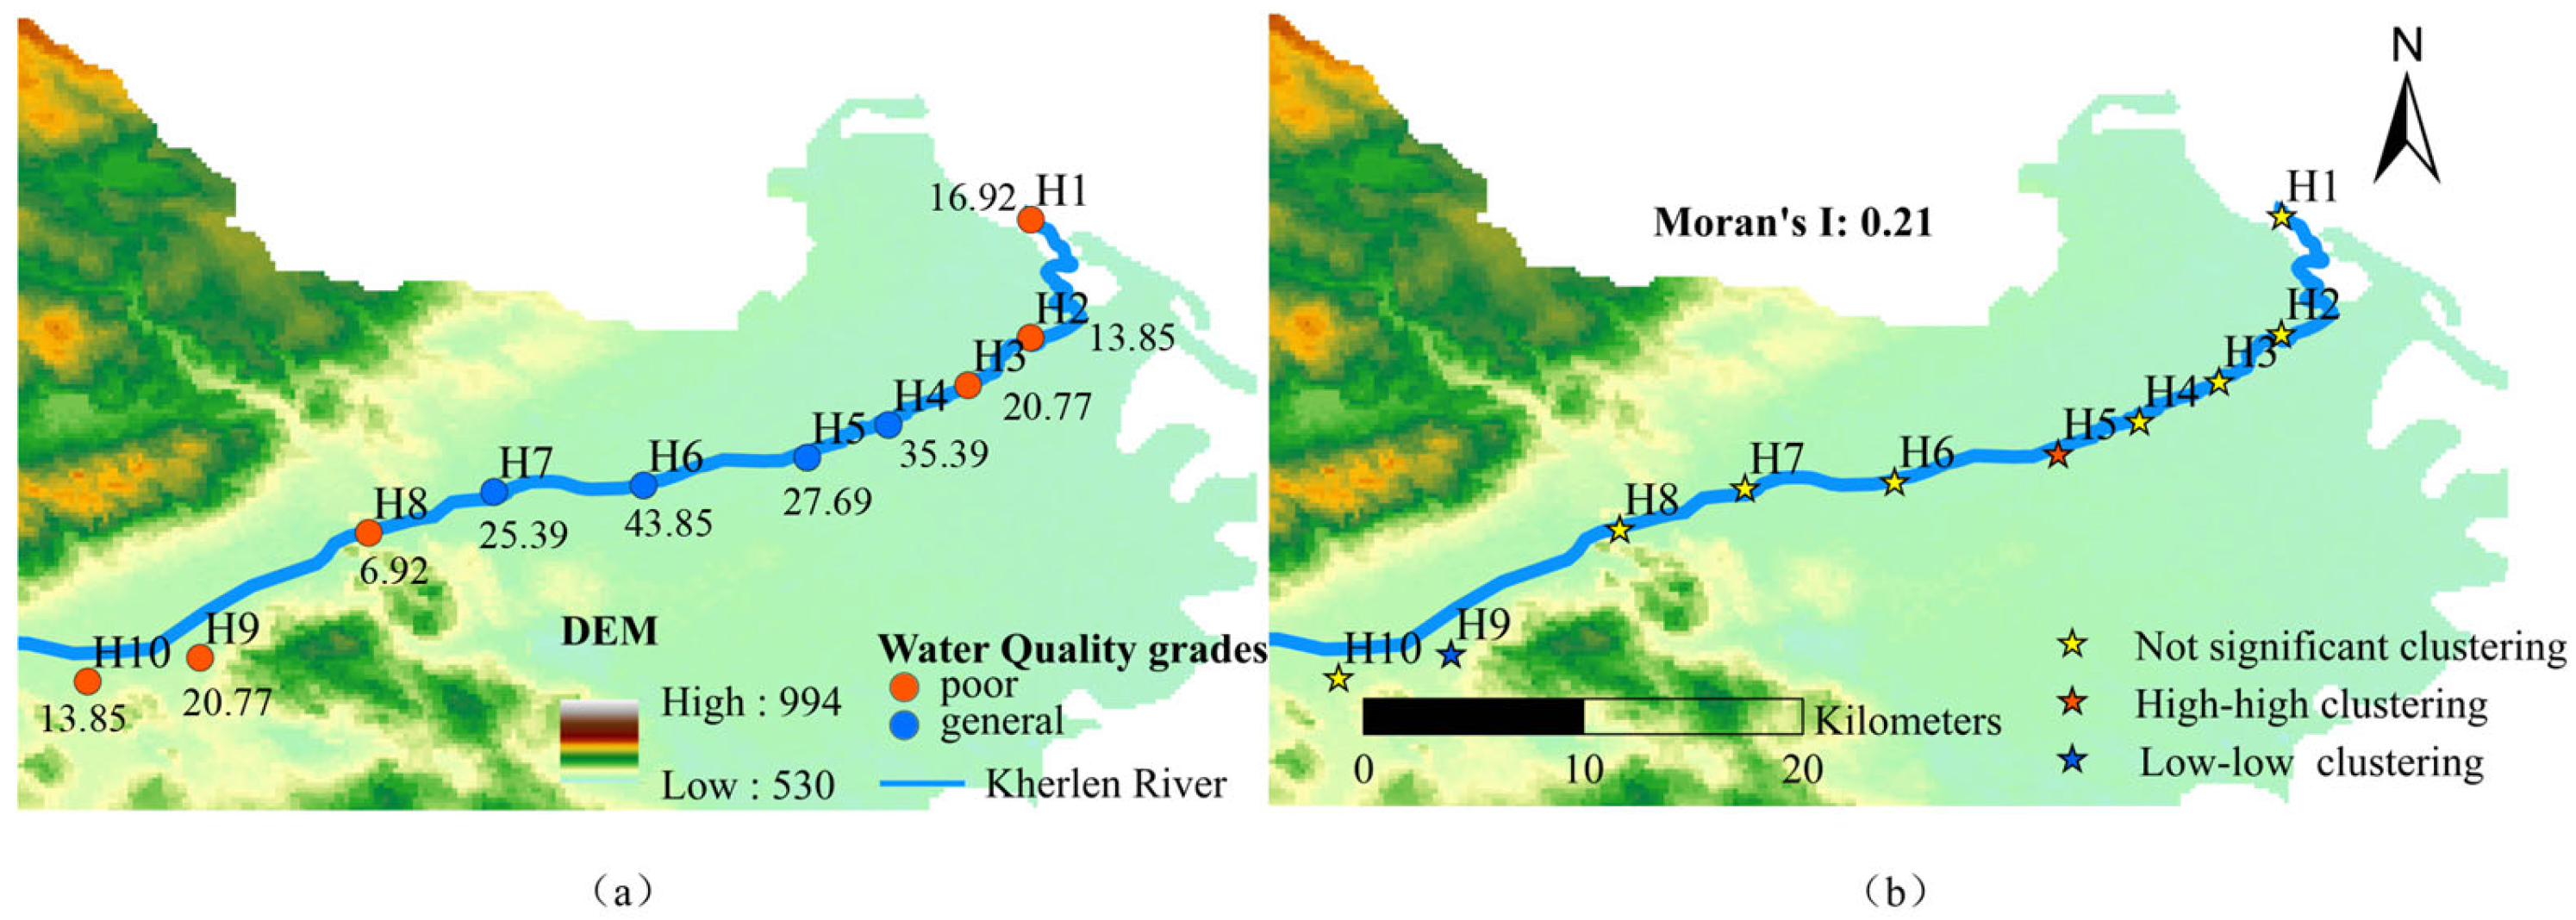
3.2. Spatial Characteristics of the WQI in the Inlet Reach

During the high-water period, the WQI values of the 10 monitoring points along the Kherlen River ranged from 6.92 to 43.85, with water quality grades of ‘poor’ and ‘general’, respectively. The overall average WQI was 22.54, classifying the water quality as ‘poor’. The spatial distribution of water quality grades and WQI values in the study area is depicted in Figure 3a. The water quality grades of monitoring points H1, H2, H3, H8, H9, and H10 were ‘poor’, while those of H4, H5, H6, and H7 in the central section were ‘general’. Notably, the WQI value at monitoring point H8 was the lowest, at 6.923, indicating poor water quality, and it was significantly lower than that of the other nine monitoring points. The WQI value at H6 was the highest, at 43.846. Overall, the water quality in the study area’s basin improved gradually from west to east but deteriorated near the lake entrance.
The global spatial autocorrelation analysis of the comprehensive water quality index measurements in the study area showed that the Global Moran’s I of the 10 sampling points in the Kherlen River was 0.21, indicating a positive spatial autocorrelation of the WQI. The WQI of each sample point tends to be spatially aggregated, indicating that the spatial structure of the comprehensive water quality level in the basin is well reflected at the sampling scale of this study.
To further assess the spatial aggregation of the comprehensive water quality level in the Kherlen River study area, local spatial autocorrelation analysis was employed to quantitatively examine this aggregation. The LISA aggregation distribution of the comprehensive water quality indices is shown in Figure 3b. In the high-water period of 2023, the comprehensive water quality index of the Kherlen River Basin was not significantly aggregated, and the spatial distribution of ‘high–high’ aggregation in the middle reaches of the test area was ‘high–high’. The high–high aggregation indicates that the region is a high-value aggregation area according to the comprehensive water quality index, indicating that the water quality in the region is better. In the upper reaches of the river, there is a ‘low–low’ aggregation spatial distribution, indicating that the area is a low-value aggregation area according to the comprehensive water quality index, and the water quality is biased.

3.3. Response of Riparian Soil Nutrients to Inlet Reaches of Lake

The soil nutrient elements in the Kherlen River Basin study area were analyzed and evaluated according to the grading evaluation table of various nutrient index contents [32]. In the 0–10 cm soil layer, the soil pH values in the basin ranged from 7.86 to 10.11, indicating weak alkalinity. The soil organic carbon (SOC) content ranged from 3.89 to 24.87 g/kg, with an average of 10.38 g/kg, corresponding to the fourth level, indicating a middle to lower range. The TN content ranged from 0.46 to 3.89 g/kg, with an average of 1.85 g/kg, corresponding to the second level, indicating a high range. The TP content ranged from 0.37 to 0.82 g/kg, with an average of 0.56 g/kg, corresponding to the fourth level, indicating a middle to lower range. In the 10–20 cm soil layer, the soil pH value in the watershed ranged from 8.28 to 9.97, indicating weak alkalinity. The SOC content ranged from 4.67 to 18.55 g/kg, with an average of 9.84 g/kg, corresponding to the fourth level, indicating a middle to lower range. The TN content ranged from 0.49 to 2.84 g/kg, with an average of 1.31 g/kg, corresponding to the third level, indicating an upper-middle range. The TP content ranged from 0.32 to 0.70 g/kg, with an average of 0.50 g/kg, corresponding to the fourth level, indicating a middle to lower range. The contents of SOC, TN, and TP in the 10–20 cm soil layer were slightly lower than those in the 0–10 cm soil layer. This indicates that the TN content in the meadow steppe satisfies the growth and development requirements of vegetation, while the TP and SOC contents are generally sufficient to support the daily growth needs of vegetation.
As shown in Figure 4, the overall fluctuation in soil pH within the study area is relatively small, with the highest value occurring at H5. In the 0–10 cm soil layer, the variation trends of TOC and TP contents were similar, both showing a decreasing trend from H1 to H10, while the TN content increased initially and then decreased from H1 to H10. In the 10–20 cm soil layer, the TOC content first decreased and then increased from H1 to H10. The trends in TN and TP contents were consistent: from H1 to H10, both increased initially, then decreased, and finally increased again, peaking at H10.
The spatial autocorrelation analysis of soil nutrient content in the study area revealed that the Global Moran’s I values for pH, TOC, TN, and TP in the 0–10 cm soil layer were 0.52, 0.90, 0.86, and 0.94, respectively. Similarly, in the 10–20 cm soil layer, the Global Moran’s I values for pH, TOC, TN, and TP were 0.51, 0.57, 0.77, and 0.78, respectively. All these values were positive, with most approaching 1, indicating a significant positive correlation and strong spatial aggregation between pH and nutrient elements in the soil. Furthermore, as soil depth increased, the Global Moran’s I values for the 2 km buffer zone of the Kherlen River Basin decreased, suggesting a slight reduction in the strength of spatial correlation. This indicates that while nutrient elements in the soil exhibited a significant positive spatial correlation, the spatial aggregation weakened as soil depth increased, and the differences in spatial distribution slightly increased.
As shown in Figure 5, the spatial aggregation primarily consists of high–high clustering, low–low clustering, and non-significant clustering, with non-significant clustering comprising the largest proportion. Notably, the distribution of high-value aggregation (high–high clustering) and low-value clustering (low–low clustering) was distinctly observable, suggesting a significant spatial correlation of nutrient elements in the soil. Specifically, in the 0–10 cm soil layer, pH and TN exhibited spatial distribution patterns with some similarity, as did TOC and TP. In the 10–20 cm soil layer, a similar spatial distribution pattern was observed between TN and TP.

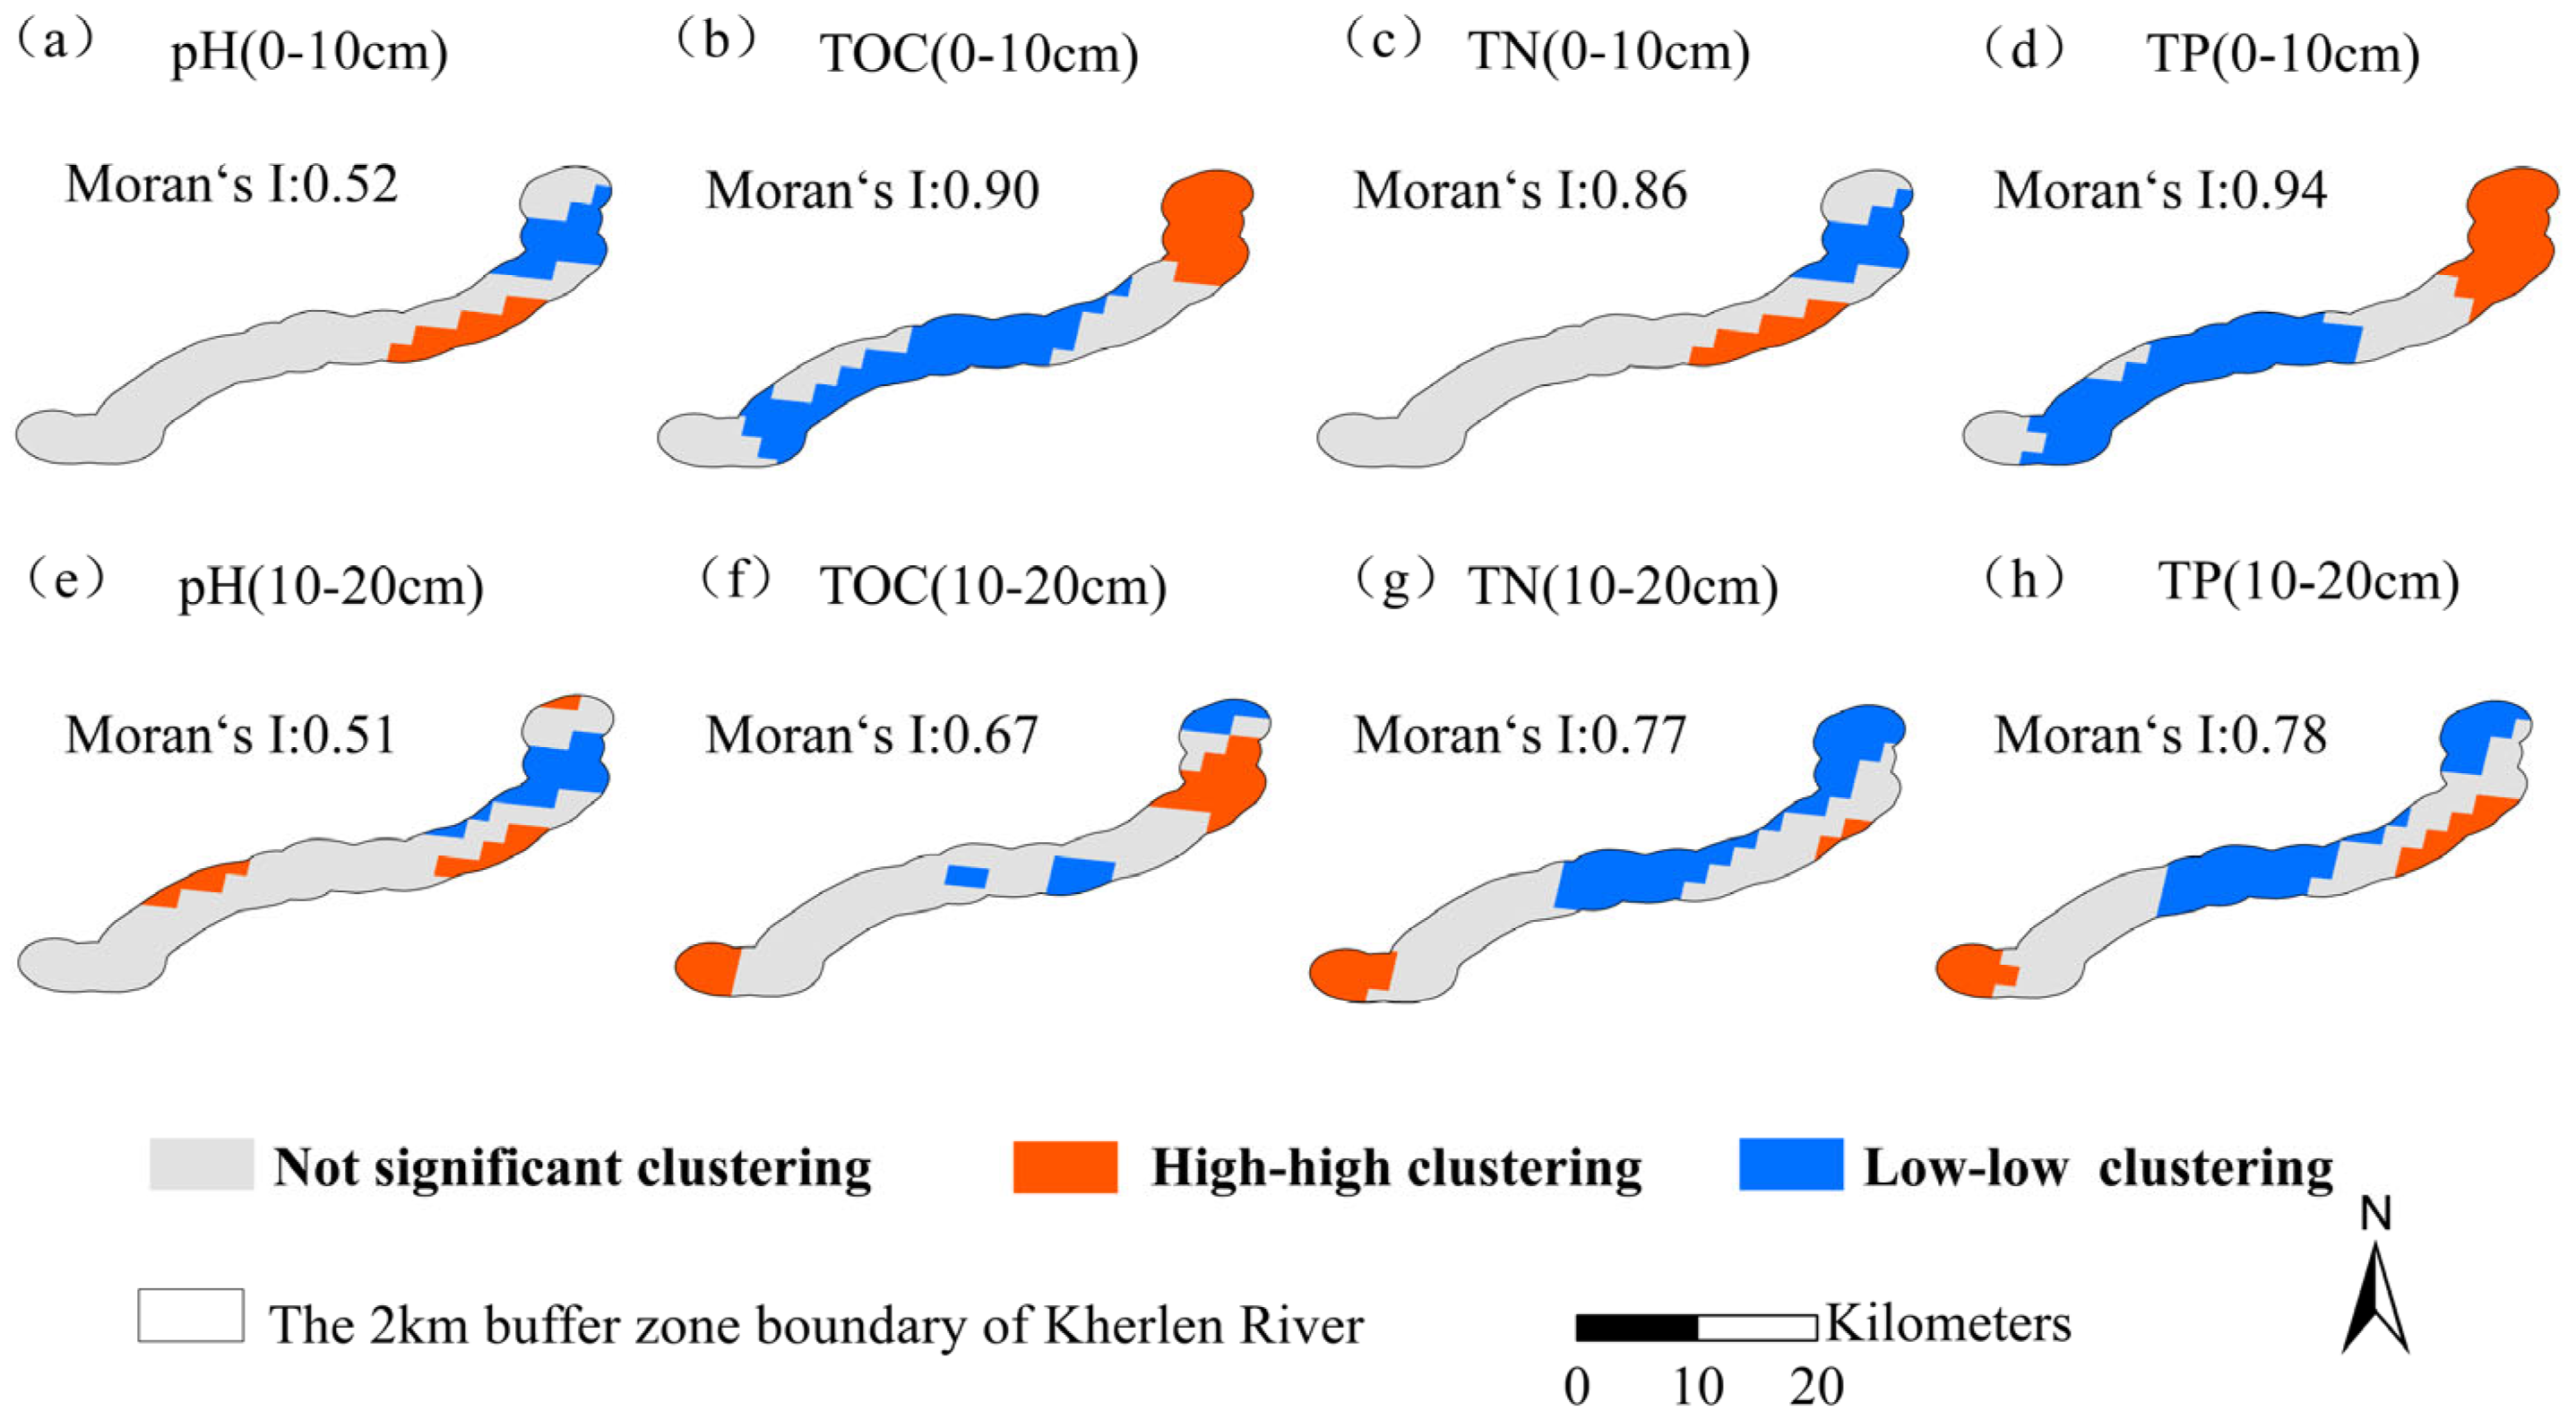
3.4. Soil Nutrient Content and Spatial Analysis in Riparian Zones

To further analyze the influence of soil nutrient indices and pH on the water quality in the basin, the WQI was used as a reference to examine the correlation between pH values, SOC, TN, TP, and the WQI at soil depths of 0–10 cm and 10–20 cm. The resolution coefficient was 0.5, and the gray correlation coefficient and degree between the WQI and soil pH values, as well as the nutrient indices at soil depths of 0–10 cm and 10–20 cm, were calculated using the gray correlation model (Figure 6). As shown in Figure 6, the gray correlation degree between the WQI and soil nutrient indices at depths of 0–10 cm and 10–20 cm during the wet season of the Kherlen River Basin exceeded 0.6, indicating a significant correlation between the WQI and soil nutrient indices in the basin. Based on the obtained correlation degrees, the eight evaluation items were ranked and analyzed. During the high-water period, the correlation degree between the WQI and pH in the 0–10 cm soil layer was the highest, at 0.75, followed by the correlation degree with pH values in the 10–20 cm soil layer, at 0.70. The gray correlation degree between soil TOC, TN, TP, and the WQI showed little variation, ranging from 0.60 to 0.63. In the 0–10 cm soil layer, TOC exhibited the highest correlation with the WQI, while in the 10–20 cm soil layer, TP demonstrated the highest correlation with the WQI.

4. Discussion

4.1. Main Environmental Variables Affecting the Spatial Distribution of Water Quality in the Inlet Section of the Lake

Spearman correlation analysis between the WQI and water quality factors revealed Spearman correlation coefficients of −0.59, −0.59, −0.74, −0.68, and −0.18 for CODMn, TP, TN, CODCr, and NH3-N, respectively. The WQI was significantly correlated with total nitrogen and chemical oxygen demand (p < 0.05), indicating that the WQI was primarily influenced by these two parameters. Specifically, CODCr and total nitrogen were the primary factors driving changes in water quality in the study area. The correlation between ammonia nitrogen content and the WQI is small, which indicates that ammonia nitrogen in the basin exhibits a small contribution to river water quality. This is because, in the high-water period, the flow rate of the river is large and increases, thus making the dilution effect of ammonia nitrogen in the water body more obvious. Higher water flow reduces the concentration of ammonia nitrogen, thereby reducing its negative impact on water quality.
The analysis reveals that the concentrations of TN, TP, CODMn, and CODCr in the Kherlen River study area exceed the Class V surface water quality standard of the national. This is linked to the development of animal husbandry in the Kherlen River Basin, where many herding families reside along the river. During the summer, concentrated grazing activities by herders result in livestock waste being deposited into the river, which threatens water quality [33]. Furthermore, the New Barag Right Banner and surrounding tourist areas exacerbate pollution in the Kherlen River. In the upper reaches of the river, several tanneries and nitrate mining operations are present. The harmful substances discharged, including ammonia nitrogen, pesticides, fluoride, arsenic, mercury, and phenols, as a consequence of these activities, have become key contributors to Kherlen River pollution [34]. Furthermore, the overall WQI of the Kherlen River study area is 22.54, indicating poor water quality. Since the river flows into Hulun Lake downstream, the water quality of the lake significantly affects the water quality at the river’s mouth. However, an assessment of eutrophication in Hulun Lake shows that, following a series of remediation efforts, the lake’s overall nutrient status index decreased from 61.84 in 2011 to 61.53 in 2020 [35], indicating a slight improvement in eutrophication. The water has experienced fluctuations from moderate to severe eutrophication and back to moderate eutrophication. This suggests that the long-standing eutrophication problem in Hulun Lake remains unresolved. Currently, the lake’s water still experiences a moderate level of eutrophication, with TN and TP being the main pollutants. The TP content exhibits significant variation from H1 to H10, with especially higher concentrations at H2, H3, and H10 compared to other sampling points. This is attributable to the TP values derived from the measured data at the sampling points in this study. Reference to the statistical yearbook of the New Barag Right Banner, in conjunction with field investigations, indicates that animal husbandry is concentrated at the downstream entrance of the lake. Consequently, the discharge of livestock manure into the river results in elevated TN and TP concentrations at the H2 and H3 sampling points. The upstream industrial park houses tanneries and nitrate factories, which discharge large volumes of sewage, thereby increasing pollutant concentrations at the H10 sampling point relative to others.

4.2. Main Environmental Variables Affecting the Spatial Distribution of Soil Nutrients

In the current research, the areas with high soil nutrient content were concentrated at the entrance of the lake, likely due to the continuous shrinkage of Hulun Lake and the associated increase in nutrient content from sediment deposition [36]. Additionally, the development of animal husbandry at the lake’s entrance has contributed to increased soil carbon and nitrogen content due to livestock excretion. The soil in the basin is weakly alkaline, with generally low carbon and nitrogen content but relatively high phosphorus levels. Studies have shown that the spatial distribution of soil nutrients is influenced by a variety of factors, including environmental conditions and vegetation growth. Climatic conditions exert a significant influence on the spatial distribution of soil nutrients. The study area is characterized by a temperate continental monsoon climate. The soil moisture content is relatively low, which may limit the leaching of soil nutrients. Phosphorus and potassium are prone to fixation and exhibit limited mobility, which restricts their release and migration within the soil [37]. This study was conducted during the summer, a period of vigorous plant growth, increased temperature, and heightened precipitation. These conditions led to an increase in the activity of soil microorganisms and a corresponding rise in the nutrient demand of plants and microorganisms, which ultimately resulted in a decrease in soil nutrient content, with the most significant reduction observed in TOC levels [38]. Pearson correlation analysis was performed to examine soil nutrient relationships. The results indicated a significant positive correlation between total phosphorus, total nitrogen, and TOC in the soil (p < 0.01), suggesting a potential coupling relationship among the three. The total nitrogen content in soil is influenced by the accumulation and decomposition of organic matter [39]. An increase in soil organic matter leads to elevated soil nitrogen levels. Under light grazing conditions, increased vegetation cover, species diversity, and litter accumulation promote the buildup of soil organic matter. However, due to the extensive grazing activities in the Kherlen River Basin, livestock disturbance impedes the accumulation of litter, thereby reducing organic matter content [40]. Given the minimal elevation variation among the sample points, the influence of topography on soil nutrient distribution was not considered in this study. In summary, the temporal and spatial variations in soil nutrients represent a complex ecological process influenced by a range of factors, including environmental conditions, vegetation growth, climate, human activities, and topography [41]. However, this study has some limitations. It did not fully account for the potential effects of latitude, longitude, and soil types on the spatial distribution of soil nutrients. These factors significantly influence the spatial distribution of soil nutrients. Future research will address these gaps and provide a deeper understanding of the factors influencing the spatial distribution of soil nutrients. Future research will address these gaps and provide a deeper understanding of the factors influencing the spatial distribution of soil nutrients, thus offering a stronger scientific foundation for the restoration, protection, and sustainable management of the Kherlen River Basin ecosystem.

4.3. Analysis of the Relationship Between the WQI in Lake Inlet Sections and Soil Nutrients in the Riparian Zone

In the present work, water quality was found to be poor in the upper reaches and near the lake entrance, while it was comparatively better in the middle section. Soil nutrient content was higher in the upper reaches and near the lake entrance, while it was lower in the middle section, suggesting a potential coupling between soil nutrients and water quality. The influence of soil on water quality is further examined in this subsection. The gray correlation coefficient between the WQI and soil nutrient indices at depths of 0–10 cm and 10–20 cm exceeds 0.6. This indicates a significant correlation between the WQI and soil nutrient indices in the Kherlen River, with soil TOC, TN, and TP playing an important role in determining lake water quality. After rainfall or irrigation, soil erosion will introduce nutrients, such as carbon, nitrogen, and phosphorus, as well as pollutants in the soil, into the river through surface runoff [42]. After the dissolved organic carbon in the soil enters the river, it will increase the organic matter content of the water body, affect the chemical oxygen demand (COD) and biochemical oxygen demand (BOD) of the river, and then affect the self-purification ability of the river [43]. At the same time, the dissolved carbon, nitrogen, and phosphorus in the soil can also enter the groundwater through underground seepage and eventually discharge into the river [44]. These substances not only increase the nutrient load of rivers but also may lead to an increase in water turbidity and affect the health of aquatic ecosystems. This is primarily attributed to inadequate drainage and sewage treatment facilities, as well as poor management, which result in the ineffective treatment of large quantities of nitrogen and phosphorus from domestic sewage and livestock and poultry excreta. Additionally, the excessive use of fertilizers and pesticides in agricultural lands has led to the accumulation of nitrogen and phosphorus [45]. These nutrients enter the water body through direct discharge, agricultural runoff, and rainfall-induced drainage. Rainfall erosion and soil leaching further exacerbate the loss of nitrogen and phosphorus, thereby increasing the nutrient load in the water body [46]. At the same time, groundwater may be polluted by industrial wastewater or pesticides and fertilizers, which in turn affects the water quality of nearby rivers and lakes. Nutrients (such as nitrogen and phosphorus) in groundwater can enter surface water through recharge and promote the eutrophication of surface water. Therefore, understanding the complex relationship between soil and water quality in riparian zones, adjusting nutrient content in soil, improving soil fertility, and formulating context-specific policies and measures can significantly contribute to soil improvement, lake ecosystem restoration, and sustainable development.
Research has indicated that [47] among the three main inflowing rivers of Hulun Lake, the water quality of the Kherlen River is the poorest, followed by the Ulson River, while the Hailar River exhibits relatively better water quality. The water quality in the upper reaches of all three rivers is relatively good, whereas the middle and lower reaches exhibit poorer water quality. Consequently, as the key objective of improving water quality, it is urgently necessary to take corresponding control measures at the entrance of the Kherlen River. First of all, the soil nutrient content is closely related to the WQI, indicating that the soil nutrient content in the riparian zone of the Kherlen River Basin during the wet season is the dominant factor of water pollution. In the future, attention should be paid to reducing the application of phosphate fertilizers and the direct discharge of domestic sewage and animal excrement into the river without treatment. At the same time, we should pay attention to source control; establish and improve ecological environment monitoring systems of lake basins; continuously monitor river water quality; adjust and improve the discharge standards of sewage and wastewater from industry, animal husbandry, and humans; and strictly enforce the prohibition of random discharge of sewage to ensure the safety and stability of the water environment in upstream areas. It is also necessary to strictly control the development of animal husbandry and adopt rotational grazing to reduce soil erosion. In addition, river water quality can be improved through ecological restoration measures, such as ecological dredging of lakes and restoration of riparian vegetation. Aquatic plants and benthic organisms can be used to absorb nitrogen, phosphorus, and other elements, thereby reducing the concentration of pollutants.

5. Conclusions

In the current investigation, the comprehensive water quality index analysis method, spatial autocorrelation analysis, and gray correlation method were employed to assess water quality status, riparian soil nutrient characteristics, and their interrelationships. The results revealed that in the high-water period, the water quality of the Kherlen River was generally poor, with an overall average WQI of 22.54, corresponding to a ‘poor’ water quality evaluation grade and exhibiting an aggregated spatial distribution. Water quality in the study area is influenced by various environmental factors, with TN and CODCr identified as the primary determinants. The TOC and TP contents in the basin soil are low, while the TN content is high. The soil nutrient index in the riparian zone exhibits a significant positive spatial correlation and decreases with increasing soil depth. In this study, it was shown that a significant correlation exists between the WQI and riparian soil nutrients. Soil TOC, TN, and TP significantly impact lake water quality in the high-water period. According to the results of this study, improving the water quality of the Kherlen River requires controlling pollutant discharges at the source, establishing a sound ecological monitoring system, enforcing strict effluent discharge standards, and controlling the development of animal husbandry. Ecological restoration measures, including the restoration of riparian vegetation and the introduction of aquatic organisms, should also be implemented to reduce the concentration of nutrients such as nitrogen and phosphorus.

Author Contributions

Y.Z., writing—original draft, software, visualization, and investigation. B.S. and X.S., conceptualization and funding acquisition. Y.T. and Z.W., resources and conceptualization. S.W. and B.Y., formal analysis, validation, project administration, and data curation. All authors have read and agreed to the published version of the manuscript.

Funding

This work was supported by the National Key Research and Development Program of China (2023YFC3206504); the National Natural Science Foundation of China (52369014, 52260028); and the Inner Mongolia Key R&D and Achievement Transformation Program Project (2023YFDZ0022).

Institutional Review Board Statement

Not applicable.

Informed Consent Statement

Not applicable.

Data Availability Statement

The data in this article cannot be shared due to privacy reasons.

Acknowledgments

The authors would like to thank all the reviewers who participated in the review of this manuscript.

Conflicts of Interest

The authors declare that they have no known competing financial interests or personal relationships that could have appeared to influence the work reported in this paper.

References

  1. Huang, J.; Zhang, Y.; Bing, H.; Peng, J.; Dong, F.; Gao, J.; Arhonditsis, G.B. Characterizing the river water quality in China: Recent progress and on-going challenges. Water Res. 2021, 201, 117309. [Google Scholar] [CrossRef] [PubMed]
  2. Chen, Y.; Guo, J.J.; Cai, G.; Ge, Y.; Liao, Y.; Dong, Z.; Fu, H. Evolution characteristics of submerged macrophyte community diversity in the middle and lower reaches of the Yangtze River in the past seventy years (1954–2021). Biodivers. Sci. 2024, 32, 23319. [Google Scholar] [CrossRef]
  3. Pandey, S.; Kumari, T.; Verma, P.; Singh, R.; Raghubanshi, A.S. Impact of anthropogenic stresses on riparian ecosystem and their management perspectives. Ecol. Significance River Ecosyst. 2022, 299–324. [Google Scholar] [CrossRef]
  4. Gumiero, B.; Mant, J.; Hein, T.; Elso, J.; Boz, B. Linking the restoration of rivers and riparian zones/wetlands in Europe: Sharing knowledge through case studies. Ecol. Eng. 2013, 56, 36–50. [Google Scholar] [CrossRef]
  5. Ghimire, S.R.; Corona, J.; Parmar, R.; Mahadwar, G.; Srinivasan, R.; Mendoza, K.; Johnston, J.M. Sensitivity of Riparian Buffer Designs to Climate Change—Nutrient and Sediment Loading to Streams: A Case Study in the Albemarle-Pamlico River Basins (USA) Using HAWQS. Sustainability 2021, 13, 12380. [Google Scholar] [CrossRef] [PubMed]
  6. Pachauri, R.K.; Allen, M.R.; Barros, V.R.; Broome, J.; Cramer, W.; Christ, R.; van Ypserle, J.P. Climate Change 2014: Synthesis Report; Contribution of Working Groups I, II and III to the Fifth Assessment Report of the Intergovernmental Panel on Climate Change; IPCC: Geneva, Switzerland, 2014. [Google Scholar]
  7. Song, W.; Yinglan, A.; Wang, Y.; Fang, Q.; Tang, R. Study on remote sensing inversion and temporal-spatial variation of Hulun lake water quality based on machine learning. J. Contam. Hydrol. 2024, 260, 104282. [Google Scholar] [CrossRef]
  8. Wu, R.; Zhang, S.; Liu, Y.; Shi, X.; Zhao, S.; Kang, X.; Li, G. Spatiotemporal variation in water quality and identification and quantification of areas sensitive to water quality in Hulun lake, China. Ecol. Indic. 2023, 149, 110176. [Google Scholar] [CrossRef]
  9. Ren, X.; Yu, R.; Liu, X.; Sun, H.; Geng, Y.; Qi, Z.; Xu, J. Spatial changes and driving factors of lake water quality in Inner Mongolia, China. J. Arid. Land 2023, 15, 164–179. [Google Scholar] [CrossRef]
  10. Luke, S.H.; Luckai, N.J.; Burke, J.M.; Prepas, E.E. Riparian areas in the Canadian boreal forest and linkages with water quality in streams. Environ. Rev. 2007, 15, 79–97. [Google Scholar] [CrossRef]
  11. Chang, D.; Lai, Z.Q.; Li, S.; Li, D.; Zhou, J. Critical ource areas’ identification for non-point source pollution related to nitrogen and phosphorus in an agricultural watershed based on SWAT model. Environ. Sci. Pollut. Res. 2021, 28, 47162–47181. [Google Scholar] [CrossRef]
  12. Tufekcioglu, M.; Zaimes, G.N.; Kahriman, A.; Schultz, R.C. The Relationship between Erosion and Precipitation and the Effects of Different Riparian Practices on Soil and Total-P Losses via Streambank Erosion in Small Streams in Iowa, USA. Sustainability 2024, 16, 8329. [Google Scholar] [CrossRef]
  13. Wang, X.; Shen, J.L.; Fan, L.; Cai, j. Analysis of the Relationship Between Groundwater Dynamics and Changes in Water and Salt in Soil Under Subsurface Pipe Salt Drainage Technology. Water 2024, 16, 3597. [Google Scholar] [CrossRef]
  14. Li, J.Y.; Wu, Y.M.; Peng, D.; Chen, M.; Peng, L.; Middleton, B.A.; Lei, T. Spatial Differences in Soil Nutrients Along a Hydrographic Gradient on Floodplains in Dongting Lake. Water 2024, 16, 3674. [Google Scholar] [CrossRef]
  15. Zhu, N.; Xu, Y.; Wang, X.L.; Feng, A.P.; Huang, L. Simulated Study on Carbon, Nitrogen and Phosphorus Release from the Soils of Water-level-fluctuating Zone in Hulun Lake. Environ. Sci. Technol. 2021, 44, 108–114. (In Chinese) [Google Scholar]
  16. Lu, X.F.; Guo, Y.N.; Wang, G.X.; Jiang, X.; Wang, K. Distribution characteristics of various forms of phosphorus and the traceability of phosphorus in particulate form in Hulun Lake basin. China Environ. Sci. 2023, 43, 4810–4818. (In Chinese) [Google Scholar]
  17. Beusen, A.H.W.; Bouwman, A.F.; Van Beek, L.P.; Mogollón, J.M.; Middelburg, J.J. Global riverine N and P transport to ocean increased during the 20th century despite increased retention along the aquatic continuum. Biogeosciences 2016, 13, 2441–2451. [Google Scholar] [CrossRef]
  18. Zimnicki, T.; Boring, T.; Evenson, G.; Karlen, D.L.; Wilson, R.S.; Zhang, Y.; Blesh, J. On quantifying water quality benefits of healthy soils. BioScience 2020, 70, 343–352. [Google Scholar] [CrossRef]
  19. Li, L.; Liu, X.; Ge, J.; Chu, X.; Wang, J. Regional differences in spatial spillover and hysteresis effects: A theoretical and empirical study of environmental regulations on haze pollution in China. J. Clean. Prod. 2019, 230, 1096–1110. [Google Scholar] [CrossRef]
  20. Zhang, X.D.; Cui, J.L.; Xiong, Y.; Zhang, L.Y. Study on the distribution and key influencing factors of Huangtai algae of Ulansuhai Lake. J. Environ. Eng. Technol. 2024, 14, 879–888. (In Chinese) [Google Scholar]
  21. Yang, W.H.; Chen, A.H.; Li, W.P.; Yu, L.H.; Yin, Z.Y.; Han, P.J.; Duan, H.J. Water quality assessment of Kherlen River and impact analysis of the water environment of Hulun Lake. Environ. Monit. Assess. 2015, 33, 113–116. (In Chinese) [Google Scholar]
  22. Avery, B.W.; Bascomb, C.L. Soil Survey Laboratory Methods; Digital Library: Paris, France, 1974; No. 6 revised 1987; p. 83. [Google Scholar]
  23. Wu, Z.S.; Wang, X.L.; Chen, Y.W.; Cai, Y.; Deng, J. Assessing river water quality using water quality index in Lake Taihu Basin, China. Sci. Total Environ. 2018, 612, 914–922. [Google Scholar] [CrossRef] [PubMed]
  24. Pesce, S.F.; Wunderlin, D.A. Use of water quality indices to verify the impact of Córdoba City (Argentina) on Suquía River. Water Res. 2000, 34, 2915–2926. [Google Scholar] [CrossRef]
  25. Sun, W.; Xia, C.Y.; Xu, M.Y.; Guo, J.; Sun, G. Application of modified water quality indices as indicators to assess the spatial and temporal trends of water quality in the Dongjiang River. Ecol. Indic. 2016, 66, 306–312. [Google Scholar] [CrossRef]
  26. Jiao, S.; Li, X.; Yu, J.; Lyu, M.; Zhang, K.; Li, Y.; Shi, P. Multi-Scale Analysis of Surface Building Density and Land Subsidence Using a Combination of Wavelet Transform and Spatial Autocorrelation in the Plains of Beijing. Sustainability 2024, 16, 2801. [Google Scholar] [CrossRef]
  27. Ding, Y.; Zhao, J.Y.; Zhang, J.; Fu, Y.C.; Peng, W.Q.; Chen, Q.C.; Li, Y.Y. Spatial differences in water quality and spatial autocorrelation analysis of eutrophication in Songhua lake. Environ. Sci. 2021, 42, 2232–2239. (In Chinese) [Google Scholar]
  28. Chen, Y. Spatial autocorrelation equation based on Moran’s index. Sci. Rep. 2023, 13, 19296. [Google Scholar] [CrossRef] [PubMed]
  29. Li, H.X.; Han, L.H.; Wei, Q.; Wang, Y.P.; Duan, L.; Xu, L. Assessment on river water ecological health based on gray relation analysis in Liaohe Conservation Area. J. Environ. Eng. Technol. 2020, 10, 553–561. (In Chinese) [Google Scholar]
  30. Tian, X.; Wang, Z.; Taalab, E.; Zhang, B.; Li, X.; Wang, J.; Ong, M.C.; Zhu, Z. Water Quality Predictions Based on Gray Relation Analysis Enhanced LSTM Algorithms. Water 2022, 14, 3851. [Google Scholar] [CrossRef]
  31. Yu, Y.Q.; Yu, Y.F.; Peng, L.L.; Yuan, T.T.; Huang, H.; Qiu, T.; Shen, J.J. Evaluation and its differentiation analysis of the coupling coordination relation of agricultural ecology and economy system in the yangtze river basin. Chin. J. Agric. Resour. Reg. Plan. 2022, 43, 235–247. [Google Scholar]
  32. Chang, S. Soil Physicochemical Characteristics and Comprehensive Evaluation of Xilingol Grassland; Inner Mongolia Normal University: Hohhot, China, 2022. (In Chinese) [Google Scholar]
  33. Li, Y.; Wang, M.; Chen, X.; Cui, S.; Hofstra, N.; Kroeze, C.; Strokal, M. Multi-pollutant assessment of river pollution from livestock production worldwide. Water Res. 2022, 209, 117906. [Google Scholar] [CrossRef] [PubMed]
  34. Han, X.H.; Yang, C. An analysis of the self-purification function of Hulun Lake and its effect on regional environmental conservation. J. Nat. Resour. 2002, 06, 684–690. (In Chinese) [Google Scholar]
  35. Yu, H.F.; Shi, X.H.; Sun, B.; Zhao, S.N.; Liu, Y.; Zhao, M.L. Analysis of water quality and eutrophication changes in Hulun Lake from 2011 to 2020. Arid. Zone Res. 2021, 38, 1534–1545. (In Chinese) [Google Scholar]
  36. Zhang, L.; Zhang, S.; Sun, B.; Zhao, S.N.; Tian, Y.; Zhao, S.X. Analysis of variation factors of Hulun lake area by using water balance method. J. Water Resour. Water Eng. 2016, 27, 80–85. (In Chinese) [Google Scholar]
  37. Gerke, J. Improving Phosphate Acquisition from Soil via Higher Plants While Approaching Peak Phosphorus Worldwide: A Critical Review of Current Concepts and Misconceptions. Plants 2024, 13, 3478. [Google Scholar] [CrossRef]
  38. Jaman, M.S.; Yu, Q.; Xu, C.; Jamil, M.; Ke, Y.; Yang, T.; Wu, H. Chronic drought decreased organic carbon content in topsoil greater than intense drought across grasslands in Northern China. Geoderma 2024, 443, 116832. [Google Scholar] [CrossRef]
  39. Tang, B.; Rocci, K.S.; Lehmann, A.; Rillig, M.C. Nitrogen increases soil organic carbon accrual and alters its functionality. Glob. Change Biol. 2023, 29, 1971–1983. [Google Scholar] [CrossRef]
  40. Su, H.H.; Zang, Z.H.; She, Y.D.; Ma, L.; Mao, X.F.; JIA, S.B.; Ma, Z.; Zhou, H.K.; Huang, X.T. Effects of different managements on soil nutrients in alpine grassland in the Qinghai Lake basin. Acta Agrestia Sin. 2022, 30, 1071–1076. [Google Scholar]
  41. Guo, B.X.; Zhou, J.; Zhan, L.Q.; Wang, Z.Y.; Wu, W.; Liu, H.B. Spatial and Temporal Variability of Soil pH, Organic Matter and Available Nutrients (N, P and K) in Southwestern China. Agronomy 2024, 14, 1796. [Google Scholar] [CrossRef]
  42. Hou, W.; Wang, H.; Meng, H.; Ning, Y.; Zhao, H.; Cui, X. Nonpoint source pollution and its relationship with soil organic carbon, nitrogen and phosphorus of the riparian zone in the Sunxi river watershed. Res. Soil Water Conserv. 2024, 31, 117–125. (In Chinese) [Google Scholar]
  43. Sun, S.; Liu, X.; Zhu, X.; Duan, X.; Han, H. Research progress on migration and leaching law of dissolved organic carbon and nitrogen in farmland. J. Shanxi Agric. Sci. 2022, 50, 1158–1167. (In Chinese) [Google Scholar]
  44. Zhou, H.; Wu, B.; Chen, P.; Jian, Y.; Deng, J.; Song, C.; Yang, Y.; Wang, G.; Sun, S. Characteristics of soil carbon and nitrogen leaching and transport on slopes under hydraulic erosion. Chin. J. Agrometeorol. 2024, 45, 943–952. (In Chinese) [Google Scholar]
  45. Liu, L.; Zheng, X.; Wei, X.; Kai, Z.; Xu, Y. Excessive application of chemical fertilizer and organophosphorus pesticides induced total phosphorus loss from planting causing surface water eutrophication. Sci. Rep. 2021, 11, 23015. [Google Scholar] [CrossRef]
  46. Li, M.; Liu, J.; Wang, J.; Song, Z.; Bouwman, A.F.; Ran, X. Phosphorus depletion is exacerbated by increasing nitrogen loading in the Bohai sea. Environ. Pollut. 2024, 352, 124119. [Google Scholar] [CrossRef]
  47. Liu, Z.X. Spatial and Temporal Characteristics of Phytoplankton Functional Groups and Relationship with Water Environment Factors in the Main Rivers of Hulun; Northeast Forestry University: Harbin, China, 2023. (In Chinese) [Google Scholar]
Figure 1. (a) Map of sampling points in Kherlen River Basin; (b) land use map of Kherlen River Basin; (c) soil type map of Kherlen River Basin; (d) slope map of Kherlen River Basin.
Sustainability 17 01367 g001
Figure 2. Spatial distribution of water quality factors in monitoring points of Kherlen River Basin. (The histogram represents different water quality index values).
Sustainability 17 01367 g002
Figure 3. (a) Spatial distribution of water quality grades in the Kherlen River Basin. (The values in the figure indicate the WQI values for each point.) (b) LISA aggregation distribution of comprehensive water quality indices.
Sustainability 17 01367 g003
Figure 4. Spatial distribution of soil nutrient contents at different depths.
Sustainability 17 01367 g004
Figure 5. The LISA aggregation distribution of soil nutrients in the 2 km buffer zone of the Kherlen River.
Sustainability 17 01367 g005
Figure 6. (a) The gray correlation coefficient box plot between different WQI and soil nutrient indices. (b) The gray correlation degree plot between different WQI and soil nutrient indices.
Sustainability 17 01367 g006
Table 1. The scores and weights of water quality factors in the WQI method.
Weight1009080706050403020100
TP1<0.01<0.02<0.05<0.1<0.15<0.2<0.25<0.3<0.35≤0.4>0.4
TN3<0.1<0.2<0.35<0.5<0.75<1<1.25<1.5<1.75≤2>2
CODMn3<1<2<3<4<6<8<10<12<14≤15>15
CODCr3<15<16<18<19<20<25<30<35<37≤40>40
NH3-N3<0.01<0.05<0.1<0.2<0.3<0.4<0.5<0.75<1≤1.25>1.2
Table 2. Characteristics of water quality factors in the study area.
Water Quality FactorsMean ± Standard DeviationMeasured Value Range
WT/°C24.97 ± 1.1223.10~26.40
pH7.98 ± 0.227.69~8.33
TDS/mg·L−1202.05 ± 62.49167.05~364.00
SAL/‰0.16 ± 0.050.13~0.30
ORP/mv−69.78 ± −27.38−133.60~−34.80
CODMn/mg·L−122.42 ± 15.096.99~60.74
TP/mg·L−10.69 ± 0.540.13~1.74
TN/mg·L−12.04 ± 0.830.87~3.82
DTP/mg·L−10.09 ± 0.010.08~0.12
DTN/mg·L−11.13 ± 0.340.74~1.71
CODcr/mg·L−180.3 ± 31.2422.00~136.00
NO3/mg·L−10.30 ± 0.100.13~0.47
F-/mg·L−10.74 ± 0.200.55~1.24
NH3-N/mg·L−10.15 ± 0.110.03~0.32
NIT/mg·L−10.08 ± 0.000.08~0.09
Disclaimer/Publisher’s Note: The statements, opinions and data contained in all publications are solely those of the individual author(s) and contributor(s) and not of MDPI and/or the editor(s). MDPI and/or the editor(s) disclaim responsibility for any injury to people or property resulting from any ideas, methods, instructions or products referred to in the content.

