Article

Comparative Assessment of Hydrogen and Methanol-Derived Fuel Co-Combustion for Improved Natural Gas Boiler Performance and Sustainability

1
School of Energy and Power Engineering, Huazhong University of Science and Technology, Wuhan 430074, China
2
School of Industrial Design, Hubei University of Technology, Wuhan 430068, China
3
State Key Laboratory of Coal Combustion, Huazhong University of Science and Technology, Wuhan 430074, China
*
Author to whom correspondence should be addressed.
Sustainability 2025, 17(3), 929; https://doi.org/10.3390/su17030929
Submission received: 23 December 2024 / Revised: 10 January 2025 / Accepted: 14 January 2025 / Published: 23 January 2025
(This article belongs to the Section Energy Sustainability)

Abstract

:
Faced with a global consensus on net-zero emissions, the use of clean fuels to entirely or substantially replace traditional fuels has emerged as the industry’s primary development direction. Alcohol–hydrogen fuels, primarily based on methanol, are a renewable and sustainable energy source. This research focuses on energy sustainability and presents a boiler fuel blending system that uses methanol–hydrogen combinations. This system uses the boiler’s waste heat to catalytically decompose methanol into a gas mostly consisting of H2 and CO, which is then co-combusted with the original fuel to improve thermal efficiency and lower emissions. A comparative experimental study considering natural gas (NG) blending with hydrogen and dissociated methanol gas (DMG) was carried out in a small natural gas boiler. The results indicate that, with a controlled mixed fuel flow of 10 m3/h and an excess air coefficient of 1.2, a 10% hydrogen blending ratio maximizes the boiler’s thermal efficiency ( η t ), resulting in a 3.5% increase. This ratio also results in a 1% increase in NOx emissions, a 25% decrease in HC emissions, and a 5.66% improvement in the equivalent economics ( e s ). Meanwhile, blending DMG at 15% increases the boiler’s η t by 3%, reduces NOx emissions by 13.8% and HC emissions by 20%, and improves the e s   by 8.63%. DMG, as a partial substitute for natural gas, outperforms hydrogen in various aspects. If this technology can be successfully applied and promoted, it could pave a new path for the sustainable development of energy in the boiler sector.

1. Introduction

The international community has adopted the common goals of lowering greenhouse gas emissions and advancing the energy transition in response to the significant difficulties posed by global climate change. Methanol, as a multi-purpose energy product, is highly efficient in combustion, simple to store and transport, and has substantial advantages for renewable energy generation [1,2]; this is particularly true for sustainable and renewable methanol, such as green methanol [3,4,5], which provides a new avenue for the development of low-carbon and renewable energy by employing non-fossil raw material production technologies.
Direct combustion of coal in typical fossil fuel boilers is inefficient and toxic; however, it can be gasified to make methanol [6,7]. Methanol has 50% more oxygen than natural gas (NG), the principal fuel used in conventional boilers, which improves combustion efficiency and lowers HC, CO, and NOx emissions. The development of methanol as a replacement for NG in gas boilers facilitates the continued cleaning and efficiency of industrial boilers.
Hydrogen, which is considered zero-carbon, has a higher calorific value than natural gas, a faster flame propagation speed, and no contaminants in the exhaust [8]. However, as hydrogen is a secondary energy source, it has a high production cost, and storage and transportation constraints limit its large-scale utilization [9]. Using methanol as a hydrogen carrier can successfully address the issues of hydrogen storage and transportation while fully utilizing hydrogen’s physicochemical features [10,11]. Of course, it is critical to examine the impacts of changes in fuel parameters following hydrogen blending on combustion. In research on the production of on-board hydrogen from methanol prior to combustion, Dmitry Pashchenko [12] performed a comparative thermodynamic analysis via Aspen HYSYS under wide ranges of the operational parameters; in particular, a gas turbine inlet temperature of 800–1000 °C, compression/expansion ratio of 9–15, and the temperature potential of low-grade heat was set from 200 to 400 °C. It was established that the decomposition of ethanol before its combustion leads to an increase in the power output of the gas turbine. Schiro et al. [13] have investigated the feasibility of using hydrogen-enriched methane in premixed boilers, proposing a relevant parameter model for combustion calculations. They also noted that flame detection systems and combustion controls developed for methane fuels are only applicable at low hydrogen blending ratios (20–30%). Oztuna et al. [14] have used both experimental and simulation methods to investigate the impact of hydrogen-enriched methane combustion in a back-pressure boiler on diffusion flame structure and emissions, demonstrating that the addition of hydrogen reduces fuel density, increases flow velocity, and widens the diffusion flame structure.
Buyukakn et al. [15] have conducted numerical simulations to assess the changes in flame temperature and emissions when methane was mixed with hydrogen at various mass fractions, concluding that the addition of hydrogen increased flame temperature and NOx emissions. Pashchenko et al. [16] have conducted CFD modeling and experimental validation of hydrogen-rich fuel combustion in rotary kilns and discovered that larger hydrogen volume fractions result in higher combustion temperature and nitrogen oxide emissions.
Existing research has mostly focused on the direct burning of hydrogen from storage tanks, which presents considerable obstacles associated with hydrogen storage and transportation issues. To remedy this, a methanol–hydrogen co-combustion technique that makes use of hydrogen’s combustion capabilities while reducing heat loss is suggested. This method uses waste heat from boilers to catalytically degrade methanol into dissociated methanol gas (DMG) mainly comprised of H2 and CO, according to the chemical expression shown in Equation (1), which is then co-fired with the original fuel to obtain improved thermal efficiency and lower emissions. The volumetric calorific value of DMG is higher than that of pure hydrogen, providing a cost advantage [17,18]. To simplify calculations, the DMG is represented as an ideal gas with a volume ratio of H2 to CO of 2:1.
CH 3 OH 180 220   ° C C a t a l y s t   2 H 2 + CO
This research focuses on managing the mixed fuel flow rate at 10 m3/h with an excess air coefficient of 1.2. It also examines the impact of mixing hydrogen and DMG with natural gas at different volume ratios on the boiler’s η t and emission characteristics. Additionally, an analysis of the equivalent economic efficiency of hydrogen and DMG combined with NG is performed.

2. Experimental Setup and Preparation

2.1. Experimental Test Bench

The experimental test setup comprised a small boiler, a gas delivery system, and a methanol dissociation device. The gas system provides NG and hydrogen, and the methanol dissociation device produces DMG. The gases and air combine and combust in the burner, and the high-temperature gases created by combustion exchange heat with water pipes located outside the furnace, transforming the water to steam. Table 1 provides the specifications of the boiler.
The experimental boiler is shown in Figure 1.
The methanol dissociation device functions primarily as a heat exchanger, while also facilitating chemical processes. High-temperature flue gases enter the reactor from the front, travel through internal pipelines, and exit from the same side at the back. The catalyst is situated outside the reactor’s heat exchange tubes. Liquid methanol enters the reactor shell through the right-side input and undergoes dissociation processes in the presence of the catalyst under certain temperature conditions. The DMG exits the reactor at the left end and then enters the burner.
The reaction temperature for methanol thermal cracking exceeds 800 °C; however, the catalyst can reduce the cracking temperature and pressure, allowing the reaction to occur at relatively moderate temperatures and pressures. In this experiment, a copper-zinc–aluminum series catalyst was used, with CuO serving as the primary component and ZnO and Al2O3 as supporting components. The catalyst specifications are provided in Table 2.
The methanol dissociation device was developed to address the fuel consumption, flue gas temperature, and heat exchange area required for the maximum blending ratio of the boiler, as shown in Figure 2 and Figure 3.
The experimental setup was essentially made up of the NG pipeline, the methanol dissociation device pipeline, the hydrogen gas pipeline, and the entire boiler system. NG and hydrogen gas fuels were routed from gas cylinders to the gas buffer tank via ball valves, pressure regulators, flow meters, and check valves before entering the boiler burner. Gas pressures and flow rates were controlled by altering the pressure regulator’s openings along the pipeline.
The methanol dissociation device pipeline consisted mostly of the methanol tank, methanol pump, methanol dissociation device, electric ball valve, and pressure regulator. The liquid methanol was injected into the methanol dissociation device, where it was vaporized and broken into DMG with the residual heat from the flue gas. PID regulation controlled the pump flow rate, in order to keep the pressure inside the separated device constant, and the electric ball valve was adjusted to control the DMG flow rate.
The experimental setup is shown in Figure 4Figure 5 and Figure 6.
A thermal gas flow meter and a mass flow meter were used to monitor the fuel and steam flow rates, respectively, while a K-type thermocouple measured the flue gas temperature and the temperature near the burner outlet. An exhaust gas analyzer was used to measure the composition of flue gases. When changes in flue gas composition and temperature are modest over time, the system can be called stable. Table 3 shows the measuring equipment, parameters, and ranges employed in the experimental study.
The exhaust gas analyzer sampling probe was positioned at the flue gas outlet, allowing for simultaneous measurement of the concentrations of CO, CO2, O2, NO, NO2, and HC compounds in the exhaust.

2.2. Boiler Performance Indicators

2.2.1. Thermal Efficiency η t

Thermal efficiency is defined as the ratio of the heat effectively utilized by the boiler to the total lower heating value of the fuel fed into the boiler. The effectively utilized heat by the boiler includes the heat absorbed to raise the water temperature, the latent heat of vaporization of the water, and the heat absorbed to superheat the steam. The heat supplied to the boiler refers to the total lower heating value of the fuel fed into the burner. The calculation formula is as follows:
Q u = m H 2 O × q H 2 O + C p l × m H 2 O × t s t i n + C p g × m H 2 O × t o u t t s ,
Q r = V f × L H V f ,
L H V f = 1 X L H V m + X L H V a ,
η t = Q u Q r × 100 % .
In these formulas,
  • Q u represents the heat effectively utilized per unit time, in kJ/h;
  • Q r represents the total lower heating value of the fuel per unit time, in kJ/h;
  • C p l represents the specific heat capacity of liquid water at constant pressure, in kJ/(kg·°C);
  • C p g represents the specific heat capacity of steam at constant pressure, in kJ/(kg·°C);
  • m H 2 O represents the steam flow rate, in kg/h;
  • V f represents the fuel volumetric flow rate, in m3/h;
  • t i n represents the boiler inlet water temperature, in °C;
  • t s represents the saturation steam temperature of water at the boiler’s rated working pressure, in °C;
  • t o u t represents the outlet steam temperature, in °C;
  • q H 2 O represents the latent heat of vaporization of water, in kJ/kg;
  • L H V f represents the lower heating value of the mixed fuel, in kJ/m3;
  • L H V a represents the lower heating value of the blended fuel (hydrogen or DMG), in kJ/m3;
  • L H V m represents the lower heating value of the primary fuel (NG), in kJ/m3;
  • η t represents the boiler thermal efficiency, in %.

2.2.2. Blending Ratio

For the experimental boiler, the blending ratio is defined as the volumetric flow rate proportion of the blended fuel (hydrogen or DMG) in the mixed fuel. The calculation formula is as follows:
X = V a V a + V m × 100 % .
In this formula,
  • V a represents the volumetric flow rate of hydrogen or DMG in the mixed fuel, in m3/h;
  • V m represents the volumetric flow rate of the primary fuel in the mixed fuel, in m3/h.
For clarity and convenience in subsequent expressions, the blending ratio of hydrogen is denoted as XH2, and the blending ratio of DMG is denoted as XDMG.

2.2.3. Economics

Economics is a key indicator for evaluating the effects of blending hydrogen and DMG with NG. It is generally defined as the ratio of the difference between the costs of consuming pure NG and the mixed fuel to the cost of consuming pure NG, under the condition of the same boiler evaporation rate over the same period. The calculation formula is as follows:
E D M G = E m × ρ D M G ,
E n = E D M G   or   E H ,
E B = 1 X E n + X E a ,
e = V f n × E n V f b × E B V f n × E n × 100 % .
In these formulas,
  • V f n represents the experimentally measured NG flow rate, in m3/h;
  • V f b represents the experimentally measured total flow rate of the mixed fuel, in m3/h;
  • E n represents the price of NG, 5.5 RMB/m3;
  • E m represents the price of methanol, 2.3 RMB/kg;
  • E D M G represents the price of DMG, RMB/m3;
  • E H represents the price of hydrogen, 3.2 RMB/m3;
  • E B represents the price of the mixed fuel, RMB/m3;
  • E a represents the price of the blended fuel ( E D M G   or   E H ),RMB/m3;
  • ρ D M G represents the density of DMG, kg/m3;
  • e represents the economic efficiency, %.

2.2.4. Equivalent Economics e s

In the experiment, the flow rate of the mixed fuel was constant. As the blending ratio increases, the calorific value of the mixed fuel decreases, resulting in a corresponding decrease in the boiler steam flow rate. Therefore, the equivalent economics is defined according to the calculation of the equivalent mixed fuel flow rate based on the reference steam flow rate and the boiler’s thermal efficiency after blending, which is used to assess its economic performance. The calculation formula is as follows:
Q s = m s × q H 2 O + C p l × m s × t s t i n + C p g × m s × t o u t t s ,
V s = Q s η t × L H V f ,
e s = V f n × E n V s × E B V f n × E n × 100 % .
In these formulas,
  • m s represents the reference steam flow rate per unit time, in kg/h;
  • Q s represents the reference effective heat utilization per unit time, in kJ/h;
  • η t represents the boiler’s thermal efficiency corresponding to different blending ratios, in %;
  • V s represents the equivalent mixed fuel flow rate, in m3/h;
  • e s represents the equivalent economic efficiency, in %.

3. Results and Discussion

3.1. The Impact of Hydrogen and Methanol Pyrolysis Gas Blending Ratios on Natural Gas Combustion

The excess air coefficient was controlled at 1.2 while maintaining the total volume flow rate of the mixed fuel gas at 10 m3/h under different blending ratios. The thermal efficiency, emission indicators, and economic performance were analyzed accordingly. The blending ratios of hydrogen and DMG in the mixed gas were 5%, 10%, 15%, 20%, 25%, and 30%.

3.1.1. The Impact on Boiler Thermal Efficiency η t

Boiler thermal efficiency is a key indicator for assessing the energy utilization efficiency of a boiler [19]. The effects of the blending ratios of hydrogen and DMG on thermal efficiency are shown in Figure 7. The related data are shown in Table 4. From the figure, it can be observed that as the hydrogen blending ratio increases, the boiler’s thermal efficiency ( η t ) first rises and then decreases. When the hydrogen blending ratio reaches 10%, the thermal efficiency ( η t ) peaks at 66.57%. Hydrogen burns faster than natural gas (NG), with a higher flame temperature. When the hydrogen blending ratio with NG ranges from 0% to 10%, it promotes overall combustion and heat transfer, thereby enhancing thermal efficiency ( η t ) . However, as the hydrogen blending ratio continues to increase, thermal efficiency ( η t ) declines. This is because hydrogen has a much lower density than air, which increases the relative density difference between the mixed fuel and air. This disparity may lead to fuel stratification, which can prevent sufficient mixing of oxygen with NG, resulting in localized oxygen deficiency or fuel excess, thus affecting the combustion process [20].
As the blending ratio of DMG with NG increases, the thermal efficiency initially rises and then declines. It reaches its maximum value of 66.04% when the blending ratio is 15%. This phenomenon occurs because, at lower blending ratios, hydrogen and CO facilitate the combustion of NG. However, as the blending ratio increases and the proportion of hydrogen rises, the combustion quality deteriorates, leading to a decrease in thermal efficiency. Nevertheless, compared to the declining trend observed with hydrogen blending, the reduction is relatively smaller.
Overall, hydrogen has a more significant catalytic effect on NG combustion. Therefore, when hydrogen is blended with NG, the thermal efficiency improvement is greater than when DMG is mixed. In contrast, as the density of DMG is higher than that of hydrogen, its impact on the relative density difference between the mixed fuel and air is less significant. As a result, when DMG is blended with NG, the thermal efficiency increases before stabilizing, showing a smoother fluctuation.

3.1.2. The Impact on Boiler Emissions

  • CO emissions
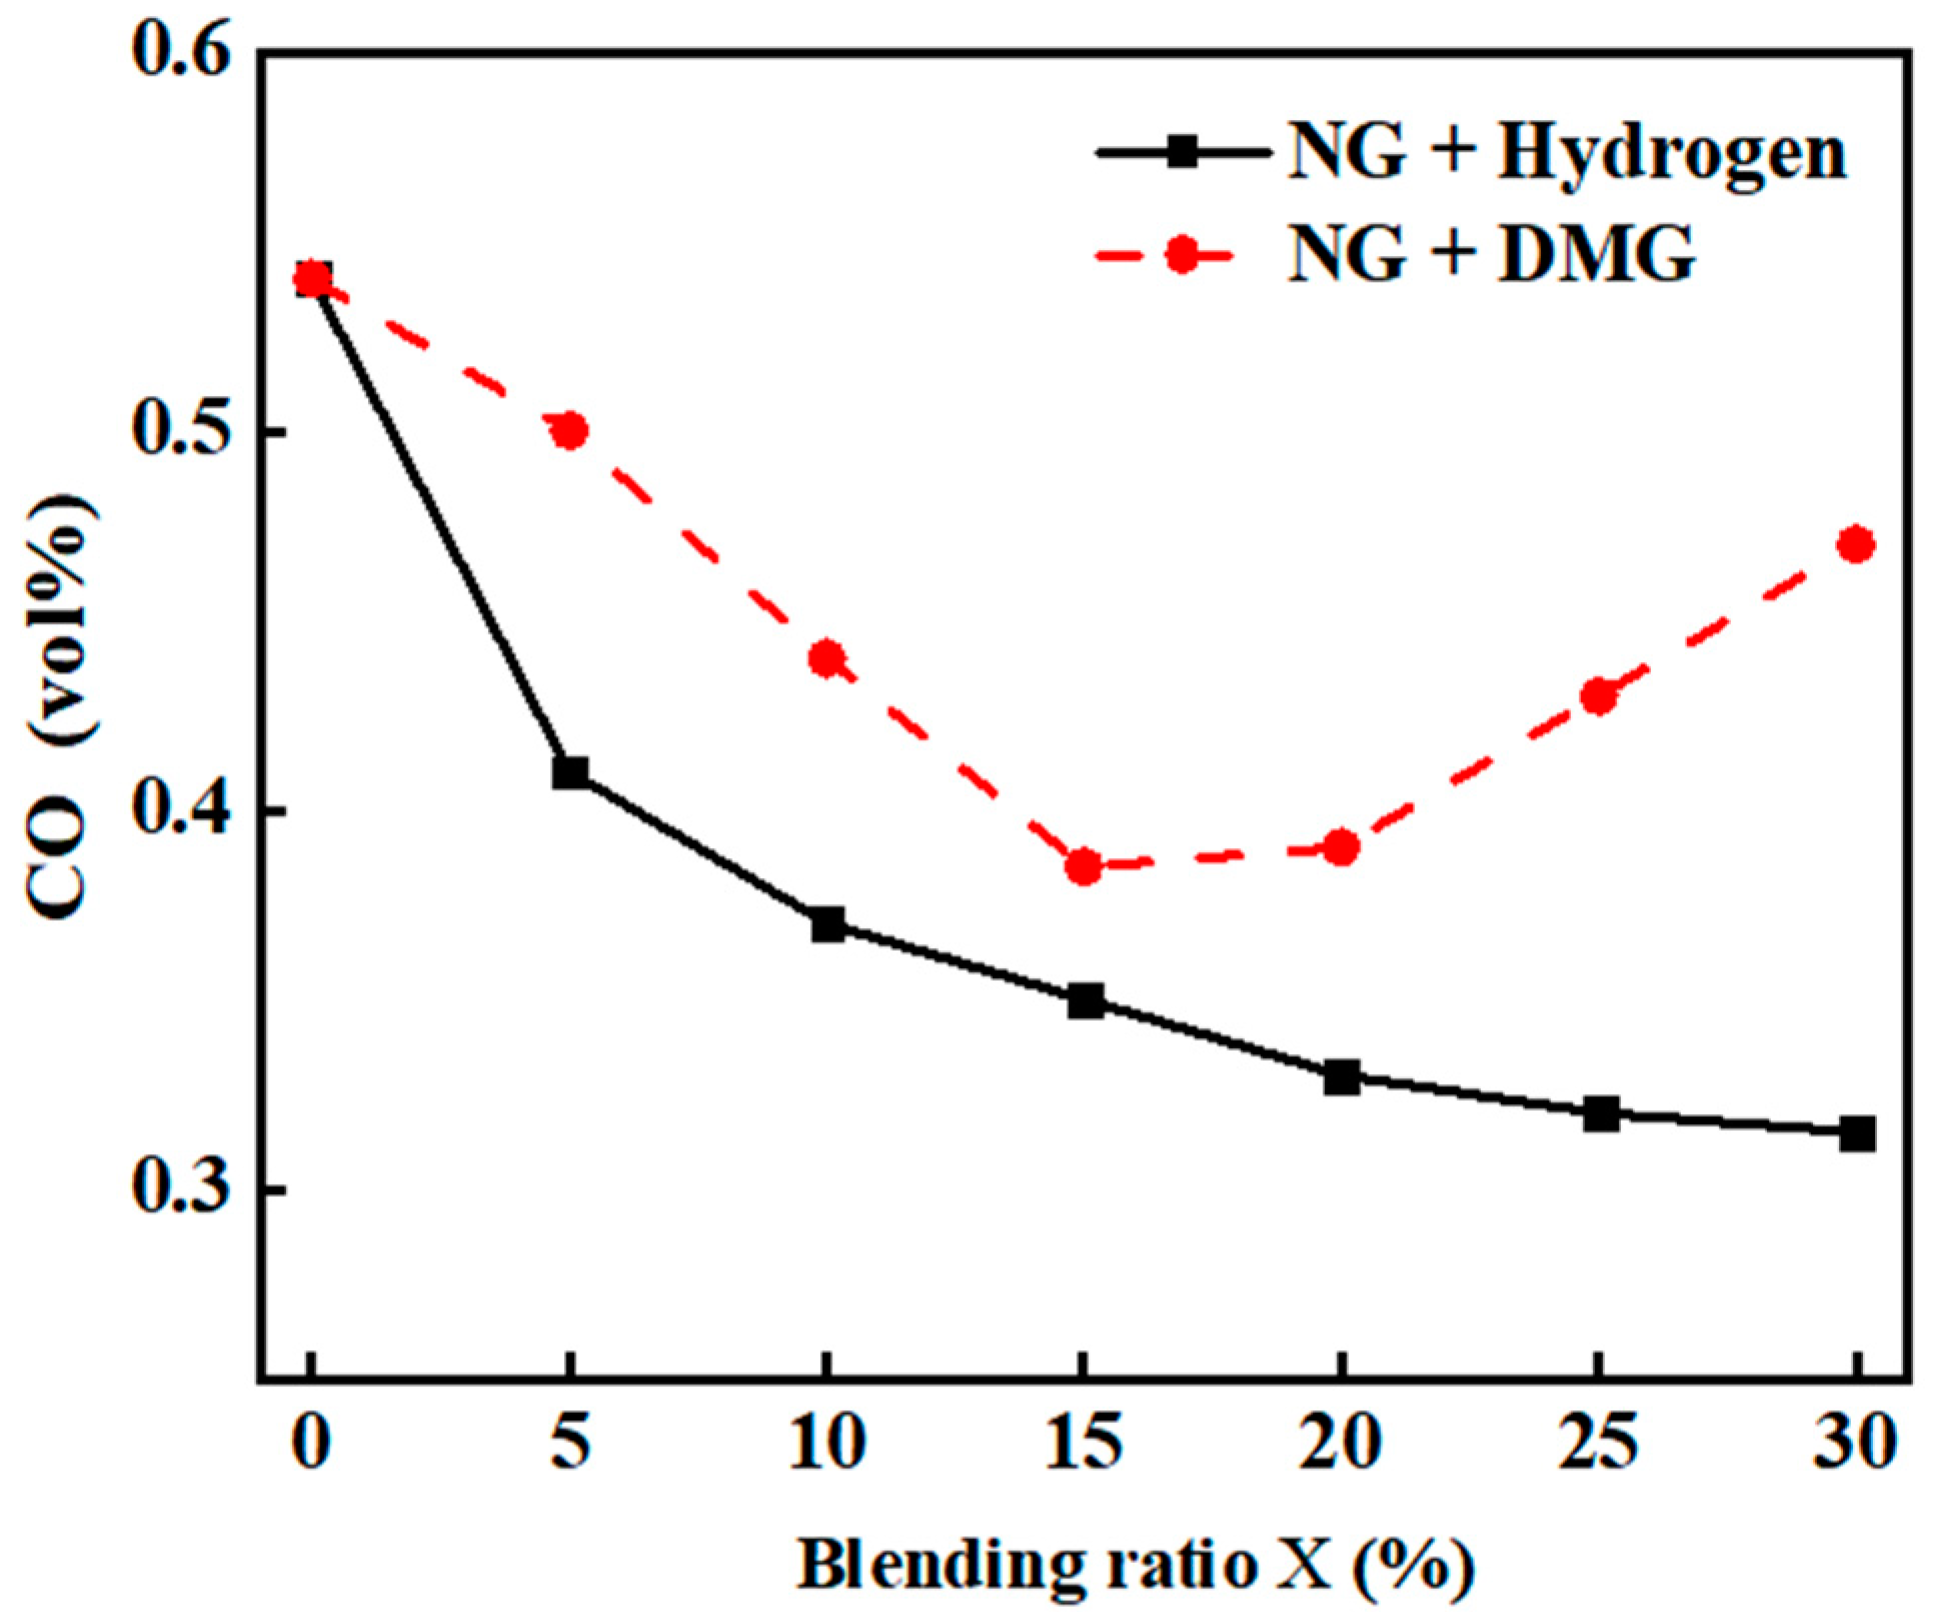
The impacts of the blending ratios of hydrogen and DMG on CO emissions are shown in Figure 8. The related data are shown in Table 5. From the figure, it is evident that as the hydrogen blending ratio increases, CO emissions gradually decrease, particularly with a noticeable reduction at low blending ratios, while the decline becomes more gradual at higher blending ratios. This phenomenon is primarily attributed to hydrogen’s lack of carbon, which reduces the overall carbon content of the input fuel. A small amount of hydrogen effectively promotes the combustion of NG, reducing the formation of incomplete combustion products such as CO, leading to a significant reduction in CO emissions initially. However, when the hydrogen proportion is too high, the increased relative density difference between hydrogen and air, coupled with the faster flame propagation speed, may cause flame stratification. This stratification may prevent oxygen from mixing sufficiently with NG, resulting in incomplete combustion and a rise in CO production. Therefore, despite the overall reduction in the carbon content of the input fuel, CO emissions tend to level off as the hydrogen proportion becomes too high.
In contrast to hydrogen, DMG contains a higher carbon content. Although its carbon content is lower than that of NG, it still contributes to the overall carbon content. Consequently, when DMG is blended, the overall carbon content of the input fuel decreases, leading to a general decline in CO emissions. However, as DMG itself contains CO, the combustion deterioration at higher blending ratios may lead to an increase in CO emissions, causing CO emissions to follow a trend of initially decreasing and then increasing.
  • CO2 emissions
The impacts of the blending ratios of hydrogen and DMG on CO2 emissions are shown in Figure 9. The related data are shown in Table 6. As can be seen from the figure, both the incorporation of hydrogen and DMG resulted in a reduction in boiler CO2 emissions. The primary reason for this phenomenon is that hydrogen contains no carbon, thereby lowering the overall carbon content of the input fuel.
At lower hydrogen blending ratios, the addition of a small amount of hydrogen effectively promotes the combustion of NG, improving combustion efficiency and leading to an increase in CO2 production. Consequently, the reduction in CO2 emissions is initially slow. However, when the hydrogen blending ratio becomes too high, the combustion of the mixed fuel deteriorates, and the combustion products are not fully converted into CO2, causing a more rapid decrease in CO2 emissions in the later stages.
In comparison to hydrogen, DMG contains more carbon, although its carbon content remains lower than that of NG. Therefore, after blending, the overall carbon content of the input fuel decreases, leading to a general decline in CO2 emissions. However, as DMG itself contains CO, at low blending ratios, its promotion of combustion may cause a slight increase in CO2, resulting in CO2 emissions initially rising and then falling.
  • HC emissions
The effects of hydrogen and DMG blending ratios on HC emissions are illustrated in Figure 10. The related data are shown in Table 7. From the graph, it is evident that as the blending ratio increases, the combustion of NG with hydrogen and DMG results in a decrease in HC emissions followed by an increase. At a blending ratio of 15%, HC emissions reach their respective minimum values of 13 ppm and 7 ppm.
This phenomenon can be attributed to the fact that, at lower blending ratios, hydrogen and DMG help to promote the complete oxidation of NG, thereby reducing HC formation. However, as the blending ratio of hydrogen and DMG increases, their lower densities increase the relative density difference between the mixed fuel and air, leading to a faster flame propagation rate and the occurrence of flame stratification. This stratification phenomenon may prevent sufficient mixing of oxygen with NG, causing localized incomplete combustion and, ultimately, an increase in HC emissions.
Overall, at lower blending ratios, the effects of hydrogen and DMG on HC emissions are similar. However, at higher blending ratios, DMG exhibits a more significant suppression effect on HC emissions, when compared to hydrogen. This is primarily because hydrogen has a lower density than DMG, making flame stratification more pronounced, whereas DMG’s higher density results in a relatively stable combustion process when blended.
  • NOx emission
NOx, primarily consisting of NO and NO2, is a key component in the formation of photochemical smog and acid rain. Its conversion into nitrates contributes to the eutrophication of water bodies, adversely affecting human health and the ecological environment [
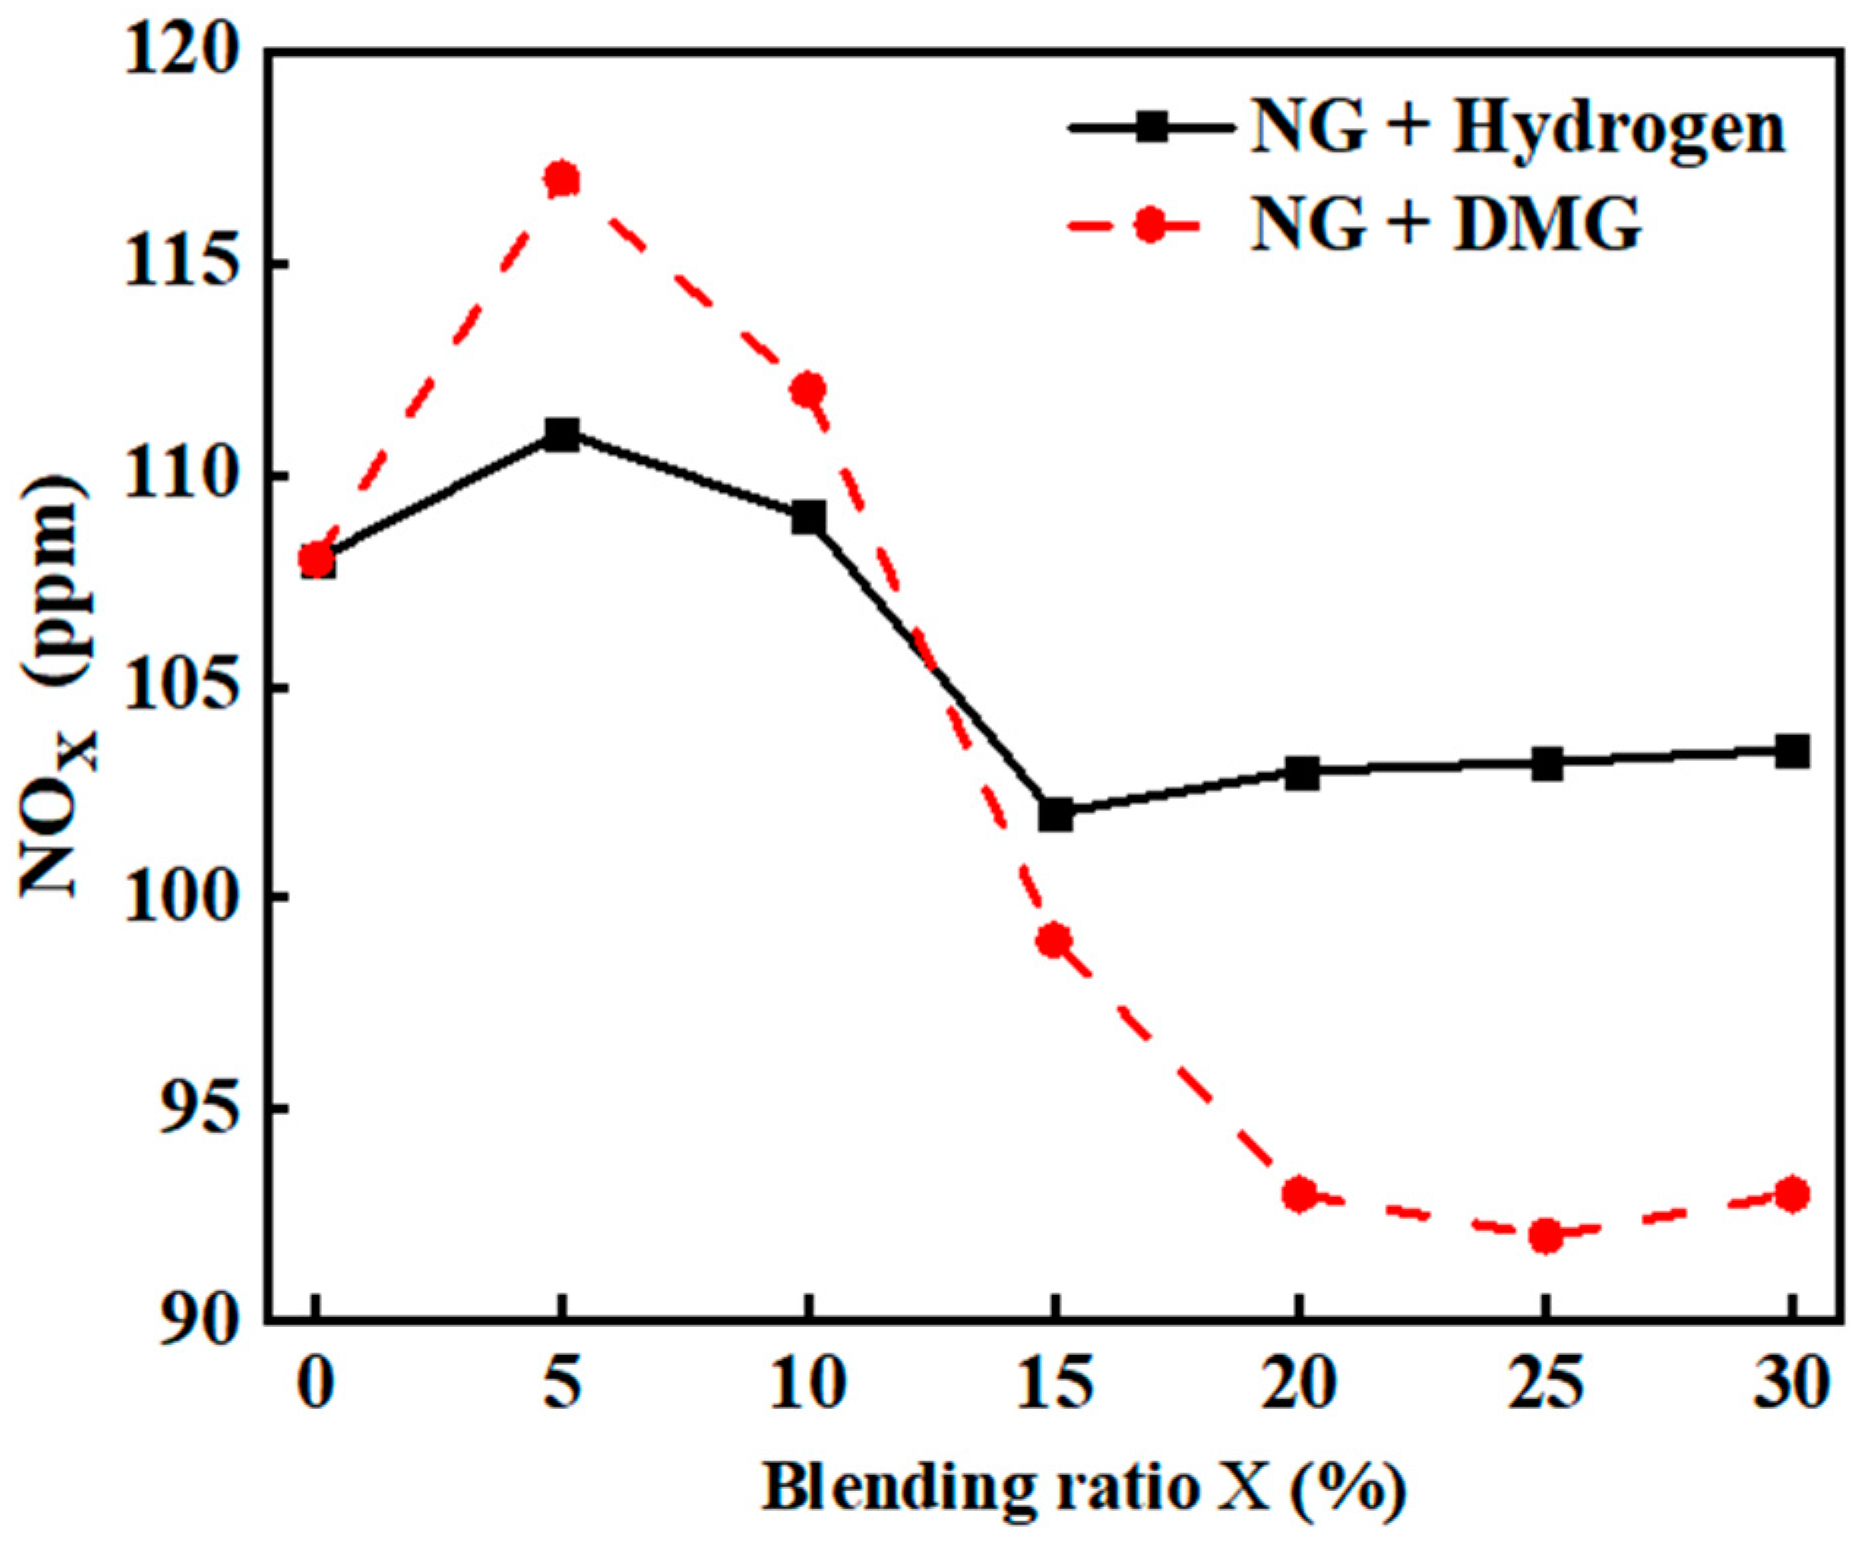
21]. The impacts of hydrogen and DMG blending ratios on NOx emissions are shown in Figure 11. The related data are shown in Table 8. From the graph, it is evident that the incorporation of hydrogen and DMG caused the NOx emissions of the boiler to first increase and then decrease. At a blending ratio of 5%, the NOx emissions peaked, reaching values of 111 ppm and 117 ppm, respectively.
The cause of this phenomenon is as follows: when the blending ratio of hydrogen and DMG is low, both contribute to promoting the oxidation combustion of NG, increasing the flame temperature. Hydrogen, with its inherently high adiabatic flame temperature, further elevates the flame temperature, and the high-temperature, oxygen-rich environment fosters the formation of NOx. Therefore, at low blending ratios, NOx emissions increase.
Among these two gases, DMG has a higher volumetric calorific value than hydrogen. Therefore, under the same fuel volume flow rate, when DMG is blended, the total heat input to the furnace will be greater than when hydrogen is mixed. This implies that blending DMG, compared to blending hydrogen, results in a higher overall heat input to the furnace, triggering a more intense combustion reaction, further raising the flame temperature and promoting the formation of NOx. As a result, the increase in NOx emissions when blending DMG is more pronounced than when blending hydrogen.
When the hydrogen blending ratio ranges between 5% and 15% and the DMG blending ratio falls between 5% and 25%, the relative density difference between the mixed fuel and air increases, resulting in a faster flame propagation speed and the occurrence of flame stratification. This stratification may prevent oxygen from fully mixing with the fuel, leading to localized oxygen-deficient or oxygen-rich combustion. Consequently, the combustion process deteriorates, reducing the heat release and lowering NOx emissions.
When the hydrogen blending ratio exceeded 15% and the DMG blending ratio exceeded 25%, the phenomenon of flame stratification became more pronounced, leading to localized oxygen enrichment. Hydrogen preferentially reacts with oxygen, creating a high-temperature, oxygen-rich environment. Although the heat release from combustion decreased, there was a tendency for NOx emissions to rise.

3.2. Economic Analysis

Due to the lower calorific value of hydrogen and DMG compared to NG, the aforementioned experimental setup resulted in a decrease in the overall heat input to the furnace. As a result, the boiler steam flow rate varied according to the blending ratios. Therefore, in the calculation of overall economics, the baseline steam flow rate was taken according to the optimal operating point for pure NG (flow rate of 10 m3/h, excess air coefficient of 1.2), corresponding to a boiler evaporation rate of 78.61 kg/h. The equivalent economics for different blending ratios were then derived based on the tested thermal efficiency after blending. The calculation results are shown in Figure 12. The related data are shown in Table 9.

4. Conclusions

This study investigated the effects of hydrogen and DMG on thermal efficiency, emissions, and economic aspects of NG boilers at different blending ratios. The main conclusions are as follows:
(1)
Considering a fixed fuel flow rate of 10 m3/h, an excess air coefficient of 1.2, and a hydrogen blending ratio ranging from 0 to 30%, relative to no blending, the boiler thermal efficiency was the highest (at 3.5%) under a blending ratio of 10%; at this time, NOx emissions increased by 1% and HC emissions decreased by 25%. Considering a DMG blending ratio ranging from 0 to 30%, relative to no blending, the boiler thermal efficiency was the highest (at 3%) under a blending ratio of 15%; at this time, NOx emissions decreased by 13.8% and HC emissions decreased by 20%.
(2)
Hydrogen slightly outperformed DMG in enhancing thermal efficiency when blended, while DMG was more effective than hydrogen in reducing HC and NOx emissions.
(3)
The equivalent economics of NG reached their maximum improvement of 5.66% when the hydrogen blending ratio was 10%. However, when the hydrogen ratio exceeded 10%, the equivalent economics gradually declined (even turning negative). In contrast, the equivalent economics of DMG showed a more stable increase, peaking at 8.63% with a 15% blending ratio, and averaging 7.6%, outperforming hydrogen at all blending ratios.
Due to the limited maximum fuel flow rate of the burner, the experiment in this study was unable to maintain a constant calorific value for the fuel entering the furnace at different blending ratios, thus imposing certain constraints on the equivalent economy calculation. Future research on the application of alcohol–hydrogen technology in boilers will focus on optimizing catalyst-driven low-temperature cracking and overall control strategies to further enhance the overall economic efficiency.

Author Contributions

Methodology, Y.C.; validation, B.Z.; resources, Y.J.; data curation, R.J.; writing—original draft, W.X.; writing—review and editing, W.X.; project administration, Y.J. All authors have read and agreed to the published version of the manuscript.

Funding

This research was funded by the Department of Science and Technology of Hubei Province, China (Grant number: 2022BEC010).

Institutional Review Board Statement

Not applicable.

Informed Consent Statement

Not applicable.

Data Availability Statement

Data are contained within the article.

Conflicts of Interest

The authors declare no conflict of interest.

Abbreviations

The following abbreviations are used in this manuscript:
DMGDissociated methanol gas
NGNatural gas

References

  1. Tian, Z.; Wang, Y.; Zhen, X.; Liu, Z. The effect of methanol production and application in internal combustion engines on emissions in the context of carbon neutrality: A review. Fuel 2022, 320, 123902. [Google Scholar] [CrossRef]
  2. Ho, C.S.; Peng, J.; Yun, U.; Zhang, Q.; Mao, H. Impacts of methanol fuel on vehicular emissions: A review. Front. Environ. Sci. Eng. 2022, 16, 121. [Google Scholar] [CrossRef]
  3. Gautam, P.; Upadhyay, S.N.; Dubey, S.K. Bio-methanol as a renewable fuel from waste biomass: Current trends and future perspective. Fuel 2020, 273, 117783. [Google Scholar] [CrossRef]
  4. Crivellari, A.; Cozzani, V.; Dincer, I. Exergetic and exergoeconomic analyses of novel methanol synthesis processes driven by offshore renewable energies. Energy 2019, 187, 115947. [Google Scholar] [CrossRef]
  5. Gu, Y.; Wang, D.; Chen, Q.; Tang, Z. Techno-economic analysis of green methanol plant with optimal design of renewable hydro gen production: A case study in China. Int. J. Hydrogen Energy 2022, 47, 5085–5100. [Google Scholar] [CrossRef]
  6. Liu, J.; Zhuang, Y.; Wang, C.; Du, J. Life cycle carbon footprint assessment of coal-to-SNG/methanol polygeneration process. Sci. Total Environ. 2024, 908, 168409. [Google Scholar] [CrossRef] [PubMed]
  7. Wang, X.; Demirel, Y. Feasibility of power and methanol production by an entrained-flow coal gasification system. Energy Fuels 2018, 32, 7595–7610. [Google Scholar] [CrossRef]
  8. Hassan, Q.; Sameen, A.Z.; Salman, H.M.; Jaszczur, M.; Al-Jiboory, A.K. Hydrogen energy future: Advancements in storage technologies and implications for sustainability. J. Energy Storage 2023, 72, 108404. [Google Scholar] [CrossRef]
  9. Ali, A.; Shaikh, M.N. Recent developments in catalyst design for liquid organic hydrogen carriers: Bridging the gap to affordable hydrogen storage. Int. J. Hydrogen Energy 2024, 78, 1–21. [Google Scholar] [CrossRef]
  10. Li, C.; Jia, T.; Wang, H.; Wang, X.; Negnevitsky, M.; Hu, Y.J.; Zhao, G.; Wang, L. Assessing the prospect of deploying green methanol vehicles in China from energy, environmental and economic perspectives. Energy 2023, 263, 125967. [Google Scholar] [CrossRef]
  11. Shih, C.F.; Zhang, T.; Li, J.; Bai, C. Powering the Future with Liquid Sunshine. Joule 2018, 2, 1925–1949. [Google Scholar] [CrossRef]
  12. Pashchenko, D. Low-grade heat utilization in the methanol-fired gas turbines through a thermochemical fuel transformation. Therm. Sci. Eng. Prog. 2022, 36, 101537. [Google Scholar] [CrossRef]
  13. Schiro, F.; Stoppato, A.; Benato, A. Modelling and analyzing the impact of hydrogen enriched natural gas on domestic gas boilers in a decarbonization perspective. Carbon Resour. Convers. 2020, 3, 122–129. [Google Scholar] [CrossRef]
  14. Oztuna, S.; Buyukakin, M.K. Effects of hydrogen enrichment of methane on diffusion flame structure and emissions in a back-pressure combustion chamber. Int. J. Hydrogen Energy 2020, 45, 5971–5986. [Google Scholar] [CrossRef]
  15. Buyukakin, M.K.; Oztuna, S. Numerical investigation on hydrogen-enriched methane combustion in a domestic back-pressure boiler and non-premixed burner system from flame structure and pollutants aspect. Int. J. Hydrogen Energy 2020, 45, 35246–35256. [Google Scholar] [CrossRef]
  16. Pashchenko, D. Hydrogen-rich fuel combustion in a swirling flame: CFD-modeling with experimental verification. Int. J. Hydrogen Energy 2020, 45, 19996–20003. [Google Scholar] [CrossRef]
  17. Guban, D.; Muritala, I.K.; Roeb, M.; Sattler, C. Assessment of sustainable high temperature hydrogen production technologies. Int. J. Hydrogen Energy 2020, 45, 26156–26165. [Google Scholar] [CrossRef]
  18. Chen, Y.; Jiang, Y.; Zhang, B.; Lu, Y.; Wang, B. Impact of preparation methods on the performance of Cu/Ni/Zr catalysts for methanol de composition. Mater. Res. Express 2024, 11, 025504. [Google Scholar] [CrossRef]
  19. Cai, Q.; Wu, X.; Huang, Y.; Wang, X. The research on the influence of boiler operating parameters on thermal efficiency. In Proceedings of the 2020 6th International Conference on Energy, Environment and Materials Science, EEMS 2020, Hulunbuir, China, 28–30 August 2020; IOP Publishing Ltd.: Bristol, UK, 2020. [Google Scholar]
  20. Cui, D.; Xiong, L.; Yu, G.; Xu, Q.; Li, Q.; Ji, Q. Hydrogen Blending Ratio and Interchangeability Requirements for Hydrogen-Infused Natural Gas as Fuel. Nat. Gas Ind. 2022, 42, 181–185. [Google Scholar]
  21. Naik, G.G.; Dharmadhikari, H.M. Methods for reducing NOx and PM emissions in compression ignition engine: A review. Mater. Today Proc. 2023, 72, 1406–1412. [Google Scholar] [CrossRef]
Figure 1. Experimental boiler.
Sustainability 17 00929 g001
Figure 2. Schematic diagram of the methanol dissociation device.
Sustainability 17 00929 g002
Figure 3. Physical model of the methanol dissociation device.
Sustainability 17 00929 g003
Figure 4. Schematic diagram of the test bench: (1) methanol tank; (2) methanol pump; (3) methanol dissociation device; (4) electric ball valve; (5) DMG flow meter; (6) buffer tank; (7) burner; (8) boiler; (9) steam flow meter; (10) water tank; (11) water pump; (12) NG cylinder; (13) NG flow meter; (14) hydrogen cylinders; (15) hydrogen flow meter; (16) emissions gas analyzer; (17) computer.
Sustainability 17 00929 g004
Figure 5. Gas pipeline system.
Sustainability 17 00929 g005
Figure 6. Methanol dissociation device pipeline.
Sustainability 17 00929 g006
Figure 7. The impacts of blending ratios on boiler thermal efficiency η t .
Sustainability 17 00929 g007
Figure 8. The impacts of blending ratios on CO emissions.
Sustainability 17 00929 g008
Figure 9. The impacts of blending ratios on CO2 emissions.
Sustainability 17 00929 g009
Figure 10. The impacts of blending ratios on HC emissions.
Sustainability 17 00929 g010
Figure 11. The impacts of blending ratios on NOx emissions.
Sustainability 17 00929 g011
Figure 12. The impacts of blending ratios on boiler equivalent economics   e s .
Sustainability 17 00929 g012
Table 1. Boiler specifications.
ManufacturerHengxin Boiler Manufacturing Co., Ltd., Zhoukou, China.
Model numberLSS0.1-0.09-YQ
Evaporation capacity0.1 t/h
Outlet vapor pressure0.1 MPa
Outlet vapor temperature119 °C
Feedwater temperature25 °C
Table 2. Catalyst specifications.
ManufacturerGuangzhou Kaisi Catalyst Chemical Co., Ltd., Guangzhou, China.
Model numberM650
Chemical compositionCuO (65–70%), ZnO (15%), Al2O3 (15–20%)
GeometryParticle ϕ5 × 5 mm
Operating temperature180 °C–220 °C
Use airspeed0.3–0.5 h−1
Conversion rate95–99%
Industrial life2–3 year
Table 3. Test equipment for the test bench.
Testing EquipmentParameterRangeAccuracyManufacturer
Emissions Gas Analyzer
Gasboard-5260
O20–25 (%)±0.1 (%)
CO0–14 (%)±0.02 (%)
CO20–18 (%)±0.3 (%)Ruiyi Automatic
NO0–5000 (PPM)±25 (PPM)Control Systems Ltd., Wuhan, China.
NO20–1000 (PPM)±25 (PPM)
HC0–9999 (PPM)±4 (PPM)
Thermocouple GH3039Temperature50–1700 (°C)±0.5 (°C)Ward Steel
Products Ltd., Xinhua, China.
Thermal Gas Flow Meter TMF-1-980-15NG Flow0–20 (kg/h)±1.0 (%)
Hydrogen Flow0–1 (kg/h)±1.0 (%)Shihua Automation
DMG Flow0–30 (kg/h)±1.0 (%)Equipment Ltd., Beijing China.
Steam Flow0–100 (kg/h)±1.0 (%)
Table 4. Detailed experimental data related to boiler thermal efficiency η t .
Blending Ratio X (%)NG + HydrogenNG + DMG
063.01%63.01%
565.50%65.25%
1066.57%65.30%
1565.87%66.04%
2063.78%65.58%
2562.87%65.52%
3062.89%65.34%
Table 5. Detailed experimental data related to CO emissions.
Blending Ratio X (%)NG + HydrogenNG + DMG
00.54 vol%0.54 vol%
50.41 vol%0.50 vol%
100.37 vol%0.44 vol%
150.35 vol%0.38 vol%
200.33 vol%0.39 vol%
250.32 vol%0.43 vol%
300.31 vol%0.47 vol%
Table 6. Detailed experimental data related to CO2 emissions.
Blending Ratio X (%)NG + HydrogenNG + DMG
010.25 vol%10.25 vol%
510.10 vol%10.30 vol%
1010.01 vol%10.23 vol%
159.86 vol%10.15 vol%
209.67 vol%9.96 vol%
259.45 vol%9.75 vol%
309.20 vol%9.53 vol%
Table 7. Detailed experimental data related to HC emissions.
Blending Ratio X (%)NG + HydrogenNG + DMG
020.0 ppm20.0 ppm
516.0 ppm17.0 ppm
1015.0 ppm15.0 ppm
1513.0 ppm7.0 ppm
2019.5 ppm16.0 ppm
2520.0 ppm17.0 ppm
3019.8 ppm17.0 ppm
Table 8. Detailed experimental data related to NOx emissions.
Blending Ratio X (%)NG + HydrogenNG + DMG
0108.0 ppm108.0 ppm
5111.0 ppm117.0 ppm
10109.0 ppm112.0 ppm
15102.0 ppm99.0 ppm
20103.5 ppm93.0 ppm
25103.2 ppm92.0 ppm
30103.5 ppm93.0 ppm
Table 9. Detailed experimental data related to on boiler equivalent economics   e s .
Blending Ratio X (%)NG + HydrogenNG + DMG
00.00%0.00%
55.31%5.36%
105.66%6.92%
153.30%8.63%
20−1.47%8.59%
25−5.13%8.21%
30−6.73%8.20%
Disclaimer/Publisher’s Note: The statements, opinions and data contained in all publications are solely those of the individual author(s) and contributor(s) and not of MDPI and/or the editor(s). MDPI and/or the editor(s) disclaim responsibility for any injury to people or property resulting from any ideas, methods, instructions or products referred to in the content.

