Article

Evaluation and Obstacle Factors of Renewable Energy Substitution Potential in Underdeveloped Rural Areas of China

1
School of Economics and Management, Lanzhou Jiaotong University, 88 Anning West Road, Anning District, Lanzhou 730070, China
2
School of Management, Gansu Agricultural University, 1 Yingmen Village, Anning District, Lanzhou 730070, China
*
Author to whom correspondence should be addressed.
Sustainability 2025, 17(3), 1315; https://doi.org/10.3390/su17031315
Submission received: 9 January 2025 / Revised: 26 January 2025 / Accepted: 4 February 2025 / Published: 6 February 2025
(This article belongs to the Section Energy Sustainability)

Abstract

:
The energy consumption structure in underdeveloped rural areas of China has long been dominated by fossil fuels. Such a structure not only makes it difficult to improve the rural living environment but also hinders the stable development of the rural economy. For these regions, improving the living environment is one of the key tasks of China’s rural revitalization strategy. As a clean energy with huge potential, renewable energy can provide a convenient and low-cost solution for the transformation of the energy structure and the improvement of the living environment in these areas. This study takes Gansu Province, a typical underdeveloped region in China, as the research area and uses a multi-objective evaluation analysis model to evaluate the potential for renewable energy substitution at the county scale in rural areas of Gansu Province. Then, through the obstacle factor analysis model, the obstacle factors of the potential for renewable energy substitution are revealed, providing a basis for the scientific formulation of energy policies and the stable development of the rural economy in underdeveloped areas. This study found that the potential for renewable energy substitution in counties of Gansu Province is generally low and shows significant temporal and spatial differences. At the criterion level, the endowment of renewable energy resources constitutes the greatest obstacle, with an average obstacle degree of 8.91%, and shows an upward trend. At the factor level, the obstacle degree of the effective irrigated area is the highest, with an average obstacle degree of 9.29%, and the interannual variation is relatively stable. In addition, the average obstacle degrees of total agricultural machinery power and the number of rural populations are also relatively high. Finally, this paper puts forward policy suggestions, such as rationally planning the development model of renewable energy, coordinating regions to give full play to economic value, and innovatively developing to enhance development capacity, in order to provide reference for relevant decision-making.

1. Introduction

Human civilization is at a turning point. Global climate change caused by human activities is becoming increasingly severe at both regional and global levels. As a clean energy source with huge reserves, renewable energy offers a carbon-neutral solution to climate change resulting from the burning of fossil fuels today [1]. Currently, the world is facing numerous challenges such as geopolitical risks and the unstable prices of natural resources. The situation regarding the global climate change response is becoming increasingly complex. Renewable energy is regarded as a viable and cost-effective option for reducing carbon emissions and enhancing alternative capacity [2]. The Chinese government attaches great importance to the development of renewable energy in rural areas, aiming to improve the rural living environment and achieve a rural revitalization strategy through the modernization of rural energy [3]. At the national level, emphasis is placed on improving rural energy infrastructure through the efficient development of renewable energy, ultimately achieving the modernization of energy supply and waste recycling in rural areas [3].
Driven by the goal of addressing climate change, many scholars have conducted research on the development of renewable energy within the framework of clean energy in recent years. Renewable energy has the characteristics of large reserves, easy accessibility, and low carbon emissions [4]. The substitution of traditional fossil fuels with renewable energy can significantly enhance energy security and mitigate the energy crisis [5]. Especially for late-developing countries such as China, Brazil, and India, efficient utilization of renewable energy and sustainable resource management can help alleviate the resource curse caused by the extensive use of fossil fuels [6]. At the same time, increasing the consumption of renewable energy can also reduce natural resource rents, thereby balancing economic development and environmental protection, ultimately contributing to the achievement of sustainable development goals in these countries [7]. For developed economies, such as the G7, prioritizing energy efficiency and transitioning to sustainable energy is also essential to align with the global trend of environmental protection [8].
Research on the reserves and substitution potential for renewable energy resources has been relatively abundant and in-depth. For instance, studies have shown that the global renewable energy potential from agricultural organic waste and forestry residues amounts to (76–79) × 1018 J/year and 74 × 1018 J/year, respectively [9]. The resource potential of solar energy is also considerable. For example, a study on Mexico indicated that even if photovoltaic plans were only implemented in rural households, it could save approximately 39,750 GWh of energy for the country, equivalent to a reduction of 20.27 Tg of CO2 [10]. In Southeast Asia, palm oil is one of the most significant sources of renewable energy. Researchers compared the renewable energy potential of Turkey and Malaysia and found that Malaysia has the potential to produce about 15 billion cubic meters of biogas annually [11], with 98.7% of this potential coming from oil palm [12]. China is a region with considerable renewable energy potential and is also one of the countries with the largest scale of renewable energy development. A study revealed that the total energy-saving potential of clean renewable energy in rural China in 2020 was 32.31 Mtce, approximately 10.61% of the total predicted energy consumption in 2020. Among these, the energy-saving potentials of solar energy, biogas, and micro- and small-scale power generation were 9.113 Mtce, 23.11 Mtce, and 0.088 Mtce, respectively [13].
The academic community generally believes that the main obstacles to the replacement of fossil energy by renewable energy are policy and economic factors. For instance, a certain study holds that renewable energy has significant positive externalities, which can promote rural economic development and improve the living environment [14]. This is also the premise for the government’s support of renewable energy. Therefore, the government’s policy support is regarded as the key factor in promoting the development of renewable energy [15]. Among these, cash subsidies and tax reductions are two commonly used policy measures to compensate for the significant economic shortcomings of renewable energy projects. Therefore, these two measures are also considered the most direct supportive factors [16]. A study on the European Union further confirmed the significant impact of environmental taxes on renewable energy [17]. China’s renewable energy development policies also tend to provide economic support for the development of renewable energy to fully leverage its positive externalities [18]. In addition, many studies believe that economic factors are the primary obstacles. For example, one study holds that only countries or regions with a high level of economic development will have sufficient funds and strong motivation to support the development of renewable energy [8]. However, another study argues that precisely because underdeveloped regions urgently need to escape energy poverty, they require the support of renewable energy even more. Therefore, underdeveloped regions should strive to overcome macroeconomic challenges and prioritize the development of renewable energy [19].
Summarizing the existing research, there is a relatively rich body of work on the evaluation of the substitution potential for renewable energy, but the evaluation content is mostly limited to assessment of the potential reserves of renewable energy resources. For most regions, high resource reserves do not necessarily mean high substitution potential. Whether a region can effectively replace fossil energy is also related to the rural economic level and natural geographical conditions. Therefore, this study aims to construct a comprehensive evaluation system that includes the endowment of renewable energy resources, the rural development level, and natural geographical conditions to comprehensively evaluate the substitution potential for renewable energy in rural areas at the county scale in Gansu Province. At the same time, the existing literature mainly explores the obstacles to the substitution of renewable energy from external factors, such as policy and economic factors, and lacks discussion on endogenous factors. This study establishes an obstacle factor system that includes both external and internal factors and uses the obstacle degree analysis model to reveal the potential limiting factors of renewable energy development and their strengths and weaknesses. Through the above research, this study provides a basis for formulating scientific and reasonable energy policies and promoting sustainable rural development, with the aim of making certain contributions to the development of renewable energy in rural areas of Gansu Province, the transformation of rural energy consumption, and the development of rural economy and society.

2. Research Design

2.1. Theoretical Analysis and Research Hypothesis

The theory of energy poverty holds that energy poverty refers to the inability of individuals or families to access or afford the energy services they need to meet their basic living requirements [19]. This is often associated with a lack of modern energy services, and the reasons may include low income, high energy costs, and inadequate infrastructure [20]. For a long time, human society has been overly dependent on traditional fossil fuels. With the rapid development of the economy, the crises of fossil energy and increasingly serious environmental problems have become more prominent [21]. In the face of these situations, improving energy utilization efficiency and promoting renewable energy have become the inevitable path for global sustainable energy development [22]. For underdeveloped regions, energy poverty is not only about a lack of efficient and clean domestic energy, but also about the ability to enjoy the convenience and comfort brought by modern energy services [23]. Renewable energy sources such as solar energy and biomass energy can replace traditional fossil fuels in a relatively low-cost and convenient way, helping underdeveloped regions to eliminate energy poverty [24]. In underdeveloped regions, solar energy and biomass energy are often readily available and are extremely convenient and cost-effective energy options. Therefore, if local governments fully develop these convenient and affordable renewable energy sources, they can be expected to solve the long-standing problem of energy poverty in underdeveloped regions [23].
The aim of underdeveloped regions using renewable energy to replace fossil fuels is to eradicate energy poverty. Therefore, whether renewable energy offers significant comprehensive benefits is the prerequisite for the potential for alternative energy to be realized [23,24]. These benefits not only include direct economic gains but also encompass multiple dimensions such as environmental and social advantages [24]. However, the factors that limit the comprehensive benefits of renewable energy are multidimensional. First, from an economic perspective, the initial investment cost of renewable energy projects is typically high, and the investment payback period is relatively long. This may make it challenging for underdeveloped regions to bear the economic burden. Secondly, from the perspective of resource endowment, regions with richer renewable energy resources have a stronger development foundation. Additionally, the economic benefits of renewable energy depend on market demand and price mechanisms. If the market demand is insufficient or the price mechanism is unreasonable, it will impact the economic benefits of renewable energy projects [25]. Of course, these factors do not affect the comprehensive benefits of renewable energy replacing fossil fuels in isolation but result from combined influences. For example, in regions with relatively abundant resource reserves, due to limitations in local economic development levels, they cannot fully realize their substitution potential, leading to lower comprehensive replacement benefits [26].
Based on the above analysis, the following theoretical hypotheses are proposed:
H1. 
Underdeveloped regions need to replace fossil energy with renewable energy to escape energy poverty.
H2. 
The potential for renewable energy to replace fossil energy in underdeveloped regions is mainly constrained by macro-environmental factors and resource endowment factors.

2.2. Research Methods

2.2.1. Technique for Order Preference by Similarity to Ideal Solution Model

The core principle of the Technique for Order Preference by Similarity to Ideal Solution (TOPSIS) model is to construct an original index matrix and adopt a multi-scheme, multi-attribute decision-making approach. Among numerous schemes, this method aims to identify the best solution to achieve a systematic evaluation of different projects based on various attributes, thereby determining the optimal solution and optimizing system performance. The detailed steps of the TOPSIS analysis method include the following:
(1)
Calculating weights, in this study, the Information Entropy Weight (IEW) method is used to determine the index weights. The original data of the renewable energy evaluation indicators for each county in each year are taken, respectively, to form an n-row sample and m-column index evaluation matrix: X = (Xij)m×n. The original data are standardized through range normalization to eliminate the influence of the different units and magnitudes of the indicators on the final result [27]. The processed matrix is X′ = (Xij)m×n. Specifically, it is as follows:
x i j = x i j min x i j max x i j min x i j
x i j = max x i j x i j max x i j min x i j
Among them, min (xij) and max (xij) are the minimum and maximum values of each indicator, respectively. The objective weighting is conducted by using the entropy weight method to obtain the indicator weights. The objective weighting process is entirely based on unbiased data and can effectively address the limitations of subjective weighting [28]. The specific process is as follows: First, calculate the information entropy value of the standardized indicators, as shown in the formula below.
e i j = K i = 1 n f i j ln   f i j
Here, K is a constant, K = 1/lnn, which is related to the number of evaluation objects n. To avoid lnfij being meaningless, the following is stipulated:
f i j = 1 + X i j i = 1 m ( 1 + X i j )
The utility value G of the indicator information is the difference between 1 and the entropy value of the indicator information:
G i j = 1 e i j
Then, the index weights Wij can be calculated:
W i j = G i j j = 1 n G i j = 1 e i j n j = 1 n e i j
Calculate the weights of the indicators and apply them to the calculation results of the evaluation content system to obtain the final outcome.
(2)
Determine the best and worst solutions. Generally, the minimum and maximum values of each indicator in the standardized matrix represent the worst and best solutions for the evaluated object, respectively. Use the TOPSIS analysis method to determine the potential for renewable energy substitution of each county in each year. Take the minimum and maximum values of each indicator in the standardized matrix X′ = (X′ij)m×n as the worst and best solutions for the evaluated object, respectively [27].
X = min x i 1 1 j m , min x i 2 1 j m , , min x i n 1 j m
X + = max x i 1 1 j m , max x i 2 1 j m , , max x i n 1 j m
(3)
Calculate the ideal distance and obtain the evaluation value. The weighted Euclidean distance is used to measure the distance between each research sample and the worst solution (negative ideal solution) and also the best solution (ideal solution). These two distances reflect the status of the evaluated object from different perspectives. The closer the evaluated object is to the ideal solution, the better the evaluation result. The evaluation value is calculated through the positive and negative ideal distances [27]. The weighted Euclidean distance is used to measure the distance between each research sample and the worst solution (negative ideal solution) and the best solution (ideal solution), di, di+:
d i = j = 1 n w j ( x i j x j ) 2
d i + = j = 1 n w j ( x i j x j + ) 2
The di and di+, respectively, represent the status of the evaluated object from different perspectives. The smaller the di+, the closer the evaluated object is to the ideal solution, and the better the evaluation result. Conversely, the larger the di, the closer the evaluated object is to the negative ideal solution [27]. The comprehensive evaluation result based on di and di+ is expressed through the evaluation value Ci:
C i = d i d i + d i +
The evaluation value Ci ranges from 0 to 1. When Ci is 1 or 0, the indicators of the evaluated sample are in the best or worst state, respectively. The closer its value is to 1, the higher the evaluation level of the evaluated sample; conversely, the closer it is to 0, the lower the evaluation level of the evaluated sample [27].
E ( C i ) = 1 M C i M
To examine the differences in the potential for renewable energy substitution in various regions before and after the implementation of policies, it is necessary to divide the period into pre-policy and post-policy based on the year when the policy was introduced and to calculate the average potential values for these two periods, respectively, for horizontal comparison and analysis. In the above formula, M represents the length of the time period and E(Ci) represents the average potential value during the respective period.

2.2.2. Spatial Autocorrelation Model

Spatial autocorrelation models are common methods in spatial statistics research. These methods are used to explore the spatio-temporal differentiation and evolution laws of objective phenomena and can effectively address issues that traditional statistical methods cannot directly handle in spatial statistical analysis [29]. In this study, spatial autocorrelation analysis was employed to conduct a spatio-temporal analysis of the potential for renewable energy substitution across 86 county-level units in Gansu Province.
(1)
The global spatial autocorrelation reflects the overall agglomeration and distribution pattern of the potential for renewable energy substitution within the entire county-level spatial area of Gansu Province. The commonly used Moran’s I index is employed for measurement, and its calculation formula is as follows:
I = n i = 1 n j = 1 n w i j x i x ¯ x i x ¯ / i = 1 n j = 1 n w i j i = 1 n x i x ¯ 2 2
In the formula, xi and xj represent the potential values of the i-th and j-th samples in the study area, respectively. The I-value ranges from −1 to 1. When the I-value approaches 1, there is a significant positive correlation between the potential values in space, indicating clear spatial agglomeration. When the I-value approaches −1, there is a significant negative correlation between the potential values in space, indicating no obvious spatial agglomeration.
(2)
Local spatial autocorrelation can clearly identify the locations where spatial agglomeration occurs, reflecting the spatial patterns and variation rules of the potential for renewable energy substitution among different counties. Specifically, Moran scatter plots and LISA cluster maps can be used to conduct local autocorrelation analysis of the potential for renewable energy substitution in rural areas of Gansu Province at the county level. The Moran scatter plot, with (Wz, z) as the coordinates, is a two-dimensional graph of the data z and its spatial lag factor Wz. The Moran scatter plot divides the data points of the potential values of each county into four different quadrants, corresponding to four different spatial patterns: high–high (H-H), low–high (L-H), low–low (L-L), and high–low (H-L). Here, H (high) and L (low), respectively, indicate that the observed value is higher or lower than its average value. The LISA cluster map, composed of local Moran indices, can more intuitively reflect the significance of spatial differences and measure the spatial agglomeration among counties. The formula for the local Moran index is as follows:
I i = x i x ¯ j = 1 n W i j x j x ¯
Based on the above research methods, an evaluation and study of the temporal and spatial differences in renewable energy substitution potential at the county scale in Gansu Province were conducted.

2.2.3. Obstacle Factor Analysis Model

As an accurate analytical tool, the obstacle degree model can precisely measure the degree of obstacles of each evaluation index in a comprehensive evaluation and can effectively identify the core elements that restrict the further development of things. Meanwhile, this model has the ability to clearly sort out the significant influencing factors of the evaluation results and precisely quantify the specific impact degree of key restrictive factors. Given that rural modernization is a complex comprehensive system, the degree of influence of each factor on the system and its changes shows differences. In order to deeply study the key factors restricting the development of China’s rural and agricultural modernization, this paper conducts an obstacle factor diagnosis analysis on the rural modernization system [30]. The main calculation formulas are as follows:
D i j = 1 X i j
U i j = W i j × D i j
O i j = U i j j = 1 n U i j × 100 %
Here, Dij represents the deviation degree of the indicator, which is the extent to which a single indicator deviates from the maximum value; Uij is the factor contribution degree, reflecting the influence of a single indicator on the overall evaluation; Wij is the indicator weight, used to measure the importance of the indicator within the overall evaluation system; Oij is the obstacle degree of a specific indicator, quantifying the impact of that indicator on the modernization development of rural areas, with a larger value indicating a more significant hindrance effect on regional rural modernization; j denotes the jth specific indicator in the sequence.

2.3. Data Sources

The research separately obtained the original data of agricultural development levels, agricultural production, and natural geography-related indicators for each county and district in Gansu Province from 2010 to 2022. The main sources of the obtained data were as follows: (1) provincial and municipal statistical yearbooks, such as the “Gansu Development Yearbook” (2011–2023), “Lanzhou Statistical Yearbook”, etc.; (2) statistical bulletins of each city, district, and county, such as the “Statistical Bulletin of National Economic and Social Development of Wuwei City”, “Statistical Bulletin of Liangzhou District”, etc.; (3) authoritative literature and materials. Some of the natural geography indicators in this study were derived from relatively authoritative literature and materials, such as the “China Atlas” published by China Map Publishing House.

3. Data Processing and Analysis

3.1. Evaluation and Analysis of the Substitution Potential of Renewable Energy

3.1.1. Evaluation Index System for the Substitution Potential of Renewable Energy

For underdeveloped regions, rural areas are constrained by natural resource endowments and the foundation of agricultural development, and the available renewable energy sources are relatively limited. Therefore, biomass energy derived from agricultural organic waste and solar energy from nature are almost the only two options. In previous field visits and investigations, it was found that both at the government level and the farmer level, biomass energy and solar energy are the main renewable energy development resources in rural areas of underdeveloped regions. Therefore, this study constructed an evaluation index system for the potential for renewable energy substitution. This system is divided into three evaluation content areas, basically covering all the contents required for the evaluation of renewable energy potential: agricultural development level, renewable energy resource endowment, and natural geographical elements (Table 1).
In this system, the two evaluation content systems, agricultural development level and renewable energy resource endowment selected indicators, fully reflect the theoretical potential of renewable energy development in various regions. However, this theoretical potential will be restricted by natural geographical elements. For instance, although a certain area may have a good agricultural development level and abundant renewable energy resources, if its natural geographical environment is harsh and does not have realistic conditions for the large-scale development and utilization of renewable energy, this will limit the full play of the area’s renewable energy potential. Therefore, in the evaluation of renewable energy potential, in order to more accurately assess the actual potential of renewable energy development in various regions, the influence of natural geographical elements needs to be considered. Natural geographical elements do not change significantly in the short term, so for the convenience of calculation, it is assumed that the natural geographical elements of each region remain constant during the evaluation period.

3.1.2. Evaluation and Analysis of the Potential for Renewable Energy Substitution in Rural Areas Before and After Policy Implementation

Taking the comprehensive implementation of the rural revitalization strategy proposed by the Chinese government in 2018 as the boundary, the period from 2010 to 2017 is defined as the pre-policy period, and the period from 2018 to 2022 as the post-policy period. The average potential values within each period are calculated, respectively, and then compared and analyzed.
As can be seen from Table 2, before the full implementation of the rural revitalization strategy, the overall potential for rural energy substitution in each county was relatively low. Only Liangzhou District and Ganzhou District scored above 0.5, while most counties scored below 0.4. This indicates that before the full implementation of the rural revitalization strategy, the potential for renewable energy substitution in rural areas of Gansu Province was not fully exploited. Among them, some regions with relatively high rural economic levels, such as Minqin County and Suzhou District, failed to leverage their advantages to stimulate the potential for renewable energy substitution. Additionally, some regions with better resource endowments, such as Gannan Prefecture, were unable to fully exploit their potential due to their relatively poor rural economic levels.
As can be seen from Table 3, after the full implementation of this policy, the renewable energy substitution potential of most counties increased. The proportion of counties with rising scores reached 79.31%. Among them, Liangzhou District had the highest substitution potential score, far exceeding other counties, reaching 0.7850 after the policy was implemented. Other counties with scores higher than 0.5000 included Ganzhou District and Suzhou District (with scores reaching 0.5023 after the policy was implemented). Counties such as Minqin County, Huining County, Jingyuan County, and Jinta County all had scores between 0.4 and 0.5. Further observation reveals that these counties and districts are mainly concentrated in the central and eastern regions with higher rural economic levels, once again demonstrating the significant role of rural economic levels in stimulating the renewable energy substitution potential in these areas. Compared with other underdeveloped regions in Asia and Africa, the evidence from Gansu Province, China, is more convincing. For instance, a study in Nigeria showed that due to the long-term lack of stable financial investment, early rural biogas projects there were forced to cease operation, pushing these areas back into energy poverty [15].
This result demonstrates that with the comprehensive implementation of the rural revitalization strategy, the promotion and application of renewable energy in Gansu Province achieved remarkable results. However, in some areas, the score for the potential of renewable energy substitution has only seen a slight increase, which may be related to factors such as local resource endowment, economic conditions, the intensity of technology promotion, and policy implementation.

3.2. Analysis of the Spatio-Temporal Differences in Renewable Energy Substitution Potential Under the Background of China’s Rural Revitalization Strategy

3.2.1. Global Spatiotemporal Evolution Analysis

This study conducted a global spatio-temporal evolution analysis using the Global Moran’s Index. As shown in Figure 1, before the comprehensive implementation of the rural revitalization strategy in China, the global Moran’s Index was 0.268. However, after the policy was fully implemented, the global Moran’s Index decreased to 0.233, indicating a reduction in the spatial agglomeration of the potential for renewable energy substitution. This might imply that under the policy’s impetus, the potential for renewable energy substitution in various regions generally improved, and spatial differences narrowed, leading to a weakening of overall spatial agglomeration. Further analysis combined with the potential evaluation results reveals that before and after the policy’s implementation, the potential for renewable energy substitution in most regions significantly increased. This may be related to multiple factors such as the intensity of policy implementation, regional resource conditions, economic foundations, and technological development levels. Therefore, when formulating subsequent policies, regional differences should be fully considered, and the development and application of renewable energy should be promoted in a way that suits local conditions.

3.2.2. Local Spatio-Temporal Cluster Analysis

As shown in Figure 2, the spatial agglomeration mainly occurred in the Hexi region and Gannan region of Gansu Province. Among them, the central part of the Hexi region is a high–high agglomeration area (H-H), where several counties with the highest potential for rural renewable energy substitution are concentrated, such as Liangzhou District and Minqin County. The rural economic development level in these areas is relatively high, and it can be initially seen that the agricultural development level has a positive impact on the potential for renewable energy substitution in this region. Other less developed economies in Asia also exhibit similar characteristics, showing a positive correlation between higher economic levels and renewable energy consumption, which further emphasizes the importance of diversifying the energy mix [7]. The Gannan region, on the other hand, is the largest low–low agglomeration area (L-L), with overall potential values being relatively low. It is worth noting that the Gannan region is not lacking in renewable energy resources, having relatively abundant biomass energy resources from animal husbandry and sufficient solar energy resources. Therefore, the main reason for the weak potential for renewable energy substitution in the Gannan region may be the level of agricultural development and natural geographical conditions. In addition, high–low agglomeration areas (H-L) and low–high agglomeration areas (L-H) are scattered in the northern and central parts of the Hexi region.

3.3. Obstacle Factor Analysis

This study utilized Formulas (15)–(17) and employed a county-level panel dataset of Gansu Province from 2013 to 2022 to calculate the factor obstacle degree. Subsequently, the average of the factor obstacle degrees for each criterion layer was taken to obtain the overall criterion layer obstacle degree. The dynamic changes in the obstacle factors of the region’s renewable energy substitution potential during this decade are depicted in Figure 3.
(1)
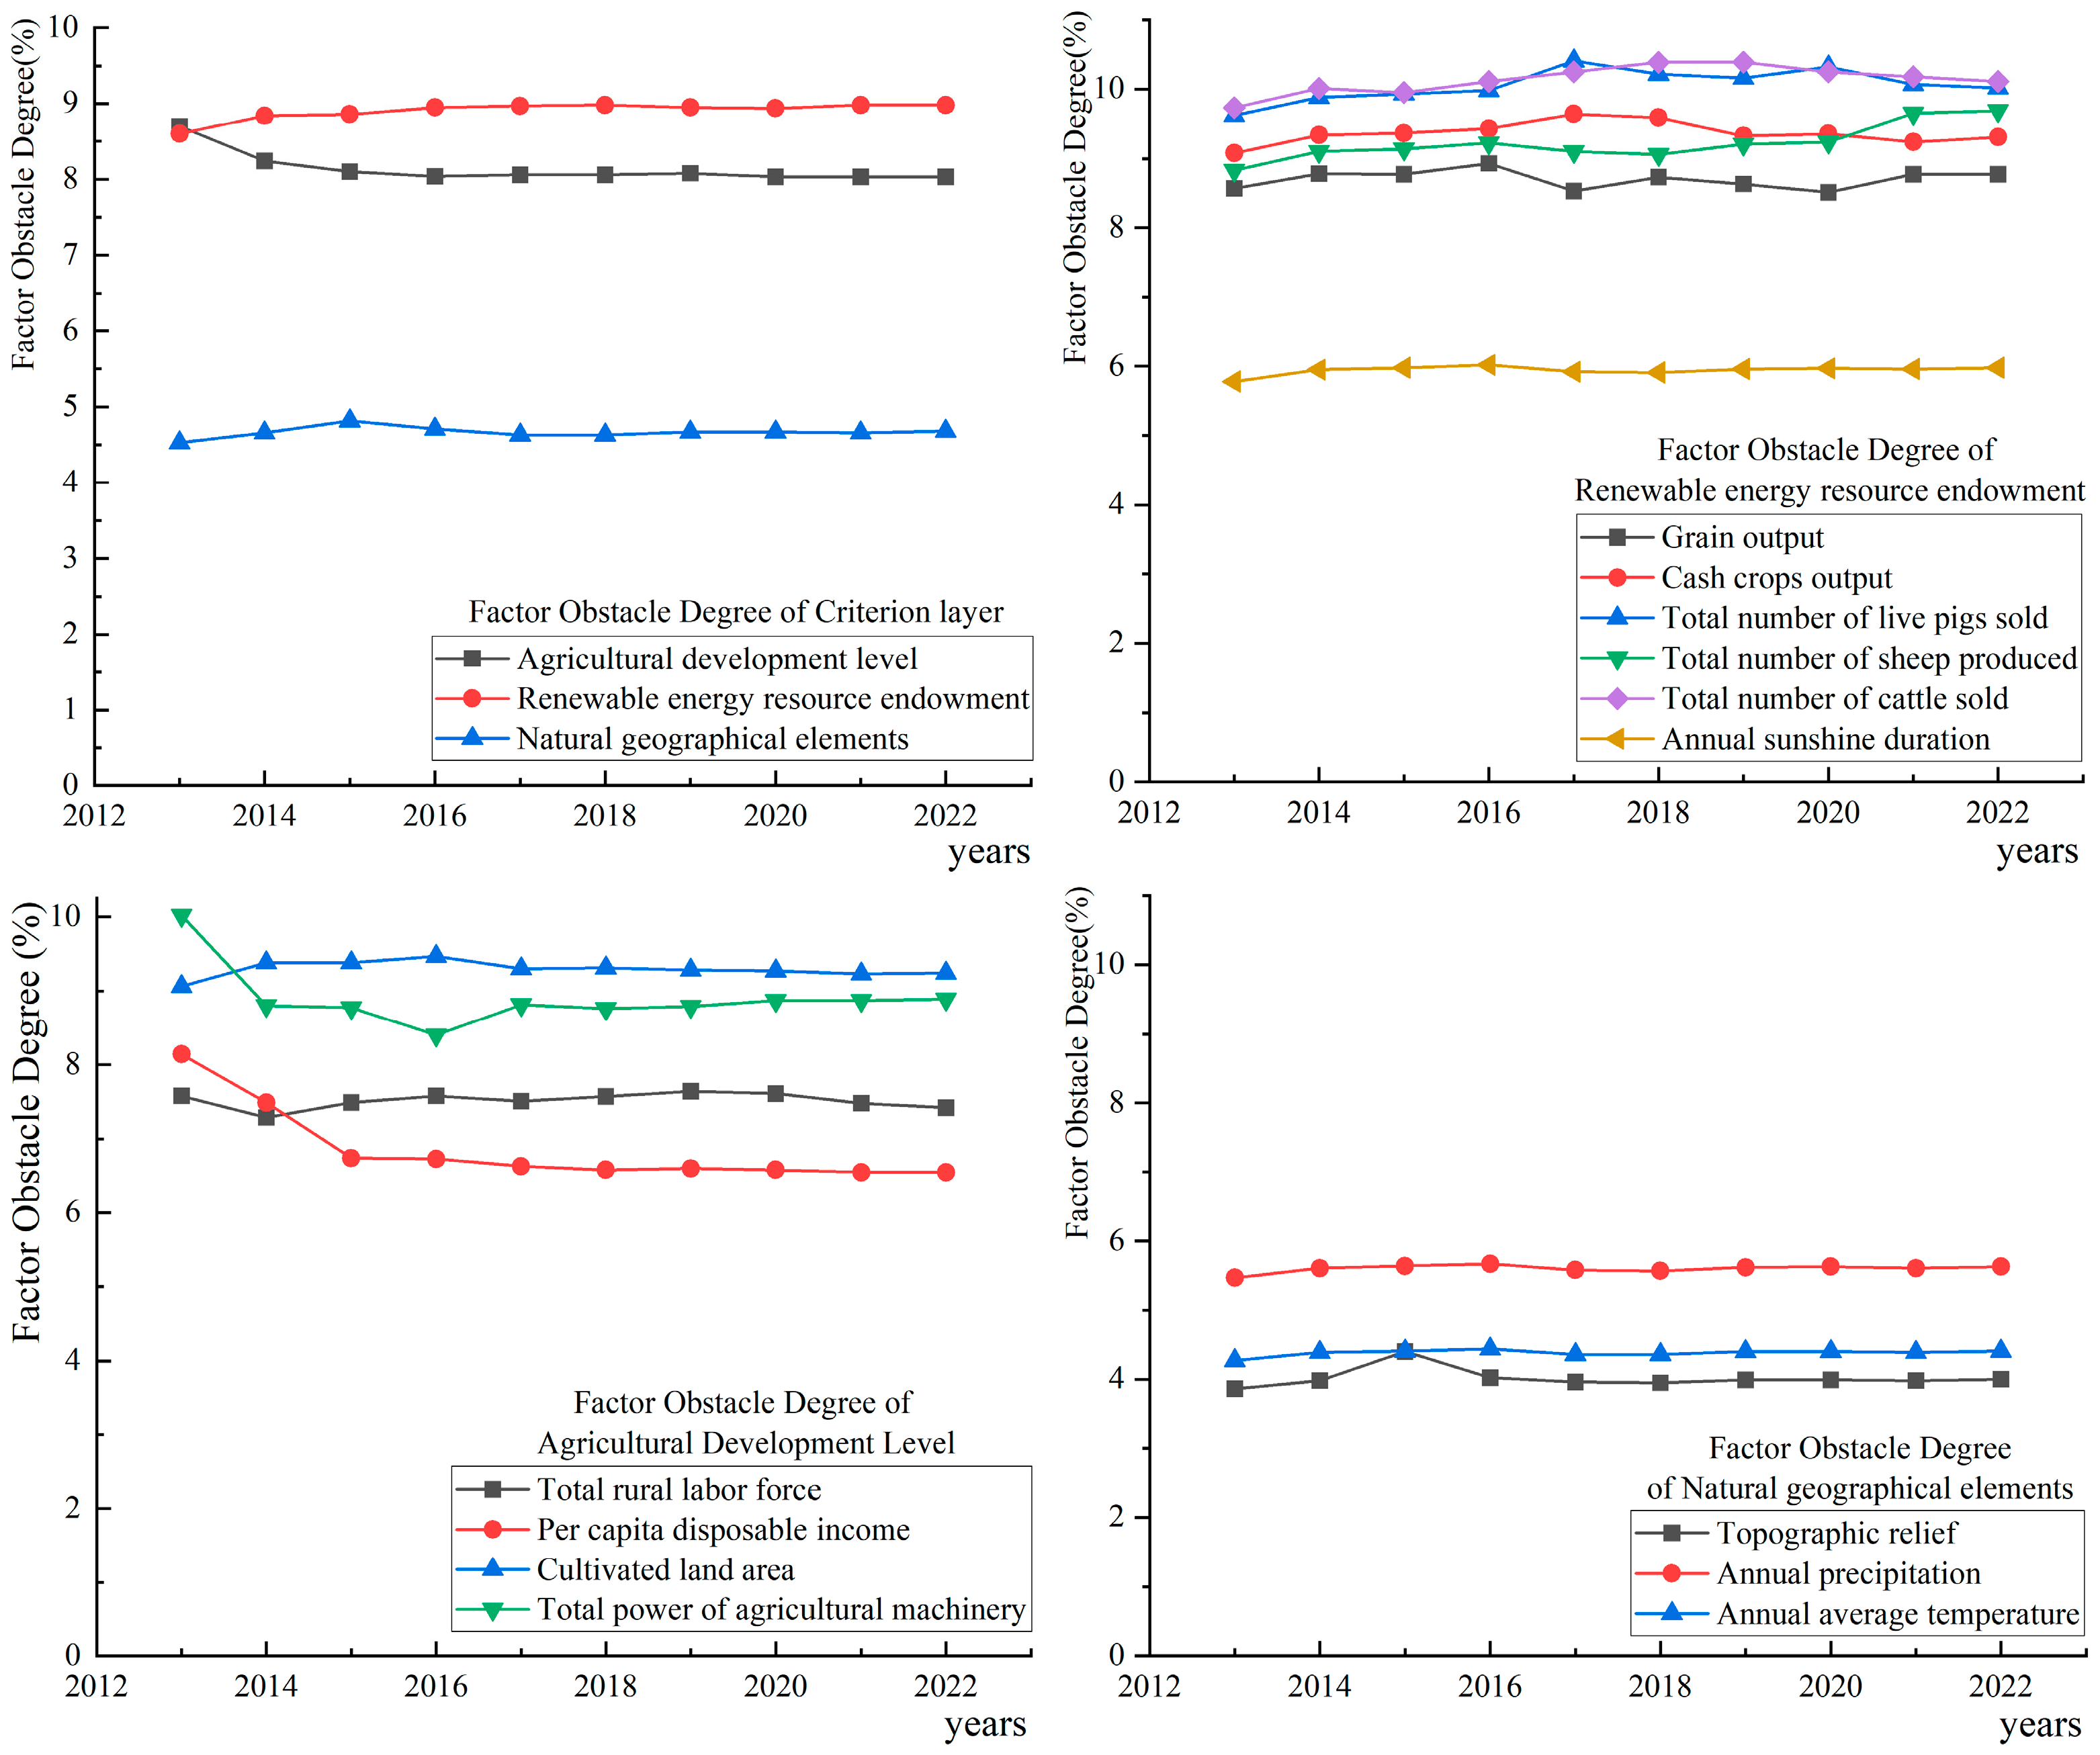
Criterion layer indicators’ degree of obstacle
The average obstacle degree of the criteria layer, from high to low, is as follows: renewable energy resource endowment, agricultural development level, and natural geographical elements. Among them, the renewable energy resource endowment constitutes the greatest obstacle, with an average obstacle degree of 8.91%, and shows an upward trend. The second is the agricultural development level, with an average obstacle degree of 8.14%, showing a downward trend. The obstacle degree of natural geographical elements is the lowest, with an average obstacle degree of only 4.67%, and it has remained relatively stable over the past 10 years. Summarizing the reasons, the renewable energy resource endowment has become the main obstacle, which may be related to factors such as uneven resource distribution, high technical development difficulty, high investment costs, and insufficient policy support. The uneven distribution of resources limits the development of renewable energy in some areas; technical difficulties increase development costs, and insufficient investment reflects inadequacies at both the market and policy levels. Additionally, the discontinuity and instability of policy support also pose challenges to the sustainable development of renewable energy. The decline in the obstacle degree of the agricultural development level may be related to improvements in the economic level in rural areas, infrastructure, and the popularization of renewable energy technology. As for natural geographical elements, due to the relatively stable geographical conditions, the obstacle degree has not changed much, but its impact on the development of renewable energy cannot be ignored, especially in areas with complex terrain or harsh climate conditions.
(2)
Factors’ Obstacle Degree
In the criterion layer of agricultural development level, the factor with the highest obstacle degree is the effective irrigated area, with an average obstacle degree of 9.29%, and its annual changes are relatively stable. The second is the total power of agricultural machinery, with an average obstacle degree of 8.90%. This factor exhibits significant fluctuations. Before 2017, the gap in the obstacle degree between it and the effective irrigated area was large; however, after 2018, this gap gradually narrowed. The average obstacle degree of the rural population is 7.52%, ranking third, and its inter-annual changes are relatively stable. The per capita disposable income of rural residents has the smallest average obstacle degree at 6.82%. This factor experienced significant fluctuations initially but later stabilized. These results indicate that, as key factors, the stability of the obstacle degrees of the effective irrigated area and the total power of agricultural machinery underscores the importance of improving and upgrading agricultural infrastructure to enhance agricultural productivity. Furthermore, the improvement in agricultural productivity contributes to the development capacity of rural renewable energy, thereby enhancing the potential for energy substitution. Although the rural population’s obstacle degree ranks third, its stability suggests that the impact of population structure on agricultural development is relatively minor. The lowest obstacle degree of the per capita disposable income of rural residents indicates that, with the development of the rural economy, the constraining effect of improving residents’ income levels on agricultural development is diminishing. These findings comprehensively reveal the potential impact of the level of agricultural development on the development of renewable energy.
At the resource endowment criterion level, the factor obstacle degrees of biomass energy resource endowments, such as grain output, economic crop output, and livestock and poultry output, are relatively high, with an average obstacle degree exceeding 8.00%. In contrast, the factor obstacle degree of annual sunshine duration is relatively low, with an average obstacle degree of only 5.94%. This reflects the prominent advantages of biomass energy resources in underdeveloped rural areas, which may be related to the maturity of biomass energy conversion technology, costs, and the extent of biomass energy utilization popularization in rural areas. Therefore, targeted policies and measures can be formulated to address the weak potential for energy substitution in underdeveloped rural areas by promoting the rational development and utilization of renewable energy resources in rural areas.
In the natural geographic element criterion layer, the average obstacle degree of each factor is generally low, with all below 6%. Among them, the average obstacle degree of annual precipitation is 5.60%, that of annual average temperature is 4.38%, and that of terrain undulation degree is 4.01%. This result shows that the natural geographic conditions have relatively limited constraints on the potential for rural renewable energy substitution. However, these factors still need attention to ensure the adaptability and sustainability of the renewable energy development plan. For example, the amount of annual precipitation may affect agricultural production, while the annual average temperature may affect the utilization efficiency of solar energy. The terrain undulation degree is directly related to the construction cost and layout of renewable energy facilities. Therefore, although the obstacle degrees of these natural geographic factors are not high, they may become key limiting factors in specific circumstances and need to be carefully evaluated and addressed in the project planning and implementation process.

4. Conclusions and Recommendations

4.1. Conclusions

The renewable energy substitution potential scores of most counties in Gansu Province are below 0.5000, indicating a relatively low overall development level. This is related to the poor agricultural ecological environment and weak agricultural foundation in the province. Liangzhou District in Wuwei City has the highest score, with 0.7410 before the policy and 0.7850 after, far exceeding other counties. Ganzhou District and Suzhou District also have scores above 0.5000, while Minqin County, Huining County, Jingyuan County, and Jinta County have scores between 0.4 and 0.5. These counties are mainly located in the central and eastern parts of Gansu Province. After the policy, the renewable energy substitution potential of 69 counties improved, accounting for 79.31% of the total, indicating that the development of renewable energy achieved results under the support of the rural revitalization strategy and policies. However, in some areas, the development capacity was not significantly enhanced due to factors such as resource limitations, economic conditions, technology promotion, and policy implementation.
Before the comprehensive implementation of the rural revitalization strategy in China, the global Moran’s Index was 0.268. However, after the policy was fully implemented, the global Moran’s Index dropped to 0.233, indicating a decline in the spatial agglomeration of renewable energy substitution potential. Spatial agglomeration mainly occurred in the Hexi region and Gannan region of Gansu Province. Specifically, the central part of the Hexi region formed a high–high agglomeration area (H-H), while the Gannan region constituted the largest low–low agglomeration area (L-L), with overall potential values being relatively low. However, the Gannan region does not lack in renewable energy resources. The weak potential for renewable energy substitution may primarily be attributed to the level of agricultural development and natural geographical conditions. Additionally, high–low agglomeration areas (H-L) and low–high agglomeration areas (L-H) were scattered in the northern and central parts of the Hexi region.
Renewable energy resource endowment is the main obstacle at the criterion level, with an average obstacle degree of 8.91%, showing an upward trend. The agricultural development level ranks second, with an average obstacle degree of 8.14%, exhibiting a downward trend. The obstacle degree of natural geographical elements is the lowest, averaging 4.67%, with a relatively stable trend. The primary reasons lie in the uneven distribution of resources, the challenges of technological development, high investment costs, and insufficient policy support. Additionally, the decline in the obstacle degree of the agricultural development level may be related to improvements in the rural economy, infrastructure, and technology dissemination. The influence of natural geographical elements on the development of renewable energy cannot be ignored. The factor obstacle degree analysis results indicate that within the agricultural development level, the effective irrigated area and the total power of agricultural machinery are the main obstacle factors, with stable average obstacle degrees of 9.29% and 8.90%, respectively, which vary significantly. In the resource endowment criterion level, the obstacle degrees of biomass energy resource endowments such as grain output, economic crop output, and livestock and poultry output are relatively high, while the obstacle degree of annual sunshine duration is relatively low. Obstacle factors in the natural geographical elements criterion level are generally low, with average obstacle degrees for annual precipitation, annual average temperature, and terrain undulation all below 6%. Although natural geographical conditions have a limited restrictive effect on the potential of rural renewable energy substitution, they may become key limiting factors under specific circumstances and need to be evaluated and addressed in project planning and implementation.

4.2. Recommendations

4.2.1. Coordinating and Integrating Efforts to Promote Collaborative Enhancement of Renewable Energy Substitution Capacity Among Regions

The conclusion of this study shows that the imbalance in regional development is one of the main issues currently hindering the potential of renewable energy substitution in Gansu Province. To address this issue, efforts should focus on overall coordination and promoting the coordinated development of different regions. (1) Identify regions with high theoretical and practical development capabilities for renewable energy and designate them as development poles to drive the development of surrounding regions with lower development capabilities, ultimately achieving coordinated development. Specifically, pilot projects for renewable energy development can be initially established in high-value regions. Through these pilot projects, experience can be accumulated, problems can be identified and resolved, and then projects can be gradually extended to low-value regions based on this foundation. (2) Actively introduce modern agricultural production technologies, promote intensive farming, and enhance the level of agricultural mechanization. Modern agricultural production technologies can not only boost agricultural productivity and increase renewable energy resource reserves but also facilitate the collection and centralized processing of renewable energy and the local consumption of agricultural organic waste. (3) Develop circular agriculture and promote the construction of ecological agriculture. Ecological agriculture is a modern and efficient agricultural development model that comprehensively considers economic, environmental, and social benefits. Circular agriculture is an important component of ecological agriculture. For example, the typical “pig-methane-fruit” project is a relatively common circular ecological agricultural model. This model can fully leverage the advantages of renewable energy and achieve the goals of “low extraction, high utilization, low emission, and recycling.” It not only improves the utilization efficiency of renewable energy but also generates ideal economic, environmental, and social benefits.

4.2.2. Taking into Account the Local Agricultural Development Level and the Endowment of Renewable Energy Resources, an Appropriate Scale and Mode of Development Should Be Selected

Given the high barriers posed by the current levels of agricultural development and renewable energy resource endowments, policymakers in this region should first follow the principle of acting within their capabilities. That is to say, policymakers should fully consider the local agricultural development levels and renewable energy resource endowments and should appropriately choose the scale and mode of development. For instance, if the local area has relatively abundant reserves of renewable energy resources but the income level of rural residents is low and their consumption capacity for commercial energy is limited, more commercial renewable energy development projects can be selected. On the one hand, this can make full use of the local abundant renewable energy resources; on the other hand, these commercial projects can increase the income of local farmers. Gradually, as the income level of farmers rises, they will be able to freely choose commercial energy and then further layout development projects with a public service nature. Of course, if a local area does not have abundant reserves of renewable energy resources but has a good economic development situation and a relatively high income level of farmers, there will be an urgent need for a centralized supply of living energy. Modern rural communities can be built by taking advantage of the favorable local economic development situation, and farms and plantations can subsequently be established near these communities. On the one hand, organic waste from farms and plantations can be utilized to develop renewable energy, and large- and medium-sized biomass energy projects as well as solar photovoltaic projects can be deployed to provide stable and clean living energy for community residents; on the other hand, this approach can meet the daily life needs of community residents while also creating employment opportunities for the surplus labor force in the community, thereby increasing the income potential for rural community residents and improving their living standards.

Author Contributions

Conceptualization, S.Z.; Methodology, S.Z.; Software, S.Z. and M.S.; Validation, S.Z.; Formal analysis, S.Z.; Investigation, S.Z. and M.S.; Resources, S.Z. and M.S.; Data curation, S.Z. and M.S.; Writing—original draft, S.Z. and M.S.; Writing—review & editing, S.Z.; Visualization, S.Z.; Supervision, S.Z.; Project administration, S.Z.; Funding acquisition, S.Z. and M.S. All authors have read and agreed to the published version of the manuscript.

Funding

This research was funded by the Gansu Science and Technology Program of the Gansu Provincial Science and Technology Department: Research on Spatial Resource Mismatch and Reconstruction Strategies for Rural Biomass Energy Development in underdeveloped areas (No.23JRRA879). The Gansu Provincial Philosophy and Social Sciences Planning Project on “Study on Enhancing the Quality of Farmer Professional Cooperatives in Gansu Province” (No. 2023QN009).

Institutional Review Board Statement

Not applicable.

Informed Consent Statement

Not applicable.

Data Availability Statement

The data used in this study are derived from open public statistical sources, such as the China Statistical Yearbook and the Gansu Statistical Yearbook. If necessary, the complete original dataset can be provided.

Acknowledgments

The valuable guidance and assistance provided by the team members during the research process have made significant contributions to the completion of this study.

Conflicts of Interest

The authors declare no conflicts of interest. Those who funded this research had no role in the study design, data collection, analyses, data interpretation, writing of the manuscript, or decision to publish the results.

Nomenclature

AcronymInterpretation
G7An annual summit of seven major industrial nations—the United States, the United Kingdom, France, Germany, Japan, Italy, and Canada—that discusses major issues of common concern.
GWhA GWh (gigawatt-hour) is equivalent to 1 billion watt-hours, which is the same as 1 million kilowatt-hours of electricity.
MtceA unit of energy measurement: one million tons of standard coal.
TOPSISTechnique for Order Preference by Similarity to Ideal Solution Model
IEWInformation Entropy Weight method
CNYThe Chinese currency “yuan”.

References

  1. Lu, Y.; Zhang, Y.; Ma, K. The effect of population density on the suitability of biomass energy development. Sustain. Cities Soc. 2022, 87, 104240. [Google Scholar] [CrossRef]
  2. Ahmed, B.; Wahab, S.; Rahim, S.; Imran, M.; Khan, A.A.; Ageli, M.M. Assessing the impact of geopolitical, economic, and institutional factors on China’s environmental management in the Russian-Ukraine conflicting era. J. Environ. Manag. 2024, 356, 120579. [Google Scholar] [CrossRef] [PubMed]
  3. Obaideen, K.; Abdelkareem, M.A.; Wilberforce, T.; Elsaid, K.; Sayed, E.T.; Maghrabie, H.M.; Olabi, A.G. Biogas role in achievement of the sustainable development goals: Evaluation, Challenges, and Guidelines. J. Taiwan Inst. Chem. Eng. 2022, 131, 104207. [Google Scholar] [CrossRef]
  4. Liu, Z.; Saydaliev, H.B.; Lan, J.; Ali, S.; Anser, M.K. Assessing the effectiveness of biomass energy in mitigating CO2 emissions: Evidence from Top-10 biomass energy consumer countries. Renew. Energy 2022, 191, 842–851. [Google Scholar] [CrossRef]
  5. Bilandzija, N.; Voca, N.; Jelcic, B.; Jurisic, V.; Matin, A.; Grubor, M.; Kricka, T. Evaluation of Croatian agricultural solid biomass energy potential. Renew. Sustain. Energy Rev. 2018, 93, 225–230. [Google Scholar] [CrossRef]
  6. Imran, M.; Alam, S.; Zhang, J.; Ozturk, I.; Wahab, S.; Doğan, M. From resource curse to green growth: Exploring the role of energy utilization and natural resource abundance in economic development. In Natural Resources Forum; Blackwell Publishing Ltd.: Oxford, UK, 2024. [Google Scholar]
  7. Imran, M.; Tufail, M.; Mo, C.; Wahab, S.; Khan, M.K.; Hoo, W.C.; Ling, Z. From resources to resilience: Understanding the impact of standard of living and energy consumption on natural resource rent in Asia. Energy Strat. Rev. 2025, 57, 101590. [Google Scholar] [CrossRef]
  8. Wang, W.; Imran, M.; Ali, K.; Sattar, A. Green policies and financial development in G7 economies: An in-depth analysis of environmental regulations and green economic growth. In Natural Resources Forum; Blackwell Publishing Ltd.: Oxford, UK, 2024. [Google Scholar]
  9. Long, H.; Li, X.; Wang, H.; Jia, J. Biomass resources and their bioenergy potential estimation: A review. Renew. Sustain. Energy Rev. 2013, 26, 344–352. [Google Scholar] [CrossRef]
  10. Rosas-Flores, J.A.; Zenón-Olvera, E.; Gálvez, D.M. Potential energy saving in urban and rural households of Mexico with solar photovoltaic systems using geographical information system. Renew. Sustain. Energy Rev. 2019, 116, 109412. [Google Scholar] [CrossRef]
  11. Ozturk, M.; Saba, N.; Altay, V.; Iqbal, R.; Hakeem, K.R.; Jawaid, M.; Ibrahim, F.H. Biomass and Bioenergy: An Overview of the development potential in Turkey and Malaysia. Renew. Sustain. Energy Rev. 2017, 79, 1285–1302. [Google Scholar] [CrossRef]
  12. Suzuki, K.; Tsuji, N.; Shirai, Y.; Hassan, M.A.; Osaki, M. Evaluation of biomass energy potential towards achieving sustainability in biomass energy utilization in Sabah, Malaysia. Biomass Bioenergy 2017, 97, 149–154. [Google Scholar] [CrossRef]
  13. Hong, Z. Assessment of Energy Consumption and Energy-saving Potential of Clean and Renewable Energy in Rural Households in China. Ph.D. Thesis, Lanzhou University, Lanzhou, China, 2020. [Google Scholar]
  14. Zhao, W.; Deng, J.; Chi, S.; Wang, W.; Xu, L.; Huang, Q.; Zhang, Y.; Yu, X.; Xu, J.; Chen, Y.; et al. Sustainability assessment of topsoil ecology in Chongqing, China based on the application of livestock and poultry manure. J. Clean. Prod. 2022, 358, 131969. [Google Scholar] [CrossRef]
  15. Emezirinwune, M.U.; Adejumobi, I.A.; Adebisi, O.I.; Akinboro, F.G. Synergizing hybrid renewable energy systems and sustainable agriculture for rural development in Nigeria. e-Prime-Adv. Electr. Eng. Electron. Energy 2024, 7, 100492. [Google Scholar] [CrossRef]
  16. Chen, Q.; Liu, T. Biogas system in rural China: Upgrading from decentralized to centralized? Renew. Sustain. Energy Rev. 2017, 78, 933–944. [Google Scholar] [CrossRef]
  17. Imran, M.; Jijian, Z.; Sharif, A.; Magazzino, C. Evolving waste management: The impact of environmental technology, taxes, and carbon emissions on incineration in EU countries. J. Environ. Manag. 2024, 364, 121440. [Google Scholar] [CrossRef]
  18. Zhu, Y.; Taylor, D.; Wang, Z. The role of renewable energy in reducing residential fossil energy-related CO2 emissions: Evidence from rural China. J. Clean. Prod. 2022, 366, 132891. [Google Scholar] [CrossRef]
  19. Sy, S.A.; Mokaddem, L. Energy poverty in developing countries: A review of the concept and its measurements. Energy Res. Soc. Sci. 2022, 89, 102562. [Google Scholar] [CrossRef]
  20. Wang, Y.; Wu, Y.; Wang, C.; Li, L.; Lei, Y.; Wu, S.; Qu, Z. The impact of energy poverty on the health and welfare of the middle-aged and older adults. Front. Public Health 2024, 12, 1404014. [Google Scholar] [CrossRef]
  21. Li, K.; Jiang, R.; Qiu, J.; Liu, J.; Shao, L.; Zhang, J.; Liu, Q.; Jiang, Z.; Wang, H.; He, W.; et al. How to control pollution from tailwater in large scale aquaculture in China: A review. Aquaculture 2024, 590, 741085. [Google Scholar] [CrossRef]
  22. Xue, S.; Song, J.; Wang, X.; Shang, Z.; Sheng, C.; Li, C.; Zhu, Y.; Liu, J. A systematic comparison of biogas development and related policies between China and Europe and corresponding insights. Renew. Sustain. Energy Rev. 2020, 117, 109474. [Google Scholar] [CrossRef]
  23. uz Zaman, Q.; Zhao, Y.; Zaman, S.; Alenezi, M.; Jehan, N. Spatial evaluation of multidimensional energy poverty between farming and non-farming communities of agroclimatic zones of Pakistan. Energy Policy 2023, 172, 113294. [Google Scholar] [CrossRef]
  24. Loganathan, V.; Ravikumar, D.; Kesavan, R.; Venkatesan, K.; Saminathan, R.; Kannadasan, R.; Sudhakaran, M.; Alsharif, M.H.; Geem, Z.W.; Hong, J. A Case Study on Renewable Energy Sources, Power Demand, and Policies in the States of South India—Development of a Thermoelectric Model. Sustainability 2022, 14, 8882. [Google Scholar] [CrossRef]
  25. Sumiyati, S.; Samadikun, B.P.; Widiyanti, A.; Budihardjo, M.A.; Al Qadar, S.; Puspita, A.S. Life cycle assessment of agricultural waste recycling for sustainable environmental impact. Glob. J. Environ. Sci. Manag. 2024, 10, 907. [Google Scholar]
  26. Lise, S.; Ida, G.J. Recent trends in biogas value chains explained using cooperative game theory. Energy Econ. 2018, 8, 503–522. [Google Scholar]
  27. Bathala, R.; Hrishikheshan, G.; Rajkumar, S.; Jeyaseelan, T. Experimental investigation, ANN modeling, and TOPSIS optimization of gasoline-alcohol blends for minimizing tailpipe emissions of a motorcycle. Energy 2024, 293, 130698. [Google Scholar] [CrossRef]
  28. Yazdani, M.; Gonzalez ED, R.S.; Chatterjee, P. A multi-criteria decision-making framework for agriculture supply chain risk management under a circular economy context. Manag. Decis. 2021, 59, 1801–1826. [Google Scholar] [CrossRef]
  29. Song, G.; Zhong, S.; Song, L. Spatial Pattern Evolution Characteristics and Influencing Factors in County Economic Resilience in China. Sustainability 2022, 14, 8703. [Google Scholar] [CrossRef]
  30. Ding, S.; Fan, Z. Spatiotemporal Evolution and Obstacle Factor Analysis of Coupling Coordination Between Economic Resilience and Green, Low-Carbon Development in China. Sustainability 2024, 16, 11006. [Google Scholar] [CrossRef]
Figure 1. Scatter plot of the global Moran’s index.
Sustainability 17 01315 g001
Figure 2. Local spatial clustering map.
Sustainability 17 01315 g002
Figure 3. Graph of the marginal effect trend of women’s economic empowerment probability at different income levels.
Sustainability 17 01315 g003
Table 1. Evaluation index system for the substitution potential of renewable energy.
ObjectiveCriterion LayerFactor LayerCriterion Attribute
The substitution potential of renewable energyRural development levelTotal rural labor force (persons)The total population with agricultural household registration is significant.
Per capita disposable income of farmers (CNY)It is obtained by dividing the total disposable income of farmers by the total rural registered population.
Cultivated land area (hectares)It is obtained by dividing the total area of cultivated land by the total population.
Total power of agricultural machinery (kW)The total power of all kinds of power machinery used in agriculture, forestry, animal husbandry, and fishery.
Renewable energy resource endowmentGrain output
(10,000 tons)
The total annual output of grain crops, such as wheat, rice, and corn.
Cash crops output (10,000 tons)The total annual output of economic crops, including fruits, vegetables, and medicinal materials.
Total number of live pigs sold (10,000 head)The total annual output of live pigs from breeding.
Total number of sheep produced (10,000 head)The total annual output of sheep raised for meat.
Total number of cattle sold (10,000 head)The total annual output of beef cattle for sale.
Annual sunshine duration (hours)The total annual duration of sunshine, measured in hours.
Natural geographical elementsTopographic relief (m)The absolute difference between the highest and lowest altitudes in this region.
Annual precipitation (mm)The depth of all precipitation that accumulates on a horizontal surface within a year, without considering evaporation, infiltration, or runoff.
Annual average temperature (°C)The average temperature over the course of a year.
Table 2. Potential for rural energy substitution prior to the comprehensive implementation of the rural revitalization strategy (2010–2017).
AreaScoreRankAreaScoreRankAreaScoreRank
Liang Z0.74101Jing N0.309030Xi G0.265159
Gan Z0.51572Mai J0.308131Lin XX0.263860
Su Z0.46783Qing C0.307832Xi H0.262461
Min Q0.45204Zhuang L0.305533Cheng0.262162
Hui N0.44125Tong W0.302034Jin C0.258263
Jing Y0.40036Gua Z0.297735Qi LH0.257464
Jin T0.39647Shan D0.297136Bai Y0.252565
Zhen Y0.37218Dong X0.296737Kang0.248666
Kong T0.36949Qin Z0.294838Yong J0.246967
Lin T0.360210Qing S0.291639Lu Q0.243668
Ning0.360111Ma Q0.289540Su N0.240369
Huan0.356512Li0.289241Jia YG0.239770
Gu L0.355113Zheng N0.289042Xia H0.236871
An D0.347614Wu D0.288443Ji SS0.235372
Yong C0.341215Cheng G0.286144He Z0.234273
Jing C0.340616Yu M0.285245Tian Z0.230074
Lin Z0.340117Hong G0.283246Dang C0.227675
Gan G0.336318He S0.282947Liang D0.225976
Dun H0.333519Chong X0.281048Ping C0.224577
Lin Tao0.331620Min0.278649An N0.214278
Jing T0.330921Hua C0.270750Wen0.211679
Qin A0.330122Hui0.270751Lin Tan0.210380
Yong D0.325223Guang H0.270152Zhang0.207281
Wu S0.324424Lin XS0.268653Zhuo N0.205282
Yu Z0.318625Kang L0.268254He Z0.198383
Min L0.316826Wei Y0.268155Su B0.193084
Gao T0.316827Zhang JC0.267456Die B0.188085
Long X0.311328Hua T0.267057Zhou Q0.185486
Xi F0.311129Gao L0.266258A KS0.174287
Note: Area represents the names of each county-level administrative unit in Gansu Province; value indicates the renewable energy substitution potential value of each county; rank represents the ranking of each county’s renewable energy substitution potential.
Table 3. Potential for rural energy substitution following the full implementation of the rural revitalization strategy (2018–2022).
AreaScoreRankAreaScoreRankAreaScoreRank
Liang Z0.78501Dun H0.315830Lin XS0.269059
Gan Z0.53532Gua Z0.313831Xi H0.267360
Su Z0.50233Qin Z0.310832Gao L0.266061
Min Q0.48814Jing C0.309633Cheng0.263462
Hui N0.47445Tong W0.308634Qi LH0.261163
Jing Y0.43756Dong X0.306835Xi G0.259664
Jin T0.42507Qing C0.305536Bai Y0.256065
Gu L0.41378Xi F0.305037Lu Q0.253966
Huan0.39569Ma Q0.300238Yong J0.248867
Zhen Y0.395110Hua T0.300039Jia YG0.245968
Yong C0.382811Yu M0.296940Su N0.245869
Ning0.373312Wu D0.292841Xia H0.245770
An D0.362113Zheng N0.289742Kang0.244571
Lin Z0.360314Qing S0.288343Ping C0.242172
Lin Tao0.354915Li0.288344Tian Z0.241773
Min L0.347116He S0.287845Ji SS0.239974
Kong T0.345617Chong X0.284246He Z0.236675
Jing T0.344518Guang H0.281547Dang C0.225176
Gan G0.341019Min0.280148Lin Tan0.217977
Wu S0.340520Zhang JC0.279549Zhuo N0.217878
Qin A0.331521Cheng G0.278850Liang D0.217179
Gao T0.329622Jin C0.278751Wen0.213780
Mai J0.328623Kang L0.278352Zhang0.212481
Shan D0.325124Hui0.278253He Z0.206082
Yong D0.325125Wei Y0.277054Su B0.201983
Yu Z0.324326Hua C0.275655Die B0.198284
Long X0.324027Hong G0.273856Zhou Q0.192785
Ling T0.323528Lin XX0.273657An N0.189186
Zhuang L0.321629Jing N0.270758A KS0.181287
Disclaimer/Publisher’s Note: The statements, opinions and data contained in all publications are solely those of the individual author(s) and contributor(s) and not of MDPI and/or the editor(s). MDPI and/or the editor(s) disclaim responsibility for any injury to people or property resulting from any ideas, methods, instructions or products referred to in the content.

