Article

Spatial Distribution Patterns, Eco-Environmental Risk Assessment, and Human Health Impacts of Uranium and Thorium in Beach Sediments in the Central Gulf of Gabes (Southern Mediterranean Sea)

by
Radhouan Belgacem El Zrelli
1,*,
Jessica K. Klar
2,
Sylvie Castet
3,
Michel Grégoire
3,
Pierre Courjault-Radé
3 and
Sébastien Fabre
4
1
Independent Researcher & International Environmental Consultant, 31400 Toulouse, France
2
Université Paris-Saclay, Centre National de la Recherche Scientifique (CNRS), Laboratoire Interdisciplinaire des Sciences du Numérique (LISN), 91400 Orsay, France
3
Géosciences Environnement Toulouse (GET), Université de Toulouse, UMR 5563 Centre National de la Recherche Scientifique (CNRS)/Université Paul Sabatier (UPS)/Institut de Recherche pour le Développement (IRD)/Centre National d’Etudes Spatiales (CNES), 14 Avenue Edouard Belin, 31400 Toulouse, France
4
Institut de Recherche en Astrophysique et Planétologie, Université de Toulouse, 14 Avenue Edouard Belin, 31400 Toulouse, France
*
Author to whom correspondence should be addressed.
Sustainability 2025, 17(3), 1283; https://doi.org/10.3390/su17031283
Submission received: 2 November 2024 / Revised: 4 January 2025 / Accepted: 21 January 2025 / Published: 5 February 2025

Abstract

:
This study investigates uranium (U) and thorium (Th) levels in surface beach sediments from the Central Gulf of Gabes (SE Tunisia), aiming to identify concentration zones, geochemical behaviors, and enrichment factors. U concentrations ranged from 0.71 to 38.00 mg/kg, exceeding Th levels, which ranged from 1.00 to 10.60 mg/kg. A positive correlation between U and Th indicates a common source, which is most likely phosphogypsum wastes, and similar geochemical behaviors. The central sector near Gabes’ fertilizer factories showed the highest U and Th concentrations, with factors such as proximity to industrial discharge, port structures’ influence, organic matter enrichment, low seawater pH, and high phosphorus levels affecting the spatial distribution of these elements. Thermochemical analysis suggests that U and Th exhibit parallel chemical behaviors in low-pH, phosphate-rich conditions. This is the first study to document U and Th presence in phosphogypsum-contaminated beach sediments in Gabes, underlining potential risks to the environment and human health. The findings of this work contribute to the international database of U and Th contamination in coastal sediments, providing essential data to support sustainable strategies aimed at safeguarding human health and preserving local environments affected by phosphate fertilizer industry pollution.

1. Introduction

In several Mediterranean phosphate-producing countries such as Spain, Morocco, Algeria, Lebanon, and Tunisia, fertilizer plants have been established in the coastal zone for several reasons, such as the availability of economic labor and ability to export large quantities of industrial products by sea, but also due to the facility to discharge the industrial wastes directly into the sea (e.g., Gabes (Tunisia [1]), Annaba (Algeria [2]), El Jadida, Jorf Lasfar, and Safi (Morocco [3,4]), and Batroun (Lebanon [5])). These industries generally use phosphate ores (PO; Ca10(PO4)6F2) to produce the phosphoric acid (PA; H3PO4) by sulfuric acid (SA; H2SO4) wet process [6]. This low-cost dihydrate wet phosphoric acid process (Equation (1)) is known for its high pollution potential, as it generates two by-products: hydrogen fluoride (HF) and phosphogypsum (PG; CaSO4·2H2O).
Ca10 (PO4)6 F2 + 10H2SO4 + 20H2O → 6H3PO4 + 10(CaSO4·2H2O) + 2HF
PG is considered an environmental and human health hazardous industrial radiochemical waste [6]. It contains several impurities that pose environmental concerns, such as heavy metals (e.g., As, Cd, Cr, Cu, Zn, Pb, and Hg), rare earth elements (e.g., Ce, Y, La, Nd, Pr, Sm, and Gd), and naturally occurring radionuclides of the uranium (U) and thorium (Th) series like 226Ra, 238U, 232Th, 210Pb, 222Rn, and 210Po [6,7,8,9,10,11,12,13,14]. According to Rutherford et al. [7], the production of 1 ton of PA produces nearly 5.1 tons of PG. While PG wastes are stored in stockpiles in some countries, such as in Tunisia [15,16,17]), Spain [18,19,20], China [21,22,23], USA [24,25,26], Brazil [27,28,29], Canada [30,31,32], South Africa [33,34,35], Cyprus [36,37,38], and Jordan [39,40,41], these toxic radiochemical wastes are directly discharged in the marine environment in many other countries, as explained beforehand (Tunisia (Gabes), Algeria (Annaba), Morocco (El Jadida, Jorf Lasfar and Safi), and Lebanon (Batroun)). This is, for example, the case of the Gabes factories (located in south-eastern Tunisia; Figure 1), where large quantities of untreated PG wastes have been discharged into the Central Gulf of Gabes (CGG), since the 1970s. It is estimated that more than 500 million tons of untreated wet PG (equivalent to >200 million tons of dry PG) have been directly dumped into the CGG, since the establishment of the Gabes’ phosphate fertilizer factories (called the Tunisian Chemical Group or Groupe Chimique Tunisien; GCT) in 1972, with an average of 30 × 103 t of wet PG per day (~14,400 t of dry PG day−1 [1,42]). These wastes are being discharged into the marine environment in a liquid form called “gypseous water”, which results from the dissolution of PG in seawater used for the acid cooling process [43,44], to avoid the clogging of PG in the littoral discharge channel (Figure 1). This PG waste discharging process is known to lead to the formation of PG foams (PGF), which are rich in organic compounds (24.7% [43,44]). In addition, the simultaneous discharge of other acidic industrial wastewater, such as fluorinated wastewater, makes the discharge of gypseous water highly acidic [45]. Previous studies showed that gypseous water and PGF are the main sources of contamination in the Gulf of Gabes and dispersion vectors of radiochemical industrial pollutants in the southern Mediterranean Sea [6,43,44].
Since the 1980s, numerous studies have been conducted to investigate the industrial pollution in the Gulf of Gabes [1,46,47,48,49,50,51,52,53,54,55] and its ecological and environmental effects, represented mainly by the loss of biodiversity and contamination of living organisms [56,57,58,59,60,61,62,63,64], seawater quality degradation [45,65], marine sediment quality degradation [66,67,68,69], habitat destruction [53,70,71,72], and biological invasions [73,74,75,76,77]. Thus, the phosphate fertilizer industry has transformed the Gulf from the most productive and most important fishing area in the Mediterranean Basin [70,78,79,80] to its main marine pollution hotspot and most impacted marine area in the world [1,46,81]. Despite having received continuous contamination during several decades, the CGG has been scarcely monitored regarding transport and accumulation patterns of the resulting pollutants throughout the Mediterranean environment.
While most of the cited studies focused on PG-associated heavy metals (e.g., Zn, Cu, Cr, Cd, Pb, and Hg), no works assessed the contamination of the coastal environment with radioelements, although PG was reported to be a potential source of toxic radio-pollutants such as U and Th [6,7,10,12]. It is estimated that the central coastal area of the Gulf of Gabes receives 8.41 tons of U and 3.89 tons of Th yearly via the PG wastes discharged from the GCT fertilizer plants [6], leading to a cumulative quantity of 420.5 and 194.5 tons, respectively, since 1972. These enormous quantities of discharged radioelements are likely to pose serious hazards to the natural environment and humans due to their high radiotoxicity [6,10,12]. Despite the seriousness of this environmental issue, the levels of radioelements present in the different compartments of the coastal ecosystem of the Gulf of Gabes remain unknown. The present work is a contribution to fill this knowledge gap and is aimed at (i) investigating, for the first time, the spatial distribution of U and Th concentrations in the surface beach sediments close to the coastal fertilizer factories of Gabes, (ii) examining the geochemical behavior of these two radioelements in seawater, considering environmental factors using thermodynamic models, and (iii) evaluating their potential environmental and human health risks in the study area.

2. Materials and Methods

2.1. Study Area, Sampling, and Laboratory Analyses

The central part of the Gulf of Gabes (Lesser Syrtis auct.) is located in south-eastern Tunisia (Figure 1). Surface beach sediment samples were collected between Metouia Beach and Zarat, over ~50 km of coastline (Figure 1). Beach sediment samples were collected from 8 sites (in 3 sectors) including Metouia (ME), Ghannouch (GH; Northern sector), Gusir Ben Amara (LG), Chatt Sidi Abd Essalam (CE1 and CE2; central sector), Corniche (CR), Limaoua (LM), and Zarat (ZT; Southern sector) (Figure 1 and Table 1). LG, CE1, and CE2 stations are located close to the industrial complex, between the fishing and commercial ports of Gabes (Figure 1). The central sector hosts the GCT littoral industrial discharge, which is known to be the most contaminated area in the Gulf of Gabes [66,81]. The sampling sites were located in the intertidal zone of the beach. At each site, 5 sediment samples (equidistant by ~5 to 10 cm) were collected from the upper 0–10 cm surface beach sediment layer, cleared of all debris (such as shell fragments and seagrass debris), and mixed together to make a representative composite sample [66]. The eight collected composite samples were preserved separately in clean and well-sealed polyethylene bags and transported immediately to the laboratory where they were stored at 4 °C, until further analysis.
In the laboratory, the composite samples were separately dried, homogenized, and stored. Thereafter, 0.5 g of each composite sample was digested using a mixed solution of H2O2-HNO3-HCl, following the USA EPA method 3050B [82]. The determination of U and Th concentrations in the sediment samples was made using an Agilent 7900 Inductively Coupled Plasma Mass Spectrometer (ICP-MS), with detection limits equal to 0.01 and 0.004 mg.kg−1, respectively. The accuracy of the analytical method was evaluated by repeatedly measuring the concentrations of the two radioelements in the certified standard reference material MRGeo08 throughout analytical sessions. Measured values were well in agreement with reported values (5.6 ± 0.6 vs. 5.5 ± 0.3 mg.kg−1 for U, n = 3; and 20.0 ± 2.0 vs. 21.7 ± 2.3 mg.kg−1 for Th, n = 3). Additionally, the total organic carbon (TOC) and fine fractions of sediment (FF, Ø < 63 µm) were determined in the sediment composite samples using the Leco C230 Carbon/Sulfur Analyzer (Leco Europe, France) and the AFNOR® stainless steel sieve with a 63 µm opening (Haver and Boecker, France), respectively.

2.2. Data Analysis

2.2.1. Environmental and Ecological Risk Assessment

The environmental and ecological risks of the beach sediment contamination with U and Th were assessed using the following indexes: the contamination factor (Cf), Pollution Load Index (PLI), geo-accumulation index (Igeo), and Potential Ecological Risk Index (PERI; Table A1). In the absence of a toxicity response coefficient for Th (TTh; Table A1), only the individual potential ecological risk of U (EU) was calculated. This was considered as the final Potential Ecological Risk Index (PERI) at each site. Because of the non-availability of data on the natural levels of U and Th in Tunisian coastal sediments, the site CR (Figure 1) was used for background values for these two radioelements, since it shows the lowest levels in this study. Other unpolluted natural sands on Mediterranean beaches show similar values ranging from 0.30 to 2.06 mg.kg−1 (3.67–25.66 Bq.kg−1) for U and 0.19 to 3.21 mg.kg−1 (0.76–13.08 Bq.kg−1) for Th [83]. The concentration values were converted from Bq.kg−1 to mg.kg−1 using conversion factors given by Kritsananuwat et al. [84] (1 µg.g−1 of U = 12.43 Bq.kg−1 of 238U; 1 µg.g−1 of Th = 4.07 Bq.kg−1 of 232Th).
Pearson correlation analysis was conducted to examine the potential influence of the distance to the industrial littoral discharge (DILD), the fine fraction of sediments (FF; ∅ < 63 µm), and total organic carbon (TOC), as well as station-corresponding seawater pH and phosphate concentrations in seawater on the spatial distribution patterns of U and Th concentrations in surface beach sediments in the study area. Statistical analyses were performed using MS Office Excel (MS Office 2019 Pro Plus).

2.2.2. Numerical Modeling

We attempted to model the U and Th chemical behaviors in seawater in the specific conditions of the CGG, considering only inorganic parameters (seawater pH and seawater phosphate concentration). Natural dissolved uranium and thorium concentrations in seawater are significantly different (for Mediterranean seawater, 1.11 mg.kgw−1 and 4.82 mg.kgw−1, respectively [85,86]) due to their distinct chemical properties. Indeed, uranium is referred to as a conservative element, meaning that it is not extensively used by the biota, hence forming ions or radicals that are highly soluble and not surface reactive [87], while thorium is non-conservative, due to being highly scavenged by particles [88]. It is noteworthy that their concentrations in rivers are very close (respectively, 0.1 and 0.19 mg.kgw−1 for Th and U [89]), demonstrating their differential reactivity in seawater.
For this study, modeling calculations were performed using the PHREEQC software (2.15.07 version) [90,91]. Starting dissolved concentrations for major elements were taken from the average seawater composition [92] (Table A5 in Appendix E), with dissolved U and Th concentrations taken from the study of Roy-Barman et al. [85], which refers to the Mediterranean Sea (measurements were made during the DYFAMED project). The speciation of U was added to the Lawrence Livermore National Laboratory (LLNL) thermodynamic database [93]; Th was already present in the LLNL database with 21 compounds, especially thorianite (Table A6 and Table A7). This database includes more than 50 U-bearing components, to which four additional components were added, namely, autunite, uraninite, Uranyl-H-orthophosphate, and uranyl orthophosphate (see details in Table A8). For this open system, we assumed gas equilibrium between seawater and atmosphere (i.e., pCO2 = 10−3.4 bars, and pO2 = 10−0.69 bars). In detail, we first calculated the U (i.e., Th) speciation and the saturation indexes for all the U-bearing phases (i.e., Th-bearing phases) for a progressive addition of U (i.e., Th), mimicking the effluent inputs. Saturation indexes (SIs) are calculated according to the following equation (log scale):
S I = log ( Q K ( T ) )
where Q is the ionic product and K(T) is the reaction equilibrium constant. Secondly, the oversaturated phases were allowed to precipitate to determine the most thermodynamically stable compound.
Speciation calculations of U and Th vs. pH (from 3 to 10) and phosphate concentration (from 0.1 to 10 mg.kgw−1) were performed to explore the effect of these two parameters. To that end, we used the PHREEPLOT software (2.15.07 version) [94] with the following starting hypothesis: Th and U concentrations were considered equal to average values in the Mediterranean Sea [85], that is, 4.82 and 1.11 mg.kgw−1, respectively. The effect on the speciation of U and Th was calculated for an average phosphate concentration of 1.17 mg.kgw−1 and an average pH of 7.74, which are representative of our study area [45] (see Table A2).

3. Results

3.1. U and Th Concentrations and Distribution

Table 2 summarizes the U and Th concentrations (mg.kg−1 d.w.), total organic carbon (TOC; %), and fine fractions (FF; %) in the beach surface sediment samples, collected from the central area of the Gulf of Gabes. U concentrations varied from 0.71 mg·kg−1 (in CR) to 38.00 mg.kg−1 (in LG), while those of Th ranged from 1.00 mg.kg−1 (in CR) to 10.60 mg.kg−1 (in LG). In general, U concentrations were higher than those of Th, with averages equal to 10.77 mg.kg−1 and 3.60 mg·kg−1, respectively. The highest concentrations of these two radioelements were found in the central sector (LG, CE1, and CE2; Table 2), where the active GCT industrial discharge channel is located (Figure 1). Concentrations of U and Th were found to follow a decreasing pattern from the central sector toward the southern or northern sites.

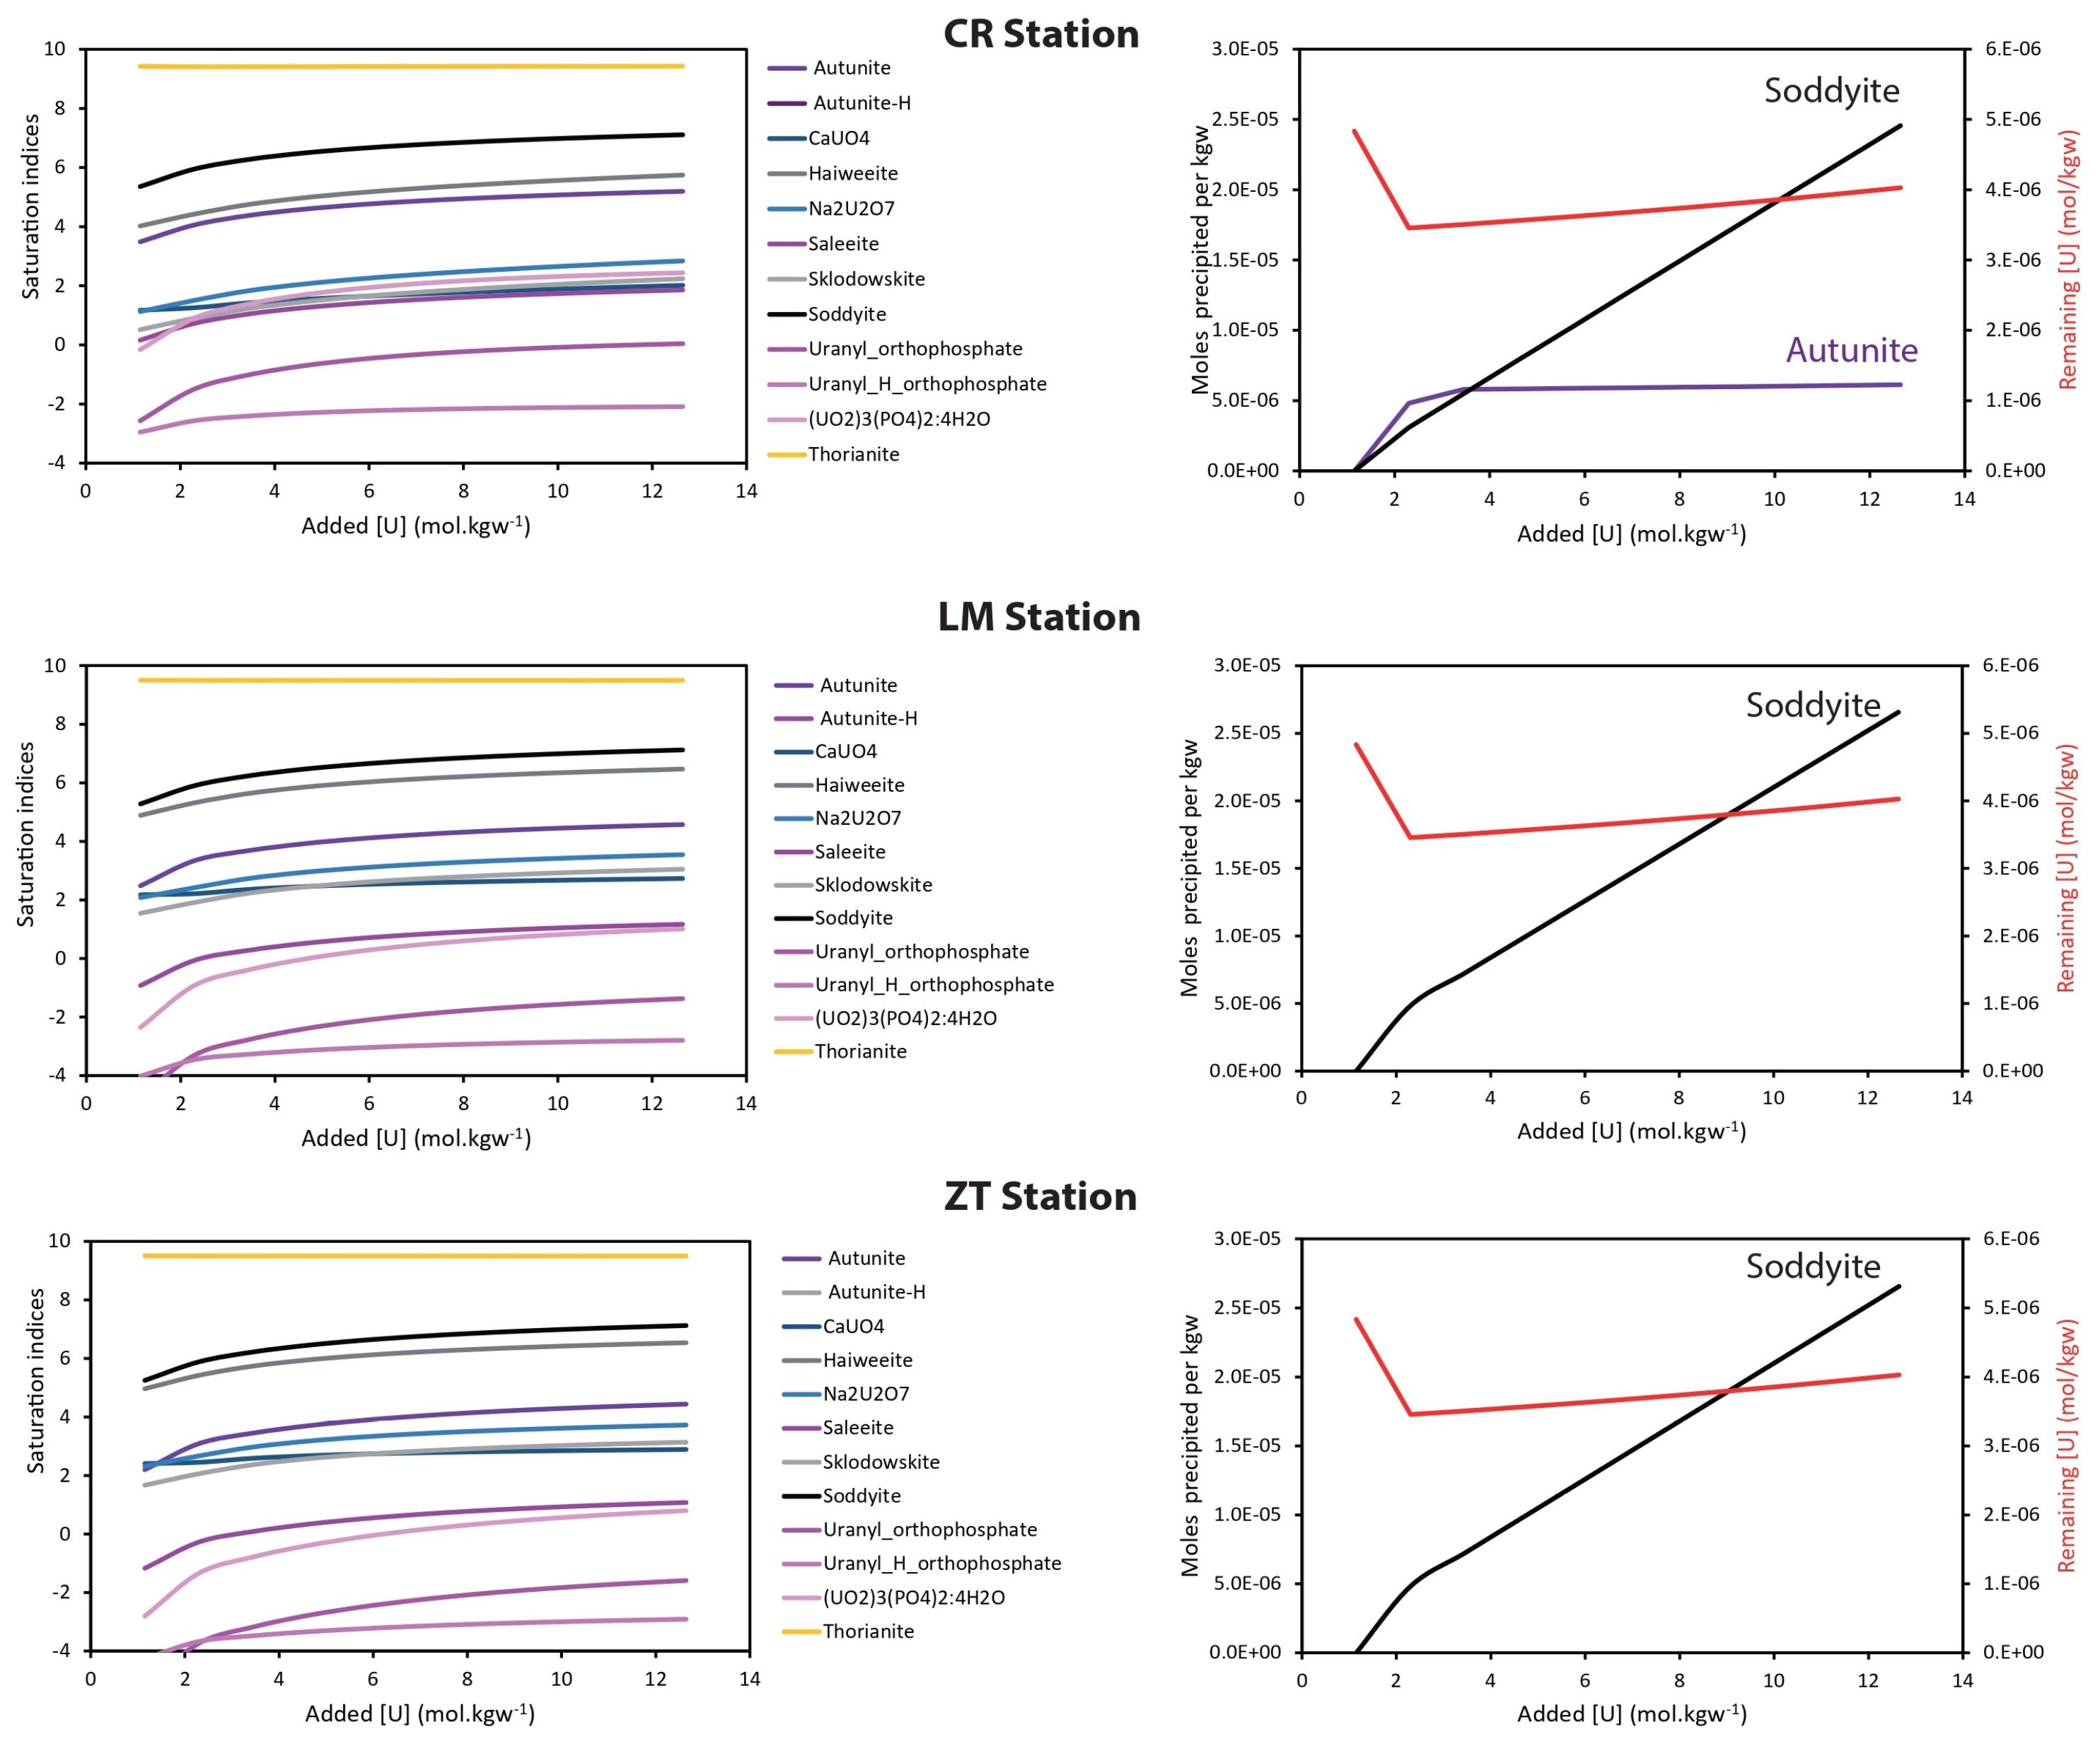
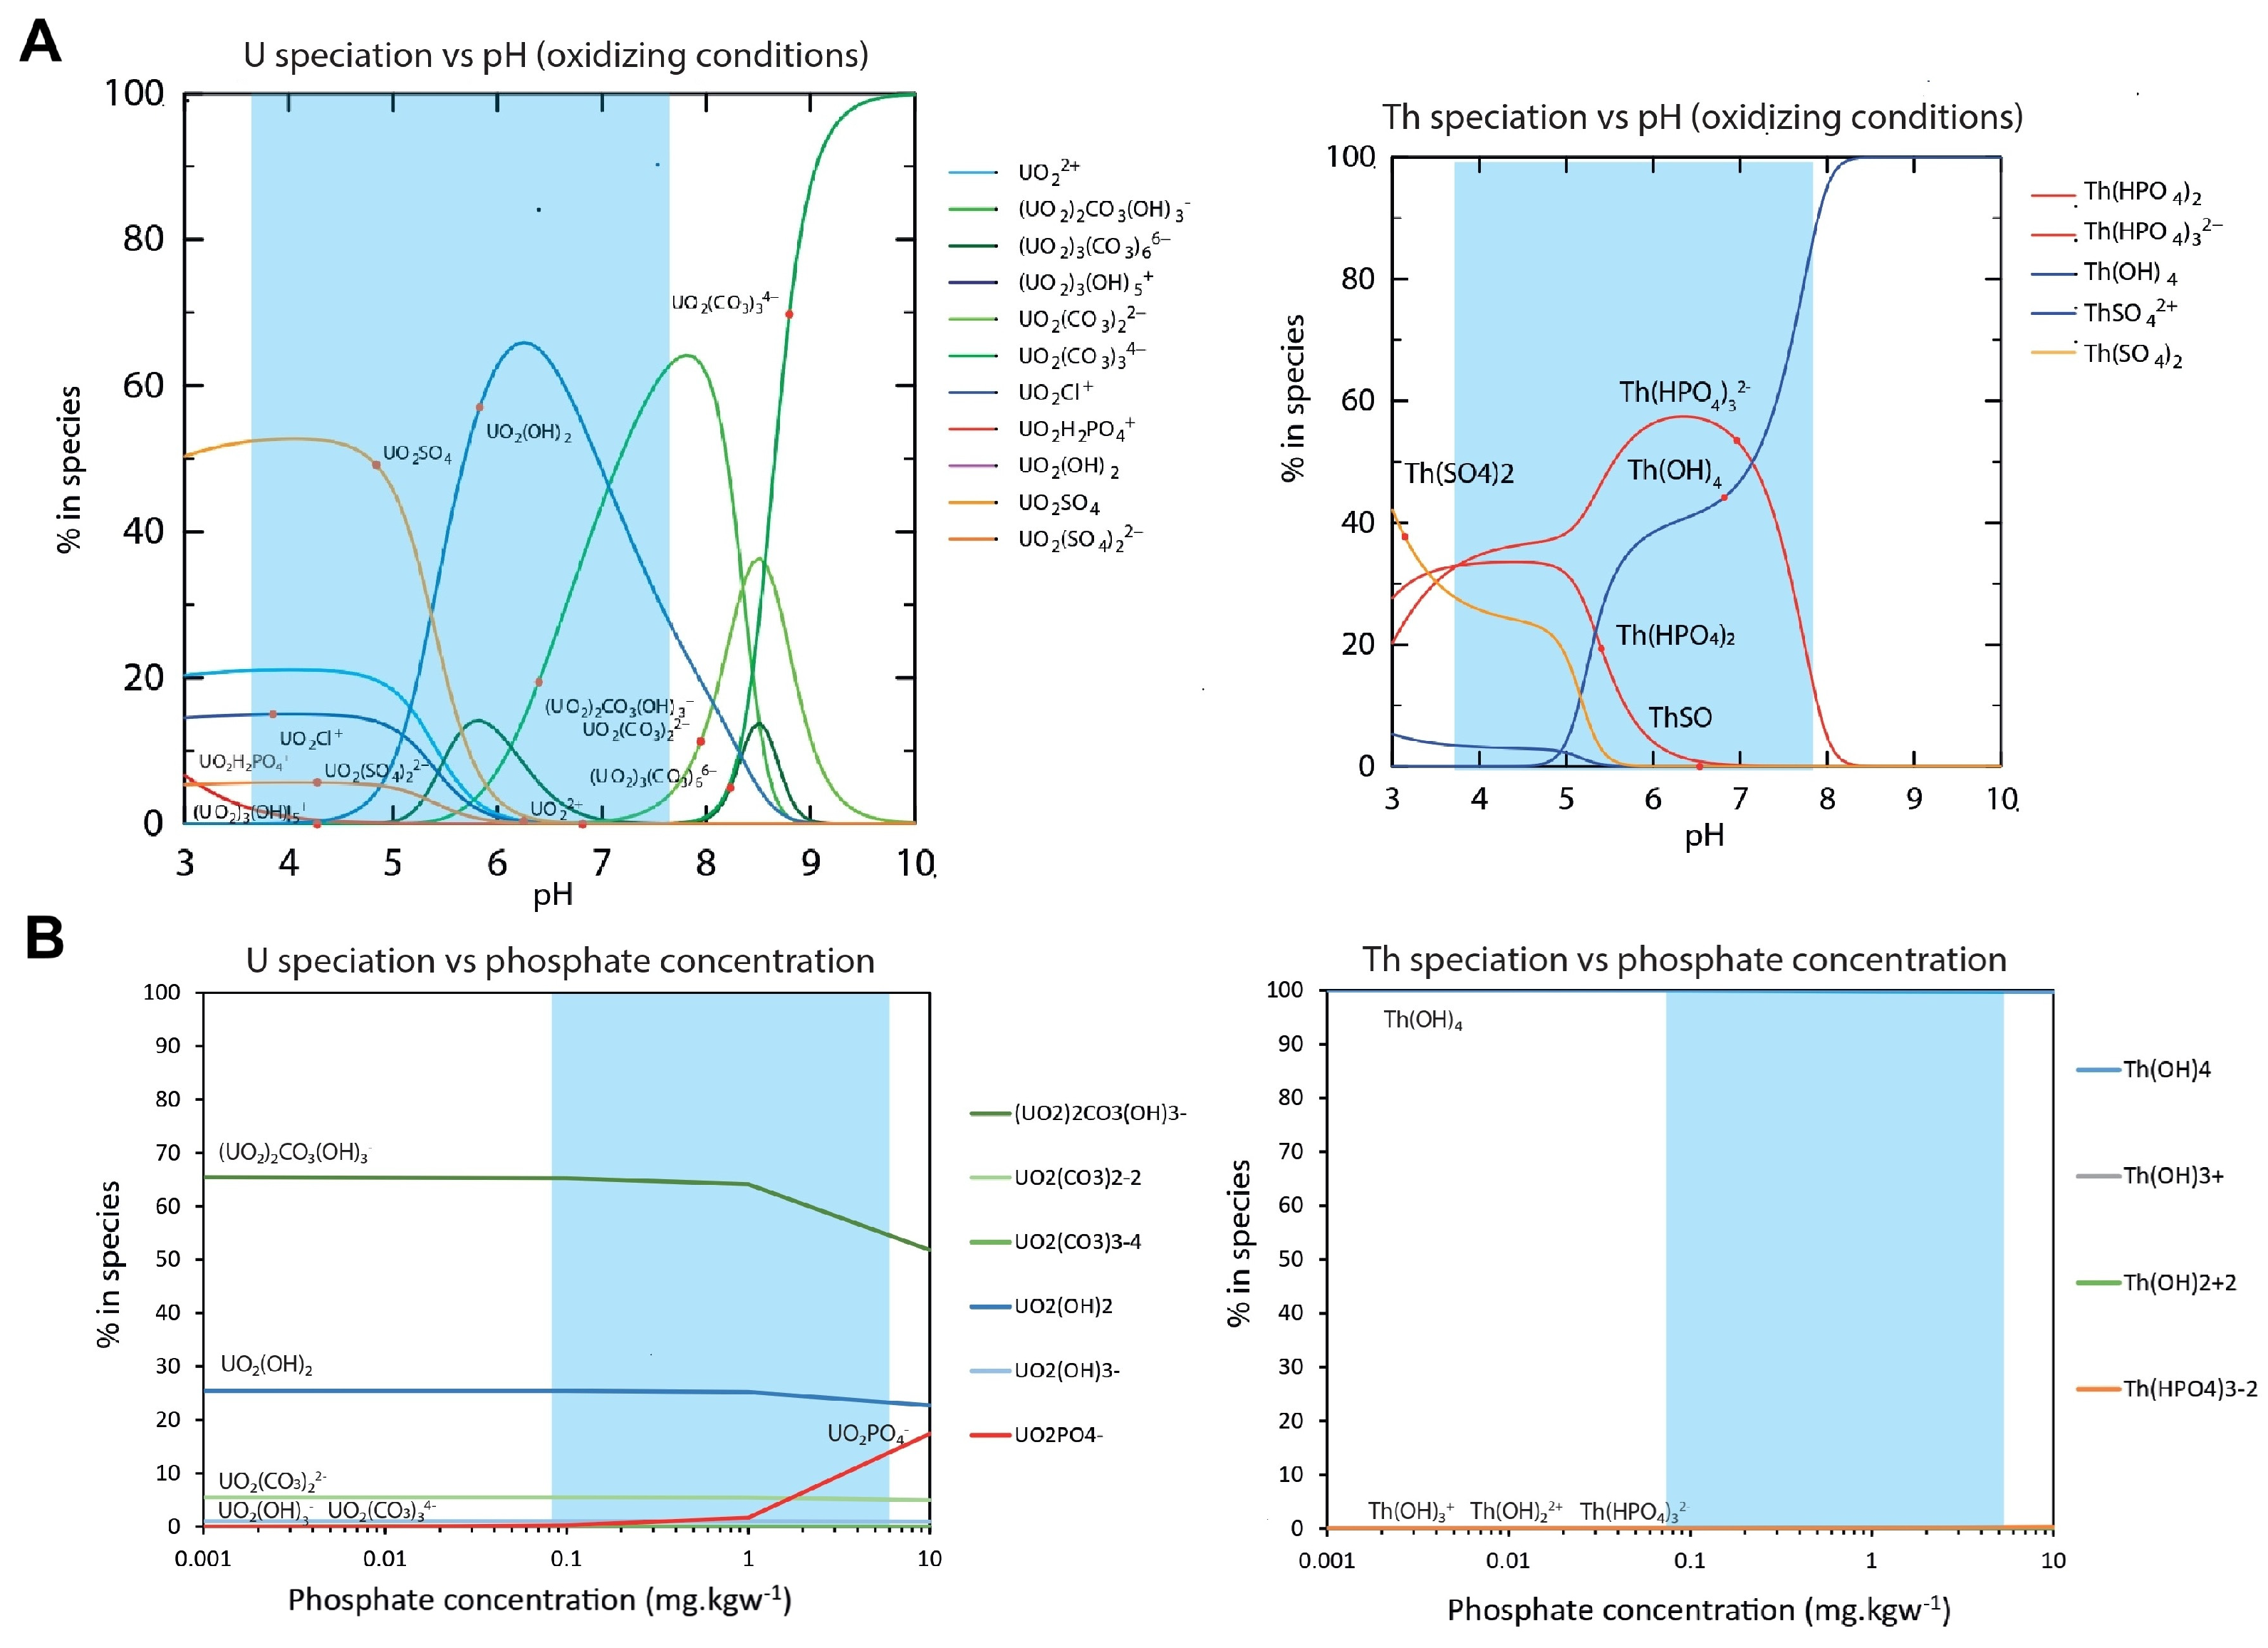
3.2. U and Th Behavior Explained by Geochemical Modeling

Results of the numerical modeling of U mineral saturation factors for the three sectors (northern, central, and southern sectors) are depicted in Figure 2, Figure 3 and Figure 4, respectively. For the northern sector (Figure 2), modeling results revealed that only a moderate increase in the U concentration in seawater (~×2, 1.11 to 2.22 mg.kg−1) leads to the oversaturation of several U-bearing minerals (Figure 2, left side). As expected, some of them are U-phosphates (namely, autunite) and others are simple U-bearing silicates, namely, haiweeite and soddyite. The most stable thermodynamic form of U-bearing minerals was found to be the soddyite phase ((UO2)2 SiO4:2H2O), except for stations LG and CR, where autunite can also form. The theoretical precipitation of this compound could lead to a substantial decrease in U concentrations in seawater (Figure 2, right side, ME and GH stations). Using the same reasoning, the potential precipitation of thorium phases was also calculated. In this case, thorianite (ThO2) is largely oversaturated, except in the LG station.
In the central sector (Figure 3), despite the elevated dissolved phosphate concentrations (sites LG, CE1, and CE2 (in the CE stations (CE1 and CE2), the SI of thorianite increases with U concentrations, which seems illogical. In fact, the SI of thorianite changes because the addition of U from a low pH gradually increases the pH)), the low seawater pH (3.61 to 4.35) prevents U-phosphate formation, and the solution did not reach oversaturation with respect to U-phosphates. Most extreme conditions are found at the LG site (i.e., the effluent), which exhibited a very low seawater pH (pH = 3.61 [45]). We arrive at the same conclusions for the northern sector as for the southern sector (CR, LM, and ZT stations depicted in Figure 4): soddyite is the most stable mineral. In this sector, the CR station, bordering the previous zone, exhibits an intermediate behavior with the potential formation of both autunite and soddyite.
Figure 5 shows the results of U and Th speciation in seawater calculated according to two relevant parameters, namely, pH and phosphate concentration. In order to calibrate our model, we first performed calculations under the conditions of natural seawater. The results were found aligned with previous calculations and observations: U is mainly solubilized as uranyl phosphates and carbonate complexes [95], whereas Th is solubilized as a charged phosphate species, Th(HPO4)32− for acidic pH and, as a neutral species, (Th(OH)4), precisely a polyhydroxyl colloidal complex, for clearly basic values [95,96]. In the case of the CGG, using the average phosphate concentration corresponding to the eight sampling sites (1.27 mg.kg−1 [45]) and a seawater pH range (depicted as the blue area), from 3.61 to 7.98, U and Th speciation are heavily modified (Figure 5A). In this scenario, these two elements exist in a solution associated with several ligands, among which phosphate is important at low pH. This change may have major importance for the fate of these elements since the solutions are heavily oversaturated relative to some phosphate compounds (e.g., autunite for U, Ca(UO2)2(PO4)2(H2O)3); the speciation of Th shows that Th(HPO4)32−, a dissolved species, is more abundant compared to amorphous colloidal forms, like Th(OH)4, more common in the open sea.
Secondly, the speciation of U and Th as a function of the concentration of phosphate was modeled, considering the average seawater pH of the non-polluted sampling sites of this study (7.74 from sites ME, GH, CR, LM, and ZT; Table A2). As phosphate concentration increases, U and Th complexes shift very gradually to carbonate and hydroxyl to phosphate compounds (Figure 5B).
For the study area of the Gulf of Gabes, we have considered that the threshold from “natural seawater” speciation to “polluted seawater” speciation is a seawater pH below ca. 7.5 and a seawater phosphate concentration greater than 3 mg.kgw−1.

3.3. U and Th Fate in the Gulf of Gabes

Pearson correlation analysis revealed a positive correlation (r = 0.94, p < 0.001; Table A3 in Appendix D) between U and Th concentrations in beach sediments, suggesting that the two radioelements share a common pollution source (most likely the GCT phosphogypsum wastes) and similar geochemical behavior in the marine environment of the CGG (transfer from seawater to sediments). Furthermore, our results show that the concentrations of U are negatively correlated with DILD and FF factors but positively correlated with TOC. In fact, U concentrations in beach sand were found to increase on sites near the GCT industrial littoral discharge (LG, CE1, and CE2; Figure 1), with high organic matter (an average of 2.44%) and low fine fraction in sediments (an average of 0.27%). In contrast, U decreases outside the central sector. Similarly, Th was revealed to have a positive correlation between this radioelement and TOC (r = 0.91) and a negative correlation to the DILD (r = −0.29; Table A3) but no correlation to the FF. The concentrations of both radioelements in beach sediments show a negative correlation to pH in corresponding seawater samples and a positive correlation to phosphate concentration in seawater. This suggests that both radioelements could be precipitated from seawater at low pH and high phosphate concentrations. The strong correlation between TOC and seawater phosphate suggests that they have the same source. The main source of phosphate in seawater being phosphogypsum, which is acidic, agrees with the negative correlation with seawater pH.

3.4. Environmental and Ecological Risk Assessment of Coastal Sediment Contamination by U and Th

In the case of U, very high Cf values (Cf ≥ 6) were recorded in LG (Cf = 53.5), CE1 (Cf = 46.5), and CE2 (Cf = 13. 6), confirming that the central sector is the most contaminated site (Table 3). In the case of Th, Cf values ranged between moderate (1 ≤ Cf < 3; CE2) to very high (LG and CE1). However, the entire study area is considered polluted based on PLI values (PLI > 1; Table 3), which reached their maximum values in LG (PLI = 23.9). Furthermore, the geo-accumulation index (Igeo) showed that, except for the central sector (whose stations were assessed as moderately to strongly contaminated (CE2; 2 < Igeo ≤ 3) and extremely contaminated (LG and CE1; Igeo > 5)), all other sectors/sites were found to be uncontaminated (Igeo ≤ 0; MT, GH, CR, and LM) and uncontaminated to moderately contaminated (0 < Igeo ≤ 1; ZT) by U and Th.
The central sector (LG, CE1, and CE2) was found to be the sector with the highest ecological risk for marine wildlife, with values ranging from considerable (300 ≤ PERI < 600; CE2) to very high (PERI ≥ 600; LG and CE1). In contrast, low ecological risks (PERI < 150) were revealed in the two other sectors (Table 3).
The comparison of the U levels recorded in the CGG with those found in other countries showed that, except for Camargue (France [97]), U levels recorded here are much higher than those measured in the coastal areas of Malaysia [98], Kalpakkam (India [99]), the Red Sea (Egypt [100]), Bushahr (Iran [101]), and the Atlantic coasts of the USA ([102]; Table 4). In addition, Th concentrations measured in this study were found to be higher than those of Malaysia [98] and the American Atlantic and Gulf coasts [102], lower than those recorded in Kalpakkam [99] and Camargue [97], and similar to those assessed in the Red Sea [100] and Bushahr ([101]; Table 4).

4. Discussion

4.1. Uranium and Thorium Geochemical Behaviors

Uranium and thorium are naturally occurring radioactive elements derived from the Earth’s crust (2.7 and 10.5 mg.kg−1, respectively [103]) with trace concentrations found in seawater (3.3 × 10⁻³ and 2 × 10⁻⁸ mg.kgw−1, respectively [104]). In the marine environment, elements can be classified into three different groups: those that are soluble in seawater, those that are insoluble, and those that are soluble but particle-reactive and thus removed from the dissolved phase by adsorption onto sinking particles (scavenging phenomenon). As summarized by Cumberland et al. [105], the most influential factors affecting U solubility are the pH, oxidation status, organic matter, redox (including microbes), and complex ions. In contrast, dissolved Th is mainly controlled by the adsorption onto marine particles. In natural seawater, dissolved Th is mainly present as Th(OH)4 oxide, which is very particle-reactive [106]. Hence, the two radioelements have a contrasting geochemical behavior in natural seawater [98]. While Th is rapidly scavenged onto sinking particles and transferred to the seafloor [106], U tends to remain in solution at natural seawater pH [98]. 234Th/238U disequilibria are widely used to determine scavenging rates in surface waters [107]. In the central sector of our study area, the two radioelements appeared to have the same geochemical behavior in seawater, clearly showing sedimentary transfer. Indeed, according to the results shown in Figure 5, the low seawater pH (3.61–4.35) and high seawater PO43− concentrations (0.85–5.60 mg·kg−1; Table A2) seem to cause U precipitation from seawater and, consequently, the increase in radioelement concentrations in sediments (Table 2). Based on our results, high concentrations of both U and Th in marine sediments could constitute indicators of anthropogenic inputs from phosphate fertilizer plants. Further studies are needed to precisely characterize the mineral phases under which U and Th precipitate.
It is well-known that in the presence of OM, U mobility is reduced through complexation and mineral formation [108,109]. Previous studies have shown that Th has a high tendency to bind to certain organic phases such as acidic polysaccharides [110]. Modeling U, Th, and organic matter (OM) interactions combined with inorganic modeling is not possible because of incomplete thermodynamic data and the high variability of OM [111,112]. Nevertheless, we suggest that, in the Gulf of Gabes, OM may act as a trap for dissolved U and Th, promoting transfer to the particulate phase.

4.2. Factors Influencing the Spatial Distribution of Uranium and Thorium

According to our results, several factors lead to the spatial distribution patterns of U and Th concentrations in beach sediments of the Central Gulf of Gabes. The distance to the GCT industrial discharge (DILD; Table A3), which is the primary source of these two elements in the marine area of this study (20.8 kg.day−1 of U and 9.62 kg.day−1 of Th [6]), is considered as the main environmental factor influencing U and Th spatial distribution patterns. Meanwhile, the harbor structures trap these radioelements in the central sector (the area located between the commercial and fishing ports of Gabes; Figure 1), making the coast of Chat Sidi Abd Essalam an accumulation site for the various GCT industrial wastes [67]. The physical barriers of the two ports most likely limit the spread of pollutants [56,66,67], leading to exceptionally high concentrations of U and Th in the central sector. This agrees with the conclusions of previous works, which recorded increased levels of several heavy metals (Cd, Cu, Cr, Zn, and Pb) in the central sector, where the industrial waste discharge is located [1,56,66].
Organic matter is known for its high sorption affinity for radioelements due to its strong binding sites (e.g., -COOH, -CONHO-, -O=POOO-, R-S-R and R-N-R groups, etc. [44,113]). Within this context, it is worth noting that the sediments of the central sector are highly enriched with OM, compared to the sediments of the other sectors (Table 2). OM in the Gulf of Gabes comes from two main sources: (i) GCT industrial waste, which includes the gypseous water, phosphogypsum foams, and phosphate ores, and (ii) discharges from Gabes wastewater treatment plants, which are often discharged without any treatment in Chatt Sidi Abd Essalam ([6,43,44,45]; Figure A1A). In addition, the low seawater pH and its high phosphorus concentration lead to enhanced U precipitation from seawater (Figure 5), which leads to increased U concentrations in (beach) sediments. Put together, five environmental factors seem to increase the content of U and Th in beach sediments of the Central Gulf of Gabes: the proximity to GCT industrial waste discharge, the catchment effect of port structures, the high content of OM in sediments, the high PO43− concentrations in seawater, and the low seawater pH. Among these factors, [PO43−] and pH have no effect on Th marine sediment concentrations.

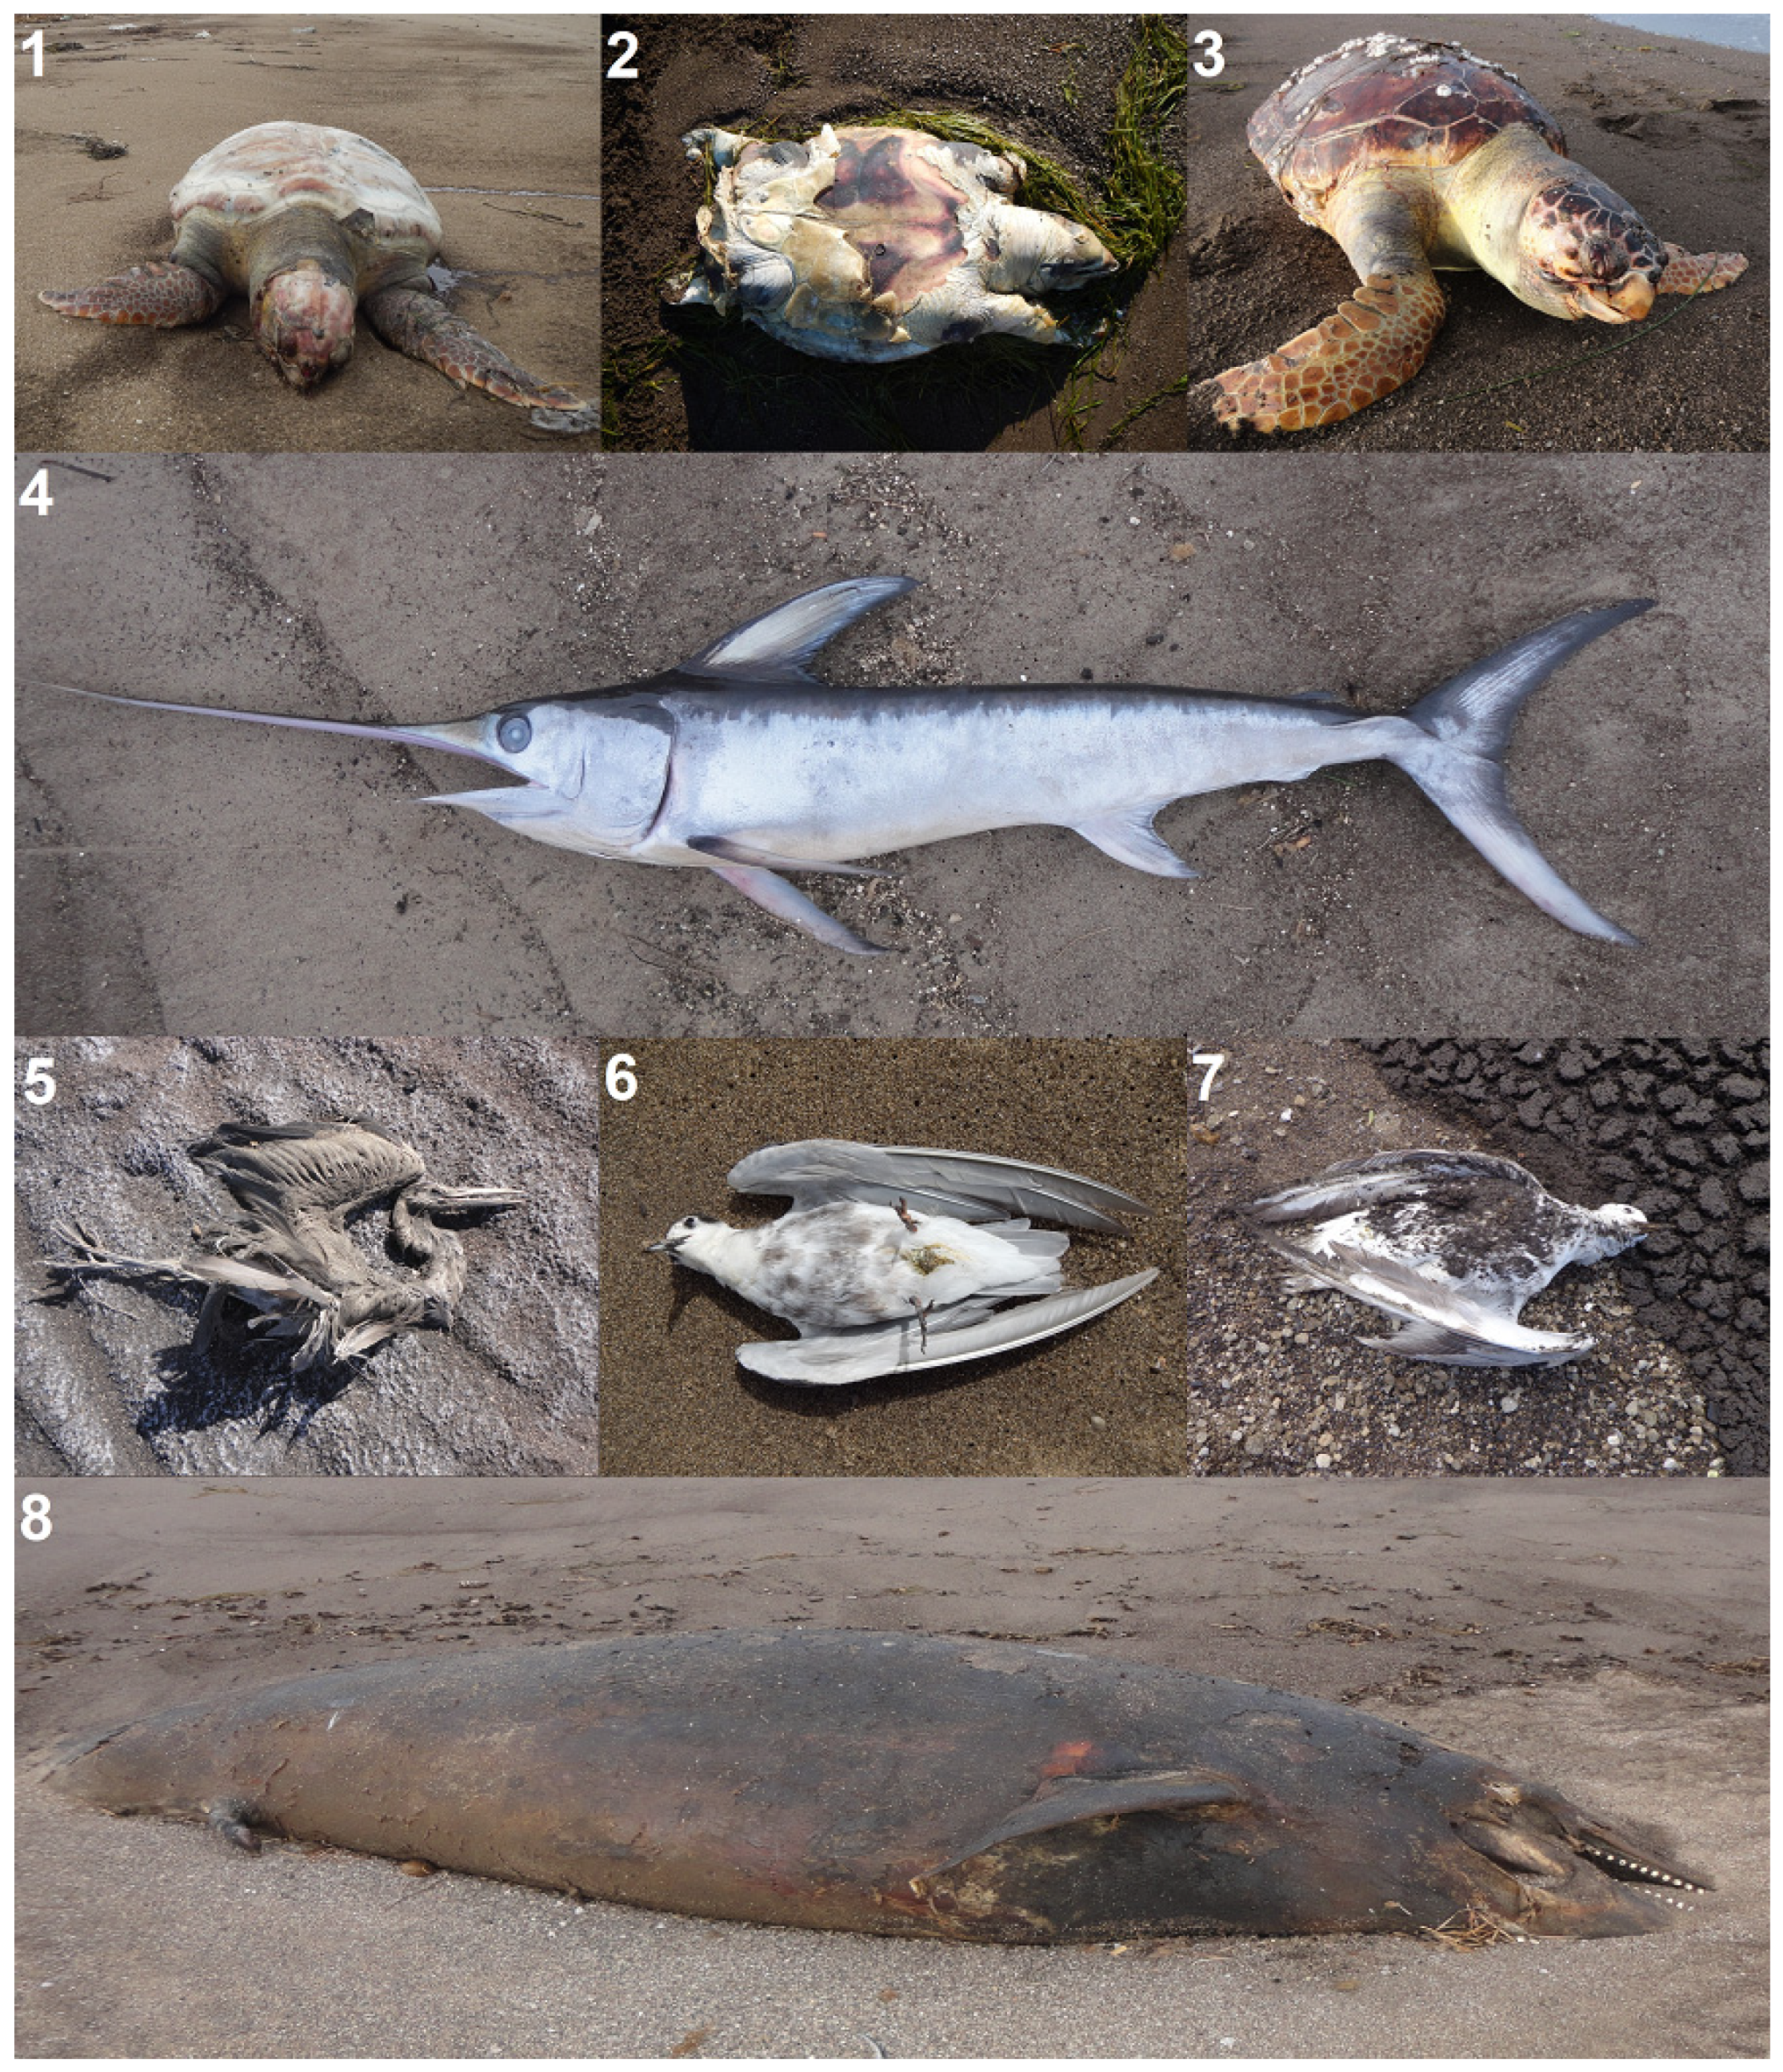
4.3. Environmental, Ecological, and Health Impacts of U and Th Contamination in Beach Sediments

Based on the results of the environmental and ecological risk assessment analysis and the alarming values of the calculated indices (Cf, PLI, Igeo, and PERI), the central sector (Figure 1) was found to be the most affected by U and Th contamination (Table 3). Among the different sectors studied herein, the central sector, which hosts the GCT industrial waste discharge (Figure 1), is considered the most ecologically dangerous zone for both marine biota and human health [1,12,43,44,66]. For instance, the coast of Chatt Sidi Abd Essalam (Figure 1) is locally recognized as “the cemetery” of the Mediterranean Sea where mortality events of several marine species are frequently recorded. The mortality events in this central sector were recorded with the following species: Caretta caretta (mass mortality), Larus michahellis (mass mortality), Chroicocephalus genei (mass mortality), Phalacrocorax carbo (mass mortality), Larus fuscus, Hydroprogne caspia, Podiceps cristatus, Tursiops truncatus, Liza aurata, Dicentrarchus labrax, Atherina hepsetus, Liza saliens, Lithognathus mormyrus, Portunus segnis, Aurelia aurita, Sepia officinalis, etc. (Figure 6). It is worth noting that the protected loggerhead sea turtle (Caretta caretta; e.g., Barcelona Convention (1976), Bonn Convention (1979), and Bern Convention (1982)) remains among the most affected marine species by industrial pollution in the Central Gulf of Gabes (Figure 6(1–3)); [12,13,44,45]. In 2015, The International Union for Conservation of Nature (IUCN) listed C. caretta as vulnerable in the Red List of Threatened Species [114]. According to local testimonies, C. caretta used to nest in the Central Gulf of Gabes before the installation of the GCT fertilizer factories in Gabes (which happened in 1972). During our systematic visits to the central sector over the past years, we recorded several paralyzed seabirds (especially Larus michahellis, and Sterna hirundo), in addition to other marine species presenting some skeletal malformations such as the blue swimming crab (Portunus segnis) and the golden grey mullet (Liza aurata), as shown in Figure 7. The malformations in marine organisms found on CGG beaches are probably partly due to contamination with radioelements, including U and Th and their disintegration products (238U (234Th, 226Ra, 210Pb…), 232Th (228Ra, 228Th, 208Tl…) [115,116,117,118]. Marine organisms are contaminated with these two radioelements and their disintegration products by direct ingestion (feeding, sediment, seawater, PGF, and microplastics), inhalation (evaporation from seawater, airborne fine fractions of sediments, and PGF), and/or dermal absorption (contact with sediments, PGF, and seawater [12,42,43,44]).
In addition to marine fauna, the health of local inhabitants seems to be affected by U and Th contamination. Residents can be contaminated through the inhalation of contaminated airborne fine fractions of sediments and/or PGF, consumption of contaminated seafood, and direct dermal contact, especially in Chatt Sidi Abd Essalam, where the untreated industrial waste is directly discharged into the sea (Figure 1). In addition, the locals use the contaminated beach sediments as fertilizers for their agricultural fields (locally called “agricultural vitamins” due to high levels of phosphorus), directly contaminating their crops (Figure A1B). The human diseases that are commonly observed in Gabes, particularly in Chatt Sidi Abd Essalam (the central sector, most polluted zone), include lung, prostate, kidney and bone cancer, liver tumors, kidney damage, cardiovascular diseases, birth defects, impotence, abortion, and many more, with high cancer mortality rates. Several international organizations, such as the ATSDR [119], WHO [120], NCI [121], and US EPA [122,123], previously published studies reporting that U and/or Th contamination can be a cause of these latter diseases [124,125,126]. However, it is important to note that these radio-contaminants (U, Th, and their disintegration products) do not act alone but in cocktails with other types of contaminants (heavy metals and rare earth elements) that are found in high concentrations in the various types of untreated industrial wastes dumped by the GCT factories directly in the natural environment [44]. These untreated wastes include PG (~10.5 × 10⁶ tons of wet PG y−1), phosphate ores, used catalysts, sulfide dross, acid gas washing water and seawater used for the acid cooling system (350.4 × 10⁶ m3.y−1 for both), sulfide oxides (SO2; 21.02 × 10³ tons.y−1), fluorinated gases (131.4 tons.y−1), nitrogen oxides (NOx; 876 tons.y−1), ammonia gas (NH3; 438 tons.y−1), dusts (1.6 × 10⁶ tons.y−1), and smelly gases (219 tons.y−1) [67,127]. Contaminants, such as heavy metals (e.g., As, Cd, Cr, Pb, and Hg) and rare earth elements (e.g., Eu, Dy, Pr, Ce, and Gd), are widely known for their high toxicity for both humans and animals [13,128,129]. To confirm the link between the observed human diseases and marine pollution, including U and Th, it is urgent to conduct epidemiological studies on the local population. These could help in developing solutions to mitigate impacts and contribute to the safety and protection of local populations and natural environments.

5. Conclusions and Recommendations

Overall, the results of this study improve our understanding of the present U and Th distribution patterns in the surface sediments of the Central Gulf of Gabes and the factors responsible for them. The highest concentrations of U and Th were recorded in the central sector, near the industrial littoral discharge of the GCT factories. U and Th appeared to originate from the same source (GCT’s phosphogypsum wastes) and to share similar geochemical behaviors (preferential transfer from seawater to sediments). Our study also showed that the main factors affecting the spatial distribution of U in sediments are the proximity to the industrial waste littoral discharge, catchment role of the port structures, high organic matter concentrations in sediments, high seawater phosphorus concentrations, and low seawater pH. The distribution of Th in marine sediments was shown to be linked to the same factors, except seawater phosphorous concentration and pH.
The waste of local phosphate fertilizers is likely to be responsible for the various observed environmental, ecological, and human health impacts in the Central Gulf of Gabes. It is, therefore, urgent to determine and execute a monitoring program of pollutants, such as U and Th, in the different compartments of local ecosystems including seawater, sediments, seafood, and agriculture fields fertilized by the contaminated beach sands. Adopting a sustainable environmental management approach for the Central Gulf of Gabes would help to design the necessary waste treatment and discharge regulations in Tunisia, in order to protect the environment, natural resources, and public health in the Gulf of Gabes but also in the entire Mediterranean Sea.

Author Contributions

Conceptualization, R.B.E.Z.; Methodology, R.B.E.Z. and S.F.; Software: S.F.; Formal analysis, R.B.E.Z., J.K.K. and S.F.; Investigation, R.B.E.Z. and P.C.-R.; Writing—original draft preparation, R.B.E.Z.; Writing, review and editing, J.K.K., S.C., M.G., P.C.-R. and S.F.; Supervision, R.B.E.Z.; Funding acquisition; S.C. and M.G. All authors have read and agreed to the published version of the manuscript.

Funding

This research received no external funding.

Institutional Review Board Statement

Not applicable.

Informed Consent Statement

Not applicable.

Data Availability Statement

The raw data supporting the conclusions of this article will be made available by the authors upon request.

Acknowledgments

This publication is dedicated to the memory of Abd Ennacer Ben Ahmed Bououd (19 February 1970/26 February 2022) from the maritime oasis of Chatt Sidi Abd Essalam. The authors are grateful to the editor and the four anonymous reviewers who helped to improve the quality of the manuscript through their constructive comments and suggestions.

Conflicts of Interest

The authors declare no conflicts of interest.

Appendix A

Figure A1. (A) Coastal discharges of untreated wastewater into the sea of Chatt Sidi Abd Essalam via Ennaten wadi (the old bed of Gabes wadi); (B) the use of the contaminated beach sand of Chatt Sidi Abd Essalam (in red arrow) as “natural” fertilizer in the oasis agricultural fields.
Sustainability 17 01283 g0a1

Appendix B

Table A1. Indexes and methods used in the environmental and ecological risk assessment of the beach sediments in the Gulf of Gabes.
IndexesFormulae/DescriptionVariablesScales and InterpretationReferences
Contamination
factor (Cf)
Cf = Cs/Cb• Cs: trace element concentration in the sample
• Cb: trace element background concentration
• Cf < 1: low factor
• 1 ≤ Cf < 3: moderate factor
• 3 ≤ Cf < 6: considerable factor
• Cf ≥ 6: very high factor
[130]
Pollution Load
Index (PLI)
PLI = (Cf1 × Cf2 × Cfn)1/n• Cf: contamination factor
• n: number of trace elements analyzed
• PLI ≤ 1: non-polluted
• PLI > 1: polluted
[131]
Geo-accumulation index (Igeo)Igeo = log2 (Cs/1.5 × Cb)• Cs: trace element concentration in the sample
• Cb: trace element background concentration
• 1.5: background matrix correction factor
• Igeo ≤ 0: uncontaminated
• 0 < Igeo ≤1: uncontaminated to moderately contaminated
• 1 < Igeo ≤ 2: moderately contaminated
• 2 < Igeo ≤ 3: moderately to strongly contaminated
• 3 < Igeo ≤ 4: strongly contaminated
• 4 < Igeo ≤ 5: strongly to extremely contaminated
• Igeo > 5: extremely contaminated
[132]
Potential Ecological Risk Index (PERI)RI = ∑ Eir = ∑ Tir × Cif• RI: sum of individual potential ecological risk for all trace elements
• Eir: PERI of an individual trace element
• Tir: toxic-response factor for a given trace element (TU = 40 [133])
• Cif: contamination factor
• RI < 150: low ecological risk
• 150 ≤ RI < 300: moderate ecological risk
• 300 ≤ RI < 600: considerable ecological risk
• RI ≥ 600: very high ecological risk
[130]

Appendix C

Table A2. Values in seawater used in the calculations depicted in Figure 2, Figure 3 and Figure 4 [45].
SectorsStations
(N → S)
pHT (°C)P (mg.kgw−1)U (mg.kgw−1) *
Northern sectorME7.8426.7<0.141.11
GH7.6227.50.27 ± 0.01
Central sectorLG3.6131.25.61 ± 0.09
CE14.3528.40.85 ± 0.14
CE2
Southern sectorCR7.3226.90.63 ± 0.12
LM7.8925.40.36 ± 0.08
ZT7.9826.20.33 ± 0.10
* Average concentration in seawater, z < 200 m, Dyfamed trap zone located at 43°25′ N–7°52′ E [85].

Appendix D

Table A3. Pearson correlation matrix (r = 0.94, p < 0.001) between U and Th concentrations in the surface beach sediments, total organic content (TOC), the fine fraction of sediments (FF; ∅ < 63 µm), the distance to industrial littoral discharge (DILD), seawater pH, and seawater phosphate concentrations (P) on each of the 8 stations (MT, GH, LG, CE1, CE2, CR, LM, and ZT) in the Central Gulf of Gabes.
UThTOCFFDILDpHP
U1.00
Th0.941.00
TOC0.810.911.00
FF−0.150.08−0.111.00
DILD−0.52−0.29−0.360.851.00
pH−0.88−0.76−0.660.280.651.00
P0.760.870.99−0.14−0.37−0.671.00
Table A4. Statistical significance (p-values) of correlations between variables, shown in Table A3. The variables are U and Th concentrations in the surface beach sediments, total organic content (TOC), the fine fraction of sediments (FF; ∅ < 63 µm), the distance to industrial littoral discharge (DILD), seawater pH, and seawater phosphate concentrations (P) on each of the 8 stations (MT, GH, LG, CE1, CE2, CR, LM, and ZT) in the Central Gulf of Gabes.
UThTOCFFDILDpHP
U-
Th0.0006-
TOC0.01440.0015-
FF0.71860.84900.8399-
DILD0.18470.48310.36190.0080-
pH0.00370.02720.06750.50060.0786-
P0.02360.00312.4 × 1070.83040.35510.0685-

Appendix E

Thermodynamic data was added to the LLNL database [93], which was used for modeling U and Th behavior in seawater with the PHREEQC computer program.
Table A5. Seawater composition [92], mg.L−1 unless otherwise noted.
Calcium412.3
Magnesium1241.8
Sodium10,768.0
Potassium399.1
Iron0.002
Manganese0.0002
Silica as SiO24.28
Chloride19,553.0
Alkalinity as HCO3141.682
Sulfate as SO42−2712.0
Nitrate as NO30.29
Ammonium as NH4+0.03
UraniumVar.
pH, standard units8.22
pe, unitless8.451
Temperature, °C25.0
Density, kg/L1.023
Table A6. Uranium speciation [91].
  U+4 + 4 H2O = U(OH)4 + 4 H+
   log K = −8.538
  U+4 + 5 H2O = U(OH)5 + 5 H+
   log K = −13.147
  U+4 + 2 H2O = UO2+ + 4 H+ + e
   log K = −6.432
  U+4 + 2 H2O = UO2+2 + 4 H+ + 2 e
   log K = −9.217
  UO2+2 + H2O = UO2OH+ + H+
  log K = −5.782
  2UO2+2 + 2H2O = (UO2)2(OH)2+2 + 2H+
   log K = −5.626
  3UO2+2 + 5H2O = (UO2)3(OH)5+ + 5H+
  log K = −15.641
  UO2+2 + CO3−2 = UO2CO3
   log K = 10.064
  UO2+2 + 2CO3−2 = UO2(CO3)2−2
   log K = 16.977
  UO2+2 + 3CO3−2 = UO2(CO3)3−4
  log K = 21.397
Table A7. Thorium speciation [93].
  2 HPO4−2 + 2 H+ + Th+4 = Th(H2PO4)2+2
   log K = 23.2070
  2 HPO4−2 + Th+4 = Th(HPO4)2
   log K = 22.6
  3 HPO4−2 + Th+4 = Th(HPO4)3−2
   log K = 31.1894
  2 H2O + Th+4 = Th(OH)2+2 +2 H+
   log K = −7.1068
  3 H2O + Th+4 = Th(OH)3+ +3 H+
   log K = −11.8623
  4H2O + Th+4 = Th(OH)4 +4H+
   log K = −16.0315
  2 SO4−2 + Th+4 = Th(SO4)2
   log K = 9.6170
  3 SO4−2 + Th+4 = Th(SO4)3−2
   log K=10.4014
  4 SO4−2 + Th+4 = Th(SO4)4−4
   log K=8.400
  2 Th+4 + 2 H2O = Th2(OH)2+6 +2 H+
   log K = −6.4618
  8 H2O + 4 Th+4 = Th4(OH)8+8 +8 H+
   log K = −21.7568
  15 H2O + 6Th+4 = Th6(OH)15+9 +15 H+
   log K = −37.7027
  Th+4 + Cl = ThCl+3
   log K = 0.9536
  2 Cl + Th+4 = ThCl2+2
   log K = 0.6758
  3 Cl + Th+4 = ThCl3+
   log K =1.4975
  4 Cl + Th+4 = ThCl4
   log K = 1.0731
  Th+4 + F = ThF+3
   log K = 7.8725
  2F + Th+4 = ThF2+2
   log K = 14.0884
  3F + Th+4 = ThF3+
   log K = 18.7357
  4 F + Th+4 = ThF4
   log K = 22.1515
  Th+4 + HPO4−2 + H+ = ThH2PO4+3
   log K = 11.7061
  2H+ + Th+4 + HPO4−2 = ThH3PO4+4
   log K = 11.1197
  Th+4 + HPO4−2 = ThHPO4+2
   log K = 10.6799
  Th+4 + H2O = ThOH+3 +H+
   log K = −3.8871
  Th+4 + SO4−2 = ThSO4+2
   log K = 5.3143
Table A8. Log K for autunite, Uranyl_H_orthophosphate, Uranyl_orthophosphate [134], uraninite [90], and thorianite [93].
 Uraninite
   UO2 + 4 H+ = U+4 + 2 H2O
    log K = −3.490
 Autunite
  Ca(UO2)2(PO4)2(H2O)3 = Ca+2 + 2UO2+2 + 2PO4−3 + 3H2O
   log K = −48.36
 Uranyl_H_orthophosphate
  UO2HPO4(H2O)3 = UO2+2 + HPO4−2 + 3H2O
   log K = −13.17
 Uranyl_orthophosphate
  (UO2)3(PO4)2(H2O)4 = 3UO2+2 + 2PO4−3 + 4H2O
   log K = −49.36
 Thorianite
  ThO2 +4 H+ = Th+4 + 2 H2O
  log K =1.8624

References

  1. El Zrelli, R. Metallic Trace Element Transfer Modalities in the Central Part of Gabes Gulf, Tunisia: A Geochemical, Mineralogical, Sedimentological, and Biological Approach. Ph.D. Dissertation, University of Toulouse III-Paul Sabatier, Toulouse, France, 2017. [Google Scholar]
  2. Chaalal, O.; Madhuranthakam, C.M.R.; Moussa, B.; Hossain, M.M. Sustainable Approach for Recovery of Sulfur from Phophogypsum. ACS Omega 2020, 5, 8151–8157. [Google Scholar] [CrossRef] [PubMed]
  3. Arhouni, F.E.; Hakkar, M.; Ouakkas, S.; Haneklaus, N.; Boukhair, A.; Nourreddine, A.; Benjelloun, M. Evaluation of the physicochemical, heavy metal and radiological contamination from phosphogypsum discharges of the phosphoric acid production unit on the coast of El Jadida Province in Morocco. J. Radioanal. Nucl. Chem. 2023, 332, 4019–4028. [Google Scholar] [CrossRef]
  4. Cheggour, M.; Langston, W.J.; Chafik, A.; Texier, H.; Idrissi, H.; Boumezzough, A. Phosphate industry discharges and their impact on metal contamination and intertidal macrobenthos: Jorf Lasfar and Safi coastline (Morocco). Toxicol. Environ. Chem. 1999, 70, 159–179. [Google Scholar] [CrossRef]
  5. Fakhri, M.; Abboud-Abi Saab, M.; Romano, J.-C. The use of sediments to assess the impact of Selaata phosphate plant on Batroun coastal area (Lebanon, Levantine Basin). Leban. Sci. J. 2008, 9, 29–42. [Google Scholar]
  6. El Zrelli, R.; Rabaoui, L.; Daghbouj, N.; Abda, H.; Castet, S.; Josse, C.; van Beek, P.; Souhaut, M.; Michel, S.; Bejaoui, N.; et al. Characterization of phosphate rock and phosphogypsum from Gabes phosphate fertilizer factories (SE Tunisia): High mining potential and implications for environmental protection, Environ. Sci. Pollut. Res. 2018, 25, 14690–14702. [Google Scholar] [CrossRef]
  7. Rutherford, P.M.; Dudas, M.J.; Samek, R.A. Environmental impacts of phosphogypsum. Sci. Total Environ. 1994, 149, 1–38. [Google Scholar] [CrossRef]
  8. Rutherford, P.M.; Dudas, M.J.; Arocena, J.M. Radioactivity and elemental composition of phosphogypsum produced from three phosphate rock sources. Waste Manag. Res. 1995, 13, 407–423. [Google Scholar] [CrossRef]
  9. Rutherford, P.M.; Dudas, M.J.; Arocena, J.M. Heterogeneous distribution of radionuclides, barium and strontium in phosphogypsum by-product. Sci. Total Environ. 1996, 180, 201–209. [Google Scholar] [CrossRef]
  10. Papastefanou, C.; Stoulos, S.; Ioannidou, A.; Manolopoulou, M. The application of phosphogypsum in agriculture and the radiological impact. J. Environ. Radioact. 2006, 89, 188–198. [Google Scholar] [CrossRef]
  11. Pérez-López, R.; Nieto, J.M.; López-Coto, I.; Aguado, J.L.; Bolivar, J.P.; Santisteban, M. Dynamics of contaminants in phosphogypsum of the fertilizer industry of Huelva (SW Spain): From phosphate rock ore to the environment. Appl. Geochem. 2010, 25, 705–715. [Google Scholar] [CrossRef]
  12. El Zrelli, R.; Rabaoui, L.; Van Beek, P.; Castet, S.; Souhaut, M.; Grégoire, M.; Courjault-Radé, P. Natural radioactivity and radiation hazard assessment of industrial wastes from the coastal phosphate treatment plants of Gabes (Tunisia, Southern Mediterranean Sea). Mar. Pollut. Bull. 2019, 146, 454–461. [Google Scholar] [CrossRef] [PubMed]
  13. El Zrelli, R.; Baliteau, J.Y.; Yacoubi, L.; Castet, S.; Grégoire, M.; Fabre, S.; Sarazin, V.; Daconceicao, L.; Courjault-Radé, P.; Rabaoui, L. Rare earth elements characterization associated to the phosphate fertilizer plants of Gabes (Tunisia, Central Mediterranean Sea): Geochemical properties and behavior, related economic losses, and potential hazards. Sci. Total Environ. 2021, 791, 148268. [Google Scholar] [CrossRef] [PubMed]
  14. Silva, L.F.O.; Oliveira, M.L.S.; Crissien, T.J.; Santosh, M.; Bolivar, J.; Shao, L.; Dotto, G.L.; Gasparotto, G.; Schindler, M. A review on the environmental impact of phosphogypsum and potential health impacts through the release of nanoparticles. Chemosphere 2022, 286, 131513. [Google Scholar] [CrossRef] [PubMed]
  15. Zairi, M.; Rouis, M.J. Impacts environnementaux du stockage du phosphogypse à Sfax (Tunisie). Bull. Lab. Ponts Chaussées 1999, 219, 29–40. [Google Scholar]
  16. Jalali, J.; Gaudin, P.; Capiaux, H.; Ammar, E.; Lebeau, T. Fate and transport of metal trace elements from phosphogypsum piles in Tunisia and their impact on soil bacteria and wild plants. Ecotoxicol. Environ. Saf. 2019, 174, 12–25. [Google Scholar] [CrossRef]
  17. Ben Garali, A.; Salah, S.; Henchiri, M.; Srarfi, F. Assessment of heavy metals contamination/pollution of phosphogypsum waste of the Mdhilla region (Gafsa, southern Tunisia). Environ. Monit. Assess. 2024, 196, 1204. [Google Scholar] [CrossRef]
  18. Pérez-López, R.; Macías, F.; Cánovas, C.R.; Sarmiento, A.M.; Pérez-Moreno, S.M. Pollutant flows from a phosphogypsum disposal area to an estuarine environment: An insight from geochemical signatures. Sci. Total Environ. 2016, 553, 42–51. [Google Scholar] [CrossRef]
  19. González, F. InSAR-based mapping of ground deformation caused by industrial waste disposals: The case study of the Huelva phosphogypsum stack, SW Spain. Bull. Eng. Geol. Environ. 2022, 81, 304. [Google Scholar] [CrossRef]
  20. Pérez-López, R.; Álvarez-Valero, A.M.; Nieto, J.M. Changes in mobility of toxic elements during the production of phosphoric acid in the fertilizer industry of Huelva (SW Spain) and environmental impact of phosphogypsum wastes. J. Hazard. Mater. 2007, 148, 745–750. [Google Scholar] [CrossRef]
  21. Zou, C.; Shi, Z.; Yang, Y.; Zhang, J.; Hou, Y.; Zhang, N. The Characteristics, Enrichment, and Migration Mechanism of Cadmium in Phosphate Rock and Phosphogypsum of the Qingping Phosphate Deposit, Southwest China. Minerals 2023, 13, 107. [Google Scholar] [CrossRef]
  22. Shi, X.; Zeng, A.; Duan, H.; Zhang, H.; Yang, J. Status and development trends of phosphogypsum utilization in China. Circ. Econ. 2024, 3, 100116. [Google Scholar] [CrossRef]
  23. Ke, H.; Zheng, S.N.; Zhang, P.Z.; Xiao, B.; Lan, J.W.; Zhang, S.; Hu, J. Leaching behavior and release mechanism of pollutants from different depths in a phosphogypsum stockpile. Waste Manag. 2024, 189, 230–242. [Google Scholar] [CrossRef] [PubMed]
  24. Hull, C.D.; Burnett, W.C. Radiochemistry of Florida phosphogypsum. J. Environ. Radioact. 1996, 32, 213–238. [Google Scholar] [CrossRef]
  25. Adeoye, C.; Gupta, J.; Demers, N.; Adhikari, A. Variations of radon and airborne particulate matter near three large phosphogypsum stacks in Florida. Environ. Monit. Assess. 2021, 193, 284. [Google Scholar] [CrossRef]
  26. Burnett, W.C.; Elzerman, A.W. Nuclide migration and the environmental radiochemistry of Florida phosphogypsum. J. Environ. Radioact. 2001, 54, 27–51. [Google Scholar] [CrossRef]
  27. Mazzilli, B.; Palmiro, V.; Saueia, C.; Nisti, M.B. Radiochemical characterization of Brazilian phosphogypsum. J. Environ. Radioact. 2000, 49, 113–122. [Google Scholar] [CrossRef]
  28. Borges, R.C.; Ribeiro, F.C.A.; Lauria, D.d.C.; Bernedo, A.V.B. Radioactive characterization of phosphogypsum from Imbituba, Brazil. J. Environ. Radioact. 2013, 126, 188–195. [Google Scholar] [CrossRef]
  29. Reis, R.G.; Lauria, D.C. The potential radiological impact from a Brazilian phosphate facility. J. Environ. Radioact. 2014, 136, 188–194. [Google Scholar] [CrossRef]
  30. Hallin, I.L.; Naeth, M.A.; Chanasyk, D.S.; Nichol, C.K. Assessment of a Reclamation Cover System for Phosphogypsum Stacks in Central Alberta, Canada. J. Environ. Qual. 2010, 39, 2160–2169. [Google Scholar] [CrossRef]
  31. Turner, L.E.; Dhar, A.; Naeth, M.A.; Chanasyk, D.S.; Nichol, C.K. Effect of soil capping depth on phosphogypsum stack revegetation. Environ. Sci. Pollut. Res. 2022, 29, 50166–50176. [Google Scholar] [CrossRef]
  32. Robinson, M.J.C.; Dhar, A.; Naeth, M.A.; Nichol, C.K. Phosphogypsum impacts on soil chemical properties and vegetation tissue following reclamation. Environ. Monit. Assess. 2023, 195, 769. [Google Scholar] [CrossRef] [PubMed]
  33. Msila, X.; Labuschagne, F.; Barnard, W.; Billing, D.G. Radioactive nuclides in phosphogypsum from the lowveld region of South Africa. S. Afr. J. Sci. 2016, 112, 5. [Google Scholar] [CrossRef] [PubMed]
  34. Wildenboer, R.A.; Sandenbergh, R.F. Extraction of Rare Earth Elements from Phalaborwa phosphogypsum. J. S. Afr. Inst. Min. Metall. 2024, 124, 575–582. [Google Scholar] [CrossRef]
  35. Louw, I. Potential radiological impact of the phosphate industry in South Africa on the public and the environment (Paper 1). J. Environ. Radioact. 2020, 217, 106214. [Google Scholar] [CrossRef]
  36. Lysandrou, M.; Pashalidis, I. Uranium chemistry in stack solutions and leachates of phosphogypsum disposed at a coastal area in Cyprus. J. Environ. Radioact. 2008, 99, 359–366. [Google Scholar] [CrossRef]
  37. Lysandrou, M.; Charalambides, A.; Pashalidis, I. Radon emanation from phosphogypsum and related mineral samples in Cyprus. Radiat. Meas. 2007, 42, 1583–1585. [Google Scholar] [CrossRef]
  38. Liatsou, I.; Pashalidis, P. Radio-environmental impacts and uranium radiochemistry of phosphogypsum disposed at a coastal area in Cyprus. In Proceedings of the 4th International Conference on Sustainable Solid Waste Management 2016, Limassol, Cyprus, 23–25 June 2016. [Google Scholar]
  39. Al-Hwaiti, M.S.; Ranville, J.F. Distribution of potentially toxic metal and radionuclide contamination in soils related to phosphogypsum waste stockpiling in the Eshidiya Mine, Jordan. Geochem. Explor. Environ. Anal. 2010, 10, 419–433. [Google Scholar] [CrossRef]
  40. Al-Hwaiti, M.S.; Ranville, J.F.; Ross, P.E. Bioavailability and mobility of trace metals in phosphogypsum from Aqaba and Eshidiya, Jordan. Geochemistry 2010, 70, 283–291. [Google Scholar] [CrossRef]
  41. Zielinski, R.A.; Al-Hwaiti, M.S.; Budahn, J.R.; Ranville, J.F. Radionuclides, trace elements, and radium residence in phosphogypsum of Jordan. Environ. Geochem. Health 2011, 33, 149–165. [Google Scholar] [CrossRef]
  42. El Zrelli, R.; Yacoubi, L.; Castet, S.; Grégoire, M.; Josse, C.; Olive, J.-F.; Courjault-Radé, P.; van Beek, P.; Zambardi, T.; Souhaut, M.; et al. PET plastics as a Trojan horse for radionuclides. J. Hazard. Mater. 2023, 441, 129886. [Google Scholar] [CrossRef]
  43. El Zrelli, R.; Rabaoui, L.; Abda, H.; Daghbouj, N.; Pérez-López, R.; Castet, S.; Aigouy, T.; Bejaoui, N.; Courjault-Radé, P. Characterization of the role of phosphogypsum foam in the transport of metals and radionuclides in the Southern Mediterranean Sea. J. Hazard. Mater. 2019, 363, 258–267. [Google Scholar] [CrossRef] [PubMed]
  44. El Zrelli, R.; Fabre, S.; Castet, S.; Grégoire, M.; Fersi, O.; Josse, C.; Cousin, A.-M.; Courjault-Radé, P. Unveiling the organic nature of phosphogypsum foam: Insights into formation dynamics, pollution load, and contribution to marine pollution in the Southern Mediterranean Sea. J. Hazard. Mater. 2024, 480, 135732. [Google Scholar] [CrossRef] [PubMed]
  45. El Zrelli, R.; Rabaoui, L.; Ben Alaya, M.; Daghbouj, N.; Castet, S.; Besson, P.; Michel, S.; Bejaoui, N.; Courjault-Radé, P. Seawater quality assessment and identification of pollution sources along the central coastal area of Gabes Gulf (SE Tunisia): Evidence of industrial impact and implications for marine environment protection. Mar. Pollut. Bull. 2018, 127, 445–452. [Google Scholar] [CrossRef] [PubMed]
  46. Darmoul, B.; Vitiello, P. Recherches expérimentales sur la toxicité aiguë des rejets de phosphogypse sur quelques organismes benthiques marins. Bull. Inst. Nat. Sci. Technol. Mer. Salammbô 1980, 7, 63–89. [Google Scholar]
  47. Darmoul, B.; Hadj Ali Salem, M.; Vitiello, P. Effets des rejets industriels de la région de Gabès (Tunisie) sur le milieu récepteur. Bull. Inst. Nat. Sci. Technol. Mer. Salammbô 1980, 7, 5–61. [Google Scholar]
  48. Darmoul, B. Pollution dans le Golfe de Gabès (Tunisie): Bilan des six années de surveillance (1976–1981). Bull. Inst. Nat. Sci. Technol. Mer. Salammbô 1988, 15, 61–84. [Google Scholar]
  49. Soussi, N.; Ben Mammou, A. Les rejets de phosphogypse dans le Golfe de Gabès et leur impact sur l’environnement marin. Rapp. Comm. Int. Mer. Médit. 1992, 33. Available online: https://www.ciesm.org/online/archives/abstracts/pdf/33/CIESM_Congress_1992_Trieste_article_l_0150.pdf (accessed on 3 October 2024).
  50. Guillaumont, B.; Ben Mustapha, S.; Ben Moussa, H.; Zaouali, J.; Soussi, N.; Ben Mammou, A.; Cariou, C. Pollution impact study in Gabes Gulf (Tunisia) using remote sensing data. Mar. Technol. Soc. J. 1995, 29, 46–58. [Google Scholar]
  51. Ben Mammou, A.; Soussi, N.; Added, A. Répartition et évolution du phosphogypse dans le Golfe de Gabès. Rev. Méditerr.Environ. 2009, 3, 544–555. [Google Scholar]
  52. El Zrelli, R.; Courjault-Radé, P.; Rabaoui, L.; Daghbouj, N.; Mansour, L.; Balti, R.; Castet, S.; Attia, F.; Michel, S.; Bejaoui, N. Biomonitoring of coastal pollution in the Gulf of Gabes (SE. Tunisia): Use of Posidonia oceanica seagrass as a bioindicator and its mat as an archive of coastal metallic contamination. Environ. Sci. Pollut. Res. 2017, 24, 22214–22225. [Google Scholar] [CrossRef]
  53. El Kateb, A.; Stalder, C.; Rüggeberg, A.; Neururer, C.; Spangenberg, J.E.; Spezzaferri, S. Impact of industrial phosphate waste discharge on the marine environment in the Gulf of Gabes (Tunisia). PLoS ONE 2018, 13, e0197731. [Google Scholar] [CrossRef] [PubMed]
  54. El Zrelli, R.; Yacoubi, L.; Castet, S.; Grégoire, M.; Lin, Y.-J.; Attia, F.; Ayranci, K.; Abdel Baki, Z.; Courjault-Radé, P.; Rabaoui, L. Compartmentation of trace metals in Cymodocea nodosa from a heavily polluted area (Central Gulf of Gabes; Southern Mediterranean Sea): Potential use of the seagrass as environmental monitoring and bioremediation tool. Reg. Study Mar. Sci. 2023, 65, 103056. [Google Scholar] [CrossRef]
  55. Bejaoui, B.; Raïs, S.; Koutitonsky, V. Modélisation de la dispersion du phosphogypse dans le golfe de Gabès. Bull. Inst. Nat. Sci. Technol. Mer. Salammbô 2004, 31, 103–109. [Google Scholar]
  56. Rabaoui, L.; El Zrelli, R.; Ben Mansour, M.; Balti, R.; Mansour, L.; Tlig-Zouari, S.; Guerfel, M. On the relationship between the diversity and structure of benthic macroinvertebrate communities and sediment enrichment with heavy metals in Gabes gulf Tunisia. J. Mar. Biol. Assoc. UK 2015, 95, 233–245. [Google Scholar] [CrossRef]
  57. Rabaoui, L.; El Zrelli, R.; Balti, R.; Mansour, L.; Courjault-Radé, P.; Daghbouj, N.; Tlig Zouari, S. Metal bioaccumulation in two edible cephalopods in the Gulf of Gabes, south-eastern Tunisia: Environmental and human health risk assessment. Environ. Sci. Pollut. Res. 2017, 24, 1686–1699. [Google Scholar] [CrossRef]
  58. El Kateb, A.; Stalder, C.; Neururer, C.; Pisapia, C.; Spezzaferri, S. Correlation between pollution and decline of Scleractinian Cladocora caespitosa (Linnaeus. 1758) in the Gulf of Gabes. Heliyon 2016, 2, e00195. [Google Scholar] [CrossRef]
  59. El Kateb, A.; Stalder, C.; Martínez-Colón, M.; Mateu-Vicens, G.; Francescangeli, F.; Coletti, G.; Stainbank, S.; Spezzaferri, S. Foraminiferal-based biotic indices to assess the ecological quality status of the Gulf of Gabes (Tunisia): Present limitations and future perspectives. Ecol. Indic. 2020, 111, 105962. [Google Scholar] [CrossRef]
  60. Oudi, A.; Chokri, M.A.; Hammouda, A.; Chaabane, R.; Badraoui, R.; Besnard, A.; Santos, R. Physiological impacts of pollution exposure in seabird’s progeny nesting in a Mediterranean contaminated area. Mar. Pollut. Bull. 2019, 142, 196–205. [Google Scholar] [CrossRef]
  61. Ghemari, C.; Waterlot, C.; Ayari, A.; Douay, F.; Nasri-Ammar, K. Bioaccumulation of heavy metals in the terrestrial isopod Porcellionides pruinosus in the vicinity of Gabes-Ghannouch industrial complex. Hum. Ecol. Risk Assess. Int. J. 2019, 26, 1270–1284. [Google Scholar] [CrossRef]
  62. Hammouda, A.; Ayadi, T.; Selmi, S. Long-term Exposure to Industrial Chemical Contamination Affects the Magnitude of Predator-induced Immunosuppression in a Free-living Passerine. Bull. Environ. Contam. Toxicol. 2024, 112, 42. [Google Scholar] [CrossRef]
  63. Hattab, S.; Boughattas, I.; Cappello, T.; Zitouni, N.; Touil, G.; Romdhani, I.; Livet, A.; Bousserrhine, N.; Banni, M. Heavy metal accumulation, biochemical and transcriptomic biomarkers in earthworms Eisenia andrei exposed to industrially contaminated soils from south-eastern Tunisia (Gabes Governorate). Sci. Total Environ. 2023, 887, 163950. [Google Scholar] [CrossRef] [PubMed]
  64. Nasri, I.; Hammouda, A.; Hamza, F.; Zrig, A.; Selmi, S. Heavy metal accumulation in lizards living near a phosphate treatment plant: Possible transfer of contaminants from aquatic to terrestrial food webs. Environ. Sci. Pollut. Res. 2017, 24, 12009–12014. [Google Scholar] [CrossRef] [PubMed]
  65. Gargouri, D.; Annabi-Trabelsi, N.; Karam, Q.; Ali, M.; Ayadi, H. Assessment of metallic pollution in the waters, suspended particulate matter, and surface sediments of the central coastal area of the Gulf of Gabès, Mediterranean Sea. J. Mater. Environ. Sci. 2021, 12, 584–594. [Google Scholar]
  66. El Zrelli, R.; Courjault-Radé, P.; Rabaoui, L.; Castet, S.; Michel, S.; Bejaoui, N. Heavy metal contamination and ecological risk assessment in the surface sediments of the coastal area surrounding the industrial complex of Gabes city Gulf of Gabes, SE Tunisia. Mar. Pollut. Bull. 2015, 101, 922–929. [Google Scholar] [CrossRef]
  67. El Zrelli, R.; Rabaoui, L.; Ben Alaya, M.; Castet, S.; Zouiten, C.; Bejaoui, N.; Courjault-Radé, P. Decadal effects of solid industrial wastes on the coast: Gulf of Gabes (Tunisia, Southern Mediterranean Sea) as an example. Estuar. Coast. Shelf Sci. 2019, 224, 281–288. [Google Scholar] [CrossRef]
  68. Gargouri, D.; Gzam, M.; Kharroubi, A.; Jedoui, Y. Use of sediment quality indicators for heavy metals contamination and ecological risk assessment in urbanized coastal zones. Environ. Earth Sci. 2018, 77, 381. [Google Scholar] [CrossRef]
  69. Mansouri, B.; Gzam, M.; Souid, F.; Telahigue, F.; Chahlaoui, A.; Ouarrak, K.; Kharroubi, A. Assessment of heavy metal contamination in Gulf of Gabès coastland (south-eastern Tunisia): Impact of chemical industries and drift currents. Arab. J. Geosci. 2020, 13, 1–11. [Google Scholar] [CrossRef]
  70. Zaouali, J. Les peuplements benthiques de la petite Syrte, golfe de Gabès-Tunisie. Résultats de la campagne de prospection du mois de juillet 1996. Étude préliminaire: Biocénoses et thanatocénoses récentes. Mar. Life 1993, 3, 47–60. [Google Scholar]
  71. El Zrelli, R.; Rabaoui, L.; Roa-Ureta, R.H.; Gallai, N.; Castet, S.; Grégoire, M.; Bejaoui, N.; Courjault-Radé, P. Economic impact of human-induced shrinkage of Posidonia oceanica meadows on coastal fisheries in the Gabes Gulf (Tunisia, Southern Mediterranean Sea). Mar. Pollut. Bull. 2020, 155, 111124. [Google Scholar] [CrossRef]
  72. El Zrelli, R.; Hcine, A.; Yacoubi, L.; Roa-Ureta, R.H.; Gallai, N.; Castet, S.; Grégoire, M.; Courjault-Radé, P.; Rabaoui, L. Economic losses related to the reduction of Posidonia ecosystem services in the Gulf of Gabes (Southern Mediterranean Sea). Mar. Pollut. Bull. 2023, 186, 114418. [Google Scholar] [CrossRef]
  73. Crocetta, F.; Agius, D.; Balistreri, P.; Bariche, M.; Bayhan, Y.; Çakir, M.; Ciriaco, S.; Corsini-Foka, M.; Deidun, A.; EL Zrelli, R.; et al. New Mediterranean Biodiversity Records (October 2015). Mediterr. Mar. Sci. 2015, 16, 682–702. [Google Scholar] [CrossRef]
  74. Rabaoui, L.; Arculeo, M.; Mansour, L.; Tlig-Zouari, S. Occurrence of lepsessian Portunus segnis (Crustacea: Decapoda) in the Gulf of Gabes (Tunisia): First record and new information on its biology and ecology. Cah. Biol. Mar. 2015, 56, 159–175. [Google Scholar]
  75. Shaiek, M.; El Zrelli, R.; Crocetta, F.; Rabaoui, L. On the occurrence of three exotic decapods, Callinectes sapidus (Portunidae), Portunus segnis (Portunidae), and Trachysalambria palaestinensis (Penaeidae), in northern Tunisia, with updates on the distribution of the two invasive portunids in the Mediterranean Sea. BioInvasions Rec. 2021, 1, 158–169. [Google Scholar] [CrossRef]
  76. EL Zrelli, R.; Mansour, L.; Crocetta, F.; Rabaoui, L. The macroalgae Lophocladia lallemandii and Sarconema filiforme and the spaghetti bryozoan amathia verticillate in native seagrass beds in the Gulf of Gabes (Southeastern Tunisia, Mediterranean Sea). BioInvasions Rec. 2021, 10, 103–108. [Google Scholar] [CrossRef]
  77. Kousteni, V.; Anastasiadis, A.; Bariche, M.; Battaglia, P.; Bonifazi, A.; Ćetković, I.; Chimienti, G.; Colombo, M.; Constantinou, C.; Corsini-Foka, M.; et al. New records of rare species in the Mediterranean Sea (May 2022). Mediterr. Mar. Sci. 2022, 23, 417–446. [Google Scholar]
  78. Jabeur, C.; Gobert, B.; Missaoui, H. Typology of the small-scale fishing fleet in the Gulf of Gabès (Tunisia). Aquat. Living Resour. 2000, 13, 421–428. [Google Scholar] [CrossRef]
  79. Papaconstantinou, C.; Farrugio, H. Fisheries in the Mediterranean. Mediterr. Mar. Sci. 2000, 1, 5–18. [Google Scholar] [CrossRef]
  80. Hattab, T.; Ben Rais Lasram, F.; Sammari, C. Modélisation de l’habitat des ressources halieutiques dans le Golfe de Gabès et projections selon un scénario de changement global. Bull. Inst. Nat. Sci. Technol. Mer. Salammbô 2011, 38, 65–71. [Google Scholar]
  81. Rabaoui, L.; Balti, R.; El Zrelli, R.; Tlig-Zouari, S. Assessment of heavy metals pollution in the Gulf of Gabes (Tunisia) using four mollusk species. Mediterr. Mar. Sci. 2014, 15, 45–58. [Google Scholar] [CrossRef]
  82. The United States Environmental Protection Agency. SW-846 Reference Methodology: Method 3050B. Standard Operating Procedure for the Digestion of Soil/Sediment Samples Using a Hotplate/Beaker Digestion Technique; The United States Environmental Protection Agency: Chicago, IL, USA, 1999. [Google Scholar]
  83. Elmasri, K.; Shetwi, A. Natural Radioactivity levels along the Mediterranean sand beach between Tajoura and Misrata, Libya. J. Eng. Res. 2023, 35, 91–100. [Google Scholar]
  84. Kritsananuwat, R.; Sahoo, S.K.; Fukushi, M.; Pangza, K.; Chanyotha, S. Radiological risk assessment of 238U, 232Th and 40K in Thailand coastal sediments at selected areas proposed for nuclear power plant sites. J Radioanal. Nucl. Chem. 2014, 1, 325–334. [Google Scholar] [CrossRef]
  85. Roy-Barman, M.; Lemaître, C.; Ayrault, S.; Jeandel, C.; Souhaut, M.; Miquel, J.-C. The influence of particle composition on Thorium scavenging in the Mediterranean Sea. Earth Planet. Sci. Lett. 2009, 286, 526–534. [Google Scholar] [CrossRef]
  86. Roy-Barman, M.; Coppola, L.; Souhaut, M. Thorium isotopes in the western Mediterranean Sea: An insight into the marine particle dynamics. Earth Planet. Sci. Lett. 2002, 196, 161–174. [Google Scholar] [CrossRef]
  87. Quinby-Hunt, M.S.; Turekian, K.K. Distribution of elements in sea water. Eos Trans. Am. Geophys. Union 1983, 64, 130. [Google Scholar] [CrossRef]
  88. Erel, Y.; Morgan, J.J. The effect of surface reactions on the relative abundances of trace metals in deep-ocean water. Geochim. Cosmochim. Acta 1991, 55, 1807–1813. [Google Scholar] [CrossRef]
  89. Broecker, W.; Peng, T.H. Tracers in the Sea; Eldigio Press: New York, NY, USA, 1982. [Google Scholar]
  90. Parkhurst, D.; Appelo, C.A.J. User’s Guide to PHREEQC (Version 2)—A Computer Program for Speciation, Batch-Reaction, One-Dimensional Transport, and Inverse Geochemical Calculations, Water-Ressources Investigations Report 1999; U.S. Department of the Interior, U.S. Geological Survey: Denver, CO, USA, 1999. [Google Scholar]
  91. Appelo, C.A.J.; Postma, D. Geochemistry, Groundwater and Pollution, 2nd ed.; CRS Press: London, UK, 2005. [Google Scholar] [CrossRef]
  92. Nordstrom, D.K.; Plummer, L.N.; Wigley, T.M.L.; Wolery, T.J.; Ball, J.W.; Jenne, E.A.; Basset, R.L.; Crerar, D.A.; Florence, T.M.; Fritz, B.; et al. A comparison of computerized chemical models for equilibrium calculations in aqueous species, in: Chemical Modeling in Aqueous Systems, Speciation, Sorption, Solubility and Kinetics. Am. Chem. Soc. 1979, 38, 857–892. [Google Scholar] [CrossRef]
  93. Delany, J.M.; Wolery, T.J. The Lawrence Livermore National Laboratory (LLNL) Thermochemical Database; Report UCRL-21658; LLNL, CA., Department of Energy: Washington, DC, USA, 1989. [Google Scholar]
  94. Kinniburgh, D.G.; Cooper, D.M. Predominance and Mineral Stability Diagrams Revisited. Environ. Sci. Technol. 2004, 38, 3641–3648. [Google Scholar] [CrossRef]
  95. Choppin, G.R.; Wong, P.J. The chemistry of actinide behavior in marine systems. Aquat. Geochem. 1998, 4, 77–101. [Google Scholar] [CrossRef]
  96. Langmuir, D.; Herman, J.S. The mobility of thorium in natural waters at low temperatures. Geochim. Cosmochim. Acta 1980, 44, 1753–1766. [Google Scholar] [CrossRef]
  97. Vassas, C.; Pourcelot, L.; Vella, C.; Carpena, J.; Pupin, J.P.; Bouisset, P.; Gulliot, L. Mechanisms of enrichment of natural radioactivity along the beaches of Camargue, France. J. Environ. Radioact. 2006, 91, 146–159. [Google Scholar] [CrossRef]
  98. Akyil, S.; Yusof, A.M. The distribution of uranium and thorium in samples taken from different polluted marine environments. J. Hazard. Mater. 2007, 144, 564–569. [Google Scholar] [CrossRef] [PubMed]
  99. Kannan, V.; Rajan, M.P.; Iyengar, M.A.R.; Ramesh, R. Distribution of natural and anthropogenic radionuclides in soil and beach sand samples of Kalpakkam (India) using hyper pure germanium (HPGe) gamma ray spectrometry. Appl. Radiat. Isot. 2002, 57, 109–119. [Google Scholar] [CrossRef] [PubMed]
  100. Harb, S. Natural radioactivity and external gamma radiation exposure at the coastal Red Sea in Egypt. Radiat. Prot. Dosim. 2008, 130, 376–384. [Google Scholar] [CrossRef] [PubMed]
  101. Abdi, M.R.; Faghihian, H.; Kamal, M.; Mostajaboddavati, M.; Hasanzadeh, A. Distribution of natural radionuclides on coasts of Bushahr, Persian Gulf, Iran. Iran. J. Sci. Technol. Trans. A Sci. 2006, 30, 259–269. [Google Scholar]
  102. Mahdavi, A. The thorium, uranium, and potassium contents of Atlantic and Gulf Coast beach sands. In The Natural Radiation Environment; Adames, J.A.S., Lowder, W.M., Eds.; University of Chicago Press: Chicago, IL, USA, 1964; p. 87. [Google Scholar]
  103. Rudnick, R.L.; Gao, S. The Composition of the Continental Crust. In Treatise on Geochemistry; Holland, H.D., Turekian, K.K., Eds.; The Crust, Elsevier-Pergamon: Oxford, UK, 2003; Volume 3, pp. 1–64. [Google Scholar] [CrossRef]
  104. White, W.M. Geochemistry; Wiley-Blackwell: Oxford, UK, 2013. [Google Scholar]
  105. Cumberland, S.A.; Douglas, G.; Grice, K.; Moreau, J.W. Uranium mobility in organic matter-rich sediments: A review of geological and geochemical processes. Earth-Sci. Rev. 2016, 159, 160–185. [Google Scholar] [CrossRef]
  106. Bacon, M.P.; Anderson, R.F. Distribution of thorium isotopes between dissolved and particulate forms in the deep sea. J. Geophys. Res. 1982, 87, 2045. [Google Scholar] [CrossRef]
  107. Coale, K.H.; Bruland, K.W. Oceanic stratified euphotic zone as elucidated by 234Th:238U disequilibria. Limnol. Oceanogr. 1987, 32, 189–200. [Google Scholar] [CrossRef]
  108. Tipping, E. Humic Ion-Binding Model VI: An Improved Description of the Interactions of Protons and Metal Ions with Humic Substances. Aquat. Geochem. 1998, 4, 3–47. [Google Scholar] [CrossRef]
  109. Davis, J.A.; Meece, D.E.; Kohler, M.; Curtis, G.P. Approaches to surface complexation modeling of Uranium (VI) adsorption on aquifer sediments. Geochim. Cosmochim. Acta 2004, 68, 3621–3641. [Google Scholar] [CrossRef]
  110. Quigley, M.S.; Santschi, P.H.; Guo, L.; Honeyman, B.D. Sorption irreversibility and coagulation behavior of 234Th with marine organic matter. Mar. Chem. 2001, 76, 27–45. [Google Scholar] [CrossRef]
  111. Kantar, C. Heterogeneous processes affecting metal ion transport in the presence of organic ligands: Reactive transport modeling. Earth-Sci. Rev. 2007, 81, 175–198. [Google Scholar] [CrossRef]
  112. Bryan, N.D.; Abrahamsen, L.; Evans, N.; Warwick, P.; Buckau, G.; Weng, L.; Van Riemsdijk, W.H. The effects of humic substances on the transport of radionuclides: Recent improvements in the prediction of behaviour and the understanding of mechanisms. Appl. Geochem. 2012, 27, 378–389. [Google Scholar] [CrossRef]
  113. Chuang, C.Y.; Santschi, P.H.; Wen, L.S.; Guo, L.; Xu, C.; Zhang, S.; Jiang, Y.; Ho, Y.F.; Schwehr, K.A.; Quigg, A.; et al. Binding of Th. Pa. Pb. Po and Be radionuclides to marine colloidal macromolecular organic matter. Mar. Chem. 2015, 173, 320–329. [Google Scholar] [CrossRef]
  114. The International Union for Conservation of Nature. The IUCN Red List Assessment, Loggerhead Turtle, Caretta Caretta. Available online: https://www.iucnredlist.org/species/3897/119333622 (accessed on 9 February 2023).
  115. Abdel-Gawad, I.I.; Mohammad, M.H.M. Congenital Malformations in Neonates After Irradiation of Rats During Pregnancy. In Proceedings of the Seventh Conference of Nuclear Sciences and Applications 2000, Cairo, Egypt, 6–10 February 2000; Aly, H.F., Ed.; International Atomic Energy Agency: Vienna, Austria, 2000. [Google Scholar]
  116. Copplestone, D.; Bielby, S.; Jones, S.R.; Patton, D.; Daniel, P.; Gize, I. Impact Assessment of Ionising Radiation on Wildlife; R&D Publication: Bristol, UK, 2001; p. 128. [Google Scholar]
  117. De Santis, M.; Cesari, E.; Nobili, E.; Straface, G.; Cavaliere, A.F.; Caruso, A. Radiation effects on development. Birth Defects Res. C Embryo Today 2007, 81, 177–182. [Google Scholar] [CrossRef] [PubMed]
  118. Yablokov, A.V. 10. Chernobyl’s radioactive impact on fauna. Ann. N. Y. Acad. Sci. 2009, 1181, 255–280. [Google Scholar] [CrossRef]
  119. The Agency for Toxic Substances and Diseases Registry. Toxicological Profile of Uranium. 2013. Available online: https://www.atsdr.cdc.gov/toxprofiles/tp150.pdf (accessed on 1 November 2024).
  120. The World Health Organization. Health Effects of Depleted Uranium. 2001. Available online: https://apps.who.int/gb/ebwha/pdf_files/WHA54/ea5419a1.pdf (accessed on 1 November 2024).
  121. The National Cancer Institute. Thorium, Cancer Causing Substances. Available online: https://www.cancer.gov/about-cancer/causes-prevention/risk/substances/thorium (accessed on 1 November 2024).
  122. The United States Environmental Protection Agency. Radionuclide Basics: Uranium. 2023. Available online: https://www.epa.gov/radiation/radionuclide-basics-uranium (accessed on 1 November 2024).
  123. The United States Environmental Protection Agency. Radionuclide Basics: Thorium. 2023. Available online: https://www.epa.gov/radiation/radionuclide-basics-thorium (accessed on 1 November 2024).
  124. Savabieasfahani, M.; Ahamadani, F.; Damghani, A. Living near an active U.S. military base in Iraq is associated with significantly higher hair thorium and increased likelihood of congenital anomalies in infants and children. Environ. Pollut. 2020, 256, 113070. [Google Scholar] [CrossRef]
  125. Yin, S.; Tian, T.; Wang, C.; Wang, D.; Pi, X.; Liu, M.; Jin, L.; Liu, J.; Wang, L.; Li, Z. Prenatal uranium exposure and risk for fetal neural tube defects: A case-control study in women living in a rural area of northern China. J. Hazard. Mater. 2022, 424, 127466. [Google Scholar] [CrossRef]
  126. Yu, L.; Lin, Z.; Cheng, X.; Chu, J.; Li, X.; Chen, C.; Zhu, T.; Li, W.; Lin, W.; Tang, W. Thorium inhibits human respiratory chain complex IV (cytochrome c oxidase). J. Hazard. Mater. 2022, 424, 127546. [Google Scholar] [CrossRef]
  127. The European Union. Etude D’impact de la Pollution Industrielle Sur L’économie de la Région de Gabès; Requête n°2016/372829/1, Rapport final; The European Union: Luxembourg, 2017; 140p. [Google Scholar]
  128. Tchounwou, P.B.; Yedjou, C.G.; Patlolla, A.K.; Sutton, D.J. Heavy metal toxicity and the environment. Exp. Suppl. 2012, 101, 133–164. [Google Scholar] [CrossRef]
  129. Gwenzi, W.; Mangori, L.; Danha, C.; Chaukura, N.; Dunjana, N.; Sanganyado, E. Sources, behaviour, and environmental and human health risks of high-technology rare earth elements as emerging contaminants. Sci. Total Environ. 2018, 636, 299–313. [Google Scholar] [CrossRef]
  130. Håkanson, L. An ecological risk index for aquatic pollution control. a sedimentological approach. Water Res. 1980, 14, 975–1001. [Google Scholar] [CrossRef]
  131. Tomlinson, D.C.; Wilson, J.G.; Harris, C.R.; Jeffery, D.W. Problems in the Assessment of Heavy Metals Levels in Estuaries and the Formation of a Pollution Index. Environ. Eval. 1980, 33, 566–575. [Google Scholar] [CrossRef]
  132. Müller, G. Index of geoaccumulation in the sediments of the Rhine River. Geol. J. 1969, 2, 108–118. [Google Scholar]
  133. Xu, Z.Q.; Ni, S.J.; Tuo, X.G.; Zhang, C.J. Calculation of heavy metals’ toxicity coefficient in the evaluation of potential ecological risk index. Environ. Sci. Technol. 2008, 31, 112–115. [Google Scholar]
  134. Gorman-Lewis, D.; Shvareva, T.; Kubatko, K.-A.; Burns, P.C.; Wellman, D.M.; McNamara, B.; Szymanowski, J.E.; Navrotsky, A.; Fein, J.B. Thermodynamic properties of autunite, uranyl hydrogen phosphate, and uranyl orthophosphate from solubility and calorimetric measurements. Environ. Sci. Technol. 2009, 43, 7416–7422. [Google Scholar] [CrossRef]
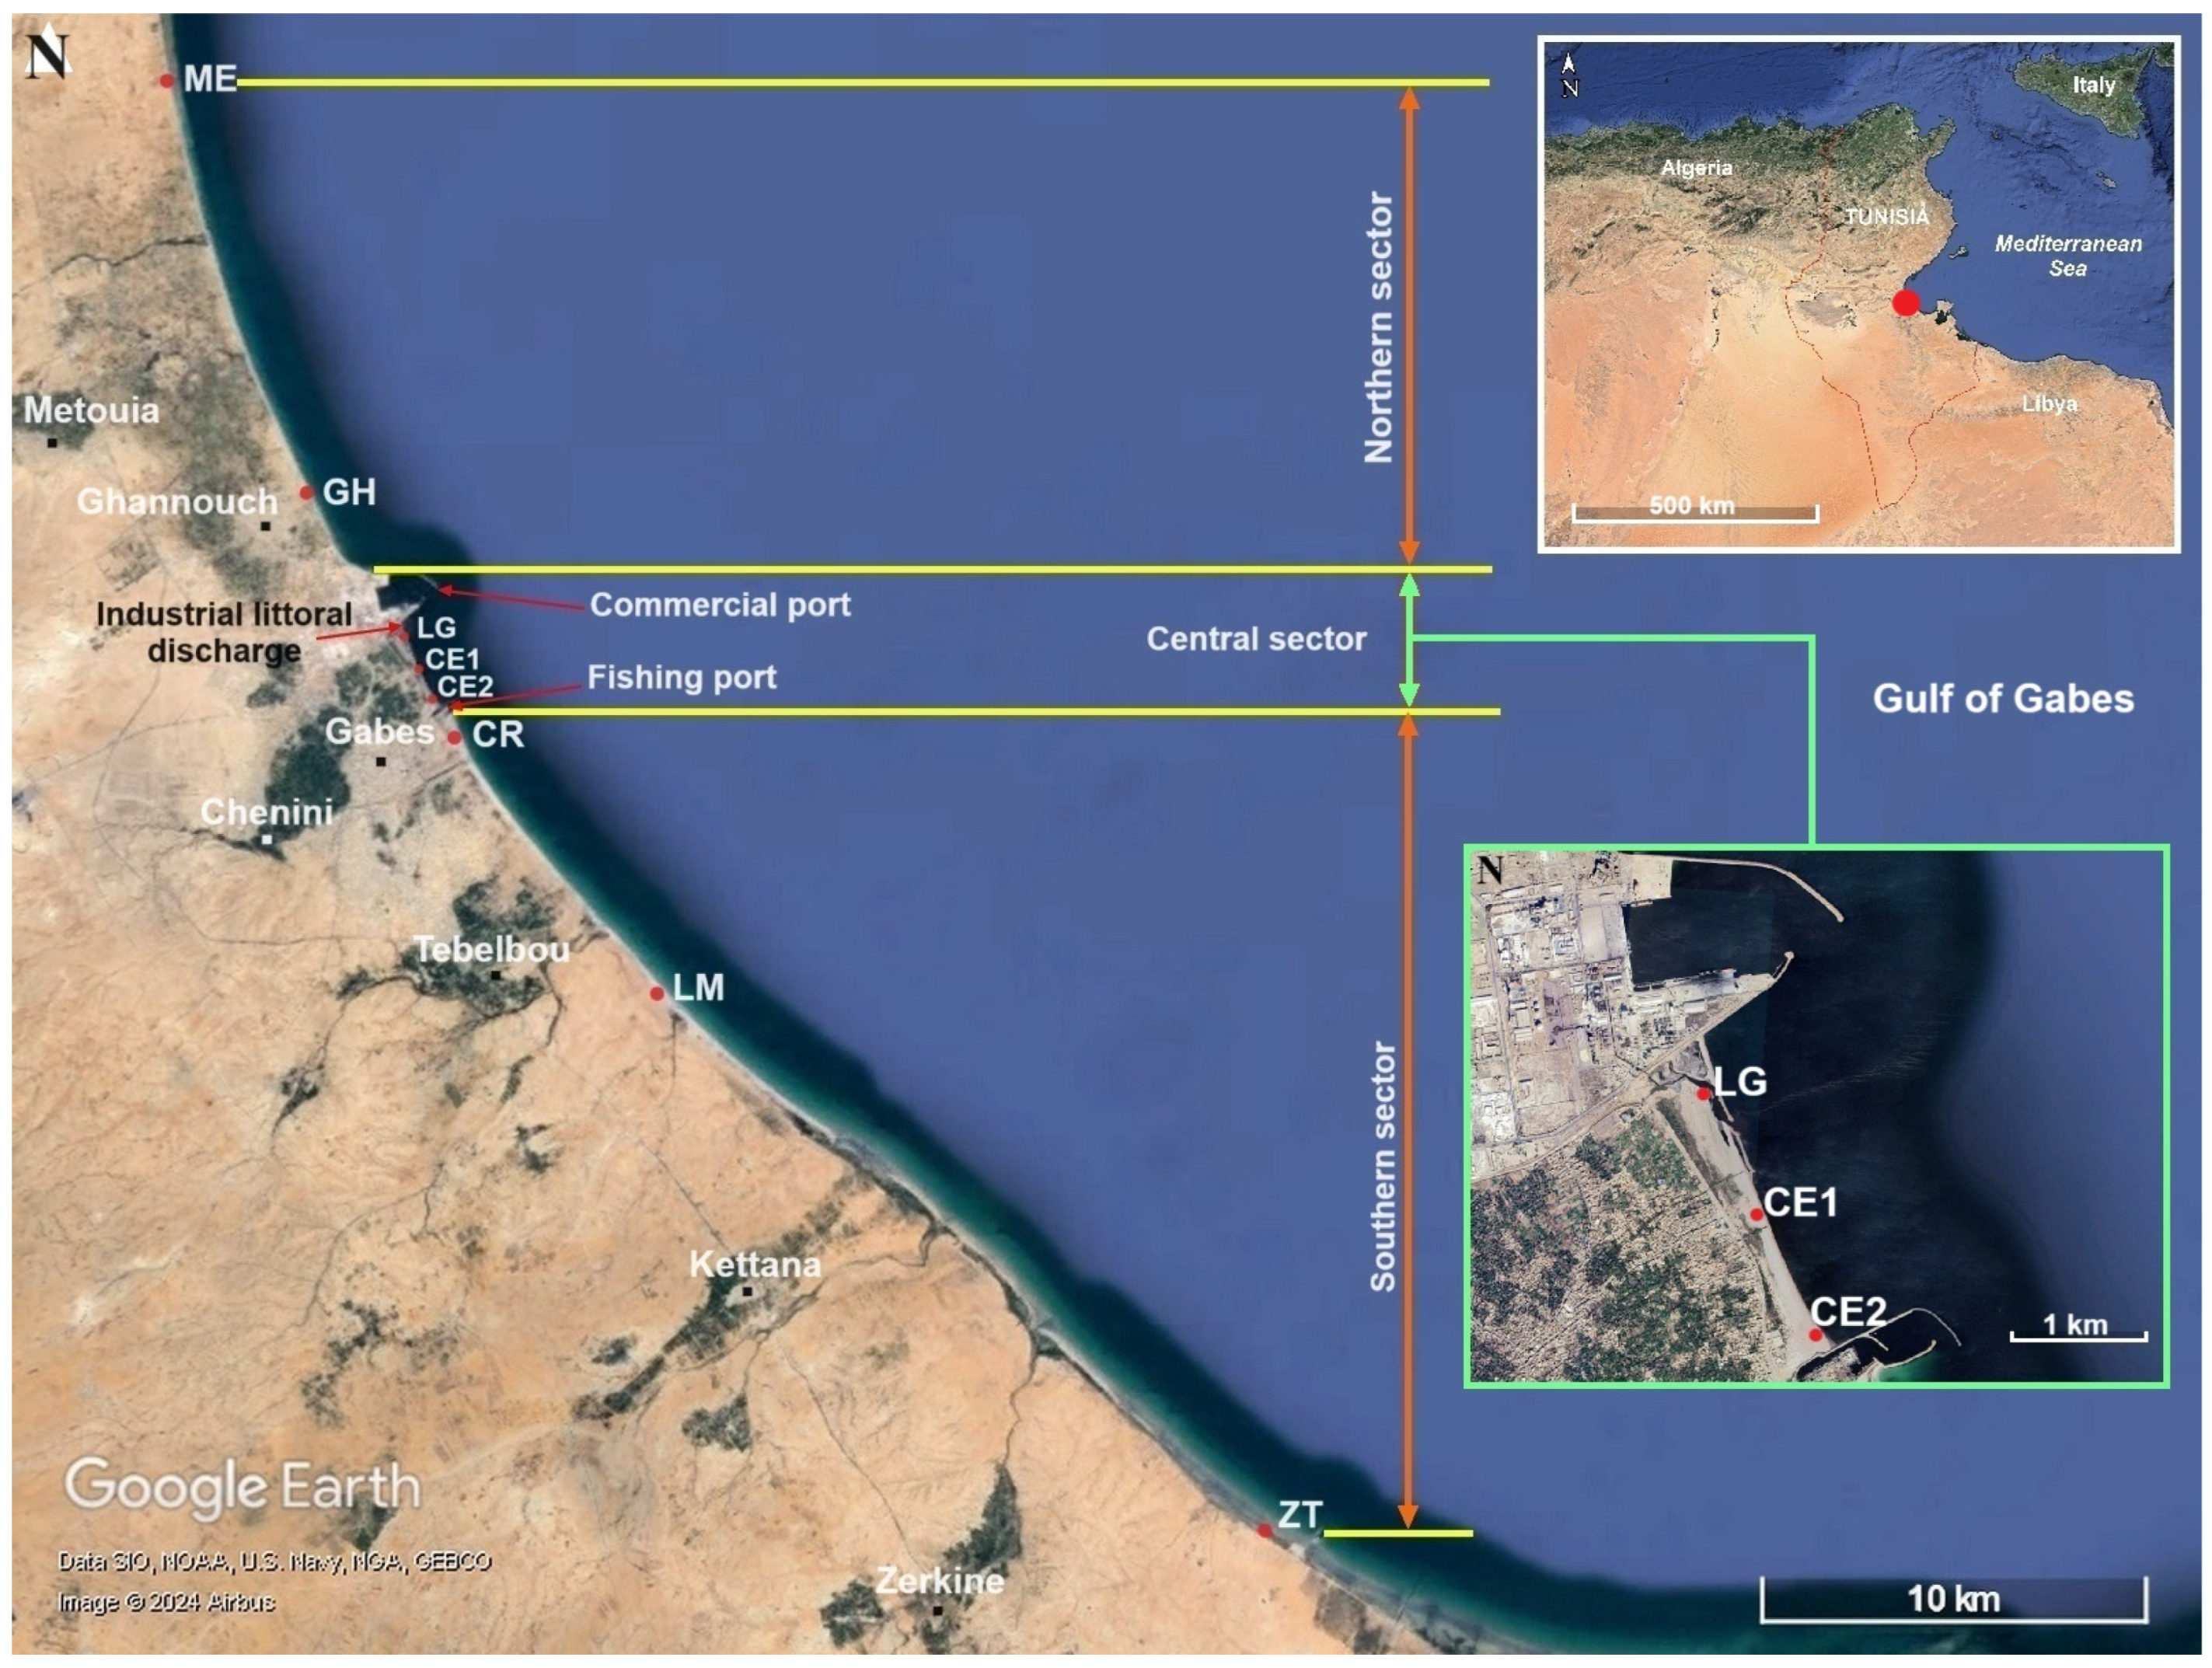
Figure 1. Map of the study area showing sampling locations (ME: Metouia; GH: Ghannouch; LG: Gusir Ben Amara (Legusir); CE: Chatt Sidi Abd Essalam (CE1 and CE2); CR: Corniche; LM: Limaoua; ZT: Zarat), the locations of the Gabes phosphoric acid plant littoral waste discharge, and the commercial and fishing ports of Gabes. The red dot in the upper right map indicates the location of the sampling area in Tunisia.
Sustainability 17 01283 g001
Figure 2. Thermodynamic modeling for stations ME and GH (northern sector), using the LLNL database. Left side: saturation indices for various U-bearing compounds vs. increasing concentrations of U in solution (in mg.kgw−1; simulating the discharge from factories). Right side: first y-axis: equilibrium precipitation and corresponding moles of the most stable phase, here soddyite (black line) only; second y-axis: remaining U concentration (red line) in solution after mineral precipitation. NB: Compounds whose saturation indexes are below the minimum y value (i.e., −4) are not depicted e.g., autunite-H.
Sustainability 17 01283 g002
Figure 3. Thermodynamic modeling for stations LG, CE1, and CE2 (central sector), using the LLNL database. Left side: saturation indices for various U-bearing compounds vs. increasing concentrations of U in solution (in mg.kgw−1; simulating the discharge from factories). Right side: first y-axis: equilibrium precipitation and corresponding moles of the most stable phases, here autunite (violet) or soddyite (black); second y-axis: remaining U concentration (red) in solution after mineral precipitation. NB: Compounds whose saturation indexes are below the minimum y value (i.e., −4) are not depicted.
Sustainability 17 01283 g003
Figure 4. Thermodynamic modeling for stations CR, LM, and ZT (southern sector), using the LLNL database. Left side: saturation indices for various U-bearing compounds vs. increasing concentrations of U in solution (in mg.kgw−1; simulating the discharge from factories). Right side: first y-axis: equilibrium precipitation and corresponding moles of the most stable phases, here autunite (violet) and/or soddyite (black); second y-axis: remaining U concentration (red) in solution after mineral precipitation. NB: Compounds whose saturation indexes are below the minimum y value (i.e., −4) are not depicted.
Sustainability 17 01283 g004
Figure 5. Uranium (left side) and thorium (right side) speciation calculated according to pH and phosphate concentrations. The blue area delimits the range of values observed in the Gulf of Gabes (Table A1). In detail, the effect of pH (A) is modeled with a phosphate concentration of 1.17 mg.kg−1, whereas for the effect of phosphate concentration (B), the pH is set to 7.74 (see text for more details). The thermodynamic database used in the calculations is the LLNL.
Sustainability 17 01283 g005
Figure 6. Photographs of some dead organisms/species encountered frequently in Chatt Sidi Abd Essalam beach (the central sector): (13): Caretta caretta; (4): Xiphias gladius; (5): Ardea cinerea; (6): Sterna hirundo; (7): Chroicocephalus genei; (8): Tursiops truncatus.
Sustainability 17 01283 g006
Figure 7. Skeleton-deformed individuals of Portunus segnis (1) and Liza aurata (2) observed in Chatt Sidi Abd Essalam beach (the central sector).
Sustainability 17 01283 g007
Table 1. Detailed description (Area and GPS coordinates (D.D.)) of sampling sites in the central area of the Gulf of Gabes. PG: phosphogypsum; PGF: phosphogypsum foam; PR: Phosphate Rock. Station abbreviations: ME: Metouia; GH: Ghannouch; LG: Gusir Ben Amara (Legusir); CE: Chatt Sidi Abd Essalam (CE1 and CE2); CR: Corniche; LM: Limaoua; ZT: Zarat.
SectorsStations (N → S)Area DescriptionLatitude (°N)Longitude (°E)
Northern sectorMENo anthropogenic source of pollution; intensive coastal fishing activity; presumed as a non-polluted site.34.04656410.034136
GHSome industrial (ICF) and domestic pollution sources; intensive coastal fishing activity; presumed as a moderately polluted site.33.94665010.075997
Central sectorLGIn the vicinity of the industrial (GCT fertilizer factories) and domestic waste (water and solids) littoral discharge points, which are considered to be the main sources of marine pollution in the Gulf of Gabes.33.91248310.103112
CE1Located in the inter-harbor area (Chatt Sidi Abd Essalam beach); important mix of industrial (PG, PGF, PR, fluoridated wastewater, etc.) and urban wastewater marine discharges; low coastal fishing activity; considered to be the most polluted site in the Gulf of Gabes.33.90482810.108053
CE233.89707310.113337
Southern sectorCRIn front of Corniche beach; rare coastal fishing activity; presumed as a non-polluted site.33.88860610.119686
LMNo anthropogenic source of pollution; average coastal fishing activity; presumed as a non-polluted site.33.82929110.177279
ZT33.70264210.345200
Table 2. U and Th concentrations (mg·kg−1 d.w.), organic matter content (TOC; %), fine fraction (FF; ∅ < 63 µm; %), and distance to the industrial littoral discharge (DILD; km) of beach surface sediments collected from the Central Gulf of Gabes. Station abbreviations: ME: Metouia; GH: Ghannouch; LG: Gusir Ben Amara (Legusir); CE: Chatt Sidi Abd Essalam (CE1 and CE2); CR: Corniche; LM: Limaoua; ZT: Zarat.
MEGHLGCE1CE2CRLMZT
U1.62 ± 0.081.25 ± 0.0638.0 ± 1.933.0 ± 1.69.6 ± 0.50.71 ± 0.040.77 ± 0.041.14 ± 0.06
Th1.38 ± 0.071.22 ± 0.0610.6 ± 0.56.6 ± 0.32.43 ± 0.121.00 ± 0.052.14 ± 0.113.46 ± 0.17
TOC0.040 ± 0.0020.020 ± 0.0016.1 ± 0.31.06 ± 0.050.120 ± 0.0060.010 ± 0.001<0.0100.070 ± 0.004
FF0.230.090.350.360.110.130.212.65
DILD16.204.540.0051.021.983.1211.5432.36
Table 3. Values of the environmental and ecological assessment indexes (contamination factor: Cf; Pollution Load Index: PLI; geo-accumulation index: Igeo; Potential Ecological Risk Index: PERI; EU: individual potential ecological risk of U), calculated for each of the stations sampled in the Central Gulf of Gabes. Details on these indexes can be found in Table A1.
Stations
(N → S)
CfPLIIgeoPERI
UThValueUThTotalEU
MT2.31.41.8−0.4−0.1−0.591.3
GH1.81.21.5−0.8−0.3−1.170.4
LG53.510.623.94.22.87.02141
CE146.56.617.54.02.16.11859
CE213.62.45.72.20.72.9542
CR1.01.01.0−1.6−0.6−2.240.0
LM1.12.11.5−1.50.5−0.943.4
ZT1.63.52.4−0.91.20.364.2
Table 4. Comparative table of U and Th concentrations in sand (mg·kg−1 d.w.) in the Central Gulf of Gabes with those recorded in sand in other coastal regions of the world. Concentration values were converted from radioactivity values for Camargue (France), the coastal areas of Malysia, Kalpakkam (India), the Red Sea (Egypt), Bushahr (Iran), and the Atlantic coasts of the USA using conversion factors given below (*).
LocationsRange/MeanUThReferences
Gulf of Gabes (Tunisia)Range0.71–38.001.00–10.60Present study
Mean10.773.60
Camargue (France)Range7.64–180.21
(95–2240 Bq.kg−1) *
33.17–852.58
(135–3470 Bq.kg−1) *
[97]
Mean--
Coastal areas of Malaysia Range3.00–6.600.01–0.68[98]
Mean4.490.26
Kalpakkam (India)Range2.90–20.76
(36–258 Bq.kg−1) *
86.49–951.35
(352–3872 Bq.kg−1) *
[99]
Mean9.98
(124 Bq.kg−1) *
396.31
(1613 Bq.kg−1) *
The Red Sea (Egypt)Range0.58–3.29
(7.2–40.9 Bq.kg−1) *
0.91–9.31
(3.7–37.9 Bq.kg−1) *
[100]
Mean--
Bushahr (Iran)Range0.97–6.03
(12–75 Bq.kg−1) *
1.97–8.11
(8–33 Bq.kg−1) *
[101]
Mean1.83
(22.7 Bq.kg−1) *
3.05
(12.4 Bq.kg−1) *
Atlantic and Gulf Coasts (USA)Range0.3–0.61–2[102]
Mean--
* The conversion factors: 1 µg g−1 of U = 12.43 Bq.kg−1 of 238U; 1 µg g−1 of Th = 4.07 Bq.kg−1 of 232Th [84].
Disclaimer/Publisher’s Note: The statements, opinions and data contained in all publications are solely those of the individual author(s) and contributor(s) and not of MDPI and/or the editor(s). MDPI and/or the editor(s) disclaim responsibility for any injury to people or property resulting from any ideas, methods, instructions or products referred to in the content.

