Article

Spatiotemporal Analysis, Predictive Modeling, and Driving Mechanism Investigation of Carbon Storage Dynamics in Changde City Under the Framework of LUCC

1
College of Forestry, Central South University of Forestry and Technology, Changsha 410004, China
2
Engineering Research Center for Forestry Equipment of Hunan Province, Central South University of Forestry and Technology, Changsha 410004, China
3
College of Computer and Mathematics, Central South University of Forestry and Technology, Changsha 410004, China
*
Author to whom correspondence should be addressed.
Sustainability 2025, 17(3), 1273; https://doi.org/10.3390/su17031273
Submission received: 6 January 2025 / Revised: 28 January 2025 / Accepted: 29 January 2025 / Published: 5 February 2025

Abstract

:
In the context of the worldwide attention on climate change, examining how land use relates to the carbon sink functions of regions is essential. This research innovatively utilizes the 2000–2020 land use data of Changde City, integrating the PLUS and InVEST models to analyze spatiotemporal changes and predict scenarios. It also combines the parameter geodetector and multiscale geographically weighted regression model to dissect driving factor distributions and mechanisms, capture interactions and multiscale impacts, uncover underlying laws, pioneer new paths for similar studies, and support regional ecological sustainability. The results show that from 2000–2020, forest and arable land areas declined while construction land expanded, leading to a yij1,172,200-ton carbon storage reduction in Changde City. Carbon storage decreased under natural development and arable land protection scenarios but increased in the ecological scenario. The main drivers of carbon storage in Changde City are the DEM, slope, and annual average temperature, with their interactions enhancing spatial heterogeneity. Human activities, especially in mountains and urbanizing regions, negatively impact carbon storage. This study aids in optimizing land resource allocation, improving land use efficiency, and promoting coordinated and sustainable development in Changde City’s ecological, economic, and social systems.

1. Introduction

As human activities increasingly impact the natural environment, the rise in carbon emissions has become one of the primary causes of global climate warming, exerting a profound influence on ecosystem patterns [1,2]. The international community has proposed climate governance goals, aiming to achieve a global carbon peak by 2025 and carbon neutrality by 2050.
By 2020, the Chinese government promises that carbon dioxide emissions will reach the highest in 2030. Neutral carbon dioxide will be achieved in 2060 [3,4]. To this end, the Chinese government has introduced a carbon neutrality strategy that incorporates the utilization of ecosystem carbon sinks and engineered approaches such as carbon capture, utilization, and storage (CCUS). Enhancing the carbon sequestration capacity of terrestrial ecosystems to mitigate the rise in CO2 concentrations and global warming is recognized as a critical pathway for achieving China’s carbon neutrality goals [5,6].
The systemic, structural, and complex nature of land resources is an important factor that cannot be overlooked in the process of exploring ecological and environmental issues, such as the carbon cycle in terrestrial ecosystems [7,8,9]. In order to obtain material products and achieve economic activities, human beings develop and utilize land, leading to changes in the land’s characteristics, utilization patterns, and coverage conditions. This reduces vegetation cover and soil regulation capacity, which negatively impacts the carbon sink function of the region and the climate conditions [10,11,12,13]. Research shows that changes in land use classifications can significantly increase carbon emissions. For example, the conversion of large areas of farmland into urbanized zones reduces carbon sink regions while expanding carbon source areas [14,15,16,17]. Consequently, effective land use management and enhanced land efficiency can improve the ability of ecosystems to sequester carbon, thereby promoting the sustainable development of human society [18].
The InVEST model serves as a crucial tool for evaluating the ability of ecosystems to sequester carbon and has found extensive application in research related to land use planning. The model addresses the challenges of previous carbon sequestration capacity evaluation methods, such as the abstract and lack of intuitive descriptions of ecosystem service values. This advantage makes it unique in the field of ecosystem service function assessment, filling the gap in spatially quantitative evaluations and becoming a commonly used model by numerous scholars for estimating carbon stocks in various ecosystems [19,20].
Land use simulation is a crucial tool for studying and predicting future land use changes, and it is widely applied to assess the dynamic evolution trends of land use. Current mainstream land use prediction models at home and abroad include CA-Markov, CLUE-S, FLUS, PLUS, and GeoSOS [21,22,23,24,25,26]. Among them, the PLUS model is optimized and improved based on CA-Markov, FLUS, and other models. It can model the dynamic changes in various land patch types, not only uncovering the potential drivers of land expansion and change but also illustrating land use patterns in different scenarios through policy-driven approaches [27,28]. As a result, an increasing number of researchers have conducted in-depth studies in the ecological field using the “PLUS-InVEST” coupled model.
Shuang Zhang et al. used the Napahai Basin as a case study to apply the coupled ‘PLUS-InVEST’ model and geographical detectors, examining the spatiotemporal evolution of land use and carbon storage over the past two decades and under various future scenarios, as well as identifying drivers of spatial differentiation [29]. Jiaohua Tang et al. focused their study on Guangzhou, utilizing land use data from 2000 to 2020. They employed the integrated ‘PLUS-InVEST’ framework to analyze the spatiotemporal changes in land use and carbon storage while also investigating the factors influencing carbon storage across different urban–rural gradients [30]. Ruei-yuan Wang and colleagues utilized the PLUS and InVEST models, in addition to Geoda software, to forecast the spatial development trends of land use and carbon storage in the Greater Bay Area across various scenarios [31]. Li et al. (Mengyao) incorporated a weight matrix into the Markov framework, in conjunction with the PLUS and InVEST models, to project the spatiotemporal dynamics of land use and carbon storage in the Yangtze River Delta under various shared socio-economic pathway (SSP) and representative concentration pathway (RCP) scenarios [32]. Yue Huang et al. used the PLUS-InVEST coupled model to analyze the spatial pattern changes in land use and carbon storage in Jiangxi Province, China, from 2000 to 2020. The results suggest that focusing on farmland and ecological protection—especially forests—can significantly reduce carbon loss [33]. These investigations offer important perspectives on how alterations in land use affect ecosystem services, and they hold considerable importance for promoting sustainable development on a global scale. While these studies offer a comprehensive quantitative examination of how land use change relates to carbon storage, they often focus on a single scale or static analysis, failing to fully account for the heterogeneity and dynamic changes in driving factors across different spatial scales. This study innovatively combines the optimal geodetector (OPGD) framework with the multiscale geographically weighted regression (MGWR) model, overcoming the limitations of traditional methods. It not only effectively reveals the spatiotemporal heterogeneity of carbon storage changes but also captures the non-stationary characteristics of the driving factors at different spatial scales. Through this innovative integration, this study provides more precise and spatiotemporally adaptive tools for the fine-grained analysis of carbon storage changes, helping to enhance the scientific and effective formulation of land use planning and ecological protection policies.
Changde has a highly diverse ecosystem with significant carbon sequestration potential, with an estimated carbon sequestration capacity of 209 million tons per year [34]. This study takes Changde City as a case, using land use data to assess and examine the characteristics of carbon storage’s spatiotemporal evolution due to land use changes over the past two decades using the model of InVEST. Additionally, the PLUS model is used to forecast land use and carbon storage variations in Changde City across multiple scenarios for 2030. Furthermore, this study analyzes the impacts of various driving factors on carbon storage using methods such as the optimal parameter geographical detector (OPGD) and multiscale geographically weighted regression (MGWR) and visualizes the spatial distribution of these factors.
This research provides scientific support for optimizing land spatial planning, implementing low-carbon strategies, and assessing ecosystem carbon storage in Changde City, thereby promoting local carbon reduction efforts and the sustainable development of the ecological environment.

2. Materials and Methodology

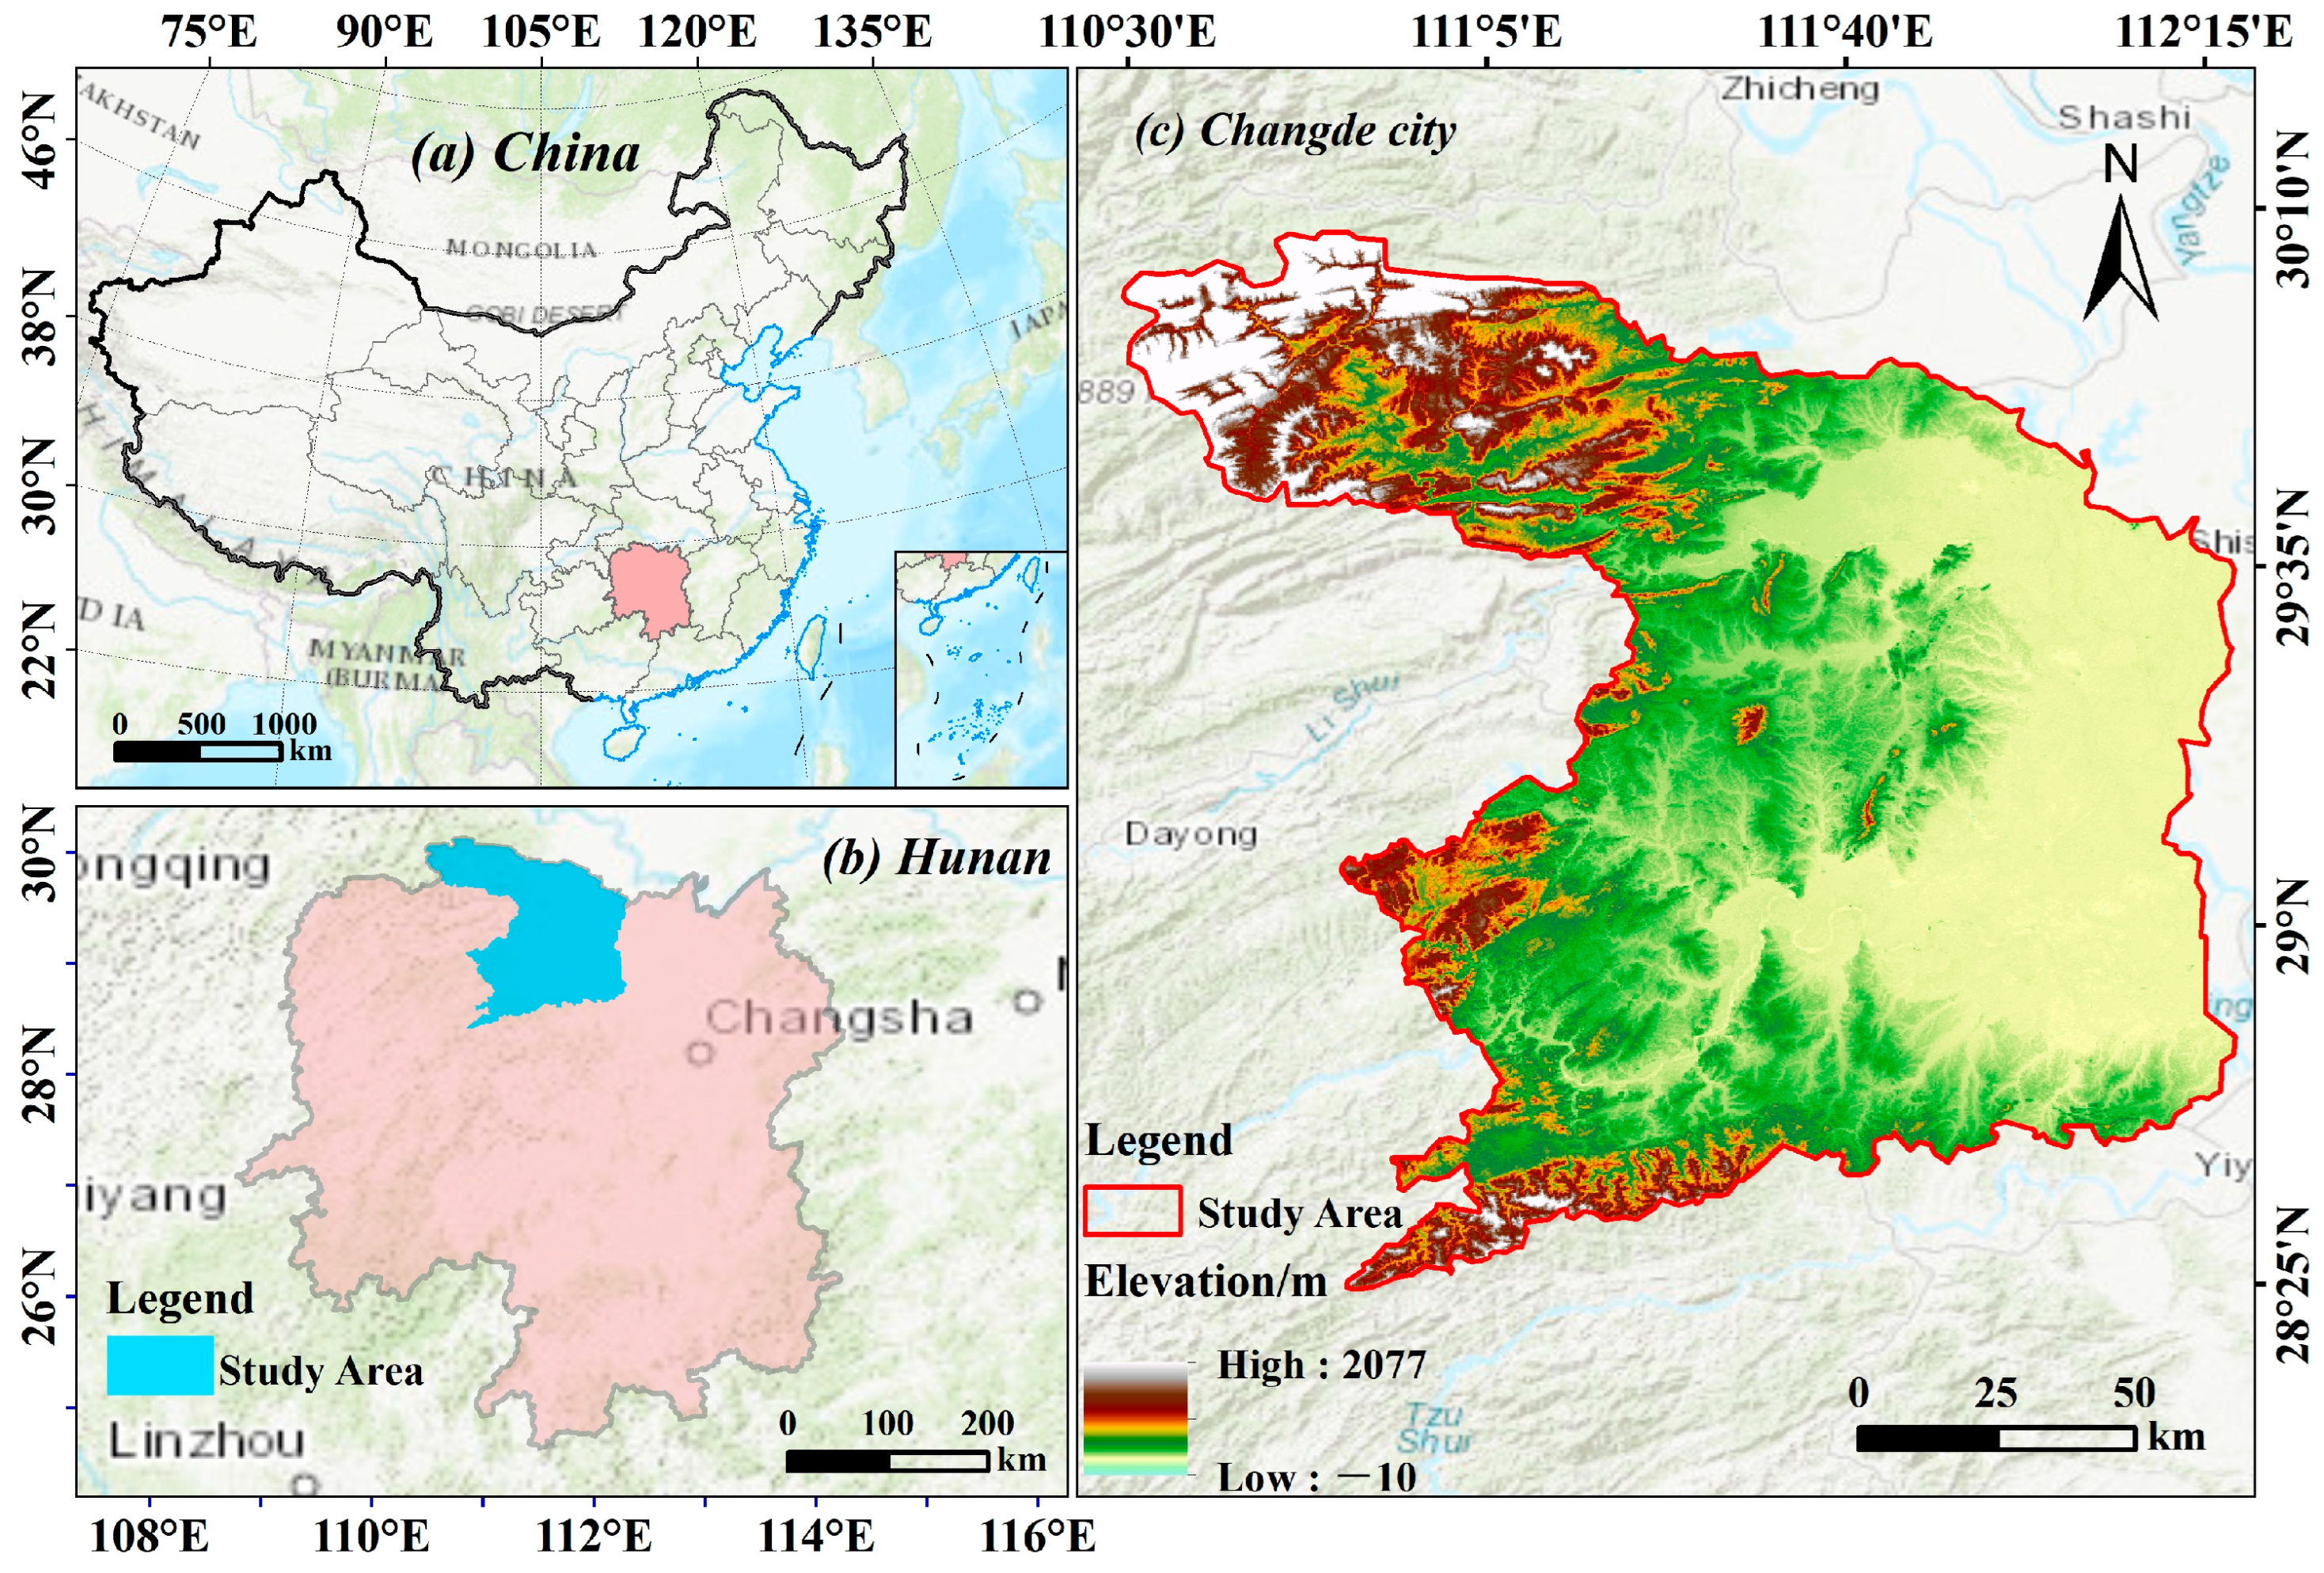
2.1. Research Region

Situated in the northernmost part of Hunan Province, China, Changde City (refer to Figure 1) holds a crucial position within the Yangtze River economic belt and is an essential element of the Dongting Lake Ecological Economic Zone. Covering an area of roughly 18,200 km2 [35], the city features a varied terrain, with elevated regions in the west and lower areas in the east. Mountains are located to the northwest, west, and southwest, while the eastern section is predominantly made up of open plains and wetlands, with numerous lakes found in the southeastern area. The city’s topography exhibits significant diversity. Changde is situated in a humid subtropical climate zone, experiencing an average annual precipitation of 1433 mm and a typical yearly temperature of 18.3 °C, which creates advantageous climatic conditions for human activities.

2.2. Data Support

This research employed various models and data sources to analyze and simulate changes in land use within Changde City. Data on land use for the years 2000, 2010, and 2020 was obtained from the Data Center for Resources and Environmental Sciences, which is part of the Chinese Academy of Sciences (http://www.resdc.cn (accessed on 6 May 2024)). The grid resolution utilized was 30 m × 30 m (refer to Table 1). Predictions of land use change trends were conducted using the Land Use Expansion Simulation (LEAS) module integrated within the model of PLUS. This module identifies spatiotemporal dynamics and, in combination with driving factors, simulates future land use changes. A total of 13 key variables were selected as driving factors and categorized into three groups: natural factors, socio-economic factors, and accessibility factors. Although the model does not require the resolution to be exactly uniform, an inconsistent resolution may lead to errors during actual use. To ensure the consistency and compatibility of the datasets, tools such as rasterizing, resampling, alignment, and coordinate system projection in ArcGIS can be used to standardize the pixel size of all data to 30 m. At the same time, alignment operations are performed to ensure that the number of rows and columns in all datasets is consistent and that the spatial coordinate system is unified to WGS_1984_UTM_Zone_49N, thereby optimizing data processing and analysis.

2.3. Research Methodology and Theory

This research utilizes both the PLUS and InVEST models to conduct an analysis that is dynamic and spatiotemporal in nature and a scenario prediction of land use changes and carbon storage in Changde City. Furthermore, the OPGD and MGWR models are utilized to evaluate the spatial effects of the driving factors and their influence on carbon storage. Through these methodologies, the mechanisms affecting carbon storage are elucidated. The research framework is illustrated in Figure 2.

2.3.1. Spatiotemporal Dynamic Evolution of Land Use

The land use transition matrix enables the quantitative analysis of system states and state transitions, characterizing the structural features of land use changes in a region and the directional changes in different land use types. It reflects the numerical characteristics of land use changes within a certain time and space, as well as the flow of land use types, which is of significant value for comparing the transition quantities between different land use categories during different periods [36,37,38].
In the ArcGIS (10.8) software, an analysis of the overlay is performed on the Land Use and Cover Change (LUCC) raster data from the beginning and ending periods to determine the areas of shared transition among different land use categories within the study area. The calculation formula is presented as follows:
A i j = M i k × 10 + M j k + 1
In the formula, A i j is the two-digit code of the transformation type from land-use type i to land-use type j in a certain research period; M i k represents the state value of the i -th type of land use in the k -th period; M i k + 1 represents the state value of the j -th type of land use in the ( k + 1 ) -th period. Through (1), the transition matrix can be obtained:
S i j = S 11 S 1 n S n 1 S n n
In the formula, S i j represents the area or the overall transferred area from land-use type i to land-use type j , and n represents the types of land use types. The diagonal element S n n represents the area where no change has occurred, that is, the area from land-use type i to itself [39].

2.3.2. Land Use Prediction Under Multiple Scenarios

The PLUS model is a cellular automata (CA) framework that employs raster data aimed at thoroughly investigating the underlying drivers of land expansion and the alterations in land use types, all while simulating and predicting changes in land use across different scenarios [40,41]. It integrates the adaptive Markov chain and the patch-generating mechanism to generate fine-scale land use patterns. Compared to traditional CA models, the PLUS model better handles the changes in dynamics and spatial features associated with various types of land use.
This research is grounded in the 2000 land use data of Changde, which served as the basis for initially simulating land use classifications for the year 2020. The results of the validation revealed a Kappa coefficient of 0.86 and an FOM value of 0.13, confirming that the simulation accuracy meets the required standards. The model is capable of accurately forecasting land use changes in Changde for 2030 under various scenarios.
Based on the draft of the Changde Territorial Spatial Master Plan (2021–2035), this study defined three scenarios: natural development, ecological protection, and farmland protection.
(1)
Natural Development Scenario: This scenario illustrates the trends in land use changes identified from 2000 to 2020, operating without any additional constraints. The variables associated with neighborhood factors and the transition cost matrix for each type of land use are maintained as constants. Using a historical matrix of land use transition probabilities, the distribution of various land use types in Changde for the year 2030 was predicted through a Markov chain approach, considering the natural development scenario.
(2)
Ecological Protection Scenario: The Changde City Territorial Spatial Master Plan (2021–2035) emphasizes the coordinated protection of the mountain, water, forest, farmland, lake, and grassland ecosystems, prioritizing the creation of protective spatial patterns for ecological, agricultural, and disaster prevention purposes. This aims to establish an ecological protection framework characterized by “one core, two corridors, and multiple regions”. To achieve this, modifications are applied to the land use transfer matrix and the parameters for domain weight in accordance with the natural development scenario. In particular, the likelihood of forest and grassland being transformed into construction land is decreased by 50%. Additionally, the ongoing Grain-to-Green Program is continued, increasing the probability of farmland being converted to forest and grassland by 30%. The chance of farmland being transformed into water bodies has risen by 10%, while the probability of transforming unused land into forests and grasslands has risen by 20%. Additionally, there are stringent limitations on the conversion of water bodies to other types of land use. These measures are designed to strengthen ecological barriers, enhance regional ecological resilience, and guide land use changes toward more environmentally sustainable directions.
(3)
Arable land Protection Scenario: Changde City, as a major grain-producing region in Hunan Province, ranks first in both the quantity and quality of its farmland. The Master Plan for Territorial Spatial Development proposes optimizing the agricultural industrial layout in a “one core, two belts, and multiple areas” framework. It stresses the need for strict farmland protection to ensure food security, optimize agricultural production, and promote the development of modern agriculture. The scenario presented is designed to enhance the utilization of farmland and safeguard agricultural resources, targeting a significant reduction in the conversion of farmland to construction land by 70%. This initiative also aims to lower the probability of farmland being transformed into grassland and water bodies by 40%. In conjunction with these reductions, there is a strategic increase of 50% in the likelihood that unused land will be repurposed as farmland. These comprehensive measures are specifically intended to effectively advance the integrated protection of farmland—in terms of its quantity, quality, and ecological integrity. As a result, this approach lays a strong resource foundation that is essential for the sustainable development of a modernized New Changde.

2.3.3. Spatial Distribution and Calculation of Carbon Stocks

The InVEST framework is a holistic tool aimed at evaluating both the amount and financial worth of ecosystem services, thereby aiding in the management of ecosystems and informing decision-making processes. Through an examination of the four primary carbon reservoirs associated with various land use categories—aboveground biomass carbon (Cabove), belowground biomass carbon (Cbelow), soil carbon (Csoil), and carbon from dead organic matter (Cdead)—the model assesses the carbon storage capacity of distinct land use types and produces distribution maps of carbon storage for multiple time frames [42]. The overall carbon storage (Ctotal) is represented by the following equation:
C t o t a l = C a b o v e + C b e l o w + C d e a d + C s o i l
To ensure data accuracy, the model utilized data from previous studies conducted in regions with similar latitudes to the study area, enhancing the model’s regional applicability and reliability. The coefficients for carbon density used in this research were obtained from the National Ecosystem Science Data Center as well as pertinent studies conducted by different researchers (see Table 2) [43].

2.3.4. Analysis of Driving Factors for Carbon Stocks

Compared to traditional geographical detectors, the optimal parameter geographical detector (OPGD) introduces parameter optimization and model adjustment, employing a data-driven automatic optimization method to select the optimal discretization method. This approach improves the rationality of factor partitioning and enhances model robustness, significantly improving the explanation of complex spatial heterogeneity and multi-factor nonlinear relationships [44]. Therefore, this study employs OPGD to analyze the factors influencing carbon storage.
The multiscale geographically weighted regression (MGWR) is an extended version of the traditional geographically weighted regression (GWR). It allows each explanatory variable (driving factor) to have an independent spatial scale (bandwidth) for regression analysis, thereby capturing the multiscale effects of different variables in space. Unlike traditional GWR, which uses a uniform bandwidth, MGWR is more flexible and can reflect the heterogeneity and variation in the influence ranges of different driving factors in local spaces. The basic formula is as follows:
y i = β 0 u i , v i + k = 1 p β k u i , v i x i k + ε i
In the formula, y i represents the value of the dependent variable (carbon storage), u i , v i denotes the spatial coordinates of the i -th sample point, β 0 u i , v i is the spatial intercept term, β k u i , v i x i k represents the local regression coefficient of the k -th explanatory variable that varies with spatial location, x i k is the value of the k -th explanatory variable at the i -th sample point ε i and denotes the error term [45].

3. Results and Analyses

3.1. Spatiotemporal Evolution and Prediction of Land Use

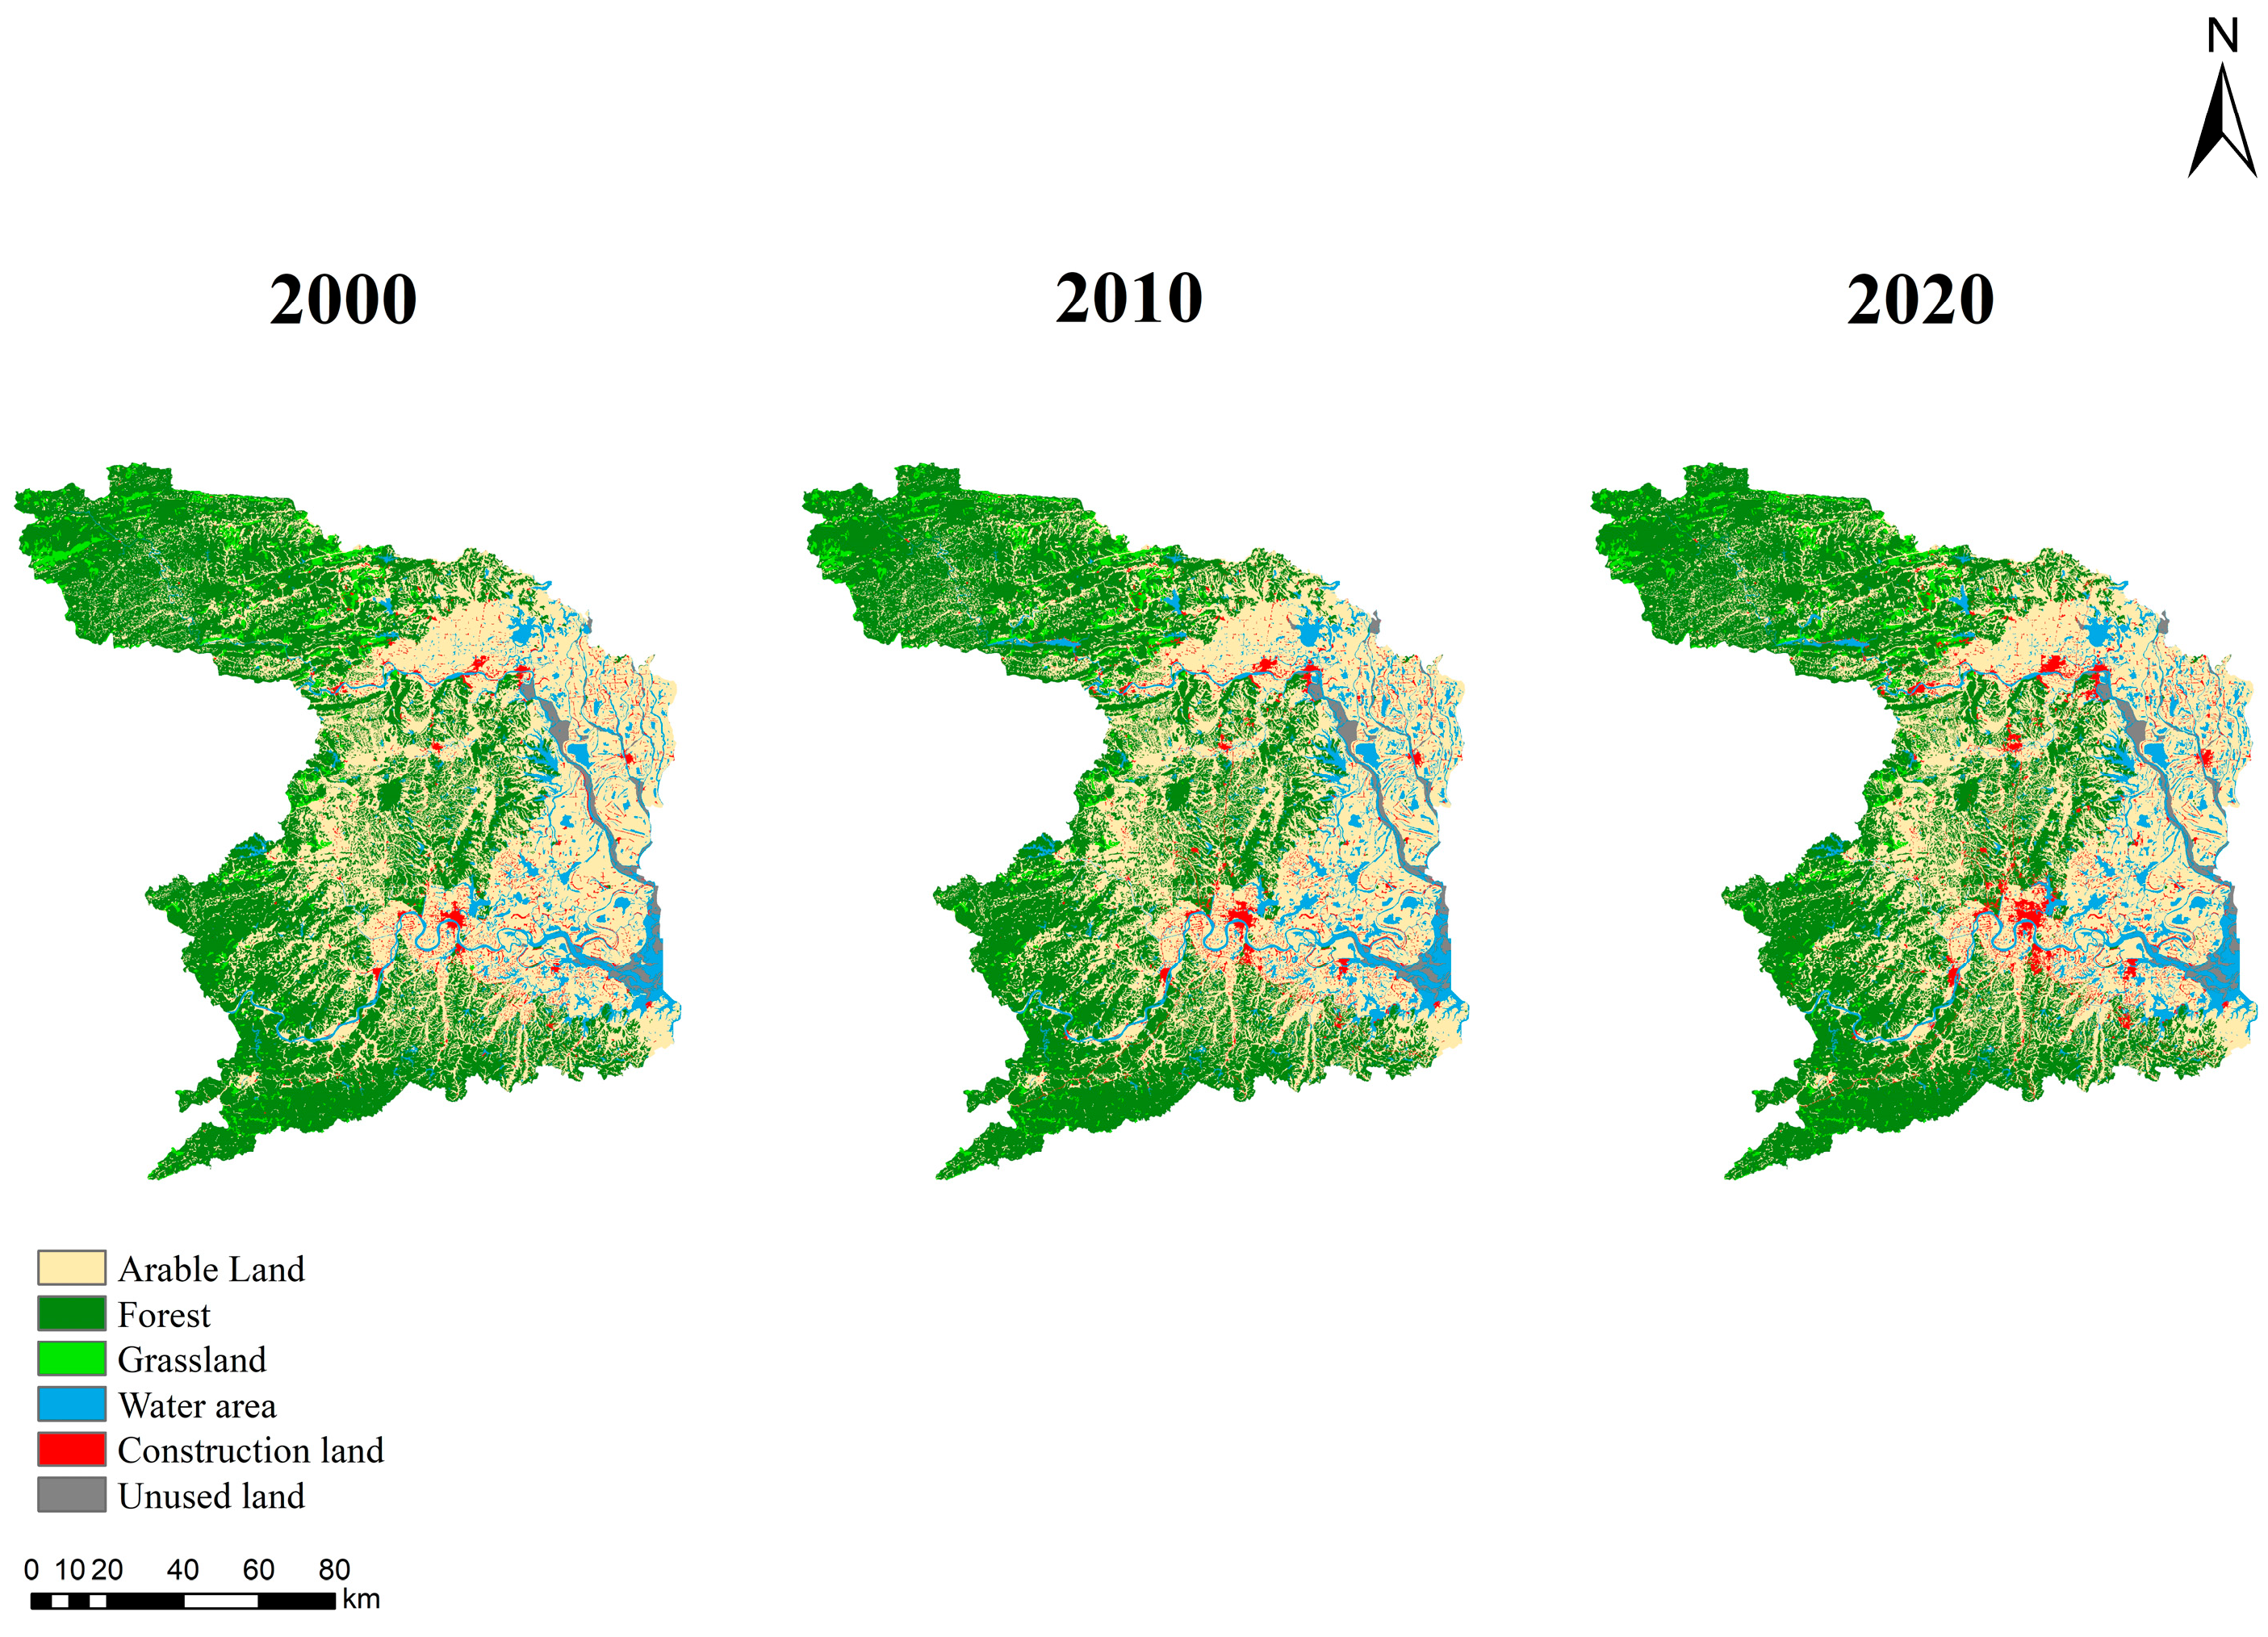
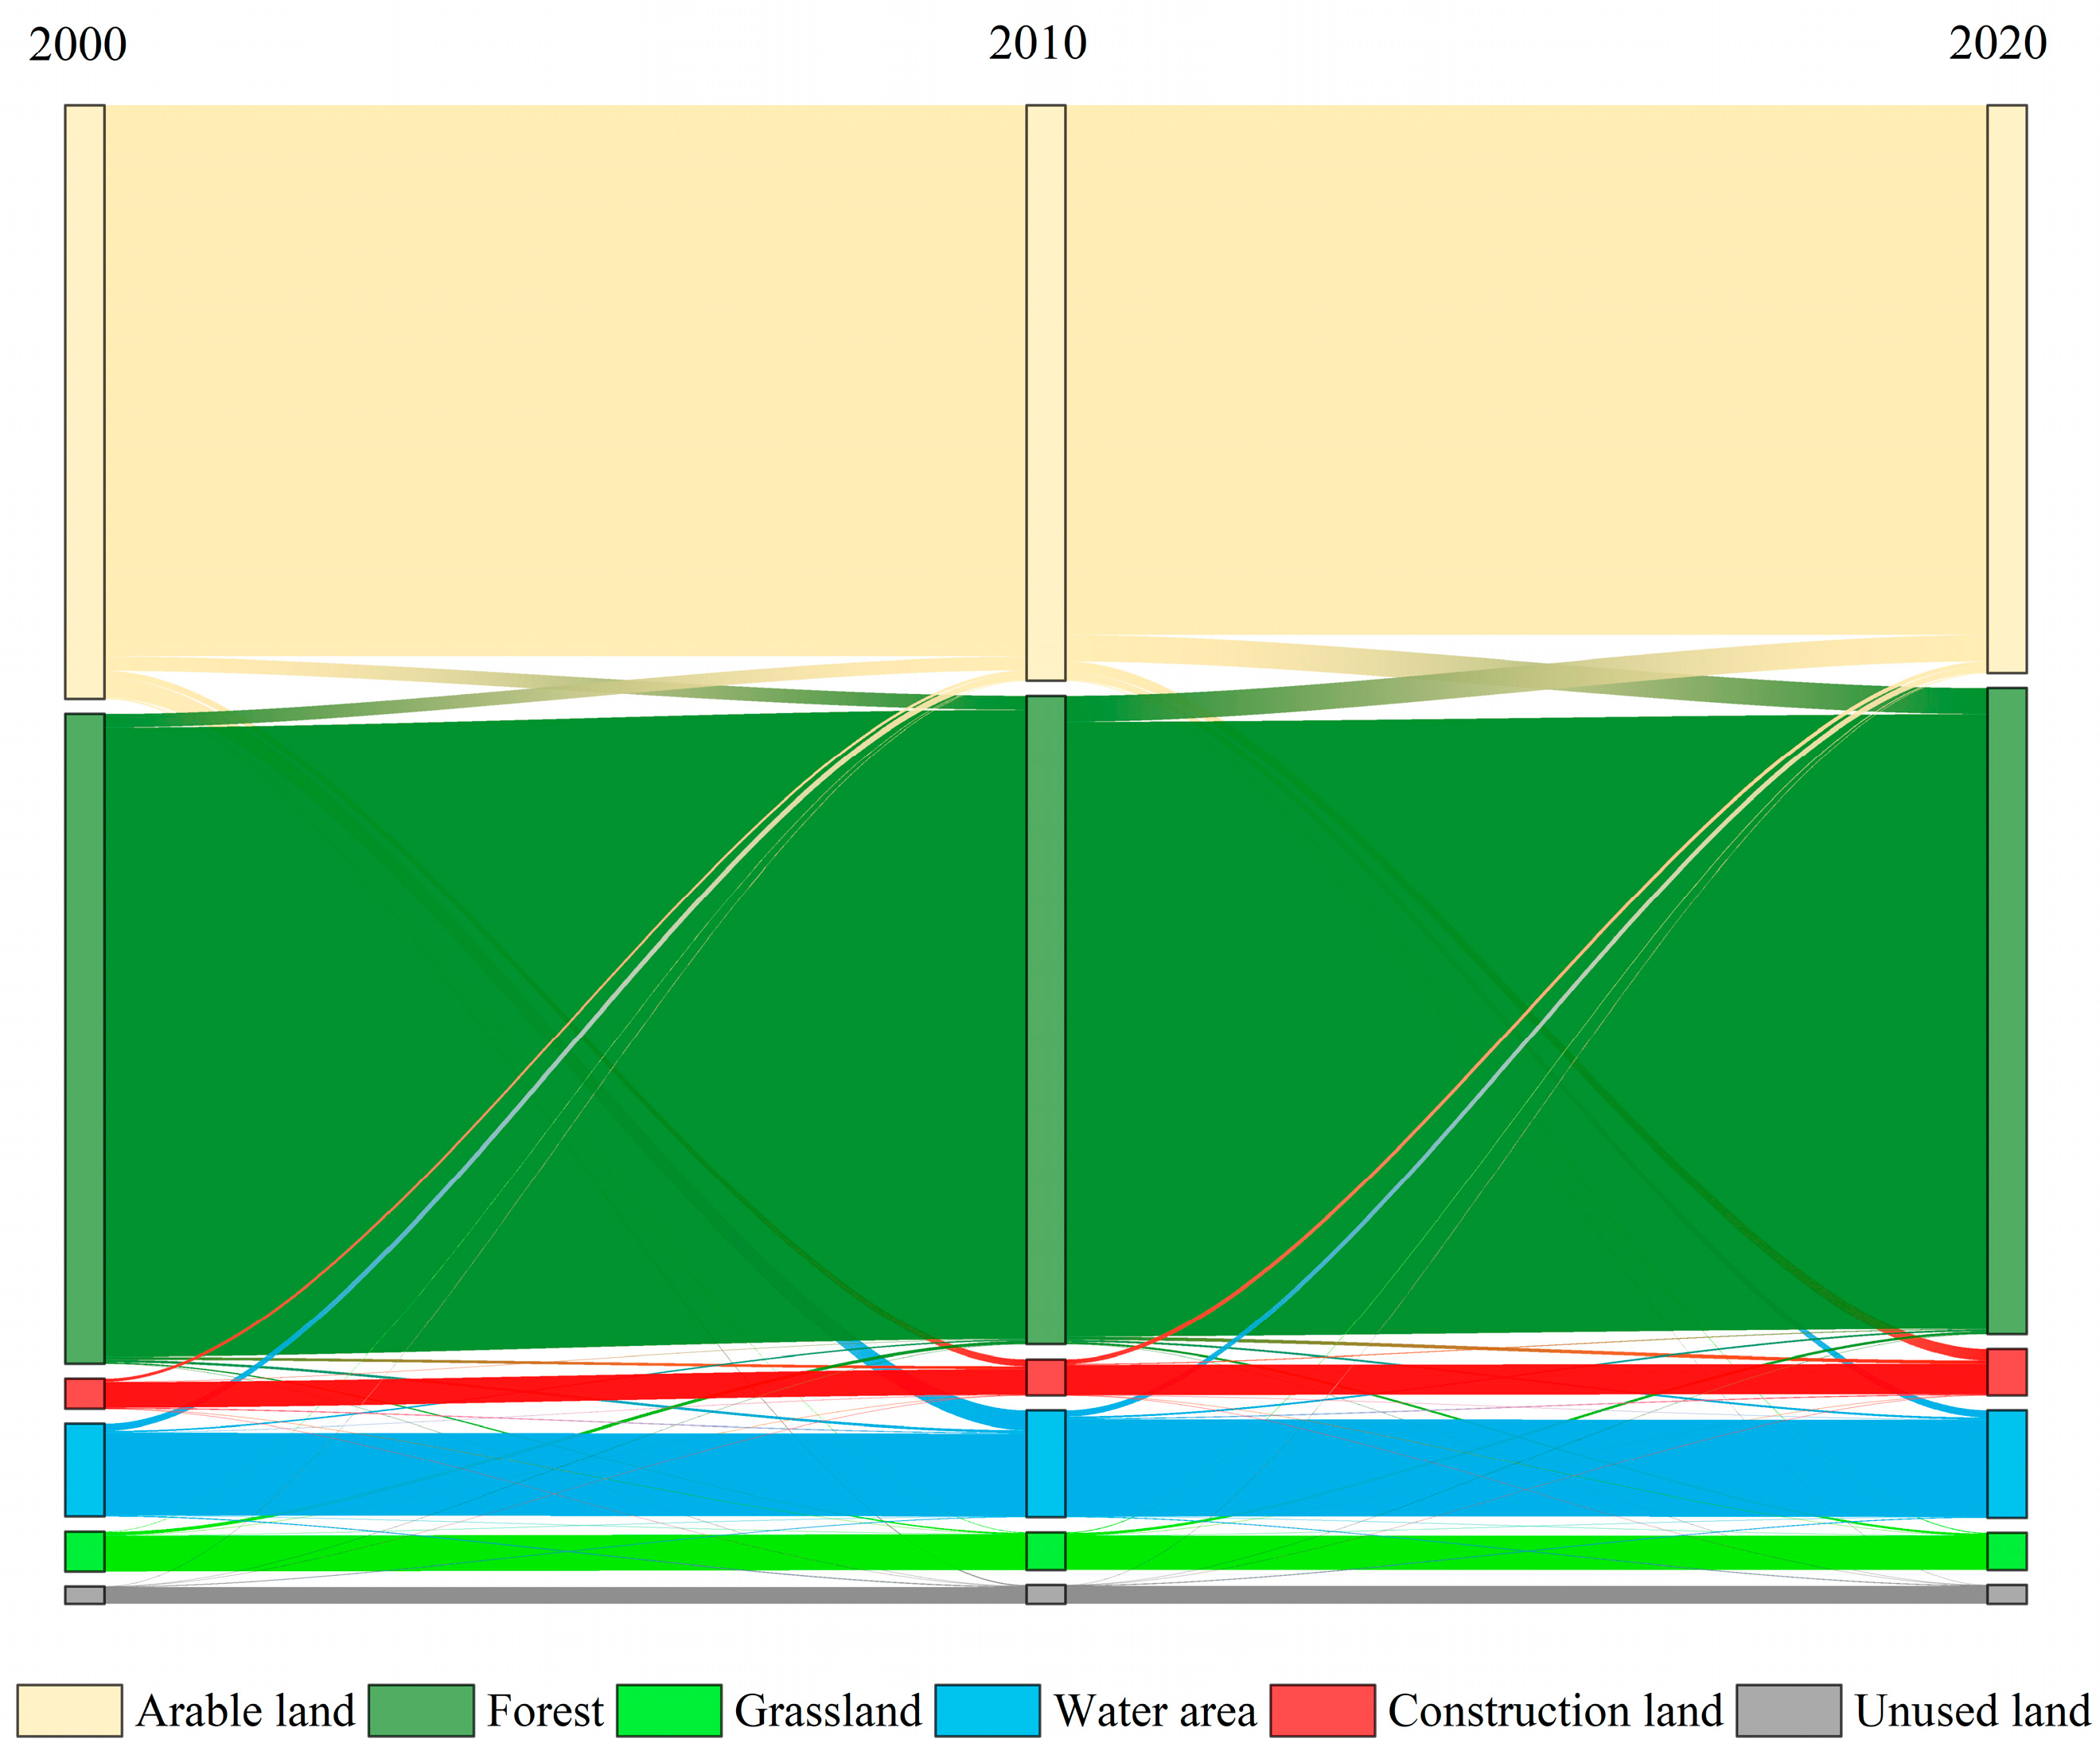
3.1.1. Interannual Changes in Land Use from 2000 to 2020

Table 3 presents the changes in land use data from 2000 to 2020, while Figure 3 illustrates the variations in the spatial distribution of different land use types. The major classifications of land use include forest land and arable land, collectively making up nearly 85% of the overall land area. Of these classifications, forest land is extensively spread out, predominantly found in the central and western regions, and constitutes about 45.39% to 45.62% of the total area. Arable land, which is of secondary importance, is primarily located in the eastern and central-western regions, comprising approximately 39.87% to 41.69% of the total area. Water bodies represent about 6.45% to 7.55% of the overall land area, while other land use types account for a smaller share, ranging from approximately 1.28% to 3.22%.
The data presented in the table indicates that land use patterns between 2000 and 2010 were ranked as follows: “forest > arable land > water area > grassland > construction land > unused land”. However, from 2010 to 2020, this sequence changed to “forest > arable land > water area > construction land > grassland > unused land”. This shift suggests that activities related to land transfer have become more pronounced, leading to significant alterations in the land use structure.
Using ArcGIS software to spatially overlay the land cover data for 2000 and 2020, a land use transfer matrix for 2000–2020 (Table 4) was generated, illustrating the mutual transitions among various land use types (Figure 4). During this period, cropland, forestland, and grassland areas decreased continuously, with cropland experiencing the largest reduction of 331.00 km2. The reduction in cropland primarily resulted in the conversion of land to forest, water bodies, and construction areas. Notably, the areas designated for water bodies and construction have expanded, with construction land exhibiting the most significant increase of 201.72 km2. This surge in construction land underscores the economic vitality and the accelerated process of urbanization observed during the past 20 years. Additionally, the extent of unused land saw a modest increase before reaching a state of stabilization.

3.1.2. Land Use Predictions for 2030 Under Multiple Scenarios

Utilizing LUCC data from 2010 as a reference point, the land expansion analysis strategy (LEAS) component of the PLUS model was employed to project the development probabilities for various land use categories in 2020. This analysis also took into account the factors influencing the growth of each land type during this period. Figure 5 depicts the impact of various driving factors on the distinct types of land use. A comparative examination revealed that the projected land use pattern for 2020 in the study area, generated using the Markov chain module of the PLUS model, closely resembles the actual pattern, exhibiting minimal errors and a high degree of accuracy.
Using the 2020 land cover data, we made predictions regarding future land use distribution patterns within the research area. Figure 6 illustrates the land use distribution for 2030 within the contexts of natural development, cropland protection, and ecological protection scenarios.
The land use changes under different simulation scenarios for 2030 are shown in Table 5. Natural Development Scenario: Under this scenario, the areas of cropland, forestland, and grassland continue to decrease, with outflows of 76.33 km2, 23.80 km2, and 6.26 km2, respectively. Construction land expands significantly by 104.61 km2, exhibiting an agglomerative expansion trend centered around urban areas. The increase in construction land mainly relies on functional conversion from cropland, leading to the issue of cropland encroachment. The area of unused land shows minimal change, and the water body areas remain essentially unchanged.
Ecological Protection Scenario: In this scenario, the areas of cropland and grassland decrease by 183.86 km2 and 2.19 km2, respectively. The increase in forestland is primarily attributed to the conversion from cropland, occurring mainly in the transition zones between cropland and forestland. Due to restrictions imposed by ecological protection policies, the expansion of construction land is limited compared to the natural development scenario, indicating that ecological construction measures have restrained urban development to some extent. Cropland serves as the primary source for the expansion of construction land. The area of water bodies increases by 16.46 km2, while the area of unused land remains relatively unchanged.
Cropland Protection Scenario: In this context, the extent of cropland is greater than in the natural development scenario, reflecting an increase of 132.38 km2, mainly derived from conversions of forestland and water bodies. This scenario of cropland protection effectively maintains the cropland area, thereby safeguarding food security and the provision of crucial agricultural goods. The limitations imposed on transforming cropland into different types of land restrict the growth of construction areas, which leads to a modest growth rate of just 1.22%, thereby decelerating urban expansion. Concurrently, there is a decline in the extent of forested areas, grasslands, aquatic regions, and unutilized land.

3.2. Spatiotemporal Distribution Characteristics of Carbon Storage

3.2.1. Spatiotemporal Analysis of Carbon Storage Changes from 2000 to 2020

The distribution of carbon storage is closely related to the spatial layout of land use, as illustrated in Figure 7. The majority of high-carbon storage zones can be found primarily in the southern and western regions, with a lesser extent also observed in specific areas of the central region. This distribution reveals a clear pattern of being “greater in the west and lesser in the east”. The western and southern regions, characterized by mountainous areas and forested landscapes with favorable vegetation growth conditions, exhibit strong carbon storage capacity within forest ecosystems, resulting in higher carbon storage levels. In contrast, low-carbon storage areas are mostly associated with agricultural lands or regions undergoing rapid urbanization.
Using the carbon module of the InVEST model, the total carbon storage for 2000 was calculated as 7822.43 × 104 tons, for 2010 as 7754.88 × 104 tons, and for 2020 as 7705.21 × 104 tons, showing a consistent decreasing trend in total carbon storage over time.
Changes in carbon storage are closely tied to dynamic land use changes. According to Table 6, during the last two decades, the overall quantity of carbon stored has decreased by 177.91 × 10⁴ tons. This decline is strongly linked to the rapid urban expansion and increased demand for land development in the region between 2000 and 2020. The significant conversion of ecological land types, such as cropland and forestland, into construction land is the main driver of carbon storage loss.

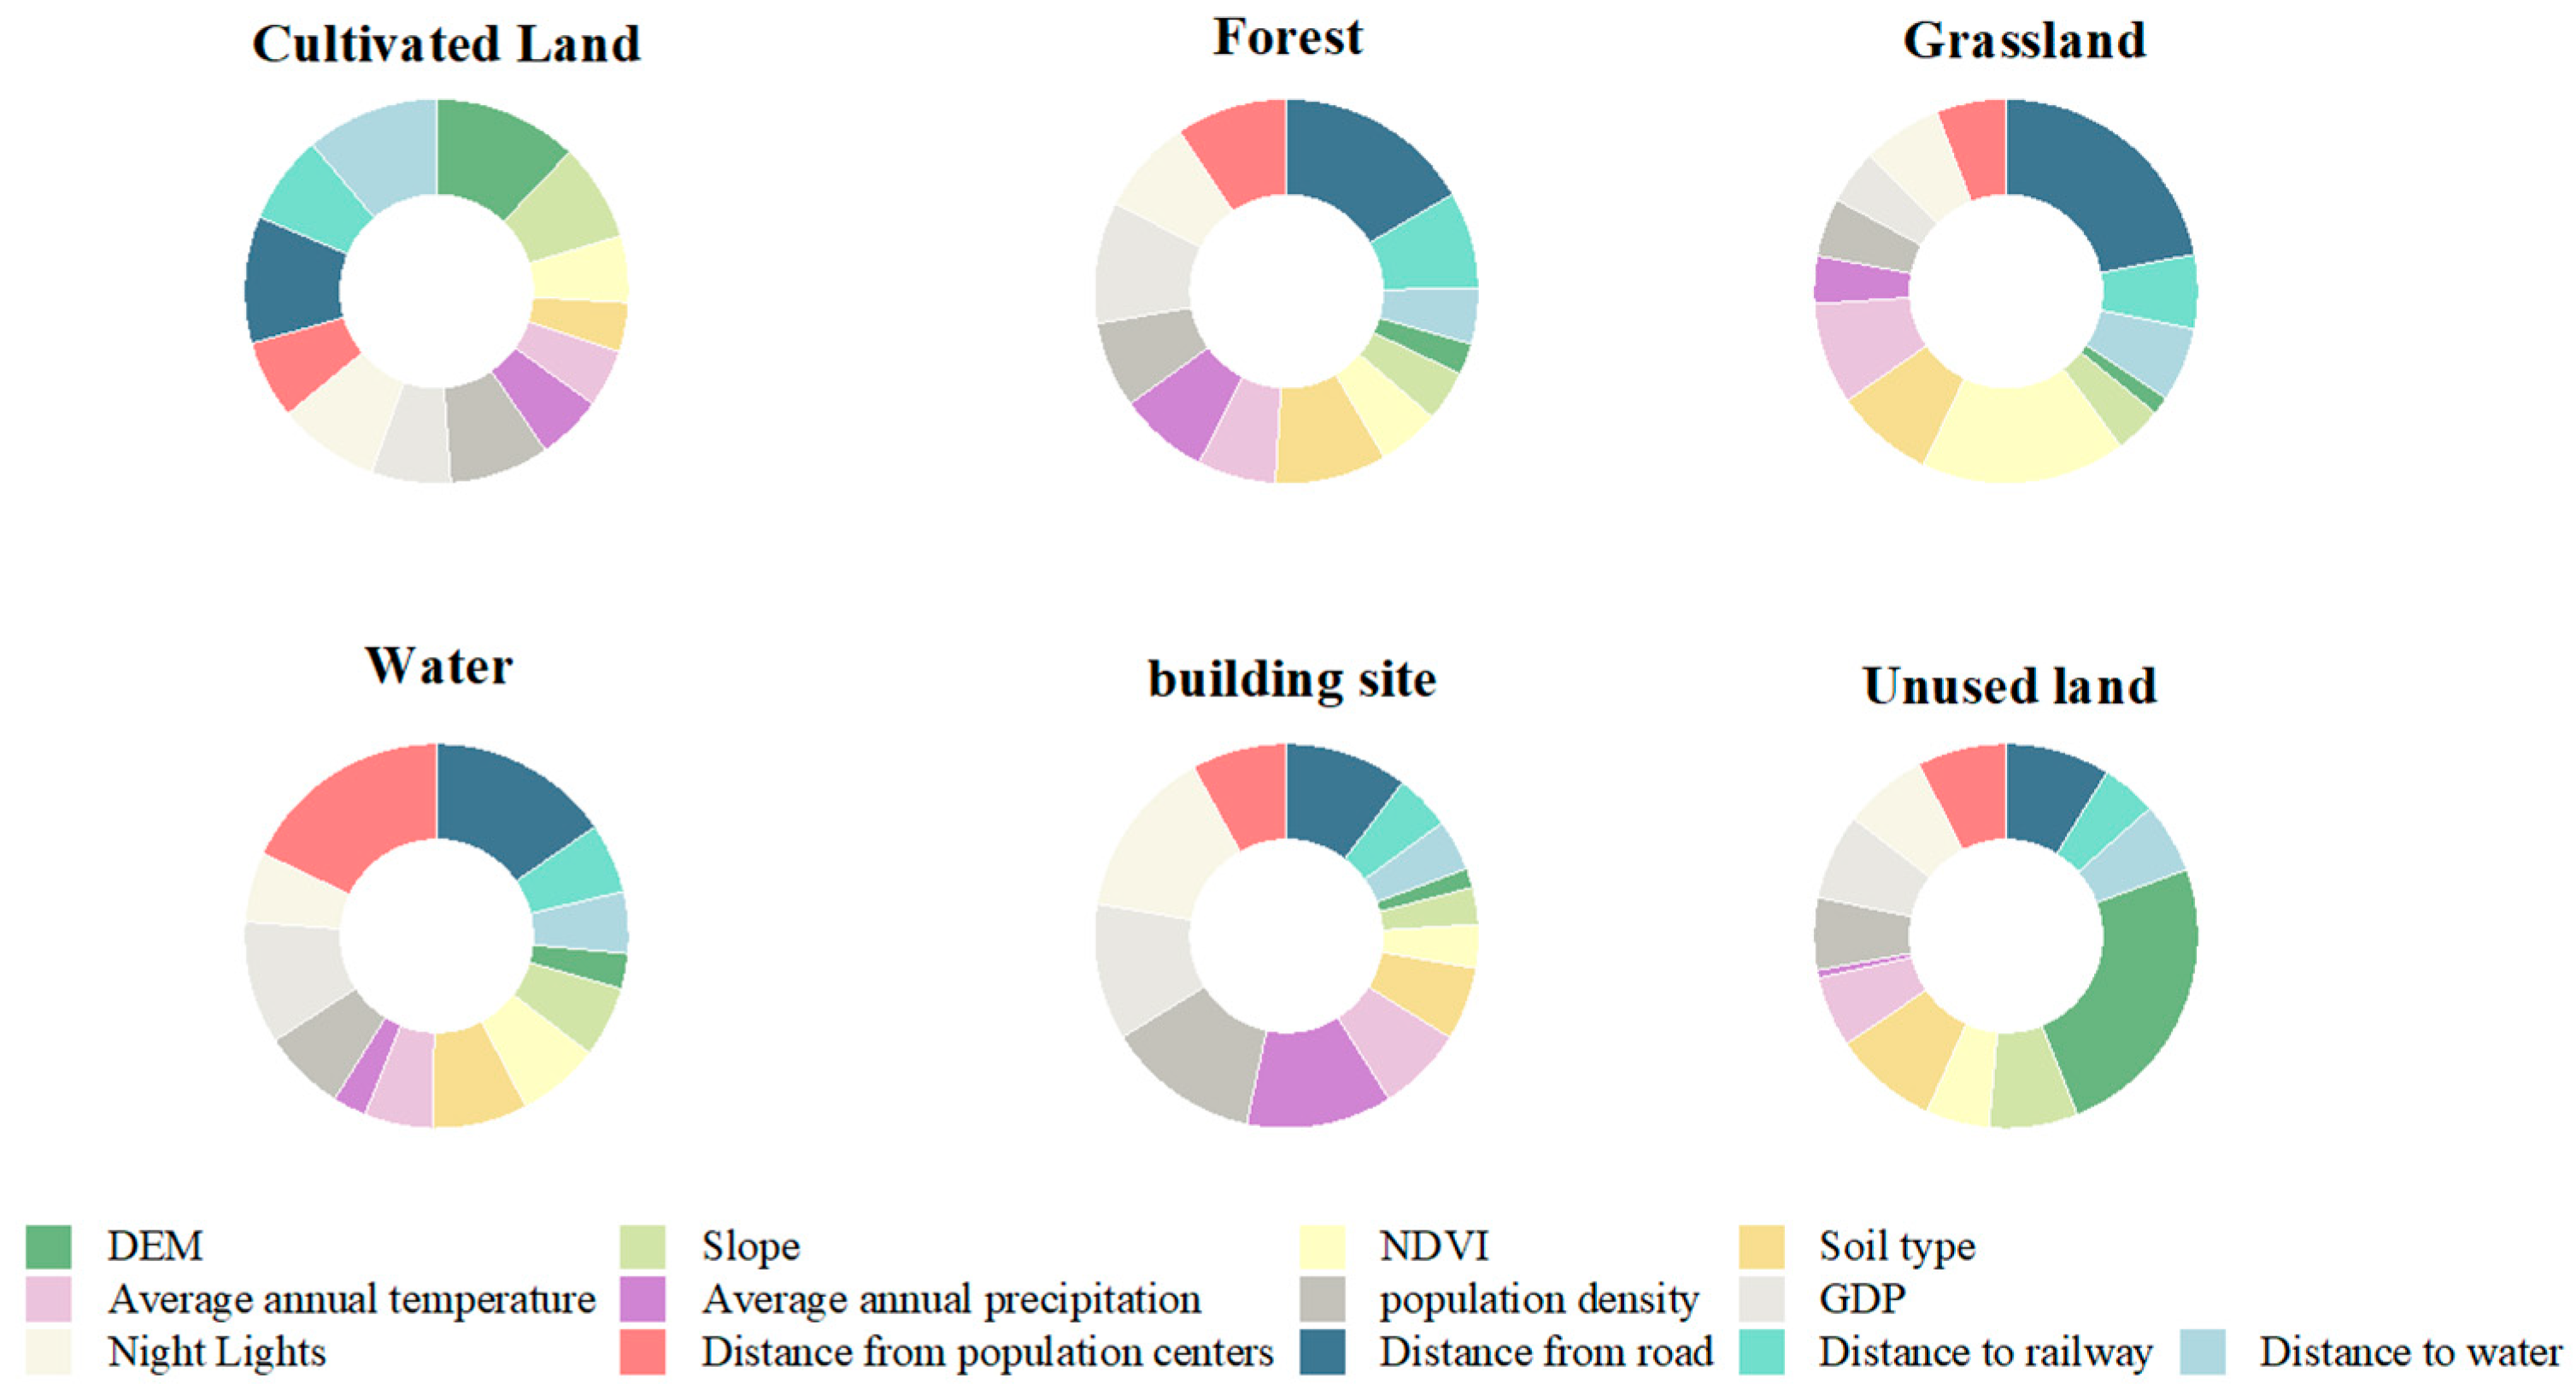
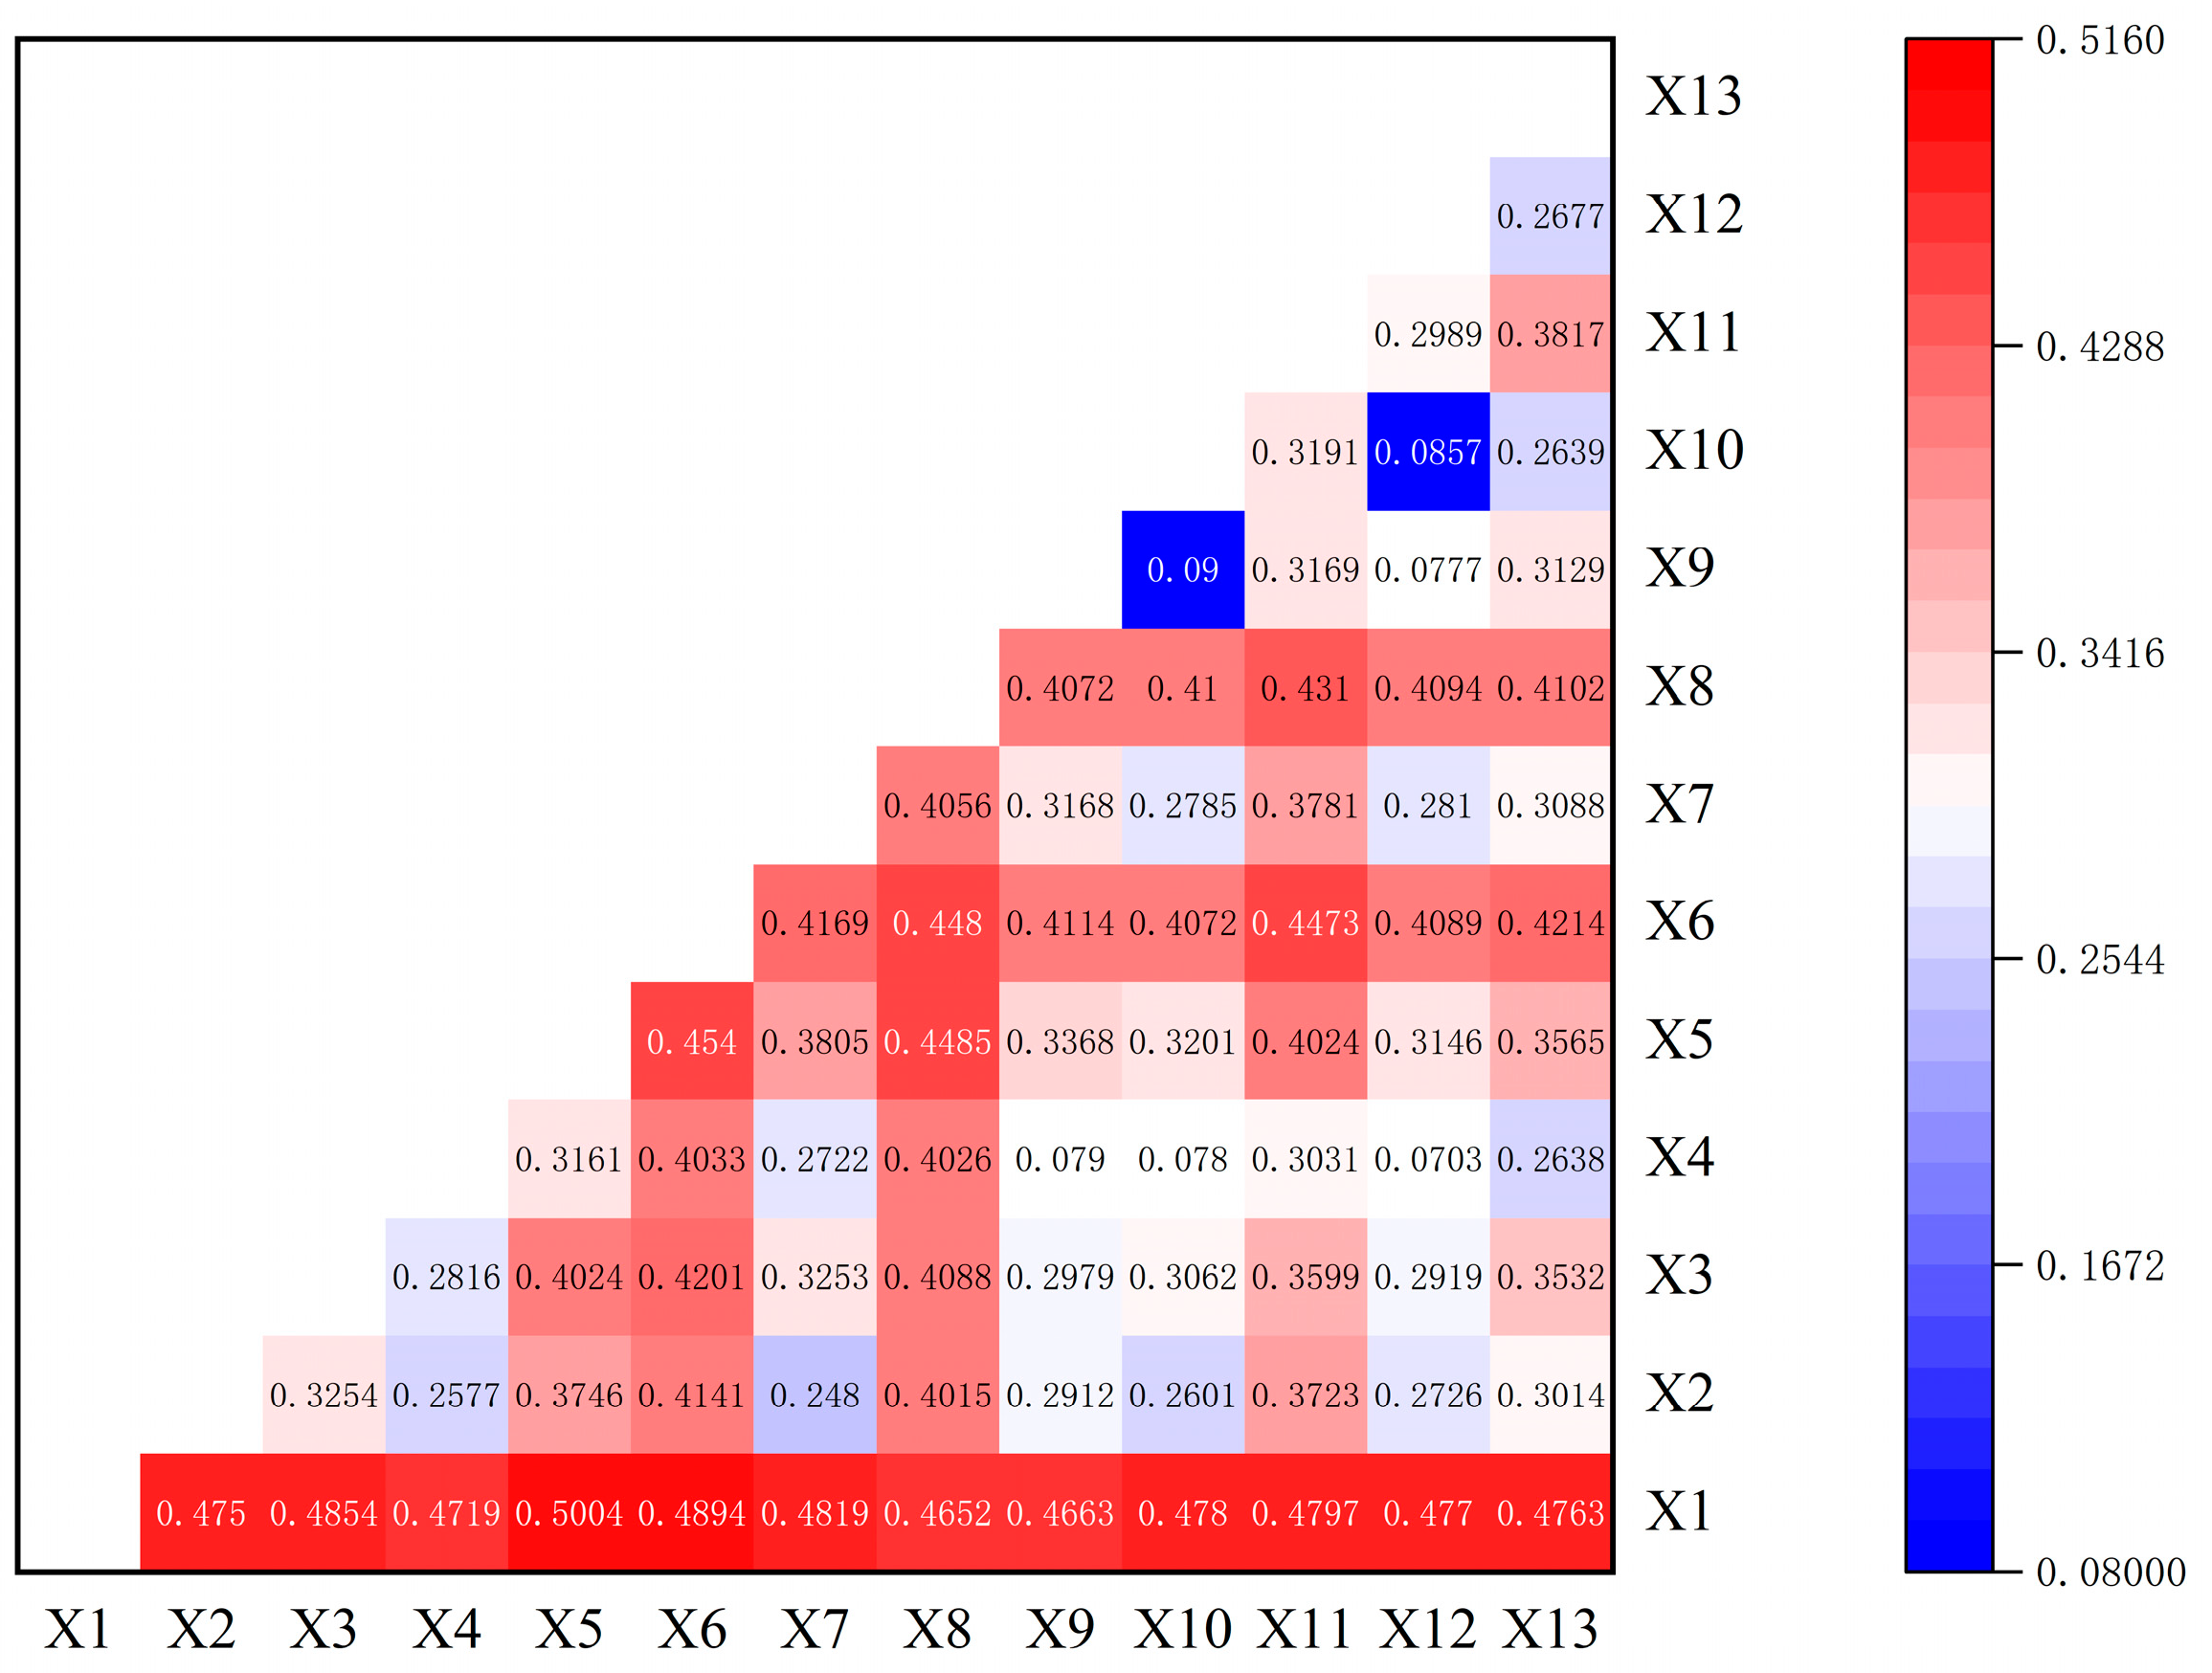
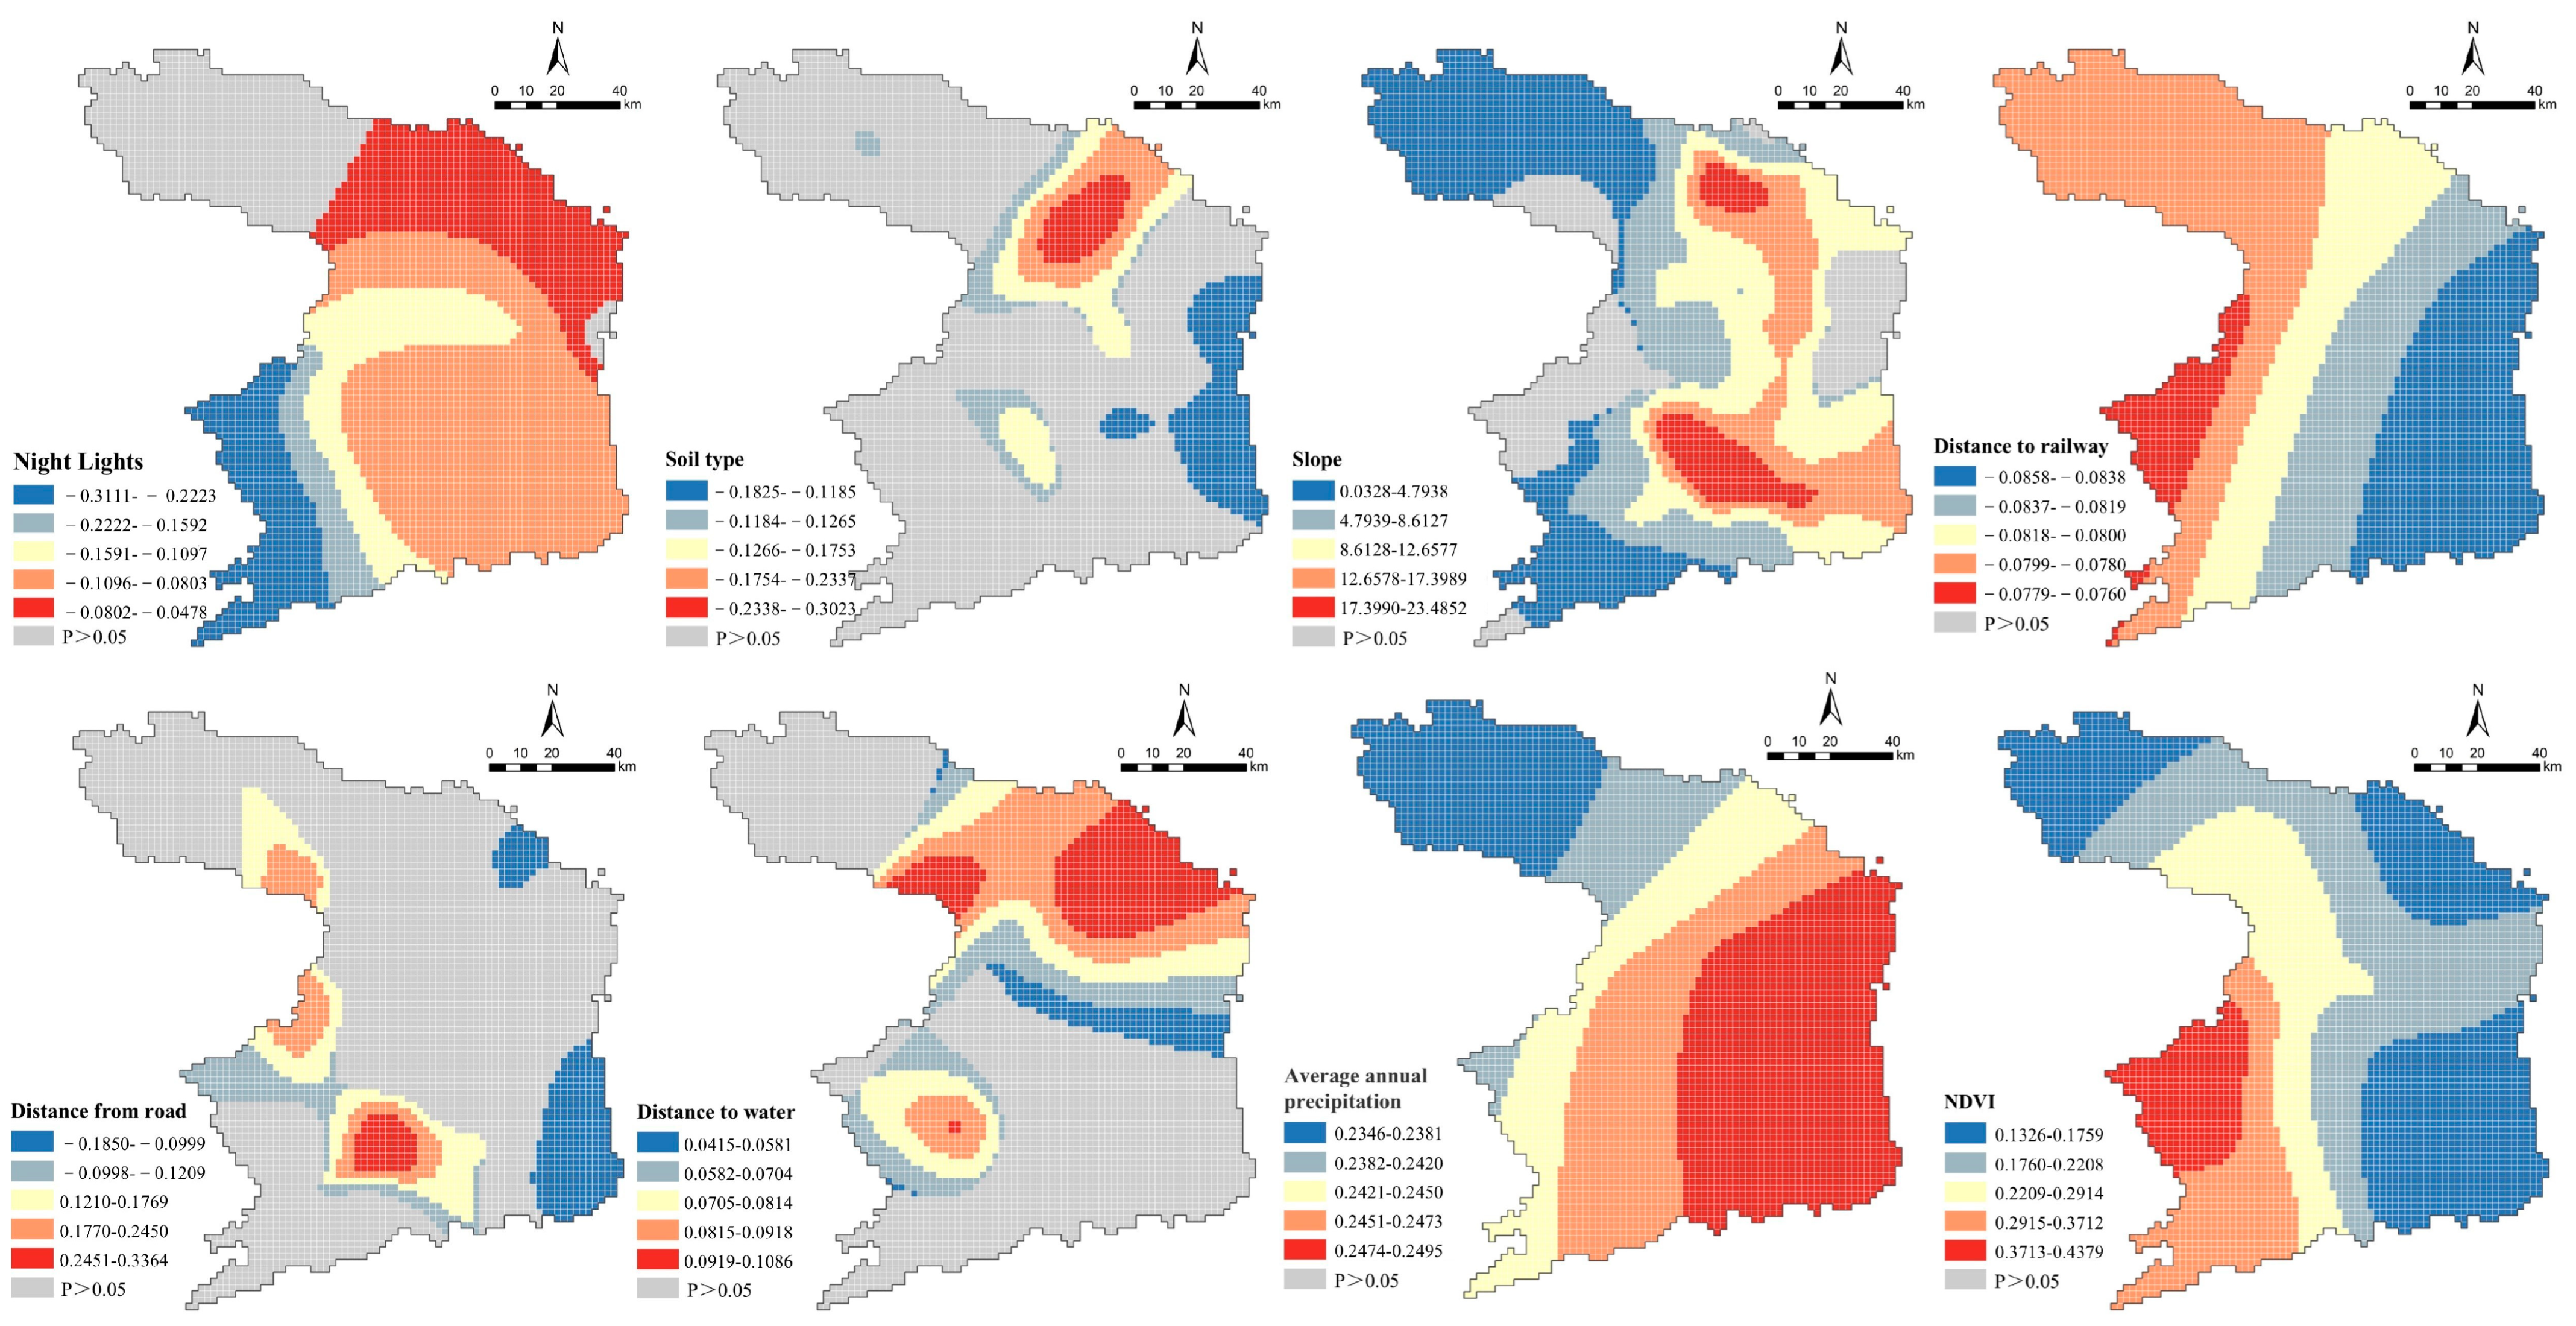
3.2.2. Analysis of Driving Forces Behind the Spatial Differentiation of Carbon Storage

Based on the single-factor detection results of the optimal parameter geographical detector (Figure 8), 13 driving factors were selected in this study as follows: DEM (X1), GDP (X2), average annual precipitation (X3), distance to residential areas (X4), NDVI (X5), slope (X6), population density (X7), average annual temperature (X8), distance to railways (X9), distance to roads (X10), soil type (X11), distance to water sources (X12), and nighttime light (X13). These factors exert different levels of influence on the spatial patterns of carbon storage. The ranking of the 13 factors’ explanatory ability regarding the spatial variations in carbon storage is as follows: DEM (0.461), slope (0.391), average annual temperature (0.381), NDVI (0.303), soil type (0.284), nighttime light (0.248), average annual precipitation (0.240), population density (0.238), GDP (0.233), distance to roads (0.051), distance to residential areas (0.040), distance to railways (0.027), and distance to water sources (0.022). Among these, the DEM, slope, and average annual temperature have the greatest impact on carbon storage, while the influence of distance to roads, distance to residential areas, distance to railways, and distance to water sources is relatively minor.
From the perspective of factor interaction, most factor interactions exhibit an enhancement effect, with the majority demonstrating bivariate enhancement, while others exhibit nonlinear enhancement. This indicates that the spatial distribution of carbon storage is influenced not only by individual factors but also by the combined interactions of multiple factors. As shown in Figure 9, the interaction between DEM and slope (X1∩X6 = 0.851), DEM and average annual temperature (X1∩X8 = 0.850), and DEM and NDVI (X1∩X5 = 0.764) has the greatest influence. Additionally, although the GDP, average annual precipitation, and population density have relatively low individual explanatory power for carbon storage, their interactions with other factors can explain more than 50% of the spatial differentiation of carbon storage. This highlights that factor interactions significantly enhance the spatial heterogeneity of carbon storage.
Furthermore, the q-values of the interactions between DEM (X1), slope (X6), and average annual temperature (X8) with all driving factors exceed 0.35, indicating that these three factors are the dominant drivers of the spatial differentiation of carbon storage. Therefore, when studying the distribution of carbon storage, it is essential to consider not only the impact of individual factors but also the impact of factor interactions on the spatial patterns of carbon storage.
Using the least squares linear regression for model variable diagnosis (factors with a VIF > 7.5 were excluded), MGWR analysis was applied to further reveal the direction of influence of each factor on carbon storage at the local scale (Figure 10). The results indicate that nighttime light and distance to railways have a negative effect on carbon storage. Regions exhibiting elevated levels of nighttime illumination are mainly located in urban, suburban, or industrial areas, where human activity tends to occur more often. Such regions often experience urban expansion and infrastructure development, leading to land use changes (e.g., conversion of forestland or cropland into construction land) that reduce carbon storage. The negative regression coefficients of nighttime light are strongest in mountainous areas, highlighting pronounced spatial heterogeneity. This suggests that human activities in mountainous areas are more sensitive, with even small-scale development potentially causing significant negative impacts on carbon storage.
The response of carbon storage to soil type and distance to roads exhibits both positive and negative effects. In plain regions, the regression coefficient of soil organic matter is positively correlated with carbon storage due to higher soil fertility enhancing the carbon sequestration capacity. However, in urbanized areas, the contribution of soil organic matter to carbon storage significantly decreases and may even show a negative relationship at the same time, while the distance to roads also shows a dual effect on carbon storage—areas closer to roads may be negatively affected by factors such as traffic and pollution, leading to a decrease in carbon storage, while areas farther from roads may have higher carbon storage due to less human disturbance and more natural environmental conditions. Slope, distance to water sources, average annual precipitation, and NDVI positively influence carbon storage.

3.2.3. Prediction and Analysis of Carbon Storage in 2030 Under Multiple Scenarios

Table 7 presents an overview of the carbon storage levels across different land use categories according to three distinct scenarios. In the natural development scenario, total carbon storage demonstrates a declining trend, with notably minor decreases observed in carbon storage for both cropland and forestland. Specifically, the carbon storage for cropland decreased from 2230.46 × 104 tons in 2020 to 2206.93 × 104 tons, while forestland carbon storage declined from 5139.57 × 104 tons to 5124.72 × 104 tons.
In contrast, within the context of ecological protection scenarios, the carbon storage of forestland increased to 51,957,000 tons, while the carbon storage of water bodies rose from 158,600 tons to 160,500 tons. This optimal overall carbon storage indicates that ecological protection positively influences carbon sequestration functions.
The cropland protection scenario demonstrates significant effectiveness in stabilizing cropland carbon storage, increasing it from 2230.46 × 104 tons to 2247.73 × 104 tons. However, its influence on forestland and grassland carbon reserves is relatively minor, with forestland carbon storage remaining stable at 5125.16 × 104 tons and grassland carbon storage slightly decreasing to 159.86 × 10⁴ tons.
These findings suggest that enhancing ecological protection and optimizing land use structures can effectively improve carbon storage.

4. Discussion

4.1. Characteristics of Carbon Storage Changes and the Impact of Land Use Transformation

Between 2000 and 2020, carbon storage in Changde City has experienced a continuous decline. While changes in carbon storage within individual land use types were relatively minor, the conversions among different land use types had a substantial impact on overall carbon storage. Significantly, the transformation of land with high-carbon density into areas of low-carbon density acts as the main factor behind the decrease in carbon storage. The simulation results for three future scenarios indicate that rapid urbanization has significantly accelerated the conversion of farmland to construction land. Conversely, ecological protection policies have somewhat facilitated the transformation of farmland into forest land. However, this transformation has been insufficient to offset the carbon storage loss caused by the conversion of farmland and forest areas into construction land. The expansion of construction land continues to be the principal factor contributing to the decline in carbon storage, a conclusion that aligns with several related studies [46,47,48,49].
To address this trend, future efforts should focus on enhancing forest management, improving the increment and quality of forest resources, and optimizing the ecological land layout in Changde City under the guidance of national spatial planning. This will help prevent irrational land use practices that further exacerbate carbon emissions and weaken carbon sequestration capacity. For key natural reserves such as the Hupingshan National Nature Reserve and the Wuyunjie National Nature Reserve, management should strictly follow the latest forest protection and utilization plans. This includes implementing a no-development policy in core areas, restricting development in general control zones, and establishing habitat buffer zones on the periphery to reduce human interference, thereby strengthening ecological barriers and gradually increasing carbon sequestration capacity.

4.2. Spatial Distribution of Carbon Storage and Key Influencing Factors

The spatial distribution of carbon storage in Changde City is influenced by multiple factors, including topography, climate, vegetation, and human activities. Natural elements like DEM, topography, and yearly mean temperature significantly influence alterations in carbon storage, while human activities negatively impact carbon storage by altering land use types and ecosystem structures. To achieve carbon neutrality, Changde City needs to optimize its land use structure, strictly control the expansion of construction land, protect high-carbon-density land types such as forests and grasslands, and intensify ecological restoration efforts to boost vegetation cover and carbon sequestration capacity. Furthermore, policy development should balance food security with ecological protection, promoting coordinated development between land use and ecological conservation. Measures such as restoring degraded lands can effectively enhance carbon storage, ensuring that both carbon neutrality and the sustainability of food security and the ecological environment are achieved.

4.3. Limitations of Model Application

Building on previous research and incorporating suggestions from scholars [50], this study innovatively combines the OPGD framework with the geographic weighted regression (MGWR) model to explore the driving mechanisms of carbon storage changes. While this approach effectively captures the spatiotemporal variations in carbon storage and the non-stationary characteristics of its driving factors across spatial scales, there are still certain limitations. These include the lack of consideration for policy and institutional factors, the overly static assumption of carbon density, and insufficient analyses of the scale and direction of the influences of driving factors. Future research should focus on incorporating quantifiable policy variables, optimizing dynamic carbon density parameters, and integrating multi-source data and spatial visualization techniques to further enhance the spatiotemporal accuracy of carbon storage analysis and its applicability to policymaking.

5. Conclusions

Over the last twenty years, significant transformations have occurred in the land use framework of Changde City, particularly from 2010 to 2020, during which there was a continuous expansion of built-up zones, indicative of a swift urbanization trend. Anticipated future growth is likely to feature a rise in built-up land alongside a reduction in agricultural areas. Between 2000 and 2020, carbon storage within Changde City experienced a steady decline, mainly due to urban sprawl and the loss of ecological land, especially in the eastern and central parts of the city. The influence of various land use scenarios on carbon storage by 2030 is substantial. In the scenario of natural development, the growth of built-up zones, largely resulting from the transformation of agricultural land, is linked to a marked reduction in total carbon storage. Conversely, the scenario focused on ecological preservation is projected to boost forest carbon storage to 51.957 million tons by increasing both forested land and water bodies, thereby illustrating the beneficial impact of ecological protection measures on carbon sequestration. Meanwhile, the scenario aimed at preserving arable land maintains the area designated for agriculture and its associated carbon storage, but it minimally affects carbon levels in other ecosystems, resulting in a slight drop in ecological stability. To summarize, the scenario emphasizing ecological protection proves most effective for enhancing carbon storage, while the protection of agricultural land necessitates a more efficient equilibrium between maintaining ecological integrity and land usage to ensure food security. Enhancing land use structures and reinforcing ecological safeguards can effectively increase carbon storage and aid in reaching carbon neutrality goals. Moving forward, it is crucial to find a balance among the needs of economic growth, environmental conservation, and food security, fostering simultaneous sustainable development and carbon sink preservation.
The coupling of the OPGD and MGWR models provides a comprehensive understanding of the driving mechanisms behind carbon storage distribution. Elements like the DEM, slope, and average annual temperature significantly influence variations in carbon storage, with their influence varying by region and land use type. Human activities, as reflected by nighttime light intensity, have a negative impact on carbon storage, especially in mountainous areas. These models further emphasize the importance of balancing land use optimization with ecological protection in increasing carbon storage and supporting carbon neutrality goals.

Author Contributions

Methodology, C.C. and W.T.; Software, Z.L.; Validation, Z.L., Z.G. and Y.W.; Resources, J.S.; Data curation, Z.L.; Writing—original draft preparation, Z.L. All authors have read and agreed to the published version of the manuscript.

Funding

Financial support was obtained from the National Key Research and Development Programme topics (2022YFD2200505) and the Natural Science Foundation of Hunan Province (2022JJ40875).

Institutional Review Board Statement

Not applicable.

Informed Consent Statement

Not applicable.

Data Availability Statement

The data presented in this study are available upon request from the corresponding author.

Acknowledgments

The authors would like to thank the research team members for their contributions to this work.

Conflicts of Interest

The authors declare no conflicts of interest.

References

  1. Li, S.; Zhang, Y.; Wang, Z.; Li, L. Mapping human influence intensity in the Tibetan Plateau for conservation of ecological service functions. Ecosyst. Serv. 2018, 30, 276–286. [Google Scholar] [CrossRef]
  2. Rodríguez-Echeverry, J.; Echeverría, C.; Oyarzún, C.; Morales, L. Impact of land-use change on biodiversity and ecosystem services in the Chilean temperate forests. Landsc. Ecol. 2018, 33, 439–453. [Google Scholar] [CrossRef]
  3. Cai, Y.; Wang, L. Carbon sequestration and greenhouse gas mitigation paths and modes in a typical agroecosystem in northern China. Chin. J. Eco-Agric. 2022, 30, 641–650. [Google Scholar]
  4. Msofe, N.; Sheng, L.; Lyimo, J. Land use change trends and their driving forces in the Kilombero Valley floodplain, southeastern Tanzania. Sustainability 2019, 11, 505. [Google Scholar] [CrossRef]
  5. Yu, G.; Hao, T.; Zhu, J. Discussion on action strategies of China’s carbon peak and carbon neutrality. Bull. Chin. Acad. Sci. 2022, 37, 423–434. [Google Scholar]
  6. Liu, Y.; Lü, C.; Fu, B.; Yu, B. Terrestrial ecosystem classification and its spatiotemporal changes in China during the last 20 years. Acta Ecol. Sin. 2021, 41, 3975–3987. [Google Scholar]
  7. Yang, J.; Xie, B.; Zhang, D. Spatio-temporal evolution of carbon stocks in the Yellow River Basin based on InVEST and CA-Markov models. Chin. J. Eco-Agric. 2021, 29, 1018–1029. [Google Scholar]
  8. Xu, X.; Liu, J.; Zhuang, D. Remote sensing monitoring methods of land use/cover change on national scale. Anhui Agric. Sci. 2012, 40, 2365–2369. [Google Scholar]
  9. Chu, P. Research Upon Land Use/Cover and Vegetation Carbon Storage Change at County Scale. Master’s Thesis, China University of Geosciences, Beijing, China, 2014. [Google Scholar]
  10. Cao, Y.; Zhou, W.; Cheng, Y.; Xu, N.; Hao, Y. A review of land use and land cover changes in China. J. Zhejiang For. Coll. 2007, 24, 633–637. [Google Scholar]
  11. Rindfuss, R.R.; Entwisle, B.; Walsh, S.J.; An, L.; Badenoch, N.; Brown, D.G.; Deadman, P.; Evans, T.P.; Fox, J.; Geoghegan, J.; et al. Land use change: Complexity and comparisons. J. Land Use Sci. 2008, 3, 1–10. [Google Scholar] [CrossRef]
  12. Pielke, R.A.; Pitman, A.; Niyogi, D.; Mahmood, R.; McAlpine, C.; Hossain, F.; Goldewijk, K.K.; Nair, U.; Betts, R.; Fall, S.; et al. Land use/land cover changes and climate: Modeling analysis and observational evidence. WIREs Clim. Change 2011, 2, 828–850. [Google Scholar] [CrossRef]
  13. Piao, S.; He, Y.; Wang, X.; Chen, F. Estimation of carbon sinks in terrestrial ecosystems in China: Methods, progress, and prospects. Sci. China Earth Sci. 2022, 52, 1010–1020. [Google Scholar]
  14. Niu, Y.; Zhao, X.; Hu, Y. Spatial variation of carbon emissions from county land use in Chang-Zhu-Tan area based on NPP-VIIRS night light. Acta Sci. Circumst. 2021, 41, 3847–3856. [Google Scholar]
  15. Yang, X.; Liu, X.; Zhao, X. Temporal and spatial differences in carbon conduction and prediction effect of land type transfer in Chang-Zhu-Tan urban agglomeration. Environ. Sci. 2022, 43, 5850–5860. [Google Scholar]
  16. Houghton, R.A.; House, J.I.; Pongratz, J.; van der Werf, G.R.; DeFries, R.S.; Hansen, M.C.; Le Quéré, C.; Ramankutty, N. Carbon emissions from land use and land-cover change. Biogeosciences 2012, 9, 5125–5142. [Google Scholar] [CrossRef]
  17. Xia, S.Y.; Yang, Y. Spatio-temporal differentiation of carbon budget and carbon compensation zoning in Beijing-Tianjin-Hebei urban agglomeration based on the plan for major function-oriented zones. Acta Geogr. Sin. 2022, 77, 679–696. [Google Scholar]
  18. Liu, J.H.; Li, W.F.; Zhou, W.Q.; Han, L.; Qian, Y. Scenario simulation balancing multiple objectives for optimal land use allocation of the Beijing-Tianjin-Hebei megaregion. Acta Ecol. Sin. 2018, 38, 4341–4350. [Google Scholar]
  19. Zhang, Y.; Liao, X.; Sun, D. A Coupled InVEST-PLUS Model for the Spatiotemporal Evolution of Ecosystem Carbon Storage and Multi-Scenario Prediction Analysis. Land 2024, 13, 509. [Google Scholar] [CrossRef]
  20. Piyathilake, I.D.U.H.; Udayakumara, E.P.N.; Ranaweera, L.V.; Gunatilake, S.K. Modeling predictive assessment of carbon storage using InVEST model in Uva province, Sri Lanka. Model. Earth Syst. Environ. 2022, 8, 2213–2223. [Google Scholar] [CrossRef]
  21. Yu, Z.; Li, M.Y.; Qian, Y.Y.; Qian, Y.T.; Yang, G.X. Land use change and its ecological effects in the Three Gorges Reservoir area based on CA-Markov model with multi-scenario simulation. Soil Water Conserv. Res. 2024, 31, 363–372. [Google Scholar]
  22. Hao, X.J.; Zhang, H.; Xu, X.M.; Wang, Z.; Cui, Y. Evolution and simulation of land use/land cover pattern in northern Shanxi Province. J. Ecol. 2020, 40, 257–265. [Google Scholar]
  23. Yuan, X.S.; Zhou, J.; Hu, B.B.; Gao, Q. Multi-scenario simulation and prediction of ecological-productive-living spaces in Guangdong-Hong Kong-Macao Greater Bay Area based on FLUS model. Geosciences 2023, 43, 564–574. [Google Scholar]
  24. Wang, Z.Y.; Huang, C.L.; Li, J.; Lin, Z. Ecological zoning planning and dynamic assessment based on coupled InVEST-HFI-PLUS model: A case study of Bortala Mongolian Autonomous Prefecture. Acta Ecol. Sin. 2022, 42, 5789–5798. [Google Scholar]
  25. Du, S.; Zhou, Z.; Huang, D.; Zhang, F.; Deng, F.; Yang, Y. The Response of Carbon Stocks to Land Use/Cover Change and a Vulnerability Multi-Scenario Analysis of the Karst Region in Southern China Based on PLUS-InVEST. Forests 2023, 14, 2307. [Google Scholar] [CrossRef]
  26. Fu, Y.; Xie, W.; Liu, J.; Wang, F.; Guo, Z.; Su, F.; Yang, Y. Spatio-temporal pattern evolution and prediction of ecological well-being in Jiangsu Province based on GeoSOS-FLUS model. Resour. Environ. Yangtze Basin 2023, 32, 71–82. [Google Scholar]
  27. Qiao, Z.; Jiang, Y.Y.; He, T.; Luo, Y.L.; Li, W.; Lu, Y.M.; Xu, X.L.; Yang, J. Land use simulation: Progress, challenges, and prospects. J. Ecol. 2022, 42, 5165–5176. [Google Scholar]
  28. Liu, Y.L.; Tong, Z.M.; Liu, S.; Quan, Z.M.; Liu, Y.; Huang, J. Progress and prospect of research on optimal land use allocation modeling. J. Wuhan Univ. (Inf. Sci. Ed.) 2022, 47, 1598–1614. [Google Scholar]
  29. Zhang, S.; Gao, Q.; Zhang, R.; Song, Z.; Kuang, H. Evaluating the changes and driving factors of carbon storage using the PLUS-InVEST model: A case study of Napa Sea Basin. China Environ. Sci. 2024, 44, 5192–5201. [Google Scholar] [CrossRef]
  30. Tang, J.; Li, Z.; Pan, Y. Simulation of land use change and carbon storage in Guangzhou based on the PLUS-InVEST model. Chin. Urban For. 2024, 22, 61–68. [Google Scholar]
  31. Wang, Y.R.; Cai, H.; Chen, L.; Li, T. Spatiotemporal Evolution and Multi-Scenario Prediction of Carbon Storage in the GBA Based on PLUS–InVEST Models. Sustainability 2023, 15, 8421. [Google Scholar] [CrossRef]
  32. Li, M.; Luo, H.; Qin, Z.; Tong, Y. Spatial-Temporal Simulation of Carbon Storage Based on Land Use in Yangtze River Delta Under SSP-RCP Scenarios. Land 2023, 12, 399. [Google Scholar] [CrossRef]
  33. Huang, Y.; Xie, F.; Song, Z.; Zhu, S. Evolution and multi-scenario prediction of land use and carbon storage in Jiangxi Province. Forests 2023, 14, 1933. [Google Scholar] [CrossRef]
  34. He, Y.; Wang, S.; Yang, T. Evaluation of Carbon Sequestration, Oxygen Release and Soil Conservation Value of Forest Ecosystem around Dongting Lake—Taking Changde City as an Example. World Ecol. 2023, 12, 413–422. [Google Scholar] [CrossRef]
  35. Ling, Z.; Deng, Y.; Jiang, W.; Song, J.; Zhang, Z. The effectiveness and attribution of wetland protection and restoration in Changde city from the perspective of international wetland cities and its policy implications. J. Nat. Resour. 2024, 39, 2241–2258. [Google Scholar] [CrossRef]
  36. Li, G.; Li, H.; Wang, L.; Zhang, W.; Chen, J. Analysis of land use change and its socio-economic driving factors in Qinghai Province. Grassl. Sci. 2022, 39, 2604–2616. [Google Scholar]
  37. Zhang, W.T.; Gao, Y.X.; Li, S.; Liu, W.P.; Zeng, C.; Gao, L.; Li, M.X.; Peng, C. Accessibility measurements for urban parks considering age-grouped walkers’ sectorial travel behavior and built environment. Urban For. Urban Green. 2022, 76, 127715. [Google Scholar] [CrossRef]
  38. Zhang, Z.; Zhao, X.; Wang, X. Remote Sensing Monitoring of Land Use in China; Planet Map Publishing House: Beijing, China, 2012. [Google Scholar]
  39. Wu, L.; Yang, S.; Liu, X.; Luo, Y.; Zhou, X.; Zhao, H. Response analysis of land use change to the degree of human activities in Beiluo River basin since 1976. Acta Geogr. Sin. 2014, 69, 54–63. [Google Scholar]
  40. Gao, L.; Tao, F.; Liu, R.; Wang, Z.L.; Leng, H.J.; Zhou, T. Multi-scenario simulation and ecological risk analysis of land use based on the PLUS model: A case study of Nanjing. Sustain. Cities Soc. 2022, 85, 104055. [Google Scholar] [CrossRef]
  41. Lin, T.; Yang, M.; Wu, D.; Liu, F.; Yang, J.; Wang, Y. Spatial correlation and prediction of land use carbon storage based on the InVEST-PLUS model—A case study in Guangdong Province. China Environ. Sci. 2022, 42, 4827–4839. [Google Scholar]
  42. Lin, W.; Sun, Y.; Nijhuis, S.; Wang, Z. Scenario-based flood risk assessment for urbanizing deltas using future land-use simulation (FLUS): Guangzhou Metropolitan Area as a case study. Sci. Total Environ. 2020, 739, 139899. [Google Scholar] [CrossRef]
  43. Wang, Z.; Wu, F.; Wan, D.; Zhang, K.; Li, L.; Huang, C. Multi-scenario simulation of the impact of regional land use change on carbon reserve. China Environ. Sci. 2023, 43, 6063–6078. [Google Scholar] [CrossRef]
  44. Wang, M.; Zhang, H.; Dong, L.; Li, J.; He, Q. Spatio-temporal heterogeneity of vegetation cover and its driving forces in the Taihangshan-Yanshan Region. China Environ. Sci. 2024, 1–18. [Google Scholar] [CrossRef]
  45. Zhao, M.-S.; Chen, X.-Q.; Xu, S.-J.; Qiu, S.-Q.; Wang, S.-H. Spatial Prediction Modeling for Soil pH Based on Multiscale Geographical Weighted Regression (MGWR) and its Influencing Factors. Environ. Sci. 2023, 44, 6909–6920. [Google Scholar]
  46. You, X.; Feng, X.; Wei, X.; Gui, Y.; Ke, L.; Cai, J.; Chen, M. Changes and multi-scenario prediction of land-use carbon storage in Nanchang City. South. For. Sci. 2024, 52, 30–38. [Google Scholar]
  47. Wang, S.; Zhao, X.; Zhou, S. Exploring on the Impact of Future Multi-scenario Land Use Change on Henan Province Regional Carbon Storage. Environ. Sci. 2025, 1–22. [Google Scholar]
  48. Jia, J.; Guo, W.; Xu, L.; Xu, K.; Gao, Y. Spatio-temporal Evolution and Driving Force Analysis of Carbon Storage in Anhui Province Coupled with PLUS-InVEST-GeoDectetor Model. Environ. Sci. 2025, 1–17. [Google Scholar]
  49. Zhao, Y.; Gao, R.; Li, H.; Rao, X.; Guo, L. Study on Carbon Storage Change and Optimization of Land Use in Jiangyin City. Ecol. Rural. Environ. J. 2022, 38, 1290–1298. [Google Scholar]
  50. Bi, F.; Wu, Z.; Liang, H.; Du, Z.; Lei, T.; Sun, X. Spatio-temporal Changes and Driving Factors of Carbon Storage in the Middle Reaches of the Yellow River Based on PLUS-InVEST-GeoDetector Model. Environ. Sci. 2024, 1–20. [Google Scholar]
Figure 1. Location map of the research region: (a) The location of Hunan Province within China; (b) The location of Changde City within Hunan Province; (c) The digital elevation model (DEM) of Changde City, with the study area delineated in red. The DEM represents elevation variations using a color gradient, where green indicates low elevations and brown represents high elevations.
Sustainability 17 01273 g001
Figure 2. Research framework.
Sustainability 17 01273 g002
Figure 3. Spatial distribution of land use categories in Changde from 2000 to 2020.
Sustainability 17 01273 g003
Figure 4. Sankey diagram illustrating the changes in land use in Changde City between the years 2000 and 2020.
Sustainability 17 01273 g004
Figure 5. The impact of the driver coefficient to expand the use of various land.
Sustainability 17 01273 g005
Figure 6. Land use layout of Changde in 2030 under three scenarios.
Sustainability 17 01273 g006
Figure 7. Spatial distribution of carbon storage in Changde City from 2000 to 2020.
Sustainability 17 01273 g007
Figure 8. Single-factor detection results.
Sustainability 17 01273 g008
Figure 9. Interaction analysis results. (Note: X1–X13 correspond to DEM, GDP, average annual precipitation, distance from population centers, NDVI, slope, population density, average annual temperature, distance to railway, distance from road, soil type, distance to water, and night lights).
Sustainability 17 01273 g009
Figure 10. Spatial distribution of regression coefficients of carbon storage influencing factors.
Sustainability 17 01273 g010
Table 1. Original data sources.
Main CategoryDataResolutionSource
Natural factorDEM30 mSRTM (https://earthexplorer.usgs.gov) (accessed on 6 May 2024)
Slope30 mDEM data calculation generation
NDVI1 kmResource and Environmental Science Date Platform (http://www.resdc.cn/data) (accessed on 6 May 2024)
Soil type1 kmResource and Environmental Science Date Platform (http://www.resdc.cn/data) (accessed on 7 May 2024)
Average annual temperature1 kmResource and Environmental Science Date Platform (http://www.resdc.cn/data) (accessed on 6 May 2024)
Average annual precipitation1 km
Socio-economic factorsPopulation density1 kmResource and Environmental Science Date Platform (http://www.resdc.cn/data) (accessed on 6 May 2024)
GDP1 kmResource and Environmental Science Date Platform (http://www.resdc.cn/data) (accessed on 6 May 2024)
Night lights1 kmResource and Environmental Science Date Platform (http://www.resdc.cn/data) (accessed on 7 May 2024)
Accessibility factorDistance from
population centers
30 mNational Geographic Information Resources Catalogue Service System (https://www.webmap.cn) (accessed on 8 May 2024)
Distance from road30 mOpen Street Map (https://www.openstrectmap.org) (accessed on 12 May 2024)
Distance to railway30 m
Distance to water30 m
Table 2. Carbon density values for different land use types (t/hm2).
Land Use TypeCaboveCbelowCsoilCdead
Arable land0.7610.8115.613.64
Forest5.6815.5334.117.06
Grassland4.7311.5914.394.08
Water area0.34011.230
Construction land0.4000
Unused land0.481.231.431.13
Table 3. Dynamic land use changes in Changde City from 2000 to 2020.
Land Use TypeYearArea (km2)Percentage (%)
Arable land20007568.0541.69
20107336.3240.41
20207237.0439.87
Forest20008282.1845.62
20108268.2545.55
20208239.1445.39
Grassland2000503.522.77
2010476.832.63
2020470.012.59
Water area20001182.956.52
20101362.567.51
20201370.787.55
Construction land2000382.782.11
2010457.702.52
2020584.503.22
Unused land2000233.251.28
2010251.061.38
2020251.261.38
Table 4. Land use transition matrix of Changde from 2000 to 2020 (km2).
2020Arable LandForestGrasslandWater AreaConstruction LandUnused Land
2000
Arable land6831.01259.0610.25270.46181.9215.34
Forest251.907899.5122.3338.1269.940.38
Grassland8.3451.99436.062.344.790
Water area94.7123.101.101035.4912.8715.68
Construction land49.215.360.2611.80314.881.27
Unused land1.880.11012.560.10218.59
Table 5. Land use changes in 2030 under different scenarios.
Land Use TypeArea of 2020 (km2)ScenariosArea of 2030 (km2)Rate of Change (%)
Arable land7237.04Natural development7160.71−1.05
Arable land protection7293.090.77
Ecological protection7053.18−2.54
Forest8239.14Natural development8215.33−0.29
Arable land protection8216.03−0.28
Ecological protection8329.121.09
Grassland470.01Natural development463.75−1.33
Arable land protection459.51−2.23
Ecological protection467.81−0.47
Water area1370.78Natural development1378.080.53
Arable land protection1341.65−2.12
Ecological protection1387.241.20
Construction land584.50Natural development689.108417.90
Arable land protection591.621.22
Ecological protection663.9113.59
Unused land251.26Natural development245.7477−2.19
Arable land protection250.83−0.17
Ecological protection251.460.08
Table 6. Carbon storage corresponding to land use transition areas in Changde from 2000 to 2020.
Land Use Type of 2000Land Use Type of 2020Transferred Area (km2)Area of Change (km2)Change in Carbon Stocks (×104 tons)Total Change (×104 tons)
Arable landForest259.06−331.0081.76−29.31
Grassland10.250.41
Water area270.46−52.06
Construction land181.92−55.34
Unused land15.34−4.07
ForestArable land251.90−43.04−79.50−148.60
Grassland22.33−6.16
Water area38.12−19.37
Construction land69.94−43.35
Unused land0.38−0.22
GrasslandArable land8.34−33.52−0.3311.83
Forest51.9914.35
Water area2.34−0.54
building site4.79−1.65
Water areaArable land94.71187.8318.2327.64
Forest23.1011.74
Grassland1.100.26
Construction land12.87−1.44
Unused land15.68−1.14
Construction landArable land49.21201.7214.9719.75
Forest5.363.32
Grassland0.260.09
Water area11.801.32
Unused land1.270.05
Unused landArable land1.8818.010.501.48
Forest0.110.07
Water area12.560.92
Construction land0.100.00
Table 7. Carbon storage across different land use types under three scenarios for 2030.
Land Use TypeCarbon Stocks in 2020 (×104 tons)Rate of Change (%)ScenariosCarbon Stocks in 2030 (×104 tons)Rate of Change (%)
Arable land2230.4628.95Natural development2206.9328.82
Arable land protection2247.7329.19
Ecological protection2173.7928.21
Forest5139.5766.70Natural development5124.7266.92
Arable land protection5125.1666.55
Ecological protection5195.7067.42
Grassland163.512.12Natural development161.342.10
Arable land protection159.862.08
Ecological protection162.752.11
Water area158.602.06Natural development159.442.08
Arable land protection155.232.02
Ecological protection160.502.08
Construction land2.340.03Natural development2.760.04
Arable land protection2.370.03
Ecological protection2.660.04
Unused land10.730.14Natural development2.760.04
Arable land protection10.710.13
Ecological protection10.740.14
Disclaimer/Publisher’s Note: The statements, opinions and data contained in all publications are solely those of the individual author(s) and contributor(s) and not of MDPI and/or the editor(s). MDPI and/or the editor(s) disclaim responsibility for any injury to people or property resulting from any ideas, methods, instructions or products referred to in the content.

