Article

Plant Diversity and Interspecific Interactions in Desert-Oasis Transition Zones: Insights from the Badain Jilin Desert

1
Shandan County Wetland Conservation Station, Zhangye 734000, China
2
Ganzhou District Xichengyi Forest Management Station, Zhangye 734000, China
3
Department of Environmental Science, University of Arizona, Tucson, AZ 85721, USA
*
Authors to whom correspondence should be addressed.
Sustainability 2025, 17(3), 1259; https://doi.org/10.3390/su17031259
Submission received: 16 December 2024 / Revised: 21 January 2025 / Accepted: 30 January 2025 / Published: 4 February 2025

Abstract

:
Plant species diversity and spatial distribution patterns are critical for understanding ecosystem dynamics in arid and fragile environments. This study investigates the diversity, spatial distribution, and interspecific associations of shrubs and herbaceous plants in the transition zone of the desert oasis located in the Hexi Corridor and southern edge of the Badanjilin Desert, China. Vegetation data were collected across sample plots spanning three counties in Zhangye City. Important values, diversity indices, and spatial distribution metrics were calculated to evaluate plant species dominance and community structure. Interspecific relationships were analyzed using variance ratio (VR), clumping indicators, and corrected χ2 tests. The shrub community exhibited low species diversity (H′ = 1.754) and was dominated by Reaumuria songarica (Pall.) Maxim (IV = 111.175), reflecting its superior adaptability to arid conditions. In contrast, the herbaceous community displayed higher diversity (H′ = 2.498), with Aristida adscensionis L. (IV = 48.6174) as the dominant species. Both communities showed predominantly aggregative spatial distribution patterns, influenced by localized resource availability and adaptive strategies. Weak interspecific associations characterized the shrub community, with limited competition among dominant species, while the herbaceous community demonstrated significant negative correlations, indicating stronger resource competition. The study highlights the contrasting diversity and ecological roles of shrubs and herbaceous plants in arid ecosystems, shaped by resource limitations and environmental stressors. Effective conservation strategies are needed to protect dominant species and sustain ecosystem resilience in desert regions. Future research should focus on below-ground interactions and long-term monitoring to enhance understanding of species coexistence and community stability.

1. Introduction

Sand-fixing vegetation is an important component of desert ecosystems in arid zones, which is sensitive to environmental changes and directly affects human survival, oasis ecosystem stability, and ecological security in arid oases [1]. Desert sand-fixing plants, which are widely distributed along the edge of the Badanjilin Desert, play an important role in curbing regional ecological degradation, improving the ecological environment and maintaining the health of desert-oasis ecosystems [2]. The study of species diversity plays a decisive role in the formation and maintenance of ecosystem functions and can reflect community composition, structure, successional stages, habitat differences, and the interrelationships between communities and the environment. Spatial distribution pattern and correlation are two spatial manifestations of population ecological relationship [3], which are the basic characteristics of plant populations and the important basis for revealing the coexistence of species and the formation and succession of communities. Research on the spatial distribution pattern of populations mainly focuses on understanding the interrelationships between populations and habitats, the ability to acquire spatial resources and ecological adaptive responses, predicting the dynamics of community growth and decline, revealing the formation mechanism of community structure and pattern, and revealing the ecological process and intrinsic mechanism of community succession [4,5,6]. The study of interspecies spatial correlation mainly focuses on elucidating the reflection of organic links formed by the mutual influence and interaction of species in different habitats. In-depth study of community species diversity, population spatial distribution pattern, and interspecific correlation is important for recognizing the ecological characteristics of populations, influencing factors, and understanding the spatial configuration and distribution status of populations at the individual level. Furthermore, this is critical in predicting the mechanism of community formation and succession, revealing the relationship between populations and the environment as well as their use of environmental resources and adaptive strategies. It also provides the theoretical basis for the regeneration and restoration of populations and communities as well as for the restoration and reconstruction of ecosystems [7]. In recent years, with the continuous expansion of the artificial oasis at the edge of Badanji Lin Desert, the transition zone at the periphery of the oasis has been strongly squeezed, resulting in the reduction in plant diversity, degradation of ecological functions, increase in dust storms, and desertification, which seriously jeopardizes the stability of the oasis. At present, there are a few systematic studies on the species diversity, population spatial distribution pattern, and interspecific correlation in the oasis transition zone along the edge of Badanjilin Desert. This area is characterized by an average annual precipitation of about 110 mm. Therefore, taking desert plants at the edge of Badanjilin Desert as the research objects, the species diversity, community spatial distribution pattern, and interspecies correlation in the transition zone of desert oasis was analyzed. Field samples were surveyed using interspecies diversity indexes and correlation analysis methods. This revealed interspecies relationships and community succession patterns. The findings aim to provide a strong scientific basis for the protection and restoration of sand-fixing vegetation populations.

2. Materials and Methods

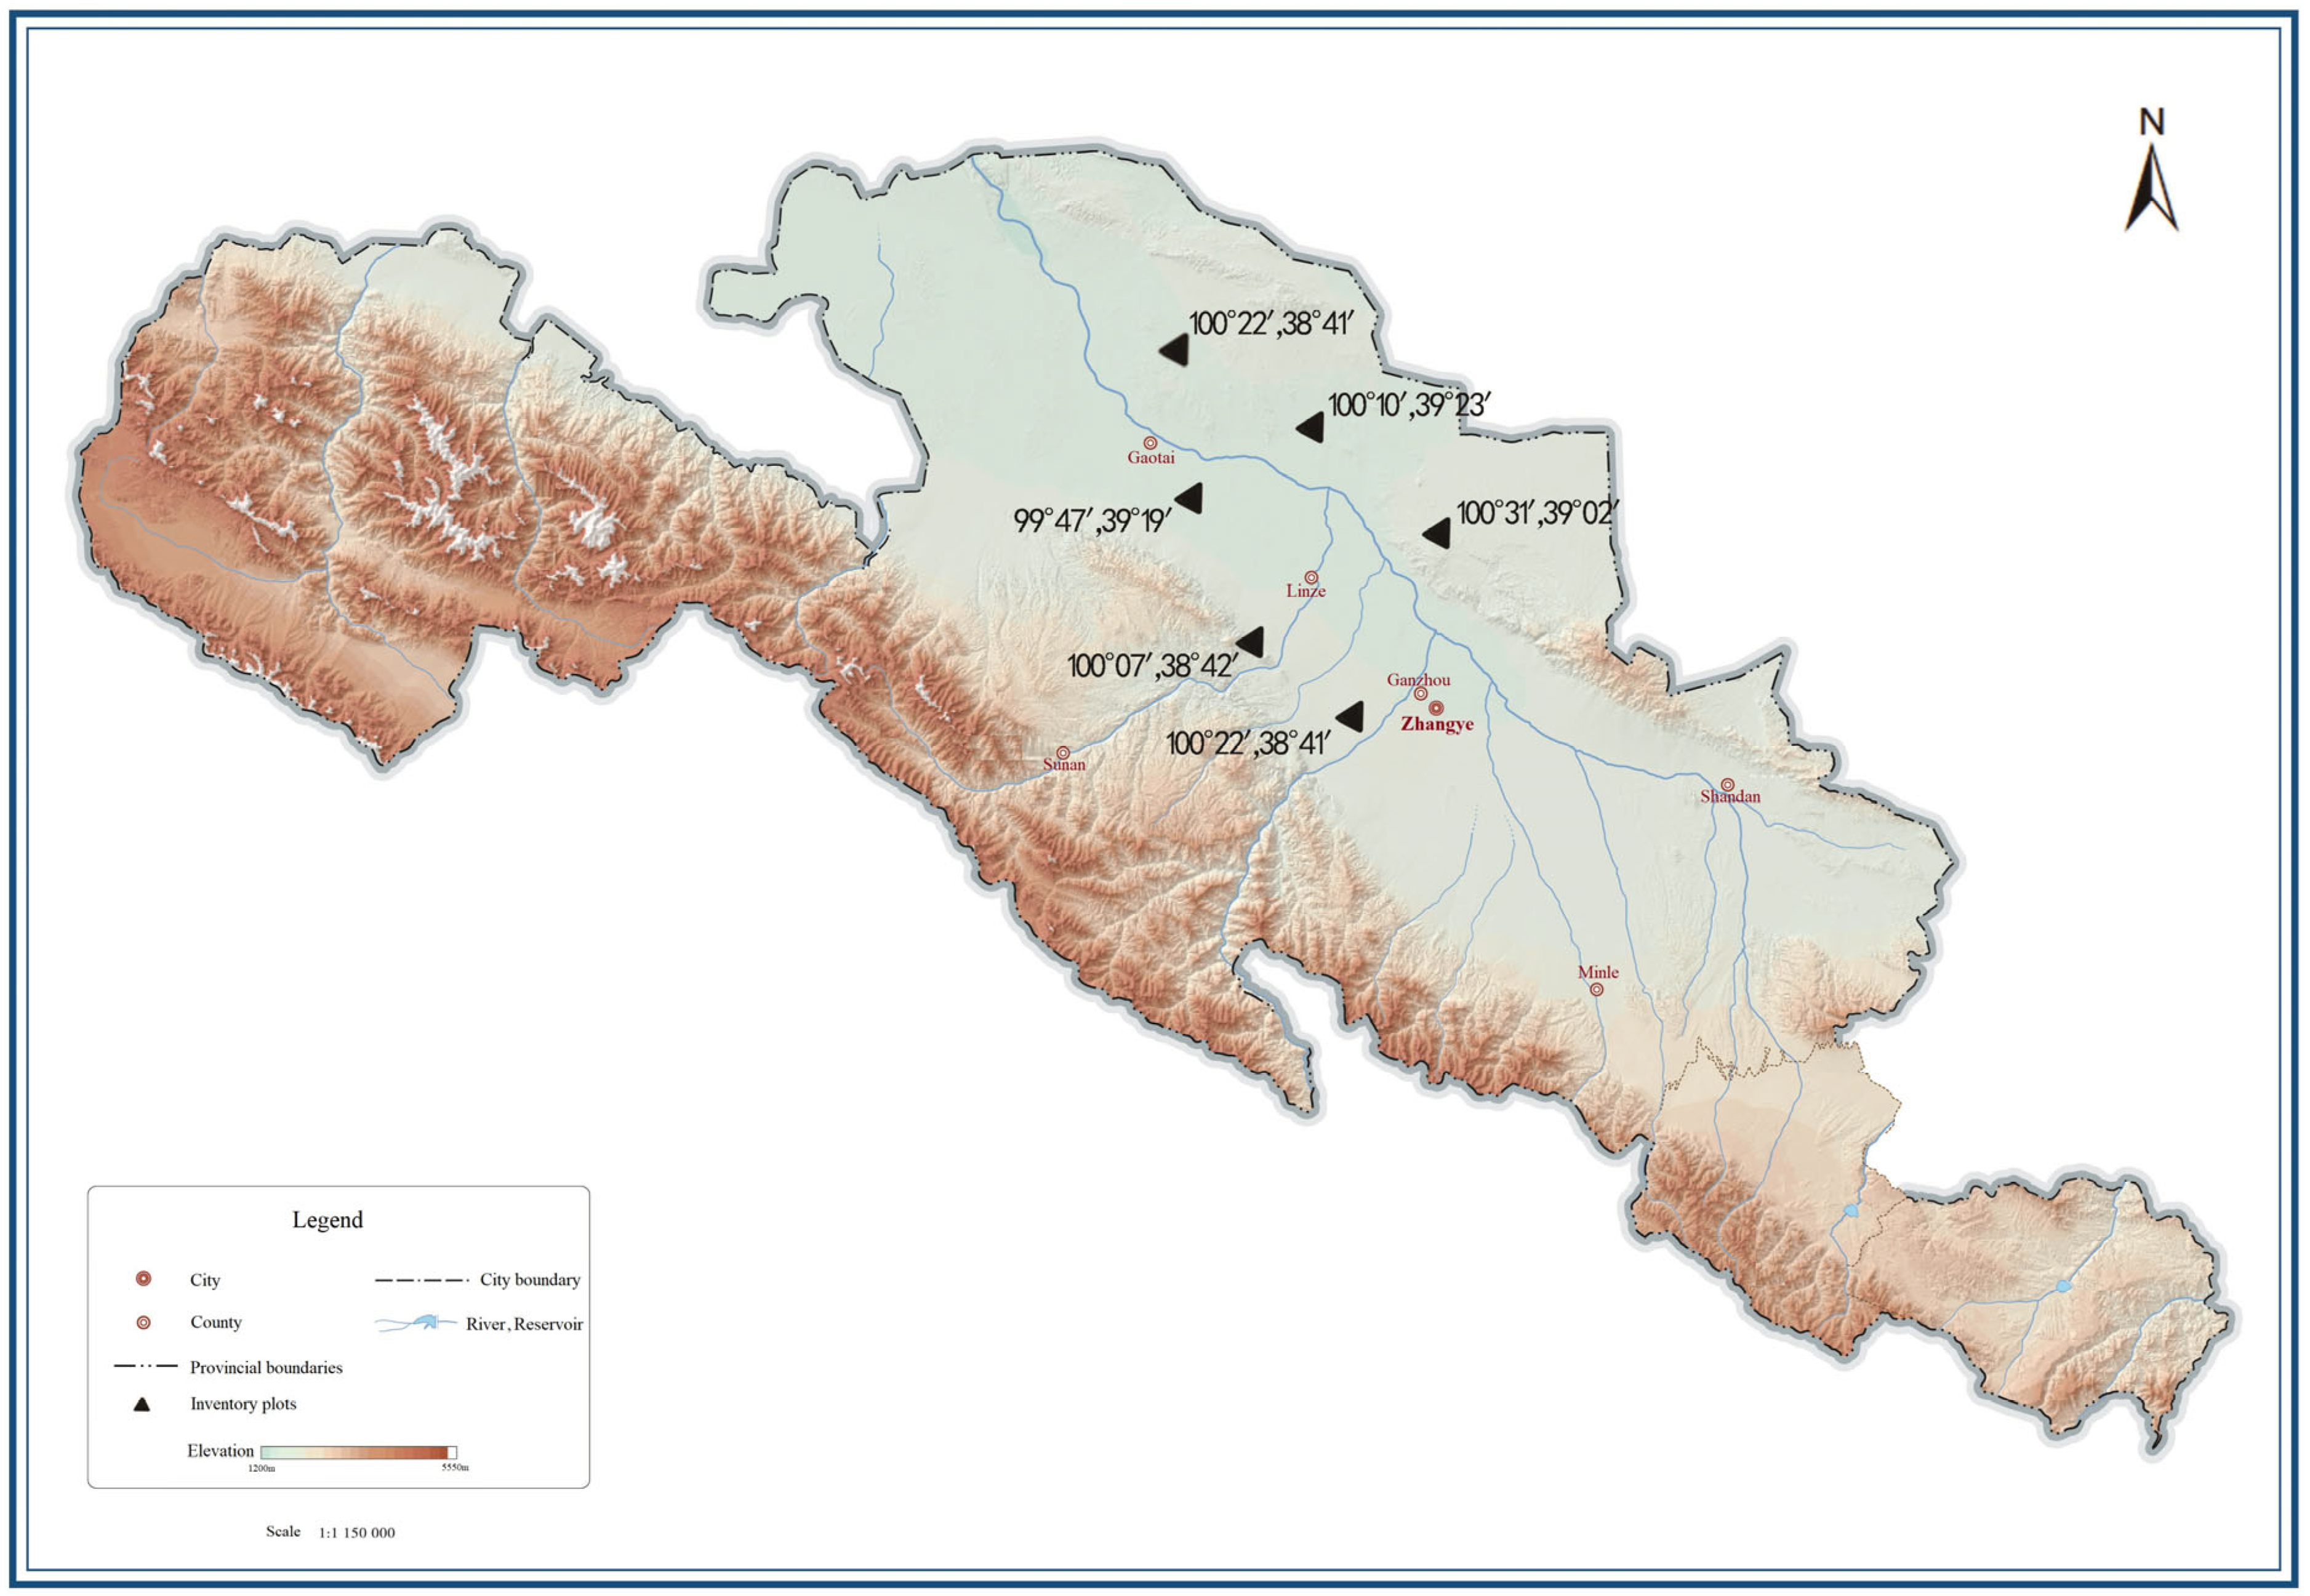
2.1. Overview of the Study Area

The study area is located in the central part of the Hexi Corridor and the southern edge of the Badanjilin Desert. Sample plots were selected in the transition zone of the desert oasis in the middle reaches of the Heihe River at the Nantan Vegetation Conservation Station in Ganzhou District, Rabbit Dam Beach in Jing’an Township, Pingchuan and Banqiao Townships in Linze County, and Nanhua and Heiquan Townships in Gaotai County. It spans three counties and districts of Zhangye City, located between 98°~101°30′ E, 38°~42° N, with an altitude between 1300~2300 m. The climate is typical of a continental climate, characterized by low precipitation, strong evaporation, large temperature difference, windy and sandy, and long sunshine hours. The average annual temperature is 7.3 °C, the average annual evaporation is 2002.5 mm, the average annual relative humidity is 52%, the annual sunshine hours are 3065.6 h, the frost-free period is 156 days, the average annual number of days of sandstorm is 3.9 days, and the average annual wind speed is 2.0 m/s. The main catastrophic weather includes drought, dry and hot winds, spring frost, frost, gale, and sandstorms, etc. The ecological environment is extremely fragile, and the vegetation is dominated by arid or super-arid shrubs and herbs, with a simple composition of vegetation structure and sparse plant species. The soil matrix is loose, infertile wind-sand and gray-brown desert soils.

2.2. Research Methodology

2.2.1. Vegetation Survey

Six typical sample plots were selected for systematic investigation in this study. These plots, located between the oasis and desert, are summarized in Table 1 and their location within the study area presented in Figure 1. In August 2021, during the peak of plant growth, 1000-m-long parallel lines were established in the study area, spread 100 m apart. In each sample line, a central point was chosen, and 30 × 30 m sample plots were set up, resulting in a total of 10 sample plots. In each sample plot, three 1 × 1 m herb samples and three 4 × 4 m shrub samples were collected, resulting in a total of 180 herb and shrub samples each. The elevation for the sample plots was also determined and recorded, as shown in Table 1. Additionally, the species, number, height, cover, canopy, life type, phenology, fruiting status, and habitat conditions of the plants in the sample plots were investigated. The species diversity, spatial pattern, and interspecific correlation were analyzed by synthesizing the cover and density of each species in the sample plots.

2.2.2. Analysis of Species Importance Values

Using quantitative indexes such as density, cover, and frequency of each species in the desert plant community, the importance values of shrubs and herbs were calculated separately. Based on these important values, the dominant populations within the desert plant community were determined. The Shannon–Wiener diversity index (H′), Simpson diversity index (D), Margalef richness index (R), Simpson dominance index (C), and Pielou evenness index (J) were used to reflect the diversity of community species and the stability of the community or ecosystem [8].
Significant value = (relative multiplicity + relative cover + relative frequency)/3
Margalef richness index (R): R = (S − 1)/lnN
Pielou   uniformity   index   ( J ) :   J = ( P i ln P i ) : ln N
Shannon Wiener   diversity   index   ( H ) :   H = i = 1 s P i ln P i
Simpson s   diversity   index   ( D ) :   D = 1 i 1 s p i 2
Simpson s   index   of   ecological   dominance   ( C ) :   C = N i ( N i 1 ) N ( N 1 )
where ‘Pi’ is the number of species ‘i’ and the relative importance of the sample (relative height + relative cover), ‘S’ is the total number of species in the sample where species ‘i’ is located, ‘Ni’ is the number of individuals of the ith species, and ‘N’ is the number of individuals of all species.

2.3. Patterns of Interspecific Spatial Distribution

The index for determining the type of spatial distribution pattern of biological populations was applied to ascertain the type of distribution pattern of populations [7]. To determine the spatial distribution pattern and aggregation strength of the populations in the transition zone of the middle reaches of the Heihe River in the desert oasis, several indices were used. These included the variance of population multiplicity (S2) and the mean of multiplicity ( x ¯ ), the ratio diffusion coefficient (C), clumping index (I), mean crowding index (M*), aggregation index (PAI), negative binomial distribution parameter (K), Cassie’s index (CA), t-test, and Green’s coefficient (GI). These indices were applied to analyze the spatial distribution pattern of each species [9] using the equations illustrated below.
Diffusion   coefficient :   C = S 2 X ¯
Clumping indicator (I): I = (v/m) − 1
When I < 0, it is uniformly distributed; when I = 0, it is randomly distributed; and when I > 0, it is clustered.
Average   congestion   factor   M :   M = X ¯ + S 2 X ¯ 1 = X ¯ + C I
When M* > 1, it is an aggregated distribution; when M* = 1, it is a random distribution; and when M* < 1, it is a uniform distribution.
Clustering   index   P A I :   P A I = M X ¯
The agglomeration index is used to measure the degree of aggregation. The larger the value, the stronger the aggregation, and when PAI > 1, it is an aggregated distribution; when PAI = 1, it is a random distribution; when PAI < 1, it is a uniform distribution.
Negative   binomial   distribution   index   K : K = X ¯ 2 S 2 X ¯
When K → ∞, it is a Uniform distribution, when K = 1 it is a random distribution and when 0 < K < 1 it is an aggregated distribution..
Cassie   indicator   C A :   C A = 1 / K
When CA > 0, it is an aggregated distribution; when CA = 0, it is a random distribution; when CA < 0, it is a uniform distribution.
t test :   t = P A I 1 / 2 n 1
Clustered distribution when t > t0.05(n–1) and uniform or random distribution when tt0.05(n–1).
Green s   factor :   G I = S 2 / X ¯ 1 n 1
For GI > 0, it is an aggregated distribution; for GI < 0, it is a uniform distribution; and for GI = 0, it is a random distribution.
Where n is the number of sample squares, S 2 is the sample multidimensional variance, and X ¯ is the sample multidimensional mean.

2.4. Calculation of Interspecific Correlations

2.4.1. Significance Test for Association Between Multiple Species

The association between multiple species was tested according to the variance ratio (VR) method [10]. The method determines whether a significant association exists among multiple co-occurring species. If no significant association is found, the following formula is used to test the statistics:
Variance ratio: VR = ST22
where ST is the variance of the number of species in all samples and δ is the variance of the frequency of occurrence of all species. VR > 1 indicates a positive association between species; VR < 1 indicates a negative association between species.

2.4.2. Association Tests for Paired Species

Linkage between species was detected using the 2 × 2 contingency table and the X2 statistic. In this table, a represents the number of samples in which species A occurs, b represents the number of samples in which species B occurs, c is the number of samples in which both species occur, and d is the number of samples in which neither occurs.
X 2   statistic : = χ 2 n [ a d b c n / 2 ] 2 ( a + b ) ( c + d ) ( a + c ) ( b + d )
where n is the total number of samples, ad > bc interspecies with positive association, ad < bc interspecies with negative association, if 3.841 ≤ χ2 < 6.635 (0.01 ≤ p ≤ 0.05) for interspecies pairwise association is significant; if χ2 ≥ 6.635 (p < 0.01) for highly significant; if χ2 < 3.841 (p > 0.05) for interspecies association is independent, and the two species are independently distributed.

2.4.3. Measurement of the Degree of Interspecific Association

The chance of occurrence and degree of association of species pairs were determined using the Ochai index (OI), Dice index (DI), and Jaccard index (JI), based on the equations below.
Ochiai   index :   OI = a ( a + b ) ( a + c )
Dice index: DI = 2a/(2a + b + c)
Jaccard index: JI = a/(a + b + c)
A value of 0 when a = 0 indicates that the species are completely dissimilar and do not occur simultaneously in the same sample square; a value of 1 when a = S indicates that they occur simultaneously in the sample square. The meaning of ‘a, b, and c’ is the same as explained for Equation (16) above.

2.5. Data Analysis and Processing

Data were captured and processed using Excel (Microsoft Corporation, 2010, Redmond, WA, USA) chart processing software to establish species importance values and community diversity indices. Further data analysis such as ANOVA and correlation analysis for each index was performed using SPSS18.0. Data visualization was conducted using Origin 9.0 software.

3. Results

3.1. Plant Species Importance Analysis

The table provides a detailed analysis of the calculated important values for different plant species, specifically focusing on shrubs and herbs, while also highlighting diversity metrics. Among the shrub species, Reaumuria songarica (Pall.) Maxim emerges as the dominant species with the highest important value of 111.175, significantly surpassing all other shrubs. This suggests that Reaumuria songarica plays a crucial role in the ecosystem, likely outcompeting other shrubs for resources. Following it, Caroxylon passerinum (Bunge) Akhani & Roalson holds a notable but considerably lower value of 54.896, indicating its secondary importance within the shrub community. Other species, such as Nitraria tangutorum Bobrov, with a value of 24.422 and Sympegma regelii Bunge at 20.111, also contribute but to a lesser extent. Additionally, species like Calligonum mongolicum Turcz. (18.740) and Caragana jubata (Pall.) Poir. (18.677) maintain a moderate presence, suggesting that while they are not as dominant, they still contribute to the overall shrub diversity (Table 2).
The diversity indices for shrubs reflect a limited range of species dominance. The diversity index (H′) for shrubs is 1.754, indicating that the shrub community is somewhat homogeneous, with only a few species playing a prominent role. Similarly, the richness (R) value of 1.343 confirms that the community consists of relatively few species, and the low evenness index (C = 0.265) further indicates an imbalance, as certain species dominate the ecosystem. However, the evenness metric (J = 2.197) suggests that despite this dominance, there is still some level of species distribution across the shrub layer.
In contrast, the herbaceous species display greater diversity and balance. The most dominant herb species is Aristida adscensionis L., which holds the highest important value of 48.6174 among the herbaceous plants. This indicates that it is a critical component of the herbaceous community. Carex tristachya Thunb. follows with a value of 23.3892, and Chloris pilosa Schumach. also contributes significantly with an important value of 18.2158. Other species, such as Grubovia dasyphylla (Fisch. & C.A. Mey) (13.6116) and Cleistogenes songorica (Roshev.) Ohwi (13.6054), further add to the herbaceous diversity, though their values are comparatively lower. This distribution reflects a more complex and balanced herbaceous layer compared to the shrubs.
The diversity metrics for the herbaceous species further underscore their greater ecological balance. The diversity index (H′) for herbs is significantly higher at 2.498, reflecting a more heterogeneous community. The richness value (R = 4.343) demonstrates that the herbaceous layer supports a larger variety of species, in stark contrast to the shrub layer. The evenness indices (C = 0.091 and J = 3.367) also indicate that the species in the herbaceous layer are distributed more evenly, with no single species overwhelmingly dominating the community.
Finally, some species across both shrubs and herbs display very low important values, suggesting minimal presence in the ecosystem. For instance, Salsola tragus L. has an important value of 10.0202, while species like Peganum harmala L. (1.716), Suaeda glauca (Bunge) Bunge (1.593), and Halogeton arachnoideus (Bunge) Moq. (1.712) are represented only minimally. These species contribute to the overall diversity but are not ecologically dominant.

3.2. Community Species Diversity and Patterns of Spatial Distribution of Populations

3.2.1. Dioecious Plant Community

In the dioecious plant community, most sample plots exhibit a congregate distribution pattern, except for one plot. Sample plot 1 has a notably high mean value of population multiplicity (66) and multivariate variance (4050), resulting in a high diffusion coefficient (61.36) and clumping indicator (60.36), showing significant clustering. Similarly, plots 2, 3, 5, and 6 also demonstrate a congregate pattern, with moderate to high diffusion coefficients ranging between 8.72 and 31.03 and clumping indicators confirming the aggregated nature of the populations. For instance, in plot 3, the diffusion coefficient is 31.03, and the average congestion factor is 3.35, indicating stronger clustering.
Plot 4, however, deviates from the general trend and displays a uniform distribution pattern. In this plot, the population multiplicity (8.2) and diffusion coefficient (1.98) are much lower than the other plots, with the clumping indicator is also relatively minimal (0.98). Cassie’s indicator (−0.02) and Green’s coefficient (0.24) further confirm that the plants in this plot are evenly distributed rather than clustered.
Overall, the dioecious community shows a dominant pattern of aggregation, with only one plot exhibiting uniformity. The high values of diffusion coefficients and clumping indicators across most plots highlight a preference for clustered growth.

3.2.2. Herbaceous Plant Community

In the herbaceous plant community, the majority of plots also display a congregate distribution pattern, with varying degrees of clustering. Plot 1 stands out with an extremely high population multivariate variance (1841.9) and diffusion coefficient (89.85), coupled with a very high clumping indicator (88.85), suggesting significant spatial aggregation. This high level of clustering is further reflected by the congestion factor (5.33), which is the highest among all the plots (Table 3).
Other plots, such as 2, 3, 4, and 6, also show congregate distribution patterns but with moderate diffusion coefficients and clumping indicators. For example, plot 2 has a diffusion coefficient of 38.89 and a clumping indicator of 37.89, indicating strong but less extreme aggregation compared to plot 1. In contrast, plot 5 exhibits a uniform distribution pattern, with a negative clumping indicator (−0.54) and low values across other indicators, including a Green’s coefficient of −0.07, signifying an evenly spaced plant community (Table 3).
The herbaceous community, therefore, shows a dominant trend of aggregation similar to the dioecious plants, with most sample plots displaying significant clustering. However, plot 5 presents a clear outlier with its uniform distribution.
Both the dioecious and herbaceous plant communities demonstrate a predominant congregate distribution pattern, characterized by significant clustering across most sample plots. The dioecious community shows one instance of uniform distribution, while the herbaceous community also has one plot (plot 5) with uniform spacing. High clumping indicators and diffusion coefficients in many plots indicate that spatial aggregation is a common feature, suggesting favorable ecological or environmental conditions promoting clustered growth in both plant communities.

3.3. Analysis of Spatial Correlation of Populations

3.3.1. Overall Correlation Analysis

The findings reveal distinct ecological dynamics between the two types of plant populations. For the dioecious plant population, the variance ratio (VR) is 0.86, and the test statistic (w) is 186.4. The results indicate a non-significant positive linkage among the populations. This suggests that while there are correlations within the dioecious plant community, they are not statistically significant and do not show strong patterns of association. The logarithmic measurements further highlight this weak linkage, as only a few cases show correlation or association (Table 4). Specifically, there are instances where the correlations are slightly greater than zero or involve mathematical association, but these patterns are inconsistent. The results point to a community where the plant populations coexist with weak or irregular interactions, possibly due to spatial dispersion or environmental factors that limit strong associations.
In contrast, the herbaceous plant population exhibits a markedly different pattern. The VR for the herbaceous plants is 1.686, and the test statistic (w) is 168.6, which indicates a significant negative linkage. This negative correlation suggests that the populations are influenced by competitive or exclusionary forces, likely driven by resource competition or environmental constraints. Unlike the dioecious community, the herbaceous populations display stronger and more structured interactions. The logarithmic results highlight several significant patterns, with many cases showing strong correlations or mathematical associations, as well as a substantial number of unrelated logarithmic values. These results suggest that while competition or exclusion dominates the interactions among herbaceous plants, there are still a few instances of unrelated distribution, adding to the complexity of the community dynamics.

3.3.2. Determination and Analysis of Correlations Between Major Populations

Of the 45 shrub species pairs (see Figure 2A), 2 pairs showed positive associations, 2 pairs had significant positive associations, 4 pairs had highly significant positive associations, 2 pairs had highly significant negative associations, and 35 pairs had no associations. Notably, there were highly significant negative associations between white thorn, red sand, and pearl millet, indicating competition among these three species for limiter resources. Conversely, red sand and pearl millet had positive association with ghost arrow mallow, suggesting similar environmental adaptations and a mutually beneficial ecological relationship.
Central Asian Asterwood did not show correlation with red sand, Artemisia spp., indicating it was distributed independently. Overall, the ecological relationships within the shrub community are largely competitive, contributing to community stability. This competition is beneficial for species regeneration and promotes population development.
Among the 45 herbaceous species pairs (see Figure 2B), 3 pairs exhibited significant positive associations, 2 pairs had highly significant negative associations, 9 pairs showed highly significant positive associations, 16 pairs had significant negative associations, and 15 pairs had no associations. This indicates that most species are mutually compatible and complementary to the environment, promoting each other’s growth and sharing similar environmental requirements. Although there is competition for resources, the small species cover means that competition for nutrients and water is not intense, preventing mutual exclusion and resource competition. Therefore, shrubs and herbs mainly exhibited no association or negative association. This suggests that as individual plants grow and develop, their demand for environmental resources, such as water and nutrients, increase.

3.3.3. Inter-Pair Linkage Analysis

The half-matrix of X2 test values after correcting for Yates’ coefficient (Figure 1) shows that among 45 species pairs in the shrub community, there are 35 pairs with X2 < 3.841, indicating that most species pairs did not have a significant association, and the interspecific associations are relatively loose. The OI value is <0.6, the DI value is <0.2, and the JI value is between −0.4 and 0, suggesting that the degree of interspecific associations in the shrub community is insignificant. Species tend to be independently distributed with greater randomness. In the herbaceous community, among the 45 species pairs, 16 pairs showed significant negative associations. The significance of associations between species pairs was tested using 3.841 ≤ χ2 < 6.635 (0.01 ≤ p ≤ 0.05), indicating competition for resources. The interspecific relationships in the herbaceous community were predominantly significant negative associations or no associations. With OI < 0.4, DI < 0.5, and JI between 0 and 0.6, it is evident that there is a certain degree of negative interspecific association, reflecting the strong influence of desert plants on resources and insignificant interspecific relationship. These findings indicate differences in habitat resource requirements among desert plants and the emergence of competition for resources among populations. Limited resources restrict the coexistence of species in desert plant communities, resulting in an unstable stage of succession that is susceptible to external disturbances and changes.

4. Discussion

The study area, situated in the transition zone of the Hexi Corridor and the Badanjilin Desert, reflects typical desert-oasis ecosystems where vegetation is sparse and environmental conditions are harsh. This arid and fragile environment, characterized by low precipitation, high evaporation, and temperature extremes, profoundly influences species dominance and diversity patterns. In the shrub community, Reaumuria songarica (Pall.) Maxim. emerged as the dominant species, with an important value (IV) of 111.175, far surpassing others like Caroxylon passerinum (Bunge) Akhani & Roalson and Nitraria tangutorum Bobrov. Similar results have been observed in studies conducted in other desert regions, such as the Alashan Plateau and Turpan Basin in China, where Reaumuria spp. are noted for their ability to tolerate extreme drought, wind erosion, and nutrient-deficient soils [11]. The dominance of Reaumuria songarica (Pall.) Maxim. highlights its ecological adaptation to desert climates, where survival depends on water-use efficiency and resistance to temperature variability. Additionally, the relatively low diversity (H′ = 1.754) and species richness (R = 1.343) align with findings from other hyper-arid regions, where species composition is simple due to strong selective pressures from extreme climatic and soil conditions [12]. In contrast, the herbaceous plant community demonstrates greater diversity and balance, with Aristida adscensionis L. playing a dominant role (IV = 48.6174). The higher diversity index (H′ = 2.498) and richness (R = 4.343) suggest a more heterogeneous community structure, which is consistent with desert fringe environments where microclimatic variations and soil moisture availability promote herbaceous species establishment [13]. Compared to the shrub layer, the herbaceous layer benefits from shorter life cycles and opportunistic growth strategies that enable species to exploit favorable conditions following sporadic rainfall. Such patterns are also observed in desert-oasis systems in northern Xinjiang and Inner Mongolia, where herbaceous species display higher resilience to environmental stresses. The spatial distribution patterns observed in this study underscore the adaptive strategies of plant species under arid conditions. The dioecious shrub community predominantly exhibits congregate distribution patterns, particularly in areas where resource availability is localized, such as along river margins or shallow groundwater zones. The high diffusion coefficients and clumping indicators (e.g., plot 1: diffusion coefficient = 61.36) suggest that clustered growth enhances species survival by reducing evaporative losses and providing mutual protection against wind erosion [14]. This clustering trend mirrors observations from desert ecosystems in the Tarim Basin, where shrubs like Haloxylon ammodendron (C.A. Mey) Bunge ex Fenzl and Tamarix ramosissima Ledeb. exhibit similar spatial patterns in response to resource scarcity. In contrast, the herbaceous community also demonstrates a predominant aggregative distribution, particularly in fertile patches where soil moisture is higher (e.g., plot 1: clumping indicator = 88.85). However, the occurrence of uniform patterns in certain plots, such as plot 5, suggests the influence of competitive exclusion forces that limit clustering under intense resource competition. Similar patterns have been reported in studies of herbaceous plants in the Gurbantunggut Desert, where limited soil nutrients and water availability promote even spacing to maximize resource utilization [15]. The spatial correlation analysis reveals contrasting interspecific interactions between shrubs and herbaceous plants, shaped by competition and resource dynamics. The dioecious shrub community exhibits weak positive linkages (VR = 0.86), suggesting loose associations and a high degree of independent spatial distribution. This finding is consistent with observations in desert-oasis environments, where abiotic factors, such as wind-sand disturbances and soil heterogeneity, dominate community dynamics, limiting strong interspecific correlations [16]. In contrast, the herbaceous plant community displays significant negative linkages (VR = 1.686), reflecting stronger competitive interactions. These patterns indicate that herbaceous species face greater resource constraints, leading to exclusionary relationships where dominant species suppress weaker competitors. Similar competitive dynamics have been reported in arid grasslands of the Loess Plateau, where resource scarcity intensifies interspecific competition among herbaceous plants [17]. Nevertheless, the presence of occasional positive correlations suggests niche complementarity, where certain species coexist by exploiting different microhabitats or resources. The spatial distribution patterns and diversity indices observed in this study align with the environmental constraints of the arid transition zone, which is strongly influenced by an aridity gradient. Gradients of aridity are known to affect the maintenance or loss of biodiversity by shaping the ecological strategies of plant species and influencing resource availability [18,19]. In hyper-arid environments, such as the Badain Jilin Desert, water scarcity and extreme temperature fluctuations create selective pressures that limit species richness and favor drought-tolerant species like Reaumuria songarica (Pall.) Maxim. Conversely, in less arid microhabitats within the study area, opportunistic herbaceous species like Aristida adscensionis L. can establish and contribute to higher diversity indices [18]. An examination of the functional traits of the dominant species in the study area reveals critical insights into their adaptive strategies and spatial distribution patterns. For instance, Reaumuria songarica (Pall.) Maxim., the dominant shrub species, is well known for its drought tolerance and ability to thrive in nutrient-poor soils. This is largely attributed to its deep root system, which allows access to groundwater, and its small, waxy leaves that minimize water loss through evapotranspiration. These traits not only enable its survival under extreme arid conditions but also contribute to its dominance within the shrub layer. Similarly, Aristida adscensionis L., the dominant herbaceous species, exhibits traits such as rapid germination and growth following sporadic rainfall events, as well as a high reproductive rate through wind-dispersed seeds. These dispersal mechanisms allow it to colonize open spaces quickly and maintain its presence in the community despite competition for limited resources. These functional traits are closely linked to the spatial distribution patterns observed in the study. The clumped distribution of Reaumuria songarica (Pall.) Maxim. is likely influenced by its ability to maximize resource use in localized areas with higher soil moisture, while the higher diversity and more evenly distributed patterns of herbaceous species, such as Aristida adscensionis L., reflect opportunistic growth and resource exploitation strategies. Incorporating such functional traits into the analysis not only enhances our understanding of species interactions and community dynamics but also provides valuable information for conservation and restoration efforts in arid environments. The analysis of major species pairs further emphasizes the competitive nature of plant communities in arid regions. In the shrub community, significant negative associations were observed among Reaumuria songarica (Pall.) Maxim., Nitraria tangutorum Bobrov, and Caroxylon passerinum (Bunge) Akhani & Roalson, likely driven by competition for limited soil moisture and nutrients. This aligns with findings from similar desert ecosystems, where dominant shrubs establish competitive hierarchies that suppress less adapted species [20]. Positive associations, such as those observed between Reaumuria songarica (Pall.) Maxim. and ghost arrow mallow, highlight the potential for facilitative interactions, where certain species improve soil conditions or provide shade, creating microhabitats that benefit co-occurring species. In the herbaceous community, the prevalence of negative associations (16 pairs) indicates intense resource competition, particularly during peak growing seasons when water availability is minimal. However, significant positive associations in nine pairs suggest that herbaceous species can coexist through complementary resource utilization, similar to patterns observed in desert steppe ecosystems of Kazakhstan [21]. The inter-pair linkage analysis confirms the overall trend of weak interspecific associations in the shrub community, with most pairs showing no significant correlation (χ2 < 3.841). This suggests that the shrub community is at an early stage of succession, where species are still independently distributed due to environmental instability and resource patchiness [22]. In contrast, the herbaceous community exhibits stronger negative associations, reflecting competitive pressures that shape species interactions under resource-limited conditions. The results of this study underscore the impact of harsh environmental conditions in the Hexi Corridor and Badanjilin Desert on plant species diversity and spatial dynamics. The dominance of Reaumuria songarica (Pall.) Maxim among shrubs and the greater diversity of herbaceous species reflect adaptive strategies to cope with extreme aridity, strong winds, and infertile soils. Aggregative distribution patterns provide ecological advantages, such as reducing evaporation and enhancing resource sharing, while competitive interactions highlight the challenges of species coexistence in desert ecosystems. This improved understanding of the vegetational ecology of the Badain Jilin Desert provides critical insights for targeted conservation strategies. By identifying the dominant species and their adaptive mechanisms, such as the aggregation patterns of Reaumuria songarica (Pall.) Maxim in shrub communities and Aristida adscensionis L. in herbaceous layers, conservation efforts can prioritize the protection of these key species that sustain ecosystem resilience. Additionally, the spatial distribution and interspecific relationship data can inform habitat restoration efforts, such as optimizing planting schemes to enhance soil stabilization and resource efficiency. These findings contribute to preserving the biodiversity of the region by maintaining ecological balance and mitigating the effects of desertification. Practically, this knowledge can guide local land-use planning, support ecological restoration projects, and shape sustainable management policies for the transition zones at the desert-oasis interface.

5. Conclusions

This study highlights the patterns of plant species diversity, spatial distribution, and interspecific relationships in the desert-oasis transition zone of the Hexi Corridor and southern Badanjilin Desert. The findings reveal that Reaumuria songarica (Pall.) Maxim dominates the shrub layer, reflecting its adaptability to extreme arid conditions such as low precipitation, nutrient-poor soils, and high evaporation. In contrast, the herbaceous layer, led by Aristida adscensionis L., demonstrates higher diversity and richness, suggesting its opportunistic growth strategies in response to transient favorable conditions. The low diversity and strong dominance in the shrub community, compared to the heterogeneity of the herbaceous community, highlight their differing ecological roles in this fragile environment. Spatial distribution analysis shows a predominant aggregative pattern in both communities, emphasizing adaptive strategies to cope with resource scarcity. While shrubs benefit from clustering for mutual protection against harsh conditions, herbaceous plants exhibit variability, with occasional uniform patterns driven by resource competition. Interspecific correlation analysis reveals weak associations in the shrub layer, with competition observed among dominant species, whereas the herbaceous layer shows stronger negative associations, reflecting more intense competition for limited resources. The results emphasize the importance of dominant species in maintaining ecosystem stability while highlighting the vulnerability of these plant communities to external disturbances. Effective conservation efforts should focus on protecting dominant species, improving microhabitat conditions, and mitigating human pressures to support ecosystem resilience. In future studies, a more comprehensive multivariate analysis, such as Non-Metric Multidimensional Scaling (NMDS), could be conducted to evaluate how the resulting plant groups correlate with the specific environmental conditions of the study site. This approach would provide deeper insights into the relationships between species composition and site-specific factors, such as soil type, moisture availability, and elevation. While the current study focuses on diversity indices and spatial correlations to highlight species interactions and adaptive strategies, integrating NMDS or similar analyses in future work could further validate and refine these findings.

Author Contributions

Conceptualization, J.C. and P.Z.; methodology, J.C. and P.Z.; software, J.C. and P.Z.; validation, J.C. and P.Z.; formal analysis, J.C., P.Z. and I.D.A.; investigation, J.C. and P.Z.; resources, J.C. and P.Z.; data curation, J.C. and P.Z.; writing—original draft preparation, J.C., P.Z. and I.D.A.; writing—review and editing, J.C., P.Z. and I.D.A.; visualization, J.C., P.Z. and I.D.A.; supervision, J.C., P.Z. and I.D.A.; project administration, J.C. and P.Z.; funding acquisition, J.C. and P.Z. All authors have read and agreed to the published version of the manuscript.

Funding

This research received no external funding.

Institutional Review Board Statement

Not applicable.

Informed Consent Statement

Not applicable.

Data Availability Statement

The original contributions presented in this study are included in the article. Further inquiries can be directed to the corresponding author.

Conflicts of Interest

The authors declare no conflicts of interest.

References

  1. Chen, Y.; Fang, G.; Li, Z.; Zhang, X.; Gao, L.; Elbeltagi, A.; El Shaer, H.; Duan, W.; Wassif, O.M.A.; Li, Y.; et al. The Crisis in Oases: Research on Ecological Security and Sustainable Development in Arid Regions. Annu. Rev. Environ. Resour. 2024, 49, 1–20. [Google Scholar] [CrossRef]
  2. Ngabire, M.; Wang, T.; Xue, X.; Liao, J.; Sahbeni, G.; Huang, C.; Song, X.; Duan, H.; Nyiransengiyumva, C. Synergic effects of land-use management systems towards the reclamation of Aeolian Desertified Land in the Shiyang River Basin. Ecol. Indic. 2022, 139, 108882. [Google Scholar] [CrossRef]
  3. Shen, J.; Li, S.; Liu, L.; Liang, Z.; Wang, Y.; Wang, H.; Wu, S. Uncovering the relationships between ecosystem services and social-ecological drivers at different spatial scales in the Beijing-Tianjin-Hebei region. J. Clean. Prod. 2021, 290, 125193. [Google Scholar] [CrossRef]
  4. Ficetola, G.F.; Marta, S.; Guerrieri, A.; Gobbi, M.; Ambrosini, R.; Fontaneto, D.; Zerboni, A.; Poulenard, J.; Caccianiga, M.; Thuiller, W. Dynamics of Ecological Communities Following Current Retreat of Glaciers. Annu. Rev. Ecol. Evol. Syst. 2021, 52, 405–426. [Google Scholar] [CrossRef]
  5. Godoy, O.; Soler-Toscano, F.; Portillo, J.R.; Langa, J.A. The assembly and dynamics of ecological communities in an ever-changing world. Ecol. Monogr. 2024, 94, e1633. [Google Scholar] [CrossRef]
  6. Zhao, D.; Guo, C.; Wu, D.; Guo, X. Different driving mechanisms of spatial heterogeneity at the community and landscape levels in the wetland ecosystem dominated by hydro-ecological processes. Hydrol. Process. 2023, 37, e14916. [Google Scholar] [CrossRef]
  7. Zhang, L.; Gao, Y.; Li, J.; Zhang, C.; Li, M.; Hu, Z.; Cui, X. Effects of grazing disturbance of spatial distribution pattern and interspecies relationship of two desert shrubs. J. For. Res. 2022, 33, 507–518. [Google Scholar] [CrossRef]
  8. Luo, Y.; Gong, Y. α Diversity of desert shrub communities and Its relationship with Climatic factors in Xin-jiang. Forests 2023, 14, 178. [Google Scholar] [CrossRef]
  9. Cui, D.; Wang, Q.; Ma, S.; Zhang, Y.; Xu, L.; Yan, L. Natural Regeneration Patterns of Juglans mandshurica in Different Habitats. Forests 2024, 15, 1201. [Google Scholar] [CrossRef]
  10. Wanishsakpong, W.; Sodrung, K.; Thongteeraparp, A. A Comparison of Nonparametric Statistics and Bootstrap Methods for Testing Two Independent Populations with Unequal Variance. Int. J. Anal. Appl. 2023, 21, 36. [Google Scholar] [CrossRef]
  11. Li, L.; Chen, J.; Han, X.; Zhang, W.; Shao, C.; Li, L.; Chen, J.; Han, X.; Zhang, W.; Shao, C. Desert Rangeland Ecosystem. In Grassland Ecosystems of China: A Synthesis and Resume; Springer: Berlin/Heidelberg, Germany, 2020; pp. 401–454. [Google Scholar]
  12. Groner, E.; Babad, A.; Swiderski, N.B.; Shachak, M. Toward an extreme world: The hyper-arid ecosystem as a natural model. Ecosphere 2023, 14, e4586. [Google Scholar] [CrossRef]
  13. El-Bana, M.I.; Nijs, I.; Kockelbergh, F. Microenvironmental and vegetational heterogeneity induced by phytogenic nebkhas in an arid coastal ecosystem. Plant Soil 2002, 247, 283–293. [Google Scholar] [CrossRef]
  14. McGuire, L.P.; Fuller, N.W.; Dzal, Y.A.; Haase, C.G.; Klüg-Baerwald, B.J.; Silas, K.A.; Plowright, R.K.; Lausen, C.L.; Willis, C.K.R.; Olson, S.H. Interspecific variation in evaporative water loss and temperature response, but not metabolic rate, among hibernating bats. Sci. Rep. 2021, 11, 1–9. [Google Scholar] [CrossRef] [PubMed]
  15. Li, C.; Lei, J.; Xu, X.; Gao, P.; Qiu, Y.; Xu, B.; Zhong, X.; Wang, Y.; Yan, J.; Wang, G. Spatial pattern for soil water and chemical properties in Gurbantunggut Desert. Acta Ecol. Sin. 2014, 34, 4380–4389. [Google Scholar] [CrossRef]
  16. Lortie, C.J.; Cushman, J.H. Effects of a directional abiotic gradient on plant community dynamics and invasion in a coastal dune system. J. Ecol. 2007, 95, 468–481. [Google Scholar] [CrossRef]
  17. Liu, C.; Jia, X.; Bai, X.; Shao, M. Analysis of soil water use by exotic and native vegetation in a semi-arid area and their associated interspecific competition. Sci. Total. Environ. 2023, 905, 167066. [Google Scholar] [CrossRef] [PubMed]
  18. Maestre, F.T.; Quero, J.L.; Gotelli, N.J.; Escudero, A.; Ochoa, V.; Delgado-Baquerizo, M.; Garcia-Gomez, M.; Bowker, M.A.; Soliveres, S.; Escolar, C.; et al. Plant species richness and ecosystem multifunctionality in global drylands. Science 2012, 335, 214–218. [Google Scholar] [CrossRef] [PubMed]
  19. Soliveres, S.; Maestre, F.T.; Bowker, M.A.; Torices, R.; Quero, J.L.; García-Gómez, M.; Cabrera, O.; Cea, A.P.; Coaguila, D.; Eldridge, D.J.; et al. Functional traits determine plant co-occurrence more than environment or evolutionary relatedness in global drylands. Perspect. Plant Ecol. Evol. Syst. 2014, 16, 164–173. [Google Scholar] [CrossRef] [PubMed]
  20. Kingsford, R.T.; West, R.S.; Pedler, R.D.; Keith, D.A.; Moseby, K.E.; Read, J.L.; Letnic, M.; Leggett, K.E.A.; Ryall, S.R. Strategic adaptive management planning—Restoring a desert ecosystem by managing introduced species and native herbivores and reintroducing mammals. Conserv. Sci. Pr. 2020, 3, e268. [Google Scholar] [CrossRef]
  21. Rachkovskaya, E.I.; Bragina, T. Steppes of Kazakhstan: Diversity and Present State. In Eurasian Steppes: Ecological Problems and Livelihoods in a Changing World; Springer: Berlin/Heidelberg, Germany, 2012; pp. 35–54. [Google Scholar] [CrossRef]
  22. Calvo, L.; Tárrega, R.; De Luis, E. Secondary succession after perturbations in scrubland community. Acta Oecol. 2002, 23, 393–404. [Google Scholar] [CrossRef]
Figure 1. Map of the study area indicating the sampling plots.
Sustainability 17 01259 g001
Figure 2. A 2 × 2 semi-matrix of interspecific associations among dominant populations in the shrub layer (A) and interspecific associations among dominant populations in the herb layer (B). Note: ◆: highly significant positive linkage; : significant positive linkage; +: positive linkage; ★: highly significant negative linkage.
Sustainability 17 01259 g002
Table 1. Basic information on the study area.
Sample PlotLocationElevation (m)Constriction (i.e., Degree of
Depression)
Soil TypeShrub SpeciesHerbaceous Species
South Beach, Ganzhou DistrictN 38°42′0.905″
E 100°21′46.673″
1848.865sandy soilPearl Pork Hair Vegetabletundra
Ganshu District Rabbit Dam BeachN 39°03′56.555″
E 100°31′2.185″
1485.745sandy loam and gravelred sandSemen euryales (botany)
Linze boardwalkN 38°42′0.905″
E 100°21′46.673″
1395.830sandy soilred sandtarragon
Linzehpingchuan, town in GansuN 39°22′59.056″
E 100°09′11.440″
1385.670sandy soilred sandtarragon
Kurozumi, KotaiN 39°27′20.455″
E 99°45′18.865″
1344.725desert soilred sandArtifacts of Inner Mongolia
Godai NanhuaN 39°17′1.122″
E 99°46′12.064″
1426.620sandy loam and gravelred sandsargassum
Table 2. Statistics of species importance values and diversity indices.
Serial NumberShrub HerbImportant Value
SpeciesImportant Value SpeciesImportant ValueSpeciesImportant Value Species
1Reaumuria songarica (Pall.) Maxim111.175 Aristida adscensionis L.48.6174 Eragrostis pilosa (L.) P. Beauv8.693Corispermum hyssopifolium L.1.785
2Caroxylon passerinum (Bunge) Akhani & Roalson54.896 Carex tristachya Thunb.23.3892 Neotrinia splendens (Trin.) M. Nobis4.817Peganum harmala L.1.716
3Nitraria tangutorum Bobrov24.422 Chloris radiata (L.) Sw.18.2158 Limonium aureum (L.) Chaz3.772Halogeton arachnoideus (Bunge) Moq. 1.712
4Sympegma regelii Bunge20.111 Grubovia dasyphylla (Fisch. & C.A. Mey)13.6116 Arnebia fimbritum (Maxim)3.187Bothriospermum chinense Bunge 1.672
5Calligonum mongolicum Turcz18.740 Cleistogenes songorica (Roshev.) Ohwi13.6054 Tragus racemosus (L.) All.3.176Arnebia szechenyi Kanitz1.608
6Caragana jubata (Pall.) Poir.18.677 Salsola paulsenii Litv.11.8383 Lepidium apetalum Willd.2.608Suaeda glauca (Bunge) Bunge1.593
7Artemisia frigida Willd.18.457 Artemisia scoparia Waldst. & Kit. 11.4009 Corispermum squarrosum (L.) Moq.2.021Zygophyllum fabago L.1.587
8Artemisia xerophytica Krasch. 16.578 Stipa tianschanica Roshev10.3616Cynanchum thesioides (Freyn)1.989
9Asterothamnus centrali-asiaticus Novopokr8.134 Salsola tragys L.10.0202Astragalus pseudotataricus Boriss 1.812
10Hedysarum scoparium Fisch. & C.A. Mey.5.312
H′1.754 2.498
R1.343 4.343
C0.265 0.091
J2.197 3.367
Note: authority for the plant names are provided according to the Plants of the World Online database (https://powo.science.kew.org/, accessed on 22 January 2025).
Table 3. Results of aggregation strength index analysis of spatial patterns of populations.
Community TypeSample PlotMean Value of Population MultiplicityPopulation Multivariate VarianceDiffusion CoefficientClumping IndicatorAverage Congestion FactorAggregation Index PAINegative Binomial Distribution ParameterCassie’s Indicatort-TestGreen’s Coefficient GIDistribution Pattern
dioecious1 66405061.36 60.36 126.36 1.91 1.09 0.91 49.92 60.36 congregate
2 15.25132.928.72 7.72 22.97 1.51 1.98 0.51 5.65 2.57 congregate
3 12.8397.231.03 30.03 42.83 3.35 0.43 2.35 24.41 7.51 congregate
4 8.216.21.98 0.98 9.18 1.12 8.41 0.12 −0.02 0.24 uniformly
5 23428.518.63 17.63 40.63 1.77 1.30 0.77 13.98 4.41 congregate
6 16.67424.3325.46 24.46 41.13 2.47 0.68 1.47 19.73 12.23 congregate
herbaceous1 20.51841.989.85 88.85 109.35 5.33 0.23 4.33 62.12 17.77 congregate
2 29.171134.1738.89 37.89 67.05 2.30 0.77 1.30 31.02 7.58 congregate
3 3.525.397.25 6.25 9.75 2.79 0.56 1.79 4.42 0.69 congregate
4 11.2183.2916.37 15.37 26.57 2.37 1.37 1.37 12.08 1.71 congregate
5 1.890.860.46 −0.54 1.34 0.71 −3.47 −0.29 −1.09 −0.07 uniformly
6 8.5190.722.44 21.44 29.94 3.52 0.40 2.52 17.18 4.29 congregate
Table 4. Overall correlation test between major populations.
PhaseVariance Ratio VRTest Statistic wMeasurementsLogarithm of Highly Significant CorrelationLogarithm of Significant CorrelationLogarithm of Association (math.)Unrelated Logarithm
Greater Than ZeroCarry (On One’s Back)Greater Than ZeroCarry (On One’s Back)Greater Than ZeroCarry (On One’s Back)
Dioecious0.864186.4Non-significant positive linkage42202035
Herbaceous1.686168.6Significant negative linkage923160015
Disclaimer/Publisher’s Note: The statements, opinions and data contained in all publications are solely those of the individual author(s) and contributor(s) and not of MDPI and/or the editor(s). MDPI and/or the editor(s) disclaim responsibility for any injury to people or property resulting from any ideas, methods, instructions or products referred to in the content.

