Article

Technical and Economic Feasibility Investigation for the Treatment of Microplastic-Contaminated Marine Sediments Through an Environmentally Sustainable Separation Process

1
Department of Civil, Environmental, Land, Building Engineering and Chemistry, Polytechnic University of Bari, Via Orabona 4, 70125 Bari, Italy
2
Department of Agricultural and Environmental Sciences, University of Bari, Via Amendola 165/A, 70126 Bari, Italy
*
Author to whom correspondence should be addressed.
Sustainability 2025, 17(3), 1258; https://doi.org/10.3390/su17031258
Submission received: 3 January 2025 / Revised: 22 January 2025 / Accepted: 3 February 2025 / Published: 4 February 2025
(This article belongs to the Section Environmental Sustainability and Applications)

Abstract

:
This work provides a comprehensive study of a density separation treatment through sucrose solution for the removal of microplastics (MPs) from marine sediments. The theoretical determination of flotation velocities for 1.0 mm diameter spherical MPs with a density of 1.3 g/cm3 at various solution temperatures and sucrose contents was performed. An optimal velocity of 1.03 m/h was observed with a 70% sucrose solution at 50 °C. The validation of theoretical velocities was carried out through experimental tests at optimal operating conditions for polypropylene (PP), high-density polyethylene (HDPE), polylactic acid (PLA), and polyvinyl chloride (PVC) as target MPs. The results showed an experimental floating velocity slightly lower than the theoretical predictions for PP, HDPE, and PLA. PVC, instead, characterized by a higher density than the separation solution, showed a settling velocity 42% lower than the theoretical one. Further tests were performed to assess the solid-to-liquid (S/L) ratio effect on MPs’ separation efficiency. The results showed an optimal S/L of 75 kg/m3 with 80% PVC removal and total PP, HDPE, and PLA removal. Finally, the design and cost optimization of a longitudinal settling tank were proposed for the pilot/real-scale treatment. The observed outcomes provided in-depth details useful for the development of an environmentally sustainable treatment for the preservation of marine areas.

1. Introduction

The production of plastic materials has been characterized by a continuously increasing rate over the years, with data highlighting a significant growth in worldwide manufacturing from 2 to 5 million tons in the 1950s up to 368 million tons in recent times [1,2]. Considering several of their characteristics (such as chemical resistance, durability, proper malleability, etc.), plastics are widely used in the manufacturing of several common consumer goods and products (such as utensils, packaging, etc.) [3,4]. However, the disposal of plastic materials leads to the formation of wastes that are susceptible to deterioration by natural factors, which then results in releasing fragments in the environment through wind or surface water run off [5,6].
Plastic particles with a size lower than 5 mm are defined as microplastics (MPs). In particular, the ones deriving from the deterioration of greater-size plastics are classified as secondary MPs. On the contrary, primary MPs are directly manufactured at microscopic sizes and commonly found in cosmetics, cleaning products, etc. [1,7].
Among environmental compartments, marine–coastal areas are particularly affected by this form of contamination. This is especially related to the extent of anthropic activities’ diffusion close to marine areas (e.g., recreational, harbor, fishing, etc.). Moreover, a further significant contribution of MPs to the marine environment can also be represented by inland sources and particularly from urban regions [8]. Based on this material persistence in the environment and slow degradability, the presence of plastic particles can be detrimental for marine ecosystems since they can be ingested by aquatic species, consequently biomagnifying trophic levels [9]. MPs can generally cause severe problems in the digestive system, reproduction, and growth of these species, but they can also act as an adsorbent material and become a carrier for other pollutants (e.g., heavy metals, organochlorines, etc.) [10]. Based on their typology and density, MPs can also float on the surface of water or sink from the water column, consequently accumulating in marine sediments, providing further contamination pathways of the marine environment [11,12]. In general, many studies have reported that the contamination of sediments by microplastics can reach values even greater than 3000 items per kg of dewatered sediment [13,14]. In particular, Jiang et al. (2022) [15] found that MPs’ contamination in the sediments of the Beibu Gulf (China) is in the range of 5014 and 8714 items/kg.
According to this, proper monitoring activities of marine areas and matrices are crucial for the preservation of environmental quality status and biota, as well as the safeguarding of human health, which could be directly or indirectly exposed to serious threat by the spread of MP pollution. An interesting aspect in this context has been represented by the challenging identification of MPs mixed in marine sediments. Many researchers have carried out studies focused on efficient methodologies to separate MPs from the solid marine matrix to provide a useful means for their monitoring in the environment. For instance, among less-investigated strategies, electrostatic separation showed itself to be an efficient technique to collect MP particles of different sizes and densities from environmental matrices [16]. Moreover, a method involving the aqueous alkaline depolymerization of polyethylene terephthalate (PET) and subsequent determination through the HPLC of the formed terephthalic acid (TPA) has been investigated for PET micro- and nanoparticles’ determination in marine sediments [17].
Nonetheless, taking into account the potential high costs of the previous approaches, the most commonly used strategy is MPs’ collection through density separation [18]. This separation method is carried out by introducing MP-contaminated sediments in a dense solution made by mixing water and a selected salt. Since MPs have a lower density than sediments, they can be separated through flotation based on the comparison of densities between the separation solution involved and the plastic particles. Different salts involved in the preparation of aqueous solutions were tested in the literature and some examples are provided by investigations involving NaCl, NaI, ZnCl2, CaCl2, or Na2WO4·2H2O [19,20,21,22]. Different studies also aimed to design efficient units to enhance MPs’ density separation. For instance, Imhof et al. reported very high separation efficiencies with ZnCl2 solution for both large (1–5 mm) and small (<1 mm) MP particles through the devising of the Munich Plastic Sediment Separator [23]. Also, a mean MP removal efficiency of almost 96% was observed through density separation with ZnCl2 solution in a custom-made portable system named the Sediment–Microplastic Isolation (SMI) unit [20]. Furthermore, the use of NaCl and sucrose mix within aqueous solutions was also suggested in order to provide a more environmentally sustainable alternative for MPs’ density separation [18].
Despite the several reported studies, the focus of the investigated separation methods was mainly oriented to define a proper analytical approach useful to monitor both MPs’ content and availability within marine sediments. On the contrary, the implementation of a MPs separation method towards a remediation purpose of marine sediment is still lacking in the literature. In this case, an in-depth optimization study would be required for the identification of suitable conditions such as process temperature and salt concentration, respectively, affecting the viscosity and density of the aqueous separation solution.
With this aim, this study focused on an experimental procedure carried out to optimize a MPs’ density separation process with sucrose solution for sediments’ remediation. The lab-scale experiments were carried out on silica sand artificially contaminated by polypropylene (PP), high-density polyethylene (HDPE), polylactic acid (PLA), and polyvinyl chloride (PVC). In the first phase, a theoretical formula was used to identify optimal operating conditions, such as sucrose percentage in solution and temperature. Moreover, the floating velocity of theoretical MPs was also determined and compared with the experimentally measured floating velocity. In the following lab-scale experimental phase, density separation tests at optimal conditions were performed with different solid-to-liquid (S/L) ratios to further identify the proper amount of solid matrix needed for an efficient treatment. Finally, a potential reactor configuration concept for MPs’ density separation process scale-up was suggested together with an economic analysis to assess its feasibility. According to this, the overall procedure provides a comprehensive investigation useful to both identify an effective strategy for MPs’ removal from solid matrices and practical information for a real-scale treatment implementation.

2. Materials and Methods

2.1. Materials

Separation experiments of MPs (PP, HDPE, PLA, and PVC) were carried out with both commercial silica sand (Bassanetti, Italy), characterized by a particle size in the range of 0.3–1.0 mm, and real marine sediments, taken from the Fischetto beach in Mola di Bari (Italy). The PLA was obtained from the cutting of a PLA Ingeo 850 filament (Eolas Print, Reocín, Spain) with a diameter of 1.75 mm. The other MPs were obtained from wastes (Table 1) and were reduced to different investigated sizes with a cutter. Food-grade sucrose (SRB s.p.a., Brindisi, Italy) and demineralized water were used for the preparation of the separation solution.

2.2. Theoretical Basis

In the laminar flow condition, a spherical particle suspended in a liquid is characterized by a settling/floating velocity (vp) expressed by Stokes’s law [24]:
v p = g · ρ p ρ s · d 2 18 · ν
where g is gravity acceleration, ρp and ρs are the density of the particle and the solution, respectively, d is the particle diameter, and ν is the solution viscosity.
In this study, both ρs and ν are dependent on temperature (T) and sucrose concentration. In particular, Barber [25] reported that the ρs is a function of T (expressed in °C) and the mole fraction of sucrose (y) according to the following equation:
ρ s k g m 3 = y · M W s + 1 y · M W w y · C 1 + C 2 T + C 3 T 2 + 1 y · A 1 + A 2 T + A 3 T 2 · 10 3
where y is expressed as a function of the sucrose weight fraction (Y):
y = Y M W s Y M W s + 1 Y M W w
where MWs and MWw are the molecular weights of sucrose and water, respectively, and C1, C2, C3, A1, A2, and A3 are constants, for which the values are reported in Table 2.
For the evaluation of the viscosity as a function of T and Y, the model described by Telis and Telis-Romero [26] was adopted. Accordingly, the viscosity of an aqueous sucrose solution could be described as follows:
ν s T , Y k g m · s = ν s 293   K , Y · e x p E a R 1 T 1 293.15   K · 10 3
where R is the gas constant, ν s 293   K , Y is the fluid viscosity at 20 °C (293.15 K), and Ea is the activation energy. The value of ν s 293   K , Y at different Y was found in the literature [27] while Ea was expressed as a function of the solute volumetric molar fraction (φ):
E a J m o l = E a 0 1 + 0.5 φ 1 φ
where Ea0 is a correction constant equal to 15.08 · 103 J/mol. φ was estimated to be a function of the solute-free volumetric fraction (φsf), which was calculated as a function of Y:
φ = φ s f 1 + φ s f
φ s f = Y 1 Y M W w M W s V s V w
where Vs and Vw are the Van der Waals molar volumes of sucrose (160.35 cm3/mol) and water (11.49 cm3/mol), respectively.

2.3. Experimental Apparatus and Procedures

2.3.1. Experimental Measurement of the MPs’ Settlement/Flotation Velocities

A 70% (w/w) sucrose solution was prepared through the gradual addition of 1400 g of sucrose to 600 mL of demineralized water in a 2.0 L baker. To increase the sucrose dissolution rate, the solution was magnetically stirred in a chiller-thermostat at 50 °C.
To evaluate the floating velocity of PP, HDPE, and PLA, some of these MP particles characterized by a dimension in the range of 1–2 mm were suspended in the bottom of a 1000 mL cylinder filled with 70% sucrose aqueous solution at 50 °C, and the time required for the particles to rise along a 10 cm height was measured. To avoid computational errors due to the particle’s initial acceleration, the time was measured starting after the rise in MPs along the first 25 cm of the cylinder. As for the PVC, due to the higher density of the sucrose solution, the velocity was evaluated by timing the settlement timeframe in the last 10 cm of the 500 mL cylinder. A comparison between the experimentally measured and theoretical velocities was made by assuming that the particles were spherical and by evaluating their diameters as a function of the weight and density of each MP particle typology. For each MP typology, three particles were tested, and their velocity was determined in triplicate.

2.3.2. Experimental Density Separation Tests

To investigate the effect of various S/L ratios on the process effectiveness, commercial sand was artificially contaminated by MPs and characterized by a dimension in the range of 1–2 mm at a concentration of 8 particles (2 for each MP typology) per 1.0 g of sand (Table 3). Specifically, this value was chosen accordingly with the previous findings [15]. Then, the separation experiments were carried out in 50 mL conical test tubes by mixing through a vortex different amounts of MP-contaminated sand with 40 mL of 70% sucrose solution. After the mixing, the suspension was left to be still for 2 h at 50 °C. At the end of each experiment, the number, color, and shape of the particles were optically determined for all the MPs that floated to the solution surface. Each experimental condition was tested in triplicate.
The best S/L condition was validated with real marine sediments contaminated with the same amount of MPs. In detail, the effectiveness of the density separation process with real marine sediments was also tested at different MP dimensions (d): d < 1 mm; 1 mm < d < 2 mm; d > 2 mm. Also, in this case, each experimental condition was tested in triplicate.
At the end of each test, MPs were identified by visual inspection, and the different plastic typologies were distinguished by the particles’ color (Table 1). Instead, particle shape allowed for the identification of the PP and PLA since both were characterized by the same color.

3. Results and Discussion

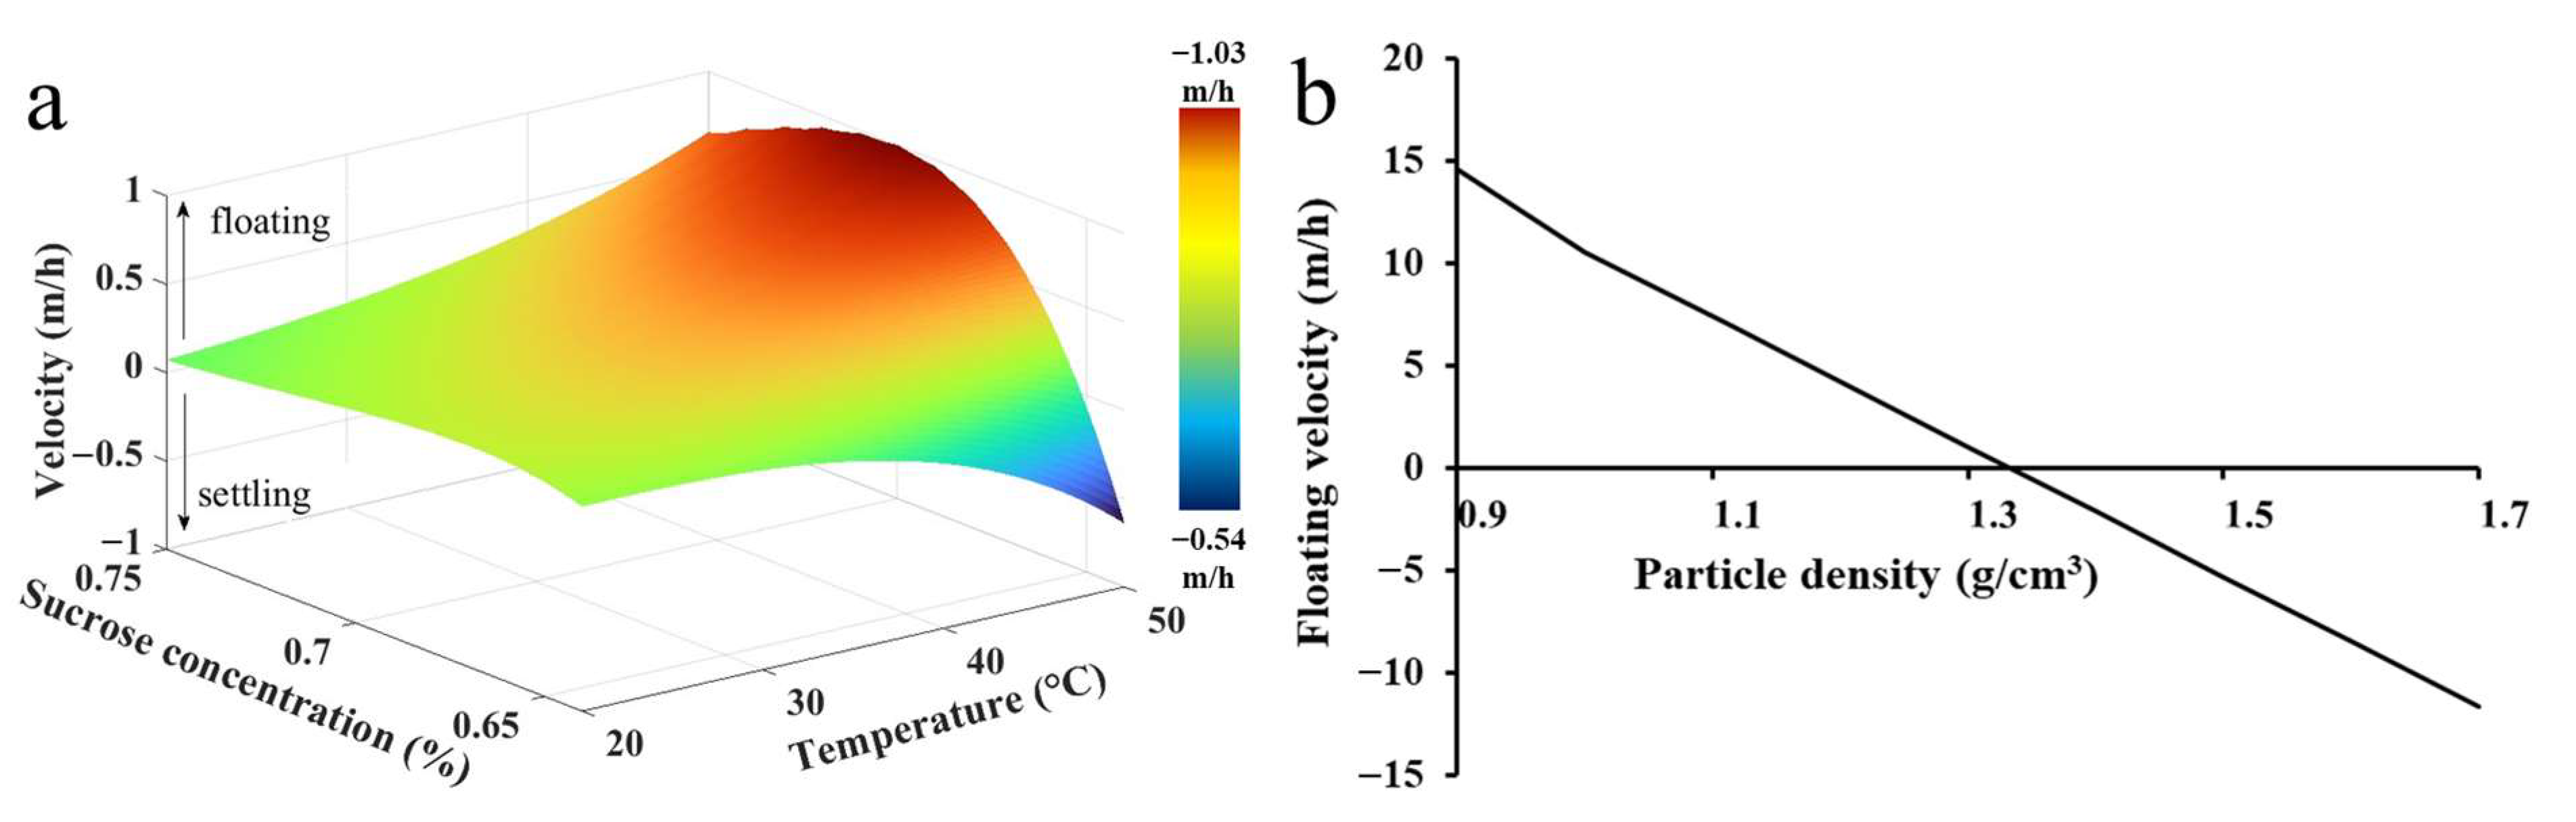
3.1. Theoretical Calculation of MPs’ Flotation/Settlement Velocities

Based on calculations through Equations (1) to (7), the floating velocities of a 1.0 mm diameter spherical MP with a density of 1.3 g/cm3 at different temperatures (from 20 to 50 °C) and sucrose contents in aqueous solution (from 64 to 75%, w/w) are reported in Figure 1a. The MPs’ density value used for the velocities’ determination was selected by taking into account the maximum density value achievable in a sucrose solution (i.e., 1.4 g/cm3) and then considering the worst operating conditions.
The results showed that MPs’ particles flotation could be hindered at temperature values higher than 40 °C with the lowest sucrose concentration (64%) since the theoretical density of the solution is steady at 1.294 g/cm3. On the contrary, a temperature decrease below 40°C, at the same sucrose concentration, led to an increase in the solution density and a consequent occurrence of particles flotation, although with very low velocities (0.18 m/h at 20 °C). The 70% sucrose aqueous solution and 50 °C temperature were considered to be optimal MP floating conditions (vp,MP = 1.03 m/h). According to the prediction from the theoretical model, a further increase in temperature up to 60 °C and 70 °C resulted in floating velocities equal to 1.52 m/h and 2.01 m/h, respectively. Despite this, the increase in solution temperature could lead to a higher water evaporation rate. Then, if not properly controlled and managed, this phenomenon can lead to an increase in sucrose concentration coupled by the formation of sucrose crystals, resulting in negative consequences on all the remediation processes. In order to avoid the abovementioned technical issues, the maximum operating temperature was set to 50 °C.
According to this outcome, the velocity trend of 1.0 mm spherical MPs in a 70% sucrose aqueous solution at 50 °C is reported in Figure 1b as a function of the particles’ density varying in a range of 0.9–1.7 g/cm3. As predicted by Equation (1), increasing floating velocity can be observed at decreasing values of the particle density. Then, based on the densities of PP, HDPE, and PLA (Table 1), a 1.0 mm diameter particle for each of the MPs’ typologies would float with theoretical velocities, respectively, equal to 13.7 m/h, 12.5 m/h, and 2.94 m/h at the same operating conditions (70% sucrose, 50 °C). As for the PVC, considering its higher density compared to the sucrose solution, a theoretical settling velocity of 2.78 m/h would be the result.

3.2. Experimental Results

3.2.1. Experimental Determination of MPs’ Settling/Floating Velocity

In order to validate the theoretical results, experiments were carried out with a 70% sucrose aqueous solution at 50 °C, and the flotation velocities of PP, HDPE, PLA, and PVC particles characterized by masses in the range of 3.5–6.8 mg were measured. PP, polyethylene (PE), and PVC materials were chosen for this study because they represent 54% of global plastic production [28]. In particular, HDPE represents 45% of all polyethylene production, while the residual percentage is composed by low-density (LD) and linear low-density (LLD) PE. The behavior of PLA particles was also studied since they are characterized by a density close to that of the theoretical MPs considered for the evaluation of floating velocities (Table 1). As shown in Figure 2a, a behavior similar to the theoretical model prediction was observed for PP, HDPE, and PLA particles. In fact, the experimental PP, HDPE, and PLA floating velocities were only 16%, 15%, and 14%, respectively, lower than the theoretical ones. The observed discrepancy from the theoretical data could be likely ascribable to the non-ideal (i.e., non-spherical) characteristics of the real MP particles used in the experiments. Accounting for the PVC, a different behavior compared to the theoretical evaluation was observed because of the occurrence of the particles’ flotation and/or suspension instead of the predicted settlement. As observed in Figure 2b, the latter outcome was due to the effect of air bubbles’ presence and persistence on the PVC particles’ surface. A similar phenomenon was observed in a previous study carried out to determine the behavior of polyester (PES) particles in NaI– and ZnCl2–water solutions both characterized by a density of 1.3 g/cm3 [29]. This study showed opposite results for the ZnCl2 and NaI solution with PES particles, respectively, floating and settling. This was probably ascribable to the higher surface tension within the ZnCl2 solution prompting the formation of bubbles on the PES surface [29]. In order to limit the air bubbles’ influence on the PVC, larger particles were used during the density separation tests. The latter strategy both increased the weight of the particles (up to 46 mg) and decreased their specific surface area. As a consequence, the air bubbles potentially attached to the particle per mass unit could be reduced. Following the abovementioned set-up change, the settlement of PVC particles was observed during the experiments. Nonetheless, the average measured experimental velocity was 42% lower than the theoretical one (Figure 2a). As for the previously discussed MPs, also in this case, the discrepancy between the observed and predicted velocity values could be related to the non-ideal conditions of the performed experiments. However, for PVC, besides the non-spherical geometry of the particles, the presence of air bubbles attached to the MPs’ surface further affected the overall settlement process and the corresponding velocity values.

3.2.2. Density Separation Tests with Artificial and Real Marine Sediments

Figure 3 shows the results of the tests carried out at different S/L ratios to evaluate the MPs’ (1 mm < d < 2 mm) separation efficiency from artificially contaminated sand. The raw data of these results are reported in Table S1 of the Supplementary Materials. After 2 h, the results showed that all the HDPE and PLA particles floated regardless of the amount of sand. This outcome was expected since the density values of HDPE and PLA are both lower than the 70% sucrose solution value. Instead, for PP, high sand concentration values affected the particles’ floating, and recovery rates of 96% and 90% were observed for tests at S/L ratios equal to 100 and 125 kg/m3, respectively. In this case, it is likely that the higher S/L ratio values negatively affected the PP separation due to the triggering of a hindered sedimentation phenomenon causing the MP particles’ entrapment within the sand matrix and consequently limiting the flotation process [30,31]. Based on the results in Figure 3, it is also worth highlighting the behavior of some PVC particles for which flotation was observed instead of settlement phenomena similar to the tests for the PVC settling velocity’s determination. In particular, the highest number of PCV particles was found on the sucrose solution surface for the test carried out at an S/L ratio equal to 75 kg/m3. For this experiment, considering its replicates, the PVC particles floating were between 4 and 5 out of 6 for a mean separation percentage of 77.8%. These results are consistent with the findings of Bellasi et al. [18] who reported a PVC recovery rate equal to 53% in a sucrose–NaCl aqueous solution characterized by a density ≤ 1.3 g/cm3. Nonetheless, it is also noticeable that the lowest reproducibility of the results was displayed for PVC in different density separation tests. Also, for this outcome, it is likely that the influence of air bubbles retained on the PVC surface could significantly affect the separation process, resulting in significant differences in the results obtained from each replicate.
To validate the results obtained with commercial sand, experimental tests were carried out with real marine sediments and an S/L ratio of 75 kg/m3. As shown in Figure 4, all the PP, HDPE, and PLA particles floated regardless of the MPs’ dimensions. The raw data of these results are reported in Table S2 of the Supplementary Materials. Regarding the PVC particles, the separation efficiency decreases as the particle size increases. This can be caused by the reduced effect of air bubbles on the surface of larger PVC particles.

3.3. Feasibility Study on the Density Separation Process Scale-Up

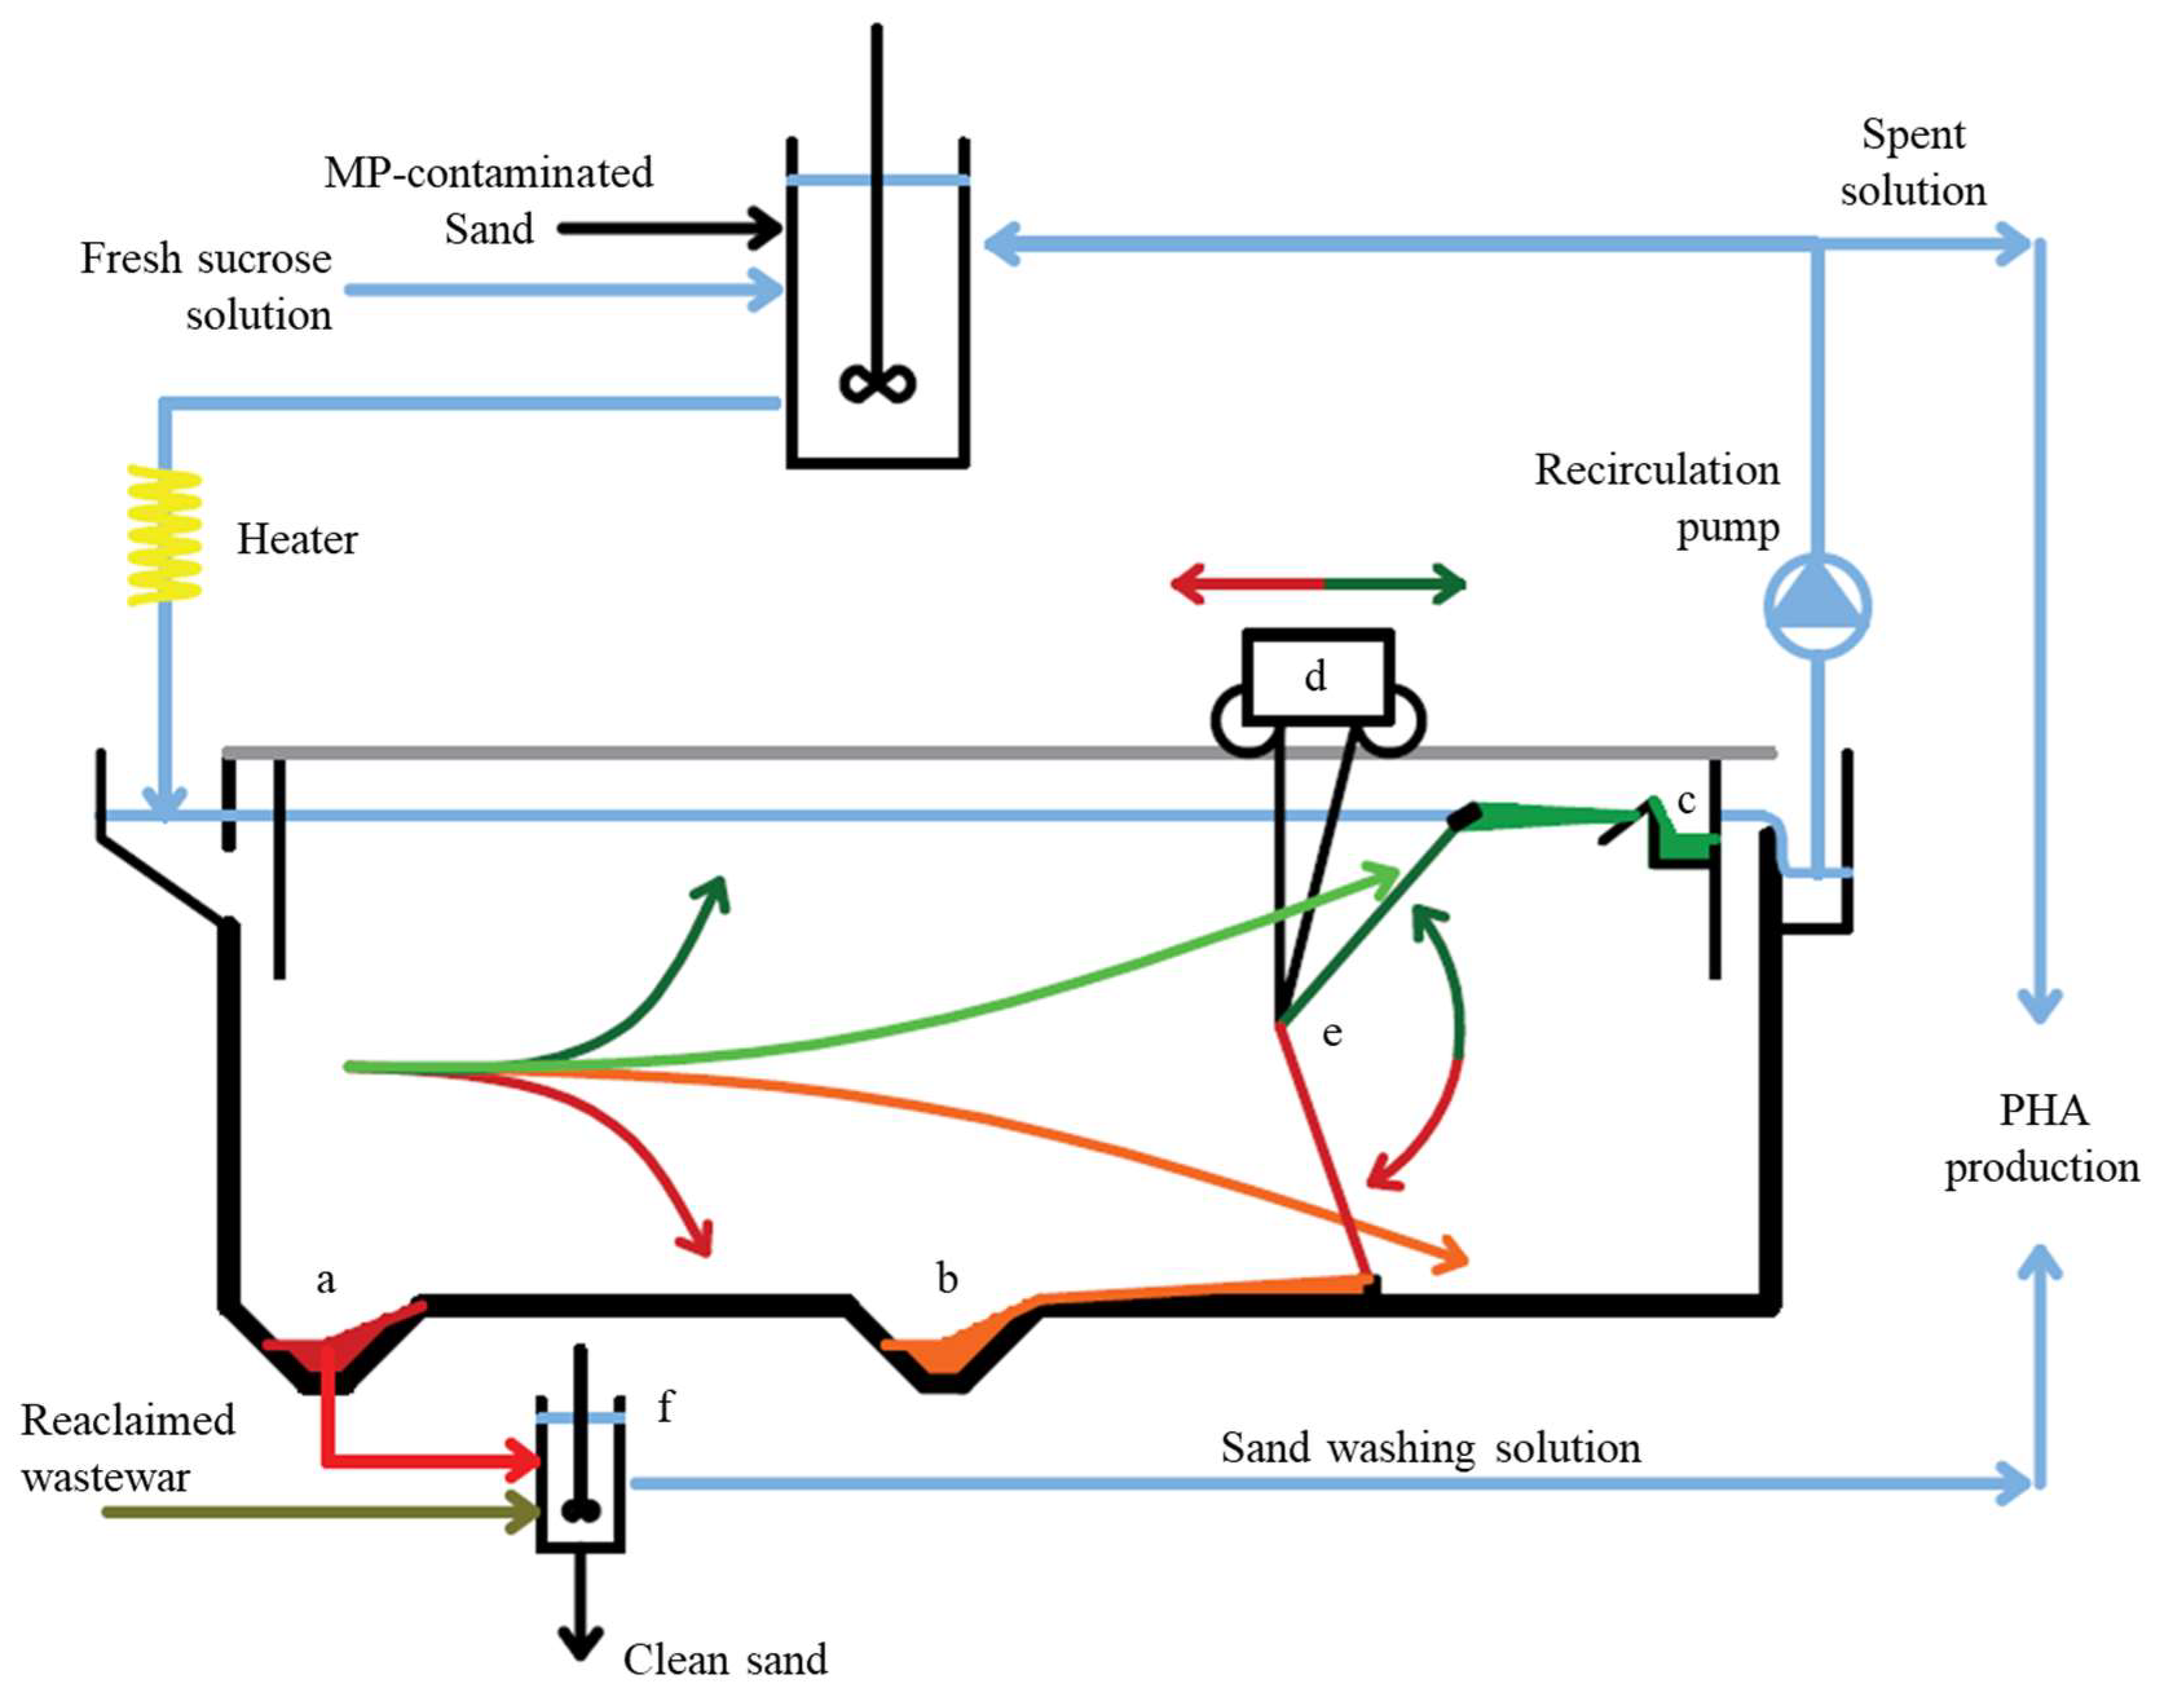
3.3.1. Potential Configuration of the Pilot/Real-Scale Separation Reactor

Based on the results obtained, a potential reactor configuration for a separation process at the pilot/real operating scale was suggested. Figure 5 reports the schematic representation of the separation system where MP-contaminated sediments can be added to the sucrose aqueous solution in a mixing tank. After carrying out a heating phase to the operational temperature, the mixture of the contaminated sand and sucrose solution is sent to the separation tank. In the present work, the separation tank has been configured as a conventional longitudinal settling tank. In particular, the separation reactor is equipped with the following: (i) a scraper bridge; (ii) a collection hopper placed in the initial section of the tank for the recovery of the settled solids; and (iii) a surface skimmer for the recovery of the floated MPs. As shown in Figure 5, the suggested separation tank is equipped with a second hopper, which could be optionally used for the separation of the slower-settling solids (higher-density MPs).
In Equation (8), with F as the mixture flowrate, the horizontal surface area (S) of the separation tank can be designed by considering an overflow rate (OFR) equal to the floating velocity (vp,MP) of the MP particle class characterized by the density almost equal to that of the separation solution (i.e., the particle class theoretically characterized by the lowest floating velocity).
S = w · l = F O F R = F v p , M P
with w and l corresponding to the separation tank width and length, respectively. Accounting for the geometry, tank dimensions could be evaluated by considering a w:l ratio of 1:5 and a height (h) equal to 4.3 m [24], plus an additional freeboard of 1.0 m for the housing of the scraper bridge. Then, based on the 1:5 proportion and Equation (8), w and l can also be expressed as follows:
w = S 5 0.5
l = 5 · S 5 0.5
After the separation of floating and settleable solids, the effluent sucrose solution could be recirculated in the mixer. Taking into account the possible presence of residual colloidal particles suspended in the effluent, a continuous recirculation of the same sucrose solution could lead to a significant accumulation of these particles, potentially causing technical issues to the following treatment cycles. For instance, a related problem could be represented by the hindered sedimentation phenomenon also observed for the PP particles during the density separation tests carried out at a high S/L ratio. Then, a periodical spent solution partial make-up with fresh sucrose solution could be carried out. From the perspective of an environmentally sustainable process, the sediments settled and removed from the separation tank could be washed with reclaimed wastewater in order to remove residual sucrose before their return to the environment. The sediments’ washing step will provide a solution with a high sucrose content which could be mixed with the spent sucrose solution fraction discarded from the separation reactor. Then, the mixture could be used as a feeding substrate in biological processes aiming to achieve polyhydroxyalkanoate (PHA) production [32,33,34]. The overall configuration described above highlights a possible valorization strategy of sucrose. Indeed, sucrose already represents a valuable product of the food industrial sector. Nonetheless, the combined use of sucrose as a separation means for sediments’ remediation and the involvement of the resulting by-product in biorefinery applications can provide multiple solutions that support the circular economy approach.

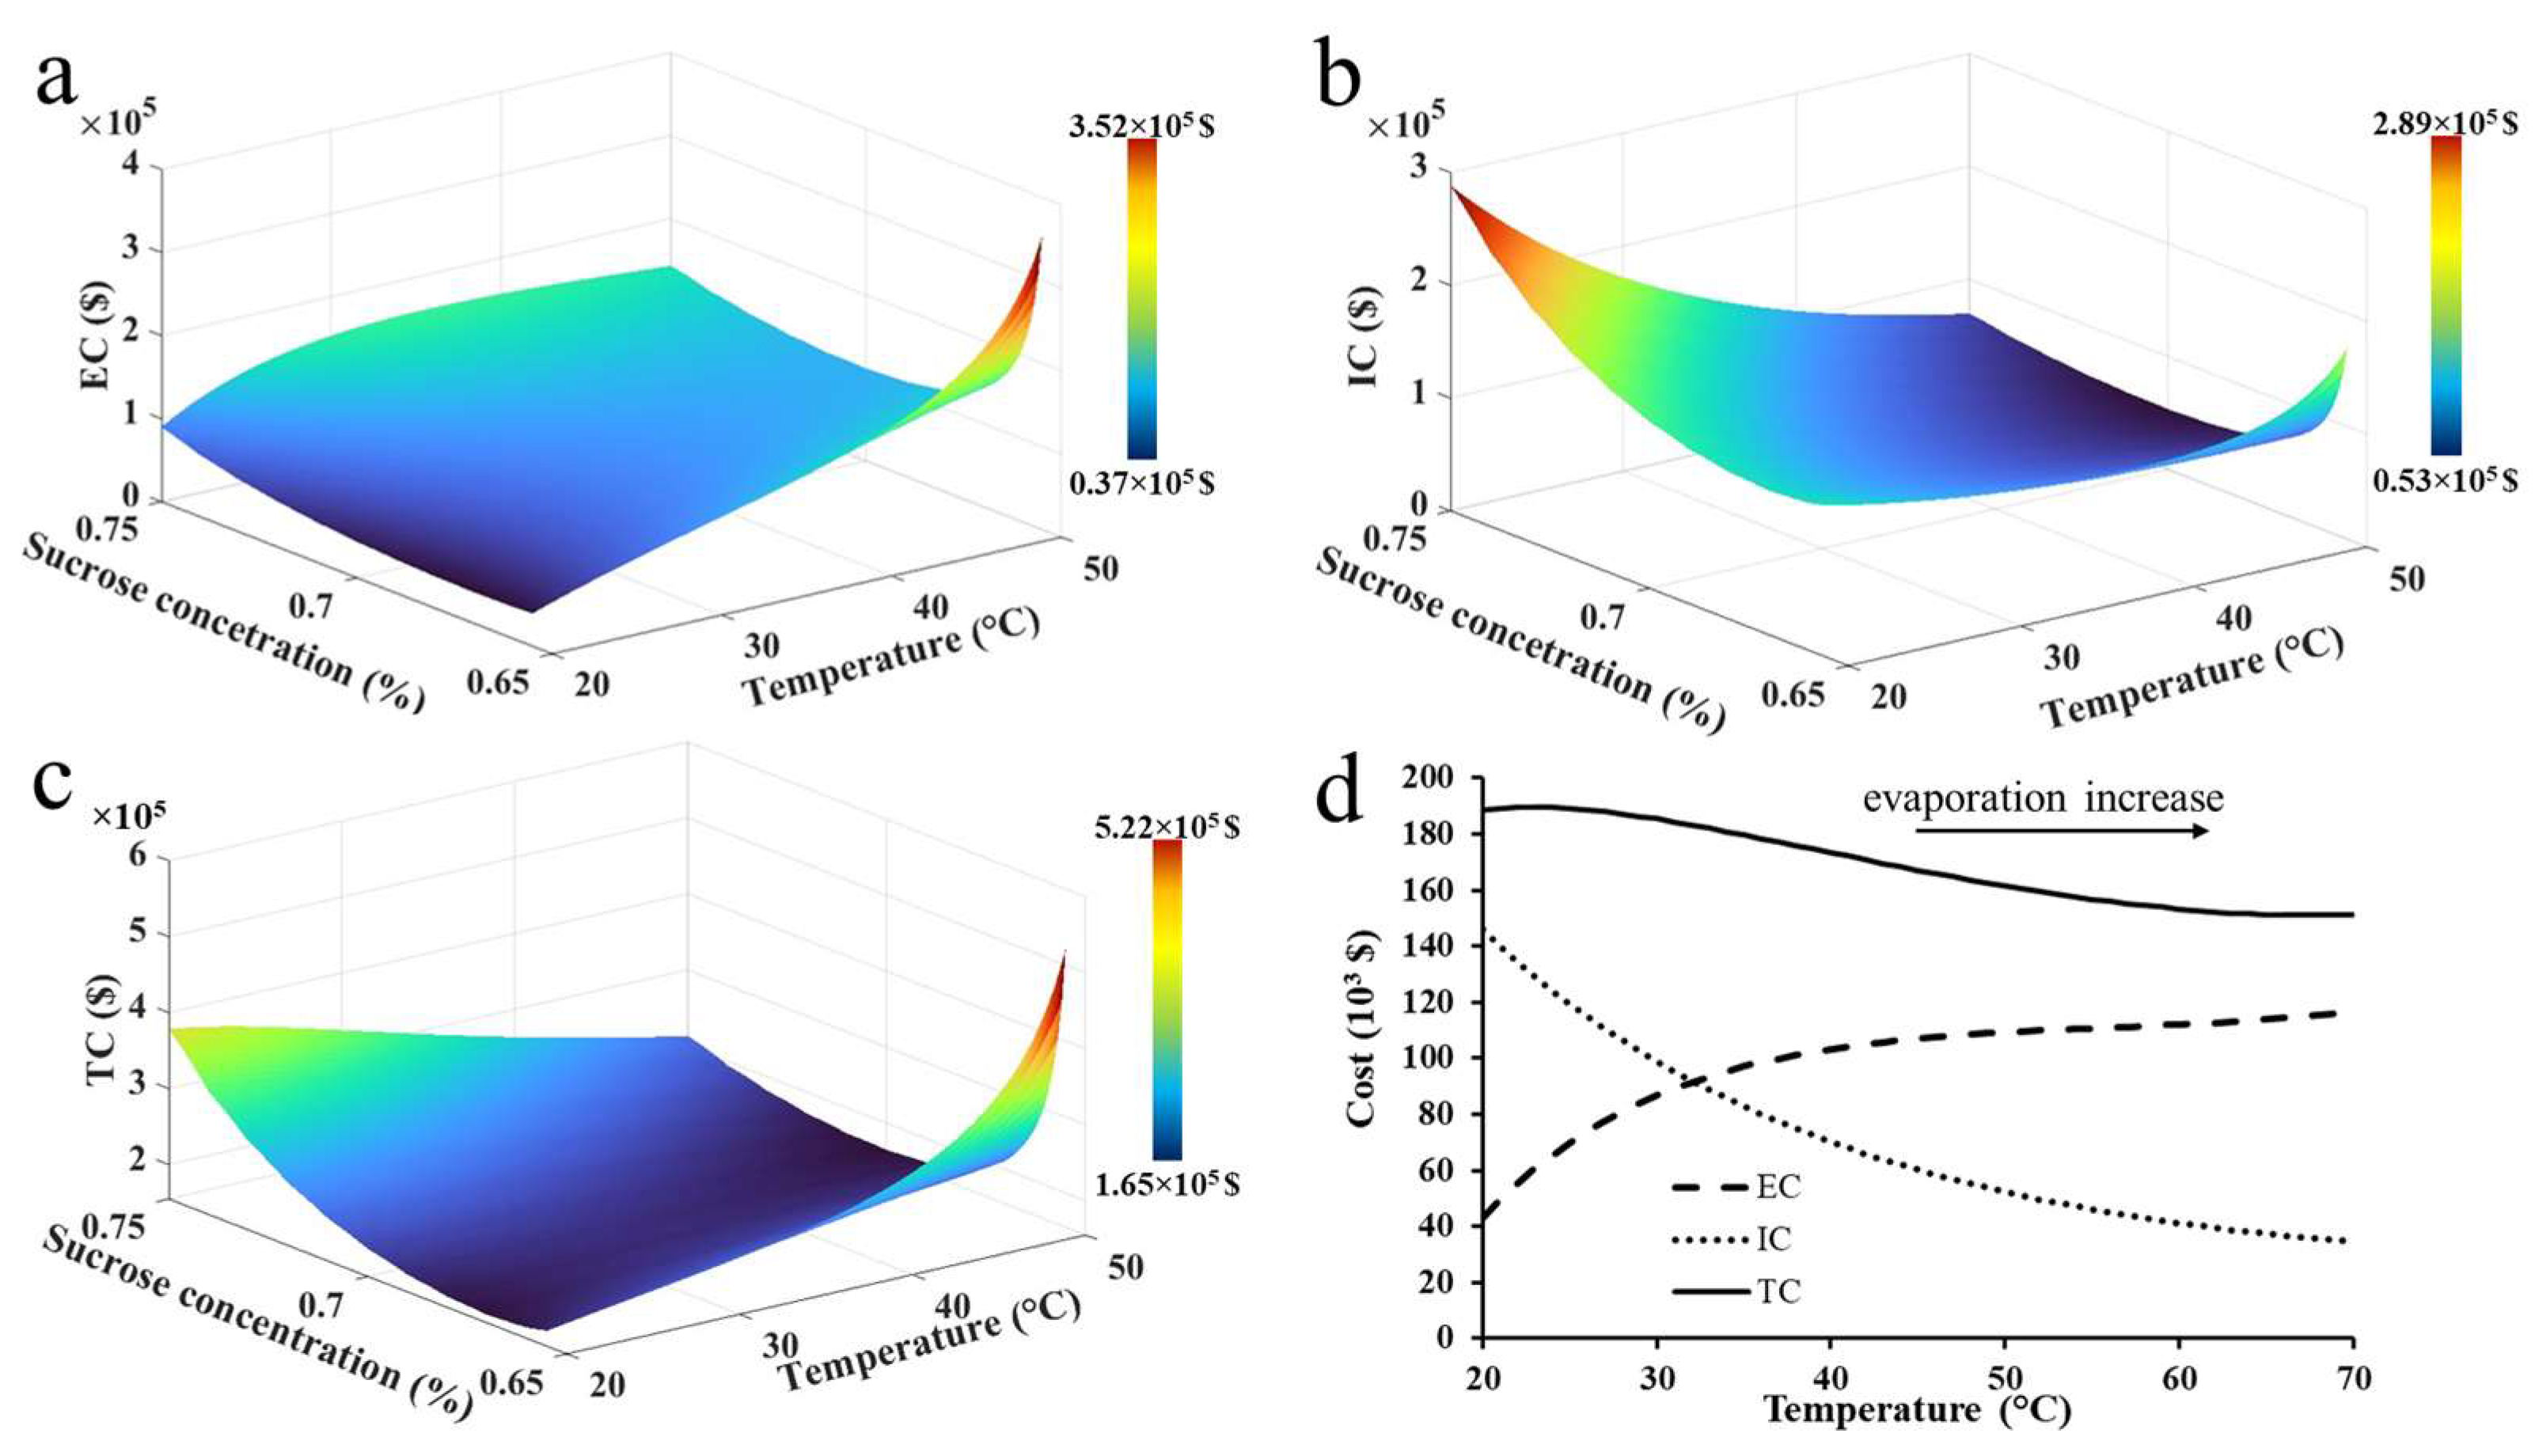
3.3.2. Process Cost Minimization and Separation Tank Design

From the perspective of the economic feasibility of the process, operating temperature plays a key role. Indeed, at high temperatures, the energy consumed by heating the system and the related system management costs increase. At the same time, an increase in temperature leads to higher MP flotation velocities and, consequently, a decrease in the S parameter previously expressed in Equation (8).
The installation costs (ICs) of a primary clarifier, excluding the earthwork and mechanisms, can be evaluated as a function of S [35]:
I C = 160 , 000   $ · S 400   m 2 0.56 = 160 , 000   $ · F v p , M P · 400   m 2 0.56
Since the separation tank should be closed to reduce heat and aqueous vapor losses, in the present work, Equation (11) was modified to also consider the cost of the concrete horizontal surface representing the separation tank ceiling:
I C = 160 , 000   $ · F v p , M P · 400   m 2 0.56 · c
The term c is a cost-increasing factor (c > 1) determined as a ratio between two different surfaces. In particular, the ratio numerator was given by the sum of four vertical surfaces (accounting for both the lateral walls, equal to lh, and both front/back walls, equal to wh) and two-time S (accounting for the tank bottom and ceiling). Instead, the ratio denominator was expressed as the sum of the four vertical surfaces and S (considering only the tank bottom). Then, based on Equations (9) and (10), the c factor could be expressed as follows:
c = 2 · S + 12 · h · S 5 0.5 S + 12 · h · S 5 0.5
For the energy requirements of the process, the only contribution was related to the consumption due to heat losses (HS) from the separation tank, while the energy involved for the movement of the electromechanical equipment and heating of the fresh separation solution were both excluded from the following calculations. Then, HS was determined according to the following equation:
H S   W = U · A · T o p T a m b
where Top is the operating temperature, Tamb is the ambient temperature equal to 15 °C by considering an average global value on an annual basis, A is the sum of all the surfaces of the separation tank exposed to the atmosphere, and U is the overall heat transfer coefficient. For the overall heat losses, the one through the tank bottom surface was excluded since it was hypothesized that it would be negligible compared to the heat losses through the tank vertical surfaces and the ceiling interfacing with the atmosphere. However, the calculation was carried out neglecting the convective resistance of the inner side of the tank surfaces contacting the sucrose solution, which led to an overestimation of the energy costs. Thus, U was determined through the following equation [36]:
U = 1 R c o n c + R i n s + R c o n v , a m b = 1 x c o n c k c o n c + x i n s k i n s + R c o n v , a m b
where Rconv,amb is the convective resistances for the external surfaces, equal to 0.036 m2 °C/W [36], and Rconc and Rins are the thermal resistances of the reinforced concrete wall and of the thermal insulation layer, respectively. The terms xconc and xins represent the thicknesses of the reinforced concrete wall and insulating layer, respectively. kconc and kins are the thermal conductivities of the concrete and insulating layer, respectively. Considering xconc of 0.35 m, xins of 0.05 m, kconc of 3 W/m/°C [37], and kins for an insulating layer made in polyisocyanurate equal to 0.023 W/m/°C [38], the resulting U value is equal to 0.43 W/m2/°C.
Based on the hypotheses of the continuous heating of the separation tank for a reactor useful life of 25 years, with an energy cost equal to 0.15 USD/kWh, given the previously reported h value (5.3 m) and a w:l ratio of 1:5, the energy cost (EC) over the whole supposed reactor functioning period can be evaluated as follows:
E C = U · A · T o p T a m b · 24 · 365 · 25 1000 · 0.15 $ k W h = = U · S + 2 · h · w + 2 · h · l · T o p T a m b · 219 · 0.15 $ k W h = = U · F v p , M P + 12 · h · F 5 · v p , M P 0.5 · T o p T a m b · 219 · 0.15 $ k W h
From Equations (12) and (16), it is possible to observe that IC and EC are both dependent on vp,MP, which refers to the lowest floating velocity for a specific particle. As a consequence, IC and EC variations as a function of operating temperature and sucrose concentration can be outlined. Then, the effects of operating temperature and sucrose concentration on EC and IC are, respectively, reported in Figure 6a,b for a density separation process, with F equal to 41.7 m3/h, aimed at removing MPs with a diameter of 1 mm and a density of 1.3 g/cm3. As expected, an increase in operating temperature led to an increase in EC (Figure 6a) and a concurrent decrease in IC (Figure 6b). Despite this, the optimal values of the total cost (TC), expressed as the sum of IC and EC, were found for a working temperature of 50 °C and the use of a 70%w/w sucrose aqueous solution (Figure 6c). Figure 6d displays the trends of EC, IC, and TC at constant 70% sucrose content. It is worth noticing that a temperature increase from 50 °C to 70 °C would result in a reduction in treatment costs of only 6.5%. However, for such high temperature values, if water evaporation is not properly managed, the saturation concentration of sucrose could be easily reached, and sucrose crystals could form. Consequently, automated control systems for vapor re-condensation and/or water restoration should be required in order to reduce water loss. Indeed, additional equipment would lead to an increase in both IC and EC.
These operating conditions were consistent with the optimal ones identified through the theoretical estimation, for which a vp,MP value of 1.03 m/h was determined. With these data, the design of the separation tank unit, operated at 50 °C and with a 70%w/w sucrose solution, was carried out by determining S:
S = F v p , M P = 41.7   m 3 h 1.03   m h = 40.3   m 2
Taking into account the moderate calculated value of the total horizontal surface required for the MPs separation process, a viable solution for the performance of this treatment in a practical way could be represented by the use of containers as a separation tank unit. This operation mode could result in a significantly convenient treatment, allowing for the in situ remediation of MP-contaminated sediments and consequently reducing the impacts of the solid matrix’s transportation in terms of process cost and gaseous emissions in the atmosphere. Then, by considering commercially available containers with a horizontal surface of 27.6 m2 (2.3 m ∙ 12 m) and h of 2.4 m, a total number of units equal to almost 1.5 would be required to suffice the total S determined in Equation (17). Then, rounding the number of units to two would further provide a suitable compartment for the housing of electromechanical and process-supporting equipment.

4. Conclusions

This work thoroughly investigates several aspects of a density separation method with sucrose solution configuring an efficient and sustainable treatment for MP-contaminated sediments’ remediation. In order to identify suitable operating conditions of the process, theoretical calculations were useful to predict the best temperature and sucrose concentration values (50 °C and 70%, respectively) for the achievement of the optimal MPs floating velocity. To further strengthen the theoretical results, experimental tests aimed at verifying the floating velocity values of the target MPs were carried out at the identified optimal operating conditions. This step allowed us to confirm the good correspondence between the theoretical and experimental velocities for almost all of the tested MPs (i.e., PP, HDPE, and PLA), while only PVC particles showed tested velocities significantly discordant (42% lower) by the predicted ones. This outcome was related to an interference in the separation process by the formation of air bubbles, and their attachment on the PVC particles’ surface was probably triggered by the high surface tension value within the solution. Further process condition optimization was investigated with density separation tests at different S/L ratios between the sediments and the sucrose solution. Also, in this case, the tests were performed at the optimal temperatures and sucrose contents theoretically determined, and promising results were observed in terms of the MP particles’ separation efficiency. Accounting for PP, HDPE, and PLA, total removal was displayed for almost all the S/L ratios investigated, while low results replicability was observed for PVC in the different tests. Nonetheless, in the test at 75 kg/m3, a higher reproducible PVC removal value equal to 77.8% was shown, indicating the possible selection of this S/L value as the optimal one. Based on the experimental results, the proposal of a potential treatment system configuration for pilot/real-scale applications was identified. The overall suggested system includes technical solutions for MPs’ removal, sucrose recirculation, and the wash of the treated sediments, as well as a possible application for the further processing of the resulting sediments’ washing solution. The system core corresponding to the MPs treatment unit was identified as a conventional longitudinal settling tank and was dimensionally designed through a preliminary cost optimization analysis. Considering a mixture flowrate of 1000 m3/d, the calculated separation tank horizontal surface required for the process resulted in a quite moderate value (40.3 m2), which allows for a feasible use of containers as in situ treatment units. Indeed, the cost analysis was carried out by excluding different contribution terms which could vary both the determined IC and EC. Based on this consideration, future research on this topic should focus on experimental activities investigating the proposed system in pilot-scale applications. This could allow for the precise calculation of all the incoming/outcoming flows (material and energetic) within the system and collect specific data useful to carry out an in-depth economic analysis. This work outlines practical and operating information useful to support the design of an environmentally sustainable separation approach feasible also for solid matrix remediation, as well as analytical and monitoring applications. Moreover, it provides a scientific background that could be used to further deepen certain aspects such as the floating behavior of differently shaped MPs (e.g., filaments, sheets) and enhance treatment performance.

Supplementary Materials

The following supplementary materials can be downloaded at: https://www.mdpi.com/article/10.3390/su17031258/s1, Table S1: Effect of the S/L ratio on the separation efficiency of tested MPs in a 70% sucrose aqueous solution at 50 °C; Table S2: Separation of MPs from real marine sediments at various MPs size and type with 70% sucrose aqueous solution.

Author Contributions

Conceptualization, D.S. and A.F.; methodology, D.S.; software, D.S. and M.S.; validation, M.S. and R.M.; formal analysis, M.S. and R.M.; investigation, M.S. and R.M.; resources, U.F.; data curation, M.S.; writing—original draft preparation, D.S. and A.F.; writing—review and editing, D.S. and A.F; visualization, M.S.; supervision, U.F.; project administration, U.F.; funding acquisition, U.F. All authors have read and agreed to the published version of this manuscript.

Funding

This research received no external funding.

Institutional Review Board Statement

Not applicable.

Informed Consent Statement

Not applicable.

Data Availability Statement

Dataset available on request from the authors.

Conflicts of Interest

The authors declare no conflicts of interest.

References

  1. Napper, I.E.; Thompson, R.C. Plastic Debris in the Marine Environment: History and Future Challenges. Glob. Chall. 2020, 4, 1900081. [Google Scholar] [CrossRef]
  2. PlasticsEurope. Plastics—The Facts 2019: An Analysis of European Plastics Production, Demand and Waste Data; PlasticsEurope: Brussel, Belgium, 2019. [Google Scholar]
  3. Flores-Ocampo, I.Z.; Armstrong-Altrin, J.S. Abundance and composition of microplastics in Tampico beach sediments, Tamaulipas State, southern Gulf of Mexico. Mar. Pollut. Bull. 2023, 191, 114891. [Google Scholar] [CrossRef]
  4. Naidu, B.C.; Xavier, K.A.M.; Shukla, S.P.; Jaiswar, A.K.; Nayak, B.B. Microplastics in the foreshore coastal waters, sediment, and coastal fauna of a highly populated megacity—A study on the effect of anthropogenic discharge on clams. Mar. Pollut. Bull. 2022, 185, 114262. [Google Scholar] [CrossRef]
  5. Edo, C.; González-Pleiter, M.; Tamayo-Belda, M.; Ortega-Ojeda, F.E.; Leganés, F.; Fernández-Piñas, F.; Rosal, R. Microplastics in sediments of artificially recharged lagoons: Case study in a Biosphere Reserve. Sci. Total Environ. 2020, 729, 138824. [Google Scholar] [CrossRef] [PubMed]
  6. Venkatramanan, S.; Chung, S.Y.; Selvam, S.; Sivakumar, K.; Soundhariya, G.R.; Elzain, H.E.; Bhuyan, M.S. Characteristics of microplastics in the beach sediments of Marina tourist beach, Chennai, India. Mar. Pollut. Bull. 2022, 176, 113409. [Google Scholar] [CrossRef] [PubMed]
  7. Keerthika, K.; Padmavathy, P.; Rani, V.; Jeyashakila, R.; Aanand, S.; Kutty, R. Contamination of microplastics, surface morphology and risk assessment in beaches along the Thoothukudi coast, Gulf of Mannar region. Environ. Sci. Pollut. Res. 2022, 29, 75525–75538. [Google Scholar] [CrossRef] [PubMed]
  8. Naidu, B.C.; Xavier, K.A.M.; Shukla, S.P.; Jaiswar, A.K.; Nayak, B.B. Comparative study on the microplastics abundance, characteristics, and possible sources in yellow clams of different demographic regions of the northwest coast of India. J. Hazard. Mater. Lett. 2022, 3, 100051. [Google Scholar] [CrossRef]
  9. Terzi, Y.; Gedik, K.; Eryaşar, A.R.; Öztürk, R.Ç.; Şahin, A.; Yılmaz, F. Microplastic contamination and characteristics spatially vary in the southern Black Sea beach sediment and sea surface water. Mar. Pollut. Bull. 2022, 174, 113228. [Google Scholar] [CrossRef]
  10. da Silva Ferreira, A.T.; Siegle, E.; Ribeiro, M.C.H.; Santos, M.S.T.; Grohmann, C.H. The dynamics of plastic pellets on sandy beaches: A new methodological approach. Mar. Environ. Res. 2021, 163, 105219. [Google Scholar] [CrossRef] [PubMed]
  11. Bridson, J.H.; Patel, M.; Lewis, A.; Gaw, S.; Parker, K. Microplastic contamination in Auckland (New Zealand) beach sediments. Mar. Pollut. Bull. 2020, 151, 110867. [Google Scholar] [CrossRef]
  12. Cincinelli, A.; Scopetani, C.; Chelazzi, D.; Martellini, T.; Pogojeva, M.; Slobodnik, J. Microplastics in the Black Sea sediments. Sci. Total Environ. 2021, 760, 143898. [Google Scholar] [CrossRef] [PubMed]
  13. Wang, J.; Wang, M.; Ru, S.; Liu, X. High levels of microplastic pollution in the sediments and benthic organisms of the South Yellow Sea, China. Sci. Total Environ. 2019, 651, 1661–1669. [Google Scholar] [CrossRef]
  14. Leslie, H.A.; Brandsma, S.H.; van Velzen, M.J.M.; Vethaak, A.D. Microplastics en route: Field measurements in the Dutch river delta and Amsterdam canals, wastewater treatment plants, North Sea sediments and biota. Environ. Int. 2017, 101, 133–142. [Google Scholar] [CrossRef]
  15. Jiang, Y.; Yang, F.; Hassan Kazmi, S.S.U.; Zhao, Y.; Chen, M.; Wang, J. A review of microplastic pollution in seawater, sediments and organisms of the Chinese coastal and marginal seas. Chemosphere 2022, 286, 131677. [Google Scholar] [CrossRef] [PubMed]
  16. Felsing, S.; Kochleus, C.; Buchinger, S.; Brennholt, N.; Stock, F.; Reifferscheid, G. A new approach in separating microplastics from environmental samples based on their electrostatic behavior. Environ. Pollut. 2018, 234, 20–28. [Google Scholar] [CrossRef]
  17. Castelvetro, V.; Corti, A.; Bianchi, S.; Ceccarini, A.; Manariti, A.; Vinciguerra, V. Quantification of poly(ethylene terephthalate) micro- and nanoparticle contaminants in marine sediments and other environmental matrices. J. Hazard. Mater. 2020, 385, 121517. [Google Scholar] [CrossRef]
  18. Bellasi, A.; Binda, G.; Pozzi, A.; Boldrocchi, G.; Bettinetti, R. The extraction of microplastics from sediments: An overview of existing methods and the proposal of a new and green alternative. Chemosphere 2021, 278, 130357. [Google Scholar] [CrossRef] [PubMed]
  19. Pagter, E.; Frias, J.; Nash, R. Microplastics in Galway Bay: A comparison of sampling and separation methods. Mar. Pollut. Bull. 2018, 135, 932–940. [Google Scholar] [CrossRef] [PubMed]
  20. Coppock, R.L.; Cole, M.; Lindeque, P.K.; Queirós, A.M.; Galloway, T.S. A small-scale, portable method for extracting microplastics from marine sediments. Environ. Pollut. 2017, 230, 829–837. [Google Scholar] [CrossRef] [PubMed]
  21. Gilbreath, A.; McKee, L.; Shimabuku, I.; Lin, D.; Werbowski, L.M.; Zhu, X.; Grbic, J.; Rochman, C. Multiyear Water Quality Performance and Mass Accumulation of PCBs, Mercury, Methylmercury, Copper, and Microplastics in a Bioretention Rain Garden. J. Sustain. Water Built Environ. 2019, 5, 04019004. [Google Scholar] [CrossRef]
  22. Nuelle, M.-T.; Dekiff, J.H.; Remy, D.; Fries, E. A new analytical approach for monitoring microplastics in marine sediments. Environ. Pollut. 2014, 184, 161–169. [Google Scholar] [CrossRef] [PubMed]
  23. Imhof, H.K.; Schmid, J.; Niessner, R.; Ivleva, N.P.; Laforsch, C. A novel, highly efficient method for the separation and quantification of plastic particles in sediments of aquatic environments. Limnol. Oceanogr. Methods 2012, 10, 524–537. [Google Scholar] [CrossRef]
  24. Metcalf, A.; Eddy, S. Wastewater Engineering: Treatment, Disposal, and Reuse, 3rd ed.; McGraw-Hill: New York, NY, USA, 1991. [Google Scholar]
  25. Barber, E.J. Calculation of density and viscosity of sucrose solutions as a function of concentration and temperature. Natl. Cancer Inst. Monogr. 1966, 21, 219–239. [Google Scholar]
  26. Telis, V.R.N.; Telis-Romero, J.; Mazzotti, H.B.; Gabas, A.L. Viscosity of Aqueous Carbohydrate Solutions at Different Temperatures and Concentrations. Int. J. Food Prop. 2007, 10, 185–195. [Google Scholar] [CrossRef]
  27. Swindells, J.F.; Snyder, C.F.; Hardy, R.C.; Golden, P.E. Viscosities of Sucrose Solutions at Various Temperatures: Tables of Recalculated Values; US Government Printing Office: Washington, DC, USA, 1958. [Google Scholar]
  28. Geyer, R. Production, use, and fate of synthetic polymers. In Plastic Waste and Recycling; Letcher, T.M., Ed.; Elsevier: Amsterdam, The Netherlands, 2020; pp. 13–32. [Google Scholar]
  29. Li, L.; Li, M.; Deng, H.; Cai, L.; Cai, H.; Yan, B.; Hu, J.; Shi, H. A straightforward method for measuring the range of apparent density of microplastics. Sci. Total Environ. 2018, 639, 367–373. [Google Scholar] [CrossRef]
  30. Sun, R.; Xiao, H.; Sun, H. Investigating the settling dynamics of cohesive silt particles with particle-resolving simulations. Adv. Water Resour. 2018, 111, 406–422. [Google Scholar] [CrossRef]
  31. Van Winckel, T.; Liu, X.; Vlaeminck, S.E.; Takács, I.; Al-Omari, A.; Sturm, B.; Kjellerup, B.V.; Murthy, S.N.; De Clippeleir, H. Overcoming floc formation limitations in high-rate activated sludge systems. Chemosphere 2019, 215, 342–352. [Google Scholar] [CrossRef]
  32. Guo, S.; Luo, J.; Wu, Y.; Qi, B.; Chen, X.; Wan, Y. Decoloration of sugarcane molasses by tight ultrafiltration: Filtration behavior and fouling control. Sep. Purif. Technol. 2018, 204, 66–74. [Google Scholar] [CrossRef]
  33. Zhang, S.; Wang, J.; Jiang, H. Microbial production of value-added bioproducts and enzymes from molasses, a by-product of sugar industry. Food Chem. 2021, 346, 128860. [Google Scholar] [CrossRef]
  34. Jung, H.J.; Kim, S.H.; Shin, N.; Oh, S.-J.; Hwang, J.H.; Kim, H.J.; Kim, Y.-H.; Bhatia, S.K.; Jeon, J.-M.; Yoon, J.-J.; et al. Polyhydroxybutyrate (PHB) production from sugar cane molasses and tap water without sterilization using novel strain, Priestia sp. YH4. Int. J. Biol. Macromol. 2023, 250, 126152. [Google Scholar] [CrossRef] [PubMed]
  35. Woods, D.R. Rules of Thumb in Engineering Practice; Wiley: Hoboken, NJ, USA, 2007; ISBN 9783527312207. [Google Scholar]
  36. Paraschiv, L.S.; Acomi, N.; Serban, A.; Paraschiv, S. A web application for analysis of heat transfer through building walls and calculation of optimal insulation thickness. Energy Rep. 2020, 6, 343–353. [Google Scholar] [CrossRef]
  37. Asadi, I.; Shafigh, P.; Abu Hassan, Z.F.B.; Mahyuddin, N.B. Thermal conductivity of concrete—A review. J. Build. Eng. 2018, 20, 81–93. [Google Scholar] [CrossRef]
  38. Hung Anh, L.D.; Pásztory, Z. An overview of factors influencing thermal conductivity of building insulation materials. J. Build. Eng. 2021, 44, 102604. [Google Scholar] [CrossRef]
Figure 1. Floating velocities of 1.0 mm spherical MPs with (a) fixed density of 1.3 g/cm3 at different sucrose solution concentrations and temperatures and with (b) different density values with a 70% sucrose solution and 50 °C.
Sustainability 17 01258 g001
Figure 2. (a) Comparison between the observed and the predicted PP, HDPE, PLA, and PVC floating/settlement velocities. The velocity of PVC-MPs was measured with particles with a mass between 15 mg and 46 mg. (b) Image of air bubbles attached to two particles of PVC.
Sustainability 17 01258 g002
Figure 3. Effect of the S/L ratio on the separation efficiency of tested MPs in a 70% sucrose aqueous solution at 50 °C. MPs size ranging from 1 to 2 mm.
Sustainability 17 01258 g003
Figure 4. Separation of MPs from real marine sediments with various MP sizes and types with 70% sucrose aqueous solution, S/L ratio = 75 kg/m3, and T = 50 °C.
Sustainability 17 01258 g004
Figure 5. Separation process for the removal of MPs from contaminated sediments. (a) Hopper for the collection of rapidly settling solids; (b) hopper for the collection of slowly settling solids; (c) skimmer for the collection of floating solids; (d) scraper bridge; (e) scraper for suspended material handling (when raised and the cart moves to the right) and settled material (when lowered and the cart moves to the left); and (f) compartment for the sediment washing.
Sustainability 17 01258 g005
Figure 6. Effect of sucrose concentration and operating temperature on the (a) EC, (b) IC, and (c) TC of the separation tank. (d) Effect of the operating temperature on the TC, IC, and EC at a constant 70% sucrose content.
Sustainability 17 01258 g006
Table 1. Characteristics of the wastes used for the MPs’ production.
PPHDPEPLAPVC
Wasteturning swarfpipelinefilament for 3D printerpipeline
Colorwhiteblackwhitegray
Density (g/cm3)0.900.941.241.42
Table 2. Values of the constant used for the evaluation of the density of the sucrose aqueous solution at varying temperatures and sucrose concentrations [25].
ConstantValue
A118.027525
A24.8318329 · 10−4
A37.7830857 · 10−5
C1212.57059
C20.13371672
C3−2.9276449 · 10−4
Table 3. Design of separation experiments.
Sand (g)S/L Ratio
(kg/m3)
PP (Number)HDPE (Number)PLA (Number)PVC (Number)
0.512.51111
1.0252222
2.0504444
3.0756666
4.01008888
5.012510101010
Disclaimer/Publisher’s Note: The statements, opinions and data contained in all publications are solely those of the individual author(s) and contributor(s) and not of MDPI and/or the editor(s). MDPI and/or the editor(s) disclaim responsibility for any injury to people or property resulting from any ideas, methods, instructions or products referred to in the content.

