Article

Research on the Efficiency and Synergistic Effect of Industrial Green Innovation Development in the Beijing–Tianjin–Hebei Urban Agglomeration

by
Hong Wu
* and
Xuewei Wen
School of Management, Fujian University of Technology, Fuzhou 350118, China
*
Author to whom correspondence should be addressed.
Sustainability 2025, 17(3), 1244; https://doi.org/10.3390/su17031244
Submission received: 6 January 2025 / Revised: 26 January 2025 / Accepted: 3 February 2025 / Published: 4 February 2025

Abstract

:
This research centers on one of northern China’s most crucial economic regions—the Beijing–Tianjin–Hebei urban agglomeration. This paper primarily addresses the present circumstances, developments, and obstacles pertaining to industrial green development and industrial innovation in the region, with a particular focus on its role in fostering integrated economic and environmental growth. This study utilizes a global super-efficiency SBM model and a coupled coordination model, along with a panel data analysis technique, to determine the extent of green development, innovation, and green innovation collaboration in the Beijing–Tianjin–Hebei urban agglomeration cluster between 2018 and 2022. The study revealed that, despite notable advancements in industrial green development in the Beijing–Tianjin–Hebei urban agglomeration in recent years, the disparity in urban development persists, with some cities exhibiting a relatively low input–output ratio for green innovation. There is a pressing need to enhance overall efficiency through policy guidance and technical support. Furthermore, the study underscores the significance of bolstering regional collaboration and facilitating the sharing of resources and technological exchange to attain harmonized regional development.

Graphical Abstract

1. Introduction

1.1. Background

Considering the swift expansion of the world economy, environmental issues have become a major hindrance to achieving sustainable development. China, being the world’s most densely populated developing nation, confronts substantial obstacles in environmental conservation [1,2,3]. Within the framework of industrialization, the challenge of harmonizing economic and environmental growth has emerged as a critical issue demanding immediate focus. The Beijing–Tianjin–Hebei urban agglomeration, a key economic area in northern China, is crucial for the sustainable growth of both the nation and the world. This urban agglomeration stands as the largest in northern China. Located in the northern North China Plain, this area includes two municipalities, Beijing and Tianjin, along with various other major cities in Hebei Province. Covering 216,000 square kilometers, it boasts a population surpassing 100 million. This area functions as China’s hub for both political and cultural activities, as well as being a significant economic and industrial hub. Lately, as the nation concentrates on building an ecological civilization, the eco-friendly growth of the Beijing–Tianjin–Hebei urban agglomeration has increasingly captured the interest of various societal segments. Nonetheless, owing to historical factors and geographical factors, this area’s industrial framework (without space) is quite singular, with a notably substantial share of heavy industry. The issue of environmental contamination stands out more significantly. The sluggish progress of green innovation in China has emerged as a pressing concern in recent years [4,5]. Acknowledging the pressing need to harmonize environmental sustainability with economic progress, the Chinese government has placed green development at the forefront of its policy agenda, making it a key pillar of its long-term strategy [6,7]. As a result, the key to the sustainable growth of the Beijing–Tianjin–Hebei urban agglomeration lies in promoting industrial eco-friendly advancements, improving the use of resources, and reducing environmental contamination.
This research aims to provide a comprehensive overview of the present state and obstacles linked to industrial green innovation within the Beijing–Tianjin–Hebei urban cluster. Furthermore, the underlying process of its combined impact will be uncovered, along with offering decision-making assistance to both the government and businesses. Simultaneously, the findings of this study will serve as a guide for eco-friendly growth in comparable areas and advance the process of sustainable development nationwide. Studies have shown that China has always lagged behind other countries in global innovation. Nevertheless, China’s rapid advancements in recent years have positioned technological innovation as a vital approach for improving sustainable green efficiency. Therefore, further exploration of green innovation development holds substantial importance [8,9,10,11]. Briefly, studies focusing on the combined impact and efficiency of industrial green advancements the Beijing–Tianjin–Hebei urban agglomeration cluster hold substantial theoretical importance and practical relevance. The varying levels of efficiency and collaborative potential in green industrial innovation across cities in this region stem from a multitude of influencing factors. Grasping the underlying dynamics behind these differences is crucial for crafting impactful policies and driving forward sustainable growth. This study aims to explore and elucidate these potential factors to provide a more comprehensive analysis.

1.2. Literature Review

Investigations into the efficacy of sustainable industrial growth and the trajectory of enhancing industrial innovation focus mainly on gauging efficiency and pinpointing key elements [12,13]. Claire’s [14] research indicates that investing in R&D fosters green innovation to some degree. Fei Fan and colleagues [15] developed a spatial measurement framework employing the geographic weight matrix to assess green innovation efficiency across 235 mainland Chinese cities between 2004 and 2016. Dong Feng [16] explores the impact of industrial convergence on the effectiveness of local green development. Wu Hong [17] pointed out that green finance can significantly improve environmental sustainability and produce positive environmental results, which largely promotes the growth of green development efficiency. Fan Fei [18] emphasized the importance of nurturing sustainable growth in resource-driven cities as a fundamental step toward hastening economic transformation. Consequently, this accelerates the process of industrialization, enhancing the effectiveness of industrial innovation. Energy-intensive manufacturing sectors and businesses are crucial drivers of industrial progress and economic expansion, serving as key catalysts in advancing green innovation efficiency. Their contributions not only fuel growth but also pave the way for sustainable development in the long run [19,20,21]. Fang He [22] employs financial growth strategies to enhance the effectiveness of innovation in industrial green technology. Some scholars [23,24] explored the effectiveness of green development from different perspectives. It is crucial to view the effectiveness of innovative development as a unified factor, instead of analyzing it as multiple separate factors. Consequently, this document will explore the trajectory of efficiency in industrial green development and the enhanced efficiency of coordinated industrial development.
Investigations into the efficacy of sustainable industrial growth and the emerging efficiency in industrial creative development primarily concentrate on four aspects: efficiency measurement, identification of influencing factors, inspection of convergence mechanism, and discussion of improvement paths [25,26,27,28,29]. For the regional level of industrial green innovation efficiency, Bingquan Liu [30] found that in the eastern part of the region, industrial digitization led to a gradual and extensive improvement in industrial green innovation efficiency, in contrast to the central area, where digital industrialization had minimal impact. Both digital and industrial digitization significantly boosted overall efficiency and the evolution of accomplishments. Nonetheless, their impact on R&D was negligible. In the western region, digital industrialization adoption caused a significant drop in overall and achievement transformation efficiency. Additionally, the advent of industrial digitization failed to noticeably affect the total or individual efficiency levels. Xiaoqian Liu and colleagues [31] assert that the integration of artificial intelligence into industrial robots, as a form of general-purpose technology, can drive technological advancements in factor gains. This, in turn, fosters an increase in total factor productivity [32], exerting a profound and extensive influence on economic growth and social structures [33,34,35]. Consequently, this advancement further catalyzes the enhancement of green innovation efficiency [36]. Some experts [37,38,39,40] also unveiled the pathways through which green innovation and environmental policies influence China’s green development efficiency, directly and indirectly, across macro- and micro-scales. Therefore, the government should strengthen regional cooperation to establish an environmentally sustainable development model [41].
The study of industrial green innovation efficiency typically employs both parametric and non-parametric approaches. The parametric approach employs stochastic frontier analysis (SFA), while the non-parametric approach utilizes data envelopment analysis (DEA). DEA can be widely used because it is able to cause bias when using the parameters. DEA takes into account multiple metrics and can handle the efficiency evaluation of multiple input and outputs, without relying on some predetermined mathematical functions [42,43]. It can also effectively evaluate a system and evaluate the efficiency of a single stage [44]. The aim of stochastic frontier analysis (SFA) is to differentiate between technical efficiency and inefficiency, while also identifying and analyzing the various factors that influence the effectiveness of green innovation within industrial sectors. This approach helps pinpoint areas where improvements can be made to enhance overall performance [45]. The traditional DEA model fails to account for undesirable outputs; Chung [46] proposed DDF, integrating pollutants as unintended outputs within the DEA structure. The conventional DEA approach is highly susceptible to outliers in the data set, potentially skewing the accuracy of efficiency assessments. Later, Fare et al. [47] proposed an ML (Malmquist–Luenberger) exponential operation method to measure the efficiency more accurately. After the improvement of the above DEA model, there are also radial models in the traditional DEA model that may ignore the input or output relaxation variables when evaluating the efficiency, leading to flawed evaluations of efficiency. To address this limitation, Tone [48] introduced the SBM model.
In summary, research on the effectiveness of sustainable industrial innovation has grown considerably. Numerous studies evaluate the effectiveness and creativity of sustainable development across various areas, such as the Beijing–Tianjin–Hebei metropolitan region [49,50]. The research employed a range of analytical techniques, including data envelopment analysis (DEA), stochastic frontier analysis (SFA), and the global super-efficiency SBM model, to assess the effectiveness of green innovation within the industrial sector. This also shows that local research on the effectiveness of industrial green development and industrial innovation development is mature, which has established a strong basis for subsequent studies [51,52,53]. While these studies offer important insights into green innovation efficiency, notable gaps remain in the existing research. A significant gap is the absence of a thorough evaluation of green innovation efficiency within the Beijing–Tianjin–Hebei urban cluster. Although some studies have examined the efficiency of green innovation in the region, they were mainly focused on individual cities or specific industries rather than urban agglomerations as a whole. Another gap in the literature is the limited focus on the coupling coordination of green innovations. Most research primarily assesses green development and innovation independently, overlooking their interconnectedness. This leads to a poor understanding of how to improve the efficiency of green innovation through coordinated efforts. Thus, our study aims to fill these gaps by providing a comprehensive analysis of green innovation efficiency in the Beijing–Tianjin–Hebei urban agglomeration. This research employs the ultra-efficient SBM model to evaluate the efficiency of green development and innovative development within the Beijing–Tianjin–Hebei region. Subsequently, a coupling model is utilized to determine the synergistic effects between these two dimensions. The research will also explore elements influencing green innovation effectiveness, including policy backing, technological advancements, and resource distribution. By tackling these gaps head-on, the research aims to enrich the current body of knowledge, offering a more comprehensive understanding of how green innovation drives efficiency within the Beijing–Tianjin–Hebei urban cluster.

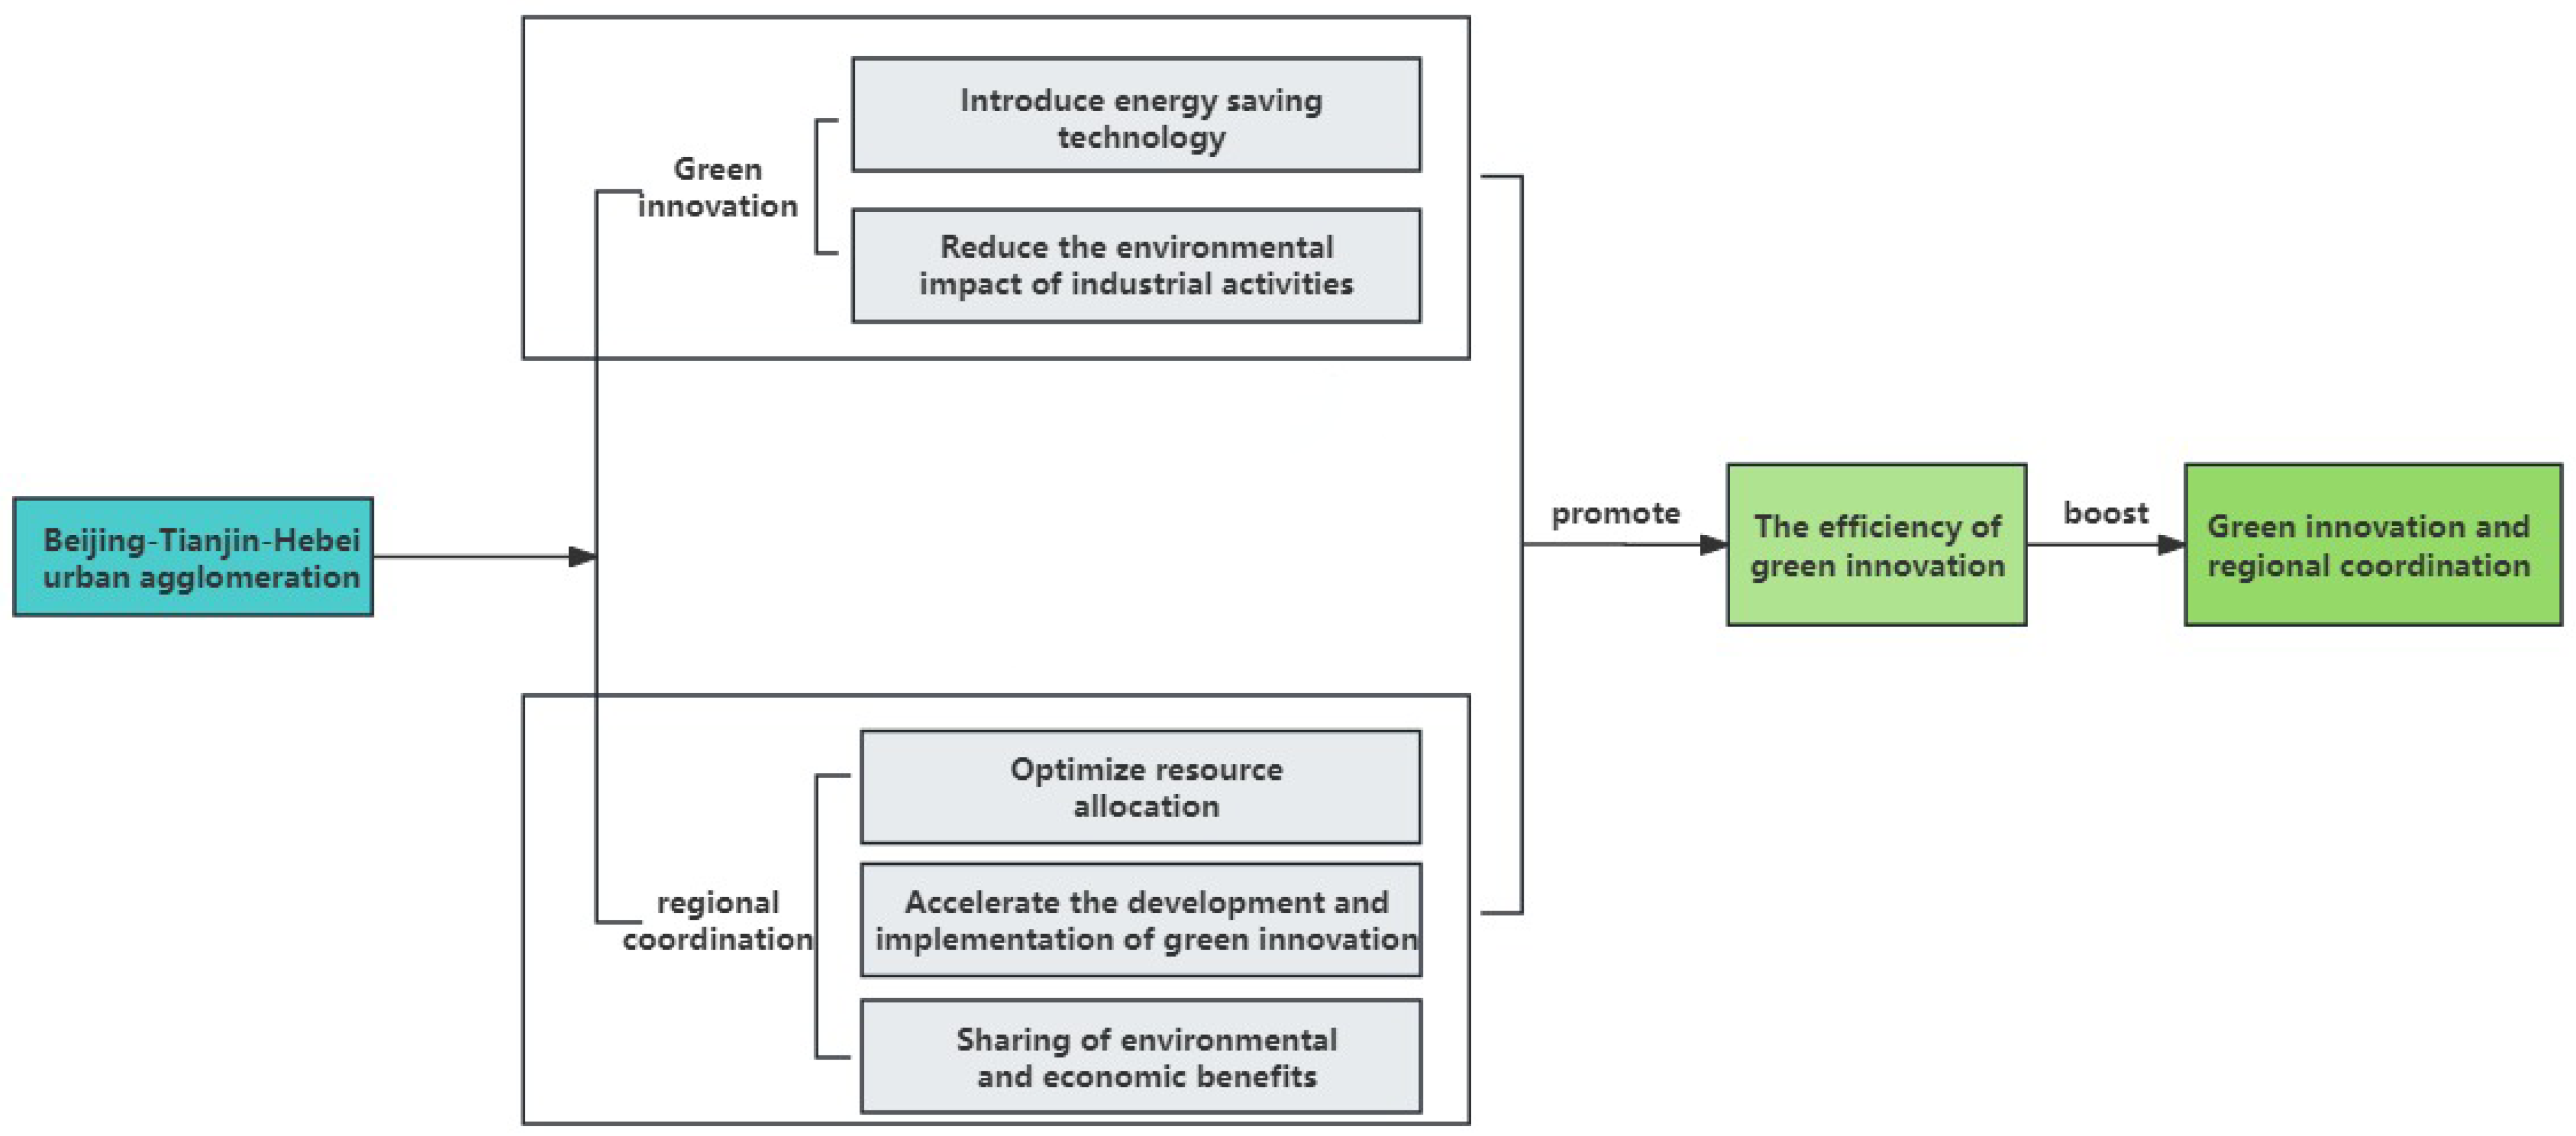
1.3. Theoretical Framework

Green innovation plays a pivotal role in advancing sustainable development, encompassing the creation and adoption of cutting-edge technologies, methods, and products aimed at minimizing environmental harm and maximizing resource efficiency. The concept includes not only incremental improvements in technology and products but also fundamental changes that could revolutionize the industry [54]. In this research, efficiency is understood as the strategic allocation and utilization of resources to maximize productivity while minimizing waste, serving as a critical benchmark for assessing the effectiveness of green innovation initiatives. Efficiency can be quantified in various ways, including productivity, resource utilization, and environmental performance indicators, which together outline a comprehensive picture of physical operations and environmental management [55]. Regional collaboration is key to maximizing the effectiveness of green innovation. By strategically aligning policies, pooling resources, and coordinating efforts across different areas, regions can work together toward shared objectives, creating a more unified and impactful approach to sustainability. This collaborative approach includes inter-regional cooperation, resource sharing, and policy coordination, all of which are crucial to creating an environment conducive to the boom of green innovation [56]. By promoting the sharing of R&D resources among regions, regions can pool their intellectual and financial capital to achieve more significant breakthroughs in green innovation. This enhances productivity, boosts efficiency, minimizes waste, and optimizes resource use [57,58].
The synergistic effect between green innovation and regional coordination is particularly obvious in the context of industrial development. Industries implementing green innovation frequently achieve a competitive edge by aligning with the rising demand for eco-friendly products and services. Additionally, adopting green technologies can lead to financial savings through lower energy use and decreased waste production, thereby improving the economic sustainability of these sectors. Regional coordination in turn ensures that these benefits are not limited to single entities but are shared across the region, facilitating a collective shift to sustainability. In the Beijing–Tianjin–Hebei urban cluster, the significance of green innovation and regional collaboration cannot be overlooked. As a key economic hub in northern China, the area contends with distinct issues related to environmental deterioration and limited resources. Green innovation offers solutions to these issues by implementing novel technologies and methods that minimize the ecological footprint of industrial operations. Manufacturing plants can substantially cut down on energy consumption and greenhouse gas emissions by implementing advanced energy-saving technologies, thereby enhancing their environmental performance.
Moreover, urban cluster coordination is vital for enhancing resource distribution and boosting green innovation efficiency. In the region, resources such as research funding, technical expertise, and infrastructure can be more effectively shared by facilitating cooperation between cities. This collaborative approach not only accelerates the development and implementation of green innovation but also ensures that these benefits are fairly distributed across the region. For example, joint research programs between universities and industries in Beijing, Tianjin, and Hebei can lead to the development of new green materials or energy-efficient processes that can be implemented throughout the region, resulting in significant environmental and economic benefits.
In short, green innovation and regional coordination are internally linked and mutually reinforcing. As shown in Figure 1, green innovation provides the technological and process advances necessary to achieve sustainable development, and regional coordination ensures that these innovations are implemented effectively and that the benefits are maximized throughout the region. Therefore, this study suggests strengthening regional cooperation to improve the efficiency of green innovation development, not only in the Beijing–Tianjin–Hebei urban agglomeration but also in other regions facing similar challenges. By doing so, we can get closer to achieving a sustainable and efficient future, in which economic growth is aligned with environmental protection.

2. Study Methods

2.1. Model Setting

The objective of this paper is to utilize the highly efficient SBM model for evaluating green and innovative growth. In order to consider the non-proportional relaxation of the traditional data envelopment analysis (DEA) framework, it is necessary to recognize that this approach cannot accurately reflect the input and output variables and fails to account for the weak disposability of undesirable outputs. This paper borrows from Andersen and Petersen [59] with the Oh [60] method. a, t, b, c, and d represent the production decision unit, production period, production factor, expected output, and undesired output, respectively. Please find the details outlined below:
min α = 1 / M t = 1 T b = 1 B ( x ¯ / x a m ) 1 / ( C + D ) ( t = 1 T c = 1 C y ¯ / y a c + t = 1 T d = 1 D z ¯ / z a d ) x ¯ t = 1 T a = 1 N λ a t x a b t , x ¯ x a b , b = 1 , 2 , 3 , , B y ¯ t = 1 T a = 1 N λ a t y a c t , y ¯ y a c , c = 1 , 2 , 3 , , C z ¯ t = 1 T a = 1 N λ a t z a d t , z ¯ z a d , d = 1 , 2 , 3 , , D a = 1 N λ a t = 1 , λ a t 0 , a = 1 , 2 , 3 , , N
Within the above formula, Where a, t, b, c, and d represent the production decision unit, production period, production factor, expected output, and undesired output, respectively.α symbolizes the efficiency of a decision unit’s production over time t under fluctuating global production technology and scale compensation (VRS) scenarios. λ a t  represents the significance of the decision unit’s input and output values across the specified period.  a = 1 N λ a = 1 t , λ a t 0 means that the scale of production technology is variable.

2.2. Evaluation Indicators

Table 1 displays the factor inputs and the anticipated and unwanted results associated with the aforementioned techniques. Regarding the effectiveness of eco-friendly industrial growth, three primary elements are taken into account: the workforce in industry, the capital of the industry, and the energy usage in industry. These are represented by the mean employee count in larger industrial firms, the society’s total industrial capital, and the consumption of industrial energy. The expected and unanticipated results are evaluated based on the overall industrial production, industrial solid waste, industrial wastewater, and industrial waste gas, in that order. The expected result is mirrored in the sales value of industrial companies surpassing the specified scale. The unforeseen result is mirrored in the overall amount of industrial wastewater released and the cumulative release of sulfur dioxide and soot originating from industrial entities, as depicted in Table 1.
Industrial innovation development’s effectiveness mirrors the conversion of industrial innovation contributions into enhanced industrial innovation efficiency. Put differently, the peak of industrial production is achieved with the backing of investments in industrial innovation and R&D. Consequently, the worldwide super-efficiency SBM framework continues to serve as a metric for assessing industrial innovation and development efficiency. The data in Table 2 illustrate the contributions of innovation, both in terms of input and output, toward enhancing industrial innovation development efficiency. Investment in innovation primarily focuses on human contribution and asset allocation, evident in the R&D staff of larger industrial firms and the R&D capital of larger enterprises, respectively. The variable outputted represents the count of patent filings by industrial entities exceeding a specified size and revenue generated from selling new items of industrial companies exceeding a specified size.
Industrial green innovation’s synergistic impact reflects the degree to which its development complements industrial innovation. Consequently, this document aims to employ the integrated coordination framework to assess the combined impact of industrial eco-friendly advancements in the Beijing–Tianjin–Hebei urban cluster. The coupling degree model is mainly employed to evaluate how industrial green development efficiency interacts with industrial innovation development efficiency. While the degree of coupling may reveal the intensity and orientation of their interconnection, it essentially signifies a uniformity across the system. Precisely encapsulating their combined impact is unfeasible. Consequently, it is crucial to develop a model for coupling coordination to assess how industrial green development impacts industrial innovation development. The model for coordinating coupling is outlined as follows:
D = C × D ,   T = α L + β E ,   C = L × E ( L + E ) / 2
In this equation, D represents the degree of cooperative interplay between the effectiveness of industrial green development (L) and industrial innovation development (E), whereas T signifies the comprehensive benefit index. α and β symbolize the expected metrics for industrial green and innovation development efficiency, respectively. To achieve the Beijing–Tianjin–Hebei urban cluster’s enhanced growth, prioritizing industrial green development and innovation is essential. As a result, α and β are presumed to be 0.5. Progress in industrial eco-friendly innovation can be segmented into three main groups, each containing ten smaller divisions (refer to Table 3).

2.3. Descriptive Statistical Analysis

The main data origin is the China City Statistical Yearbook (2018–2022), encompassing information from 13 cities: Tianjin, Beijing, Hengshui, Tangshan, Baoding, Shijiazhuang, Langfang, Qinhuangdao, Cangzhou, Handan, Chengde, Xingtai, and Zhangjiakou. The indexes related to the product value in the paper are reduced by the fixed-base price index based on 2013. The fixed capital is adjusted downwards by the industrial fixed-asset price index. The industrial sales output value and new product sales revenue have been diminished by the industrial producer price index. The industrial producer purchase index lowers the R&D investment.

3. Empirical Analysis Results

3.1. Measurement and Analysis of Beijing, Tianjin, and Hebei

3.1.1. Calculation of Green Development Efficiency in the Beijing–Tianjin–Hebei Region

An analysis of green development efficiency across 13 key cities in the Beijing–Tianjin–Hebei region between 2018 and 2022 reveals notable disparities in performance over the years, as illustrated in Table 4. The data underscore the uneven progress in sustainable growth among these urban centers, highlighting the varying levels of commitment and effectiveness in achieving eco-friendly development goals. Overall, the green development efficiency in the Beijing–Tianjin–Hebei region has been on an upward trajectory, with particularly notable improvements in 2021 and 2022. The average efficiency score for 2022 reached 0.1985, marking a significant increase of approximately 23% compared to the 2018 figure of 0.9687. The green development efficiency in most cities reached its peak in 2022, which was related to the economic environment, policy adjustments, and market changes at that time. For instance, cities like Beijing and Tianjin have achieved relatively high green development efficiency. This can be primarily attributed to their advanced industrial structures. Beijing, as the political and cultural center of China, has been vigorously promoting the transformation and upgrading of industries in recent years. It has gradually scaled back traditional heavy industries and simultaneously expanded the high-tech and service sectors. These industries generally have higher energy utilization efficiency and lower pollutant emissions. Moreover, Beijing boasts extensive scientific and technological resources, offering robust support for green technology research and implementation. Beijing is home to a plethora of prestigious universities and cutting-edge research institutions that are tirelessly working to pioneer innovative green technologies and enhance existing environmental protection methods. These institutions are at the forefront of driving sustainable solutions, pushing the boundaries of what is possible in the fight against environmental challenges. In contrast, cities such as Zhangjiakou, Handan, Xingtai, and Hengshui have relatively low green development efficiency. One of the main reasons is their high population density and excessive resource consumption. These cities have a large number of traditional manufacturing enterprises, which rely heavily on natural resources and energy. The production processes are often accompanied by high levels of pollutant emissions. Additionally, due to limited economic development levels and financial resources, they face difficulties in investing in advanced green technologies and environmental protection facilities, resulting in a relatively backward situation in green development.
Figure 2 illustrates that Beijing, Tianjin, Chengde, and Baoding exhibit a high level of green development efficiency. These areas are marked as light green, and their green development efficiency is above 1.1396, showing a spatial distribution pattern with an “A” shape. Shijiazhuang, Cangzhou, Langfang, Tangshan, and Qinhuangdao are all marked as light blue, indicating their green development is between 1.0541 and 1.1322. Zhangjiakou, Handan, Hengshui, and Xingtai demonstrate lower efficiency in green development, signifying an efficiency rate below 1.
Overall, green development efficiency in the Beijing–Tianjin–Hebei region shows notable spatial disparities. Green development is better in the north, while the south is relatively poor. As the nation’s capital, Beijing has likely set the standard for enforcing environmental protection measures, adopting cutting-edge green technologies and refining its industrial framework. Meanwhile, Chengde, blessed with abundant natural resources and minimal industrial contamination, has probably carved out a notable reputation for its strides in sustainable development. The eco-friendly progress of these light-blue cities outpaces the norm, with notable strides in areas like clean energy adoption and environmental management. However, there is still ample room for improvement to push their green development even further. Southern cities such as Hengshui, Xingtai, and Handan, which are relatively lagging in green development, may face severe environmental problems and industrial structure adjustment pressure. Therefore, enhancing investment and efforts in environmental conservation and sustainable development is essential.

3.1.2. Calculation of Innovative Development Efficiency in the Beijing–Tianjin–Hebei Region

As illustrated in Table 5, in 2018, the average efficiency of innovation development in the Beijing–Tianjin–Hebei region was 0.9485. This figure saw a modest uptick to 1.0073 in 2019, followed by a steady climb to 1.0608 in 2020. The upward trajectory continued, reaching 1.1309 in 2021 and 1.2111 in 2022, clearly indicating a consistent year-over-year improvement in overall innovation efficiency. The high innovation development efficiency in cities like Beijing and Tianjin is closely related to their advantageous industrial structures and rich educational resources. Beijing has a large number of high-tech enterprises and innovation platforms, attracting a large number of high-quality R&D talents. These talents bring advanced innovation concepts and technologies, promoting continuous innovation in enterprises. Tianjin boasts a robust industrial base, particularly in cutting-edge high-tech sectors. To foster innovation, the local government has rolled out a range of supportive measures, including financial grants and tax breaks tailored to forward-thinking companies. This has effectively stimulated the innovation enthusiasm of enterprises and improved the innovation development efficiency. On the other hand, cities like Chengde, Hengshui, Xingtai, and Handan have relatively low innovation development efficiency. The primary cause is the absence of a favorable innovation ecosystem and inadequate policy and financial support. These cities possess a limited concentration of high-tech firms and research organizations, coupled with a low capacity to attract skilled professionals. As a result, the innovation ability is relatively underdeveloped, and it is necessary to strengthen policy support and resource input to promote the development of innovative technology.
As illustrated in Figure 3, Beijing, Tianjin, Langfang, and Shijiazhuang demonstrate notably high innovation development efficiency. These regions are highlighted in light green, with innovation efficiency exceeding 1.0726. The innovation development efficiency of Zhangjiakou, Baoding, Cangzhou, Tangshan, and Qinhuangdao is at the medium level, and these areas are marked as light blue, indicating that their innovation development efficiency is between 0.9525 and 1.0539. Chengde, Hengshui, Xingtai, and Handan exhibit low efficiency in innovation and development. These areas are marked as white, and their innovation and development efficiency is less than 0.9514.
From a broader spatial standpoint, Beijing, as a centrally administered municipality within the Beijing–Tianjin–Hebei region, stands out for its remarkable efficiency in innovation and development. This can largely be attributed to its robust economic foundation, cutting-edge scientific research capabilities, and its ability to attract and retain top-tier talent, among other key factors. The majority of cities surrounding Beijing demonstrate impressive innovation and development efficiency, highlighting Beijing’s pivotal role as a driving force in fostering progress. The capital not only sets a strong example but also effectively propels the economic growth of its neighboring regions. However, cities like Handan, Xingtai, Hengshui, and Chengde lag behind, showing relatively lower levels of innovation and development efficiency. Therefore, we should strengthen the cooperation between Beijing, Tianjin, and Hebei cities; share innovation resources; form a regional innovation network; and improve the overall efficiency of innovation development.

3.1.3. Calculation of Green Innovation in the Beijing–Tianjin–Hebei Region

As illustrated in Table 6, when examining the average coupling degree of green innovation in the Beijing–Tianjin–Hebei region, the data show that green is gradually on the rise. In 2018, the mean stood at 0.9747, followed by a modest rise to 1.0093 in 2019. The trend continued, dipping slightly to 1.0339 in 2020 before climbing to 1.0611 in both 2021 and 2022. Overall, the data underscore a consistent year-on-year increase in the coupling degree of green innovation within the region. When examining the classification of industrial green development efficiency alongside industrial innovation efficiency, the average performance across all cities from 2018 to 2022 has achieved a level of high-quality coordination. However, cities like Handan, Xingtai, and Zhangjiakou only managed to reach a state of good coordination in 2018. Despite this progress, significant disparities remain in the level of green innovation synergy among different cities, highlighting ongoing challenges in achieving uniform progress. In metropolitan hubs like Beijing, Tianjin, Tangshan, and Shijiazhuang, the consistent high level of green innovation integration stems from their robust industrial infrastructure and exceptional capacity for innovation. These urban centers have wholeheartedly embraced the fusion of eco-friendly progress and cutting-edge innovation, fostering robust partnerships between businesses and academic institutions. By doing so, they have ramped up the practical application and real-world impact of sustainable technological breakthroughs. In Beijing, numerous collaborative initiatives between universities and businesses are driving advancements in green technology innovation, fostering a seamless integration of eco-friendly practices and spurring sustainable growth. However, in cities like Handan and Hengshui, the green innovation coupling degree has always been low. This is mainly because the industrial structure in these cities is relatively single, mainly relying on traditional industries, and the awareness and ability of green innovation are relatively weak. There is a lack of effective cooperation channels and platforms for green innovation, resulting in a serious lack of technological innovation and poor coordination in green innovation. To address this issue effectively, it is crucial to prioritize the restructuring and modernization of industries, foster a mindset geared toward eco-friendly innovation, and actively establish collaborative platforms that drive the harmonious advancement of sustainable development.
As illustrated in Figure 4, Beijing, Tianjin, Shijiazhuang, and Tangshan have the highest coupling coordination, which is marked as light green, indicating that the coupling coordination is above 1.0446, suggesting that these cities have very good coordination in sustainable innovation and economic growth. In the Beijing–Tianjin–Hebei region, the coupling coordination degrees of Chengde, Qinhuangdao, Langfang, Baoding, and Cangzhou, which are colored light blue, fall within the range of 1.0139 to 1.0345. Zhangjiakou, Hengshui, Xingtai, and Handan have lower coupling coordination; these areas are marked as white, with their coupling coordination being between 0.9291 and 0.9892. Green development and innovation complement each other. We should focus on advancing green industries, enhancing innovative technologies, and fostering mutual growth. Those cities with occasionally low coordination may be due to the lack of technology, etc. To foster growth and progress, it is essential to ramp up efforts in advancing scientific and technological innovation. Additionally, the government ought to offer increased incentives and favorable policies to propel these cities toward greater development and prosperity.

3.2. Analysis of the Evolution Trend of Efficiency Measurement in the Beijing–Tianjin–Hebei Region

The Gaussian kernel density estimation technique is employed to analyze the alterations in the distribution patterns of green development efficiency, innovation development efficiency, and the level of coordination in green innovation coupling. Figure 5A–C illustrate that the peak of the distribution curve aligns with the nuclear density curve of green development efficiency, leaning toward the “1” side rather than the “0” side. This shows that most cities in the Beijing–Tianjin–Hebei area demonstrate strong performance in both green and innovative development efficiency. Over time, the center point shifts rightward, reflecting enhanced efficiency and innovation in green development. The coupling coordination degree is similarly high, being closer to “1”. As the years have progressed, the widths of the kernel density curves for green development efficiency and coupling coordination efficiency have remained relatively stable, indicating a consistent upward trend. In contrast, the kernel density curve for innovation development efficiency has noticeably widened, showing significant expansion driven by recent scientific and technological progress. This progress is particularly evident in the Beijing–Tianjin–Hebei region, where innovation and development have surged. Analyzing the nuclear density maps reveals that all three maps are largely skewed to the right, signifying the presence of several cities, including Beijing and Tianjin, that exhibit a high level of development.

3.3. Examination of the Spatial and Temporal Development Features of the Beijing–Tianjin–Hebei Area

3.3.1. Changes over Time in the Efficiency of Green Development in the Beijing–Tianjin–Hebei Area

Between 2018 and 2022, the development efficiency across various cities displayed distinct distribution patterns, as illustrated in Figure 6. The figure shows the spatiotemporal and spatial changes in the green development efficiency in the Beijing–Tianjin–Hebei region. In the figure, darker shades indicate regions with greater green development efficiency, whereas lighter shades represent those with lower efficiency. From the point of color depth, in 2018, Beijing, Tianjin, Baoding, Tangshan, and Chengde were dark green and in a leading position, but with the passage of time, in 2019 and 2020, only Beijing and Tianjin remained at a higher level; there is a strong relationship between green transformation and environmental improvement progress. Handan and Hengshui have been at low levels. In general, with the passing of years, different cities have significant differences, so it can be seen that there is still large room for progress.

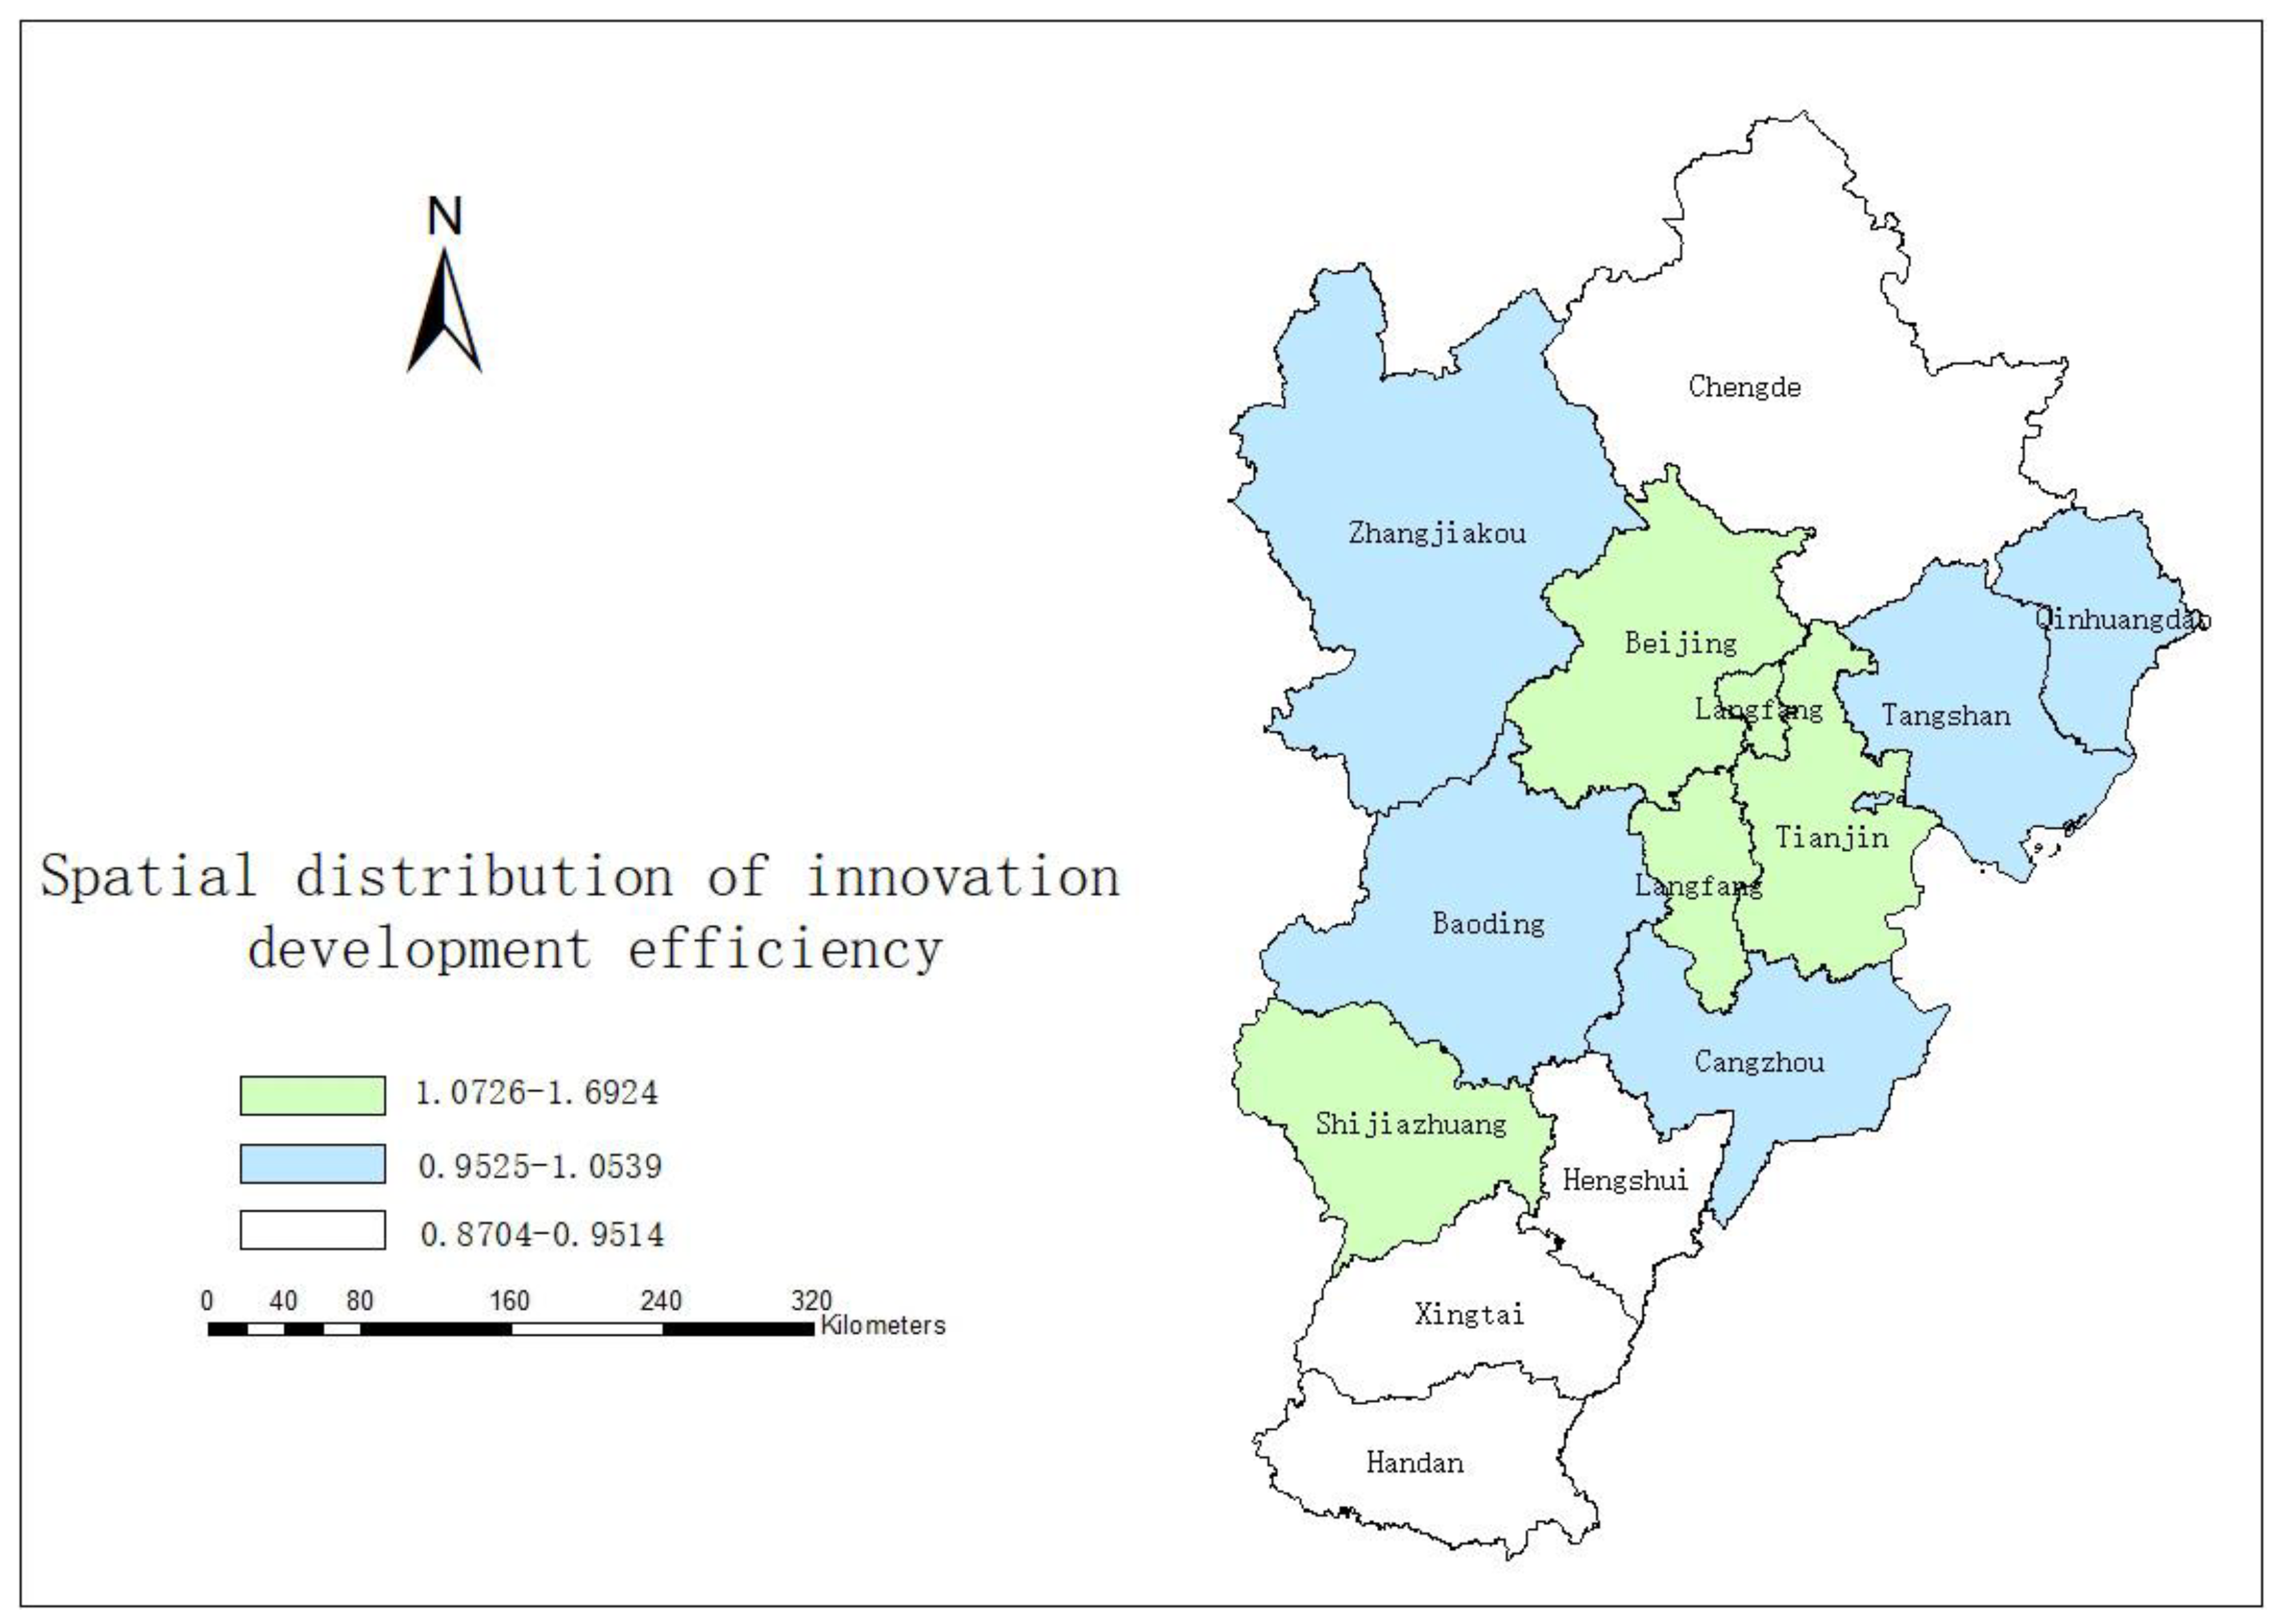
3.3.2. Spatial–Temporal Dynamics of Innovation and Development Efficiency in the Beijing–Tianjin–Hebei Area

Figure 7 shows the spatiotemporal distribution characteristics of innovation development efficiency in the Beijing–Tianjin–Hebei region from 2018 to 2022. From the perspective of distribution, in 2018, Beijing, Tianjin, and Shijiazhuang were in a leading position, especially in Beijing and Tianjin; as an innovation resources and talent cluster, the two cities play a leading role in promoting regional innovation development. The impact of their innovation development efficiency is strikingly evident, as reflected in the data. Additionally, Shijiazhuang, the provincial capital of Hebei, boasts its own distinct advantages when it comes to fostering innovation and driving progress. Handan has always been at a low level. Overall, the northern region greatly surpasses the southern region, with most northern cities oriented around Beijing.

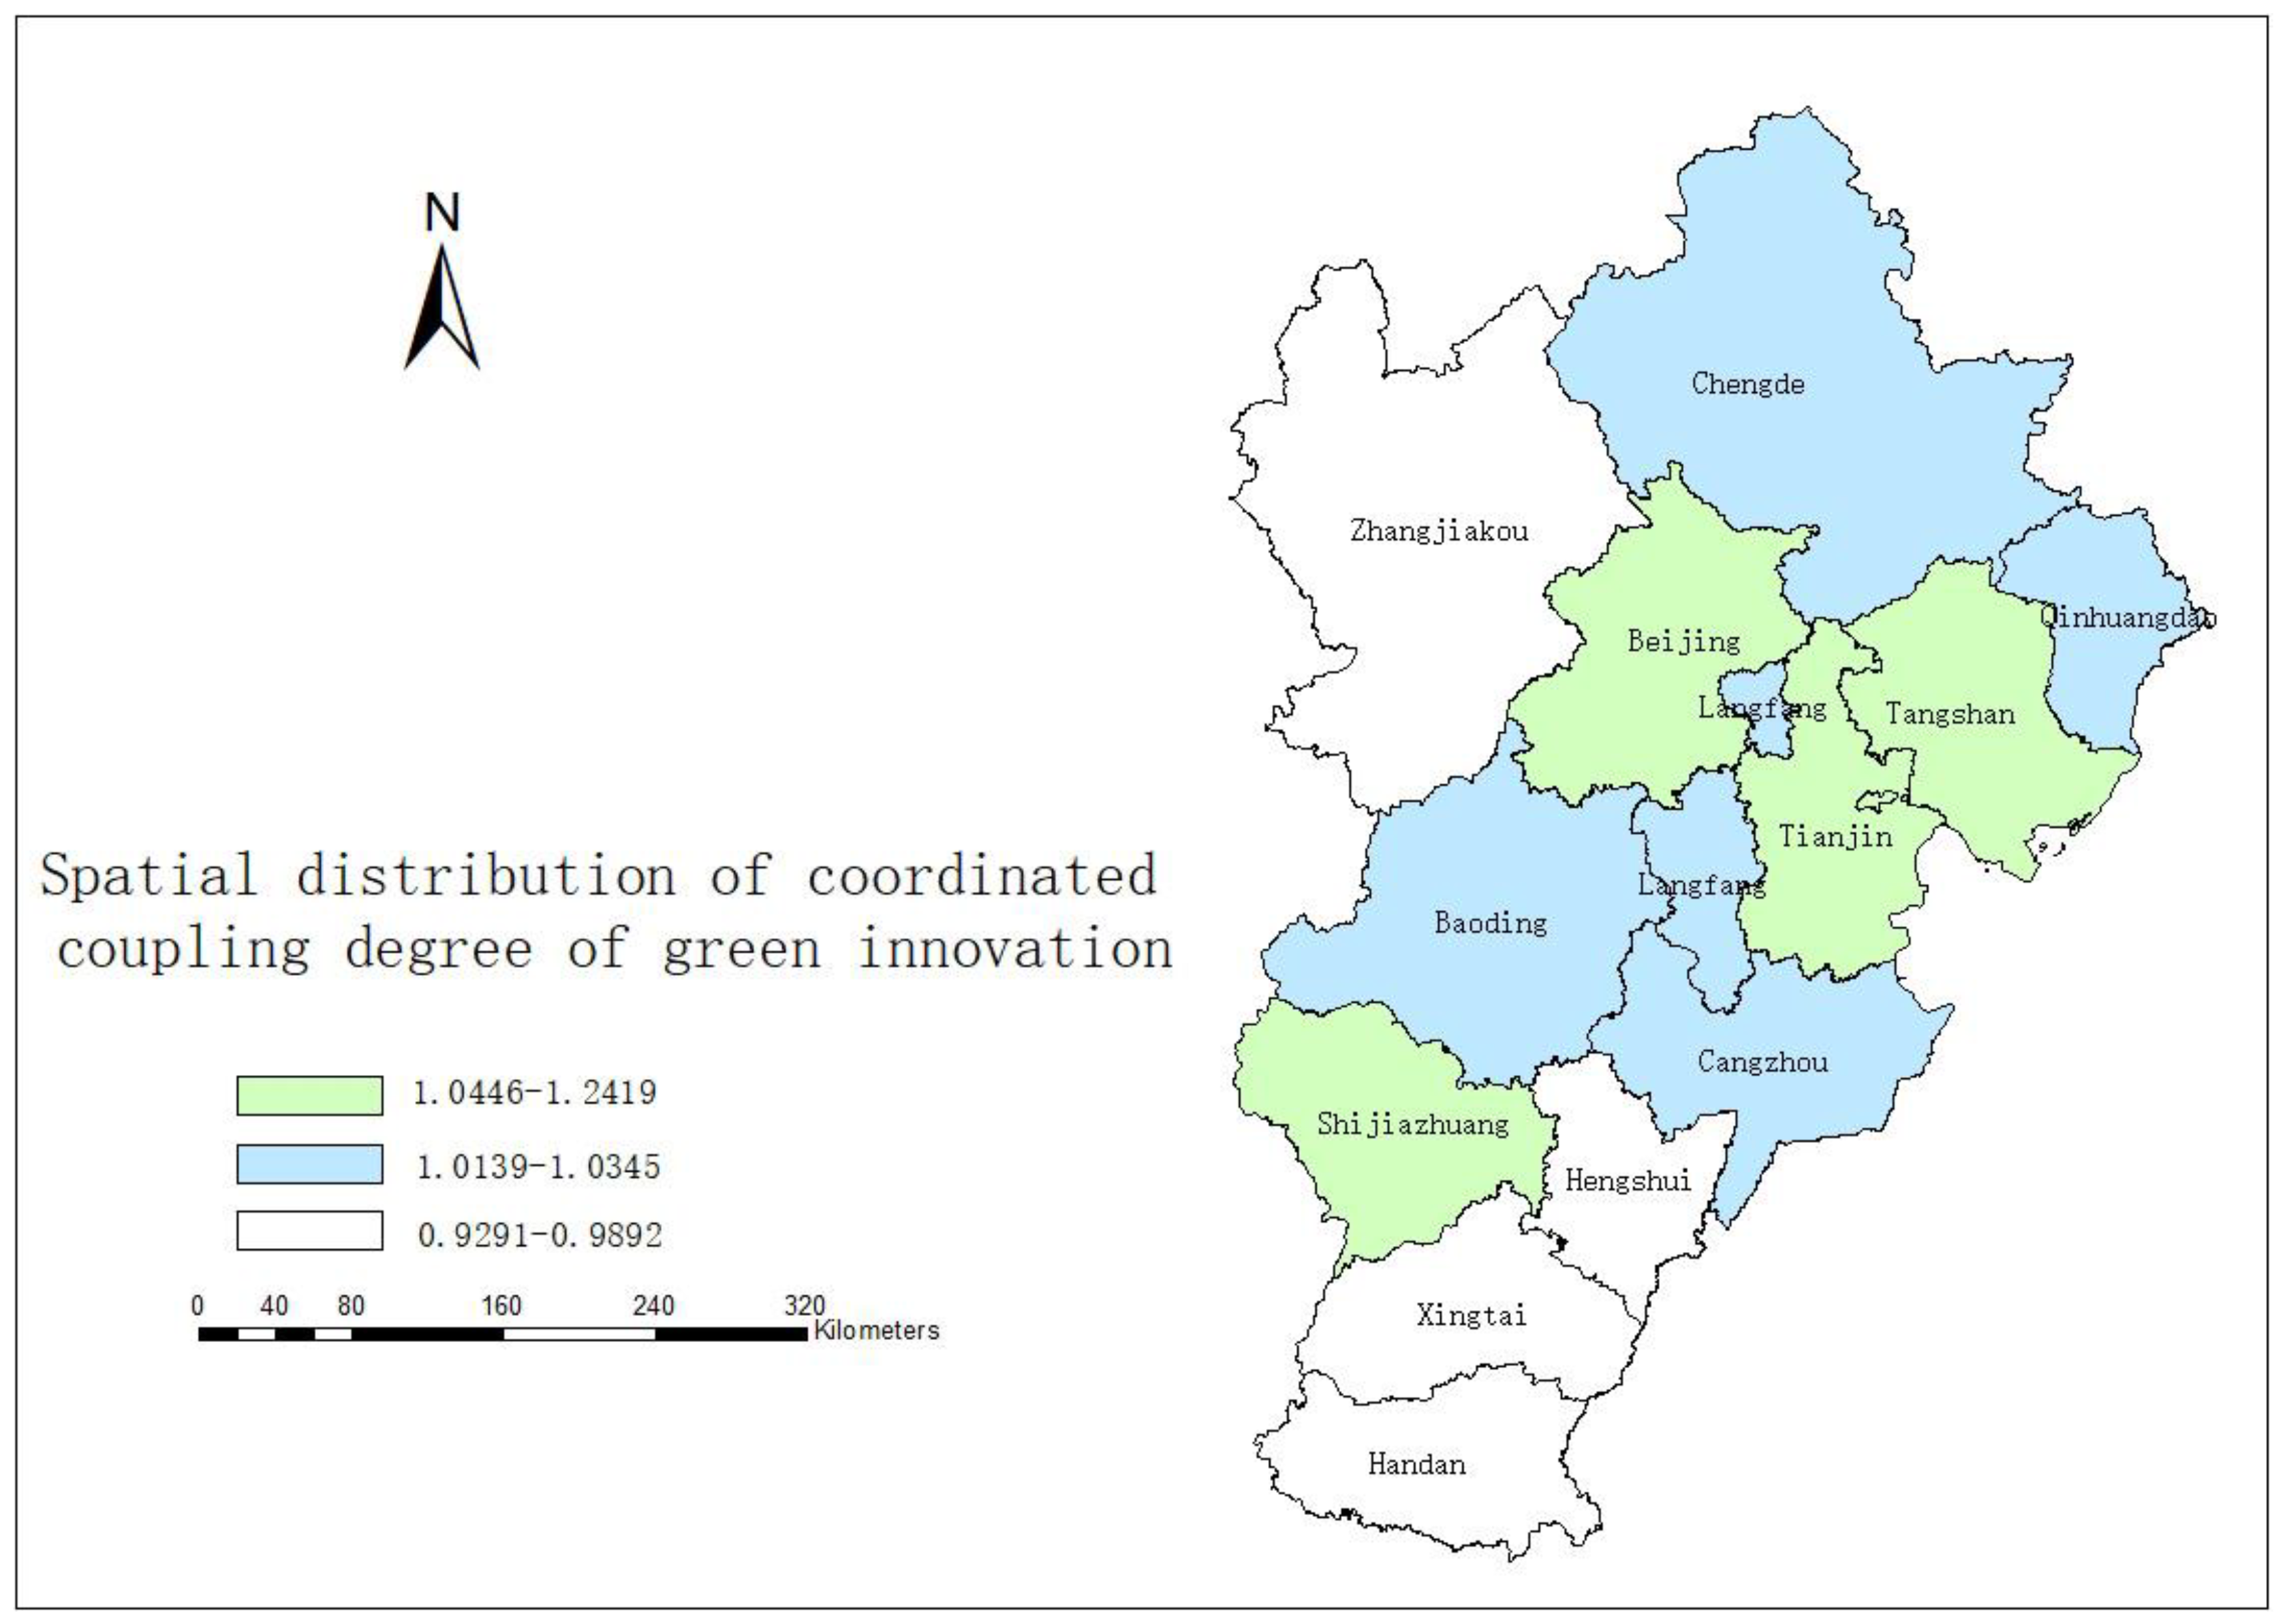
3.3.3. Spatiotemporal Change Characteristics of the Coordinated Coupling Degree of Green Innovation in the Beijing–Tianjin–Hebei Region

As illustrated in Figure 8, from 2018 to 2022, Beijing consistently demonstrated strong green innovation synergy across the Beijing–Tianjin–Hebei area. In stark contrast, Handan remained at the lower end of the spectrum. This disparity can largely be attributed to differences in industrial frameworks, government initiatives, and innovation capacities between the two areas. Urban centers like Tianjin and Shijiazhuang have witnessed advancements in their industrial transformation and enhancement, evident in the increased synergy between their green innovation efforts. There may be significant differences in the coordinated coupling degree of green innovation between different regions. Beijing and Tianjin, as more developed cities, are more prominent in green innovation, while there may be differences in the surrounding areas. The overall development trend is to gradually develop from the north to the central part. The coordination degree of green innovation in the south is lagging behind, but the overall development trend is still above the average level, with a large space for progress.

4. Discussion

In terms of research methodology, previous studies primarily emphasized the development of theoretical models, whereas this study integrates theoretical models with more comprehensive and detailed empirical data. Over the past decade, we have collected and examined data from industrial enterprises in the Beijing–Tianjin–Hebei region, covering companies of various sizes and industries. This comprehensive approach ensures that our findings are not only grounded in reality but also tailored to address the specific challenges and opportunities within this region. On the other hand, earlier studies often relied on somewhat narrower data sets. By focusing only on information from a specific year or a particular sector, these studies struggled to present a comprehensive picture of the green innovation efforts within the region’s industries.
Our research methodology expands on previous studies by offering a detailed analysis of green innovation efficiency in the Beijing–Tianjin–Hebei region, addressing a gap in earlier research. Unlike earlier studies that limited their focus to individual cities or sectors, we take a broader look at the entire urban area. While some experts zoom in on specific industries, we incorporate multiple elements like industrial progress, policy influence, and regional collaboration. Our findings highlight the crucial role of regional cooperation and policy support in boosting green innovation efficiency, echoing the conclusions of many experts but providing more in-depth regional insights. We have found significant disparities in green innovation efficiency across different cities in the region, mirroring patterns seen by scholars in other urban clusters. However, our research not only points out these differences but also investigates the underlying causes, such as differences in industrial structure, resource availability, and policy enforcement. This thorough analysis enables us to offer specific policy recommendations to enhance regional green innovation efficiency. Additionally, our study underscores the importance of a coordinated approach to green innovation, a topic not extensively covered in previous research. While some studies have mentioned the significance of regional cooperation, we present a detailed framework for implementing it effectively. For example, we suggest forming joint innovation platforms and optimizing resource distribution as key strategies to boost regional green innovation efficiency. This aligns with the broader academic trend that acknowledges the importance of regional integration in pursuing sustainable development goals.
As time goes on, various factors could cause future case studies to diverge from the findings of this research. Advancements in technology are expected to have a major impact on research results. Emerging green technologies, such as more efficient clean energy systems and advanced pollution management solutions, may reshape how industrial green innovation is undertaken. Companies in the future might lean more heavily on these innovative green technologies rather than relying solely on the traditional methods of upgrading existing technologies. By contrast, this study focuses on evaluating current technological standards and industrial frameworks. Changes in policy will also play a significant role. Governments may shift their approach to environmental protection and sustainable industrial development, potentially enacting stricter environmental regulations or offering stronger incentives for green innovation. Such changes would push companies to adopt different strategies, leading to case studies in the future showing varied results in corporate behavior and innovation outcomes. Additionally, the dynamics of economic globalization could exert further influence. With stronger global economic ties, industries in the Beijing–Tianjin–Hebei region might encounter more intense international competition and collaboration. This would prompt businesses to prioritize aligning their green innovation efforts with international standards and market requirements. Future case studies might uncover a greater emphasis on international strategies for green innovation, offering a clear contrast to the regional innovation dynamics discussed in this study.

5. Conclusions and Suggestions

5.1. Conclusions

This study examines panel data collected from 13 key urban centers over a five-year period, from 2018 to 2022. Utilizing advanced methodologies such as the global super-efficiency SBM model and the coupled coordination degree model, the research assesses the effectiveness of green development initiatives, the pace of innovative expansion, and the interplay between green innovation in the Beijing–Tianjin–Hebei area. Drawing on these analytical frameworks, the results highlight several key insights:
(1)
The Beijing–Tianjin–Hebei area continues to advance in sustainable growth, achieving yearly efficiency gains, yet noticeable gaps persist among its cities. Notably, Beijing, Tianjin, Chengde, and Baoding stand out as frontrunners in green development efficiency, setting a benchmark that should be upheld to continue driving progress. Meanwhile, cities like Shijiazhuang, Langfang, Cangzhou, Tangshan, and Qinhuangdao are holding their ground with stable performance, yet they have considerable potential to elevate their efforts. On the flip side, Zhangjiakou, Hengshui, Xingtai, and Handan lag behind, largely due to their high population density and unsustainable levels of resource consumption, which pose significant challenges to their green development goals.
(2)
The Beijing–Tianjin–Hebei area is advancing steadily in sustainable practices, with annual efficiency gains, yet intercity differences persist. Notably, Beijing, Tianjin, Chengde, and Baoding stand out as frontrunners in green development efficiency, setting a benchmark that should be upheld to continue driving progress. Meanwhile, cities like Shijiazhuang, Langfang, Cangzhou, Tangshan, and Qinhuangdao are holding their ground with stable performance, yet they have considerable potential to elevate their efforts. On the flip side, Zhangjiakou, Hengshui, Xingtai, and Handan lag behind, largely due to their high population density and unsustainable levels of resource consumption, which pose significant challenges to their green development goals. The innovation development efficiency is relatively high in Beijing, Tianjin, Shijiazhuang, and Langfang. This is closely related to their industrial structures, educational resources, and policy support. Zhangjiakou, Baoding, Cangzhou, Tangshan, and Qinhuangdao still need further improvement in this regard. The innovation development efficiency in Chengde, Hengshui, Xingtai, and Handan is too low. It is necessary to adjust their industrial structures and corresponding government support in a timely manner. It has also been found that the innovation development efficiency in the northern region is significantly better than that in the southern region. The northern region mainly revolves around Beijing to drive the development of innovation and technology in surrounding cities.
(3)
The Beijing–Tianjin–Hebei region demonstrates a notably strong green innovation impact, operating at a high level of coordinated quality. That said, the degree of green innovation synergy varies significantly across cities within the region. Cities like Chengde, Baoding, Qinhuangdao, Langfang, and Cangzhou exhibit moderate levels of green innovation coordination, indicating a pressing need to ramp up collaborative efforts and advancements in green technology. On the other hand, Beijing, Tianjin, Tangshan, and Shijiazhuang consistently maintain a high coupling degree of green innovation, showcasing their robust integration in this area. In contrast, Handan and Hengshui lag behind, with persistently low levels of green innovation synergy, highlighting a stark deficit in technological advancement. Broadly speaking, the southern part of the region has considerable room for improvement, signaling untapped potential for progress.
To put it simply, the varying industrial frameworks, natural resource availability, economic growth stages, and policy execution across cities in the Beijing–Tianjin–Hebei area have created stark disparities in how efficiently they pursue green development, foster innovation, and align these two priorities. These gaps highlight the uneven progress in balancing sustainability and technological advancement within the region. Understanding these differences and their causes is the basis for formulating targeted policies and promoting regional sustainable development.

5.2. Suggestions

This document aims to advance the synchronized growth of eco-friendly innovation in the Beijing–Tianjin–Hebei area by proposing these recommendations at the policy, enterprise, and social tiers:
(1) Suggestions at the policy level: Initially, the government should formulate and refine policies that foster green innovation, alongside implementing targeted supportive initiatives. A dedicated fund will be established to offer financial subsidies to green innovation projects, thereby alleviating the research and development expenses for businesses. Companies that adhere to green innovation benchmarks will receive tax incentives, and they will be encouraged to augment their investment in research and development. Secondly, the government will enhance its legal framework by enacting stricter environmental regulations, setting clear emission reduction goals for businesses, and intensifying environmental oversight. The government should strengthen the intellectual property rights protection system to safeguard the legitimate interests of green innovation outcomes. The government should also foster regional collaborative innovation by establishing a regional coordination mechanism and optimizing resource distribution. Additionally, the government should create a joint innovation platform for Beijing, Tianjin, and Hebei to encourage technological exchange and resource sharing. It is essential to encourage and support cross-regional green innovation initiatives to leverage complementary strengths. Lastly, the government should refine the industrial structure by tailoring it to the unique resource endowment and industrial foundations of each city. This approach will help prevent redundant construction and conserve resources. Additionally, the government should promote collaborative infrastructure development, strengthening the joint construction and shared utilization of transportation, energy, information, and other critical infrastructure sectors. By doing so, the overall regional competitiveness can be significantly enhanced.
(2) Enterprise-level suggestions: Firstly, enterprises must intensify their efforts in technological research and development, as well as in the application of emerging technologies. It is imperative for companies to bolster their innovation capabilities, ramp up investments in research and development, recruit and cultivate high-caliber talent, and thereby enhance their capacity for independent innovation. Secondly, enterprises should proactively adopt foreign advanced green technologies and management expertise to accelerate technological advancements. They should promote green production practices by implementing cleaner production technologies, thereby reducing pollutant emissions and enhancing resource utilization rates. Furthermore, enterprises should embrace the circular economy model to facilitate resource recycling and minimize waste generation. Establishing a green supply chain is also crucial; this involves prioritizing the use of environmentally friendly materials and green products to encourage suppliers to enhance their environmental standards. Additionally, optimizing logistics and transportation methods is essential to decrease energy consumption and emissions during the transportation process. Lastly, enterprises should reinforce their commitment to social responsibility. It is essential for companies to regularly publish environmental reports, disclose their environmental performance, and submit to societal oversight. By actively engaging in community environmental initiatives, enterprises can bolster their social standing and brand value.
(3) Social suggestions: To begin with, the government aims to enhance public awareness of environmental protection. It plans to implement environmental education in schools, fostering a sense of environmental stewardship in students from a young age. Through various channels, including the media and the Internet, the government should seek to disseminate knowledge about environmental conservation, thereby elevating the public’s understanding of its importance. Additionally, the government should encourage community involvement in voluntary environmental services, promoting collective efforts to sustain a healthy ecological environment. Secondly, the government should promote the concept of green consumption, guiding consumers toward environmentally friendly products and services. Establishing a varied eco-friendly financial system is equally crucial. Consequently, various banks and financial entities have launched eco-friendly loan offerings to meet the funding needs of green innovation initiatives. Lastly, the government should establish a risk-sharing mechanism to mitigate the financing costs and risks associated with green projects. By fostering the green bond market, the government aims to enhance investors’ awareness and participation in green bonds.
Effective policies implemented in the Yangtze River Delta and Pearl River Delta regions have achieved remarkable results in environmental sustainability and economic integration. These protocols could facilitate the sharing of resources, technologies, and best practices among cities in the Beijing–Tianjin–Hebei region. The government should suggest the establishment of a joint planning committee including representatives from Beijing, Tianjin, and Hebei. These committees could oversee the implementation of regional development plans and ensure coordination in areas such as transport, energy, and environmental policy. Also, it should encourage the development of science and technology parks like those in the Pearl River Delta region. These parks can serve as a hub for innovation and technology transfer to attract domestic and foreign high-tech companies. The government should implement an emissions trading system similar to that in the Pearl River Delta region. This system can provide an economic incentive for industries to reduce emissions and improve their environmental performance. The government should develop green finance programs to support environmental projects. This could include building green banks and issuing green bonds, as seen in other successful regions. The government should develop a comprehensive transportation network connecting Beijing, Tianjin, and Hebei Province. This can include high-speed railways, urban metro systems, and an efficient road network, similar to infrastructure development in the Yangtze River Delta region.
In light of the above analysis, the government should enact policies tailored to the specific circumstances of each city. For example, in Beijing and Tianjin, policies should be further strengthened to maintain their leading positions and promote the sharing of their experience and technology within the region. Specific support policies should be formulated for cities with relatively low efficiency and poor coordination, such as Handan and Hengshui. For instance, financial backing should be ramped up to facilitate the modernization and evolution of conventional industries in these urban areas, incentivize the adoption of cutting-edge eco-friendly technologies and the recruitment of skilled professionals, and bolster their capacity for sustainable innovation. Simultaneously, the government ought to bolster regional collaboration frameworks, encourage the seamless exchange of resources and cutting-edge technologies across urban centers, and work to bridge the disparities in green innovation progress between cities.

Author Contributions

Conceptualization, H.W.; methodology, H.W. and X.W.; writing—original draft preparation, H.W. and X.W.; writing—review and editing, H.W. All authors have read and agreed to the published version of the manuscript.

Funding

The work was supported by the National Social Science Fund of China [23&ZD068]; Planning Fund for Humanities and Social Sciences Research of the Ministry of Education [24YJA630122].

Institutional Review Board Statement

Not applicable.

Informed Consent Statement

Not applicable.

Data Availability Statement

The data used to support the findings of this study are available from the corresponding author upon request.

Conflicts of Interest

The authors declare that they have no conflicts of interest.

References

  1. Peng, J.; Chen, X.; Liu, Y.; Lü, H.; Hu, X. Spatial identification of multifunctional landscapes and associated influencing factors in the Beijing-Tianjin-Hebei region, China. Appl. Energy 2016, 74, 170–181. [Google Scholar] [CrossRef]
  2. Zhang, D.; Huang, Q.; He, C.; Wu, J. Impacts of urban expansion on ecosystem services in the Beijing-Tianjin-Hebei urban agglomeration, China: A scenario analysis based on the Shared Socioeconomic Pathways. Resour. Conserv. Recycl. 2017, 125, 115–130. [Google Scholar] [CrossRef]
  3. Xu, D.; Li, C.; Song, X.; Ren, H. The dynamics of desertification in the farming-pastoral region of North China over the past 10years and their relationship to climate change and human activity. Catena 2014, 123, 11–22. [Google Scholar] [CrossRef]
  4. Wang, Q.; Qu, J.; Wang, B.; Wang, P.; Yang, T. Green technology innovation development in China in 1990–2015. Sci. Total Environ. 2019, 696, 134008. [Google Scholar] [CrossRef] [PubMed]
  5. Song, M.; Wang, S.; Zhang, H. Could environmental regulation and R&D tax incentives affect green product innovation? J. Clean. Prod. 2020, 258, 120849. [Google Scholar]
  6. Fang, G.; Wang, Q.; Tian, L. Green development of Yangtze River Delta in China under Population-Resources-Environment-Development-Satisfaction perspective. Sci. Total Environ. 2020, 727, 138710. [Google Scholar] [CrossRef]
  7. Ran, Q.; Yang, X.; Yan, H.; Xu, Y.; Cao, J. Natural resource consumption and industrial green transformation: Does the digital economy matter? Resour. Policy 2023, 81, 103396. [Google Scholar] [CrossRef]
  8. Dahesh, M.B.; Tabarsa, G.; Zandieh, M.; Hamidizadeh, M. Reviewing the intellectual structure and evolution of the innovation systems approach: A social network analysis. Technol. Soc. 2020, 63, 101399. [Google Scholar] [CrossRef]
  9. Du, K.; Li, J. Towards a green world: How do green technology innovations affect total-factor carbon productivity. Energy Policy 2019, 131, 240–250. [Google Scholar] [CrossRef]
  10. Li, G.; Wang, X.; Wu, J. How scientific researchers form green innovation behavior: An empirical analysis of China’s enterprises. Technol. Soc. 2019, 56, 134–146. [Google Scholar] [CrossRef]
  11. Luo, Q.; Miao, C.; Sun, L.; Meng, X.; Duan, M. Efficiency evaluation of green technology innovation of China’s strategic emerging industries: An empirical analysis based on Malmquist-data envelopment analysis index. J. Clean. Prod. 2019, 238, 117782. [Google Scholar] [CrossRef]
  12. Abdul-Nasser, E.K.; Sanjay, K.S. Green innovation and organizational performance: The influence of big data and the moderating role of management commitment and HR practices. Technol. Forecast. Soc. Change 2019, 144, 483–498. [Google Scholar]
  13. Reza, K.M.; Reza, F.S.; Mark, G. Joint analysis of eco-efficiency and eco-innovation with common weights in two-stage network DEA: A big data approach. Technol. Forecast. Soc. Change 2019, 144, 553–562. [Google Scholar]
  14. Claire, B. Green innovation and green Imports:Links between environmental policies, innovation, and production. J. Environ. Manag. 2019, 248, 109290. [Google Scholar]
  15. Fan, F.; Lian, H.; Liu, X.; Wang, X. Can environmental regulation promote urban green innovation Efficiency? An empirical study based on Chinese cities. J. Clean. Prod. 2021, 287, 122303. [Google Scholar] [CrossRef]
  16. Dong, F.; Li, Y.; Qin, C.; Sun, J. How industrial convergence affects regional green development efficiency: A spatial conditional process analysis. J. Environ. Manag. 2021, 300, 113738. [Google Scholar] [CrossRef]
  17. Hong, W. Trade openness, green finance and natural resources: A literature review. Resour. Policy 2022, 78, 102801. [Google Scholar]
  18. Fan, F.; Zhang, X. Transformation effect of resource-based cities based on PSM-DID model: An empirical analysis from China. Environ. Impact Assess. Rev. 2021, 91, 106648. [Google Scholar] [CrossRef]
  19. Ma, S.; Ding, W.; Liu, Y.; Zhang, Y.; Ren, S.; Kong, X.; Leng, J. Industry 4.0 and cleaner production: A comprehensive review of sustainable and intelligent manufacturing for energy-intensive manufacturing industries. J. Clean. Prod. 2024, 467, 142879. [Google Scholar] [CrossRef]
  20. Ma, S.; Ding, W.; Liu, Y.; Ren, S.; Yang, H. Digital twin and big data-driven sustainable smart manufacturing based on information management systems for energy-intensive industries. Appl. Energy 2022, 326, 119986. [Google Scholar] [CrossRef]
  21. Wu, J.; Wang, S.; Zhang, R.; Zhao, M.; Sun, X.; Qie, X.; Wang, Y. Measurement of green innovation efficiency in Chinese listed energy-intensive enterprises based on the three stage Super-SBM model. Int. Rev. Econ. Financ. 2025, 97, 103819. [Google Scholar] [CrossRef]
  22. He, F.; Hu, J.L.; Chen, L. The Effect of Financial Development on Industrial Green Technology Innovation Efficiency: Experience Analysis from 288 Cities in China. Sustainability 2024, 16, 5619. [Google Scholar] [CrossRef]
  23. Lu, P.; Li, Z.; Wu, H. Investigating the effects of industrial transformation and agglomeration on industrial eco-efficiency for green development: Evidence from enterprises in the Yangtze River Economic Belt. J. Clean. Prod. 2024, 479, 143949. [Google Scholar] [CrossRef]
  24. Li, S.; Shangguan, L. Has the Policy of National Agricultural Green Development Pilot Zones Enhanced the Agricultural Eco-Efficiency? Observation Based on the County-Level Data from Hubei Province of China. Sustainability 2024, 16, 9265. [Google Scholar] [CrossRef]
  25. Chen, C.; Han, J.; Fan, P. Measuring the Level of Industrial Green Development and Exploring Its Influencing Factors: Empirical Evidence from China’s 30 Provinces. Sustainability 2016, 8, 153. [Google Scholar] [CrossRef]
  26. Li, G.; Li, X.; Huo, L. Digital economy, spatial spillover and industrial green innovation efficiency: Empirical evidence from China. Heliyon 2023, 9, e12875. [Google Scholar] [CrossRef]
  27. Yang, Y.; Wang, Y. Research on the Impact of Environmental Regulations on the Green Innovation Efficiency of Chinese Industrial Enterprises. Pol. J. Environ. Stud. 2021, 30, 1433–1445. [Google Scholar] [CrossRef]
  28. Zhao, Y.; Hong, F. Research on green productivity of Chinese real estate companies—Based on SBM-DEA and TOBIT models. Sustainability 2020, 12, 3122. [Google Scholar] [CrossRef]
  29. Luo, Y.; Lu, Z.; Wu, C. Can internet development accelerate the green innovation efficiency convergence: Evidence from China. Technol. Forecast. Soc. Change 2023, 189, 122352. [Google Scholar] [CrossRef]
  30. Liu, B.; Wang, Y.; Jiang, N.; Zhang, X. The impact of digital industrialization and industrial digitalization on regional green innovation efficiency in China—From the perspective of the innovation value chain. J. Clean. Prod. 2024, 478, 144015. [Google Scholar] [CrossRef]
  31. Liu, X.; Cifuentes-Faura, J.; Yang, X.; Pan, J. The green innovation effect of industrial robot applications: Evidence from Chinese manufacturing companies. Technol. Forecast. Soc. Change 2025, 210, 123904. [Google Scholar] [CrossRef]
  32. Cao, Y.; Chen, S.; Tang, H. Robot adoption and firm export: Evidence from China. Technol. Forecast. Soc. Change 2025, 210, 123878. [Google Scholar] [CrossRef]
  33. Zeira, J. Workers, machines, and economic growth. Q. J. Econ. 1998, 113, 1091–1117. [Google Scholar] [CrossRef]
  34. Georg, G.; Guy, M. Robots at Work. Rev. Econ. Stat. 2018, 100, 753–768. [Google Scholar]
  35. Acemoglu, D.; Pascual, R. The Race between Man and Machine: Implications of Technology for Growth, Factor Shares, and Employment. Am. Econ. Rev. 2018, 108, 1488–1542. [Google Scholar] [CrossRef]
  36. Ibrahim, A. Evaluating efficiency of green innovations and renewables for sustainability goals. Renew. Sustain. Energy Rev. 2025, 209, 115137. [Google Scholar]
  37. Feng, S.; Chong, Y.; Yu, H.; Ye, X.; Li, G. Digital financial development and ecological footprint: Evidence from green-biased technology innovation and environmental inclusion. J. Clean. Prod. 2022, 380, 135069. [Google Scholar] [CrossRef]
  38. Rong, J.; Hong, J.; Guo, Q.; Fang, Z.; Chen, S. Path mechanism and spatial spillover effect of green technology innovation on agricultural CO2 emission intensity: A case study in Jiangsu Province, China. Ecol. Indic. 2023, 157, 111147. [Google Scholar] [CrossRef]
  39. Manigandan, P.; Alam, M.S.; Murshed, M.; Ozturk, I.; Altuntas, S.; Alam, M.M. Promoting sustainable economic growth through natural resources management, green innovations, environmental policy deployment, and financial development: Fresh evidence from India. Resour. Policy 2024, 90, 104681. [Google Scholar] [CrossRef]
  40. Song, M.; Peng, L.; Shang, Y.; Zhao, X. Green technology progress and total factor productivity of resource-based enterprises: A perspective of technical compensation of environmental regulation. Technol. Forecast. Soc. Change 2022, 174, 121276. [Google Scholar] [CrossRef]
  41. Jiang, H.; Sun, T. Unravelling the impact pathways of green innovation and environmental regulation on China’s green development efficiency goals: Direct and spillover effects. Ecol. Indic. 2024, 168, 112713. [Google Scholar] [CrossRef]
  42. Shu, T.; Liao, X.; Yang, S.; Yu, T. Towards sustainability: Evaluating energy efficiency with a super-efficiency SBM-DEA model across 168 economies. Appl. Energy 2024, 376, 124254. [Google Scholar] [CrossRef]
  43. Storto, C.L. Measuring the eco-efficiency of municipal solid waste service: A fuzzy DEA model for handling missing data. Util. Policy 2024, 86, 101706. [Google Scholar] [CrossRef]
  44. Liu, X.; Wu, X.; Zhang, W. A new DEA model and its application in performance evaluation of scientific research activities in the universities of China’s double first-class initiative. Socio-Econ. Plan. Sci. 2024, 92, 101839. [Google Scholar] [CrossRef]
  45. Karagiannis, G.; Tzouvelekas, V.; Xepapadeas, A. Measuring irrigation water efficiency with a stochastic production frontier. Environ. Resour. Econ. 2003, 26, 57–72. [Google Scholar] [CrossRef]
  46. Chung, Y.H.; Fare, R.; Grosskopf, S. Productivity and Undesirable Outputs: A Directional Distance Function Approach. J. Environ. Manag. 1997, 51, 229–240. [Google Scholar] [CrossRef]
  47. Fare, R.; Grosskopf, S.; Pasurka, J. Accounting for Air Pollution Emissions in Measures of State Manufacturing Productivity Growth. J. Reg. Sci. 2001, 41, 381–409. [Google Scholar] [CrossRef]
  48. Tone, K. A Slacks—Based Measure of Efficiency in Data Envelop-ment Analysis. Eur. J. Oper. Res. 2001, 130, 498–509. [Google Scholar] [CrossRef]
  49. Zhou, J.; Bai, X.; Tian, J. Study on the impact of electric power and thermal power industry of Beijing–Tianjin–Hebei region on industrial sulfur dioxide emissions—From the perspective of green technology innovation. Energy Rep. 2022, 8, 837–849. [Google Scholar] [CrossRef]
  50. Wang, K.; Ma, H. Does urban technological innovation and cooperation promote its green development? Evidence from cities in the Beijing-Tianjin-Hebei urban agglomeration, China. J. Geogr. Sci. 2024, 34, 1977–2002. [Google Scholar] [CrossRef]
  51. Wang, M.; Li, Y.; Li, J.; Wang, Z. Green process innovation, green product innovation and its economic performance improvement paths: A survey and structural model. J. Environ. Manag. 2021, 297, 113282. [Google Scholar] [CrossRef] [PubMed]
  52. Liu, H.; Cai, X.; Zhang, Z.; Wang, D. Can green technology innovations achieve the collaborative management of pollution reduction and carbon emissions reduction? Evidence from the Chinese industrial sector. Environ. Res. 2025, 264, 120400. [Google Scholar] [CrossRef]
  53. Yang, L.; Li, Z. Technology advance and the carbon dioxide emission in China—Empirical research based on the rebound effect. Energy Policy 2017, 101, 150–161. [Google Scholar] [CrossRef]
  54. Mirata, M.; Emtairah, T. Industrial symbiosis networks and the contribution to environmental innovation: The case of the Landskrona industrial symbiosis programme. J. Clean. Prod. 2005, 13, 993–1002. [Google Scholar] [CrossRef]
  55. Morgado, A.O.; Gauch, H.; Cullen, J.M. Resource Efficiency as an environmental performance metric for industry: Exergetic analysis of a clinker manufacturing plant. J. Clean. Prod. 2024, 484, 144352. [Google Scholar] [CrossRef]
  56. Liu, Y.; Yang, R.; Sun, M.; Zhang, L.; Li, X.; Meng, L.; Wang, Y.; Liu, Q. Regional sustainable development strategy based on the coordination between ecology and economy: A case study of Sichuan Province, China. Ecol. Indic. 2022, 134, 108445. [Google Scholar] [CrossRef]
  57. Griffiths, S.; Sovacool, B.K.; Kim, J.; Bazilian, M.; Uratani, J.M. Industrial decarbonization via hydrogen: A critical and systematic review of developments, socio-technical systems and policy options. Energy Res. Soc. Sci. 2021, 80, 102208. [Google Scholar] [CrossRef]
  58. Ahmad, T.; Madonski, R.; Zhang, D.; Huang, C.; Mujeeb, A. Data-driven probabilistic machine learning in sustainable smart energy/smart energy systems: Key developments, challenges, and future research opportunities in the context of smart grid paradigm. Renew. Sustain. Energy Rev. 2022, 160, 112128. [Google Scholar] [CrossRef]
  59. Andersen, P.; Petersen, N.C. A procedure for ranking efficient units in data envelopment analysis. Manag. Sci. 1993, 39, 1261–1264. [Google Scholar] [CrossRef]
  60. Oh, D.H. A global Malmquist—Luenberger productivity index. J. Prod. Anal. 2010, 34, 183–197. [Google Scholar] [CrossRef]
Figure 1. Green innovation in the Beijing–Tianjin–Hebei city cluster and coordinated regional development.
Sustainability 17 01244 g001
Figure 2. Spatial distribution of green development efficiency in 13 important cities in Beijing, Tianjin, and Hebei from 2018 to 2022.
Sustainability 17 01244 g002
Figure 3. Spatial distribution of innovation development efficiency in 13 important cities in Beijing, Tianjin and Hebei from 2018 to 2022.
Sustainability 17 01244 g003
Figure 4. Spatial distribution of coordinated coupling degree of green innovation in 13 important cities in the Beijing–Tianjin–Hebei region from 2018 to 2022.
Sustainability 17 01244 g004
Figure 5. Dynamic evolution of the distribution in the Beijing–Tianjin–Hebei region. (A): Green development efficiency. (B): Innovation development efficiency. (C): Coupling and coordination of green innovation).
Sustainability 17 01244 g005
Figure 6. Spatial–temporal distribution characteristics of green development efficiency in the Beijing–Tianjin–Hebei region.
Sustainability 17 01244 g006
Figure 7. Spatial–temporal distribution characteristics of innovation and development efficiency in the Beijing–Tianjin–Hebei region.
Sustainability 17 01244 g007
Figure 8. Spatial–temporal patterns of green innovation coupling coordination in the Beijing–Tianjin–Hebei area.
Sustainability 17 01244 g008
Table 1. Efficiency index system of industrial green development.
Index LevelIndicator TypeBasic IndicatorsUnit
Input elementsIndustrial labor forceThe average user count for industrial firms exceeding the specified size thresholdThousands of people
Stock of industrial capitalThe whole social industrial fixed capital stockCNY 10,000
Industrial energy consumptionIndustrial energy consumptionTen thousand tons of standard media
Expected outputTotal industrial outputThe value of sales output for industrial entities exceeding a specified sizeCNY 10,000
Undesired outputIndustrial wastewaterThe total quantity of industrial wastewater dischargedTen thousand tons
Industrial waste gasTotal industrial sulfur dioxide emissionsTen thousand tons
Industrial solid wasteEmissions of soot from industryTen thousand tons
Table 2. Efficiency index system of industrial innovation and development.
Index LevelIndicator TypeBasic IndicatorsUnit
Innovation investmentHuman inputResearch and development staff at industrial companies exceeding a specified sizePeople
Asset investmentResearch and development capital reserves for industrial entities exceeding a specified sizeCNY 10,000
Innovative outputPart of the outputThe count of patent filings submitted by industrial companies exceeding a specified sizePieces
Gross outputRevenue generated from selling new items by industrial companies exceeding a specified sizeCNY 10,000
Table 3. A categorization of the relationship and alignment between the efficiency of industrial green development and the efficiency of industrial innovation.
Disorder recession range
D < 0.4
Excessive reconciliation interval
0.4 ≤ D < 0.6
Coordinated development range
D > 0.6
Extreme disorder and recessionExtreme disorder and recessionExtreme disorder and recessionExtreme disorder and recessionExtreme disorder and recessionManage with an effort
coordinate
Elementary
coordinate
Middle-rank
coordinate
Good
coordinate
High-quality
coordinate
<0.10.1~0.20.2~0.30.3~0.40.4~0.50.5~0.60.6~0.70.7~0.80.8~0.9>0.9
Table 4. The green development efficiency of 13 key cities in the Beijing–Tianjin–Hebei region from 2018 to 2022.
City20182019202020212022Mean Value
Beijing1.22211.38611.43361.47521.54111.4116
Tianjin1.13991.19211.21831.24191.29121.2167
Shijiazhuang0.88211.0151.14811.17391.20771.0854
Tangshan1.08691.09111.11071.17271.19981.1322
Qinhuangdao1.01121.09851.11511.13041.16341.1037
Handan0.75810.77780.84610.93110.98360.8593
Xingtai0.77780.80320.89310.95511.02640.8911
Baoding1.09211.11891.14411.19841.27411.1655
Zhangjiakou0.81120.97220.99731.04991.11790.9897
Chengde1.09281.10851.11251.16671.21771.1396
Cangzhou1.01421.04621.11811.14161.24021.1121
Langfang0.82381.07011.09581.10271.17761.0541
Hengshui0.88080.93170.97441.05211.13930.9957
Mean value0.96871.04711.09291.13781.19851.0891
Table 5. Measurement results of innovation development efficiency of 13 important cities in Beijing, Tianjin, and Hebei from 2018 to 2022.
City20182019202020212022Mean Value
Beijing1.47091.57611.63311.83241.94961.6924
Tianjin1.21891.32151.39231.46111.55811.3904
Shijiazhuang1.06891.109611.16471.22461.29971.1735
Tangshan0.94080.99531.02981.11931.18421.0539
Qinhuangdao0.88190.95540.95641.05291.16621.0026
Handan0.80330.81990.85920.92690.94260.8704
Xingtai0.83330.85940.89820.92061.03220.9087
Baoding0.89970.91710.97681.03311.09760.9849
Zhangjiakou0.78660.92720.99611.01231.14650.9737
Chengde0.76370.87910.98351.03511.09560.9514
Cangzhou0.89030.89570.93130.99591.04930.9525
Langfang0.92090.96961.08681.15871.22721.0726
Hengshui0.85140.86980.88180.92850.99630.9056
Mean value0.94851.00731.06081.13091.21111.0717
Table 6. Calculation results of green innovation coordinated coupling degree in 13 important cities in the Beijing–Tianjin–Hebei region from 2018 to 2022.
City20182019202020212022Mean Value
Beijing1.15791.21581.23711.28221.31661.2419
Tianjin1.08571.12031.14121.16061.19111.1398
Shijiazhuang0.98541.03021.07531.09511.11931.0611
Tangshan1.00561.02081.03421.07041.09181.0446
Qinhuangdao0.97181.01221.01621.04451.07931.0248
Handan0.88340.89360.92340.96380.98130.9291
Xingtai0.89730.91150.94640.96831.01450.9476
Baoding0.99561.00651.02821.05481.08751.0345
Zhangjiakou0.89380.97440.99831.01531.06410.9892
Chengde0.95580.99361.02271.04831.07471.0191
Cangzhou0.97480.98391.01021.03261.06811.0139
Langfang0.93331.00931.04461.06321.09641.0294
Hengshui0.93060.94880.96280.99421.03220.9737
Mean value0.97471.00931.03391.06111.09361.0345
Disclaimer/Publisher’s Note: The statements, opinions and data contained in all publications are solely those of the individual author(s) and contributor(s) and not of MDPI and/or the editor(s). MDPI and/or the editor(s) disclaim responsibility for any injury to people or property resulting from any ideas, methods, instructions or products referred to in the content.

