Article

Toward Sustainable Development: The Impact of Green Fiscal Policy on Green Total Factor Productivity

School of Government, University of International Business and Economics, Beijing 100029, China
*
Author to whom correspondence should be addressed.
Sustainability 2025, 17(3), 1050; https://doi.org/10.3390/su17031050
Submission received: 17 December 2024 / Revised: 18 January 2025 / Accepted: 25 January 2025 / Published: 27 January 2025
(This article belongs to the Section Sustainable Management)

Abstract

:
Green fiscal policy draws worldwide attention from policymakers as a potential mechanism that contributes to sustainable development. However, although many studies have discussed the economic consequences of green fiscal policy, there is still a lack of studies that systematically quantify the productivity impacts of green fiscal policy. Therefore, to fill this gap, China’s Energy Conservation and Emission Reduction Fiscal Policy Pilot (ECER) and difference-in-differences (DID) identification method were chosen to explore the impact of green fiscal policy on green total factor productivity (GTFP). We find that ECER significantly enhances urban GTFP, and it holds after a series of robustness tests. Moreover, we explore the mediating mechanisms that may explain this effect: government environmental regulation, green technology innovation, and industrial structure optimization. Further analysis shows that the positive effect of ECER is more significant when (1) government transparency is high; (2) government financial autonomy is high; (3) government digital transformation is high; (4) the city’s resource endowment is high; and (5) the city’s economic development level is high. Overall, our study provides new insights into the economic consequences of green fiscal policy.

1. Introduction

Sustainable development is the general consensus for addressing the problems of environmental damage and energy consumption. As an economic development model, it advocates reducing resource consumption to meet the resource needs of the next generation while developing the economy to meet the needs of the present generation. Enhancing green total factor productivity (GTFP) is an important means of realizing sustainable development because higher GTFP means less resource input and more economic output with less environmental damage [1], which also means maintaining a certain rate of economic growth without over-consuming ecological resources. Although China elevated sustainable development to a national strategy as early as 1994 and proposed efforts to improve factor productivity, local governments have had difficulty implementing it. This is because the key to improving GTFP lies in technological innovation and talent training, both of which require large amounts of financial support, which will undoubtedly increase the financial pressure and risk of local governments. Under such circumstances, “rational” officials tend to underinvest in GTFP-enhancing activities, preferring instead to invest in energy-consuming and polluting activities [2,3], which can help them rapidly develop the economy during their term of office and thus achieve political advancement. In reality, therefore, boosting GTFP is often difficult to achieve due to the lack of sufficient incentives.
As climate deterioration and energy consumption intensify, green fiscal policy has gradually attracted the attention of scholars from various countries as a potential tool for solving environmental problems. A well-designed green fiscal policy can effectively promote green economic growth and thus realize ecological and environmental governance objectives [4,5]. As for the explanation, it may be due to the negative externality of environmental damage, and if property rights are not clearly defined, then the market will not actively internalize this negative externality, which will in turn lead to environmental pollution problems. In this case, policies with interventionist features, such as environmental taxes, improve environmental quality by clarifying property rights on environmental liabilities and forcing the market to choose between high taxes and relatively low pollution treatment costs [6,7]. Similar to the promotion of green economic growth, green fiscal policy also plays an active role in reducing pollutant emissions, promoting industrial structure upgrading, facilitating green technological innovation, and reducing energy consumption [8,9]. In addition, another strand of scholars focuses on the impact of green fiscal policy on enterprise behavior and believes that green fiscal policy can help alleviate the financial pressure on enterprises, prompting them to increase R&D efforts and invest more funds in environmentally friendly technologies and green projects [10].
Overall, existing studies provide different perspectives on the economic impacts of green fiscal policies. However, the economic impacts of green fiscal policies on GTFP remain under-explored. Specifically, can green fiscal policy incentivize GTFP, and through which mechanisms does it incentivize GTFP? These are the questions this study aims to answer. To this end, China’s energy conservation and emission reduction fiscal policy pilot (ECER) was selected as an exogenous shock, combined with a multi-period difference-in-differences (DID) model to empirically test the impact of ECER on urban GTFP. It is found that ECER can effectively enhance urban GTFP. This enhancement is achieved by strengthening government environmental regulation, encouraging green technological innovation, and promoting industrial structure optimization. The effect of ECER on urban GTFP is more significant when there is a higher degree of transparency, financial autonomy, and digital transformation of the local government. In addition, ECER is able to enhance GTFP in resource-based cities and cities with high levels of economic development, while its effect on GTFP in non-resource-based cities and cities with low levels of economic development are not significant.
The possible marginal contributions of this paper are as follows. (1) This paper supplements the study on enhancing urban GTFP from the perspective of green fiscal policy. As an essential means of government macro-control, green fiscal policy can improve resource structure and regulate economic activities [5], but existing studies have ignored the positive effects of green fiscal policy that may enhance urban GTFP. This paper takes an early step in focusing on the causal relationship between ECER and GTFP at the urban level, filling a gap in the relevant research field. (2) This paper reveals the causal mechanism by which ECER enhances urban GTFP. The essence of ECER is regulation, which cannot directly enhance urban GTFP. Furthermore, we explore whether government transparency, fiscal autonomy, and digital transformation can play a moderating role. The findings contribute to a deeper understanding of the causal mechanism between green fiscal policy and urban GTFP.
The remainder of the paper is structured as follows: Section 2 presents a literature review; Section 3 outlines the policy background and theoretical assumptions; Section 4 elaborates on the research design; Section 5 details the results; Section 6 discusses the results of further empirical analysis. Finally, conclusions and policy recommendations are discussed in Section 7.

2. Literature Review

The literature related to this study focuses on two areas: the first area is GTFP measurement methods and their influencing factors. The main measurement methods are the Solow Residual Method (SRM), Stochastic Frontier Approach (SFA), and Data Envelopment Analysis (DEA) [11]. The latter two methods are more widely used. For example, Hailu and Veeman constructed the Malmquist productivity index based on the input distance function by applying the input SFA and measured the GTFP of the Canadian pulp and paper industry [12]. Zhu et al. measured the GTFP of China’s plantation industry using the SFA based on the output distance function [13]. Wang et al. used the SBM-ML model to measure the agricultural GTFP at the provincial level in China from 2004 to 2016 and found that China’s agricultural GTFP showed accelerated growth [1]. Zhong et al. constructed a three-level Metfrontier–Malmquist–Luenberger index (MML), taking negative outputs into account based on the directional distance function (DDF) to evaluate the farming GTFP from 2004 to 2018 [14]. In terms of influencing factors, it has been pointed out that technological innovation, green finance, government intervention, government concern, foreign investment, and other factors can affect GTFP. Specifically, technological innovation can significantly reduce non-expected outputs, such as pollutant emissions, by improving energy efficiency, thus effectively increasing GTFP [15]. Green finance can channel financial resources into green and low-carbon projects, improve the structure and efficiency of resource allocation, and ultimately contribute to the increase in GTFP [16]. The government can use administrative measures, financial incentives, and other interventions to make up for the shortcomings of the market, help the market economy to better allocate resources, and play a positive role in promoting urban GTFP [17]. The government’s attention determines its administrative efficiency, resource input, and supervision in environmental protection, which guides the public to enhance their awareness of environmental protection and positively affects the city’s green productivity [18]. On the one hand, foreign investment can directly introduce advanced production equipment and technology skills, and on the other hand, through spillover effects, it can transfer green management concepts and knowledge to local capitals to enhance the overall green production capacity of cities [19].
The second aspect is the policy effects of ECER. Previous studies have assessed the policy effects of ECER from various perspectives. For example, Lin and Xu empirically examined the effect of ECER on firms’ energy performance (the ratio of value output to energy consumption) using ECER as an exogenous event [20]. It is found that ECER significantly improves firms’ energy performance, mainly through two mechanisms: technological innovation and energy consumption reorganization. Fan and Liang explored the causal effects of ECER on pollutant and carbon emissions and showed that ECER can weaken the economic growth targets of local governments, promote industrial restructuring and green technological innovation, and thus reduce the total amount of pollutant and carbon emissions. This positive effect is more obvious in cities with low fiscal pressure, high inter-jurisdictional competition, and high government concern [21]. Feng and Ge constructed a dynamic model of the game between the central government, local governments, and high-pollution and high-carbon emission enterprises and analyzed the effects of the central government’s regulatory mechanism and local governments’ implementation efforts on green and low-carbon transformation. Using ECER as an entry point for empirical analysis, the authors found that the implementation capacity of local governments and the regulatory mechanism of the central government are the mechanisms by which ECER shapes the green low-carbon transition [22]. Wang et al. empirically examined the causal relationship between ECER and energy efficiency using a multi-period DID model after measuring energy efficiency using the SBM-GML model. It was found that ECER does not cause energy rebound while narrowing the energy efficiency gap, thereby providing robust empirical evidence for enhancing energy use efficiency [23].
In summary, existing studies have explored how ECER can achieve sustainable development from the perspectives of carbon emissions and energy consumption. However, despite its importance in achieving sustainable development, the existing literature does not focus on the effect of ECER on GTFP. Can ECER enhance GTFP and thus achieve sustainable development? What are the transmission mechanisms required for ECER to affect GTFP? Does ECER have similar effects in different cities? These questions remain unanswered. Therefore, this study uses panel data from 280 Chinese cities covering the period 2005 to 2021 to explore these questions.

3. Policy Background and Theoretical Hypothesis

3.1. Policy Background

The Chinese government has consistently demonstrated strong concern for environmental issues and has formulated a series of green regulations and policies. For example, the 13th National People’s Congress formally enshrined ecological civilization in the Constitution in 2018. The Law of the People’s Republic of China on the Protection of the Yangtze River came into force in 2021. The Wetland Protection Law of the People’s Republic of China came into force in 2022. In February 2019, the National Development and Reform Commission (NDRC) and other ministries and commissions jointly issued the Green Industry Guidance Catalog. In April 2019, the NDRC and the Ministry of Science and Technology (MOST) issued the Guiding Opinions on the Construction of a Market-Oriented Green Technology Innovation System.
We chose the Energy Conservation and Emission Reduction Fiscal Policy (ECER) pilot, jointly conducted by China’s Ministry of Finance and NDRC in 2011, as the policy context, with the aim of exploring its impact effect on urban GTFP. ECER selected a total of 30 cities for the pilot in 2011, 2013, and 2014. The three batches of pilots were distributed in the eastern, central, and western regions of China, and these cities have significant differences in terms of city size, level of economic development, and geographic characteristics and are therefore highly representative, typical, and demonstrative (as shown in Table 1). ECER requires that energy conservation and emission reduction be promoted systematically and holistically with the goals of industrial decarbonization, transportation cleanliness, building greening, service intensification, pollution reduction, and energy regeneration. Concurrently, it set up clear assessment indexes around the effect of reducing energy consumption, the effect of pollutant emission reduction, the construction of long-term mechanisms, the cultivation of supervisory capacity, etc., links the results of the assessment with the allocation of the comprehensive incentive funds for the next year, and makes strict provisions for the issuance and use of the comprehensive incentive funds. In addition, an exit mechanism is established. Cities that fail to complete tasks or misappropriate financial funds would be disqualified from the pilot program and all incentive funds would be withdrawn. It is foreseeable that ECER will trigger changes in the economic and social development model and have a significant and far-reaching impact on the sustainable development of the country by creating exemplary pilot cities and popularizing the advanced working experience for the whole country.

3.2. Research Hypothesis

A key challenge for sustainable development is how to overcome market failures and externalities, which require long-term and sustained intervention by well-designed government policies [24], and the government’s ability to intervene plays a crucial role in enhancing urban GTFP [17]. In terms of the actual implementation of ECER in China, government policies have mainly intervened to overcome market failures and externalities through two mechanisms: the first is the “punishment mechanism”. On the one hand, it internalizes the costs of negative externalities, such as pollution, by strengthening local governments’ taxes and fines. This forces all industry players to reduce pollution emissions and carry out green and clean production, thus eliminating high-pollution and high-emission projects in the pilot cities of ECER and developing low-energy-consumption and low-pollution projects instead. On the other hand, local governments are urged to establish stricter regulatory mechanisms and local policies to fulfill the performance and binding targets set by the central government for the ECER pilot cities, which will have a significant impact on cities’ industries in seeking cleaner and more efficient ways of production and operation [4] and thus reducing the use of fossil energy. The second is the “reward mechanism”, that is to say, on the one hand, the government employs various methods, including subsidies, direct investment, preferential policies, funding guidance, and tax regulation, and offering sustained investment and support for green, low-carbon, and environmentally friendly projects. This encourages more funds and resources to flow into areas such as low-carbon initiatives, clean production, and new energy. As a result, demonstration cities can achieve a smooth transition when engaging in the production of green products that involve high risks, significant investments, and long cycles, as well as in their transformation and upgrading processes. On the other hand, fiscal policies that invest in and support education and human capital can cultivate and attract more relevant innovative talents. This contributes to enhancing the quality of the regional workforce and also the research and development of green technologies, as well as to improving energy efficiency. It also fosters the optimization and upgrading of the cities’ industrial structure, serving as an essential catalyst in facilitating the cities’ transition toward green development [25]. Based on the above, this paper advances the subsequent hypothesis:
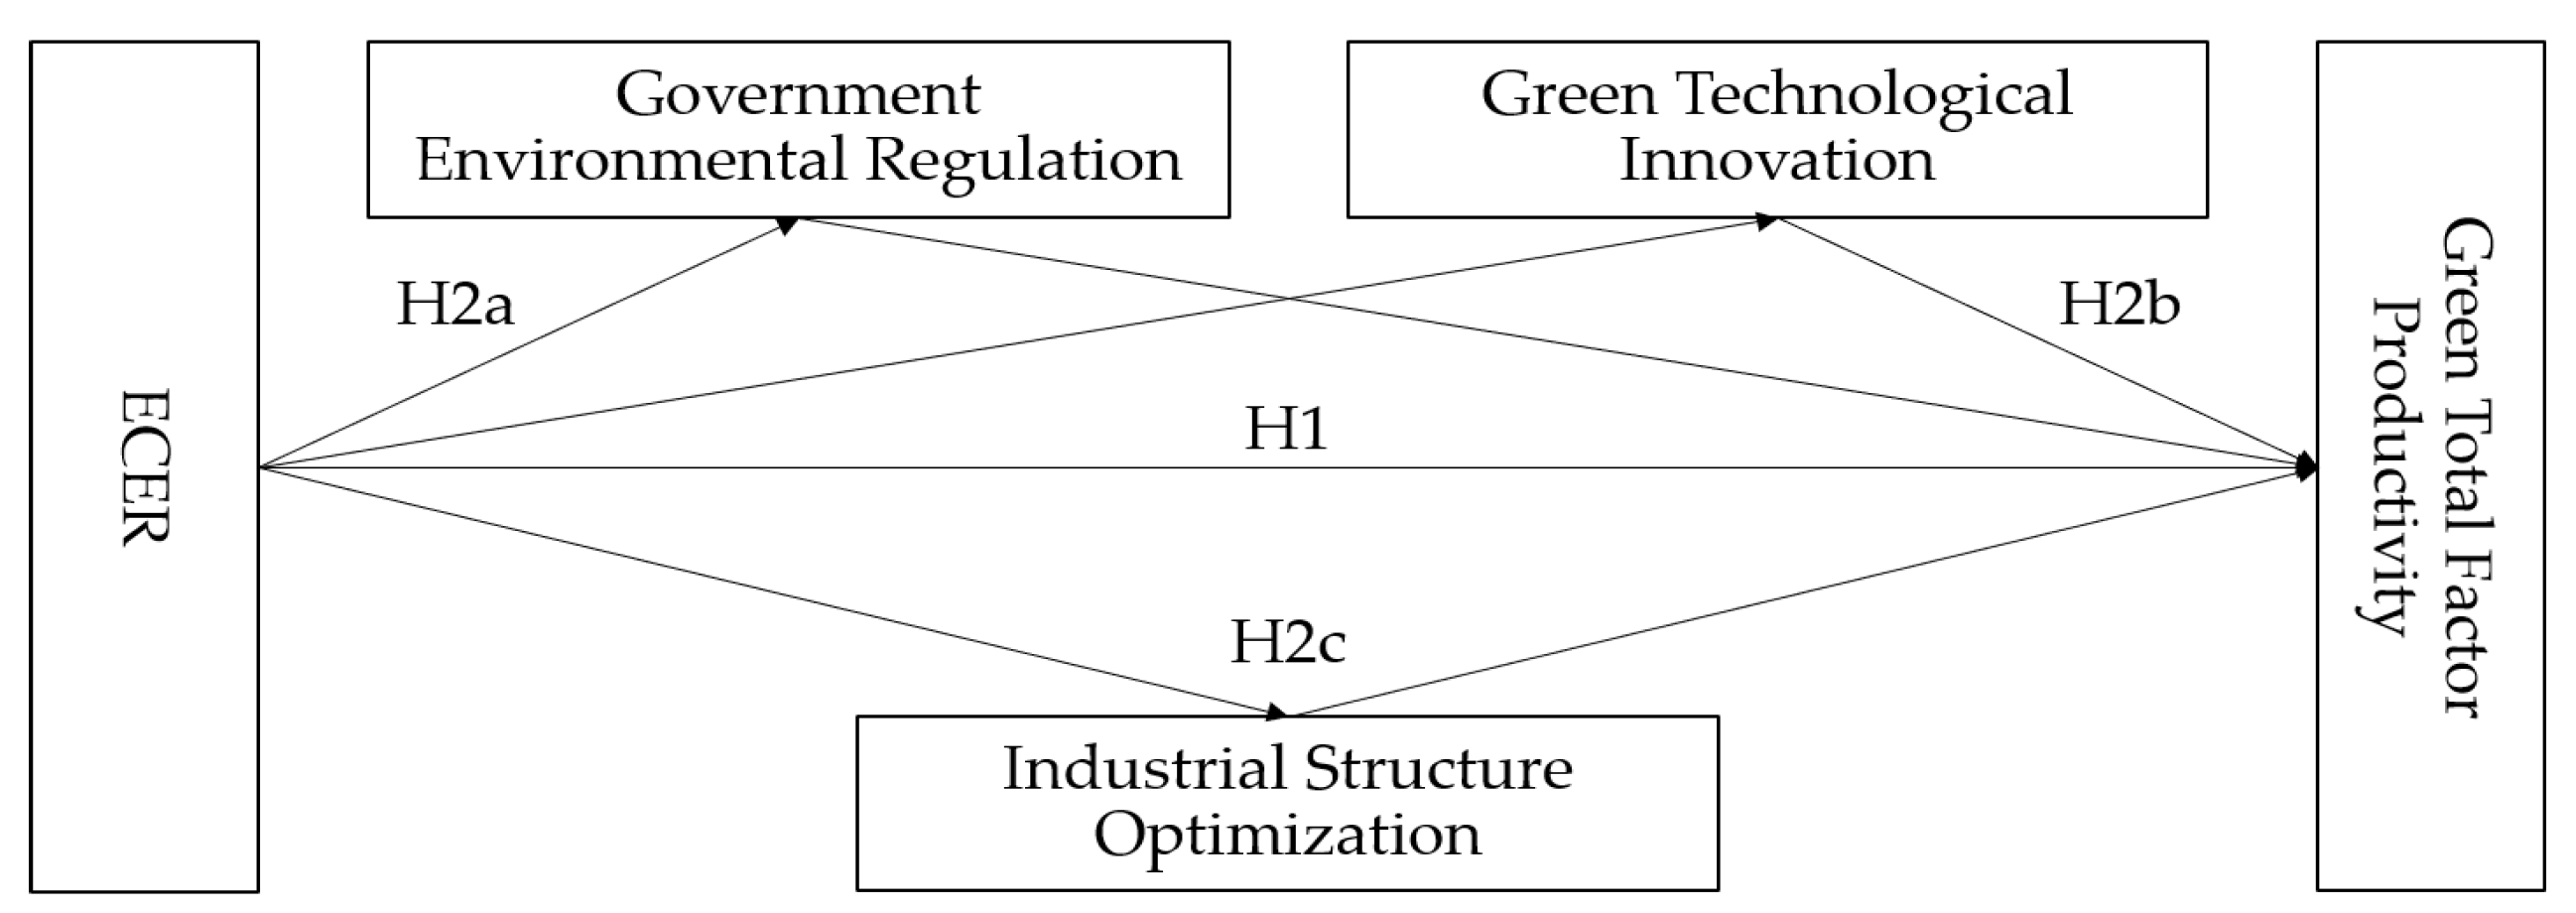
H1. 
ECER can significantly increase urban GTFP
The interaction between the central government and local governments constitutes the institutional environment for local governments’ decision making, and the central government’s orders and administrative means are important reasons for local governments’ actions [26]. The central government has established stringent rules and regulations governing the environmental protection efforts of ECER pilot cities, such as the accountability system and the “one-vote veto” system, which take the fulfillment of energy-saving and emission reduction targets as part of the assessment of local governments. Local governments failing to complete their tasks are notified, criticized, and disqualified from being evaluated and selected for excellence in the current year. Therefore, in response to the orders and policies of the central government, local governments are willing to implement stricter environmental regulations at the cost of slow economic growth to balance economic growth and environmental protection and to meet the performance appraisal targets issued by the central government [27]. Furthermore, according to Porter’s hypothesis, the core competitiveness of industries is a dynamic paradigm based on innovation, which pursues the goals of high productivity, lower production costs than those of competitors, more valuable products, and greener and lower-carbon production and management methods. Only when industries can innovate, optimize, and upgrade within constraints can they achieve sustainable development and long-term irreplaceable competitiveness in the marketplace [28,29]. Therefore, environmental regulations influence production costs and enhance urban GTFP by improving green technology innovation capacity and optimizing resource allocation efficiency across industries. Based on this, this paper proposes the following hypothesis:
H2a. 
ECER can enhance urban GTFP by strengthening environmental regulations
Green technological innovation can provide endogenous forces for the sustainable development of ECER pilot cities. On the one hand, being selected as a pilot city releases a policy signal, highlighting the need for technological transformation, upgrading, and increased support for green production technologies. These signals help ECER pilot cities establish more research centers and industrial innovation centers, whereby more innovative talents can be attracted to gather in the city, which contributes to the continuous improvement in the innovation capacity and green production technology level of ECER pilot cities, reduces pollutant and carbon emissions, and thus enhances the city’s GTFP [30]. On the other hand, ECER’s support for innovative R&D projects can form a “depression effect”, making pilot cities gradually become a cluster of high-tech and service industries, along with other eco-friendly and low-carbon industries. The knowledge and technology spillover mechanism, transaction cost-saving mechanism, infrastructure, and public service sharing mechanism included in industrial agglomeration can realize the aggregation of innovation factors to a greater extent [30]. With the agglomeration of innovation factors and new industries, more multinational companies and excellent domestic companies will be attracted, and the healthy competition among these companies will help to maximize the optimization of resource allocation, promote green technological innovation, and enhance the overall efficiency of the city’s resource use, which in turn will enhance the city’s GTFP. Based on this, this paper puts forward the following hypothesis:
H2b. 
ECER can enhance urban GTFP by encouraging technological innovation
Under the ECER policy, high-pollution and high-energy-consumption industries (‘two high’ industries) are expected to transition into green and low-carbon industries. This is because if the “two high” industries fail to transform and upgrade, they would face high taxes and fines, which inevitably increase their costs and reduce their profits, and then go bankrupt or move to other cities. In addition, the performance appraisal system formulated by ECER sets strict binding targets for local governments. In order to fulfill the assessment, local governments would strictly control the number of polluting enterprises and raise the production and operation standards of the industry, preventing “two high” industries unable to survive or even unable to enter. Based on this, this paper puts forward the following hypothesis:
H2c. 
ECER can enhance urban GTFP by restructuring industries
The conceptual model based on the above analysis is shown in Figure 1.

4. Research Design

4.1. Variable Design

Explained variable: Green Total Factor Productivity (GTFP). The concept of GTFP is derived from TFP. Different from TFP, GTFP fully considers environment-related indicators, including energy inputs and pollutant outputs, so it can measure the quality of economic and environmental development more scientifically [31]. Currently, most GTFP studies use the DEA method. Traditional DEA methods include the CCR model and the BBC model, both of which are radial and angular models with high requirements for changes in the proportions of different output factors, while the SBM model under the emerging DEA method is a non-radial and non-angular model, which is considered more suitable for assessing total factor productivity indicators [32]. Therefore, this research employs the SBM model to quantify the GTFP among Chinese cities at the prefecture level. However, the measurement results of different models under the DEA method are all (0, 1) distributed, and using the SBM model may result in a situation where efficiency values for different decision-making units are simultaneously 1, leading to biased estimation results. In addition, the DEA method only applies to static efficiency evaluation and cannot obtain the dynamic change trend of decision-making units under time series. Therefore, to avoid the above problems, building upon the work of prior research [33], this article develops a super-efficiency SBM model and integrates the Malmquist productivity index to assess the GTFP of Chinese cities at the prefecture level, which ensures the accuracy and continuity of the measurement results. The specific indexes for measuring GTFP are shown in Table 2.
Explanatory variable: Energy conservation and emission reduction fiscal policy (ECER) dummy variable. China’s Ministry of Finance and NDRC have cumulatively designated 30 cities across three phases in 2011, 2013, and 2014 to serve as pilot cities for energy conservation and emission reduction initiatives. Within the scope of this study, the cities are scored based on the official roster of recognized pilot cities. Specifically, a city receives a value of 1 for the year it is chosen as a pilot city for energy conservation and emission reduction policy and also for the years that follow; for all other years, the value is 0.
Control variables: Excluding the impact of city characteristics differences on the research results, this paper refers to existing studies and includes relevant factors that may have an impact on GTFP into the control scope, which includes direct impacts. The economic development level (PGDP) is measured by using the per capita regional gross domestic product (GDP) of the city [34]. Fiscal decentralization (Fiscal) is measured by the ratio of a city’s budgetary revenue to budgetary expenditure [35]. The financial development level (Finance) is measured by comparing the total amount of deposits and loans from city banks to the region’s GDP as a ratio [36]. Infrastructure development level (Infrastructure) is measured by the per capita road area within a city [37]. The internet development level (Internet) is measured by the number of internet port accesses per capita in the city [38].

4.2. Baseline Model

The difference-in-differences (DID) model has the advantage of being able to avoid endogeneity problems and is therefore widely used in the assessment of policy effects in economic and management research [39]. Specifically, it requires that the experimental group maintains the same trend of change as the control group before the policy is implemented, and by controlling for confounding factors, it ensures that the post-policy trend difference between the experimental and control groups is a causal effect of the policy implementation. Therefore, we construct the following DID model:
G T F P i , t = α 0 + α 1 E C E R i , t + α 2 X i , t + δ c i t y + δ y e a r + ε i , t
In the model, the subscripts i and t represent the city and the year, respectively. GTFPi,t is the explained variable, which indicates the GTFP of the city i in year t. ECERi,t is the explanatory variable, and its coefficient α1 indicates the effect of ECER on urban GTFP, which is expected to be significantly positive, implying that ECER can significantly contribute to urban GTFP. Xi,t represents a set of control variables that may affect the performance of city GTFP. δcity and δyear are city-fixed effects and year-fixed effects, respectively, to exclude confounding factors in the regression that do not vary with geography and time. εi,t is a random perturbation term.

4.3. Data Selection

This study leverages a dataset encompassing 280 Chinese cities from 2005 to 2021 to derive a range of variables. Data for calculating the dependent variable GTFP were obtained from the EPS DATA database. The pilot cities and start year of the core independent variable ECER were manually collated by the author from the Ministry of Finance and other government websites. Data for the control variables were obtained from the EPS DATA database. Based on the obtained raw data, the following processing work actions are conducted in this paper. (1) Exclude cities with significant data gaps. (2) For cities with a few missing values, linear interpolation is used to fill in the data with specific linear variation characteristics, and mean value interpolation is used to fill in the data without linear variation characteristics. (3) All continuous variables were subjected to a 1% winsorization process both above and below to exclude extreme values. (4) To ensure the comparability of economic data across different years, this paper deflates all nominal variable data to the base year of 2005. After data consolidation, a balanced panel dataset of 4573 observations at the city level in China, spanning from 2005 to 2021, was obtained for the study. The results of the descriptive statistical analysis of the main variables are presented in Table 3.

5. Analyses of the Empirical Results

5.1. Correlation Analysis

Table 4 demonstrates the results of Pearson and Spearman correlation analysis. The lower left part is the result of Pearson correlation analysis, and the upper right part is the result of Spearman correlation analysis. It can be seen that ECER is positively and significantly correlated with GTFP, indicating that ECER can significantly increase urban GTFP, which initially supports H1. The control variables are positively and significantly correlated with GTFP, indicating that the selection of control variables in this paper is reasonable.

5.2. Baseline Regression Analysis

Table 5 presents the results of the baseline regression analysis. Columns (1) to (6) present the impact of ECER on urban GTFP as control variables that are progressively included. The results indicate that regardless of whether control variables are introduced, the coefficient for the core explanatory variable of ECER on urban GTFP is significantly positive at the 1% level. Column (7) of Table 5 lists the regression results including all control variables and fixed effects. The data show that the coefficient for the core explanatory variable of ECER on urban GTFP is 0.397 and is significant at the 1% level. This suggests that compared to cities that were not selected, those selected as part of China’s national energy conservation and emission reduction fiscal policy demonstration cities have a significantly positive effect on urban GTFP. Hypothesis H1 of this paper is verified.

5.3. Robustness Test

5.3.1. Parallel Trend Test

A key condition for employing a Difference-in-Differences (DID) approach is that the experimental sample passes the parallel trend test, i.e., indicating the absence of a notable mathematical or statistical disparity in GTFP levels between the experimental and control groups prior to the policy’s introduction. Therefore, this paper, building upon existing research [40], formulates the following model to substantiate the parallel trends test for both the experimental and control groups.
G T F P i , t = β 0 + t = 1 6 y t p r e i , t + t = 1 6 y t l a s i , t + β 1 X i , t + δ c i t y + δ y e a r + ε i , t
In the aforementioned equation, prei,t denotes year t before the launch of ECER, lasi,t denotes year t after the launch of ECER, with the interpretations of the other variables correspond to those defined in the baseline regression analysis. This paper sets the time window from (−6, 6) for the parallel trend test and takes the year preceding the promulgation of ECER as the base period for empirical regression to avoid multicollinearity issues. As indicated in Figure 2, there was no significant difference in the regression coefficients for the experimental and control groups prior to the announcement of ECER. However, from the year of the policy’s introduction and in subsequent years, the coefficients became significantly positive. This suggests that the GTFP between different groups has changed from no difference to an expanding difference. ECER has always existed and has had a long-term dynamic effect on improving urban GTFP, which satisfies the parallel trend test, thereby justifying the use of the DID regression method.

5.3.2. Placebo Test

Even though the baseline regression analysis results confirm the constructive role of ECER in enhancing urban GTFP, time, region, and other relevant factors may still be omitted, which could perturb the research results. Therefore, in this paper, we use random sampling of the experimental sample based on the year of policy implementation to form the virtual experimental group, with the remaining cities serving as the control group. A placebo test is then conducted using the Bootstrap method, which involves 1000 random samples. Figure 3 presents the outcomes of the placebo test, illustrating that the estimated coefficients from the random sample tests are approximately normally distributed around a mean of zero. Each of the estimated coefficients is smaller than the coefficient derived from the baseline regression (0.397), marked by a black dashed line. Furthermore, the majority of these coefficients have associated p-values exceeding the 10% significance level. Consequently, the results of the baseline regression analysis demonstrate robustness and appear to be largely unaffected by potential disturbances from factors not under observation.

5.3.3. Endogeneity Test

The DID model can somewhat overcome the endogeneity problem, yet this relies on the assumption that the experimental samples are obtained through random selection. The selection of pilot cities in this paper may be influenced by factors such as environmental conditions and technical efficiency. Specifically, cities with lower green production efficiency are more likely to receive green fiscal support, which could lead to reverse causality. Therefore, this paper builds upon the work of prior research [41] and selects the air flow coefficient (Air) as an instrumental variable, using least squares regression for endogeneity testing. The air flow coefficient refers to the total amount of airflow in a certain spatial range per unit of time, and the larger the coefficient, the lower the degree of air pollutant contamination. Therefore, when the total amount of pollutant emissions is certain, the larger the airflow coefficient is, the better the local environmental conditions are, and accordingly, the lower the likelihood of being included as a pilot city, which satisfies the instrumental variable correlation condition. In addition, the airflow coefficient is determined by meteorological and geographic factors and is not affected by urban GTFP, which satisfies the homogeneity of instrumental variables. Similar to Broner and Paula (2012) [42], this paper measures the air flow coefficient using the product of wind speed and atmospheric boundary layer height, with latitude and longitude raster meteorological data from the European Centre for Medium-Range Weather Forecasts (ECMWFs).
Displayed in Table 6 within Columns (1) and (2) are the results from the endogeneity test. The first-stage results in Column (1) indicate that the correlation coefficient between the air flow coefficient and the application of ECER is −0.049, which is significant at the 1% level. This points to a strong relationship between the air flow coefficient and the selection of cities to participate in the pilot city. The second-stage results in Column (2) show that the coefficient for the non-identifiable test confirms significance at the 1% level, highlighting a substantial correlation between the instrumental and endogenous variables. The weak instrument variable test statistic not only surpasses the 16.38 threshold from the Stock-Yogo weak identification test but also does so at a p < 0.10 level, validating the rationality of the chosen instrumental variable. The core explanatory variable’s regression coefficient is 4.970, which is significant, and suggests that ECER contributes positively to the elevation of urban GTFP. Collectively, these results substantiate the baseline regression’s robust findings.

5.3.4. PSM-DID

This paper employs propensity score matching regression to eliminate the impact of selective bias between groups on the research findings. Specifically, the control variables are used as covariates, kernel matching is adopted for the matching process, and the sample is further regressed according to model (1) after eliminating unsuccessfully matched cities. The estimated coefficient on ECER, reported in Table 6 Column (3) from the propensity score matching regressions, is 0.252 and is significant at the 1% significance level. This further indicates the robustness of the finding that ECER enhances urban GTFP.

5.3.5. Changing the Measurement Model

To avoid potential interference from the measurement model on the regression results, this paper builds upon the prior research [43] and employs the NDDF model to calculate urban GTFP. Subsequently, a regression analysis is conducted based on these calculations. The regression results, displayed in Column (4) of Table 6, reflect the changes after the measurement model was altered. The estimated coefficient for ECER stands at 0.197, which is significant at the 1% level, and the results continue to support the conclusion that ECER can enhance urban GTFP.

5.3.6. Removing Confusing Policy Interference

During the research time interval of this paper, China has enacted a series of green innovation development policies, which may have interfered with the findings of this paper. Therefore, in order to eliminate the possibility that urban GTFP enhancement is driven by similar policies, this paper chooses to test four policies that may have a similar effect to ECER: the pilot low carbon city (Lowcarbon), the pilot carbon emissions trading (Emission), the pilot national innovative city (Innovation), and the pilot smart city (Smart). Specifically, dummy variables are set according to the enactment time and pilot cities of each of the four policy pilots and then included in the baseline model for regression along with the ECER, respectively. The analysis in Table 7, across Columns (1) to (4), reveals the outcomes associated with different pilot policy programs. Upon the inclusion of a control dummy variable for other potential pilot policy interferences, all coefficients for the core explanatory variable representing ECER are positive and meet the 1% significance criterion. This finding indicates that the enhancement of GTFP by green fiscal policy is not influenced by the effects of the aforementioned policy initiatives. Moreover, the size and statistical significance of the coefficients for ECER are in line with the baseline regression analysis, reinforcing the assertion that ECER significantly promotes urban GTFP and this policy behavior appears to be highly exogenous.

5.4. Mediation Mechanism Analysis

According to the previous hypothesis, ECER not only has a green development effect but also strengthens local environmental regulation, green innovation capacity, and industrial structure upgrading. In order to test these mechanisms, this part searches for proxy variables from environmental regulation, technological innovation and structural optimization, and constructs the following model to explore the mediating effect. In the following model, Mi,t are different mediating variables, and the meanings of the rest of the variables are consistent with the benchmark regression model.
M i , t = θ 0 + θ 1 E C E R i , t + θ 2 X i , t + δ c i t y + δ y e a r + ε i , t
First is government environmental regulation (Regulation). Building upon the work of prior research [44], this paper utilizes the natural logarithm of environmental administrative penalty cases at the city level to gauge the stringency of environmental regulation, and the data are retrieved and organized by the author through the PKU Law Database website. The regression analysis results, which incorporate environmental regulation as a mediating variable, are presented in Columns (1) of Table 8. Demonstrated in Column (1), ECER significantly enhances environmental regulation, which means that after being selected as the pilot scope, local governments will significantly increase the attention and punishment to pollution violations. Therefore, it can be concluded that ECER can indirectly promote the process of urban GTFP enhancement to a certain extent by strengthening the intensity of environmental regulation. Hypothesis H2a is thus verified.
Second is green technological innovation (Innovation). Building upon the work of prior research [45], this paper employs the count of green patent applications within cities as an index of the cities’ green technological innovation levels, with data obtained from the China City Statistical Yearbook. The regression analysis results featuring technological innovation as a mediating variable are detailed in Columns (2) of Table 8. As shown in Column (2), ECER has a significant positive effect on the number of green patent applications in cities, meaning that ECER may contribute to the elevation of urban GTFP by bolstering cities’ capacity for technological innovation. Hypothesis H2b is thus verified.
Third is industrial structure optimization (Structure). Building upon the work of prior research [46], this study incorporates the Theil index to gauge the extent of industrial structure optimization within cities, which is calculated by the following formula: S t r u c t u r e = i = 1 n Y i / Y × l n ( Y i / L i Y / L ) , where i denotes the ith industry, n denotes the number of industries, Y denotes the total industrial output value, L denotes the total number of industrial employees, Yi denotes the output value of the ith industry, and Li denotes the number of employees in the ith industry. The Theil index serves as a negative indicator: a lower index indicates a more optimized industrial structure. The necessary data for this calculation are gathered from the China City Statistical Yearbook. The regression analysis with structural optimization as the mediating factor is presented in Column (3) of Table 8. Column (3) reveals that the coefficient of ECER is significantly positive, and it can be assumed that ECER can enhance GTFP by optimizing the industrial structure of the city and thus, hypothesis H2c is verified.

6. Further Analysis

6.1. Moderation Mechanism Analysis

Local governments are not only the direct beneficiaries of fiscal subsidies but also the overall planners of urban green development. Their many inherent characteristics may significantly influence the rational distribution and efficient use of central fiscal subsidies, ultimately leading to differentiated levels of urban GTFP enhancement. Therefore, to further explore which government characteristics play a constructive moderating role in the process by which ECER facilitate the enhancement of urban GTFP, this section intends to construct indicators of government characteristics from three dimensions, governmental transparency, financial autonomy, and digital transformation, and formulate a model (4) to analyze the moderating effect. In this model, Ii,t is the moderating variable of government characteristics, and ECERi,t × Ii,t is the cross-multiplier of ECER and moderating variables. The significance of the coefficient γ3 determines the presence or absence of the moderating effect, while all other variables maintain their interpretations from the baseline regression model.
G T F P i , t = γ 0 + γ 1 E C E R i , t + γ 2 I i , t + γ 3 E C E R i , t I i , t + γ 4 X i , t + δ c i t y + δ y e a r + ε i , t
First is government transparency (Transparency). High transparency is a manifestation of government integrity, which helps to guarantee the public’s right to be informed, to engage, and to supervise. It promotes the effective operation of the government accountability mechanism [47], which in turn promotes the reasonableness and openness of fiscal decision-making, improves the efficiency of fiscal implementation [48], and ultimately improves the level of governance [49]. Therefore, it can be argued that local governments with higher transparency can utilize fiscal subsidies more scientifically and rationally under public scrutiny, thus achieving higher results in terms of urban GTFP enhancement. In this paper, we use the final scores in the Research Report on Fiscal Transparency of Chinese Municipal Governments published by Tsinghua University to measure government transparency, which comprehensively evaluates and scores the fiscal disclosure of municipal governments in China across five dimensions: list of institutions, budgetary situation, fiscal situation, performance objectives, and information quality, and the data results are authoritative, representative, and accurate. Table 9 Column (1) reveals the results of the regression analysis with the transparency of government operations acting as a variable that moderates the effect. The data present that the coefficient associated with the interaction term of ECER × Transparency is 0.010, reaching significance at the 1% level. This implies that when there is greater transparency in government activities, the influence of ECER on the advancement of urban GTFP is more noticeable.
Second is fiscal autonomy (Autonomy). Fiscal autonomy provides the public with the opportunity to evaluate the competence of government officials and the utilization rate of public resources [50], which encourages the motivations of local officials to be closely aligned with the welfare of local residents [51] and ultimately provide a potential boost to the efficiency of fiscal expenditures [52]. Therefore, a reasonable conjecture is that local governments with higher autonomy are more capable of appropriately applying fiscal subsidies to address urban shortcomings based on the current state of local development, rather than merely following the directives of the central government, thus achieving higher levels of green development construction outcomes. For reference [53], the ratio of local fiscal general budgetary revenue to local fiscal general budgetary expenditure is employed to assess fiscal autonomy, with information taken from the China City Statistical Yearbook. Column (2) of Table 9 illustrates the regression analysis using fiscal autonomy as a moderating factor. The analysis reveals that the coefficient for the interaction term of ECER × Autonomy is 0.628, which is significant at the 1% level. It signifies that the impact of ECER on the advancement of Green Total Factor Productivity (GTFP) is amplified in settings with greater fiscal autonomy.
Third is digital transformation (Digital). Government digital transformation is also the process of re-engineering business processes across levels, regions, and systems using a variety of information and data [54], which will make the government move closer to a standardized paradigm, thus improving governance capacity and efficiency [55]. Therefore, this paper argues that the more digitally transformed local governments will have higher governance effectiveness and will be able to fully utilize fiscal subsidies to accomplish urban green building governance goals. In 2016, the Chinese government selected a total of 80 cities nationwide to carry out the pilot work of “Internet + Government Service”, which requires local governments to optimize the online service process and reform and innovate the service model; therefore, it is reasonable to assume that cities designated as part of the pilot program exhibit a greater extent of digital transformation. Thus, this study employs the pilot policy to formulate a difference-in-differences (DID) dummy variable representing digital transformation (Digital = Treati × Timet), where Treati is a grouping variable assigned a value of 1 for cities within the demonstration cities and 0 for non-demonstration cities. Timet is a time variable that equals 1 for the year the policy was enacted and for all subsequent years, and 0 for years preceding the policy. Column (3) of Table 9 presents the regression results with digital transformation as the moderating variable. The findings indicate that the coefficient for the interaction term ECER × Digital is 0.517, which is significant at the 1% level. It suggests that the impact of ECER on the advancement of GTFP is more pronounced where the level of government digital transformation is higher.

6.2. Heterogeneity Analysis

To delve deeper into the differentiated effect of ECER on the GTFP of cities with varying characteristic attributes, this part categorizes the overall sample based on resource ownership and the level of economic development to conduct group regression analysis.
First is resource ownership. The stock of resources in a city may affect a city’s GTFP; the higher the degree of resource abundance, the more likely it is that capital will flow to the resource industries with quick and certain returns rather than to the high-tech industries with longer cycles and high risks [56]. This may trigger imbalances in industrial development and lagging levels of technological innovation in a region. Therefore, a reasonable conjecture is that resource-based cities, due to their path dependency on existing resources, will exhibit more pronounced improvements in GTFP after being incorporated into the demonstration cities. In response to policy calls, they will embark on a path of diversified development, which is expected to generate stronger momentum for environmental regulation, technological innovation, and industrial upgrading and thus show a more obvious GTFP enhancement effect. To test this idea, this paper categorizes the data samples into resource-based cities and non-resource-based cities according to the National Sustainable Development Plan for Resource-based Cities (2013–2020) issued by the State Council of China and conducts group regression analysis. The coefficient for the resource-based cities group, as displayed in Table 10, columns (1)–(2), is 0.304 and is significant at the 1% level, while the coefficient of the non-resource-based cities group is 0.573 and is only significant at the 10% level. This means that the promoting effect of ECER on urban GTFP is mainly manifested in resource-based cities, and the aforementioned conjecture is valid.
Second is economic development levels. Cities of varying economic development levels may receive varying degrees of benefits from ECER. Compared with economically backward cities, economically developed cities have comparative advantages regarding human resources, financial resources, and material resources. Therefore, they are more capable of actively implementing policy requirements such as energy-saving technological transformation, green building transition, intensive development of the service industry, and high-efficiency energy utilization, achieving a higher level of urban GTFP. To test this idea, this paper employs the median value of per capita GDP of each prefecture-level city as the criterion for classification, designating cities with per capita GDP above the median as high economic development level cities and those below the median as low economic development level cities. Regression analysis was then conducted based on this classification. The test results displayed in columns (3)–(4) of Table 10 demonstrate that the coefficient for the high economic development level cities group is 0.431 and is significant at the 1% level, while the coefficient for the low economic development level cities group is not significant. This means that the promotional effect of ECER on urban GTFP is primarily evident in high economic development level cities, thus confirming the aforementioned conjecture.

7. Conclusions and Policy Recommendations

7.1. Conclusions

ECER stipulates that cities participating in the pilot program are given financial allocations by the central government to overhaul industry, construction, transportation, and services in an effort to achieve the goals of improving productivity and reducing pollution emissions. Therefore, utilizing ECER as a quasi-natural experiment and DID identification strategy, we assessed the causal impact of ECER on GTFP. It is found that after the implementation of ECER, the GTFP of pilot cities has significantly increased compared to non-pilot cities, and this conclusion still holds after a series of robustness tests. Additionally, ECER can mainly enhance urban GTFP by improving government environmental regulation, promoting green technological innovation, and optimizing industrial structure. It is further found that some characteristics of local governments can enhance the effect of ECER on GTFP, including government transparency, fiscal autonomy, and the degree of digital transformation. In addition, the effect of ECER on GTFP is more pronounced in cities with more resources and higher levels of economic development.

7.2. Policy Recommendations

In light of the aforementioned conclusions, to further enhance the facilitating effect of green fiscal policies on urban GTFP, efforts should primarily be focused on the following four aspects.
First, the ECER pilot policy should be persistently implemented. On the one hand, the central government should allocate more financial funds to the field of environmental governance in the form of grants to promote cities to upgrade GTFP and realize sustainable development, but it should also pay attention to the risk of improper use of financial allocations. On the other hand, replicable and scalable development models and governance experiences should be summarized from the ECER pilot cities to provide reference templates for heavily polluted cities and to enhance the incentives for urban green transformation.
Second, local governments should actively explore effective paths for ECER to enhance GTFP. For example, in terms of government environmental regulation, it should be considered to increase penalties for environmentally damaging behaviors and to charge higher environmental taxes for high-pollution and high-energy-consumption enterprises. In terms of green technological innovation, it increases the R&D investment in green innovation technology and forms an enterprise-oriented and market-oriented technological innovation system. At the same time, it gives full play to the government’s role in guiding environmental technology innovation, providing financial support and assurances and strengthening the protection of intellectual property rights. In terms of the optimization of industrial structure, the threshold of industrial access should be raised, the industrial structure of the city should be gradually adjusted, and the aggregation of green and low-carbon industries, high-tech industries, and modern service industries in the city should be further promoted, so as to form a structural dividend effect.
Third is a focus on government capacity building to strengthen the positive utility of ECER. Financial support from the central government is not directly disbursed to local enterprises or research institutions but is first allocated to local governments, which then distribute the funds. Therefore, whether the funds are effectively distributed and thus enhance urban GTFP depends largely on local governments. We suggest that government information disclosure needs to be strengthened to clarify the amount, use, and balance of fiscal funds, so as to facilitate monitoring by the central government and the public. At the same time, the financial autonomy of local governments should be appropriately safeguarded, and local governments should be allowed to appropriately improve the use and expenditure of financial funds according to their needs and advantages. In addition, there is a need to accelerate the process of building a digital government and to enhance the Government’s capacity to implement policies, so as to ensure that fiscal funds are allocated to the fields most in need of financial support.
Fourth, attention must be paid to the heterogeneity constraint mechanism and the implementation of differentiated ECER pilot policies. Under different resource endowments and levels of economic development, there are significant differences in the effect of ECER on the enhancement of urban GTFP. Therefore, in the process of promoting sustainable development, the characteristics of different cities should be summarized, and the policy system should be formulated in a targeted manner to integrate the effectiveness of green fiscal policy with the development status of cities.

7.3. Limitations and Future Research

However, there are still some research gaps and opportunities. On the one hand, while we fill a research gap by examining the GTFP effect of ECER, it remains unclear whether this positive effect can be transmitted to non-pilot areas through learning behavior. In the future, the macroeconomic effects of ECER can be further explored by utilizing ECER as an exogenous shock and combining data from cities surrounding the pilot city. On the other hand, we have only examined data from one country, and it would be more convincing to conduct a study at the international level, which is undoubtedly difficult. Future research could target other emerging countries to reassess the policy effects of green fiscal policies.

Author Contributions

Conceptualization, P.L., C.Z. and B.C.; methodology, P.L.; software, P.L.; validation, C.Z. and B.C.; formal analysis, C.Z. and B.C.; investigation, P.L. and C.Z.; resources, P.L.; data curation, P.L.; writing—original draft preparation, P.L. and C.Z.; writing—review and editing, B.C.; visualization, P.L. and C.Z.; supervision, B.C.; project administration, B.C.; funding acquisition, B.C. All authors have read and agreed to the published version of the manuscript.

Funding

This research received no external funding.

Institutional Review Board Statement

Not applicable.

Informed Consent Statement

Not applicable.

Data Availability Statement

The data supporting the conclusions of this study are available upon reasonable request.

Conflicts of Interest

The authors declare no conflict of interest.

References

  1. Wang, Y.; Xie, L.; Zhang, Y.; Wang, C.; Yu, K. Does FDI Promote or Inhibit the High-Quality Development of Agriculture in China? An Agricultural GTFP Perspective. Sustainability 2019, 11, 4620. [Google Scholar] [CrossRef]
  2. Cao, X.; Kostka, G.; Xu, X. Environmental political business cycles: The case of PM2.5 air pollution in Chinese prefectures. Environ. Sci. Policy 2019, 93, 92–100. [Google Scholar] [CrossRef]
  3. Pu, Z.; Fu, J. Economic growth, environmental sustainability and China mayors’ promotion. J. Clean. Prod. 2018, 172, 454–465. [Google Scholar] [CrossRef]
  4. Sun, J.; Zhang, N.; Sun, Y.; Su, Y. Fiscal policy’s impact on the efficiency of natural resources for a green economic recovery. Resour. Policy 2024, 90, 104660. [Google Scholar] [CrossRef]
  5. Choi, Y.; Bone, C.; Zhang, N. Sustainable policies and strategies in Asia: Challenges for green growth. Technol. Forecast. Soc. 2016, 112, 134–137. [Google Scholar] [CrossRef]
  6. Erdogan, S. Linking green fiscal policy, energy, economic growth, population dynamics, and environmental degradation: Empirical evidence from Germany. Energy Policy 2024, 189, 114110. [Google Scholar] [CrossRef]
  7. Ullah, S.; Luo, R.; Adebayo, T.S.; Kartal, M.T. Dynamics between environmental taxes and ecological sustainability: Evidence fromtop-seven green economies by novel quantile approaches. Sustain. Dev. 2023, 31, 825–839. [Google Scholar] [CrossRef]
  8. Lin, B.; Zhu, J. Is the implementation of energy saving and emission reduction policy really effective in Chinese cities? A policy evaluation perspective. J. Clean. Prod. 2019, 220, 1111–1120. [Google Scholar] [CrossRef]
  9. Xu, T.; Kang, C.; Zhang, H. China’s efforts towards carbon neutrality: Does energy-saving and emission-reduction policy mitigate carbon emissions? J. Environ. Manag. 2022, 316, 115286. [Google Scholar] [CrossRef]
  10. Dobbins, L.; Jacob, M. Do corporate tax cuts increase investments? Account. Bus. Res. 2016, 46, 731–759. [Google Scholar] [CrossRef]
  11. Xia, R.; Wei, D.; Jiang, H.; Ding, Y.; Luo, X.; Yin, J. Research on the coordinated development and convergence characteristics of China’s urban competitiveness and green total factor productivity. Ecol. Indic. 2024, 161, 111954. [Google Scholar] [CrossRef]
  12. Hailu, A.; Veeman, T.S. Environmentally Sensitive Productivity Analysis of the Canadian Pulp and Paper Industry, 1959-1994: An Input Distance Function Approach. J. Environ. Econ. Manag. 2000, 40, 251–274. [Google Scholar] [CrossRef]
  13. Zhu, Y.; Zhang, Y.; Piao, H. Does Agricultural Mechanization Improve the Green Total Factor Productivity of China’s Planting Industry? Energies 2022, 15, 940. [Google Scholar] [CrossRef]
  14. Zhong, S.; Li, J.; Chen, X.; Wen, H. Research on the green total factor productivity of laying hens in China. J. Clean. Prod. 2021, 315, 128150. [Google Scholar] [CrossRef]
  15. Tian, Y.; Pang, J. What causes dynamic change of green technology progress: Convergence analysis based on industrial restructuring and environmental regulation. Struct. Change Econ. Dyn. 2023, 66, 189–199. [Google Scholar] [CrossRef]
  16. Feng, C.; Zhong, S.; Wang, M. How can green finance promote the transformation of China’s economic growth momentum? A perspective from internal structures of green total-factor productivity. Res. Int. Bus. Financ. 2024, 70, 102356. [Google Scholar] [CrossRef]
  17. Tian, X.; Zhang, H. Analysis of the impact factors of industrial structure upgrading on green total factor productivity from the perspective of spatial spillover effects. Heliyon 2024, 10, e28660. [Google Scholar] [CrossRef]
  18. Zhang, Z.; Hua, Z.; He, Z.; Wei, X.; Sun, H. The impact of local government attention on green total factor productivity: An empirical study based on System GMM dynamic panel model. J. Clean. Prod. 2024, 458, 142275. [Google Scholar] [CrossRef]
  19. Yu, D.; Li, X.; Yu, J.; Li, H. The impact of the spatial agglomeration of foreign direct investment on green total factor productivity of Chinese cities. J. Environ. Manag. 2021, 290, 112666. [Google Scholar] [CrossRef]
  20. Lin, B.; Xu, C. Evaluating the effect of green fiscal policy on firm energy performance: Evidence from China. Econ. Change Restruct. 2024, 57, 22. [Google Scholar]
  21. Fan, H.; Liang, C. The pollutant and carbon emissions reduction synergistic effect of green fiscal policy: Evidence from China. Financ. Res. Lett. 2023, 58, 104446. [Google Scholar] [CrossRef]
  22. Feng, N.; Ge, J. How does fiscal policy affect the green low-carbon transition from the perspective of the evolutionary game? Energ. Econ. 2024, 134, 107578. [Google Scholar] [CrossRef]
  23. Wang, J.; Hu, X.; Song, J. Unleashing the power of green fiscal policies: Driving energy efficiency in China. Energy 2024, 312, 133402. [Google Scholar] [CrossRef]
  24. Fankhauser, S.; Bowen, A.; Calel, R.; Dechezleprêtre, A.; Grover, D.; Rydge, J.; Sato, M. Who will win the green race? In search of environmental competitiveness and innovation. Glob. Environ. Change 2013, 23, 902–913. [Google Scholar] [CrossRef]
  25. Lee, C.; Lee, C. How does green finance affect green total factor productivity? Evidence from China. Energ. Econ. 2022, 107, 105863. [Google Scholar] [CrossRef]
  26. Yuan, J.; Kang, J.; Yu, C.; Hu, Z. Energy conservation and emissions reduction in China—Progress and prospective. Renew. Sustain. Energy Rev. 2011, 15, 4334–4347. [Google Scholar] [CrossRef]
  27. Chen, Y.J.; Li, P.; Lu, Y. Career concerns and multitasking local bureaucrats: Evidence of a target-based performance evaluation system in China. J. Dev. Econ. 2018, 133, 84–101. [Google Scholar] [CrossRef]
  28. Dechezleprêtre, A.; Sato, M. The Impacts of Environmental Regulations on Competitiveness. Rev. Environ. Econ. Policy 2017, 11, 183–206. [Google Scholar] [CrossRef]
  29. Porter, M.E.; van der Linde, C. Toward a New Conception of the Environment-Competitiveness Relationship. J. Econ. Perspect. 1995, 9, 97–118. [Google Scholar] [CrossRef]
  30. Wang, Y.; Bai, Y.; Quan, T.; Ran, R.; Hua, L. Influence and effect of industrial agglomeration on urban green total factor productivity—On the regulatory role of innovation agglomeration and institutional distance. Econ. Anal. Policy 2023, 78, 1158–1173. [Google Scholar] [CrossRef]
  31. He, Z.; Chen, Z.; Feng, X. Different types of industrial agglomeration and green total factor productivity in China: Do institutional and policy characteristics of cities make a difference? Environ. Sci. Eur. 2022, 34, 64. [Google Scholar] [CrossRef]
  32. Fukuyama, H.; Weber, W.L. A directional slacks-based measure of technical inefficiency. Socio-Econ. Plan. Sci. 2009, 43, 274–287. [Google Scholar] [CrossRef]
  33. Cheng, Z.; Jin, W. Agglomeration economy and the growth of green total-factor productivity in Chinese Industry. Socio Econ. Plan. Sci. 2022, 83, 101003. [Google Scholar] [CrossRef]
  34. Zheng, M.; Feng, G.; Jang, C.; Chang, C. Terrorism and green innovation in renewable energy. Energ. Econ. 2021, 104, 105695. [Google Scholar] [CrossRef]
  35. Song, M.; Du, J.; Tan, K.H. Impact of fiscal decentralization on green total factor productivity. Int. J. Prod. Econ. 2018, 205, 359–367. [Google Scholar] [CrossRef]
  36. Zhao, X.; Nakonieczny, J.; Jabeen, F.; Shahzad, U.; Jia, W. Does green innovation induce green total factor productivity? Novel findings from Chinese city level data. Technol. Forecast. Soc. 2022, 185, 122021. [Google Scholar] [CrossRef]
  37. Mao, K.; Failler, P. Local Government Debt and Green Total Factor Productivity-Empirical Evidence from Chinese Cities. Int. J. Environ. Res. Public Health 2022, 19, 12425. [Google Scholar] [CrossRef]
  38. Chen, S.; Chen, D. Haze pollution, government governance, and high-quality economic development. Econ. Res. J. 2018, 53, 20–34. [Google Scholar]
  39. Baker, A.C.; Larcker, D.F.; Wang, C.C.Y. How much should we trust staggered difference-in-differences estimates? J. Financ. Econ. 2022, 144, 370–395. [Google Scholar] [CrossRef]
  40. Beck, T.; Levine, R.; Levkov, A. Big Bad Banks? The Winners and Losers from Bank Deregulation in the United States. J. Financ. 2010, 65, 1637–1667. [Google Scholar] [CrossRef]
  41. Cai, X.; Lu, Y.; Wu, M.; Yu, L. Does environmental regulation drive away inbound foreign direct investment? Evidence from a quasi-natural experiment in China. J. Dev. Econ. 2016, 123, 73–85. [Google Scholar] [CrossRef]
  42. Broner, F.; Paula, B.V.M.C. Sources of Comparative Advantage in Polluting Industries; National Bureau of Economic Research, Inc.: Cambridge, MA, USA, 2012; p. 18337. [Google Scholar]
  43. Zhang, N.; Kong, F.; Choi, Y.; Zhou, P. The effect of size-control policy on unified energy and carbon efficiency for Chinese fossil fuel power plants. Energy Policy 2014, 70, 193–200. [Google Scholar] [CrossRef]
  44. Li, J.; Li, X.; Hao, L. Impact of dual environmental regulations on carbon emission intensity under the con? Straint of technological innovation. China Popul. Resour. Environ. 2021, 31, 34–44. [Google Scholar]
  45. Chen, A.; Chen, H. Decomposition Analysis of Green Technology Innovation from Green Patents in China. Math. Probl. Eng. 2021, 2021, 10–16. [Google Scholar] [CrossRef]
  46. Zhao, J.; Jiang, Q.; Dong, X.; Dong, K.; Jiang, H. How does industrial structure adjustment reduce CO2 emissions? Spatial and mediation effects analysis for China. Energy Econ. 2022, 105, 105704. [Google Scholar] [CrossRef]
  47. McGee, R.; Gaventa, J. Shifting Power? Assessing the Impact of Transparency and Accountability Initiatives. IDS Work. Pap. 2011, 2011, 1–39. [Google Scholar] [CrossRef]
  48. Arbatli, E.; Escolano, J. Fiscal Transparency, Fiscal Performance and Credit Ratings. Fisc Stud. 2015, 36, 237–270. [Google Scholar] [CrossRef]
  49. Alt, J.E.; Lassen, D.D. Fiscal transparency, political parties, and debt in OECD countries. Eur. Econ. Rev. 2006, 50, 1403–1439. [Google Scholar] [CrossRef]
  50. Besley, T.; Smart, M. Fiscal restraints and voter welfare. J. Public Econ. 2007, 91, 755–773. [Google Scholar] [CrossRef]
  51. Qian, Y.; Roland, G. Federalism and the Soft Budget Constraint. Am. Econ. Rev. 1998, 88, 1143–1162. [Google Scholar] [CrossRef]
  52. Rodden, J. Reviving Leviathan: Fiscal Federalism and the Growth of Government. Int. Organ. 2003, 57, 695–729. [Google Scholar] [CrossRef]
  53. Akai, N.; Sakata, M. Fiscal decentralization contributes to economic growth: Evidence from state-level cross-section data for the United States. J. Urban. Econ. 2002, 52, 93–108. [Google Scholar] [CrossRef]
  54. Alshaher, A. IT capabilities as a fundamental of electronic government system success in developing countries from users perspectives. Transform. Gov. People Process Policy 2020, 15, 129–149. [Google Scholar] [CrossRef]
  55. Milakovich, M.E. Digital Governance: New Technologies for Improving Public Service and Participation; Routledge: London, UK, 2012. [Google Scholar]
  56. Papyrakis, E.; Gerlagh, R. The resource curse hypothesis and its transmission channels. J. Comp. Econ. 2004, 32, 181–193. [Google Scholar] [CrossRef]
Figure 1. Conceptual model.
Sustainability 17 01050 g001
Figure 2. Parallel trend test.
Sustainability 17 01050 g002
Figure 3. Placebo test.
Sustainability 17 01050 g003
Table 1. ECER pilot years and cities.
Batch (Time)Energy Conservation and Emission Reduction Pilot Cities
First tranche (2011)Beijing, Shenzhen, Chongqing, Hangzhou, Changsha, Guiyang, Jilin, Xinyu
Second tranche (2013)Shijiazhuang, Tangshan, Tieling, Qiqihar, Tongling, Nanping, Jingmen, Shaoguan, Dongguan, Tongchuan
Third tranche (2014)Tianjin, Linfen, Baotou, Xuzhou, Liaocheng, Hebi, Meizhou, Nanning, Deyang, Lanzhou, Haidong, Urumqi
Table 2. Indicator system for measuring urban GTFP.
Type of IndicatorIndicatorPrediction Method
Input VariablesCapital inputAnnual fixed asset investment in cities
Labor inputEmployees in urban establishments at year-end
Energy inputAnnual urban electricity consumption
Desirable Output VariablesGDPAnnual urban GDP
Undesirable Output VariablesWastewater EmissionsAnnual industrial wastewater discharges from cities
Sulfur Dioxide EmissionsAnnual industrial sulphur dioxide emissions from cities
Smoke Dust EmissionsAnnual industrial soot emissions from cities
Table 3. Descriptive statistics.
VariableObs.MeanStd. Dev.MinMedianMax
GTFP45732.4201.2020.9022.20011.15
Policy45730.05800.234001
PGDP457310.440.7348.30110.4812.12
Fiscal45730.4740.2210.07900.4391.105
Finance45732.2941.1070.7321.9697.187
Infrastructure45734.6755.3550.2323.05354.80
Internet45730.1910.1760.003000.1411.035
Table 4. Correlation analysis.
VariablesGTFPECERPGDPFiscalFinanceInfrastructure Internet
GTFP10.182 ***0.589 ***−0.061 ***0.243 ***0.296 ***0.578 ***
ECER0.217 ***10.215 ***0.080 ***0.163 ***0.160 ***0.228 ***
PGDP0.523 ***0.211 ***10.529 ***0.378 ***0.745 ***0.842 ***
Fiscal−0.063 ***0.080 ***0.536 ***10.164 ***0.570 ***0.330 ***
Finance0.226 ***0.215 ***0.370 ***0.254 ***10.456 ***0.623 ***
Infrastructure0.179 ***0.165 ***0.582 ***0.502 ***0.404 ***10.656 ***
Internet0.420 ***0.240 ***0.711 ***0.374 ***0.548 ***0.626 ***1
Note: *** indicate significance at the 1% level.
Table 5. Baseline results.
Variables(1) GTFP(2) GTFP(3) GTFP(4) GTFP(5) GTFP(6) GTFP(7) GTFP
ECER1.113 ***0.572 ***0.487 ***0.446 ***0.457 ***0.436 ***0.397 ***
(15.005)(8.708)(8.431)(7.648)(7.850)(7.509)(7.074)
PGDP 0.819 ***1.244 ***1.217 ***1.268 ***1.189 ***1.450 ***
(39.102)(57.162)(54.207)(52.806)(42.145)(21.463)
Fiscal −2.595 ***−2.621 ***−2.506 ***−2.453 ***−0.642 ***
(−36.645)(−36.967)(−34.162)(−33.227)(−4.208)
Finance 0.059 ***0.077 ***0.049 ***−0.146 ***
(4.552)(5.792)(3.392)(−5.469)
Infrastructure −0.019 ***−0.025 ***0.027 ***
(−5.792)(−7.212)(5.643)
Internet 0.659 ***0.414 ***
(5.290)(3.485)
City FENoNoNoNoNoNoYes
Year FENoNoNoNoNoNoYes
N4573457345734573457345734573
Ad-just R20.0470.2860.4480.4500.4540.4570.765
Note: We report t statistics in parenthesis. *** indicate significance at the 1% level.
Table 6. Endogeneity test, PSM-DID, and changing the measurement model.
VariablesEndogeneity TestPSM-DIDChanging the Measurement Model
(1) Policy(2) GTFP(3) GTFP(4) GTFP
ECER 4.970 ***0.252 ***0.197 ***
(4.310)(3.441)(5.651)
Air−0.049 ***
(−5.210)
Underidentification Test 36.7088 ***
Weak identification Test 27.1578 (16.38)
ControlsYesYes
City FEYesYes
Year FEYesYes
N4573457330164573
Ad-just R20.0800.6940.7680.756
Note: We report t statistics in parenthesis. *** indicate significance at the 1% level.
Table 7. Removing confusing policy interference.
Variables(1) GTFP(2) GTFP(3) GTFP(4) GTFP
ECER0.377 ***0.395 ***0.379 ***0.392 ***
(6.670)(6.975)(6.695)(6.942)
Lowcarbon0.113 ***
(3.272)
Emission 0.021
(0.441)
Innovation 0.139 ***
(3.075)
Smart 0.031
(0.875)
ControlsYesYesYesYes
City FEYesYesYesYes
Year FEYesYesYesYes
N4539453945054573
Ad-just R20.7650.7640.7650.765
Note: We report t statistics in parenthesis. *** indicate significance at the 1% level.
Table 8. Mediation effect analysis.
Variables(1) Regulation(2) Innovation(3) Structure
ECER0.440 ***0.141 ***−0.014 ***
(5.760)(2.736)(−3.237)
ControlsYesYesYes
City FEYesYesYes
Year FEYesYesYes
N457344594304
Ad-just R20.8280.9230.827
Note: We report t statistics in parenthesis. *** indicate significance at the 1% level.
Table 9. Moderation effect analysis.
VariablesTransparencyAutonomyDigital
(1) GTFP(2) GTFP(3) GTFP
ECER−0.556 **0.0620.214 ***
(−2.457)(0.451)(3.453)
Transparency−0.002 *
(−1.726)
ECER × Transparency0.010 ***
−0.002*
Autonomy −1.455
(−1.357)
ECER × Autonomy 0.628 ***
(2.678)
Digital 0.237 ***
(5.180)
ECER × Digital 0.517 ***
(5.305)
ControlsYesYesYes
City FEYesYesYes
Year FEYesYesYes
N241045734573
Ad-just R20.7710.7650.770
Note: We report t statistics in parenthesis. ***, **, and * indicate significance at the 1%, 5%, and 10% levels, respectively.
Table 10. Heterogeneity analysis.
VariablesIndustryLevel of Economic Development
Resource-Based CitiesNon-Resource-Based CitiesHighLow
(1) GTFP(2) GTFP(3) GTFP(4) GTFP
ECER0.304 ***0.573 *0.431 ***−0.025
(4.110)(1.728)(5.130)(−0.254)
ControlsYesYesYesYes
City FEYesYesYesYes
Year FEYesYesYesYes
N2754180222732276
Ad-just R20.7510.7910.7960.760
Note: We report t statistics in parenthesis. *** and * indicate significance at the 1% and 10% levels, respectively.
Disclaimer/Publisher’s Note: The statements, opinions and data contained in all publications are solely those of the individual author(s) and contributor(s) and not of MDPI and/or the editor(s). MDPI and/or the editor(s) disclaim responsibility for any injury to people or property resulting from any ideas, methods, instructions or products referred to in the content.

