Article

Transboundary and National Environmental Impacts of Seawater Desalination in Central Chile: An LCA-Based Analysis Across Energy Transition Scenarios

by
Roberto Meza-Olivares
1,
Adrián-Enrique Ortiz-Rojas
1,*,
Camila Mery-Araya
1 and
Jaime Chacana-Olivares
2,3
1
Chemical and Environmental Engineering Department, Universidad Técnica Federico Santa María, Avenida España 1680, Valparaíso 2340000, Chile
2
Departamento de Ingeniería Química y de Medio Ambiente, Facultad de Ingeniería y Ciencias Geológicas, Universidad Católica del Norte, Avenida Angamos 0610, Antofagasta 1240000, Chile
3
Centro de Investigación Tecnológica del Agua y Sustentabilidad en el Desierto (CEITSAZA), Universidad Católica del Norte, Antofagasta 1240000, Chile
*
Author to whom correspondence should be addressed.
Sustainability 2025, 17(24), 11178; https://doi.org/10.3390/su172411178 (registering DOI)
Submission received: 10 October 2025 / Revised: 9 November 2025 / Accepted: 14 November 2025 / Published: 13 December 2025

Abstract

The environmental impact of seawater reverse osmosis desalination in central Chile was assessed using Life Cycle Assessment (LCA) with the EcoInvent database to address the region’s high water stress. The study analyzed the operational phase using 1 m3 of product water as the functional unit, considering power demand, chemicals, and membranes across eight scenarios that varied energy matrix composition, membrane lifespan, water use, and seawater source. Eighteen environmental indicators were evaluated using the ReCiPe 2016 Midpoint (H) method. Results revealed that eight impact indicators were primarily national in origin, while ten exhibited transboundary characteristics. Power demand was the dominant contributor, exceeding 75% of impacts in 17 of 18 categories. A 25% power increase raised environmental impacts by an average of +21.5%, while the projected 2050 renewable energy scenario showed substantial reductions averaging −43.0%. This demonstrates that power consumption is the principal driver of environmental impacts, underscoring the importance of energy-efficiency measures and integration of Non-Conventional Renewable Energies (NCRE), particularly as fossil-based sources constitute the main contributors to environmental burdens at both national and transboundary scales.

Graphical Abstract

1. Introduction

The depletion of water resources is advancing rapidly, and Chile is no exception, experiencing high water stress in its central and northern regions [1]. Reverse osmosis (RO) desalination technologies, commonly referred to as SWRO when using seawater, are emerging as a solution due to the availability of seawater and the associated water scarcity in the northern and north-central areas of the country.
Globally, reverse osmosis (RO) is the predominant seawater desalination technology, accounting for ~65% of installed capacity, while thermal processes such as MSF and MED together represent about 28% [2,3]. In Chile, the dominance of RO is even more pronounced: all 22 desalination plants currently in operation with capacities greater than 20 L/s use RO technology, totaling ~8200 L/s. If the projects under construction and in the approval pipeline are completed, national capacity is expected to increase to nearly 25,000 L/s by 2028, and all of them are based on RO [4]. The water crisis in Chile is concentrated in the northern desert but increasingly affecting the country’s central region, where most of the population and agricultural production are located. This area combines a high water demand with climate variability, leading to recurrent droughts and long-term water stress [5,6]. In this context, SWRO desalination emerges as an alternative, complementing limited surface and groundwater water sources. Unlike northern Chile, where desalination supplies mining operations, in central Chile this technology is promoted for domestic water use, agriculture, and multisectoral uses, thereby increasing the complexity of its environmental and social implications.
Although life cycle impacts of desalination technologies have been extensively assessed, most studies focus on environmental impacts associated with power consumption in Europe, the Middle East, and Asia [7]. However, these studies do not adequately represent Chile’s specific energy mix, geographic conditions, or regulatory frameworks: Chile’s central region is characterized by a growing integration of non-conventional renewable energies, a strong dependence on hydropower, and the expansion of transmission systems connecting with northern mining demand. These unique features could significantly modify the environmental footprint of desalination compared to international benchmarks.
Applying a life cycle assessment (LCA) to SWRO desalination in central Chile is therefore essential, as it provides context-specific evidence, capturing the combined effect of power demand, chemical use, and membrane replacement under local operational conditions.
While several studies have evaluated desalination from a technical, environmental, and socio-political perspective in northern Chile, where desalination has historically supplied the mining sector, there is a lack of equivalent assessments for central Chile, where desalination is now expanding for domestic, agricultural, and multisectoral uses.
This study provides a decision-making tool for stakeholders to design desalination projects that are both technically viable and environmentally sustainable. By quantifying both national and transboundary impacts, LCA helps anticipate potential trade-offs, such as shifting water scarcity problems to increased greenhouse gas emissions or cross-border supply chain pressures.
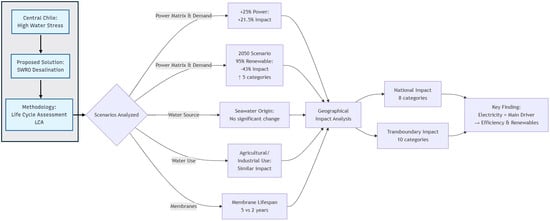
To address this gap, OpenLCA and the EcoInvent database are used to conduct an LCA on the operation of SWRO plants in central Chile. The assessment inventory includes power demand, membranes (SWRO, ultrafiltration), and chemicals (pretreatment, cleaning, mineralization, and potabilization). Eight different scenarios are analyzed to identify the operational conditions under which impacts are minimized. Additionally, the impact mechanisms and their geographical origin are analyzed, indicating whether they occur within the country or beyond Chile’s borders. By locally applying this methodology, the study aims to provide decision-making environmental and geographical factors to promote sustainable desalination practices.

2. Materials and Methods

To evaluate the environmental impacts of desalination plant operations in Chile, a LCA was conducted using OpenLCA software version 2.4, equipped with the EcoInvent 3.10 database. The operational data were primarily obtained through modeling in Dupont’s WAVE software version 1.82, utilizing seawater data from the regions of Valparaíso and Atacama, Chile [8]. The LCA followed the steps outlined in ISO 14040 and 14044 standards [9,10], including goal and scope definition, inventory analysis, impact assessment and interpretation.

2.1. Goal and Scope Definition

A SWRO including an ultrafiltration pretreatment (UF) powered by the National Electric System is analyzed. The focus is on the operational stage of the RO, which includes power demand, chemicals, reverse osmosis and ultrafiltration membranes, thus excluding plant construction.
The system boundaries are defined as cradle-to-gate, encompassing from seawater intake to its output as conditioned water for drinking, agricultural or industrial purposes. The input flows include the use of chemicals, ultrafiltration and reverse osmosis membranes, as well as power consumption. The manufacture of chemicals and membranes, and their transport from manufacturing site to installation location are considered. The assessment also includes the end-of-life (EoL) stage for the RO and ultrafiltration UF membranes, which encompasses transportation from the plant to the landfill and disposal as a mixture of plastic waste. The functional unit used is 1 m3 of conditioned water, allowing for comparisons with other comparable studies [7]. The impact assessment methodology is the widely used ReCipe 2016 midpoint H [11,12,13], considering 18 impact categories: Fine particulate matter formation (FPMF), Fossil resource scarcity (FRS), Freshwater ecotoxicity (FECO), Freshwater eutrophication (FEU), Global warming (GW), Human carcinogenic toxicity (HCT), Human non-carcinogenic toxicity (HCNT), Ionizing radiation (IR), Land use (LU), Marine ecotoxicity (MECO), Marine eutrophication (MEU), Mineral resource scarcity (MRC), Ozone formation human health (OFHH), Ozone formation terrestrial ecosystems (OFTE), Stratospheric ozone depletion (SOD), Terrestrial acidification (TA), Terrestrial ecotoxicity (TECO) and Water consumption (WC).
A recovery rate of 45%, corresponding to the amount of product water obtained from the feed water, was assumed [14]. The lifespan of RO and ultrafiltration membranes is assumed at a 20% annual replacement rate, equivalent to a total replacement every 5 years. Power demand includes a transmission loss factor of 8%. These values along with the quantities of pretreatment, cleaning chemicals, and membranes used for both reverse osmosis and ultrafiltration were sourced from the WAVE software. The amounts of chemicals used in the stages of mineralization, potabilization, and dosing were based on literature [8,15].
A sensitivity analysis was conducted by defining the following scenarios (Table 1), which were compared against the Base scenario to evaluate the influence of key operational parameters on the system’s environmental impacts:
  • Atacama (2): This scenario evaluates how the required dosage of cleaning and treatment chemicals affects environmental impacts. It considers seawater from the Atacama region in northern Chile instead of Valparaíso (Table 2), which modifies the required chemical doses. Note that the same energy consumption is maintained in both scenarios to enable a direct comparison of the chemical impacts.
  • −25% (3), +25% (4) and 2050 (5): These scenarios are based on a reduction of 25% (3.47 kWh/m3) and an increase of 25% (5.78 kWh/m3) of power consumption. The 2050 scenario considers the same power consumption as the base scenario but uses the projected electric generation matrix in 2050 by the “Long-term Energy Planning” (PELP) report by the Ministry of Energy (2025). This scenario (2050) should be interpreted as a sensitivity analysis evaluating how a higher share of non-conventional renewable energy sources (NCRE, Table 3) may influence environmental impacts, rather than as an exact prediction of the 2050 energy and waste management systems. It does not aim to accurately model the precise future generation mix, its associated balancing infrastructure (e.g., BESS), potential shifts in waste management from the current landfill-based approach for membrane end-of-life (EoL), or other potential developments such as improvements in desalination plant efficiency. These elements were excluded because their precise trajectories remain highly uncertain. This uncertainty stems from multiple dynamic factors, including the development of emerging technologies like green hydrogen and BESS, as well as climate change impacts (e.g., prolonged drought) on the generation matrix itself.
  • Agricultural (6) and industrial (7): These scenarios allow the assessment of whether differences in the intended use of the product water impact the environment. The scenarios do not consider potabilization chemicals and alter those used for mineralization due to different quality requirement.
  • Mem 2y (8): This scenario investigates the impact of a higher membrane replacement rate, considering replacement every 2 years instead of every 5 years as in the Base scenario.

2.2. Life Cycle Analysis Inventory

Data from 2023 from Energía Abierta [16] were used to characterize Chile’s electricity generation matrix (Table 3). Additionally, the Ecoinvent 3.10 inventory for reverse osmosis membranes (model SW30XLE-440i) and ultrafiltration (PALL UNA-620), with quantities from the WAVE software [8] were converted to the functional unit (Table 4). For RO, this was performed considering the m2 of active surface. For UF, the calculation was based on the number of membranes required for the flow according to EcoInvent inventory, considering the functional unit. The end-of-life of RO or UF membranes is considered including transportation to a certified landfill. The EcoInvent database’s model for RO membranes includes emissions of 1,1,2-Trichloro-1,2,2-trifluoroethane (CFC-113), an ozone-depleting substance banned under the Montreal Protocol. As this emission factor likely reflects outdated manufacturing methods, it was considered unreliable for this assessment and was excluded from the inventory.
The inventory data for chemicals were calculated specifically for this study, with sources tailored to each sub-group to ensure accuracy and compliance. The dosages were scaled to the study’s functional unit of 1 cubic meter of conditioned water, consistent with the approach established in prior work [8]. The specific sources and calculation methods for each chemical category are as follows:
  • Cleaning Chemicals (CEB + CIP): Dosage data was directly sourced from the WAVE software (Table 4 for all scenarios; Table 5 for Atacama scenario only).
  • Pretreatment Chemicals: Data (Table 4 for all scenarios; Table 5 for Atacama scenario only) were obtained from the WAVE software and bibliographic references [15].
  • Potabilization and Mineralization Chemicals: The chemical dosages for drinking, agricultural, and industrial uses were calculated using national regulations [17,18] and literature [8,15], as detailed in Table 4, Table 6 and Table 7. For potabilization, data were calculated to comply with Chilean standards [17,18], applying a conservative (upper-bound) estimate where a dosage range was provided. For mineralization in agricultural and drinking water conditioning, the addition of magnesium sulfate and calcium carbonate was determined based on the standards, which establish maximum hardness limits but not a minimum [18].
For the 2050 scenario, the projected generation matrix for that year was employed, according to the PELP report [19]. However, the impact attributed to energy storage, estimated to constitute 3.1% of the electricity generation matrix for 2050, was not considered.
Table 3. Energy matrix of Chile’s National Electric System (SEN) for 2023 [16] and projected scenario for 2050 [19].
TechnologyPVNatural GasCoalReservoirRun-of-RiverWind PowerBiomassOilGeother-malCSPStorage
SEN 202319.9%18.3%17.2%16.1%12.5%11.6%2.6%1.1%0.5%0.2%0.0%
SEN 205036.1%0.9%0.0%2.4%4.9%33.50%1.0%0.6%0.2%17.2%3.1%
Table 4. Base scenario inventory. From left to right, the first column shows the input, followed by its value, the measurement unit, and finally the source. Own-calculation indicates that bibliographic data was used and manually converted to the functional unit.
InputValuesUnitSource
Electricity (SEN)4.622KwhEnergía Abierta 2023
Ultrafiltration membrane2.51 × 10−5ItemEcoinvent database
Reverse osmosis membrane0.00083m2Ecoinvent database
(CEB + CIP) Citric acid0.00152KgWAVE model
(CEB + CIP) Sodium hydroxide0.00010KgWAVE model
(CEB + CIP) Sodium hypochlorite0.00162KgWAVE model
(CEB + CIP) Sodium hypochlorite0.00018KgWAVE model
(CEB + CIP) Hydrochloric acid0.00012KgWAVE model
(CEB + CIP) Hydrochloric acid0.00611KgWAVE model
(Mineralization) Calcium carbonate0.06700KgOwn calculation
(Mineralization) Carbon dioxide0.02950KgOwn calculation
(Mineralization) Magnesium sulfate0.05337KgOwn calculation
(Potabilization) Sodium fluoride0.00080KgOwn calculation
(Potabilization) Sodium hypochlorite0.00110KgOwn calculation
(Pretreatment) Sulfuric acid0.00084KgOwn calculation
(Pretreatment) Sodium hypochlorite0.00014KgOwn calculation
(Pretreatment) Polycarboxylate (antiscalant)0.01100KgOwn calculation
(Pretreatment) Sodium sulfite0.00167KgOwn calculation
Note: Values designated as ‘Own calculation’ were determined specifically for this study. The calculation methodology and data sources are detailed in Section 2.2.
Table 5. Inventory for the Atacama scenario.
InputValueUnitSource
(CEB + CIP) Citric acid0.00152KgWAVE model
(CEB + CIP) Sodium hydroxide0.00015KgWAVE model
(CEB + CIP) Sodium hypochlorite0.00162KgWAVE model
(CEB + CIP) Sodium hypochlorite0.00018KgWAVE model
(CEB + CIP) Hydrochloric acid0.00012KgWAVE model
(CEB + CIP) Hydrochloric acid0.00618KgWAVE model
(Pretreatment) Sulfuric acid0.00060KgOwn calculation
(Pretreatment) Sodium hypochlorite0.00014KgOwn calculation
(Pretreatment) Polycarboxylate (antiscalant)0.01100KgOwn calculation
(Pretreatment) Sodium sulfite0.00167KgOwn calculation
Ultrafiltration membrane2.055 × 10−5ItemEcoInvent Database
Note: Values designated as ‘Own calculation’ were determined specifically for this study. The calculation methodology and data sources are detailed in Section 2.2.
Table 6. Inventory for agricultural scenario (variations with respect to the base scenario).
Input (Agricultural)ValueUnitSource
(Mineralization) Calcium carbonate0.10200KgOwn calculation
(Mineralization) Carbon dioxide0.04488KgOwn calculation
Note: Values designated as ‘Own calculation’ were determined specifically for this study. The calculation methodology and data sources are detailed in Section 2.2.
Table 7. Inventory for industrial scenario (variations with respect to the base scenario).
Input (Industrial)ValueUnitSource
(Mineralization) Calcium carbonate0.05700KgOwn calculation
(Mineralization) Carbon dioxide0.02508KgOwn calculation
Note: Values designated as ‘Own calculation’ were determined specifically for this study. The calculation methodology and data sources are detailed in Section 2.2.

3. Results

The calculated indicators and the breakdown of environmental impacts by process for each indicator are presented in Table 8 and Figure 1, respectively. To align with the sensitivity analysis framework of this study and to provide a clear narrative of the consequences of each operational change, the results are organized by scenario. This structure directly facilitates the subsequent discussion of how specific parameter variations influence the overall environmental profile.
Although the chemical dosages differ between the Base and Atacama scenarios (Table 4 and Table 5), this variation did not produce a significant change in the calculated environmental impacts, as evidenced by their identical results across all 18 indicators (Table 8 and Table 9).
For the +25% scenario, indicators are higher for 15 out of 18 scenarios (Table 8) while in the 2050 scenario, most scenarios show greatest decreases compared to the Base scenario (13 out of 18). The largest percentage variations are found in power demand.
There are minimal changes in the Agricultural and Industrial scenarios when compared to the Base scenario (Table 9).
By averaging and categorizing the inventory inputs across indicators, it is found that 86.00% corresponds to electricity, 0.59% to materials, and 13.41% to chemicals (Figure 1a). The impact of the end-of-life (EOL) stage for both ultrafiltration (UF) and reverse osmosis (RO) membranes (landfill disposal) was found to be insignificant and does not contribute measurably to the “UF membrane” and “RO membrane” processes in Figure 1. To compare the variation in each scenario with respect to the Base scenario, a weighted average of all indicators was used. Key aspects of the calculated indicators for each scenario are presented below.
  • Scenario: Base
For all the Base scenario indicators (Figure 1a), electricity is the category with the greatest relevance in terms of impacts, reaching over 90%. The impacts associated with the electricity generation matrix primarily originate from energy generated through coal, natural gas, and, to a lesser extent, wind and photovoltaic sources. The reverse osmosis membrane model used is the SW30XLE-440i. While the EcoInvent database for this model includes emissions of 1,1,2-trichloro-1,2,2-trifluoroethane (CFC-113), a substance harmful to the ozone layer [20,21], this emission was removed from our assessment. This is because the desalination plants in Central Chile are modern, and the use of CFC-113 is prohibited under the Montreal Protocol.
  • Scenario: Atacama
The 18 indicators maintain their value when compared to the Base scenario (Table 9). It can be concluded that, for this study, changing the source of seawater from the Valparaíso region to the Atacama region does not result in significant differences in the categories of pretreatment and cleaning chemicals, which were the categories expected to be affected by changes in seawater properties.
  • Scenario: −25%
Seventeen out of the eighteen indicators decrease, ranging from −24.2% (WC and FPMF) to −12.9% (IR, Table 9). The average decrease is −21.5%.
  • Scenario: +25%
Seventeen out of the eighteen indicators increase, ranging from 12.9% (IR) to 24.2% (FPMF). The average increase is 21.5%
  • Scenario: 2050
The projection of the National Electric System to 2050 indicates a decrease in the values of 13 out of 18 indicators, with FPMF showing the largest decrease (−94.4%), and an increase in 5 out of 18 indicators, with FECO showing the largest increase at 38.2%. Given that this model alters the entire composition of the electricity generation matrix, the increases and decreases in the indicators depend on the technologies used and their corresponding participation percentages. There is a clear shift in the distribution of impacts (Figure 1e), with a reduction in power demand compared to the Base scenario (Figure 1a), particularly in the indicators FPMF, FRS, FEU, OFHH, and OFTE, which are the five indicators with the greatest reduction in impacts. This electricity generation matrix has high percentages of solar energy and wind energy, at 36% and 33%, respectively. Although renewable energy sources are considered to have fewer impacts, in this case, the impacts are greater for the indicators FECO, IR, MECO, MRC, and TECO. This is due to the materials used in the construction of solar panels and wind turbines, particularly concerning the end-of-life management of these materials. Despite the increases and decreases, this scenario is characterized by reductions in magnitude.
  • Scenario: Agricultural
In this scenario, the indicators FECO, HCT, HNCT, MECO, MRC, and TECO increase, while FPMF, FRS, FEU, GW, IR, OFHH, OFTE, and TA decrease, ranging from a reduction of −9.4% to an increase of 3.1% for IR and MRC, respectively. This increase is attributed to the fact that mineralization for this conditioning requires a higher dosage of calcium carbonate, which affects the MRC indicator. It can be observed that the variation in the composition of impacts across the 18 indicators is slight, as mentioned at the beginning of Section 3 (Figure 1f). The average variation is −0.4%.
  • Scenario: Industrial
For this condition, all indicators decrease between −0.9% and −19.1%, with WC and IR being the respective extremes. It is noteworthy that the changes in conditioning are primarily the result of alterations in the chemicals used for mineralization. As mentioned in Section 3, the variations in conditioning scenarios are slight (Figure 1g). The average variation is −4.0%.
  • Scenario: Mem 2y
In this final scenario, the membrane lifespan is reduced from 5 years to 2 years, thereby increasing the replacement rate. As expected, all indicators either increase or remain unchanged, with values ranging from 0.0% to 4.5% with FMPF and IR being the respective extremes (Table 9). The average variation is 0.9%.

4. Discussion

The sensitivity analysis performed confirms that power demand is the most influential factor on environmental impacts (Figure 2), as previously shown [13,22]. Methods to mitigate such impacts [23], such as energy recovery systems, can achieve values of 2–3 kWh/m3 [24]. To illustrate their effects on environmental impacts, a 25% reduction in power consumption (3.5 kWh/m3) led to an average decrease in indicators of −21.5%. The indicators FPMF, WC, and FEU experienced a reduction of over −23% (Table 9). This highlights the importance of enhancing the efficiency of SWRO plants and integrating energy recovery systems into existing or future installations.
A substantial reduction in 13 out of 18 indicators was observed under the projected 2050 electricity generation matrix, foreseeing a dominant contribution from renewable sources (36% solar and 33% wind, Figure 1e). Yet, contrary to the expectation of uniformly lower impacts, five indicators (FECO, IR, MECO, MRC, and TECO) exhibit increases. These results highlight an important trade-off; while the substitution of fossil fuels reduces greenhouse gas emissions and air pollution, large-scale renewable infrastructures introduce pressures associated with the extraction and processing of minerals as well as with the management of end-of-life components (e.g., photovoltaic panels and wind turbine blades). This outcome is particularly relevant in the Chilean context where decarbonization strategies are strongly based on solar and wind but where recycling systems and circular economy policies for renewable technologies remain incipient. The evidence presented here underscores that the benefits of a cleaner energy mix cannot be considered in isolation from the upstream and downstream impacts of renewable technologies. Since the impacts of power consumption are high compared to the contribution of chemicals and materials, the composition of the generation matrix is a key factor. This also means that studies in this area are often closely tied to a specific region or country [11,22]
If the energy source is high in coal (Base scenario), higher values of the FPMF indicator due to the particulate matter generated by thermal power plants are expected. Conversely, as observed in the 2050 scenario, high percentages of solar and wind energy increase some indicators (FECO, MECO, MRC, IR, and TECO). Variable geographic and climate conditions across the country imply that the available non-conventional renewable energies (NCRE) are consequently not uniform. This becomes significant when SWRO projects aim to self-supply their power, as the impacts depend on the site-specific power source. Given the plans to increase non-conventional renewable energy sources in Chile -by 2024, 41% came from these sources [25] the energy matrix is becoming cleaner year by year. This suggests that indicators such as GW, FPMF, FEU, and FRS will decrease, as observed in the 2050 scenario. Based on the research findings, a strategy for reducing environmental impacts is to opt for mixed or transitional energy matrices over those solely dependent on fossil fuels, and to minimize consumption during operation through strategies such as energy recovery.
The energy demand of reverse osmosis desalination is strongly determined by the TDS content of feedwater, making pretreatment a critical factor for both efficiency and sustainability [26,27]. Effective pretreatment reduces fouling and scaling, lowering pressure requirements, energy consumption, and chemical use, while extending membrane lifespan. In contexts such as Chile, where seawater composition varies regionally, this step becomes essential to meet water quality standards and minimize life cycle impacts dominated by electricity use. Although advanced pretreatment technologies can improve performance, they also involve trade-offs in cost and embodied energy, underscoring the need for case-specific assessments. By reducing Base energy demand, optimized pretreatment not only enhances operational performance but also facilitates the integration of desalination with renewable energy sources.
The production and use of chemicals at each stage (pretreatment, cleaning, mineralization, and potabilization) represent the second most significant impact factor, particularly the chemicals used in mineralization. This underscores the importance of accurately dosing the chemicals used. Overuse of chemicals not only has economic consequences but also environmental ones. The indicators with the highest percentages related to chemical use in the Base scenario (Figure 1a) are IR, MRC, MEU, TA, and TECO. When evaluating the Base and Atacama scenarios, no significant differences in impacts are evident. For the Agricultural and Industrial conditioning scenarios, there are no significant changes compared to the Base scenario. For the Industrial scenario, the average reduction is −4.0%, while for the Agricultural scenario, the average reduction is −0.4%. These differences from the Base scenario are related to the conditioning applied to the water based on its intended use. A relationship has been found between mineral water consumption and serum levels [28]. Additionally, it has been shown that drinking water can significantly contribute to the daily intake of essential minerals, such as Ca, Mg, and Zn [29].
In the Agricultural scenario, some indicators increase while others decrease. This is attributed to an increase in calcium carbonate and a decrease in magnesium sulfate compared to the Base scenario, driven by the specific requirements for this application [8]. For both scenarios (agricultural and industrial), the IR indicator exhibits the greatest variation, decreasing by −9.4% for agricultural conditioning and −19.1% for the industrial scenario. This is because the IR indicator has a higher percentage contribution from mineralization chemicals (Figure 1a,g,h), and thus, changes in these chemicals are reflected in the indicator’s value. It is important to note that Chilean regulations do not specify a minimum hardness value, although there is a maximum magnesium concentration limit of 125.0 mg/L [18].
Regarding the membranes used, when compared to electricity and chemicals, they exhibit lower environmental impacts. The membrane used in this study is the model SW30XLE-440i SWRO membrane. According to the EcoInvent database it has CFC113 emissions, which is harmful to the ozone layer, but they were not considered because the Montreal protocol mandates the phase-out of ozone depleting substances. Concerning the membrane replacement scenario, mem2y, two scenarios are evaluated: a 20% annual replacement (total replacement every 5 years) and a 50% annual replacement (total replacement every 2 years). Although less dominant than electricity-related burdens, these increases highlight the cumulative significance of material flows when membrane lifespans are shortened. Consequently, strategies aimed at extending service life through improved pretreatment, as well as initiatives for reuse, refurbishment, or recycling of spent UF and RO membranes, emerge as critical levers for impact reduction. It is important to note that while this study models landfill disposal, evaluating other end-of-life alternatives is critical for a complete understanding within the LCA framework. Beyond their technical benefits, such approaches align with circular economy principles, enhancing resource efficiency and mitigating supply chain dependencies linked to polymeric materials. The Integration of membrane end-of-life management into LCA frameworks was essential, not only to capture the full spectrum of impacts but also to guide innovation toward low-impact alternatives that complement energy efficiency efforts in desalination systems.
The geographical classification of impacts as national or transboundary was methodologically established by tracing the origin of key inputs within the life cycle inventory. The fossil fuels (e.g., coal, natural gas) used for power generation in the SEN are imported, with only their conversion into electricity occurring within Chile. Similarly, the technologies for NCRE generation and the reverse osmosis and ultrafiltration membranes are entirely imported, while the chemicals are predominantly sourced from international markets. By accounting for these import dependencies and utilizing the location-specific data available in the OpenLCA and Ecoinvent framework, we were able to systematically attribute the environmental impacts to either national or transboundary categories. This geographical differentiation made it possible to observe that for eight indicators (FPMF, GW, OFHH, OFTE, TA, SOD, LU and WC), the environmental impacts are generated within the national territory (Figure 2), while the rest are generated beyond the borders. Regarding the primary mechanisms (major contribution to environmental impacts), for the indicators FPMF, GW, OFHH, OFTE, SOD and TA, the predominant mechanism is power generation through coal, which directly arises from production. FPMF and GW are two of the most recognized indicators by Chilean consumers and are also more regulated [30]. The LU indicator is attributed to land use for obtaining raw materials used as biomass. This impact can decrease depending on the assumptions made, as biomass generation often utilizes by-products. The WC indicator is linked to electricity generation in reservoir-based hydroelectric plants, particularly due to water loss caused by evaporation. For the indicators FRS, FECO, FEU, HNCT, MECO, MEU, and MRC, the impact mechanisms are found in the stages of extraction, preparation, and waste from coal mining, primarily mining waste. For HCT, these relate to materials used in the construction of natural gas plants; for IR, they correspond to the production of inputs for magnesium sulfate. For TECO, the primary mechanism is coke, which is produced during the manufacture of construction materials for plants, primarily those fueled by natural gas. Indicators and the locations of their impacts are not well known, with greater emphasis placed on global warming indicators [31].
Although this study focuses on the environmental performance of SWRO systems, it is important to recognize that the long-term feasibility of desalination in Chile is not determined solely by technical or environmental indicators. Social acceptance and regulatory conditions have increasingly shaped project development, particularly in regions where desalinated water is intended for public supply or agriculture. In Chile, several desalination initiatives have encountered community resistance linked to marine ecosystem impacts, privatization of water access, brine discharge, and concerns that desalination may reinforce an extractive development model rather than promote integrated water governance. Recent case studies in northern Chile highlight that even technically efficient desalination plants may face delays or legal disputes if they fail to engage local stakeholders or align with evolving regulatory frameworks on coastal concessions, water rights, and environmental licensing [32,33,34]. Therefore, future LCAs should incorporate not only environmental metrics but also socio-institutional factors, as the success of desalination increasingly depends on its legitimacy within territorial and policy contexts.
Based on the scenario analysis, several operational strategies emerge as relevant for reducing the environmental footprint of SWRO in Chile. Since energy consumption accounts for more than 75% of the impacts in most categories, priority should be given to high-efficiency pumping systems, energy recovery devices and optimized pressure management. The strong reductions observed under the 2050 renewable-energy scenario also indicate that hybrid configurations that combine grid electricity with on-site photovoltaic or wind generation can significantly lower impacts. Optimizing pretreatment and cleaning regimes can reduce both chemical demand and membrane replacement frequency, which aligns with current circular-economy initiatives in the sector. In addition, the results highlight the importance of economies of scale, since larger plants achieve lower specific energy use (kWh m3) and reduced material intensity per unit of water produced. Multipurpose desalination plants, capable of supplying industrial, agricultural and municipal users simultaneously, also improve resource efficiency by stabilizing demand profiles and increasing infrastructure utilization. Finally, extending membrane lifespan or enabling reuse pathways is relevant, given that accelerated replacement significantly increases environmental burdens. Overall, the findings show that environmental performance depends not only on technological choice but also on operational strategies involving energy integration, plant scale, end-use configuration and material circularity.
It is essential to note that having a life cycle assessment inventory with local and up-to-date data is crucial, not only for accurately identifying where each impact is generated, but also for more accurately representing environmental impacts within a national context. It was noted that the process of generating energy with coal has negative ecological impacts both domestically and internationally, and at various stages (extractive and productive). This may change as Chile undergoes an energy transition process, where national plans aim to retire and convert coal plants [35], in addition to increasing the percentage of renewable energy sources, particularly wind and solar (see 2050 scenario, Figure 1e).

Limitations of This Work

While this study provides a valuable assessment of the environmental impacts of desalination in central Chile, it is important to acknowledge its limitations for the correct interpretation of the results and to guide future research.
  • Choice of membrane model. The membrane used in both the WAVE modeling and the LCA corresponds to the SW30XLE-440i model, available in the EcoInvent database. While this is a representative model, the reverse osmosis membrane industry constantly evolves towards products with higher energy efficiency and flow. Therefore, the impacts associated with the membrane could vary with other models, and the results may not fully reflect future market practices.
  • Geographical specificity of coal impacts. The life cycle impacts of coal-fired power generation, a main contributor in many indicators, are derived from generic inventory data from EcoInvent. These may not fully capture the particularities of the Chilean supply chain and its fluctuations (since the origin of the coal varies frequently) or the impacts of coal mining in the regions of origin. This limitation affects the accuracy of the geographical traceability of transboundary impacts, although it does not invalidate the overall classification of impacts by their origin (national or transboundary).
  • Exclusion of local operational impacts from brine discharge. The local impacts of brine discharge, such as the formation of saline plumes and the effects of chemical additives (antiscalants, antioxidants) on coastal ecosystems, are not captured by this assessment. These impacts are site-specific and species-specific and are currently subject to study and discussion in Chile.
  • Uncertainty associated with cleaning and chemical dosages. The quantities of chemicals used in pretreatment, membrane cleaning, and water conditioning can vary significantly in real operation due to the specific operational strategies of each plant. This variability introduces a degree of uncertainty in the environmental contribution attributed to chemicals.
  • Recovery rate assumption. A fixed recovery rate of 45% was assumed, a standard value, but one that can vary across different facilities. For example, smaller plants may operate with lower rates and therefore present higher environmental impacts.

5. Conclusions

The ReCiPe 2016 Midpoint (H) modeling allowed for the geographical classification of impacts, identifying eight as national and ten as transboundary. The mechanisms with the greatest contribution in both categories originate from coal (i.e., energy production, extractive, or manufacturing processes), highlighting the importance of reducing the percentage of fossil energy sources and increasing that of renewable energies.
Results indicate that power generation for operating SWRO plants contributes to all impact categories evaluated for all scenarios, except for the 2050 scenario, aligning with previous studies [7,13,24].
For scenarios where there was variation in power demand or the matrix (Atacama, Agricultural, Industrial, Mem 2y), there are minimal differences in the results (Figure 1b,f–h). The Mem 2y scenario shows an increase in all indicators. It is thus recommended to have plans for reusing or refurbishing membranes, given their replacement rate, to extend their useful life.
For the conditioning Agricultural and Industrial scenarios, indicators decreased compared to the Base scenario primarily due to the removal of magnesium sulfate from the mineralization chemicals.
Significant differences are found when changes are made to the generation matrix and to the demand value. By reducing or increasing the power demand by 25%, there is an average impact reduction of −21.5% or an increase of 21.5%, respectively, making the variable the most sensitive in the study. Taking the GW indicator from the Base scenario as an example (Figure 1a), when power demand is increased by 25%, impacts rise by 22.7% (Figure 1d). This demonstrates the relevance of power demand in the GW indicator. Reducing the amount of chemicals used by 25% or decreasing the membrane replacement rate by 25% results in minor reductions in impacts. When comparing scenarios, the greatest reduction occurs in the 2050 generation matrix projection (Figure 1e), which is highly based on renewable energy sources (36% solar and 33% wind). However, five indicators have increased (FECO, IR, MECO, MRC, and TECO) due to the end-of-life of photovoltaic panels and wind turbines, exemplifying the usefulness of this methodology in conducting a traceability exercise of these impacts. The average variation for this scenario is 36.94% (Table 2). This highlights the advantage of having a matrix inclined towards non-conventional renewable energies, aligning with Chile’s strategic plans [25].
The operational power demand is a primary source of environmental impacts, and therefore, it is crucial to plan strategies (i.e., recovery technologies and renewable energy generation wind or solar alternatives) that are essential for their mitigation. Future studies should integrate economic indicators such as Levelized Cost of Water (LCOW) and cost–benefit analysis to provide a more comprehensive assessment of mitigation strategy viability.

Author Contributions

Conceptualization, R.M.-O. and A.-E.O.-R.; Data curation, R.M.-O.; Formal analysis, R.M.-O. and A.-E.O.-R.; Funding acquisition, A.-E.O.-R.; Investigation, R.M.-O. and A.-E.O.-R.; Methodology, R.M.-O. and A.-E.O.-R.; Project administration, A.-E.O.-R.; Resources, A.-E.O.-R.; Software, R.M.-O.; Supervision, A.-E.O.-R.; Validation, A.-E.O.-R., C.M.-A. and J.C.-O.; Visualization, R.M.-O.; Writing—original draft, R.M.-O.; Writing—review and editing, A.-E.O.-R., C.M.-A. and J.C.-O. All authors have read and agreed to the published version of the manuscript.

Funding

This research was partially funded by the project ANID IDeA I + D 2023 ID23I10336 and the APC was funded by the “Programa de Apoyo Complementario a la Investigación 2025: Programa de Apoyo a Iniciativas en Curso” of the DGIIE—Universidad Técnica Federico Santa María.

Data Availability Statement

In accordance with MDPI’s policy, we support the sharing of research data. The data supporting the findings of this study are available within this article. All relevant inventory data and results are presented in the tables and figures of the manuscript. Should any additional data or the underlying inventory in a different format be required, they are available from the corresponding author upon reasonable request.

Acknowledgments

The authors sincerely acknowledge Patricio Winckler from the School of Ocean Engineering, Faculty of Engineering, Universidad de Valparaíso, Chille, for his valuable feedback on an earlier draft of this work. All authors have read and agreed to the published version of the manuscript.

Conflicts of Interest

The authors declare no conflicts of interest. The funders had no role in the design of the study; in the collection, analyses, or interpretation of data; in the writing of the manuscript; or in the decision to publish the results.

Abbreviations

The following abbreviations are used in this manuscript:
Technical and Process Abbreviations
CEBChemically Enhanced Backwashing
CIPClean in Place
LCALife Cycle Assessment
MEDMulti-Effect Distillation
MSFMulti-Stage Flash Distillation
NCRENon-Conventional Renewable Energies
ROReverse Osmosis
SWROSeawater Reverse Osmosis
TDSTotal Dissolved Solids
UFUltrafiltration
Environmental Impact Categories (ReCiPe 2016)
FPMFFine Particulate Matter Formation
FRSFossil Resource Scarcity
FECOFreshwater Ecotoxicity
FEUFreshwater Eutrophication
GWGlobal Warming
HCTHuman Carcinogenic Toxicity
HCNTHuman Non-carcinogenic Toxicity
IRIonizing Radiation
LULand Use
MECOMarine Ecotoxicity
MEUMarine Eutrophication
MRCMineral Resource Scarcity
OFHHOzone Formation, Human Health
OFTEOzone Formation, Terrestrial Ecosystems
SODStratospheric Ozone Depletion
TATerrestrial Acidification
TECOTerrestrial Ecotoxicity
WCWater Consumption
Institutional and Regional Abbreviations
PELPLong-term Energy Planning (Planificación Energética de Largo Plazo)
SENNational Electric System (Sistema Eléctrico Nacional)

References

  1. Food and Agriculture Organization of the United Nations; UN-Water. Progress on the Level of Water Stress: Mid-Term Status of SDG Indicator 6.4.2 and Acceleration Needs, with Special Focus on Food Security; FAO: Rome, Italy, 2024. [Google Scholar] [CrossRef]
  2. Behnam, P.; Faegh, M.; Khiadani, M. A Review on State-of-the-Art Applications of Data-Driven Methods in Desalination Systems. Desalination 2022, 532, 115744. [Google Scholar] [CrossRef]
  3. Almasoudi, S.; Jamoussi, B. Desalination Technologies and Their Environmental Impacts: A Review. Sustain. Chem. One World 2024, 1, 100002. [Google Scholar] [CrossRef]
  4. ACADES, Asociación Chilena de Desalinización. Primer Catastro Nacional de Plantas Desalinizadoras en Chile. 2025. Available online: https://www.acades.cl/catastro-plantas-y-proyectos/ (accessed on 14 May 2025).
  5. Herrera-León, S.; Cruz, C.; Negrete, M.; Chacana, J.; Cisternas, L.A.; Kraslawski, A. Impact of Seawater Desalination and Wastewater Treatment on Water Stress Levels and Greenhouse Gas Emissions: The Case of Chile. Sci. Total Environ. 2022, 818, 151853. [Google Scholar] [CrossRef] [PubMed]
  6. Boisier, J.P.; Alvarez-Garreton, C.; Marinao, R.; Galleguillos, M. Increasing Water Stress in Chile Evidenced by Novel Datasets of Water Availability, Land Use and Water Use. EGUsphere, 2024; preprint. [Google Scholar] [CrossRef]
  7. Aziz, N.I.H.A.; Hanafiah, M.M. Application of Life Cycle Assessment for Desalination: Progress, Challenges and Future Directions. Environ. Pollut. 2020, 268, 115948. [Google Scholar] [CrossRef] [PubMed]
  8. Carrasco Muñoz, C. Análisis Cuantitativo de Consumo de Energía y Materiales de Plantas Desalinizadoras de Agua de Mar mediante Ósmosis Inversa. Bachelor’s Thesis, Universidad Técnica Federico Santa María, Valparaíso, Chile, 2024. [Google Scholar] [CrossRef]
  9. ISO 14040:2006+A1:2020; Environmental Management—Life Cycle Assessment—Principles and Framework. International Organization for Standardization (ISO): Geneva, Switzerland, 2020.
  10. ISO 14044:2006+A2:2020; Environmental Management—Life Cycle Assessment—Requirements and Guidelines. International Organization for Standardization (ISO): Geneva, Switzerland, 2020.
  11. Abdul Ghani, L.; Ali, N.; Nazaran, I.S.; Hanafiah, M.M. Environmental Performance of Small-Scale Seawater Reverse Osmosis Plant for Rural Area Water Supply. Membranes 2021, 11, 40. [Google Scholar] [CrossRef] [PubMed]
  12. Alhaj, M.; Al-Ghamdi, S.G. Integrating Concentrated Solar Power with Seawater Desalination Technologies: A Multi-Regional Environmental Assessment. Environ. Res. Lett. 2019, 14, 074014. [Google Scholar] [CrossRef]
  13. Fayyaz, S.; Masjedi, S.K.; Kazemi, A.; Khaki, E.; Moeinaddini, M.; Olsen, S.I. Life Cycle Assessment of Reverse Osmosis for High-Salinity Seawater Desalination Process: Potable and Industrial Water Production. J. Clean. Prod. 2022, 382, 135299. [Google Scholar] [CrossRef]
  14. Turek, M.; Mitko, K.; Piotrowski, K.; Dydo, P.; Laskowska, E.; Jakóbik-Kolon, A. Prospects for High Water Recovery Membrane Desalination. Desalination 2016, 401, 180–189. [Google Scholar] [CrossRef]
  15. Voutchkov, N. Desalination Engineering: Planning and Design; McGraw-Hill: New York, NY, USA, 2013. [Google Scholar]
  16. Energía Abierta. Evolución de la Generación Bruta. Available online: http://energiaabierta.cl/visualizaciones/evolucion-generacion-bruta/ (accessed on 5 May 2025).
  17. Instituto Nacional de Normalización. Norma Chilena NCh 1333: Requisitos de Calidad del Agua para Diferentes Usos; INN: Santiago, Chile, 1987. [Google Scholar]
  18. Instituto Nacional de Normalización. Norma Chilena NCh 409/1: Agua Potable—Parte 1—Requisitos; INN: Santiago, Chile, 2005. [Google Scholar]
  19. Ministerio de Energía—Gobierno de Chile. Proyecciones Eléctricas. Available online: https://energia.gob.cl/pelp/proyecciones-electricas (accessed on 5 May 2025).
  20. United Nations Environment Programme. Global Increase of Ozone-Depleting CFCs from 2010–2020; UNEP: Nairobi, Kenya, 2023; Available online: https://ozone.unep.org/sites/default/files/2023-04/Global%20increase%20of%20ozone-depleting%20CFCs%20from%202010-2020.pdf (accessed on 14 May 2025).
  21. Trafton, A. New Emissions of Ozone-Depleting Chemicals Are Slowing the Recovery of the Ozone Layer. MIT News, 17 March 2020. Available online: https://news.mit.edu/2020/emissions-ozone-cfc-chemicals-0317 (accessed on 14 May 2025).
  22. Najjar, E.; Al-Hindi, M.; Massoud, M.; Saad, W. Life Cycle Assessment of a Seawater Reverse Osmosis Plant Powered by a Hybrid Energy System (Fossil Fuel and Waste to Energy). Energy Rep. 2021, 7, 448–465. [Google Scholar] [CrossRef]
  23. Zarzo, D.; Prats, D. Desalination and Energy Consumption: What Can We Expect in the Near Future? Desalination 2018, 427, 1–9. [Google Scholar] [CrossRef]
  24. Raluy, G.; Serra, L.; Uche, J. Life Cycle Assessment of MSF, MED and RO Desalination Technologies. Energy 2006, 31, 2361–2372. [Google Scholar] [CrossRef]
  25. Ministerio de Energía de Chile. ERNC y Otro Récord: Generación Eléctrica en Base a Este Tipo de Energía Llegó al 41% en lo que Va de 2024. Available online: https://energia.gob.cl/noticias/nacional/ernc-y-otro-record-generacion-electrica-en-base-este-tipo-de-energia-llego-al-41-en-lo-que-va-de-2024 (accessed on 14 May 2025).
  26. Abushawish, A.; Bouaziz, I.; Almanassra, I.W.; Al-Rajabi, M.M.; Jaber, L.; Khalil, A.K.A.; Takriff, M.S.; Laoui, T.; Shanableh, A.; Atieh, M.A.; et al. Desalination Pretreatment Technologies: Current Status and Future Developments. Water 2023, 15, 1572. [Google Scholar] [CrossRef]
  27. Lugo, A.; Mejía-Saucedo, C.; Senanayake, P.S.; Stoll, Z.; Sitterley, K.; Wang, H.; Kota, K.; Kuravi, S.; Fthenakis, V.; Kurup, P.; et al. Technical, Economic, Energetic, and Environmental Evaluation of Pretreatment Strategies for Scaling Control in Brackish Water Desalination Brine Treatment. Water 2025, 17, 708. [Google Scholar] [CrossRef]
  28. Thippeswamy, H.M.; Shanbhog, R.; Kumar, M.N.; Prashanth, S.N.; Smitha, P. Comparison of Serum Calcium, Magnesium, Phosphate, Alkaline Phosphatase, and Vitamin D Levels in Children Consuming Reverse Osmosis, Non Reverse Osmosis, and High Fluoride Drinking Water. Sci. Rep. 2025, 15, 10689. [Google Scholar] [CrossRef] [PubMed]
  29. Agbasi, J.C.; Alkasimi, A.; Turki, A.F.; Abba, S.I.; Khan, M.Y.A.; Egbueri, J.C. Reimagining Water Quality Assessment: A Nutritional Indexing Perspective for Drinking Water Resources Management. Int. J. Environ. Anal. Chem. 2025, 1–27. [Google Scholar] [CrossRef]
  30. Ministerio del Medio Ambiente. Decreto 12: Establece Norma Primaria de Calidad Ambiental para Material Particulado Respirable MP10. Biblioteca del Congreso Nacional de Chile, 2022. Available online: https://www.bcn.cl/leychile/navegar?idNorma=1176988 (accessed on 14 May 2025).
  31. Lee, K.; Jepson, W. Environmental Impact of Desalination: A Systematic Review of Life Cycle Assessment. Desalination 2021, 509, 115066. [Google Scholar] [CrossRef]
  32. Herrera-León, S.; Cruz, C.; Kraslawski, A.; Cisternas, L.A. Current situation and major challenges of desalination in Chile. Desalination Water Treat. 2019, 171, 93–104. [Google Scholar] [CrossRef]
  33. Campero, C.; Bennett, N.J.; Arriagada, N. Technologies of dispossession in the blue economy: Socio-environmental impacts of seawater desalination in the Antofagasta Region of Chile. Geogr. J. 2022, 189, 231–245. [Google Scholar] [CrossRef]
  34. Rodríguez Martínez, A. Evaluating Alternative Water Sources for Copper Processing: A Life Cycle Assessment of Seawater and Desalination in Northern Chile. Master’s Thesis, Technical University of Leoben, Leoben, Austria, 2024. [Google Scholar] [CrossRef]
  35. Ministerio de Energía, Gobierno de Chile. Plan de Retiro y/o Reconversión de Unidades a Carbón. 2020. Available online: https://energia.gob.cl/sites/default/files/plan_de_retiro_y_o_reconversion_centrales_carbon.pdf (accessed on 14 May 2025).
Figure 1. Breakdown of environmental impacts by process for each indicator.
Sustainability 17 11178 g001
Figure 2. Geographical distribution (national vs. transboundary) of environmental impacts across all indicators for the Base scenario.
Sustainability 17 11178 g002
Table 1. Assessment scenarios. The second column displays the base scenario, while each subsequent column shows the variations for a specific scenario. For example, in the ‘Atacama’ scenario, only the seawater parameter changes, while all other columns remain constant. Potable means it uses potabilization and mineralization chemicals, while agricultural and industrial only uses mineralization chemicals.
ScenarioLocationPower ConsumptionWater ConditioningMembrane
NameBaseAtacama−25%+25%2050AgriculturalIndustrialMem 2y
#12345678
SeawaterValparaísoAtacamaValparaísoValparaísoValparaísoValparaísoValparaísoValparaíso
kWh/m34.6224.6223.475.784.6224.6224.6224.622
Matrix20232023202320232050202320232023
UsePotablePotablePotablePotablePotableAgriculturalIndustrialPotable
Lifespan5 years5 years5 years5 years5 years5 years5 years2 years
Table 2. Seawater characteristics from regions Valparaíso and Atacama [8].
VariableAtacamaValparaísoUnits
Turbidity0.961.00NTU
Total Suspended Solids9.8846.50mg/L
Density of Sediments Index4.883.00-
Total Organic Carbon4.003.00mg/L
Minimum Temperature12.75°C
Medium Temperature13.56°C
Maximum Temperature14.27°C
pH7.537.74-
Table 8. Environmental impacts across 18 indicators. Red indicates higher impacts; green indicates lower impacts.
IndicatorUnitBaseAtacama−25%+25%2050AgriculturalIndustrialMem 2y
FPMFg PM 2.5 eq16.3316.3312.3720.290.9116.2916.1516.33
FRSkg oil eq0.600.600.460.740.110.600.590.61
FECOkg 1,4-DCB0.080.080.060.100.110.080.080.08
FEUg P eq0.930.930.711.150.120.920.910.93
GWkg CO 2 eq2.052.051.582.520.432.052.002.07
HCTkg 1,4-DCB0.280.280.220.340.190.280.270.28
HNCTkg 1,4-DCB1.971.971.532.400.791.971.921.98
IRBq Co-60 eq13.4613.4611.7315.2013.8912.1910.8914.07
LU m 2 a crop eq0.080.080.060.100.060.080.080.08
MECOkg 1,4-DCB0.110.110.090.140.150.110.110.11
MEUg N eq0.080.080.070.100.030.080.080.09
MRCg Cu eq2.622.622.113.133.612.702.492.65
OFHHg NOx eq7.537.535.929.141.717.497.117.56
OFTEg NOx eq7.727.726.069.371.777.677.297.74
SODmg CFC11 eq0.530.530.420.640.170.530.510.54
TAg SO 2 eq8.328.326.5610.092.318.287.898.36
TECOkg 1,4-DCB10.2910.298.1812.3911.2810.409.7810.40
WCL29.3229.3222.2336.407.8729.3229.0629.43
Table 9. Environmental impacts (percentage change relative to the base scenario). Red highlights higher percentages; green denotes lower percentages.
IndicatorBaseAtacama−25%+25%2050AgriculturalIndustrialMem 2y
FPMF-0.0%−24.2%24.2%−94.4%−0.2%−1.1%0.0%
FRS-0.0%−23.0%23.0%−81.0%−0.2%−2.4%0.6%
FECO-0.0%−22.4%22.4%38.2%1.1%−2.3%0.7%
FEU-0.0%−23.7%23.7%−87.1%−1.1%−2.2%0.0%
GW-0.0%−22.7%22.7%−78.9%−0.1%−2.8%0.7%
HCT-0.0%−22.1%22.1%−31.9%0.6%−3.2%0.6%
HNCT-0.0%−22.1%21.9%−59.9%0.0%−2.3%0.6%
IR-0.0%−12.9%12.9%3.2%−9.4%−19.1%4.5%
LU-0.0%−22.8%22.8%−27.3%0.0%−1.3%0.3%
MECO-0.0%−22.3%22.3%29.0%1.0%−2.5%0.7%
MEU-0.0%−19.2%18.8%−63.3%0.0%−2.1%1.7%
MRC-0.0%−19.5%19.5%37.8%3.1%−5.0%1.1%
OFHH-0.0%−21.4%21.4%−77.3%−0.5%−5.6%0.4%
OFTE-0.0%−21.5%21.4%−77.1%−0.6%−5.6%0.3%
SOD-0.0%−21.3%21.2%−68.1%−0.8%−3.8%1.4%
TA-0.0%−21.2%21.3%−72.2%−0.5%−5.2%0.5%
TECO-0.0%−20.5%20.5%9.6%1.1%−4.9%1.1%
WC-0.0%−24.2%24.1%−73.2%0.0%−0.9%0.4%
Disclaimer/Publisher’s Note: The statements, opinions and data contained in all publications are solely those of the individual author(s) and contributor(s) and not of MDPI and/or the editor(s). MDPI and/or the editor(s) disclaim responsibility for any injury to people or property resulting from any ideas, methods, instructions or products referred to in the content.

