Article

Integrated Accounting of the Gross Ecosystem Product (GEP) of Pingtan, Fujian, China

1
Island Research Center, Ministry of Natural Resources, Pingtan 350400, China
2
School of Marine Science and Engineering, Nanjing Normal University, Nanjing 210023, China
3
Fujian Provincial Key Laboratory of Island Conservation and Development, Island Research Center, Ministry of Natural Resources, Pingtan 350400, China
*
Authors to whom correspondence should be addressed.
Sustainability 2025, 17(23), 10647; https://doi.org/10.3390/su172310647
Submission received: 27 October 2025 / Revised: 24 November 2025 / Accepted: 26 November 2025 / Published: 27 November 2025

Abstract

Accounting for Gross Ecosystem Product (GEP) is a crucial approach for quantifying ecological value, assessing the contributions of ecosystems to human well-being, and supporting sustainable development decision-making. For the Pingtan Comprehensive Experimental Zone, an island-centered administrative region, we developed a GEP indicator system and accounting framework tailored to islands for integrated accounting of terrestrial and marine ecosystems. We used a functional value approach that combines biophysical models with statistical data and conducts physical and monetary accounting in two steps. The accounting methods and procedures were refined to exclude resource and labor inputs from production processes and eliminate external contributions. From 2015 to 2023, the GEP increased by 9.118 billion CNY, representing an increase of 133.03%. The total GEP exhibited a phased rapid–slow–rapid fluctuation pattern over time. The value structure shifted from being dominated by material supply services to being dominated by cultural services. The high-value areas of flood regulation exhibited a clear expansion trend, whereas water conservation and climate regulation showed a fragmented decline. Carbon sequestration, oxygen release, and soil retention remained relatively stable. The findings support evaluating the effectiveness of ecological conservation, implementing ecological compensation, and formulating sustainable development policies in the Pingtan Comprehensive Experimental Zone.

1. Introduction

A development model driven only by Gross Domestic Product (GDP) growth is insufficient as an indicator of sustainable social progress [1,2]. To address this limitation, there is an urgent need to establish an ecological output indicator that corresponds to GDP. Therefore, Chinese researchers pioneered the concept of the Gross Ecosystem Product (GEP) in 2013 [3], hereafter referred to as GEP. GEP refers to the aggregate monetary value of ecosystem-derived goods and services received by people, encompassing material supply, regulating, and cultural service values. It addresses the limitations of GDP, which fails to fully capture the contributions of nature to economic activities and human well-being [4]. The accounting process for GEP enables one to quantify the economic value of contributions to a particular regional ecosystem, thereby providing an evidence-based foundation for evaluating the outcomes of ecological protection, restoration, and management efforts. This study offers robust scientific support for the formulation of region-specific policies for ecological protection and sustainable development [5].
The accounting framework of the GEP originates from ecological asset accounting and the valuation of ecosystem services. In 1997, Costanza et al. estimated the value of 17 categories of global ecosystem services and clarified the fundamental principles and methodologies of value assessment [6]. Daily data further refine the classification of ecosystem services [7]. In 2001, the United Nations launched the Millennium Ecosystem Assessment (MA) [8], which organized ecosystem services into four main categories: provisioning, regulating, cultural, and supporting. In doing so, it substantially advanced international research on the valuation of ecosystem services. Building on the MA framework, initiatives, such as TEEB, IPBES, and SEEA–EEA, proposed new accounting classification systems, further encouraging governments worldwide to incorporate GEP into their national economic accounting frameworks. As an emerging research field grounded in ecosystem services, GEP has attracted increasing academic attention over the past two decades, with more than 400 published articles using it as a keyword [9]. Research on GEP accounting covers a wide range of ecosystem types and spatial scales. Regarding accounting targets, existing studies have mainly focused on forests [10], grasslands [11,12], wetlands [13], marine [14], and agricultural ecosystems [15,16]. Some studies have focused on specific ecological function zones or protected areas, such as nature reserves [17] and national parks [18,19]. Studies have been conducted at multiple levels, ranging from national [20,21], provincial [22,23], municipal [24,25], and county levels [26,27] to watershed scales [28,29]. Fine-scale accounting has received growing attention, with research increasingly extending to more localized spatial units, such as towns and administrative villages [30,31], enhancing the operability and policy applicability of GEP accounting results. In 2021, the United Nations released the SEEA–EA framework, incorporating GEP as a monetary indicator [32], marking its formal recognition at the international level. Pacetti et al. [33] introduced the GEP framework into the European context and applied it to a case study in the Apennines east of Parma, Italy, demonstrating its feasibility for natural capital accounting and policy practices. The Chinese government has attached considerable importance to GEP accounting, issuing a series of technical guidelines and regulatory documents at both the national and local levels [34,35,36,37,38,39]. This has created a favorable environment for ecological value assessment [40]. GEP has been applied or is planned to be applied in various decision-making contexts in China, and in other countries, such as Colombia, Sri Lanka, and Sweden [41].
The GEP accounting methods provide support for establishing a scientifically sound and unified accounting framework. Currently, three relatively well-developed approaches are commonly used, that is, the equivalent factor, emergy, and functional value methods. First proposed by Costanza et al. [6], the equivalent factor method establishes a value equivalent factor table and estimates the monetary value of ecosystem services based on the distribution areas of different ecosystem types. Developed by ecologist Odum [42], the emergy method converts various ecosystem services into a common energy unit using emergy conversion rates, making it suitable for large-scale studies. The functional value method is the most widely used. Its accounting framework first involves calculating the physical quantities of ecosystem services through statistical surveys or ecological models, such as soil loss equations and evapotranspiration models, and then converting them into monetary values using methods such as market valuation and replacement cost approaches [43]. This method achieves relatively high accounting precision and reflects ecosystem services, offering strong specificity and applicability. However, this method is computationally complex, requires extensive parameters and data, and the results are sensitive to price fluctuations [44]. The functional value method is particularly suitable for regional accounting at smaller spatial scales and provides robust support for localized decision making. In China, the current technical standards for ecological product accounting generally use this method as the primary approach.
As key geographical units at the intersection of land and sea, islands are crucial for safeguarding maritime rights, expanding territorial space, and supporting the development of the marine economy, and are concentrated areas of diverse ecosystems and essential ecological service functions. However, island ecosystems are generally limited in area, have low resource-carrying capacity, and are highly sensitive to external disturbances, such as climate change, sea level rise, and human activities, exhibiting pronounced ecological fragility. Against this background, prior studies on the GEP accounting for the islands are inadequate. Most research has focused on either terrestrial or marine dimensions alone [14,45], or lacks an integrated land–sea framework. Indicator systems often overlook the socioecological coupling of islands, resulting in the omission of key ecosystem service values. In terms of temporal scale, many studies are confined to a single year or, when covering longer periods, account only for the initial and final years [24,27,30], failing to show the dynamic evolution of ecosystem values. These limitations highlight the theoretical and practical importance of developing a multi-period GEP accounting framework for islands with strategic geographical positioning and high ecological vulnerability to deepen our understanding of ecological value and support evidence-based decision-making.
As a major maritime nation, China has numerous islands that play crucial roles in regional ecological security and sustainable development. The Pingtan Comprehensive Experimental Zone is an island-centered administrative region characterized by its natural landscapes and abundant tourism resources. However, with the advancement of the International Tourism Island Initiative, the intensity of development and use has continued to increase, leading to substantial changes in ecosystem structure and function. Against a backdrop of rapid development, the conflict between development and conservation has become increasingly prominent. Problems, such as an insufficient understanding of ecosystem service values and a lack of evaluation of ecological benefits, urgently need to be addressed by establishing a scientific accounting framework to support ecological management and policy decision-making. Although local governments have implemented multiple ecological restoration and protection measures, the effectiveness of these initiatives and their ecological contributions remain difficult to fully assess without a systematic evaluation framework. Therefore, conducting GEP accounting research in island regions is of considerable importance for identifying ecosystem values, evaluating management performance, and providing a robust scientific basis to promote the coordinated development of ecological protection and socioeconomic growth.
In this study, we aimed to develop an indicator system and an analytical framework suitable for island ecosystems. The specific objectives of this study are as follows:
(1)
Taking the Pingtan Comprehensive Experimental Zone as a case study, establish an indicator system consistent with its socioecological characteristics, optimize the method framework, and account for the region’s GEP in four benchmark years (2015, 2018, 2021, and 2023) using biophysical models.
(2)
Based on the multiperiod accounting results, we analyzed the spatial and temporal variations and structural evolution of GEP and explored the main driving forces behind its value increase.
(3)
Considering local resource endowments and development potential, strategic recommendations were proposed to promote GEP growth.
In line with these objectives, we further put forward a clear research hypothesis for empirical testing: Cultural ecosystem services will dominate the GEP structure in the Pingtan Comprehensive Experimental Zone because of the tourism-oriented development strategy of the zone. Specifically, we expect the contribution of cultural services to total GEP to exceed that of provisioning and regulating services across the four benchmark years.

2. Materials and Methods

2.1. Study Area

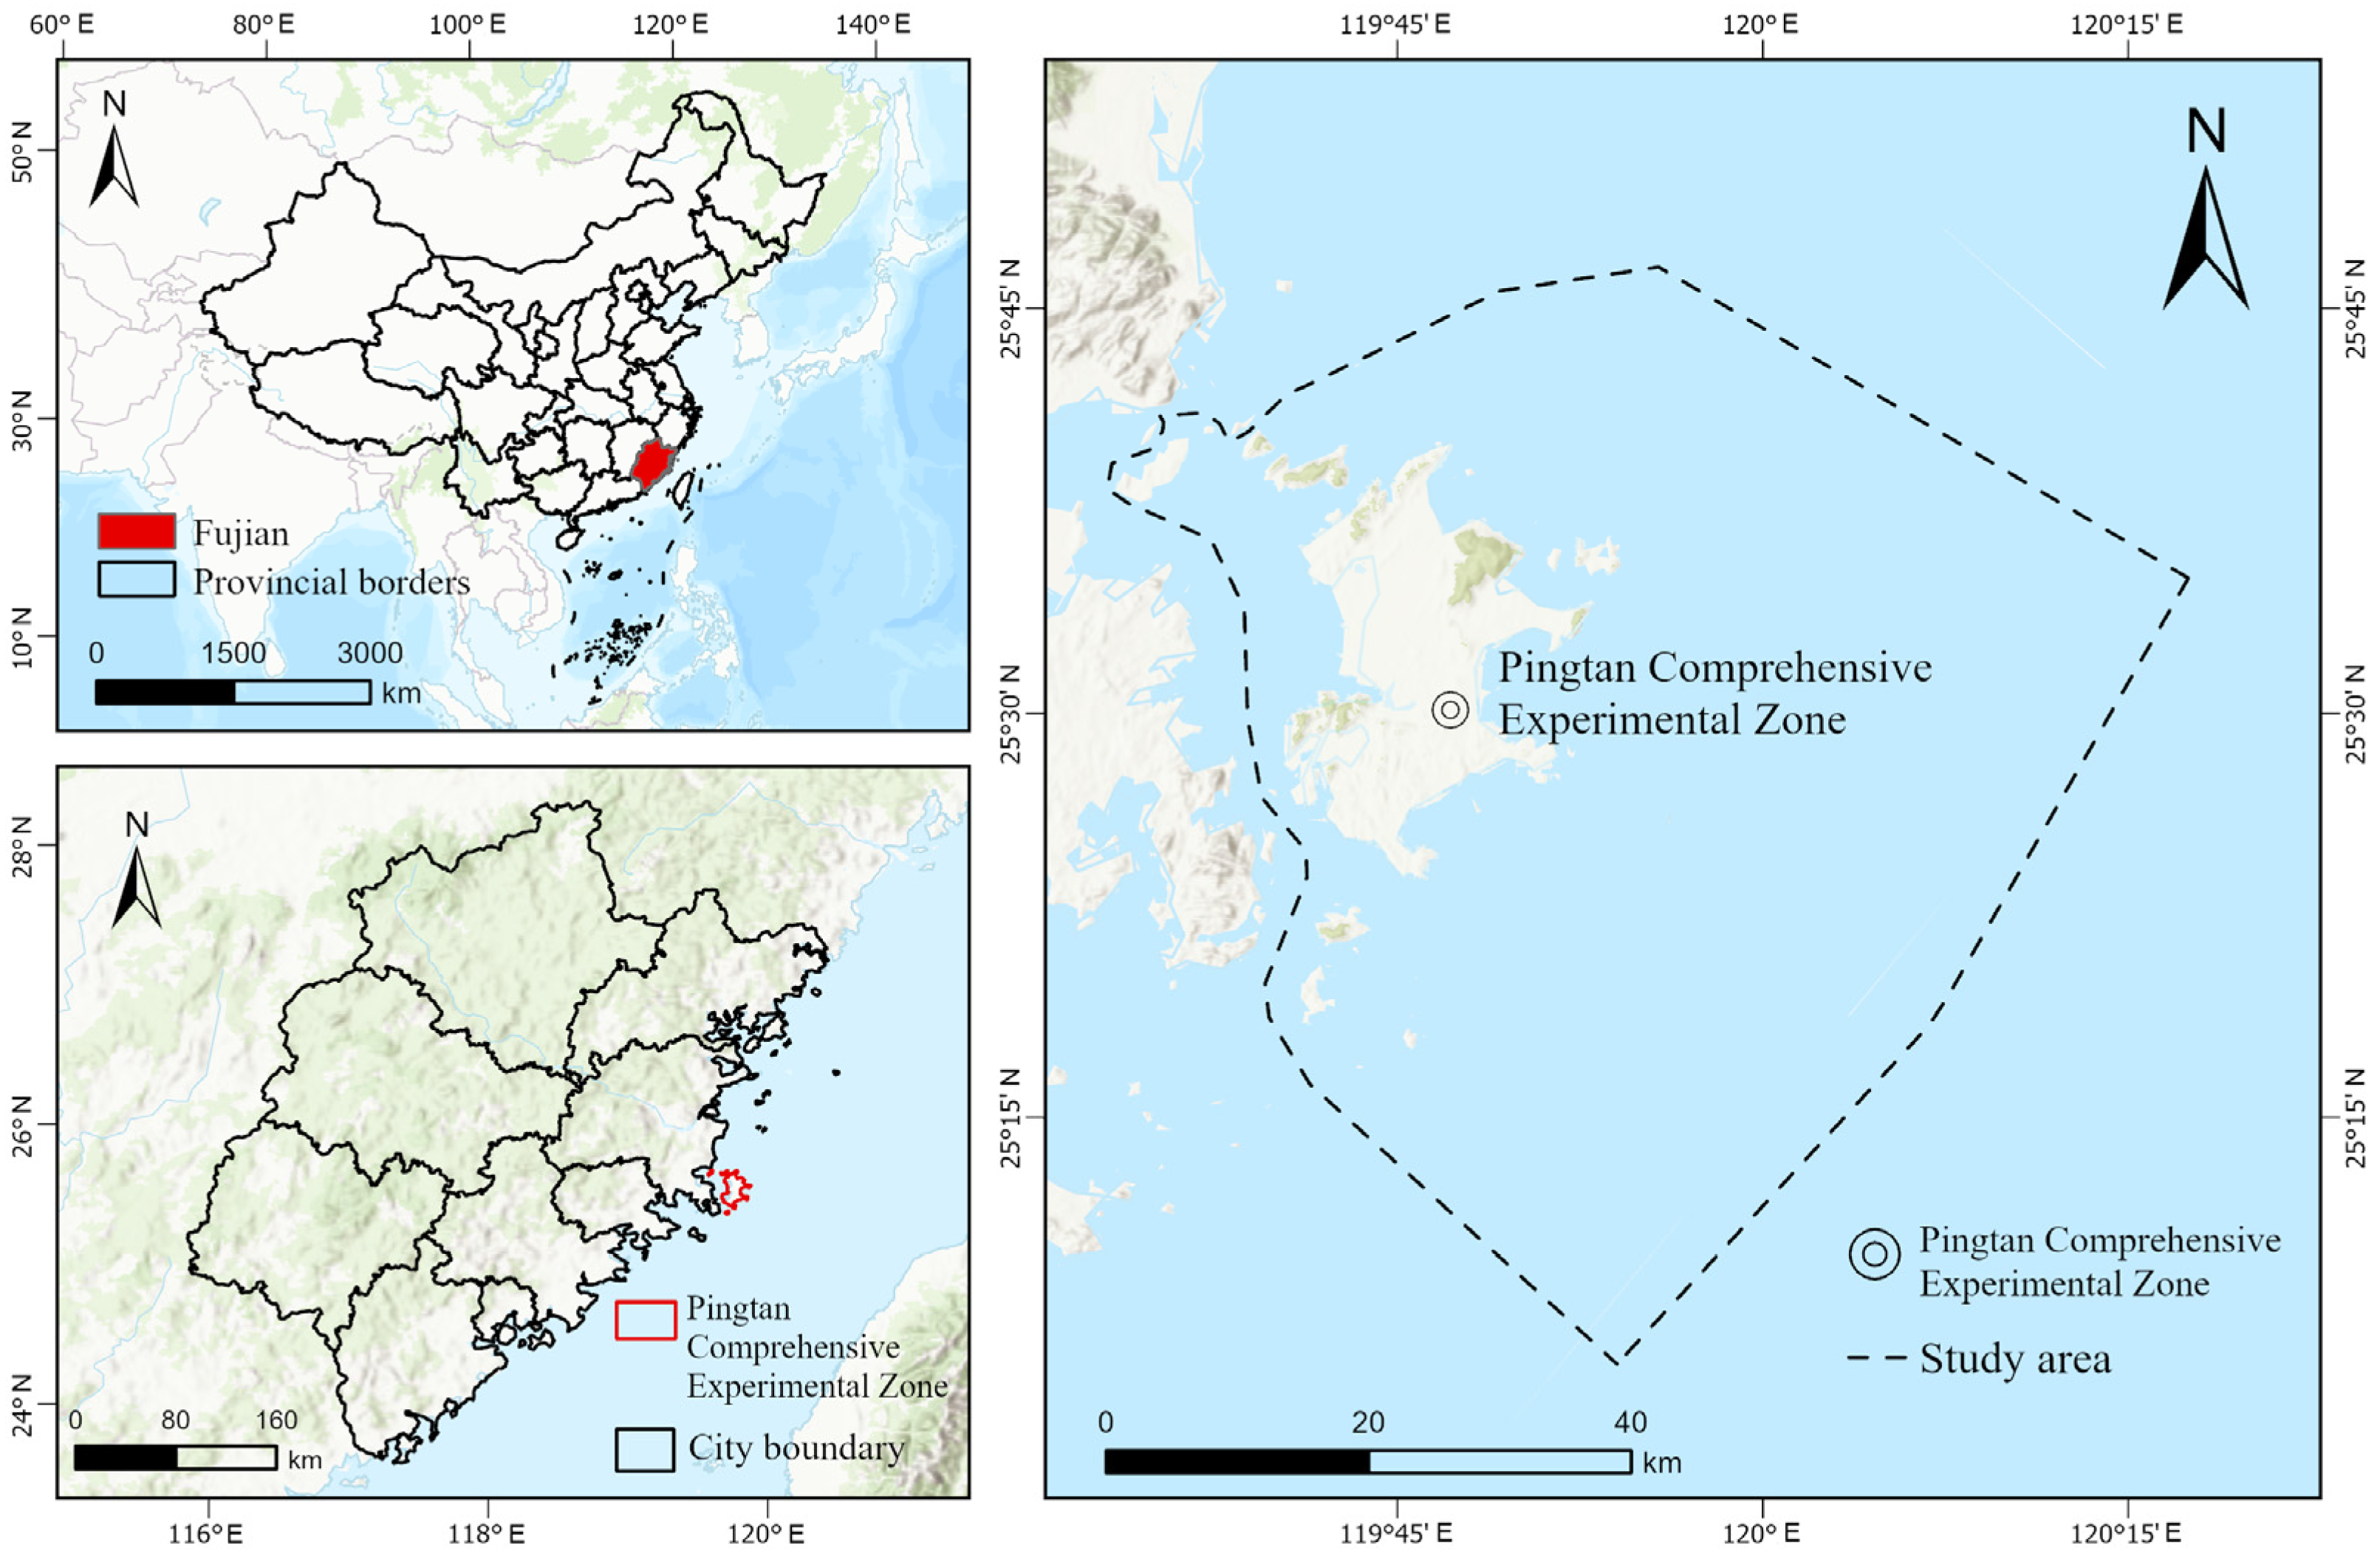
The study area encompasses the entire terrestrial territory and jurisdictional marine area of the Pingtan Comprehensive Experimental Zone, covering a total area of 3151 km2, including 2830 km2 of marine area (Figure 1). The Pingtan Comprehensive Experimental Zone is located in the eastern coastal waters of Fujian Province, China, between 25°15′–25°45′ N and 119°32′–120°10′ E. It consists of 11 inhabited islands, more than 330 uninhabited islands, and 702 reefs. The Pingtan Comprehensive Experimental Zone is an island-type administrative unit centered on Haitan Island and composed of numerous surrounding islands. Its natural environment, resource endowment, and socioeconomic activities exhibit distinct island characteristics, providing the regional context for this study. Hereafter, the Pingtan Comprehensive Experimental Zone is referred to as Pingtan. Pingtan administers three towns, three townships, and one subdistrict, encompassing 28 communities and 192 administrative villages. By the end of 2024, the population of the residents was 378,000. The establishment of this administrative system has endowed Pingtan with geographical integrity, administrative autonomy, and policy implementation capacity, which are important for ecosystem management and GEP accounting.
Pingtan has a subtropical monsoon climate with semi-humid marine characteristics. The topography is dominated by hills and marine-alluvial plains, complemented by a variety of landforms such as terraces, bays, islands, reefs, tidal flats, and lakes. The Pingtan ecosystem is relatively fragile and its biological communities have relatively low resistance to external disturbances. Owing to its geographical location, the area is frequently affected by natural hazards, such as typhoons and strong winds. Storm surges, coastal erosion, and water pollution exert considerable pressure on local ecological environments. Government-led ecological restoration projects and tourism development have resulted in substantial changes to the island’s ecosystem. Compared with other island regions with more stable ecological conditions, Pingtan is an ideal observation site. Therefore, conducting GEP accounting is vital for promoting the sustainable development of Pingtan’s ecological resources.

2.2. Data Sources

Diverse data sources can effectively support the implementation of GEP accounting research. These can be categorized into natural geographic and socioeconomic data (Table 1).

2.3. Indicator System and Accounting Methods

2.3.1. Indicator System

The accounting indicator system forms the core foundation of GEP value accounting and its development is jointly driven by government agencies and the academic community. Since the release of the Technical Specification for GEP Accounting of Yantian District Urban Ecosystem in 2018, a series of technical standards, such as the Technical Guidelines for Terrestrial Ecosystem GEP Accounting and the Specification for GEP Accounting (Trial), have been issued. These standards gradually formed a three-tiered technical framework for GEP accounting at provincial, municipal, and district levels, providing institutional foundations and methodological support for the construction of an indicator system. Under policy guidance, the academic community has actively explored region-specific accounting approaches for various ecosystem types. Researchers such as Ouyang [3] and Ma [46] have developed representative accounting frameworks at various spatial scales. There is a consensus among researchers regarding the structure of the indicator system, which typically comprises three main categories, namely, provisioning, regulating, and cultural services. The commonly recognized evaluation indicators and methods are listed in Table 2.
In this study, we developed a GEP accounting indicator system tailored to the ecological characteristics and functions of Pingtan (Table 3). The system comprises 14 indicators and forms an evaluation framework with distinctive island-specific features. To avoid double counting and to maintain the internal consistency of the accounting framework, we prioritized indicators that directly represent ecosystem-generated products and services while excluding variables that primarily reflect human-made inputs or capital stocks. This study introduces two main extensions and innovations. Ecosystem-based disaster risk reduction (Eco-DRR) is incorporated into the accounting system to reflect the regulating and buffering functions of island ecosystems in response to extreme climatic events and natural disasters. This indicator quantifies the value of ecosystems in reducing disaster risks and mitigating economic losses, addressing the gap in previous research, in which such aspects have received limited attention. Pingtan faces frequent threats from strong typhoons and storm surges. Its extensive windbreak forests act as ecological barriers by reducing wind speeds, minimizing wind erosion, and protecting farmlands and residential areas. A seascape value-added indicator was introduced to capture the derived economic value associated with coastal landscape resources. This indicator encompasses the spillover effects of marine scenery on sectors, such as real estate and tourism, providing a more detailed representation of the contribution of island ecological resources to socioeconomic development. In addition, we did not include human capital inputs in tourism and recreation as a separate ecosystem service indicator. This is because they mainly represent anthropogenic investment (such as sewage treatment expenditures, operation and maintenance of tourism facilities, staff training, and destination marketing and branding activities) rather than direct ecosystem outputs [47]. Similarly, some supporting or highly intangible services (such as aesthetic experiences not captured by observable market behavior) were not explicitly quantified owing to severe data limitations and difficulties in establishing robust, non-overlapping monetary estimates at the county scale. We acknowledge that excluding certain ecosystem services may lead to an underestimation of total GEP and a possible bias toward services with better data support. At the same time, these exclusions help sharpen the conceptual boundary of GEP by focusing on ecosystem-derived flows rather than mixed eco–social inputs, and can thus be regarded as an optimization of the accounting framework. As data availability and methodological consensus improve, additional indicators—particularly those capturing more complex human–ecosystem interactions—should be considered in future empirical applications.

2.3.2. Accounting Methods

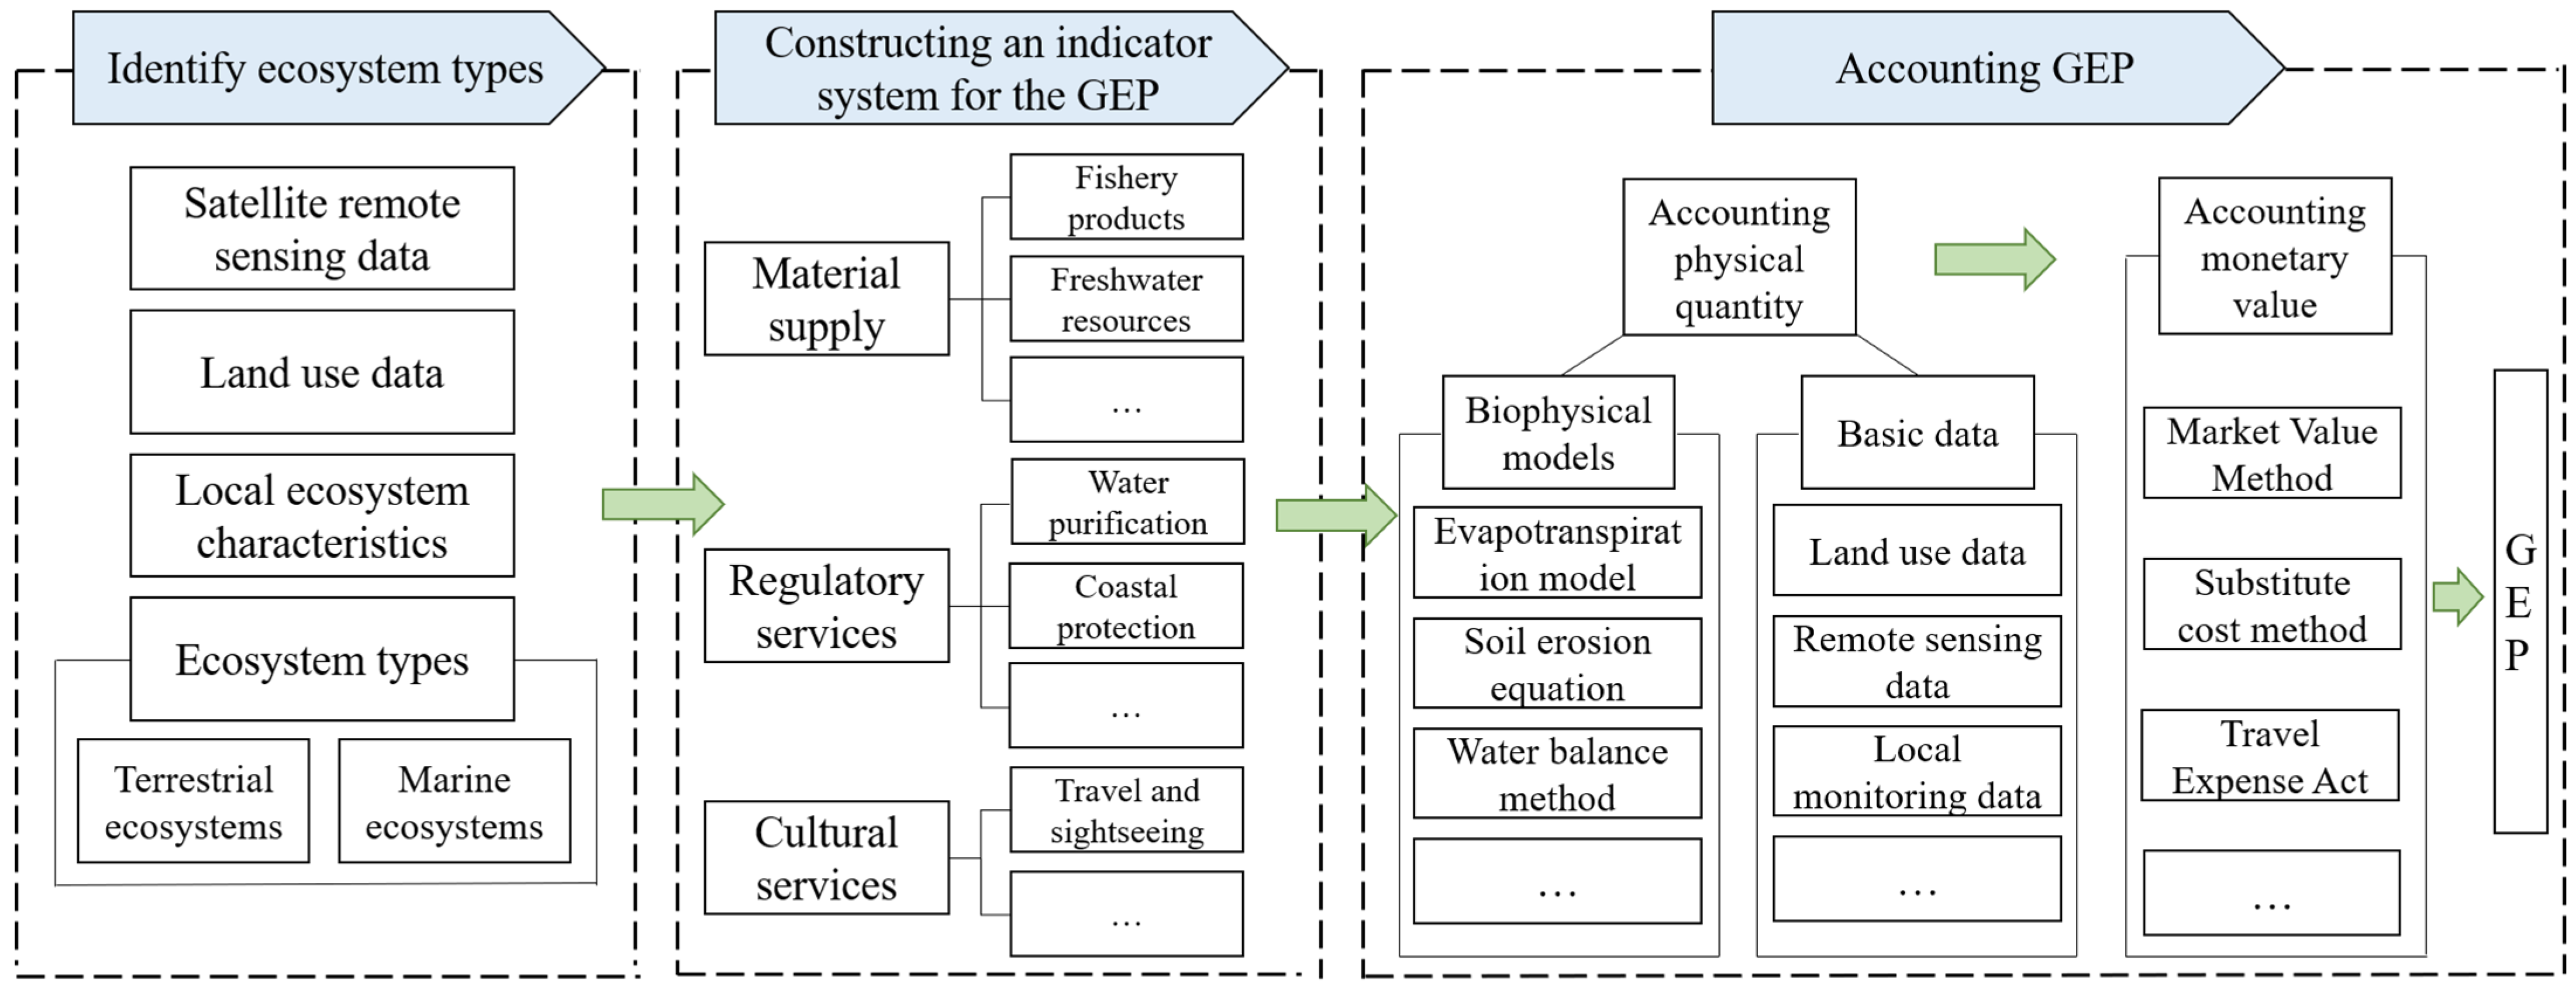
In this study, we used the functional value method to conduct GEP accounting in two stages, that is, physical quantity and monetary value accounting (Figure 2). Data were obtained through field surveys, literature reviews, data collection, platform sharing, and departmental consultations. The physical quantities were estimated using both biophysical and statistical models. Monetary value accounting was conducted by applying the market value and substitute cost methods, and the results were aggregated to derive the total GEP value.
Based on national technical standards and prior research findings [34,35,36,37,38,39], we refined and optimized certain GEP accounting methods and procedures (Table 4). When accounting for agriculture, forestry, animal husbandry, and fishery products, the value-added approach was used as the accounting indicator. This adjustment separates the resource and labor costs incurred during production processes, enabling the results to more accurately reflect the actual ecosystem contribution [37]. In terms of marine fishery products, field investigations and interviews have shown that large-scale nearshore aquaculture is the predominant production mode in Pingtan. Integrating spatial vector data on marine aquaculture provided by local fishery authorities showed that most fishing activities, including both aquaculture and capture, are concentrated within a 4 km nearshore zone. This eliminates potential disturbances to the accounting results caused by cross-regional fishing, offshore resource inputs, and external labor contributions. To account for coastal protection services, a protection weighting coefficient was introduced to differentiate between rocky, sandy, and muddy coastlines [36], more accurately reflecting the protective benefits of different coastal types. Cultural and artificial scenic spots were excluded for tourism and recreation services. This ensured that the results represent the actual contribution of natural ecosystems to the regional tourism economy.

3. Results

3.1. Pingtan GEP Accounting Results

Excluding the effects of price fluctuations and calculating at comparable prices, the total GEP of Pingtan in 2023 is 15.973 billion yuan (Table 5). Among these, terrestrial GEP accounted for 6.125 billion yuan (38.35% of the total). Meanwhile, marine GEP reached 9.847 billion yuan, comprising 61.65% of the total. Within the terrestrial ecosystem, tourism and recreation services had the highest value of 4.389 billion yuan. Meanwhile, water purification services had the lowest value of 0.003 billion yuan. In the marine ecosystem, tourism and recreation services also ranked the highest at 4.877 billion yuan, while seascape value-added services contributed the least at 0.064 billion yuan. This pattern indicated that Pingtan’s GEP structure is strongly shaped by its marine resource endowment and tourism-oriented development pathway, with tourism-linked cultural services already outweighing most material and regulating functions in both the terrestrial and marine subsystems.
Compared to 2015, Pingtan’s total GEP in 2023 increased by 9.118 billion yuan, representing a growth rate of 133.03%. Terrestrial GEP increased by 3.664 billion yuan (148.83%). This was mainly driven by tourism and recreation services, which grew by approximately 3.921 billion yuan. Marine GEP increased by 5.455 billion yuan, up by 124.18%, primarily reflecting the growth in carbon sequestration, oxygen release, water purification, and tourism and recreation services. Among these, tourism and recreation services exhibited the fastest growth, with an increase of approximately 4.357 billion yuan.

3.2. Analysis of Value Change Characteristics

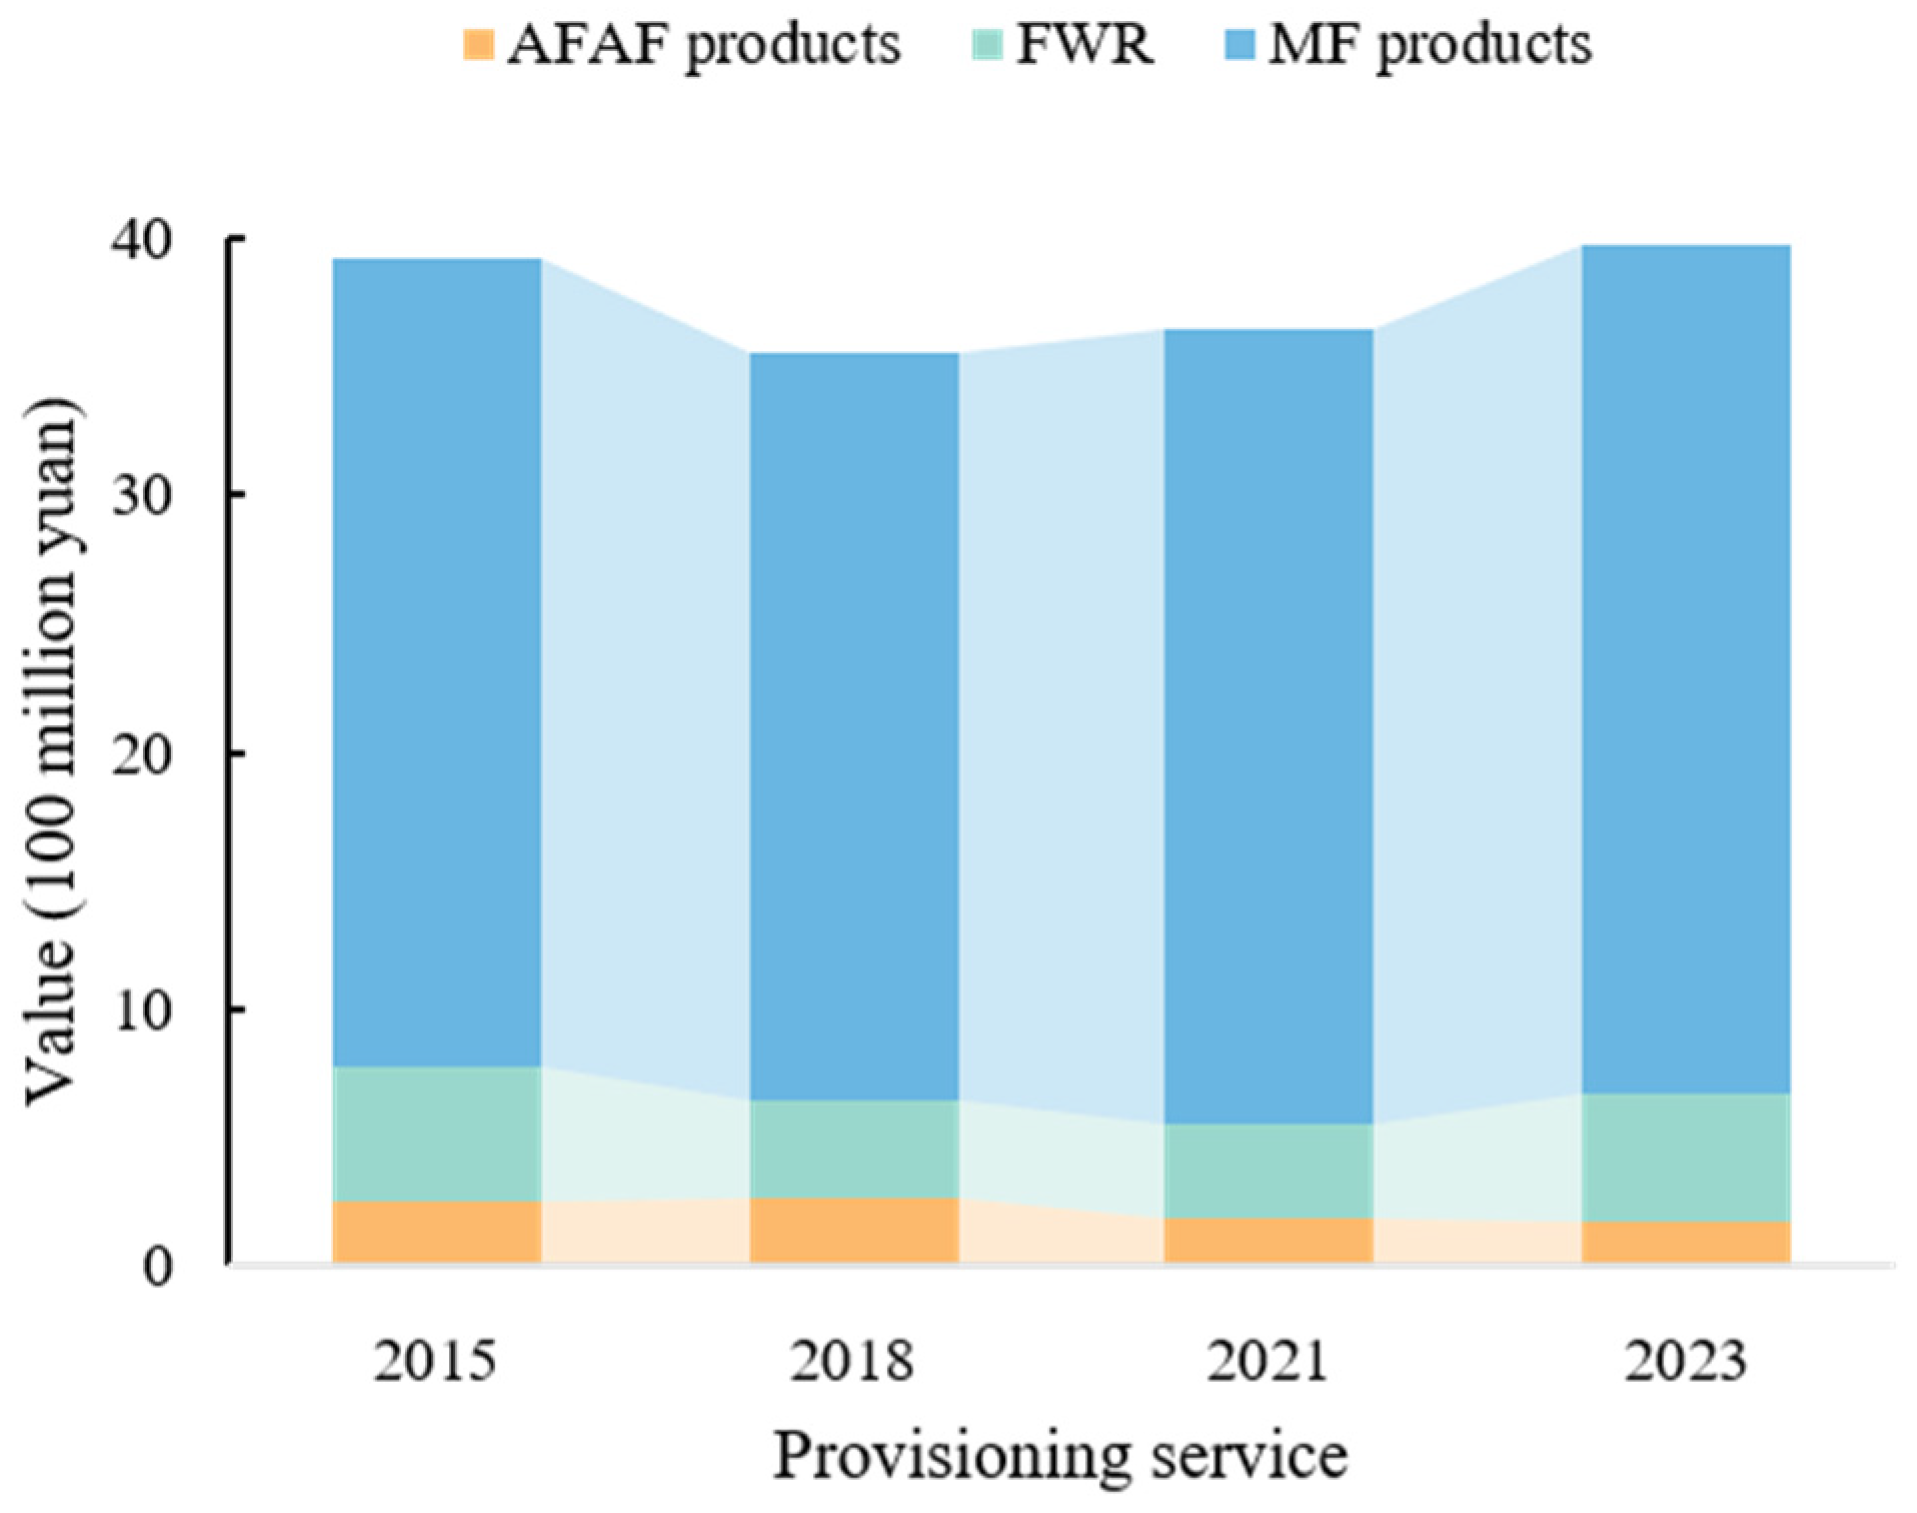
From 2015 to 2023, the GEP of Pingtan exhibited dynamic changes, characterized by differentiated evolutions of provisioning, regulating, and cultural services across different stages. In terms of provisioning services, the overall value generally remained stable, with minor interannual fluctuations (Figure 3). Marine fishery products consistently dominated the provisioning category, maintaining a value exceeding 2.9 billion yuan throughout the period and being the core source of material supply. In contrast, freshwater resources declined, followed by a rebound that was strongly influenced by natural factors such as precipitation conditions. The values of agriculture, forestry, animal husbandry, and fishery products were the lowest, decreasing from 249 million yuan in 2015 to 174 million yuan in 2023. This indicated a gradual weakening in their supply functions. Material provisioning in Pingtan is highly dependent on marine fishery resources. Meanwhile, the supporting roles of agriculture and freshwater resources remain relatively limited.
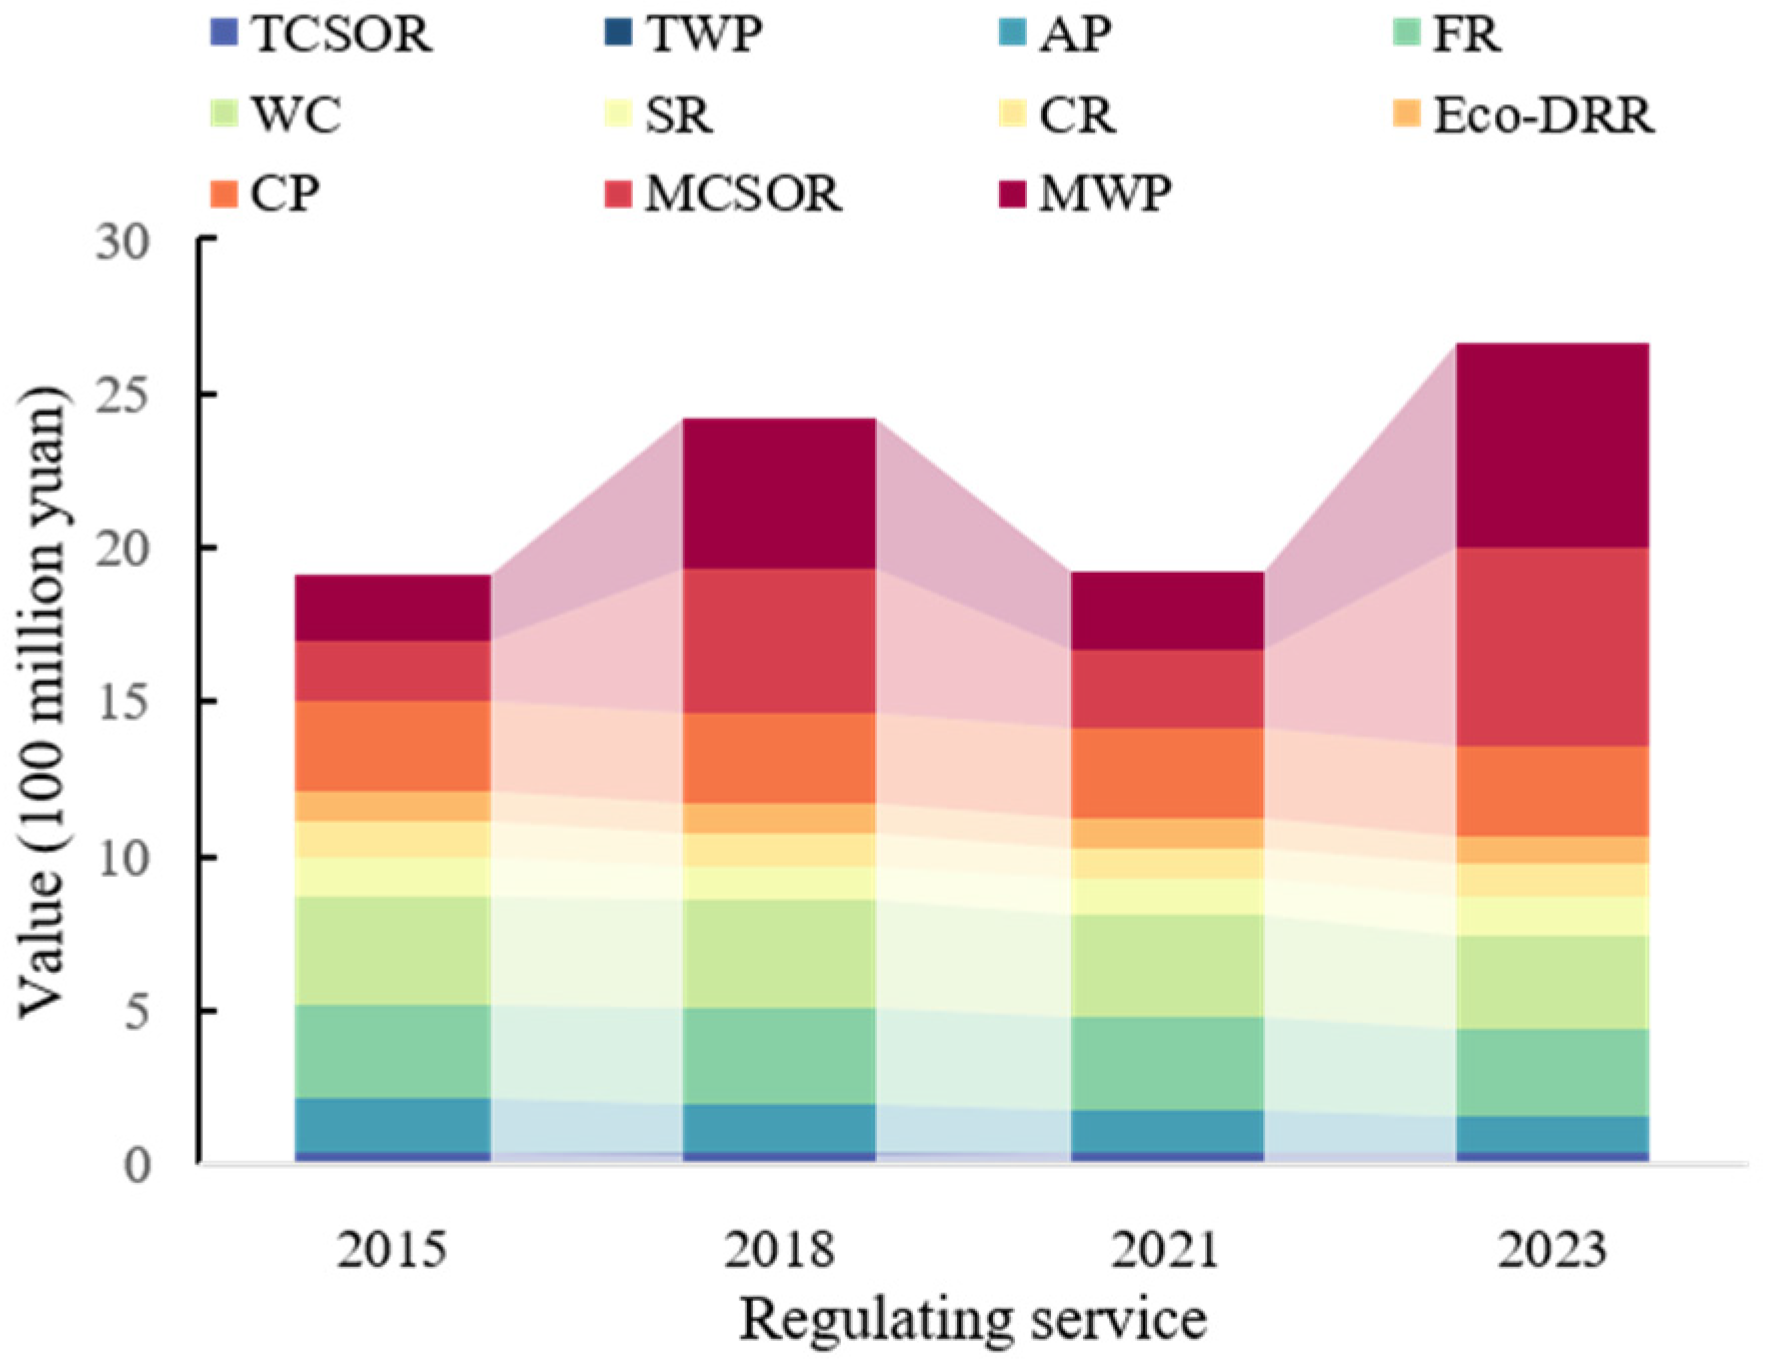
In terms of regulating services, the total value shows a fluctuating upward trend. This was primarily driven by two marine ecosystem functions, namely, carbon sequestration, oxygen release, and marine water purification (Figure 4). Other regulating services remained relatively stable throughout the study period. From 2018 to 2021, both services experienced a decline. According to the available monitoring data, the mean surface primary productivity of the marine area during the spring of 2019 was 214 mg m−2 d−1, and the chlorophyll a concentration was 2.91 µg/L. By 2021, these values had decreased to 103.64 mg m−2·d−1 and 1.02 µg/L, respectively, representing declines of more than 50%. This indicates a substantial reduction in ecosystem photosynthetic efficiency and shows that intensified eutrophication and increased pollution levels have weakened the carbon fixation and self-purification functions of seawater.
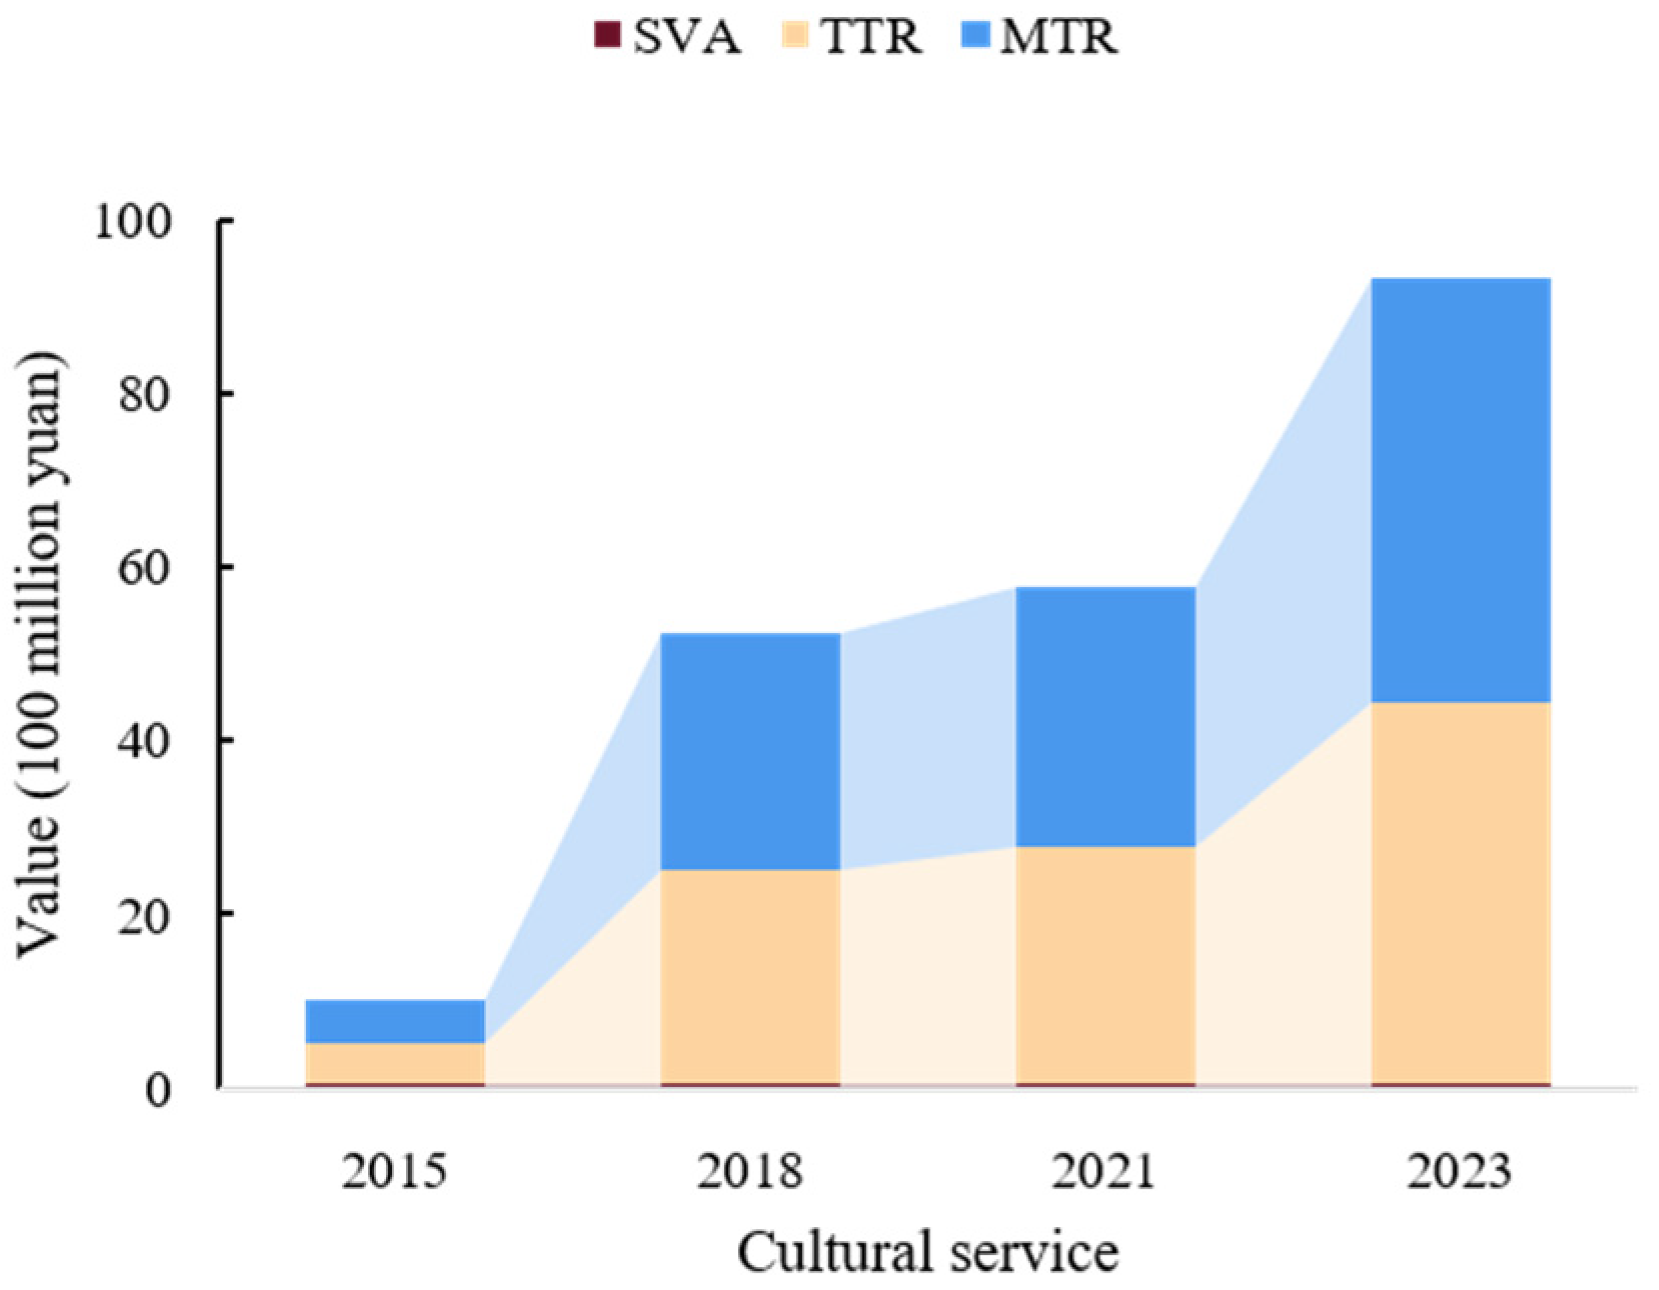
In contrast to the two preceding categories, cultural services had substantial growth during the same period, increasing from 1.026 billion yuan in 2015 to 9.329 billion yuan in 2023. This has far exceeded the growth rates of both provisioning and regulating services (Figure 5). This rapid expansion was predominantly driven by the booming tourism industry, suggesting that cultural services have become key drivers of GEP growth.
The three categories of ecosystem services demonstrated distinct evolutionary patterns characterized by stable provisioning services, fluctuating but rising regulating services, and substantial growth in cultural services. Overall, the asynchronous evolution of the three categories indicated a functional reconfiguration of Pingtan’s ecosystem contributions, with cultural services increasingly dominating the growth margin while provisioning and regulating services provide a more stable ecological foundation.
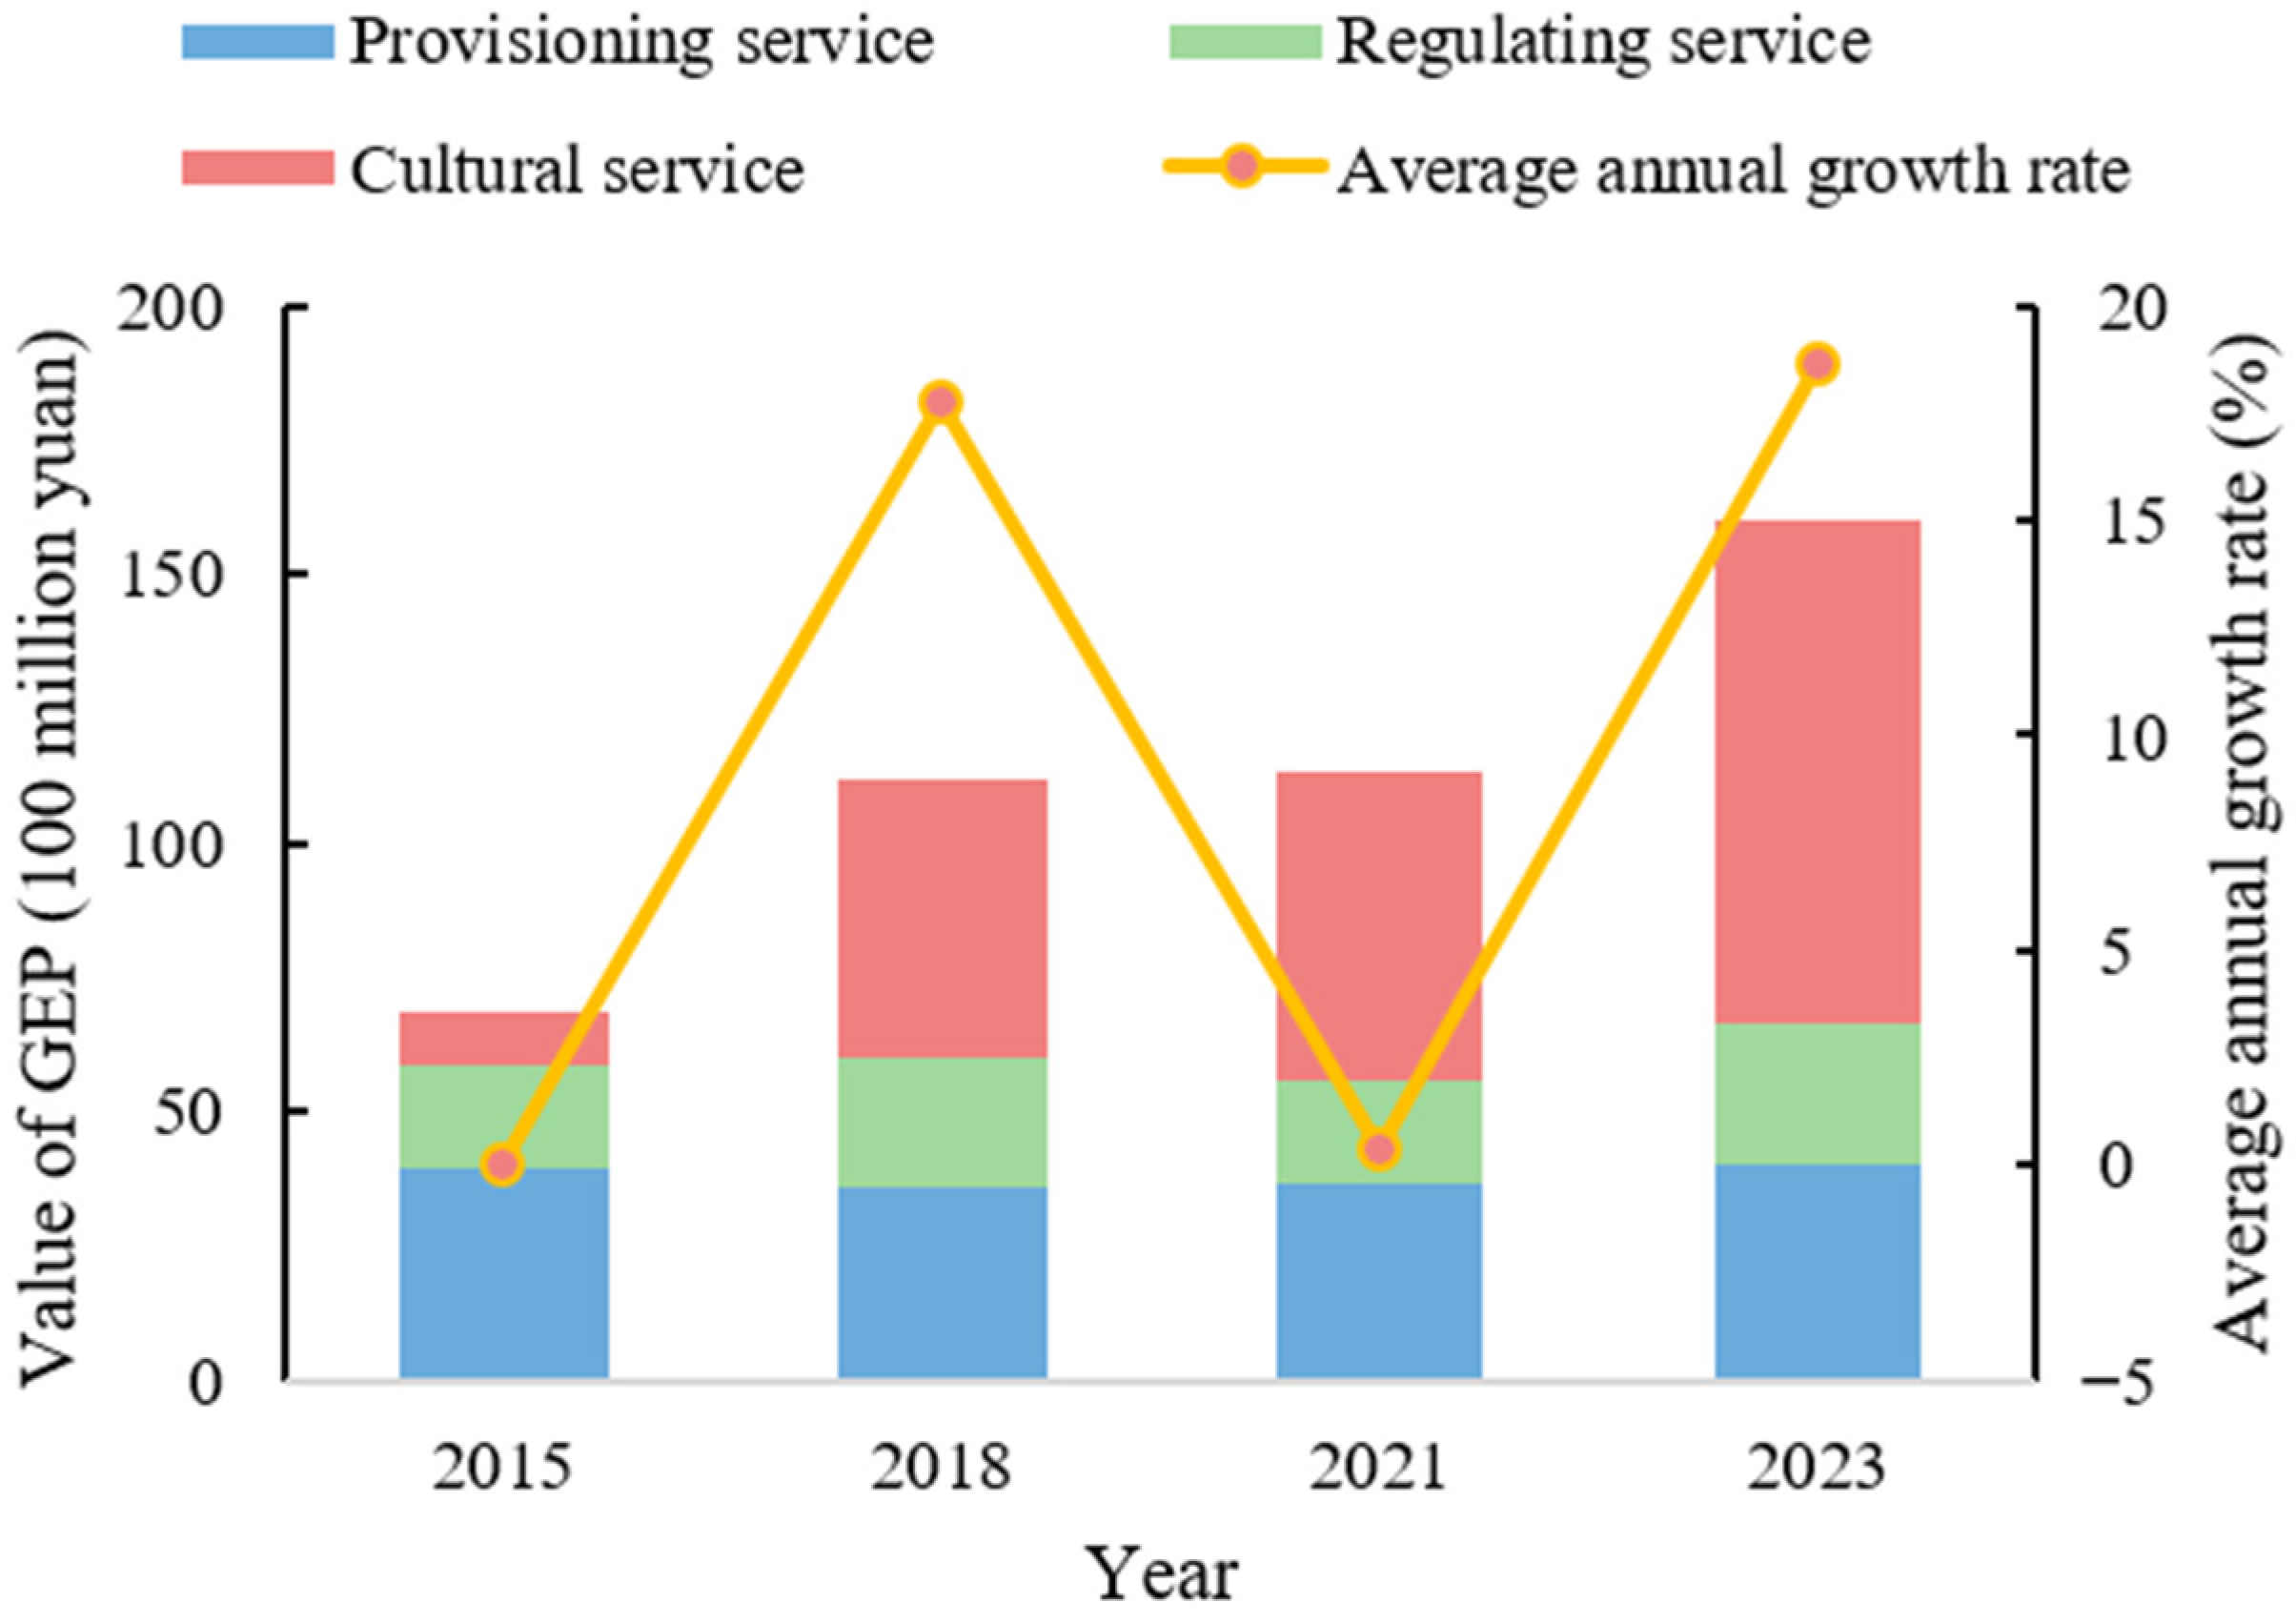
The variation in Pingtan’s GEP exhibited a continuous expansion in the total value and stage-specific differentiation in growth rates. From 2015 to 2023, the total GEP increased from 6.854 billion yuan to 15.973 billion yuan, representing an overall growth of 133.03%. The average annual growth rate was 17.79% (+4.347 billion yuan) during 2015–2018, slowed to 0.41% (+0.138 billion yuan) during 2018–2021, and rebounded to 18.68% (+4.633 billion yuan) during 2021–2023, showing a rapid–slow–rapid pattern of phased fluctuations (Figure 6). The pronounced slowdown during 2018–2021 was mainly attributed to the impact of the COVID-19 pandemic, which constrained the recovery of the tourism industry and limited the contribution of cultural services. The number of tourists increased from 4.8432 million in 2018 to 6.8419 million in 2021, with an average annual growth rate of 12.2%, which is significantly lower than the 28.2% recorded from 2015 to 2018. Tourism revenue increased slightly from 5.674 billion yuan to 6.1 billion yuan, with an average annual growth rate of 2.4%, which is far below the 105.4% recorded in the previous period. The sluggish performance of the tourism market between 2018 and 2021 decreased the overall GEP growth. This phased trajectory suggests that exogenous shocks to the tourism sector can rapidly affect the value of cultural services and thus total GEP, revealing both the growth potential and vulnerability of an ecosystem-service structure that heavily relies on tourism.

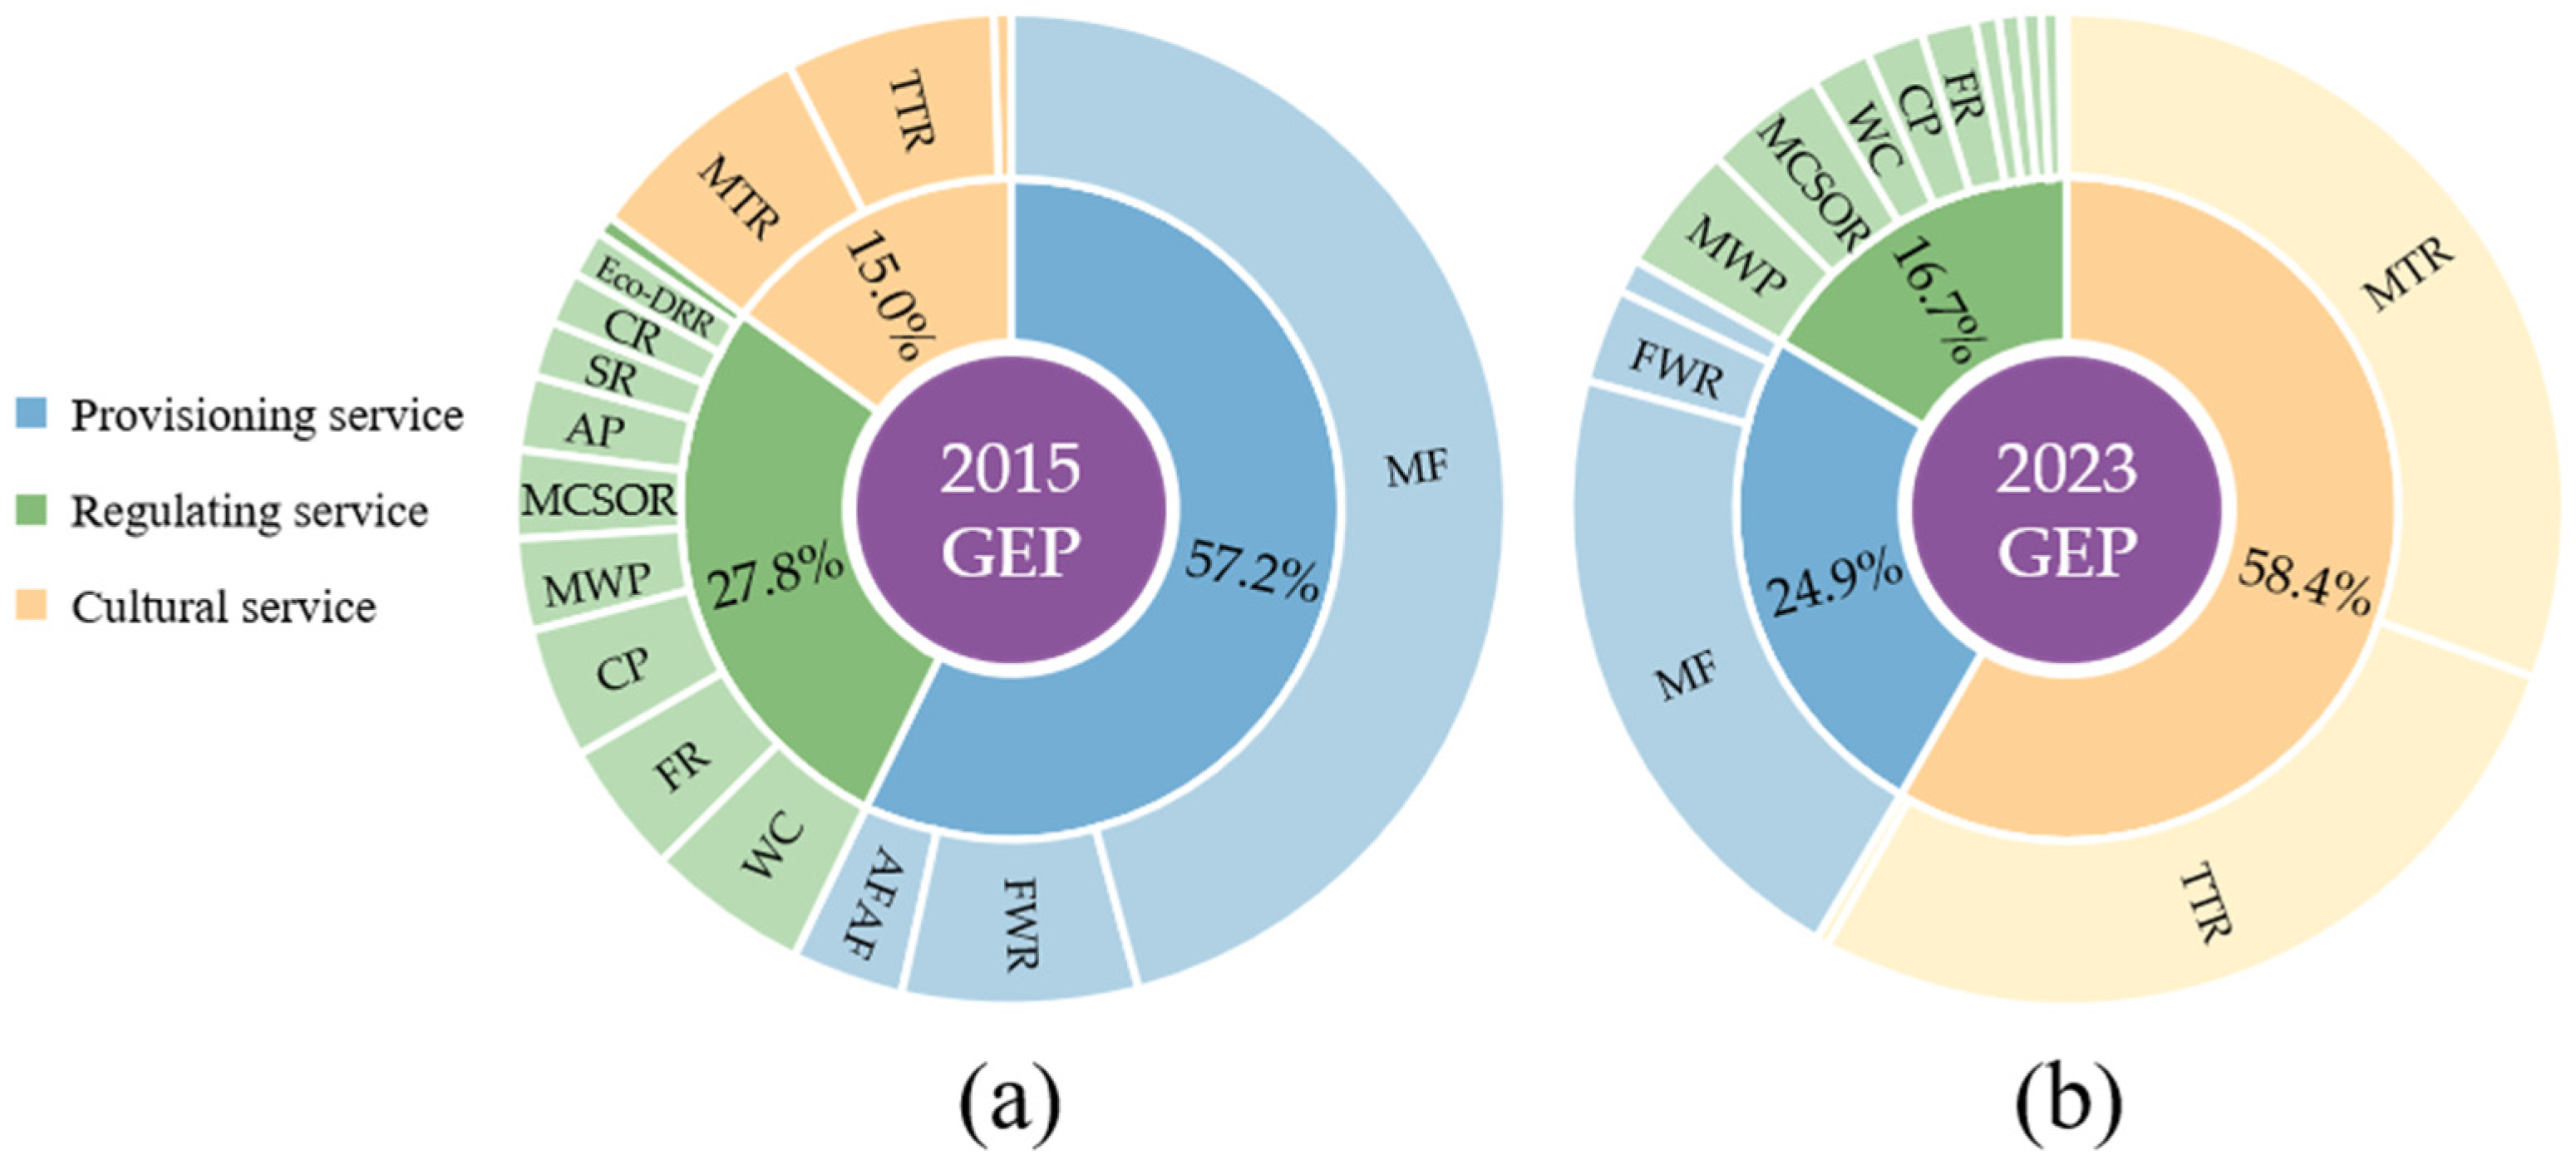
3.3. Analysis of Structural Evolution

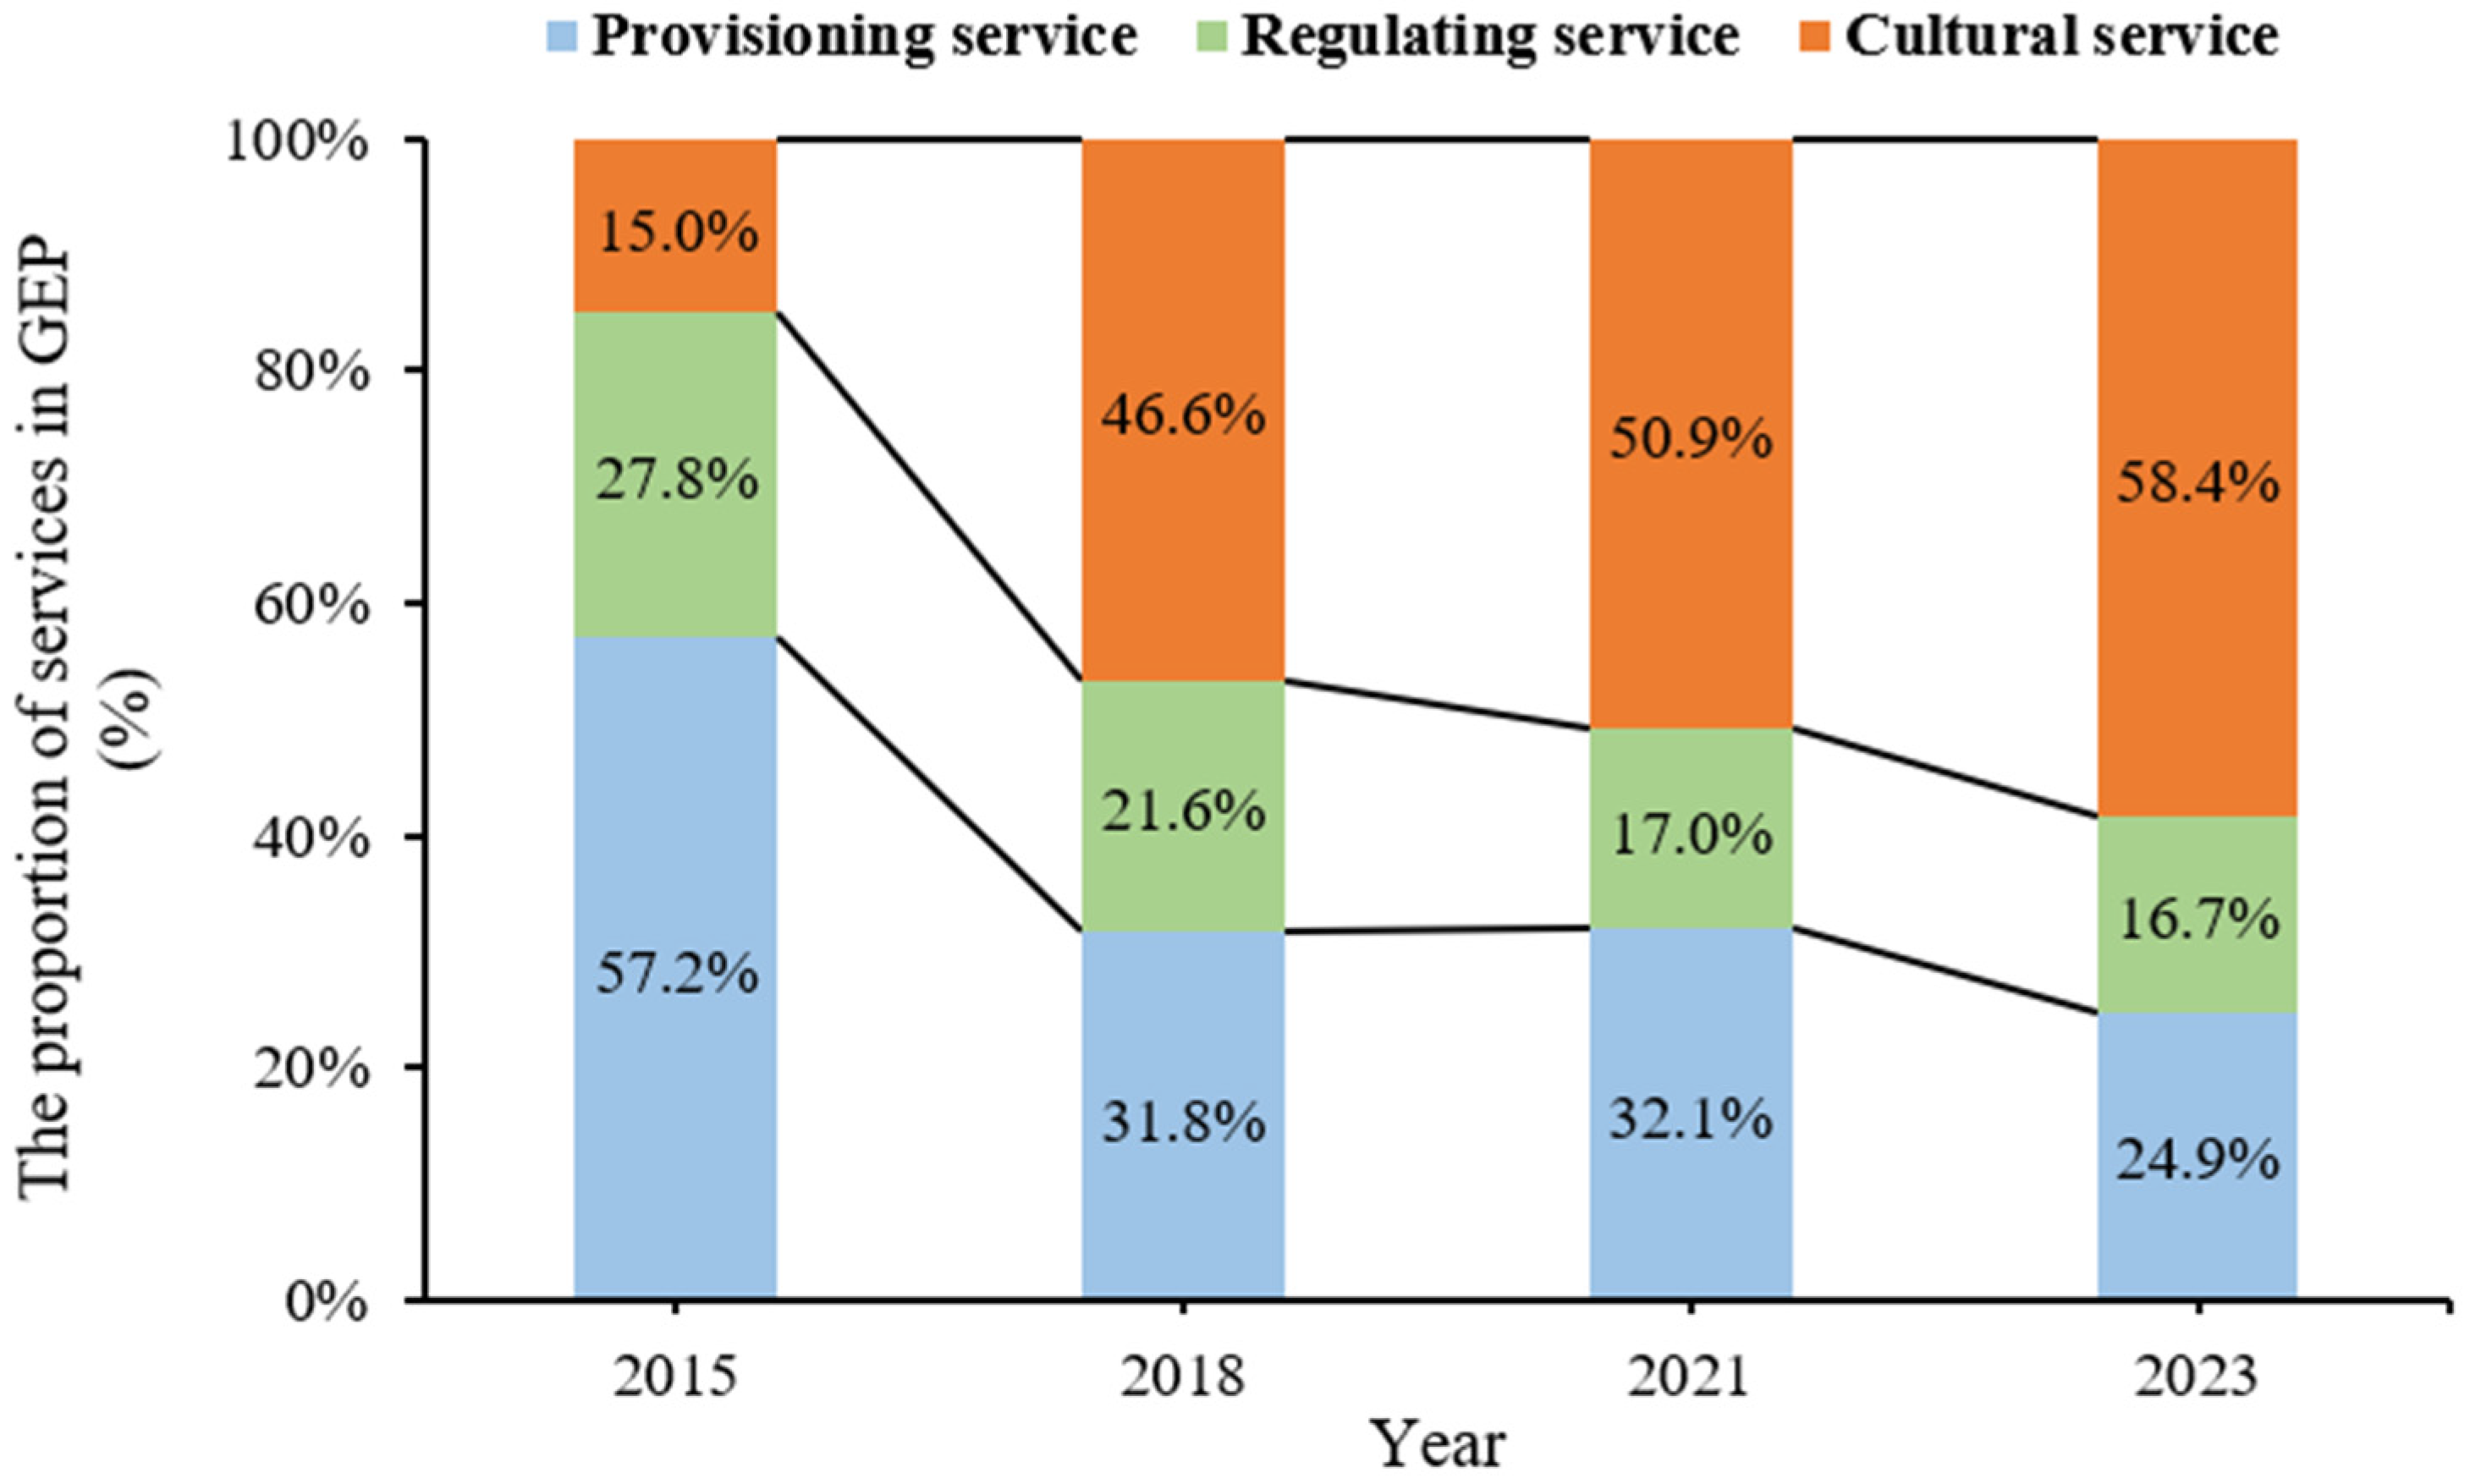
From 2015 to 2023, the structural composition of Pingtan’s GEP underwent a considerable transformation (Figure 7). In 2015, provisioning services dominated the structure, accounting for 57.2% of the total GEP. Meanwhile, regulating and cultural services contributed 27.8% and 15.0%, respectively. By 2018, the share of cultural services had increased sharply to 46.6%, surpassing provisioning services (31.8%) and regulating services (21.6%) for the first time and becoming the largest service category. This trend is further strengthened in 2021, when the proportion of cultural services rose to 50.9%. Meanwhile, provisioning and regulating services declined to 32.1% and 17.0%, respectively. By 2023, cultural services continued to expand, reaching 58.4% of the total GEP and consolidating their dominant position. Meanwhile, provisioning and regulating services further decreased to 24.9% and 16.7%, respectively. The three categories of ecosystem services exhibited a clear transition from a provisioning-dominated to a cultural service-dominated structure. The continuous expansion of cultural services was the key driving force behind this structural shift. Meanwhile, provisioning and regulating services have shown a declining share and a tendency toward a weakening influence (Figure 8). This structural transition reflects a fundamental reorientation of Pingtan’s development model, away from resource extraction and toward the tourism- and service-led use of ecosystems. Although this shift enhances the monetization of cultural benefits, it may also increase dependence on market demand and susceptibility to the external shocks affecting the tourism industry.

4. Discussion

4.1. Spatial Evolution of Value

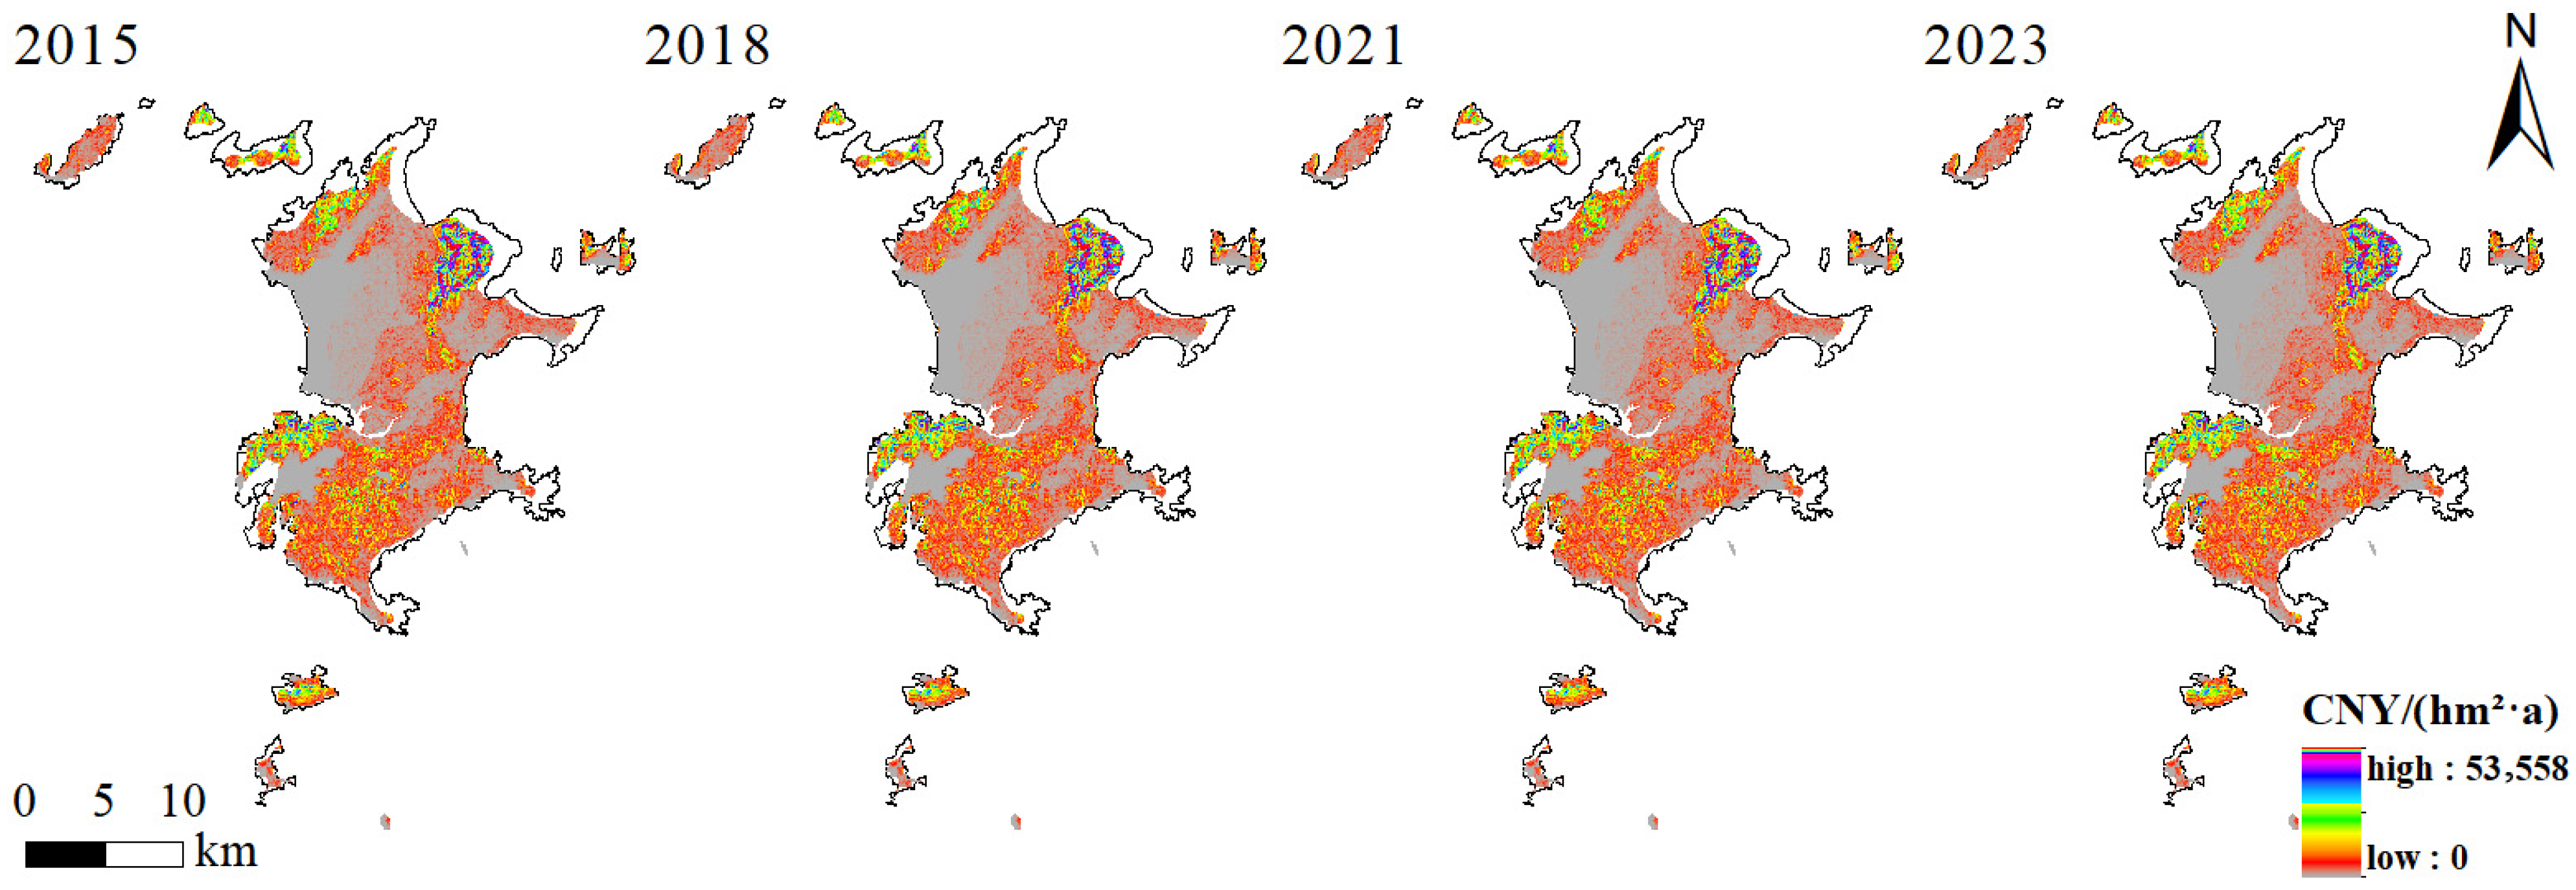
Using ArcGIS 10.8 software, the assessment area was divided into 30 m × 30 m grid cells. As the study area was at the county scale, the data of certain ecosystem services could not be refined to a per-unit-area resolution. Therefore, only services that could be spatialized were mapped to illustrate their spatiotemporal evolution and provide a preliminary understanding of their spatial distribution patterns.
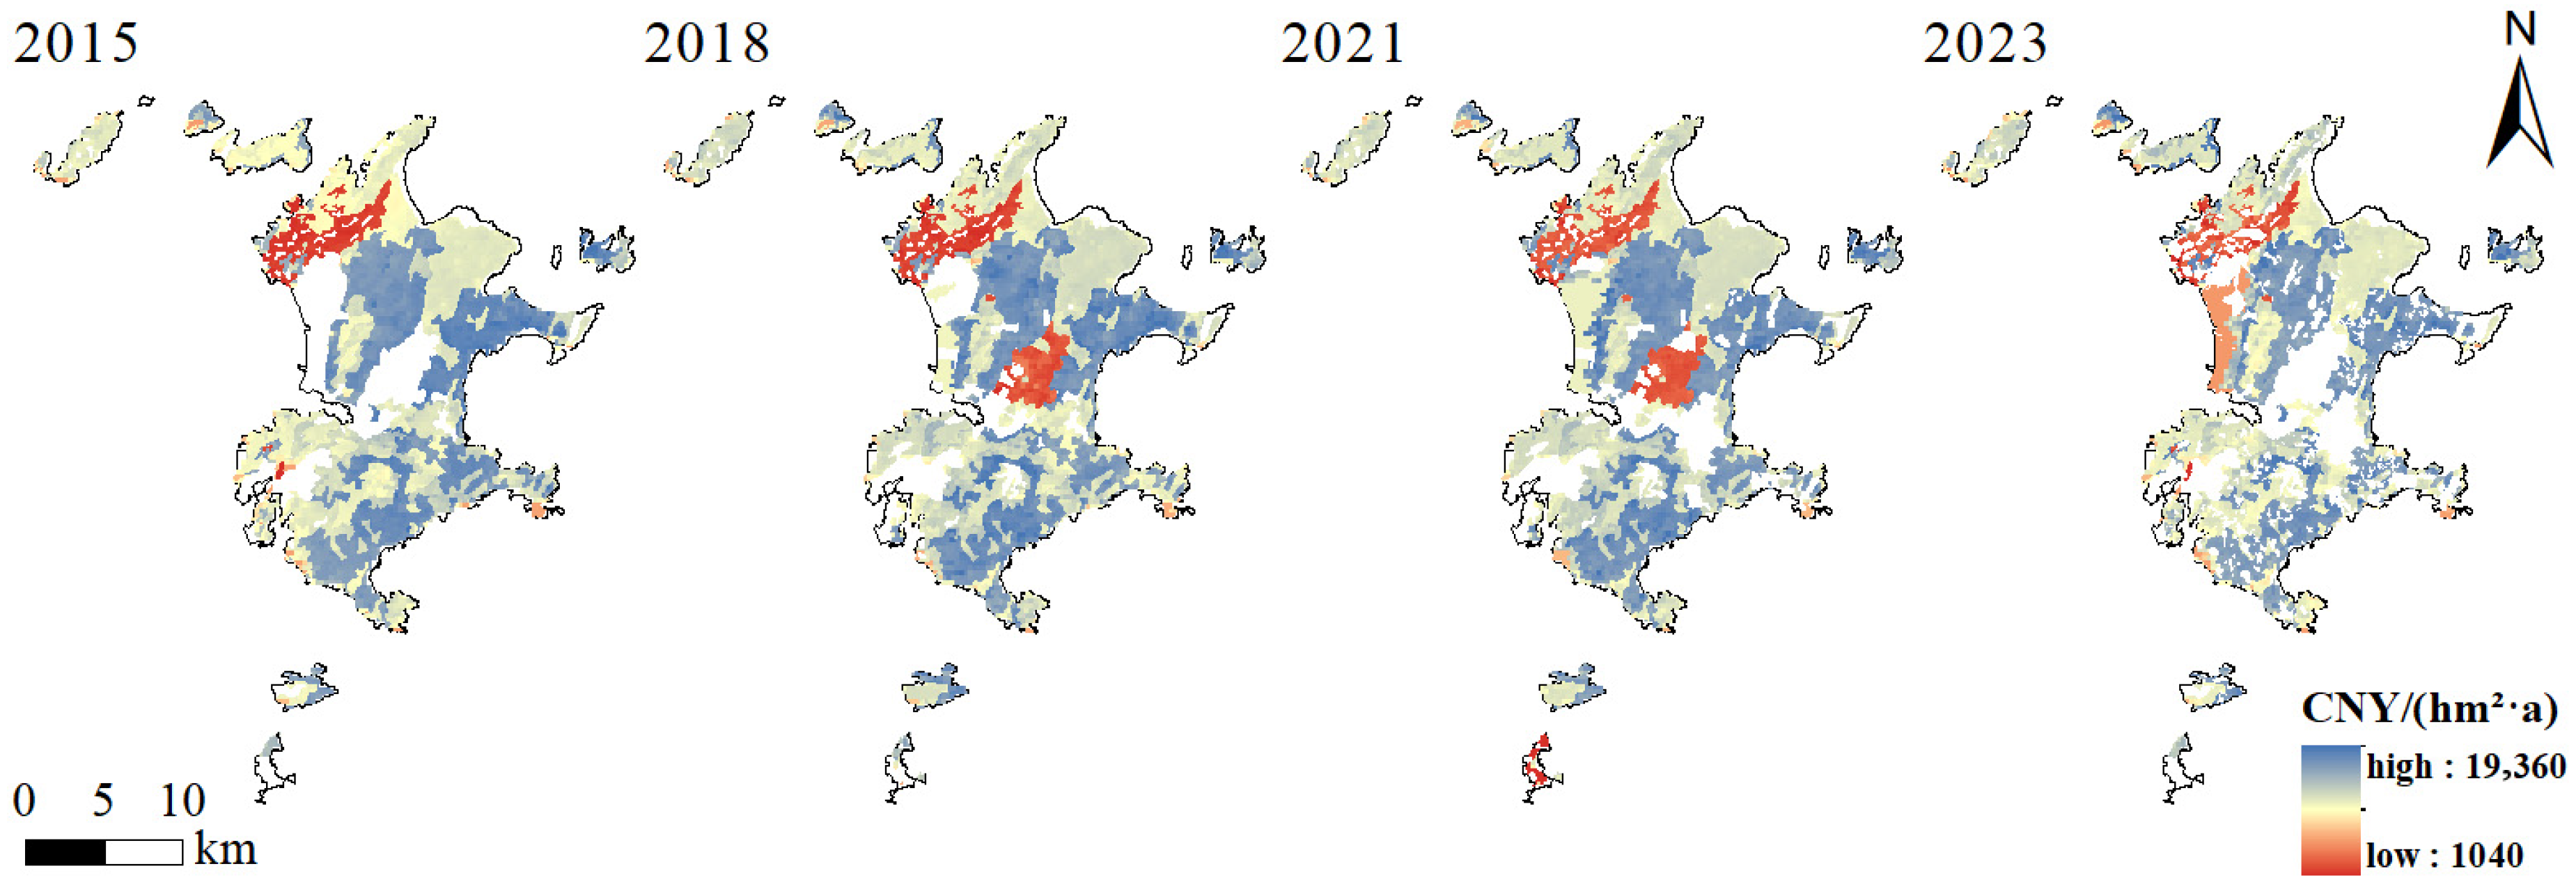
High-value flood regulation areas showed a clear expansion trend from 2015 to 2023 (Figure 9). In 2015, they were mainly concentrated in several localized high-value patches in the central and southern parts of the island. These areas gradually expanded northward and southward, forming continuous high-value zones. By 2023, new clusters emerged in the northern coastal areas. In addition to interannual variations in precipitation, this pattern is closely related to the distribution of low-lying terrain and the construction of drainage and flood control projects.
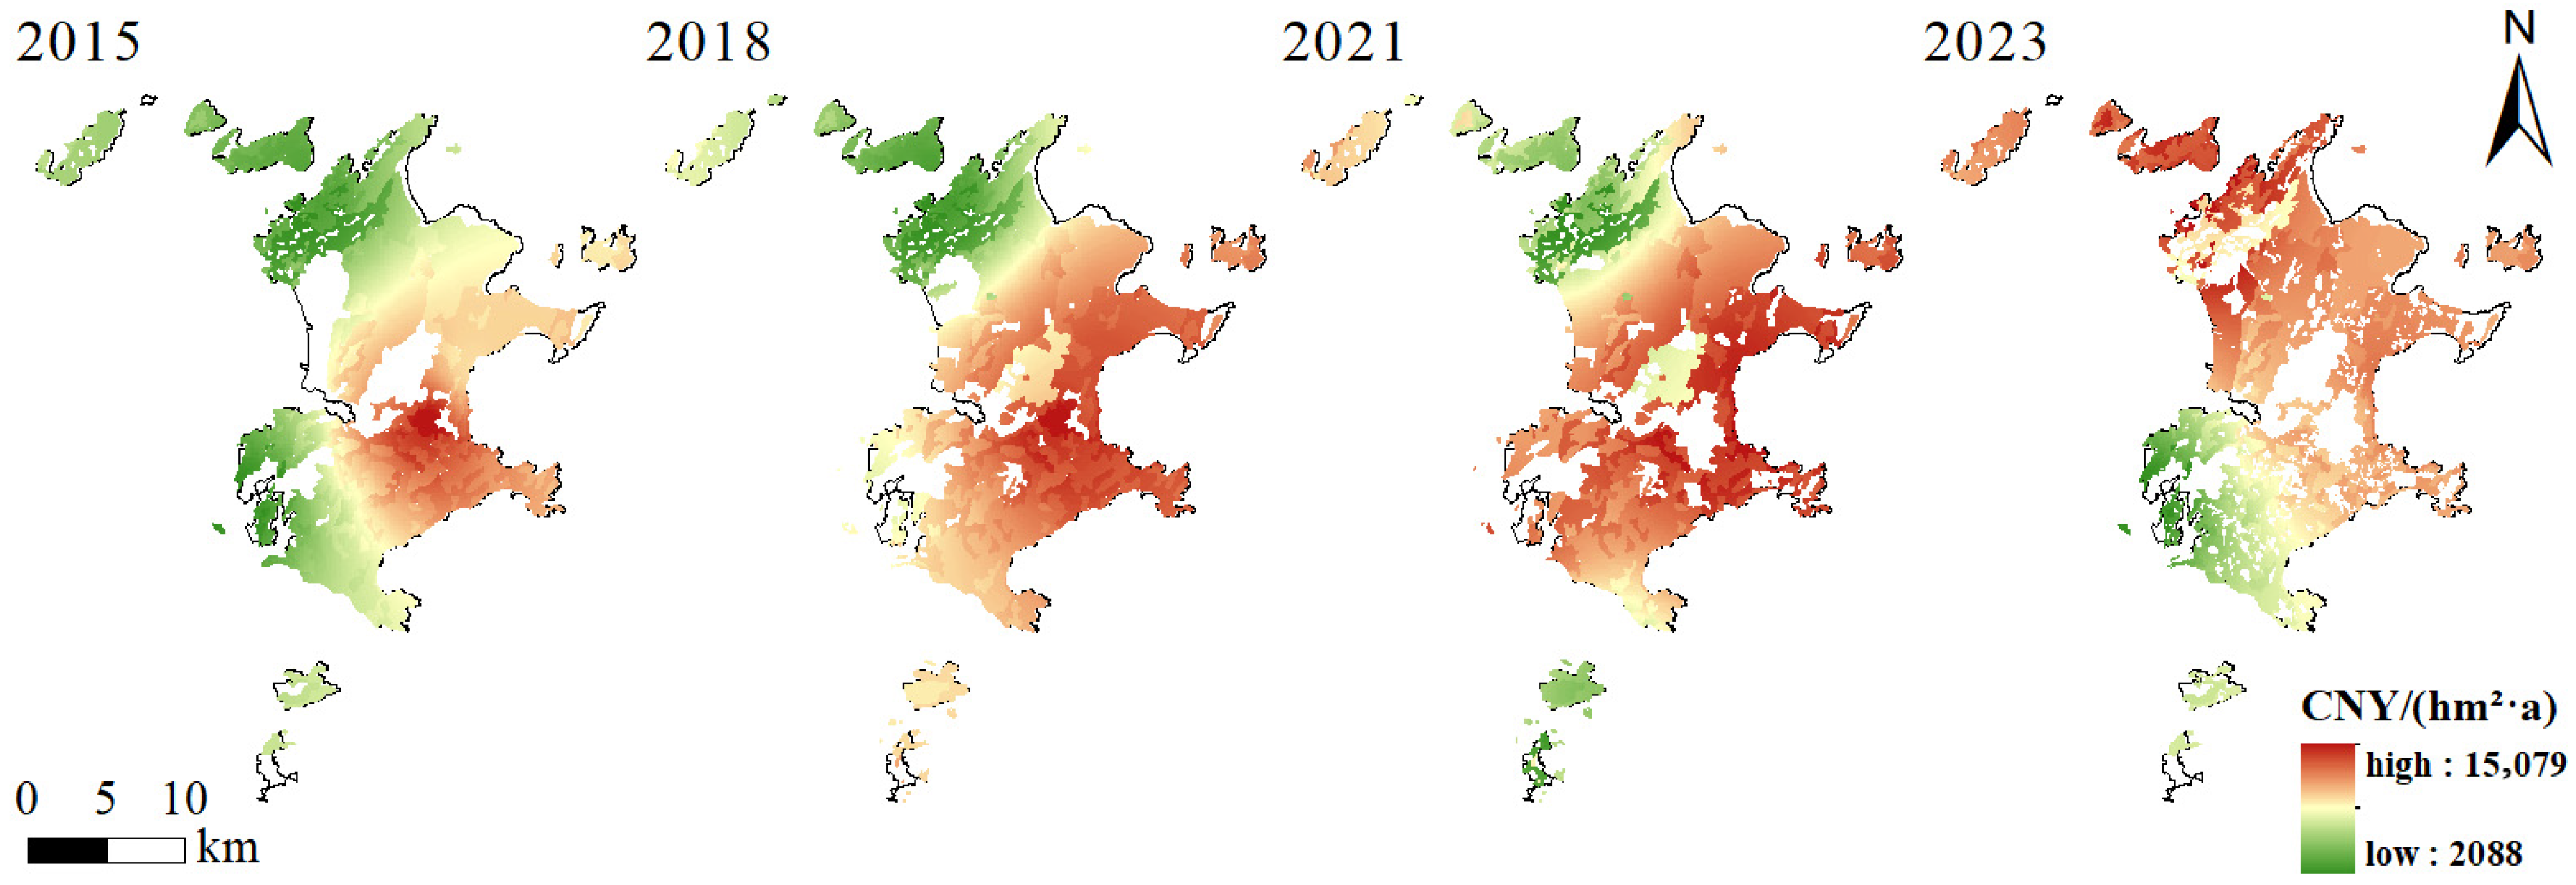
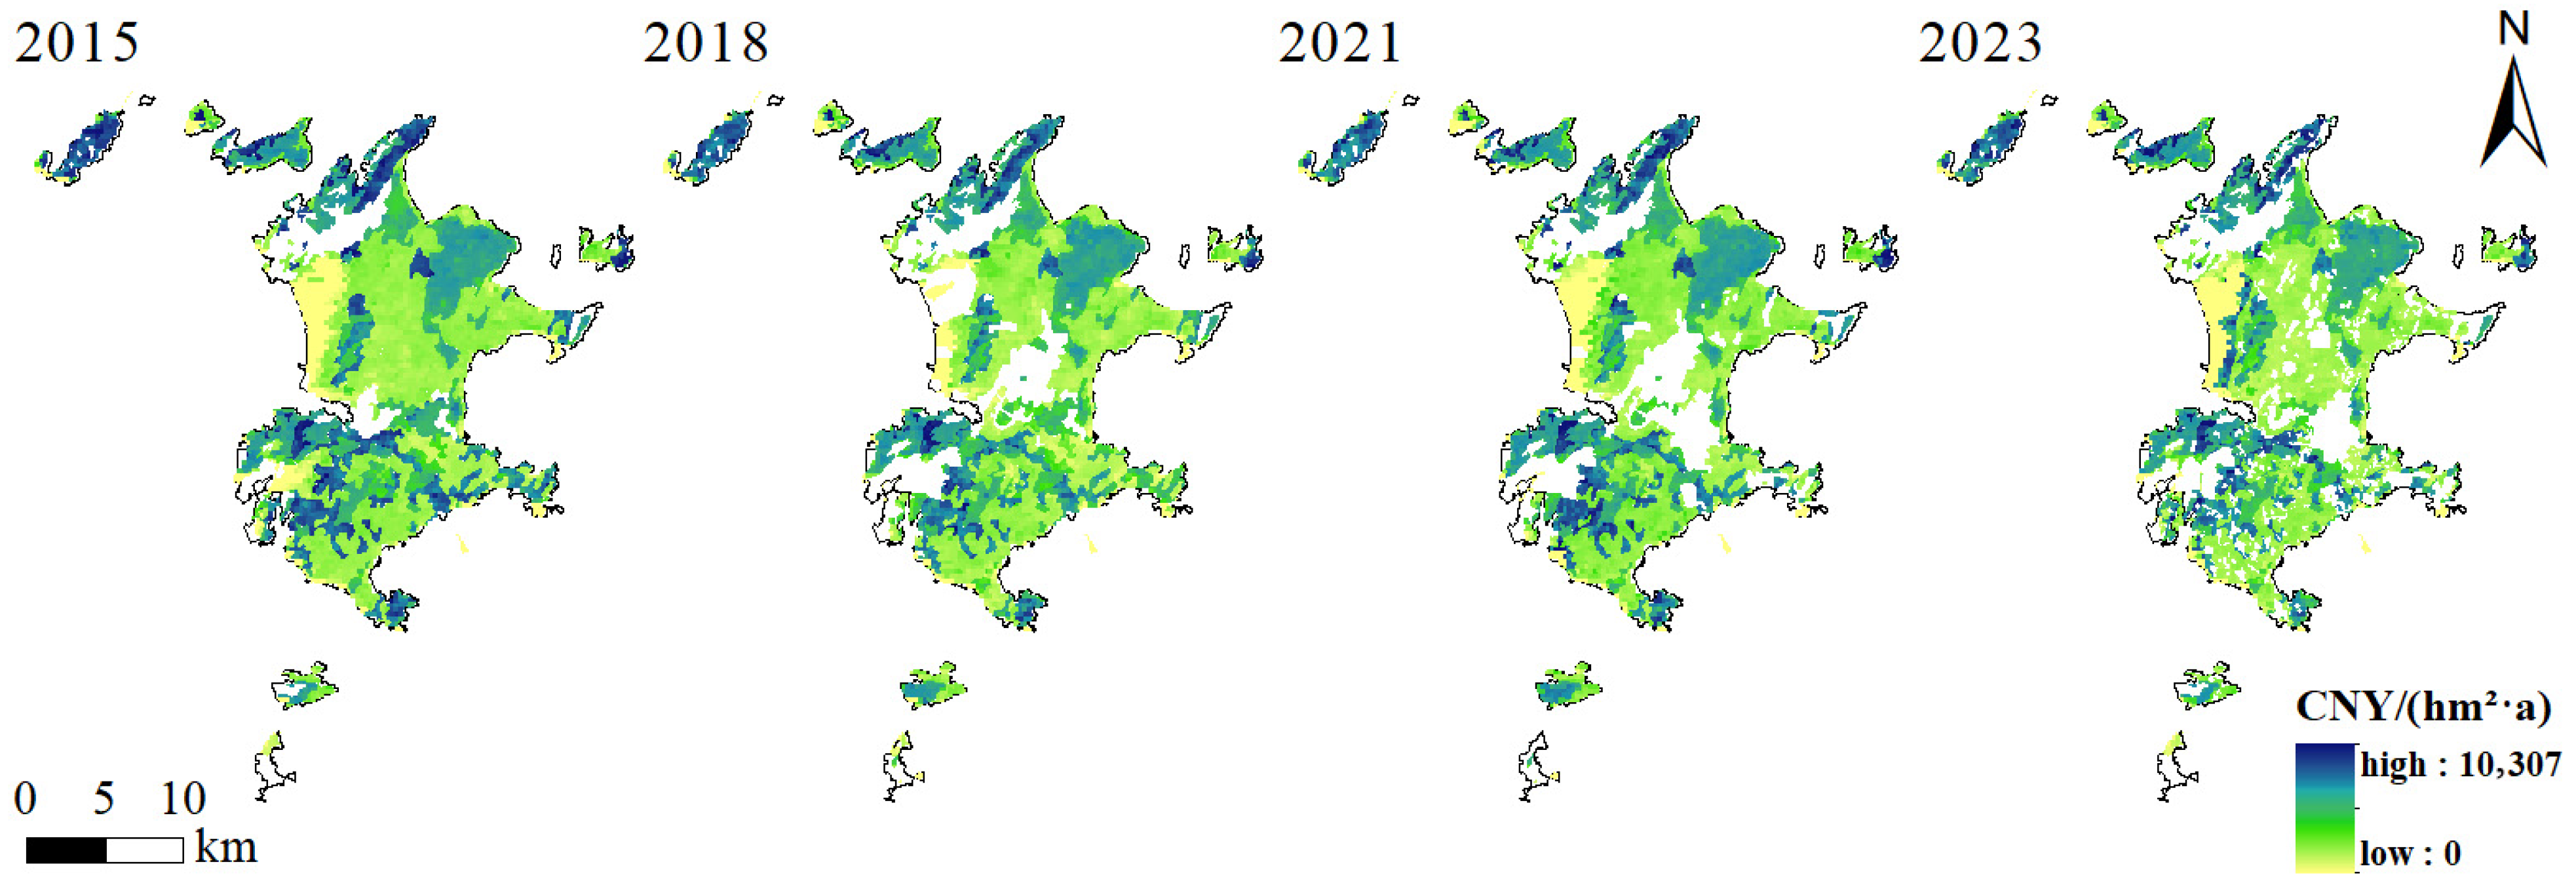
The total values of water conservation and climate regulation showed an overall decline, decreasing from 357 million to 305 million yuan and from 117 million to 103 million yuan, respectively. Both services evolved from relatively concentrated distributions to more fragmented patterns, with weakened connectivity and an increasingly patchy and fragmented landscape (Figure 10 and Figure 11). The reduction in the water conservation capacity was mainly influenced by the expansion of built-up land and accelerated urbanization. This led to decreased vegetation cover and surface hardening, weakening the hydrological regulation capacity. Changes in land-use patterns and localized rainfall variations further exacerbated this process. The decline in climate regulation was closely associated with a reduction in vegetation cover and the decreasing continuity of green spaces.
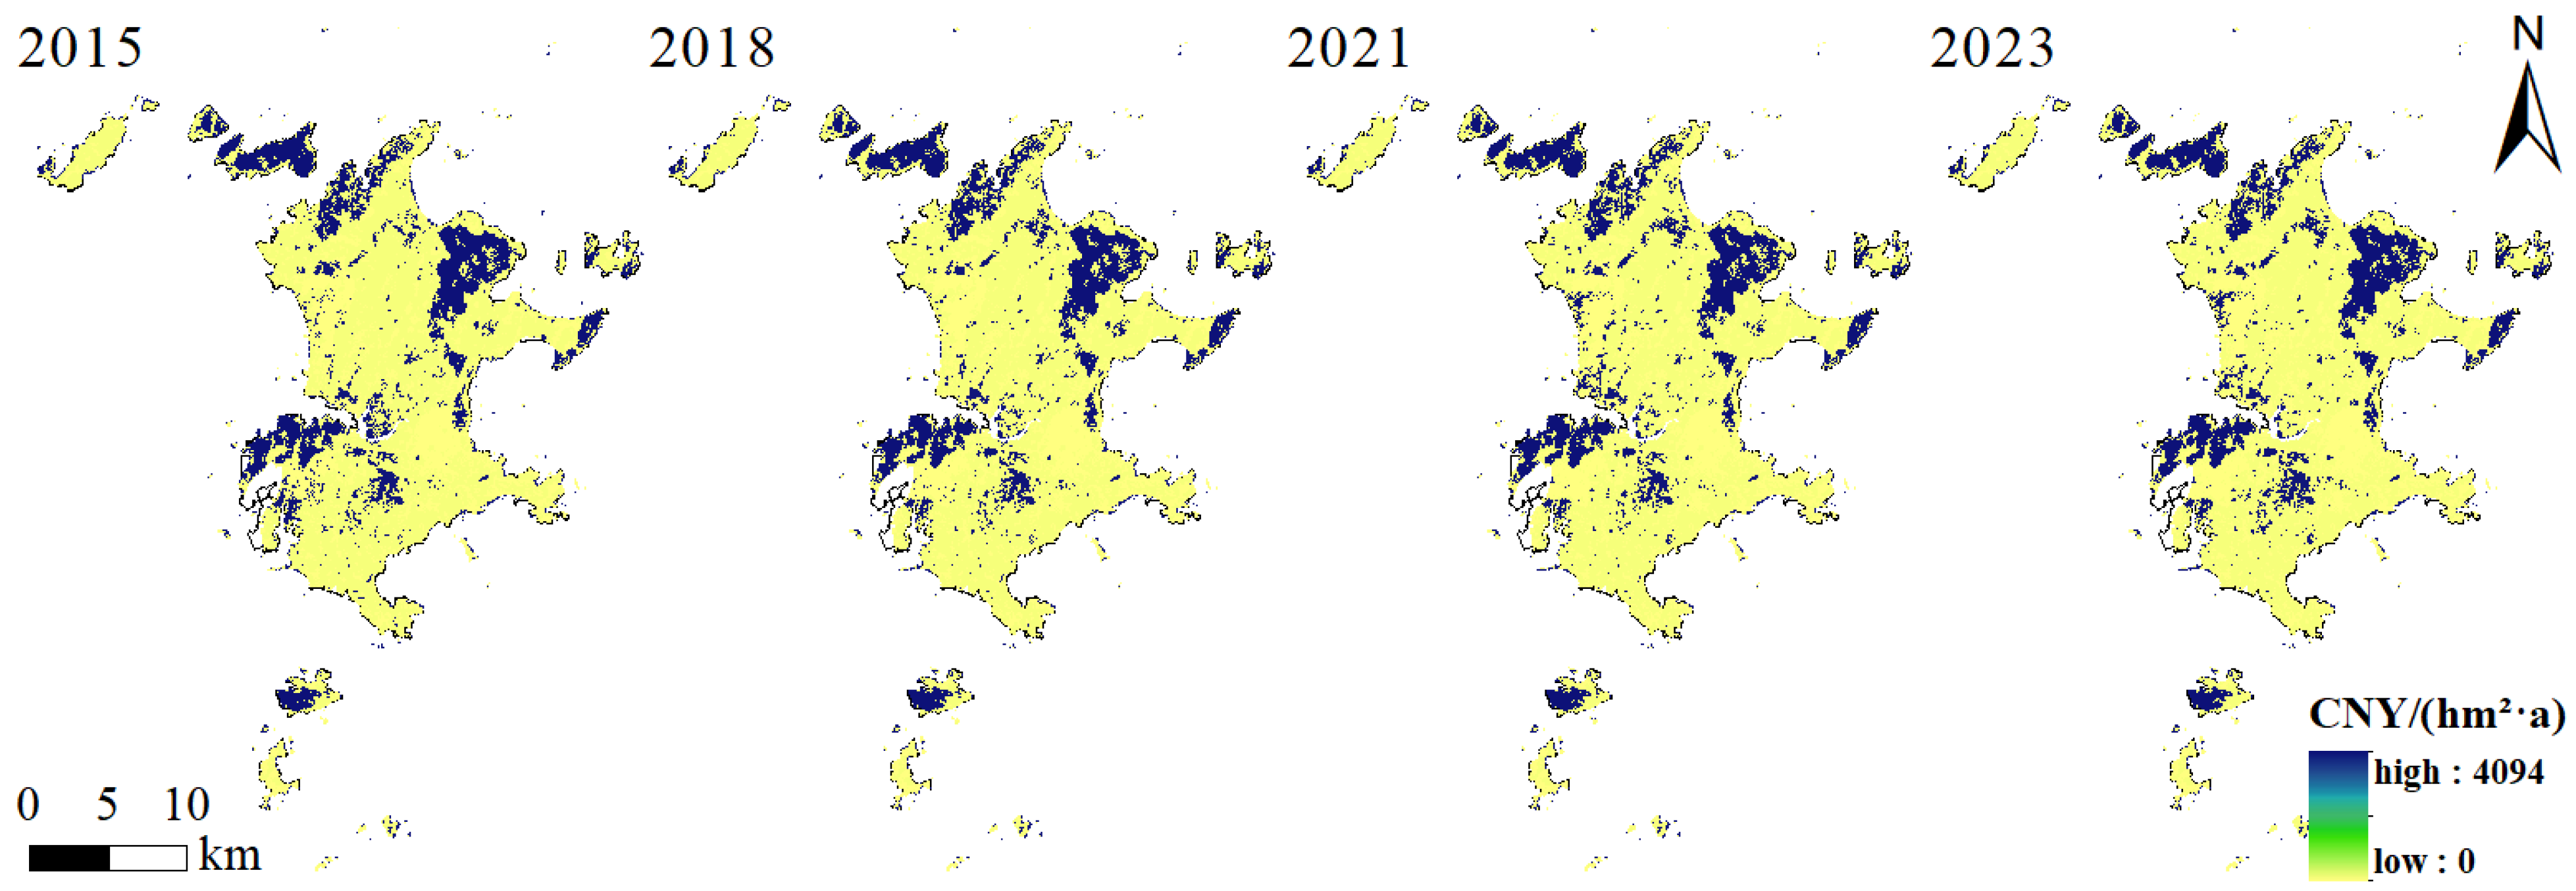
In contrast, from 2015 to 2023, the spatial configuration of carbon sequestration, oxygen release, and soil retention remained largely unchanged (Figure 12 and Figure 13). High-value zones of carbon sequestration and oxygen release were mainly concentrated in forest-dense regions in the northern and southwestern parts of the island, and in the eastern and central areas with high vegetation cover. This indicated that their distribution was primarily controlled by land cover type. High-value zones of soil retention were consistently distributed in the northern mountainous regions. Meanwhile, the plains maintained low values. Both services exhibited minimal temporal variations, reflecting a high degree of ecological functional stability.

4.2. Drivers of GEP Growth

From 2015 to 2023, the GEP of Pingtan increased by 9.118 billion yuan. Of this, tourism and recreation services contributed 8.277 billion yuan, water purification contributed 0.459 billion yuan, and carbon sequestration and oxygen release contributed 0.447 billion yuan. This accounted for 90.78%, 5.04%, and 4.90% of the total growth, respectively. This upward trend primarily reflects the enhancement in ecosystem service functions driven by multiple factors, rather than only being the result of intensified development or economic expansion.
Since 2016, Fujian Province has proposed the strategic goal of building an international tourism island and introduced a series of policy measures to provide institutional support for ecological protection and sustainable industrial development in Pingtan. Policy guidance has played a pivotal role in optimizing resource allocation and steering the industrial structure in an eco-friendly direction, facilitating the regional economic transition from development-driven growth to ecological value-oriented growth. With improvements in infrastructure, the spatial accessibility and service capacity of ecotourism have increased substantially. In 2020, the opening of China’s first cross-sea road–rail bridge eliminated the transportation bottleneck between Pingtan and Fuzhou. The construction of the ring island highway and supporting scenic facilities adhered to the principle of ecological priority, ensuring that transportation and tourism functions are optimized with minimal ecological disturbance, enhancing the spatial availability of ecosystem services.
Pingtan continued to advance its coastal ecological restoration and landscape enhancement projects. A total of 19.42 km of the coastline has been rehabilitated, covering a restored area of 337 ha2. For instance, the Zhuyu Bay Ecological Revetment Project established 7.8 ha2 of ecological shoreline, which has become a habitat for rare species such as the black-faced spoonbill. In the Tannan Bay and Longwangtou areas, integrated measures including beach cleanup, demolition of illegal structures, sand nourishment, and vegetation restoration have substantially improved the coastal ecological structure and landscape connectivity. Among these efforts, 24.6 hm2 of salt-tolerant vegetation was planted, forming a 5.1 km coastal ecological buffer zone. Meanwhile, the proportion of beaches rated as having excellent natural quality increased to 71%. The Junshan Marine Ecological Protection and Restoration Project added 1286 hm2 of forest and 38 hm2 of green space, with ambient air quality compliance reaching 99.4%. Centered on optimizing ecosystem structure, these restoration actions have substantially enhanced the water self-purification capacity and carbon sequestration functions, being the principal ecological drivers of growth in water purification and carbon sequestration–oxygen release values.
During the post-pandemic period, increasing public health awareness and increasing demand for ecological recreation further stimulated the expansion of the ecotourism market. Benefiting from its high-quality ecological environment and natural landscape resources, Pingtan has attracted many ecotourism and wellness-oriented visitors. In 2023, the number of tourists reached 10.2615 million, 4.46 times higher than that in 2015. Meanwhile, tourism revenue increased 16.16-fold. This indicates a synergistic relationship between ecological quality improvement, infrastructure enhancement, and policy incentives, which jointly drive the rapid growth of tourism and recreational service values.
The enhancement mechanism of Pingtan’s GEP can be attributed to a multi-level linkage system of policy guidance–ecological restoration–infrastructure development–market response. Policy guidance has laid the institutional foundation for green development, ecological restoration has strengthened ecosystem service functions, infrastructure construction has improved service accessibility, and changes in market demand have amplified the realization of ecological value. Therefore, the continuous growth of Pingtan’s GEP reflects improvements in ecosystem quality and service functionality rather than being a direct outcome of economic expansion or development.

4.3. Suitability and Limitation Analysis

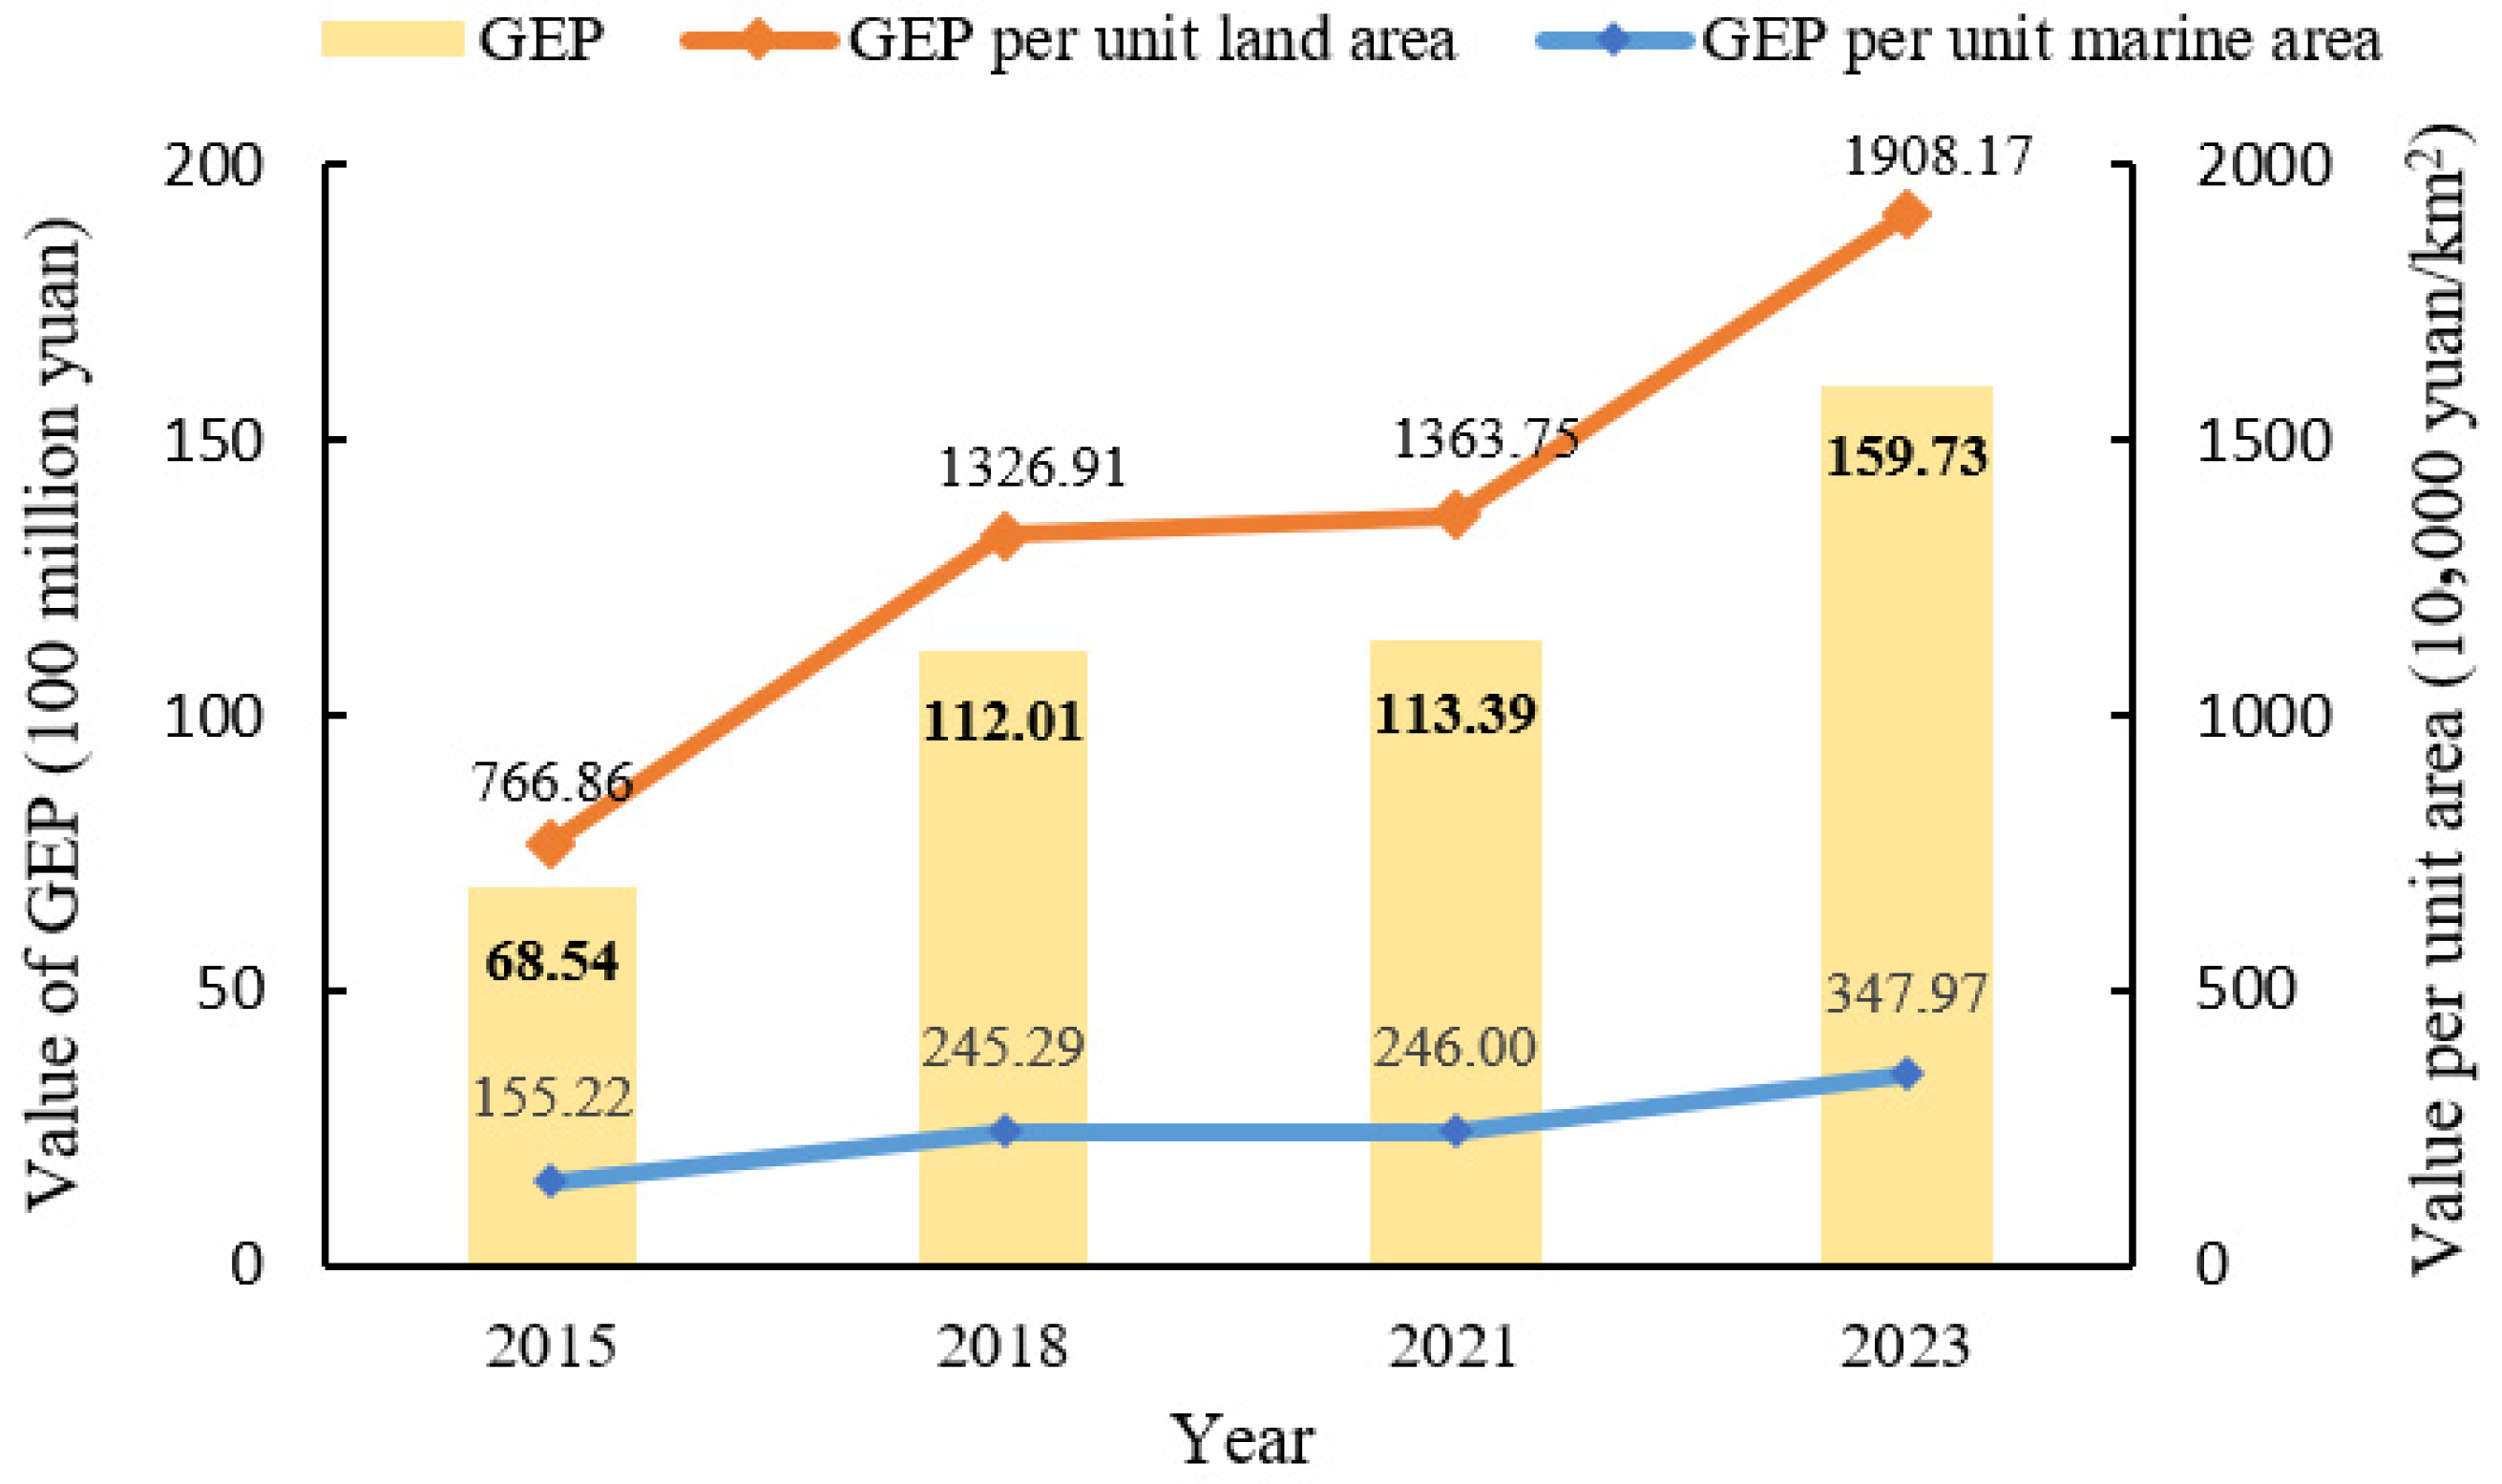
The unit-area GEP of the terrestrial and marine ecosystems in Pingtan exhibited a continuous upward trend (Figure 14). The GEP per square kilometer of terrestrial ecosystems increased significantly from 7.6686 million yuan/km2 in 2015 to 19.0817 million yuan/km2 in 2023. The GEP per square kilometer of marine ecosystems rose steadily from 1.5522 million yuan/km2 to 3.4797 million yuan/km2.
Compared to previous studies [21,48,49,50,51], the results of this study demonstrate consistency and suitability in terms of value ranges. In 2015, the unit-area GEP of the land and marine areas in the Zhoushan Island region were 7.4233 million yuan/km2 and 1.1297 million yuan/km2 [50,51], respectively. In comparison, the corresponding values for Pingtan in the same year were 7.6686 million yuan/km2 and 1.5522 million yuan/km2, respectively. These values are within a similar range but slightly higher than those of Zhoushan, which aligns with the actual ecological background of the two regions during that period. This consistency indicates that the accounting methods and parameter settings used in this study are suitable and comparable.
However, certain limitations remain in the valuation of tourism and recreational services. Owing to data availability and method constraints, it is difficult to separate the influence of human capital inputs. The absence of data on infrastructure construction and maintenance costs within scenic areas may lead to a slight overestimation of the total value of cultural services. This upward bias arises primarily from the current inability of the accounting framework to fully distinguish between labor and capital expenditure. Nevertheless, considering this potential deviation, the contribution of cultural services to the total GEP remained substantial, and their structural importance and relative importance were not materially affected. In addition, some ecosystem service coefficients and biophysical parameters had to be treated as spatially or temporally homogeneous due to limited monitoring data, potentially obscuring fine-scale heterogeneity and dynamic feedbacks between ecological processes and human activities. Moreover, since Pingtan is a relatively small, island-based, and tourism-oriented region, the empirical findings should be interpreted with caution when extrapolating to inland cities, resource-dependent regions, or countries with different ecological and institutional contexts. Future research could extend this framework by conducting comparative studies across multiple island and coastal regions, both within and beyond China, and by integrating higher-resolution ecological and socio-economic data (including survey-based information on recreation behavior). It could also be extended by incorporating explicit uncertainty analysis and scenario simulations, in order to better test the transferability of the indicator system and enhance its policy relevance at broader spatial scales.

4.4. Suggestions for Improving Pingtan’s GEP

Efforts should be made to promote the green and efficient transformation of fisheries and the realization of blue carbon value. Based on local specialties such as abalone and mussels, the ecological transformation of fish cage structures and aquaculture models should be advanced to build an integrated industrial chain encompassing seed breeding, aquaculture, processing, marketing, and ecotourism, enhancing product added value. Meanwhile, the development of recreational fisheries should be encouraged to diversify activities, such as angling and fishery culture experiences, facilitate the circulation of fishery resources, and promote the integration of fisheries with the leisure industry. Blue carbon sequestration should be strengthened by improving the carbon sink capacity and ecosystem service functions through the construction of marine ranches and the cultivation of high-carbon-storage capacity species. Pingtan’s aquaculture zones are rich in blue carbon resources associated with landmark species, such as laver and abalone. It is advisable to promote research on marine carbon sink accounting and innovate market-based trading mechanisms, such as auctions and judicial subscriptions, to enhance value realization through market incentives.
Building on ecological restoration, enhancement in Pingtan’s GEP should be pursued. Continuous improvement in ecological quality is essential, with a focus on restoring coastal shelterbelts in Longfengtou, Aoqian, and Jiangjunshan and strengthening the protection system for ecologically sensitive zones to provide solid ecological support for regional sustainable development. Regarding infrastructure, efforts should be made to improve the landscape quality of the Pingtan Ring Island Scenic Belt by coordinating coastal landscape restoration with the ecological rehabilitation of abandoned mining sites, enhancing the regional ecological carrying capacity. The opportunity presented by the construction of Pingtan International Tourism Island should be leveraged to guide financial institutions to invest in ecosystem protection and development, improving regional ecosystem service functions. A green financial risk-sharing mechanism should be explored to support the development of green credit and policy-based insurance to ensure sufficient financial resources for the sustainable use of ecosystem services.
Therefore, a diversified ecological protection funding mechanism should be established. By combining government guidance funds with green finance, an ecological protection fund can be created while encouraging active participation from enterprises and social capital. The ecological compensation mechanism should be improved by promoting resource pricing and the marketization of ecosystem services to strengthen the financial security for ecosystem protection and restoration. Pilot ecological restoration projects should be conducted to explore market-based transactions and government procurement of ecosystem services, thereby promoting the sustained growth of the GEP.

5. Conclusions

Building on existing GEP accounting studies, we have established an island-specific GEP indicator system and conducted an empirical study in Pingtan, a representative island region.
(1)
By integrating the natural conditions and ecosystems of island regions, a comprehensive indicator framework was developed, encompassing 14 ecosystem services: agriculture, forestry, animal husbandry, fishery products, freshwater resources, carbon sequestration and oxygen release, water purification, air purification, flood regulation, water conservation, soil retention, climate regulation, eco-DRR, marine fishery products, coastal protection, tourism and recreation, and seascape value-added. This framework constitutes a holistic accounting system with distinct island characteristics.
(2)
Multi-period accounting results show that from 2015 to 2023, Pingtan’s total GEP was 6.854 billion yuan (2015), 11.201 billion yuan (2018), 11.339 billion yuan (2021), and 15.973 billion yuan (2023), exhibiting a phased rapid–slow–rapid pattern of fluctuation. The value structure evolved from a provisioning-dominated to a cultural service-dominated system, in which the continuous expansion of cultural services served as the core driving force of structural transformation.
(3)
The phase-specific surge in the GEP value was driven by multiple interacting factors. Policy support, infrastructure development, and marine ecological restoration together establish fundamental conditions for value enhancement. Among these, ecological restoration serves as a sustained engine for GEP growth by optimizing ecosystem structure and functions, thereby increasing both the quantity and quality of ecosystem services supplied to society. As these ecological improvements are translated into economic benefits, they stimulate the development of related industries, creating a positive feedback loop in which ecological conservation and economic development reinforce each other. In the post-pandemic period, the strengthened public preference for ecotourism and the rapid increase in market demand further increased tourist volume and revenue, making tourism and recreation key drivers of value growth.
(4)
The enhancement in Pingtan’s GEP should be synergistically advanced through fishery transformation, ecological restoration, and financial mechanisms. Efforts should focus on promoting the green and efficient transformation of specialty fisheries and developing recreational fisheries while leveraging blue carbon resources to explore accounting and market-based trading mechanisms. Ecological restoration should be strengthened to improve shoreline management and protect ecologically sensitive areas, thereby enhancing ecological carrying capacity. A diversified funding mechanism should be established to improve ecological compensation and promote market-based transactions and the government procurement of ecosystem services, providing sustainable support for ecosystem protection and restoration.
The Pingtan case also provides a transferable analytical framework that can inform other coastal and island regions, both in China and beyond, particularly those regions seeking to balance tourism-led growth with ecological security. By linking multi-period GEP accounting to structural evolution and policy drivers, this study contributes to refining GEP-based performance evaluation and ecological compensation schemes, thereby enhancing the decision-making relevance of ecosystem service accounting.

Author Contributions

Conceptualization, Z.Z. and H.L.; methodology, M.X.; software, Z.Z.; validation, Z.Z. and M.X.; formal analysis, M.X.; investigation, D.J.; resources, H.L.; data curation, Z.Z.; writing—original draft preparation, Z.Z.; writing—review and editing, H.L. and M.X.; visualization, Z.Z.; supervision, D.J.; project administration, H.L.; funding acquisition, H.L. All authors have read and agreed to the published version of the manuscript.

Funding

This research was jointly funded by the Natural Science Foundation of Fujian Province, China (No. 2023J011388, No. 2022J01513 and No. 2023J011385) and the Science and Technology Projects of Fujian Province (No. 2023Y0075).

Institutional Review Board Statement

Not applicable.

Informed Consent Statement

Not applicable.

Data Availability Statement

Data are available from the authors upon reasonable request, as the data need further use.

Conflicts of Interest

The authors declare no conflicts of interest.

Abbreviations

The following abbreviations are used in this manuscript:
GEPGross Ecosystem Product
GDPGross Domestic Product
Eco-DRREcosystem-based disaster risk reduction
AFAFAgricultural, forestry, animal husbandry, and fishery
FWRFreshwater resources
MFMarine fishery
TCSORTerrestrial carbon sequestration and oxygen release
MCSORMarine carbon sequestration and oxygen release
TWPTerrestrial water purification
MWPMarine water purification
APAir purification
FRFlood regulation
WCWater conservation
SRSoil retention
CRClimate regulation
CPCoastal protection
SVASeascape value-added
TTRTerrestrial tourism and recreation
MTRMarine tourism and recreation

References

  1. Hickel, J.; Hallegatte, S. Can we live within environmental limits and still reduce poverty? Degrowth or decoupling? Dev. Policy Rev. 2021, 40, e12584. [Google Scholar] [CrossRef] [Scilit]
  2. Hickel, J.; Kallis, G. Is Green Growth Possible? New Polit. Econ. 2020, 25, 469–486. [Google Scholar] [CrossRef] [Scilit]
  3. Ouyang, Z.; Zhu, C.; Yang, G.; Xu, W.; Zheng, H.; Zhang, Y.; Xiao, Y. Gross Ecosystem Product: Concept, Accounting Framework and Case Study. Acta Ecol. Sin. 2013, 33, 6747–6761. [Google Scholar] [CrossRef] [Scilit]
  4. Ouyang, Z.; Song, C.; Zheng, H.; Polasky, S.; Xiao, Y.; Bateman, I.J.; Liu, J.; Ruckelshaus, M.; Shi, F.; Xiao, Y.; et al. Using gross ecosystem product (GEP) to value nature in decision making. Proc. Natl. Acad. Sci. USA 2020, 117, 14593–14601. [Google Scholar] [CrossRef] [Scilit]
  5. Yang, H.; Gou, X.; Ma, W.; Xue, B. Research and Application of GEP: China’s Experience in Natural Capital Accounting. Front. Environ. Sci. 2023, 11, 1106654. [Google Scholar] [CrossRef] [Scilit]
  6. Costanza, R.; D’Arge, R.; De Groot, R.; Farber, S.; Grasso, M.; Hannon, B.; Limburg, K.; Naeem, S.; O’Neill, R.V.; Paruelo, J.; et al. The value of the world’s ecosystem services and natural capital. Nature 1997, 387, 253–260. [Google Scholar] [CrossRef] [Scilit]
  7. Daily, G.C. Introduction: What are ecosystem services. In Nature’s Services: Societal Dependence on Natural Ecosystems; Island Press: Washington, DC, USA, 1997; Chapter 1; p. 1. [Google Scholar]
  8. Assessment, M.E. Ecosystems and Human Well-Being: A Framework for Assessment; Island Press: Washington, DC, USA, 2003; ISBN 978-1-55963-403-8. [Google Scholar]
  9. Hao, C.; Wu, S.; Zhang, W.; Chen, Y.; Ren, Y.; Chen, X.; Wang, H.; Zhang, L. A Critical Review of Gross Ecosystem Product Accounting in China: Status Quo, Problems and Future Directions. J. Environ. Manag. 2022, 322, 115995. [Google Scholar] [CrossRef] [Scilit] [PubMed]
  10. Wu, L.; Xu, D.; Liu, B.; Zhang, W. Forest ecological products and their value accounting: A case study of J ForestFarm in Beijing. J. Arid Land Resour. Environ. 2024, 38, 181–190. [Google Scholar] [CrossRef]
  11. Li, Y.; Xiong, K.; Zhang, W.; Song, S.; Luo, L. Analyzing Characteristics of Grassland Gross Ecosystem Product to Inform Decision Making in the Karst Desertification Control. Agronomy 2023, 13, 1861. [Google Scholar] [CrossRef] [Scilit]
  12. Wang, H.; Wu, N.; Han, G.; Li, W.; Batunacun; Bao, Y. Analysis of spatial-temporal variations of grassland gross ecosystem product based on machine learning algorithm and multi-source remote sensing data: A case study of Xilinhot, China. Glob. Ecol. Conserv. 2024, 51, e02942. [Google Scholar] [CrossRef] [Scilit]
  13. Zhu, Z.; Wu, K.; Zhou, S.; Wang, Z.; Chen, W. Multi-Scale Gross Ecosystem Product (GEP) Valuation for Wetland Ecosystems: A Case Study of Lishui City. Water 2024, 16, 3554. [Google Scholar] [CrossRef] [Scilit]
  14. Li, W.; He, S.; Chen, E.; Xia, T.; Jin, Y.; Tang, B.; Chen, S. Indices and Methods for Evaluating Gross Ecosystem Product in Sea Areas: A Case Study in Changdao County, China. Front. Mar. Sci. 2024, 11, 1356149. [Google Scholar] [CrossRef] [Scilit]
  15. Liu, J.; Zhang, Q.; Wang, Q.; Lv, Y.; Tang, Y. Gross Ecosystem Product Accounting of a Globally Important Agricultural Heritage System: The Longxian Rice–Fish Symbiotic System. Sustainability 2023, 15, 10407. [Google Scholar] [CrossRef] [Scilit]
  16. Zhang, J.; Song, Y.; Wang, J. Spatiotemporal patterns of gross ecosystem product across China’s cropland ecosystems over the past two decades. Front. Ecol. Evol. 2022, 10, 959329. [Google Scholar] [CrossRef] [Scilit]
  17. Xu, C.; Zhao, T.; Shao, Y.; Li, X.; Yan, G. Accounting for the gross ecosystem product (GEP) of forests in nature reserves—Taking the Taishan Scenic and Historic Spot as an example. PLoS ONE 2025, 20, e0320075. [Google Scholar] [CrossRef] [Scilit] [PubMed]
  18. Liu, J.; Xu, M.; Wang, A.; Sun, T.; Zhang, C.; Chen, X.; Zhang, P. Quantifying the human wellbeing of the national wetland park: Gross ecosystem product accounting of Shandong Mata Lake National Wetland Park. Front. Environ. Sci. 2025, 13, 1500075. [Google Scholar] [CrossRef] [Scilit]
  19. Jia, P.; Chen, J.; Gao, D.; Zhu, Y.; Wang, X. Framework Construction and Application of Gross Ecosystem Product (GEP) in the Three-River-Source National Park (TRSNP) in China. Land 2025, 14, 642. [Google Scholar] [CrossRef] [Scilit]
  20. Yu, F.; Li, X.; Wang, H.; Zhang, L.; Xu, W.; Fu, R. Accounting of Gross Ecosystem Product Based on Emergy Analysis and Ecological Land Classification in China. Acta Ecol. Sin. 2016, 36, 1663–1675. [Google Scholar] [CrossRef] [Scilit]
  21. Li, K.; Fan, H.; Ouyang, J.; Yao, P. Valuation of the 2020 gross ecosystem product of China and analysis of driving factors. J. Clean. Prod. 2025, 513, 145741. [Google Scholar] [CrossRef] [Scilit]
  22. Hu, Q.; Lu, C.; Chen, T.; Chen, W.; Yuan, H.; Zhou, M.; Qiu, Z.; Bao, L. Evaluation and Analysis of the Gross Ecosystem Product towards the Sustainable Development Goals: A Case Study of Fujian Province, China. Sustainability 2023, 15, 3925. [Google Scholar] [CrossRef] [Scilit]
  23. Ji, L.; Qi, Y.; Jiang, Q.; Zhao, C. Spatial–Temporal Variations of the Gross Ecosystem Product under the Influence of the Spatial Spillover Effect of Urbanization and Ecological Construction in the Yangtze River Delta Region of China. Land 2024, 13, 778. [Google Scholar] [CrossRef] [Scilit]
  24. Zhao, N.; Wang, H.; Zhong, J.; Bai, Y.; Yi, S. Evaluation of the Gross Ecosystem Product and Analysis of the Transformation Path of “Two Mountains” in Hulunbuir City, China. Land 2022, 12, 63. [Google Scholar] [CrossRef] [Scilit]
  25. Zou, Z.; Wu, T.; Xiao, Y.; Song, C.; Wang, K.; Ouyang, Z. Valuing natural capital amidst rapid urbanization: Assessing the gross ecosystem product (GEP) of China’s ‘Chang-Zhu-Tan’ megacity. Environ. Res. Lett. 2020, 15, 124019. [Google Scholar] [CrossRef] [Scilit]
  26. Shen, Y.; Yi, X.; Chen, M.; Ouyang, Z. Gross ecosystem product accounting in Miyun County: The supply and use of ecosystem services. Front. Ecol. Evol. 2024, 12, 1367768. [Google Scholar] [CrossRef] [Scilit]
  27. Li, Y.; Wang, H.; Liu, C.; Sun, J.; Ran, Q. Optimizing the Valuation and Implementation Path of the Gross Ecosystem Product: A Case Study of Tonglu County, Hangzhou City. Sustainability 2024, 16, 1408. [Google Scholar] [CrossRef] [Scilit]
  28. Li, J.; Han, Q.; Zhang, L.; Feng, L.; Liu, G. Analyzing the spatiotemporal evolution and driving forces of gross ecosystem product in the upper reaches of the Chaobai River Basin. Front. Environ. Sci. Eng. 2024, 18, 102. [Google Scholar] [CrossRef] [Scilit]
  29. Guo, J.; Wang, L. Spatiotemporal Variations in Gross Ecosystem Product and Its Relationship with Economic Growth in Ecologically Vulnerable Watershed Areas: A Case Study of Yongding River Basin. Sustainability 2024, 16, 9383. [Google Scholar] [CrossRef] [Scilit]
  30. Li, T.; Chen, J.; Zhu, J.; Zeng, L.; Yan, Y.; Hu, A.; Wang, Y. Evaluation of gross forest ecosystem product on small scale: Taking Siqian she ethnic town in Taishun county as an example. Acta Ecol. Sin. 2025, 45, 1406–1416. [Google Scholar] [CrossRef]
  31. Geng, J.; Ren, B. Application of the gross ecosystem product accounting theory on rural ecological civilization assessment in Hainan Province: A case study of Wenmen Village in Sanya. Acta Ecol. Sin. 2020, 40, 3236–3246. [Google Scholar] [CrossRef] [Scilit]
  32. United Nations. System of Environmental-Economic Accounting—Ecosystem Accounting (SEEA EA). In White Cover Publication, Pre-Edited Text Subject to Official Editing; United Nations: San Francisco, CA, USA, 2021; Volume 350. [Google Scholar]
  33. Pacetti, T.; Lompi, M.; Panza, G.; Bosso, A.; Monaci, M.; Pasini, G.; Santolini, R. Gross Ecosystem Product as a Measure of Natural Capital Value: An Italian Experience. Earth Syst. Environ. 2025, 9, 2417–2435. [Google Scholar] [CrossRef] [Scilit]
  34. National Development and Reform Commission (NDRC). Gross Ecosystem Product Accounting Specification; People’s Publishing House: Beijing, China, 2022.
  35. GB/T 28058-2011; Technical Directives for Marine Ecological Capital Assessment. General Administration of Quality Supervision, Inspection and Quarantine of the People’s Republic of China (AQSIQ): Beijing, China; Standardization Administration of China (SAC): Beijing, China, 2011. Available online: http://c.gb688.cn/bzgk/gb/showGb?type=online&hcno=73B9ACEA58EFE2BFC29AD8FA600520B2 (accessed on 17 October 2025).
  36. DB3309/T 114-2024; Technical Specification for Accounting Value of Ecosystem Product (VEP) in Specific Geographic Unit in Coastal Zone. Zhoushan Administration for Market Regulation: Zhoushan, China, 2024. Available online: https://dbba.sacinfo.org.cn/attachment/onlineRead/c8b74b17bba3561a41e14b90ee584a39a38b3462a55005b13809bb6e16aa4c46 (accessed on 17 October 2025).
  37. DB46/T 611-2023; Technical Specification for Accounting Gross Ecosystem Product (GEP). Hainan Administration for Market Regulation: Haikou, China, 2023. Available online: https://dbba.sacinfo.org.cn/attachment/onlineRead/6d2c63f34972a061d927f1e5f89a9e1394a528cdd14ac201a0b61d5752f04449 (accessed on 17 October 2025).
  38. DB4403/T 141-2021; Technical Specification for Accounting Gross Ecosystem Product of Shenzhen. Shenzhen Administration for Market Regulation: Shenzhen, China, 2021. Available online: https://dbba.sacinfo.org.cn/attachment/onlineRead/72deb97fd3814b9486bf3f48ec311dbed08945701ef856fd7f0ba4f072352821 (accessed on 17 October 2025).
  39. DB3502/T 102-2023; Technical Guidelines for STATISTICAL accounting of Gross Ecosystem Product (GEP). Xiamen Administration for Market Regulation: Xiamen, China, 2023. Available online: https://dbba.sacinfo.org.cn/attachment/onlineRead/c722595bad7a39ed208103f072fbcefad75596690903fafd746757593eba6a6f (accessed on 17 October 2025).
  40. Chen, K.; Wang, Z.; Wang, J.; Gao, Y.; Yue, L.; Cai, F. Overview of marine ecosystem product accounting: Theories, methods and application. J. Appl. Oceanogr. 2024, 43, 708–720. [Google Scholar]
  41. Zheng, H.; Wu, T.; Ouyang, Z.; Polasky, S.; Ruckelshaus, M.; Wang, L.; Xiao, Y.; Gao, X.; Li, C.; Daily, G.C. Gross ecosystem product (GEP): Quantifying nature for environmental and economic policy innovation. Ambio 2023, 52, 1952–1967. [Google Scholar] [CrossRef] [Scilit] [PubMed]
  42. Odum, H.T. Self-Organization, Transformity, and Information. Science 1988, 242, 1132–1139. [Google Scholar] [CrossRef] [Scilit]
  43. Hui, X.; Xu, X.; Zhu, L. Ecological Product Value Accounting: Review, Problems and Countermeasures. Stat. Res. 2024, 41, 13–28. [Google Scholar]
  44. Zhang, L.; Chen, X.; Liang, T.; Wang, H.; Hao, C.; Ren, Y.; Li, Y.; Wu, S. Research Progress, Problems and Prospects of Ecosystem Products Value Accounting in China. Res. Environ. Sci. 2023, 36, 743–756. [Google Scholar] [CrossRef]
  45. Zhou, X.; Wang, Q.; Zhang, R.; Ren, B.; Wu, X.; Wu, Y.; Tang, J. A Spatiotemporal Analysis of Hainan Island’s 2010–2020 Gross Ecosystem Product Accounting. Sustainability 2022, 14, 15624. [Google Scholar] [CrossRef] [Scilit]
  46. Ma, G.; Yu, F.; Wang, J.; Zhou, X.; Yuan, J.; Mou, X.; Zhou, Y.; Yang, W.; Peng, F. Measuring gross ecosystem product (GEP) of 2015 for terrestrial ecosystems in China. Chin. Environ. Sci. 2017, 37, 1474–1482. [Google Scholar]
  47. Zhang, Y.; Han, B.; Sun, F. Gross Ecosystem Product accounting system and its management application: A case study of Shenzhen. Acta Ecol. Sin. 2023, 43, 7023–7034. [Google Scholar] [CrossRef]
  48. Shi, H.; Zheng, W.; Ding, D.; Lv, J. Valuation and ecosystem services of typical island. Mar. Environ. Sci. 2009, 28, 743–748. [Google Scholar] [CrossRef]
  49. Zhao, J.; Shen, G.; Yan, L.; Huang, L.; Jin, A.; Huo, S. Assessment and spatiotemporal analysis of the ecosystem services value of island: A case study of Jintang Island. Acta Ecol. Sin. 2016, 36, 7768–7777. [Google Scholar] [CrossRef] [Scilit]
  50. Bao, X.; Zhao, Y.; Dong, M.; Xu, H.; Chen, Y.; Wu, D.; Shao, S. Assessment of the value of island terrestrial ecosystem services in Zhoushan City. J. Zhejiang Agric. Sci. 2019, 60, 1916–1920. [Google Scholar]
  51. Zhao, S.; Li, M.; Wu, C. Emergy valuation of ecosystem services in the Zhoushan marine area. Acta Ecol. Sin. 2015, 35, 678–685. [Google Scholar] [CrossRef] [Scilit]
Figure 1. Geographical location of the study area.
Sustainability 17 10647 g001
Figure 2. GEP accounting process.
Sustainability 17 10647 g002
Figure 3. Change in provisioning service value.
Sustainability 17 10647 g003
Figure 4. Change in regulating service value.
Sustainability 17 10647 g004
Figure 5. Change in cultural service value.
Sustainability 17 10647 g005
Figure 6. Growth characteristics of GEP.
Sustainability 17 10647 g006
Figure 7. Proportional structure of Pingtan’s GEP from 2015 to 2023. (a) Pingtan’s GEP structure in 2015; (b) Pingtan’s GEP structure in 2023.
Sustainability 17 10647 g007
Figure 8. Evolution of the structural proportion of GEP.
Sustainability 17 10647 g008
Figure 9. Spatial evolution of flood regulation.
Sustainability 17 10647 g009
Figure 10. Spatial evolution of water conservation.
Sustainability 17 10647 g010
Figure 11. Spatial evolution of climate regulation.
Sustainability 17 10647 g011
Figure 12. Spatial evolution of carbon sequestration and oxygen release.
Sustainability 17 10647 g012
Figure 13. Spatial evolution of soil retention.
Sustainability 17 10647 g013
Figure 14. Change in GEP per unit area.
Sustainability 17 10647 g014
Table 1. Data sources.
TypeData NameSources
Natural geographic dataLand use dataCLCD (https://zenodo.org/records/15853565 (accessed on 26 October 2025)) CNLUCC (https://www.resdc.cn/DOI/doi.aspx?DOIid=54 (accessed on 26 October 2025))
Air quality dataPingtan Comprehensive Experimental Zone Natural Resources and Ecological Environment Bureau
Annual rainfall dataPingtan Comprehensive Experimental Zone Meteorological Bureau
Rainfall erosivity factor (R)National Tibetan Plateau/Third Pole Environment Data Center (https://data.tpdc.ac.cn/zh-hans/data/faae7605-a0f2-4d18-b28f-5cee413766a2 (accessed on 26 October 2025))
Soil erodibility factor (K)Resource and Environmental Science Data Platform (https://www.resdc.cn/ (accessed on 26 October 2025))
Topographic factor (LS)China Scientific Data (https://www.sciengine.com/doi/10.11922/11-6035.csd.2024.0026.zh (accessed on 26 October 2025))
Fractional vegetation cover (FVC)Global resources data cloud (www.gis5g.com)
Marine monitoring survey dataIsland Research Center, Ministry of Natural Resources
2 m-level remote sensing imageIsland Research Center, Ministry of Natural Resources
Coastline vector dataIsland Research Center, Ministry of Natural Resources
Chemical Oxygen Demand of marine dischargesPingtan Comprehensive Experimental Zone Natural Resources and Ecological Environment Bureau
Socioeconomic dataPingtan Statistical YearbookPingtan Comprehensive Experimental Zone Bureau of Statistics
Statistical Bulletin of National Economic and Social DevelopmentPingtan Comprehensive Experimental Zone Bureau of Statistics
Fujian Province Water Resources BulletinFujian Provincial Department of Water Resources
Fujian Province Marine Disaster BulletinFujian Provincial Department of Ocean and Fisheries
Per capita housing area of urban residentsNational Bureau of Statistics of China
Scenic spot traffic, ticket fees, etc.Tourism, Culture and Sports Bureau of Pingtan Comprehensive Experimental Zone
Table 2. Commonly used evaluation indicators and methods.
CategoryEvaluation IndicatorsPhysical Quantity Accounting MethodValue Accounting Method
Provisioning servicesAgricultural productsStatistical analysisMarket value method: product output × market price
Forestry products
Livestock products
Fishery products
Freshwater resources
Regulating servicesWater conservationWater balance equationShadow engineering method
Soil retentionModified universal soil loss equationReplacement cost method
Flood regulationWater volume adjustment methodShadow engineering method
Carbon sequestration and oxygen releaseMass balance methodReplacement cost method
Air purificationPlant purification modelReplacement cost method
Water purificationWater purification modelReplacement cost method
Climate regulationEvapotranspiration modelReplacement cost method
Windbreak and sand fixationModified wind erosion modelRestoration cost method
Cultural
services
Leisure tourismStatistical analysisTravel cost method
Landscape valueHedonic pricing method
Table 3. Pingtan GEP accounting indicator system.
Ecosystem TypeFunction CategoryAccounting IndicatorsCharacterization Indicators
Terrestrial ecosystemProvisioning servicesAgricultural, forestry, animal husbandry, and fishery productsOutput of primary agricultural, forestry, livestock, and freshwater fishery products
Freshwater resourcesSurface water resources volume
Regulating servicesCarbon sequestration and oxygen releaseCarbon sequestration and oxygen release by forests, grasslands, farmlands, and wetlands
Water purificationPurified volume of waterborne pollutants
Air purificationChange in health effects
Flood regulationFlood reduction by forests, grasslands, farmlands, and wetlands
Water conservationWater conservation by forests, grasslands, farmlands, and wetlands
Soil retentionReduction in sediment deposition and retention of soil nutrients
Climate regulationHeat absorbed by ecosystems
Eco-DRRIncrease in crop yield and resistance to storm surge disasters
Cultural servicesTourism and recreationNumber of tourists and tourism revenue
Marine ecosystemProvisioning servicesMarine fishery productsOutput of marine fish, crustaceans, shellfish, and algae
Regulating servicesCarbon sequestration and oxygen releaseMarine carbon sequestration and oxygen release
Water purificationPurified volume of waterborne pollutants
Coastal protectionLength of coastline protected by ecosystems
Cultural servicesTourism and recreationNumber of tourists and tourism revenue
Seascape value-addedContribution rate of housing prices
Table 4. Calculation methods for each indicator.
IndicatorsCalculation Methods
Agricultural, forestry, animal husbandry and fishery products, Marine fishery productsThe output data of agriculture, forestry, animal husbandry, and fishery were extracted from the Pingtan Statistical Yearbook, with the value dimension represented by the added value of these sectors as reported in the same source.
Freshwater resources
V = Q w × P w
V is the monetary value of freshwater resources ( CNY   ·   a 1 ) ,   Q w is the quantity of surface water resources provided by the water body ( m 3   ·   a 1 ) ,   P w is the water resource fee (CNY · m−3).
Carbon sequestration and oxygen releaseCarbon sequestration and oxygen release in terrestrial ecosystem:
Q C O 2 = M C O 2 M C × F C S + G S C S + W C S + C S C S
F C S = F C S R × S F × 1 + β
G S C S = G S R × S G
W C S = i = 1 n S C S R i × S W i × 10 2
C S C S = N S C × B D × H × 0.1 × S C
Q O 2 = M O 2 M C O 2 × Q C O 2
V = Q C O 2 × P C O 2 × 10 4 + Q O 2 × P O 2 × 10 4
Q C O 2 is the amount of carbon sequestered by terrestrial ecosystems ( t   CO 2 · a 1 ) ,   M C O 2 / M C is the conversion coefficient from carbon to CO2, with a value of 44/12, F C S is the carbon sequestration of forests (including shrubs) ( t   C · a 1 ) ,   G S C S is the carbon sequestration of grasslands ( t   C · a 1 ) ,   W C S is the carbon sequestration of wetlands ( t   C · a 1 ) ,   C S C S is the carbon sequestration of croplands ( t   C · a 1 ) ,   F C S R is the carbon sequestration rate of forests and shrubs ( t   C · hm 2 · a 1 ) ,   S F is the area of forests and shrubs ( hm 2 ) ,   β is the soil carbon sequestration coefficient for forests and shrubs, G S R is the soil carbon sequestration rate of grasslands ( t   C · hm 2 · a 1 ) ,   S G is the area of grasslands ( hm 2 ) ,   S C S R i is the carbon sequestration rate of the i-th type of aquatic wetland ( g   C · m 2 · a 1 ) ,   S W i is the area of the i-th type of aquatic wetland ( hm 2 ) ,   N S C is the change in soil organic carbon in Chinese croplands under conditions without chemical or organic fertilizer application ( g · kg 1 · a 1 ) ,   B D is the soil bulk density of each province, H is the soil thickness, S C is the cropland area ( hm 2 ) ,   Q O 2 is the amount of oxygen released by terrestrial ecosystems ( t   O 2 · a 1 ) ,   M O 2 / M C O 2 is the conversion coefficient from CO2 to O2, with a value of 32/44, V is the monetary value of carbon sequestration and oxygen release ( 10 4   CNY · a 1 ) ,   P C O 2 is the carbon trading price ( CNY · t 1 ) ,   P O 2 is the industrial oxygen production price (CNY·t−1).
Carbon sequestration and oxygen release in marine ecosystem:
Q C O 2 = Q m + Q p
Q m = M C O 2 / M C × B × W
Q p = 3.67 × Q p p × S × 365 × 10 3
Q O 2 = Q O 2 × S × 365 × 10 3 + Q O 2
Q O 2 = 2.67 × Q p p
Q O 2 = 1.19 × Q A
Q C O 2 is the amount of carbon sequestered by marine ecosystems ( t · a 1 ) ,   Q m is the annual carbon sequestration of mangroves and seagrass beds ( t · a 1 ) ,   Q p is the annual carbon sequestration of phytoplankton ( t · a 1 ) ,   M C O 2 / M C is the conversion coefficient from carbon to CO2, with a value of 44/12, B is the area of mangroves and seagrass beds ( hm 2 ) ,   W is the carbon sequestration rate of mangroves and seagrass beds ( t   CO 2 · hm 2 · a 1 ) ,   Q p p is the primary productivity of phytoplankton ( mg · m 2 · d 1 ) ,   S is the assessed marine area ( km 2 ) ,   Q O 2 is the amount of oxygen produced ( t · a 1 ) ,   Q O 2 is the amount of oxygen produced by phytoplankton per unit area and per unit time ( mg · m 2 · d 1 ) ,   Q O 2 is the amount of oxygen produced by macroalgae ( t · a 1 ) ,   Q A is the dry weight of macroalgae (t·a−1), the calculation of the value component follows the same method as in Equation (8).
Water purificationWater purification in terrestrial ecosystems:
Q w = i = 1 n Q w i × S R 1,000,000
V w = i = 1 n Q w × C w i
Q w is the physical quantity of water purification ( t · a 1 ) ,   Q w i is the Class II/III water quality standard for the i-th type of water pollutant in aquatic wetlands ( mg · L 1 ) ,   S R is the runoff volume of inland wetland ecosystems ( m 3 ) ,   V w is the monetary value of water purification ( CNY · a 1 ) ,   C w i is the treatment cost of water pollutants (CNY·t−1).
Water purification in marine ecosystems:
Q w = Q C O 2 × 16 106 + Q C O 2 × 1 106 + P C O D
Q w is the amount of purified water pollutants ( t · a 1 ) ,   Q C O 2 is the amount of carbon sequestered by marine ecosystems (t·a−1), the ratios 16/106 and 1/106 are derived from the Redfield ratio (C:N:P = 106:16:1), which reflects the general stoichiometric relationship of nutrient uptake by phytoplankton, P C O D is the discharged chemical oxygen demand (t·a−1), the calculation of the value component follows the same method as in Equation (16).
Air purification
Δ E = i = 1 n P × β i × C 0 i C i × M
V = Δ E × H C L = Δ E × i = 1 t G D P i = Δ E × G D P 0 × i = 1 t 1 + a i 1 + r i
Δ E is the change in health endpoints caused by variations in pollutant concentrations, P is the permanent resident population, β i is the mortality coefficient associated with pollutant i, C 0 i is the baseline concentration of pollutant i ( μ g · m 3 ) ,   C i is the annual average concentration of pollutant i ( μ g · m 3 ) ,   M is the all−cause mortality rate ( ) ,   V is the monetary value of air purification services ( CNY · a 1 ) ,   H C L is the adjusted per capita human capital loss (CNY), t is the average number of life years lost due to premature deaths caused by air pollution, G D P i is the discounted value of per capita GDP in the i−th future year (CNY), G D P 0 is the per capita GDP in the base year (CNY), a is the annual growth rate of per capita GDP (%), r is the social discount rate (%).
Flood regulation
E S Q = i = 1 n a i × A i × P i
V = E S Q × C r
E S Q is the physical quantity of flood regulation and storage ( 10 3   m 3 ) ,   n is the number of ecosystem types, a i is the regulation coefficient of the i−th type of ecosystem, A i is the area of the i−th type of ecosystem (km2), P i is the cumulative daily precipitation exceeding 50 mm for the i−th type of ecosystem (mm), C r   is the construction cost of reservoirs (CNY·m−3).
Water conservation
W = i = 1 n a i × f i × A i × P i + b i × A i
V = W × C f
W is the physical quantity of water conservation ( 10 3   m 3 ) ,   n is the number of ecosystem types, a i and b i are the regulation coefficients of the i−th type of ecosystem, f i is the average canopy density of the i−th type of ecosystem, A i is the area of the i−th type of ecosystem (km2), P i is the annual precipitation of the i−th type of ecosystem (mm), C f   is the water resource fee (CNY·m−3).
Soil retention
Q s r = R × K × L × S × 1 C × P
V s d = λ × Q s r ρ × c
V d n = i = l n Q s r × C i × P i
V = V s d + V d n
Q s r is the physical quantity of soil retention ( t · a 1 ) ,   R is the rainfall erosivity factor, K is the soil erodibility factor, L is the slope length factor, S is the slope steepness factor, C is the vegetation cover and management factor, P is the soil and water conservation measure factor, V s d   is the monetary value of reduced sediment deposition ( CNY · a 1 ) ,   λ is the sediment deposition coefficient, ρ is the soil bulk density ( t · m 3 ) ,   c is the unit cost of reservoir dredging (CNY·m−3), V d n is the monetary value of soil nutrient retention ( CNY · a 1 ) ,   n is the number of soil nutrients, C i is the pure content of nutrient i in the soil (%), P i   is the treatment cost (CNY·t−1).
Climate regulation
Δ Q = Δ T × ρ c × FVC × A × H × H h
V = Δ Q × α × P
Δ Q is the atmospheric heat absorbed by the ecosystem (J), Δ T is the maximum cooling range of each ecosystem type ( ° C ) ,   ρ c is the specific heat capacity of air, F V C is the fractional vegetation cover, A is the area of the ecosystem ( km 2 ) ,   H is the height of the ecosystem (m), H h is the duration of time when the temperature exceeds 26 ° C   ( h ) ,   α is the conversion coefficient between thermal energy and electrical energy, P is the electricity price (CNY·kWh−1).
Eco-DRR
S d = i = 1 n S i × γ
V d = i = 1 n P i × S d
V s = D 1 η × η
V = V d + V s
S d is the increased crop yield, S i is the yield of the i−th type of crop, γ is the crop yield growth rate resulting from the ecosystem’s disaster mitigation services, V d is the monetary value of the increased crop yield, P i is the market price of the i−th type of crop, V s is the direct economic loss reduced by shelterbelts in resisting storm surge disasters, D is the average direct economic loss caused by storm surges in Pingtan over multiple years, η is the contribution rate of shelterbelts in mitigating storm surge disasters.
Coastal protection
D c l = i = 1 n D c l i
V c p = i = 1 n D c l i × W c l i × V c l a
D c l   is the total length of coastline protected by marine ecosystems (km·a−1), D c l i is the length of coastline protected by the i−th type of ecosystem (km·a−1), obtained from field measurements and remote sensing interpretation, n is the number of coastal protection ecosystem types, V c p is the total monetary value of coastal protection (CNY·a−1), W c l i is the weighting coefficient of coastal protection for the i−th type of ecosystem, V c l a is the construction cost per unit length of artificial coastline (CNY·km−1).
Tourism and recreation
P S = S × f
V = P S × T C P + S C × f + P S × C S P × R
P S is the number of visitors to natural scenic areas, S is the total number of visitors throughout the year, f is the proportion of natural scenic sites, V is the monetary value of tourism and sightseeing services (CNY·a−1), T C P is the average time cost per visitor (CNY·person−1), S C is the direct expenditure (CNY), C S P is the average consumer surplus per visitor (CNY·person−1), R is the proportion of terrestrial or marine landscapes.
Seascape value-addedThe contribution rate of housing prices is used as the physical quantity indicator, the Hedonic model is employed for calculation, and its expression is as follows:
P = P Z 1 , Z 2 , Z 3 , , Z n
P is the housing price of the residential community, Z is the price influencing factor.
V = P C × A × M × E S Q / 60
V is the monetary value of the seascape premium (CNY·a−1), P C is the urban population, A is the per capita housing floor area of urban residents, M is the average transaction price of housing, E S Q is the contribution rate of marine landscapes to housing prices.
Table 5. Composition and changes of GEP in Pingtan, 2015–2023.
Accounting IndicatorsValue (104 Yuan)Value Changes from 2015 to 2023
2015201820212023Change (108 Yuan)Growth Rate (%)
Terrestrial ecosystemAFAF products24,87426,05019,04017,360−0.751−30.21
FWR53,04038,22035,88049,660−0.338−6.37
TCSOR42034193420942620.0061.40
TWP355256240332−0.002−6.48
AP16,71015,71712,94311,740−0.497−29.74
FR30,20230,47130,49328,004−0.220−7.28
WC35,70035,51633,66030,466−0.523−14.66
SR12,43110,93411,01512,218−0.021−1.71
CR11,73010,62610,37110,297−0.143−12.22
Eco-DRR10,111967795129292−0.082−8.10
TTR46,807244,279270,400438,89239.209837.66
Subtotal246,163425,939437,763612,52336.636148.83
Marine ecosystemMF products314,050291,625309,613330,8061.6765.34
MCSOR19,57846,91425,15964,2094.463227.97
MWP20,80748,62326,02066,7794.597220.94
CP28,99028,78028,86928,914−0.008−0.26
MTR52,008271,421300,446487,65843.565837.66
SVA38266816606263770.25566.68
Subtotal439,259694,179696,169984,74354.548124.18
GEP (108 yuan)68.54112.01113.39159.7391.184133.03
Note: AFAF products denote agricultural, forestry, animal husbandry, and fishery products; FWR denotes freshwater resources; TCSOR denotes terrestrial carbon sequestration and oxygen release; TWP denotes terrestrial water purification; AP denotes air purification; FR denotes flood regulation; WC denotes water conservation; SR denotes soil retention; CR denotes climate regulation; Eco-DRR denotes ecosystem-based disaster risk reduction; TTR denotes terrestrial tourism and recreation; MF products denote marine fishery products; MCSOR denotes marine carbon sequestration and oxygen release; MWP denotes marine water purification; CP denotes coastal protection; MTR denotes marine tourism and recreation; SVA denotes seascape value-added.
Disclaimer/Publisher’s Note: The statements, opinions and data contained in all publications are solely those of the individual author(s) and contributor(s) and not of MDPI and/or the editor(s). MDPI and/or the editor(s) disclaim responsibility for any injury to people or property resulting from any ideas, methods, instructions or products referred to in the content.