Article

Projecting the FIA’s GHG Emissions: A Forecast for the 2030 Sustainability Target

Faculty of Engineering and Architecture, Altinbas University, 34217 Istanbul, Türkiye
*
Author to whom correspondence should be addressed.
Sustainability 2025, 17(23), 10633; https://doi.org/10.3390/su172310633
Submission received: 22 October 2025 / Revised: 23 November 2025 / Accepted: 24 November 2025 / Published: 27 November 2025

Abstract

This study provides a data-driven evaluation of the Fédération Internationale de l’Automobile’s (FIA) progress toward its 2030 net-zero emissions goal, based on publicly reported data from 2019 to 2023. Using SPSS-based regression analysis, we first identify business travel emissions and the number of championships, trophies, challenges, and cups as the most significant drivers of the FIA’s total carbon footprint, jointly explaining 99.3% of its variance. These drivers then inform a three-stage forecasting model developed in MATLAB to project future emissions. The results indicate a projected 18% increase in total emissions from 2024 to 2030. This upward trajectory stands in sharp contrast to the FIA’s target of a 50% reduction by 2030, revealing a significant implementation gap. Our analysis concludes that the FIA’s current path is insufficient to meet its ambitious climate targets, underscoring the urgent need for more decisive interventions, such as emissions-based event planning and AI-powered logistics optimization. The methodology offers a replicable framework for forecasting emissions in other data-constrained, high-emission sectors.

1. Introduction

Significant carbon emissions are produced by sports and events, mostly from lodging and travel. Even 4% of spectators’ air travel can account for more than 50% of an event’s emissions, according to studies [1], while major events like the Olympics release millions of tons of CO2 emissions [2]. Mobility alone can sometimes account for 63% of emissions in the MICE sector [3]. Although carpooling, efficient logistics, and eco-certified locations are examples of mitigation techniques that can lessen impacts, there are still significant gaps in Scope 3 emission tracking and standardized measurement instruments [2,3].
Due to its resource-intensive operations, foreign travel, and massive airfreight, Formula 1 in particular is coming under growing fire for its environmental effects [4]. These statements are frequently seen as performative, even if the FIA has committed to achieving environmental goals in line with the Paris Agreement and the SDGs, such as net-zero emissions by 2030 [4,5].
The Fédération Internationale de l’Automobile (FIA), which oversees global motorsport and mobility, has created a comprehensive Environmental Strategy for 2020–2030 with the goal of lowering its organizational emissions in response to these demands. In addition to emphasizing quantifiable efforts across four areas of responsibility—the FIA as an organization, a member-based federation, the motor sport governing body, and a global champion for sustainability—the plan details a vision for “Sustainable Motor Sport and Mobility for All” [6]. Since 2019, the FIA has released yearly Environmental Impact Reports that list major sources of emissions, including energy use, freight transportation, and business travel [7].
The FIA’s commitment to reducing carbon emissions by 50% by 2030, with an intermediate goal of 20% by 2025 (compared to the 2019 baseline), is at the heart of this strategy. By eliminating any remaining emissions, it will achieve net-zero carbon starting in 2030 [7]. The FIA established the Environmental Accreditation Programme, a three-tiered framework (One-Star to Three-Star) that helps stakeholders measure and enhance their environmental performance, in order to standardize sustainability practices [8]. Despite the fact that these initiatives represent advancement, there is still no empirical evidence that the FIA is really on the right track. Preliminary data suggest that total emissions in 2022 were almost back to the levels before the pandemic (with a 0.7% increase from the 2019 level) [7], highlighting the importance of a quantitative assessment.

1.1. Problem Statement

While FIA reports descriptively list emission sources, there is a critical absence of independent, peer-reviewed studies that quantitatively validate these drivers and use them to empirically project future progress against the 2030 net-zero targets. Existing documents are self-reported, lack statistical validation, and do not provide a transparent, reproducible model for forecasting.
This gap is significant because it leaves stakeholders without an objective, data-driven tool to assess the sufficiency of current actions, creating a risk of relying on descriptive reporting rather than predictive, evidence-based planning ahead of the 2025 interim milestone.

1.2. Objective and Approach of the Study

In order to fill the mentioned gap, this study examines five years of FIA emissions data that were made public (2019–2023) in order to identify the main factors influencing overall emissions. The study initially determines which operational variables have the greatest impact on overall emissions using linear and multiple regression analysis based on SPSS Statistics Ver. 25.
Based on these findings, MATLAB is employed to build a structured three-stage forecasting model to estimate total emissions until the year 2030. The first stage involves the forecast of the FIA’s number of championships, trophies, challenges, and cups on an annual basis; these are official event categories representing its competitive calendar. Then, in the second stage, the forecast event counts are used for estimating emissions from business travel. Thirdly, event counts and business travel emissions are forecast for total emissions. To deal with small-sample forecasting, each model stage is trained using data from 2019 to 2022 and validated using data from 2023, using Mean Absolute Percentage Error (MAPE), bootstrap confidence intervals, and sensitivity analysis for performance evaluation.

1.3. Research Questions

This study is guided by the following questions:
  • To what extent can the FIA’s self-reported key emission sources be statistically validated as the primary drivers of its total carbon footprint?
  • What is the empirically projected trajectory of the FIA’s emissions to 2030, based on a model built from these validated drivers?
  • How large is the implementation gap between this projected trajectory and the FIA’s official 2030 reduction target?

1.4. Contribution and Justification

This study provides the first independent, quantitative assessment of the FIA’s progress towards its 2030 sustainability targets. Its novel contribution is threefold:
  • Methodological Novelty: It moves beyond descriptive reporting by developing a replicable, three-stage forecasting framework that integrates SPSS-based driver identification with deterministic MATLAB modeling, specifically designed for data-scarce environments common in early-stage sustainability reporting.
  • Empirical Validation: It provides the first statistical evidence (R2 = 0.993) confirming that business travel and championship count are not just self-reported sources, but are in fact the statistically dominant drivers of the FIA’s emissions, and quantifies their marginal impact.
  • Strategic Insight: It delivers the first peer-reviewed forecast of the FIA’s emissions trajectory, revealing a significant implementation gap—a projected 18% increase vs. a 50% reduction target—thereby providing a critical, evidence-based alert for strategic course-correction.
The proposed framework establishes a transparent and reproducible analytical template that other sporting organizations and data-constrained sectors can adopt for independent sustainability monitoring and target assessment.
The structure of the paper is as follows. Section 2 provides a literature review, followed by the research methodology in Section 3. Section 4 presents the results obtained, followed by a discussion in Section 5. The final part, Section 6, presents recommendations for future research and conclusions.

2. Literature Review

In line with international initiatives such as the Paris Agreement and the Sustainable Development Goals (SDGs) of the United Nations, the Fédération Internationale de l’Automobile (FIA) has shown a strong commitment to environmental sustainability through its comprehensive *Environmental Strategy 2020–2030* [6]. A 20% decrease in emissions by 2025 and a 50% reduction by 2030 are among the aggressive goals set by the strategy, which also lays forth a vision for “Sustainable Motor Sport and Mobility for All” [6]. In order to achieve these objectives, the FIA has put policies in place like lowering energy use, switching to renewable energy sources, and offsetting emissions through certified projects [7].
A fundamental element of the FIA’s strategy is its Environmental Accreditation Program, which offers stakeholders a three-tiered framework (from One-Star to Three-Star) to assess and enhance their environmental performance [8]. Best practices in areas such as supply chain sustainability, waste management, and energy consumption are highlighted in the program [8].
Limited time-series data is a common problem for academic research on sustainability projects, especially for new legislation and reporting frameworks. Recent research, however, shows that with the right approaches, even limited datasets can provide insightful information. Chen and Wu (2022), for instance, used urban private car trajectory data to successfully assess the efficacy of low-carbon transition policies, demonstrating that short-term datasets, when paired with predictive modeling techniques such as neural networks, can effectively assess policy impacts [9]. Similar to this, research has demonstrated that gathering information from a small number of sources—for example, five datasets that include variables like temperature, noise, passenger counts, speed, and delay—can still yield insightful information about public transportation systems if the information is thoroughly examined and placed within larger urban planning frameworks [10].
Linear regression is still a fundamental and understandable statistical approach for determining the major contributions to overall emissions. Because of its ability to measure the direction and degree of correlations between dependent and independent variables, it is especially useful for studies that seek to extract insights from sparse data that are pertinent to policy [11]. Furthermore, sustainability modeling techniques in related fields are in line with the application of linear regression. For example, Jing et al. (2022) used panel data from 30 Chinese provinces and multiple regression to assess emission contributors in public transportation systems, showing that even simple models can produce high explanatory power when used within a targeted analytical framework [12].
Accurate prediction and estimation of emissions remain challenging. To overcome such challenges, the Bayesian optimization algorithm has been applied to enhance model accuracy in air quality prediction using better emission inventories and real-time concentration correction [13]. Scenario-based sensitivity analysis is vital to estimate carbon emission projections’ uncertainty by testing the influence of socioeconomic drivers (e.g., industrial structure, urbanization, and energy mix) variations on emission trajectories. It identifies leading factors that generate uncertainty, such as the dependence on coal in high-emission scenarios, and informs low-carbon resilient transitions [14]. Together, these approaches enable more realistic emission pathways to be created and help policymakers understand how variability in underlying drivers might affect long-term environmental goals. [14].
In quantitative research, statistical software like SPSS is often used, especially for regression and correlation analysis. As evidenced by the study of newborn age and height, where a Pearson correlation coefficient of 0.853 (p < 0.01) was discovered, SPSS allows researchers to quantify the strength of correlations between variables [15]. Regression modeling is further made easier by the software, which produces results such as significance testing (p = 0.000 for F-statistics) and coefficients of determination (R2 = 0.728) to confirm model fit [15]. Although the study points out drawbacks such as its dependence on secondary data and presumptions like homoscedasticity, these characteristics make SPSS a useful tool for inexperienced researchers examining linear correlations [15]. Particularly in the social sciences, SPSS is a helpful statistical tool for analysis [16]. Through sophisticated quantitative techniques, it can also be utilized in research on sustainable development to measure crucial sustainability indicators, including carbon emissions, resource efficiency, and socioeconomic equity [16]. A flexible platform for complex environmental modeling and simulation is provided by MATLAB. Holzbecher claims that MATLAB is robust and accessible at the majority of educational institutions [17]. This is due to MATLAB’s exceptional numerical linear algebra capabilities [17].
This study adopts a more rigorous and integrated approach by first identifying statistically significant predictors of total emissions using SPSS-based regression analysis and then embedding these insights into a structured, multi-stage forecasting model developed in MATLAB. This methodology provides a replicable and transparent forecasting pathway, particularly well-suited for data-limited and policy-sensitive domains such as motorsport sustainability.
Such practices have been successfully applied in other high-emission sectors. For example, Tang et al. (2023) conducted a two-phase approach for China’s transport sector by using LASSO regression to identify key influencing factors and then applying an optimized LSTM neural network to forecast emissions under various policy scenarios [18]. Similarly, Alhindawi et al. (2020) integrated multivariate regression to pinpoint critical variables affecting greenhouse gas emissions in road transport and subsequently employed double exponential smoothing to produce forward-looking projections [19]. A third study by Javanmard et al. (2023) used regression-based sensitivity analysis in combination with MATLAB-driven machine learning algorithms to forecast energy demand and emissions in the transportation sector, demonstrating that embedding identified drivers into simulation models significantly improves forecast reliability and relevance [20].
Unlike the widely accepted method in emissions forecasting that gives priority to the complexity of the prediction using vast amounts of data and machine learning algorithms [17,18,19], this paper presents a simple, policy-first approach. Our framework is purposely made for the situation of developing sustainability reporting, where data is scarce, but the demand for actionable, transparent insights is urgent. Hence, we pass over black-box models that have the potential to overfit on small samples, and we build a ‘white-box’ forecasting pipeline based on empirically validated drivers (through linear regression) and deterministic projections. This method gives the first place to interpretability and strategic relevance, thus offering a replicable template for the early-stage target assessment in high-emission sectors where no long data histories are available.

Critical Comparison and Identified Gap

Even though there is an increasing amount of research on emission modeling and sustainability forecasting, the majority of the current studies are still focused on a single sector or are very much dependent on data. These studies use enormous datasets and machine learning models that do not fit the newly standardized organizational reporting systems, like the FIA’s. Past methods in transportation and energy (e.g., [18,19,20]) have been discussing prediction optimization, but still have not validated the causal factors that emissions are decreased. Likewise, descriptive studies of motorsport sustainability are giving excellent contextual insights [4,5,6,7,8]; however, they are not able to provide quantitative frameworks that could be used to compare the organization’s performance against the set reduction targets.
By incorporating the method of regression-based driver identification with deterministic forecasting in a short-data situation, this research overcomes these methodological and contextual limitations. It directly connects emission projections to operational drivers that have been empirically validated, thus providing a transparent and reproducible framework for assessing whether institutional sustainability commitments—like the FIA’s 2030 net-zero goal—are realistically achievable under the present trends.
This paper addresses this gap by moving from descriptive driver identification to driver-validated forecasting, providing a quantitative tool to assess the realism of institutional sustainability commitments.

3. Data and Methodology

This section outlines the data sources and analytical procedures employed to evaluate the FIA’s environmental sustainability progress from 2019 to 2023. It is structured into three subsections: (a) Data, which specifies variables and sources; (b) Statistical Analysis, which presents regression diagnostics; and (c) Forecasting Models, which details the multi-stage forecasting framework used to project future emissions. The conceptual framework for this study can be seen in Figure 1.

3.1. Data

The dataset comprises official FIA data reported annually between 2019 and 2023. These data were collected from the FIA official websites [21,22] and publicly available FIA Activity Reports [23], which detail organizational emissions across multiple categories following international standards.
The study focuses on the following:
  • Dependent variable:
    • Total Emissions (metric tons CO2-equivalent), representing the FIA’s overall annual carbon footprint [21].
  • Independent variables:
    • Business Travel Emissions (metric tons CO2-equivalent) [22].
    • Number of Events (annual count) [23].
    • Number of championships, trophies, challenges, and cups (annual count) [23].
    • Upstream Transportation Emissions (metric tons CO2-equivalent) [22].

3.1.1. Key Assumptions and Justifications

  • Data Completeness Assumption: It was assumed that the FIA’s publicly reported data is accurate, complete, and consistent with the GHG Protocol Corporate Standard, as stated in their reports. This assumption is fundamental to any analysis of secondary data and is considered reasonable for an organization of the FIA’s stature and under its reporting commitments.
  • Handling of Missing Data: The 2022 Environmental Report did not explicitly report the Number of Events and the Number of championships, trophies, challenges, and cups. To address this gap without introducing bias, the missing values for 2022 were imputed using the average of the 2021 and 2023 values. This approach was selected because it minimizes the influence of short-term volatility (like the pandemic recovery) and provides a reasonable, conservative estimate based on the trend observed in the adjacent years.
  • Temporal Scope Justification: Although the dataset spans only five years, this timeframe is analytically valuable as it captures distinct operational phases: a pre-pandemic baseline (2019), a pandemic-disrupted year (2020), and a post-pandemic recovery period (2021–2023). This scope is sufficient for initial trend detection and aligns with the early-phase monitoring needs of the FIA’s 2020–2030 strategy [6].

3.1.2. Addressing the Impact of the Pandemic Period

The year 2020 represents a significant anomaly due to the global COVID-19 pandemic, which drastically reduced travel and event schedules. Acknowledging this, a deliberate decision was made to retain this data point rather than exclude it, as its omission would create a biased four-year dataset lacking a representation of operational disruption. To ensure this anomaly did not unduly distort the analysis, specific mitigation strategies were embedded directly into the forecasting methodology. These included the use of filtered median growth rates that exclude extreme fluctuations (Section 3.3.1) and robust sensitivity analyses that tested the model’s resilience to perturbations in the 2020 data (Section 4.3.1). This approach allows the model to learn from the full available timeline while being structurally guarded against over-reliance on anomalous periods.
The identification of determinants has been done in a data-driven but conceptually guided manner in this study, which was intended to pinpoint the most influential operational drivers of total emissions at FIA. Candidate variables were gathered directly from the FIA Annual Sustainability and Activity Reports (2019–2023), which provide standardized metrics across different emission categories. The initial dataset included the emissions from business travel, upstream transportation, the number of events, and the number of championships, trophies, challenges, and cups. These variables were chosen because they are representative of the main operational activities that, through travel, logistics, and event organization, one would logically expect to contribute to the total carbon output.
The study did not restrict itself to a priori theoretical models, but rather took an empirical verification approach. The first step for each variable was to test its relationship with total emissions individually through simple linear regression to determine its explanatory power, and then followed by a combined multiple regression to assess the joint predictive power. This was an evidence-based selection of determinants, and subjective expectations did not influence the outcome. The results indicated that the emissions of business travel and the count of championships were the only ones that were statistically significant, as well as strongly correlated with the predictors. The results support the FIA’s 2030 sustainability roadmap, which aims at significant emission reductions and considers travel and event frequency as the main influencing factors. Initially, the suggestion was to look at upstream transportation and event count, but their weaker and statistically insignificant correlations suggested that they had very limited predictive power. This is why they were removed from the forecasting framework, which already included the more straightforward and less uncertain predictions. The collinearity diagnostics for the variables included in the analysis pointed to an acceptable level of interdependencies.
A critical methodological choice was the selection of the Number of championships, trophies, challenges, and cups over the broader Number of Events as an independent variable. This decision was conceptually and empirically guided. Conceptually, the “Number of Events” encompasses a wide range of activities, including media days, promotional gatherings, and non-competitive support events, which have a highly variable and often minimal direct emissions footprint. In contrast, a “championship, trophy, challenge, or cup” represents a formal, structured racing series with significant and consistent associated logistics, freight, and travel—the core drivers of the FIA’s operational emissions. Empirically, this choice was validated by the regression analysis itself. The Number of championships demonstrated a much stronger and more significant correlation with total emissions compared to the Number of Events, confirming it as a superior proxy for the scale of emissions-intensive competitive operations.

3.2. Statistical Analysis

To identify which factors most significantly impact total emissions, simple and multiple linear regression analyses were conducted using IBM SPSS Statistics 25.0 [24]. Each independent variable was first tested separately, followed by a combined model to assess its joint explanatory power with respect to total emissions.
The identification of main emission drivers was done with the help of linear regression, which was a method chosen for its appropriateness to the small sample context (n = 5) and the primary goal of getting clear, interpretable results. Therefore, we intentionally did not use more complex and data-hungry models such as tree-based ensemble techniques (e.g., Random Forest) that are more powerful and available. Though these cutting-edge models are available, they easily suffer from overfitting and, when very limited datasets are the case, they act as “black boxes”, thus compromising both their trustworthiness and explanatory power. On the other hand, linear regression gives a firm basis for coefficient estimates and helps clearly understand the direction and extent of the variable relationships, which is a requirement for creating a reliable forecasting model. This method is accepted in sustainability literature for preliminary, data-scarce studies where the aim is to identify the basic drivers rather than to attain the highest predictive complexity [11,12]. Before the analysis, the standard linear regression assumptions—linearity, residuals normality, and homoscedasticity—were examined and confirmed as described below, thus permitting their proper application to this dataset.
Before conducting these analyses, the standard assumptions of linear regression—linearity, normality of residuals, and homoscedasticity—were evaluated. Following best practices outlined in Field (2013) [25], these assumptions were assessed through visual inspection of P-P plots, histograms of standardized residuals, and scatterplots of standardized residuals vs. predicted values. No major violations were detected, and the data were deemed suitable for linear regression.
A multiple regression model was developed using the two strongest predictors: business travel emissions and the number of championships. The model demonstrated exceptional explanatory power, accounting for 99.3% of the variance in total emissions (R2 = 0.993; adjusted R2 = 0.985) and was statistically significant (F(2,2) = 135.518, p = 0.007). However, within this combined model, only business travel emissions were a statistically significant predictor (B = 1.299, p = 0.016), underscoring its dominant role. The number of championships did not contribute a meaningful independent effect (B = 3.033, p = 0.832), with its influence diminishing once business travel was accounted for.
Collinearity diagnostics confirmed a moderate level of multicollinearity, which is expected given the relationship between organizational activity metrics. The Variance Inflation Factor (VIF = 4.205) remained within acceptable limits, and the Condition Index (CI = 19.243) was consistent with moderate interdependence.
These results are consistent with established diagnostic thresholds in the literature. A Condition Index between 15 and 30 is generally interpreted as indicating moderate multicollinearity, which aligns with the observed value of 19.243 in this analysis [26]. Similarly, the VIF values 4.205 for both predictors fall well within the commonly accepted range of 1 to 5, suggesting that multicollinearity is not severe and unlikely to distort the regression estimates [27]. These results validate the use of both variables as inputs in the subsequent forecasting model. Detailed interpretation of their practical and environmental significance is reserved for the Discussion section (Section 5).

3.3. Forecasting Models

To project emissions trends from 2024 to 2030, a structured, three-stage forecasting model was implemented in MATLAB R2024b [28]. This framework leverages deterministic methods combined with statistical inference to produce transparent and robust forward-looking estimates.

3.3.1. Model 1: Predicting Number of Championships, Trophies, Challenges, and Cups

A hybrid forecasting model was developed to estimate the FIA’s annual number of championships, trophies, challenges, and cups ( C t ) from 2024 to 2030. This method combines a simple Moving Average (MA) baseline with a filtered median-based Growth Rate adjustment. The model was trained on data from 2019–2022, with 2023 reserved for out-of-sample validation. To mitigate the influence of COVID-19-related anomalies, annual growth rates were computed only from 2020 onward as
g t = C t C t 1 C t 1 ,     t = 2020 , , 2023
With extreme fluctuations exceeding ±50% excluded from the calculation. The filtered median growth rate was then obtained as
g ~ = m e d i a n g t : g t     0.5
and applied to a moving-average baseline
M A s n = 1 n i = s n + 1 s C i
to generate forecasts according to
C ^ s + 1 = M A s n × ( 1 + g ~ )
Using the average of the 2019–2022 training period, the model predicted 240 championships for 2023 vs. an actual value of 254, achieving a MAPE of 5.36%. Once validated, the model was extended through a dynamic rolling forecast, where each new forecasted value was appended to the series and incorporated into the next moving-average window:
C ^ t + k + 1   =   1 n k i = t + k n k + 1 t + k C ^ i × 1 + g ~ ,   n k   =   3 ,   f o r   2024     t   +   k     2026 4 ,   f o r   2027     t   +   k     2030
All forecasts were rounded to the nearest integer for reporting, while retaining raw values for transparency.

3.3.2. Model 2: Predicting Business Travel Emissions

Business travel emissions ( E t B T ) from 2024 to 2030 were forecast using a deterministic hybrid model that integrates a blended growth estimation with a decaying championship-based adjustment. The model was trained on 2019–2022 data and validated using 2023 as an out-of-sample test year. The annual growth rate was modeled as a weighted blend of recent and long-term components:
g t B T   =   W r   g r e c e n t   +   1     W r g l o n g
where g r e c e n t is the 2021–2022 growth rate, g l o n g = 0.08 represents an 8% benchmark growth, and w r = 0.30 assigns 30% weight to recent trends and 70% to the long-term benchmark. To prevent over-projection, the blended growth was capped at 15%
g t B T = m i n ( g t B T ,   0.15 )
A linear regression estimated the influence of championships on emissions using the 2019–2022 training data:
E T B T   =   β 0   +   γ C t   +   ε t
where C t is the number of championships and γ is the estimated slope coefficient. The resulting value of γ was used to compute the championship-based adjustment for 2023,
A 2023 = γ ( C 2023 C ¯ 2019 2022 )
Which was added to the blended-growth projection derived from the training mean:
E ^ 2023 B T =   E ¯ 2019 2022 B T 1   +   g t B T   +   A 2023
This produced a 2023 forecast of 14,135 tonnes of CO2 emissions (Actual = 15,243 tonnes of CO2 emissions), yielding a MAPE of 7.27%. Once validated, the model was extended iteratively for 2024–2030 using rolling moving-average baselines—three-year windows for 2024–2026 and four-year windows for 2027–2030—while applying a time-decaying championship adjustment each year:
A t + 1   =   A 2023 d t t 2023 ,       d t   =   δ     ρ ( t     2023 )
where δ = 0.98 represents an exponential 2% annual decay and ρ = 0.002 captures a small linear acceleration of that decay. The final iterative forecast is therefore
E ^ t + 1 B T = M A t n 1 + g t B T + A t + 1 ,     n = 3 ,   2024     t     2027 4 ,   2027     t     2030
All forecasts were rounded for reporting while retaining raw values for internal accuracy.

3.3.3. Model 3: Predicting Total Emissions

Total emissions ( E t T ) from 2024 to 2030 were forecast using a deterministic, growth-driven model that integrates the outputs of Model 1 (championships) and Model 2 (business travel emissions). The model was trained on 2019–2022 data and validated on 2023 to ensure consistency across stages. A three-year moving average of historical total emissions establishes a stable baseline:
M A s T n   =   1 n i = s n + 1 s E i T ,     n   =   3
For each year, a composite growth rate is computed as a weighted combination of business-travel and championship growth, reflecting their validated relative impact ( R 2 = 0.971) obtained from the SPSS regression analysis:
g t c o m p   =   W B T   g t B T   +   W c   g t C  
where W B T   =   0.63 and W c   =   0.37 , g t B T and g t C   are the year-to-year growth rates in business-travel emissions and the number of championships, respectively.
The one-step deterministic forecast is then given by
E ^ s + 1 T = M A s T n 1 + g t c o m p
Applying the median of historical composite growth rates to the 2019–2022 baseline produced a 2023 forecast of 20,495 tonnes of CO2 emissions compared with the observed 21,120 tonnes of CO2 emissions (MAPE = 2.96%). Once validated, the model was extended iteratively for 2024–2030 using dynamic rolling windows—n = 3 for 2024–2026 and n = 4 for 2027–2030—together with the projected composite growth rate for each horizon:
E ^ t + k + 1 T   =   1 n k i = t + k n k + 1 t + k E ^ i T   ×   1 + g t + k c o m p ,   n k   =   3 ,   f o r   2024     t + k     2027 4 ,   f o r   2027     t + k     2030
This iterative process ensures that each new forecast updates the baseline as new simulated data become available, maintaining internal consistency with the sub-models while adapting to policy-driven structural changes over time. Final forecasts were rounded for reporting, but raw values were retained for sensitivity analysis.

3.3.4. Validation and Uncertainty Quantification

Given the limited historical data (n = 5), a comprehensive validation strategy was employed that extended beyond a single out-of-sample test to assess model robustness and long-term reliability. This multi-faceted approach is recognized as a best practice in small-sample forecasting [29].
Out-of-Sample Validation 2023: As a baseline check, each model was trained on data from 2019–2022, and the 2023 data point was used for a one-step-ahead forecast. All models achieved a low Mean Absolute Percentage Error (MAPE), providing initial evidence of predictive validity.
Robustness Checks via Sensitivity Analysis: To assess the model’s stability and reliability under different assumptions, a series of targeted sensitivity analyses was conducted for each model stage:
  • Model 1 tested the impact of perturbing the anomalous 2020 data and varying the long-term growth rate, confirming the model’s resilience to outliers and parameter uncertainty.
  • Model 2 evaluated the effect of shocks to championship counts and adjustments to the growth blending ratio, demonstrating stable and logical behavioral dynamics.
  • Model 3 employed One-At-A-Time (OAT) perturbation of the composite growth rate, showing smooth and proportional output changes with no signs of structural instability.
These analyses, detailed in Section 4.3, confirm that the model projections are not overly sensitive to small changes in inputs or assumptions, a key indicator of forecast reliability.
Uncertainty Quantification with Bayesian Credible Intervals: To formally account for the uncertainty inherent in small-sample, long-range forecasting, Bayesian inference was used to generate 95% credible intervals for all projections. This method incorporates the uncertainty of model parameters and projects it forward, resulting in intervals that widen realistically over the forecast horizon. This provides a probabilistic assessment of the forecast, acknowledging the range of possible outcomes rather than presenting a single, over-precise trajectory [30].
This integrated validation framework—combining out-of-sample testing, rigorous sensitivity analysis, and formal uncertainty quantification—is specifically designed to provide confidence in the model’s projections despite the limited data history. It ensures the forecasts are robust, interpretable, and properly convey their inherent uncertainty.

4. Results

This section presents the empirical findings of the study, organized into three main parts. First, we report the outcomes of the regression analysis based on SPSS outputs, highlighting the most influential predictors of total emissions. Second, we present the forecasting results generated using MATLAB-based models, including both validation against 2023 data and forward-looking projections to 2030. Finally, we assess the reliability of the forecasts through uncertainty quantification and sensitivity analysis.

4.1. Regression Results

To identify the primary drivers of the FIA’s total emissions, several linear and multiple regression analyses were conducted using sustainability data from 2019 to 2023. The models examined the influence of event-related activities and operational emissions on total emissions, with a particular focus on the number of events, number of championships, business travel emissions, and upstream transportation and distribution.
The initial analysis assessed the relationship between the number of events and total emissions, yielding a moderate positive Pearson correlation (r = 0.679, p = 0.104). The linear regression model yielded an R2 of 0.461, indicating that approximately 46.1% of the total variance in emissions could be explained by the number of events. However, the model was not statistically significant (F(1,3) = 2.565, p = 0.208), suggesting substantial uncertainty. While this result hints at a potential emissions impact from event frequency, it falls short of statistical robustness.
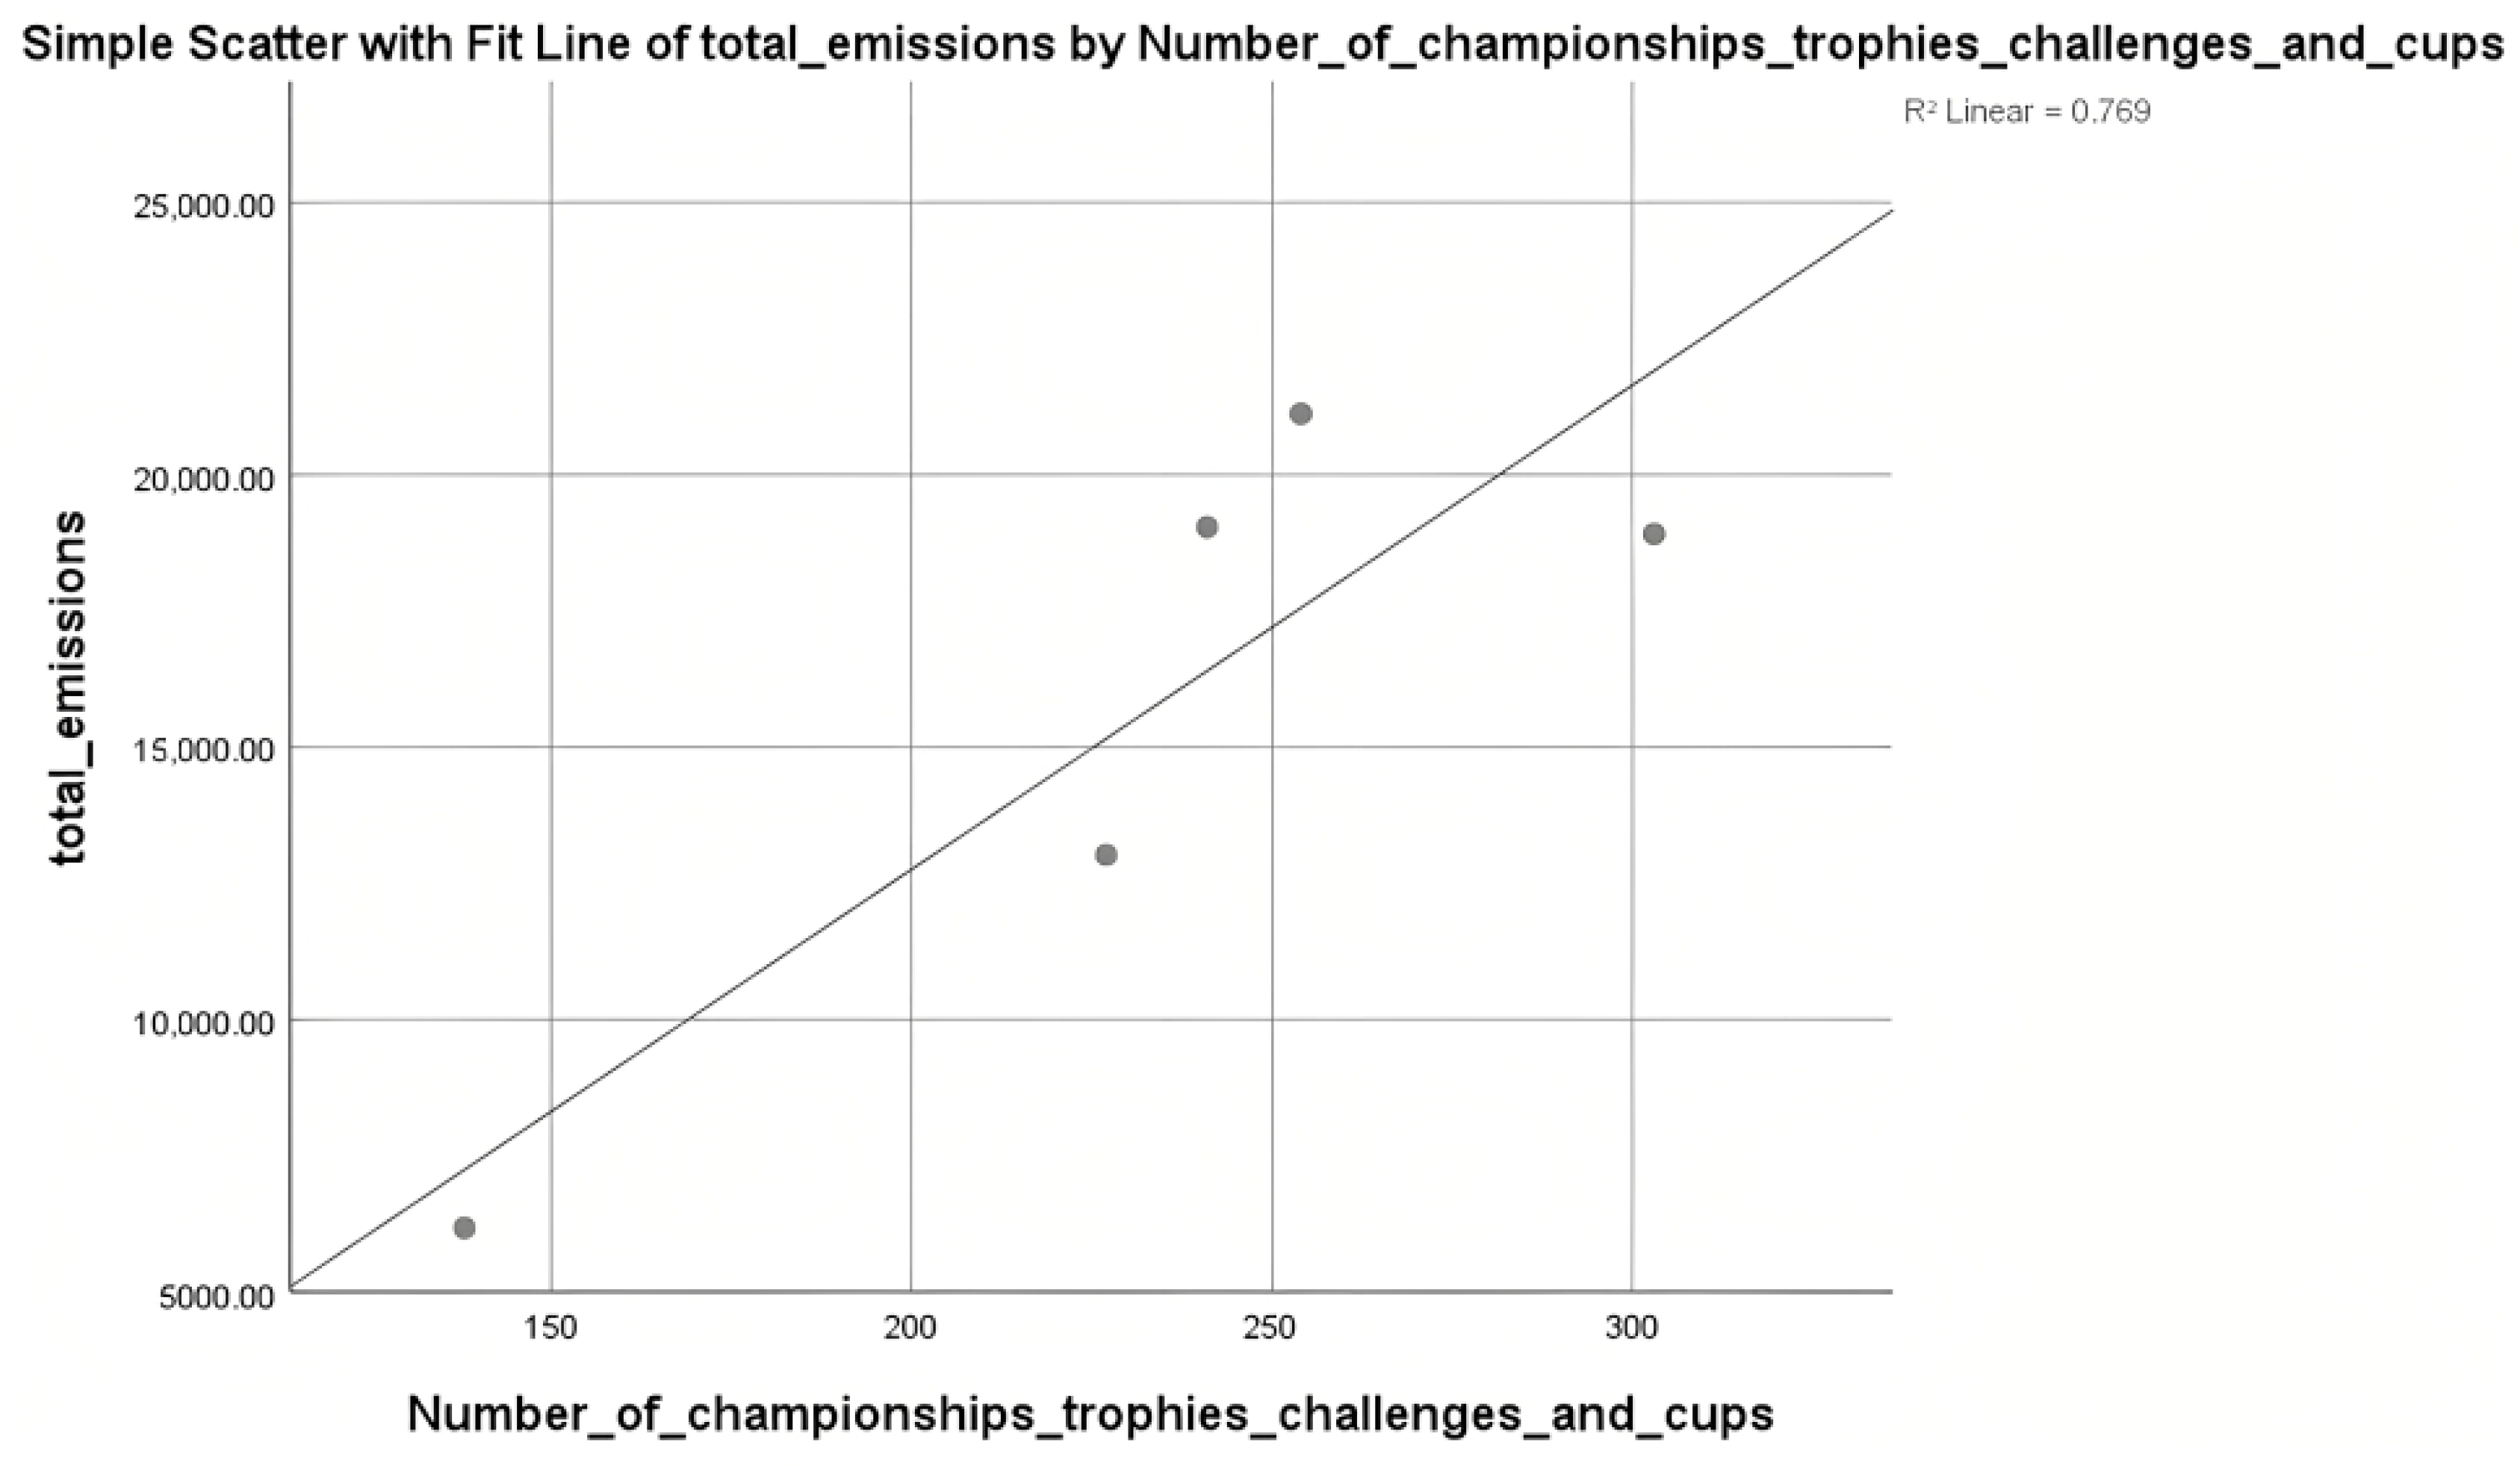
In contrast, a stronger association was found between total emissions and the number of championships, trophies, challenges, and cups organized by the FIA. The correlation was high and statistically significant (r = 0.877, p = 0.025), and the regression model explained 76.9% of the variance in total emissions (R2 = 0.769), as shown in Figure 2.
The coefficient (B = 88.93) suggests that each additional competitive event is associated with an increase of approximately 88.93 metric tons in total emissions. Although the model narrowly missed conventional significance thresholds (F(1,3) = 9.981, p = 0.051), it provides compelling evidence that the FIA’s expanding event portfolio contributes materially to emissions growth. This highlights the potential for sustainable event planning and logistics optimization as impactful mitigation strategies.
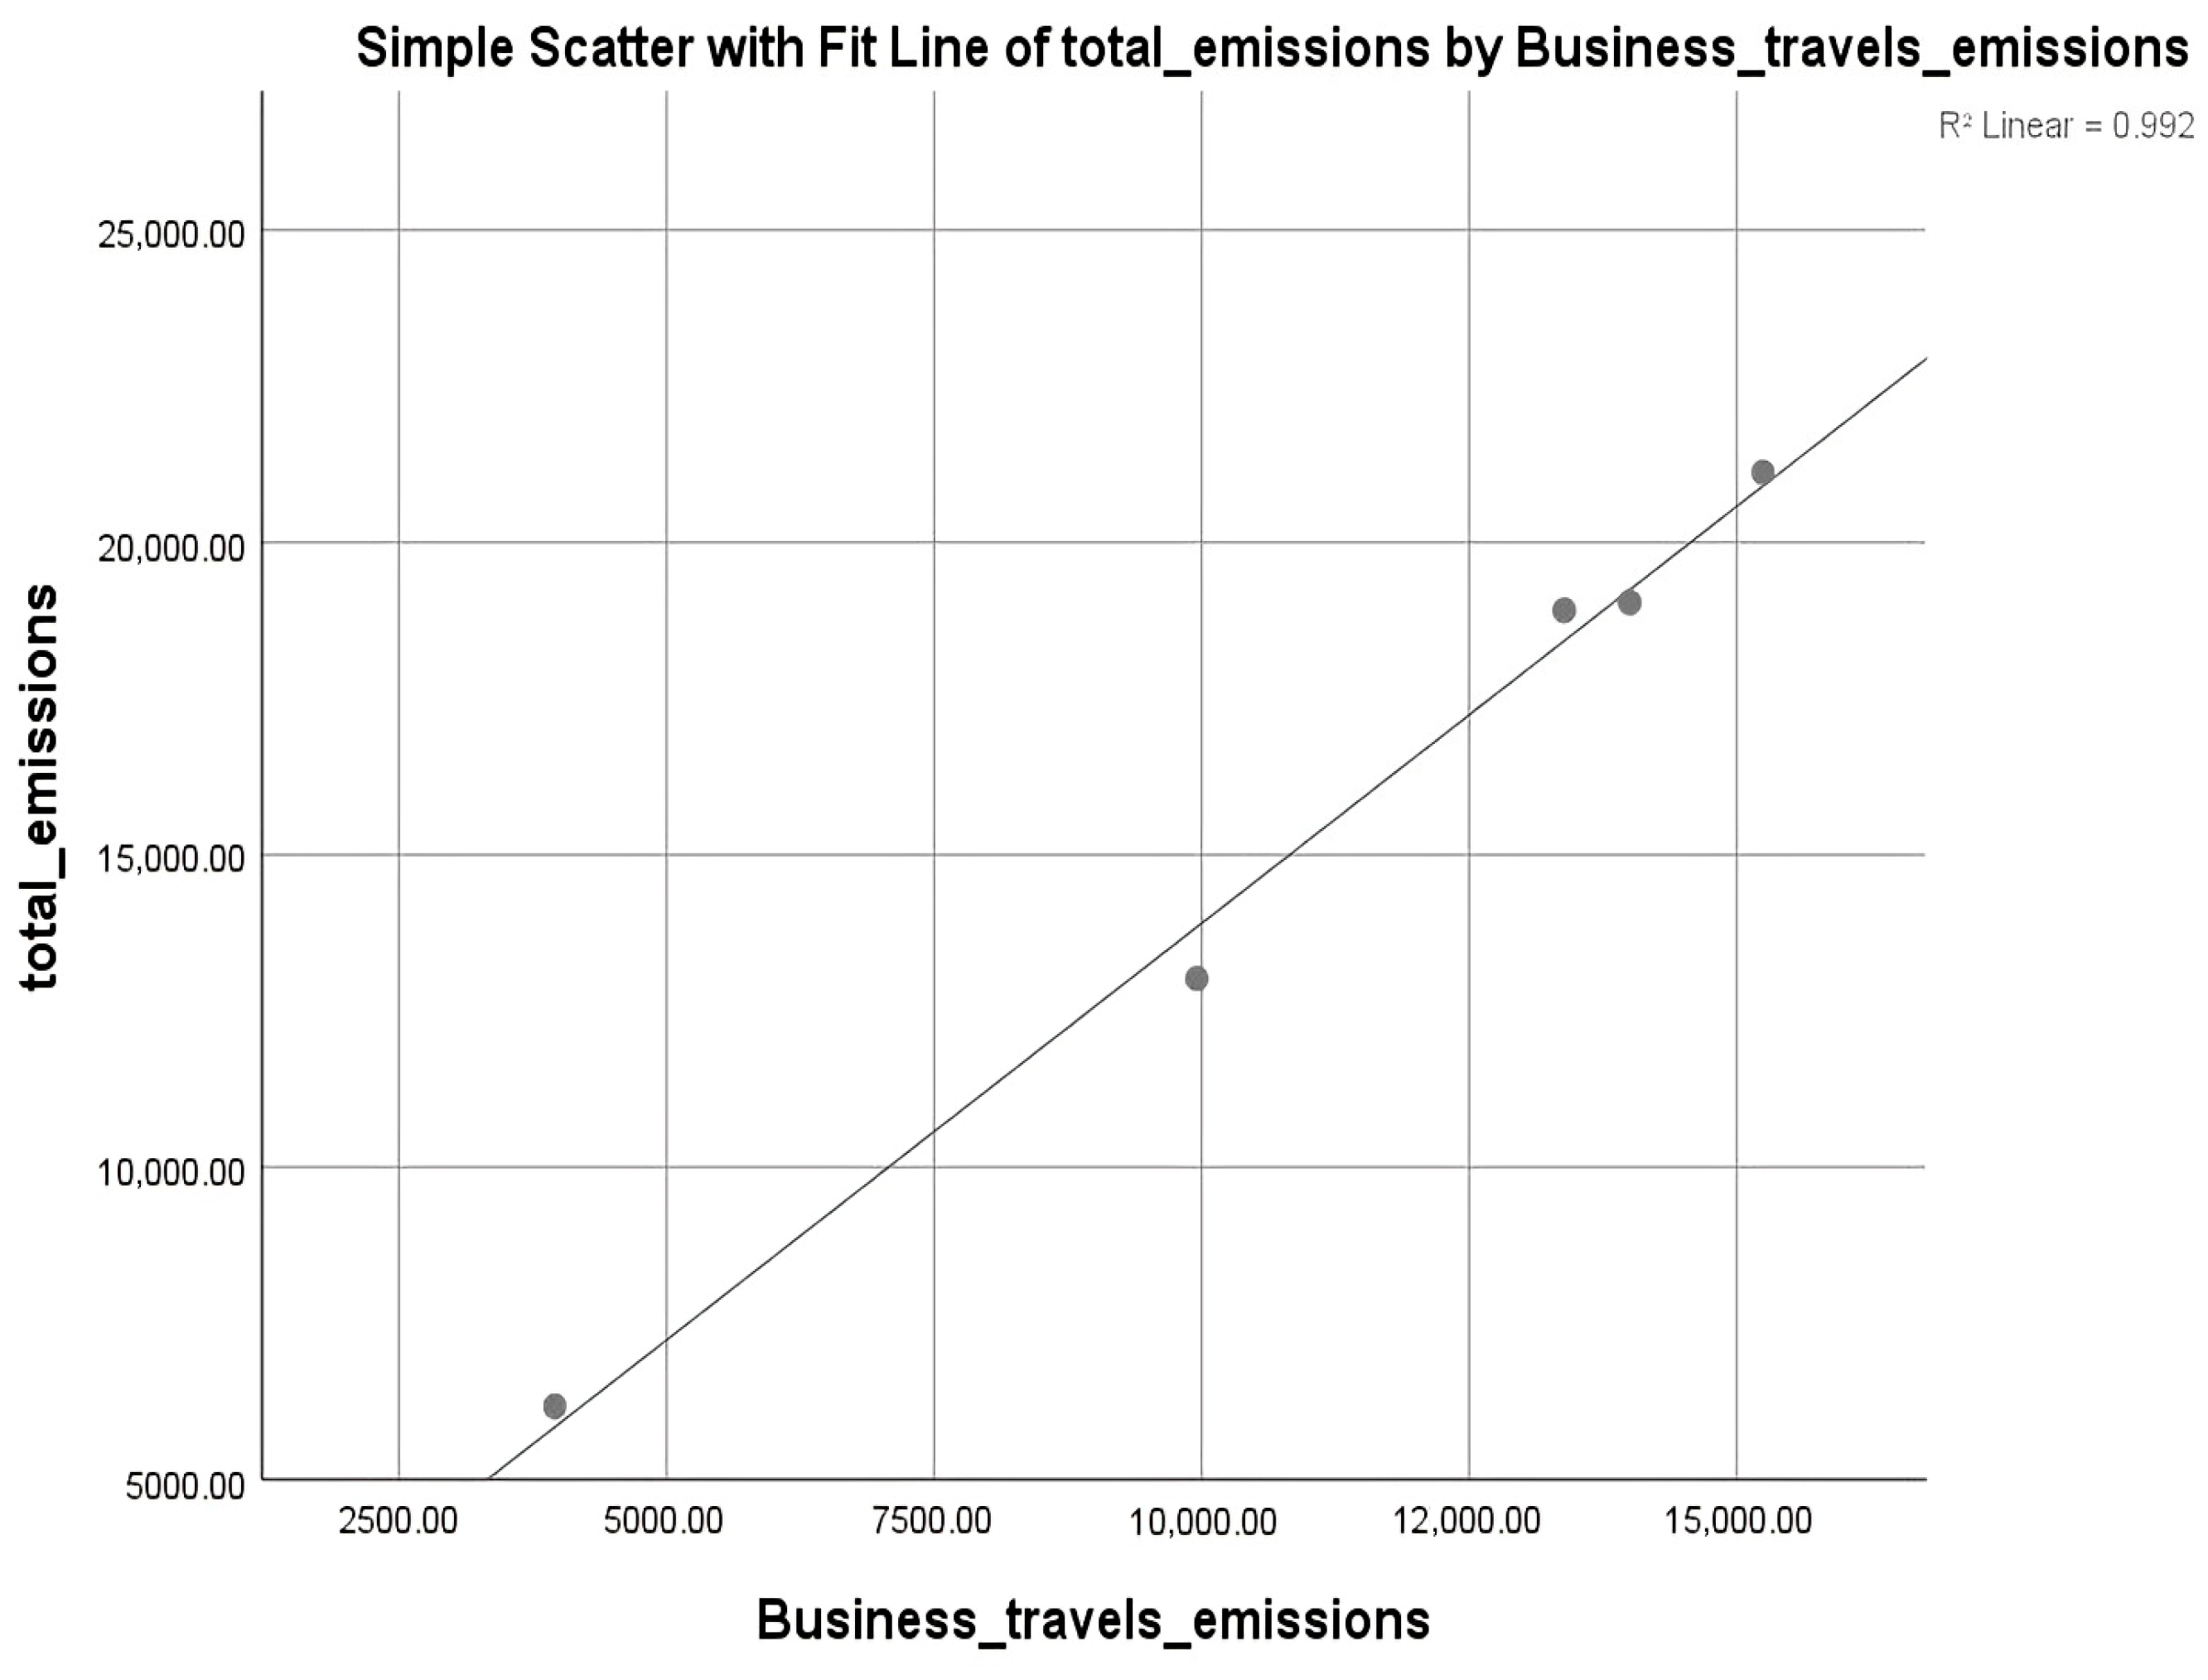
The analysis of business travel emissions produced the strongest and most statistically robust evidence in the study. A near-perfect positive correlation was observed (r = 0.996, p < 0.001), and the regression model explained 99.2% of the variance in total emissions (R2 = 0.992), as shown in Figure 3.
The unstandardized coefficient (B = 1.334, p < 0.001) shows that for every additional ton of business travel emissions, total emissions increase by approximately 1.334 tons (see Table 1). This confirms that business travel is the single most influential and quantifiable driver of the FIA’s carbon footprint and represents a critical area for targeted emissions-reduction strategies.
Although the Durbin–Watson value of 1.727 suggests small negative autocorrelation, the small sample size naturally limits the validity of this result. This is consistent with current literature, which confirms that the Durbin–Watson test cannot be applied in small samples and has undesirable small-sample properties [31].
It is statistically consistent that the simple regression yields an R2 as high as 0.992, even though business travel emissions represent approximately 70% of total FIA emissions in absolute terms. R-squared measures how well year-to-year changes in business travel track changes in total emissions—not the proportion of total emissions they constitute. Because business travel is not only the largest component but also varies closely in parallel with total emissions across years, the model naturally captures nearly all of the variance.
Other components (like upstream transportation, energy use, etc.) also fluctuate, contributing to the total variance. The high R2 value of 0.886 indicates that the fluctuations in business travel are the dominant driver of the fluctuations in the total emissions across the observed period. The coefficient of 2.213 suggests a multiplier effect, where an increase in business travel is associated with an even larger increase in the total footprint, likely because it acts as a proxy for broader operational intensity that also elevates other, smaller emission sources.
The relationship between upstream transportation and distribution emissions and total emissions also revealed a strong positive correlation (r = 0.766), though it did not reach statistical significance (p = 0.131). The corresponding regression model accounted for 58.6% of the variance in total emissions (R2 = 0.586), with a coefficient of B = 3.024 and a wide confidence interval, reflecting notable uncertainty in the estimated effect.
A final multiple regression model was developed using the two strongest predictors identified in the analysis: business travel emissions and the number of championships. The model demonstrated an exceptionally high level of explanatory power, accounting for 99.3% of the variance in total emissions (R2 = 0.993; adjusted R2 = 0.985), and was statistically significant overall (F(2,2) = 135.518, p = 0.007). In the combined model, business travel emissions remained the only statistically significant predictor (B = 1.299, p = 0.016), underscoring its dominant role in shaping the FIA’s emissions profile. In contrast, the number of championships did not contribute a meaningful independent effect (B = 3.033, p = 0.832), with its influence diminishing once business travel was included in the model. See Table 2.
The regression equation is expressed as:
Total Emissions = 254.45 + (3.033 × Number of Championships) + (1.299 × Business Travel Emissions)
This indicates that, holding other variables constant, each additional ton of business travel emissions is associated with an estimated 1.30-ton increase in total emissions. The championship coefficient, while directionally positive, is not statistically significant and carries a wide confidence interval, reflecting the limited independent contribution of this variable in the presence of business travel. As with all regression models applied to a small sample, the intercept (B = 254.45) should not be interpreted as a physically meaningful emission level, since no realistic FIA scenario includes zero championships and zero business travel [32].
Collinearity diagnostics showed moderate multicollinearity, which is expected given the structural relationship between FIA activity metrics. The Variance Inflation Factor (VIF = 4.205) remained below levels considered severe, and the Condition Index (CI = 19.243) was consistent with moderate dependence between predictors. Importantly, the Durbin–Watson statistic (2.012) indicated no evidence of autocorrelation, confirming that the residuals meet the assumption of independence.
In summary, the regression analyses confirm that business travel emissions are the most robust predictor of total emissions, followed closely by the number of championships. While other variables, such as event counts and transportation-related emissions, show moderate associations, they lack statistical significance. These findings support a targeted emissions mitigation strategy centered on reducing business travel impacts and managing the emissions footprint of competitive events.

4.2. Forecast Results

4.2.1. Model 1 Forecast

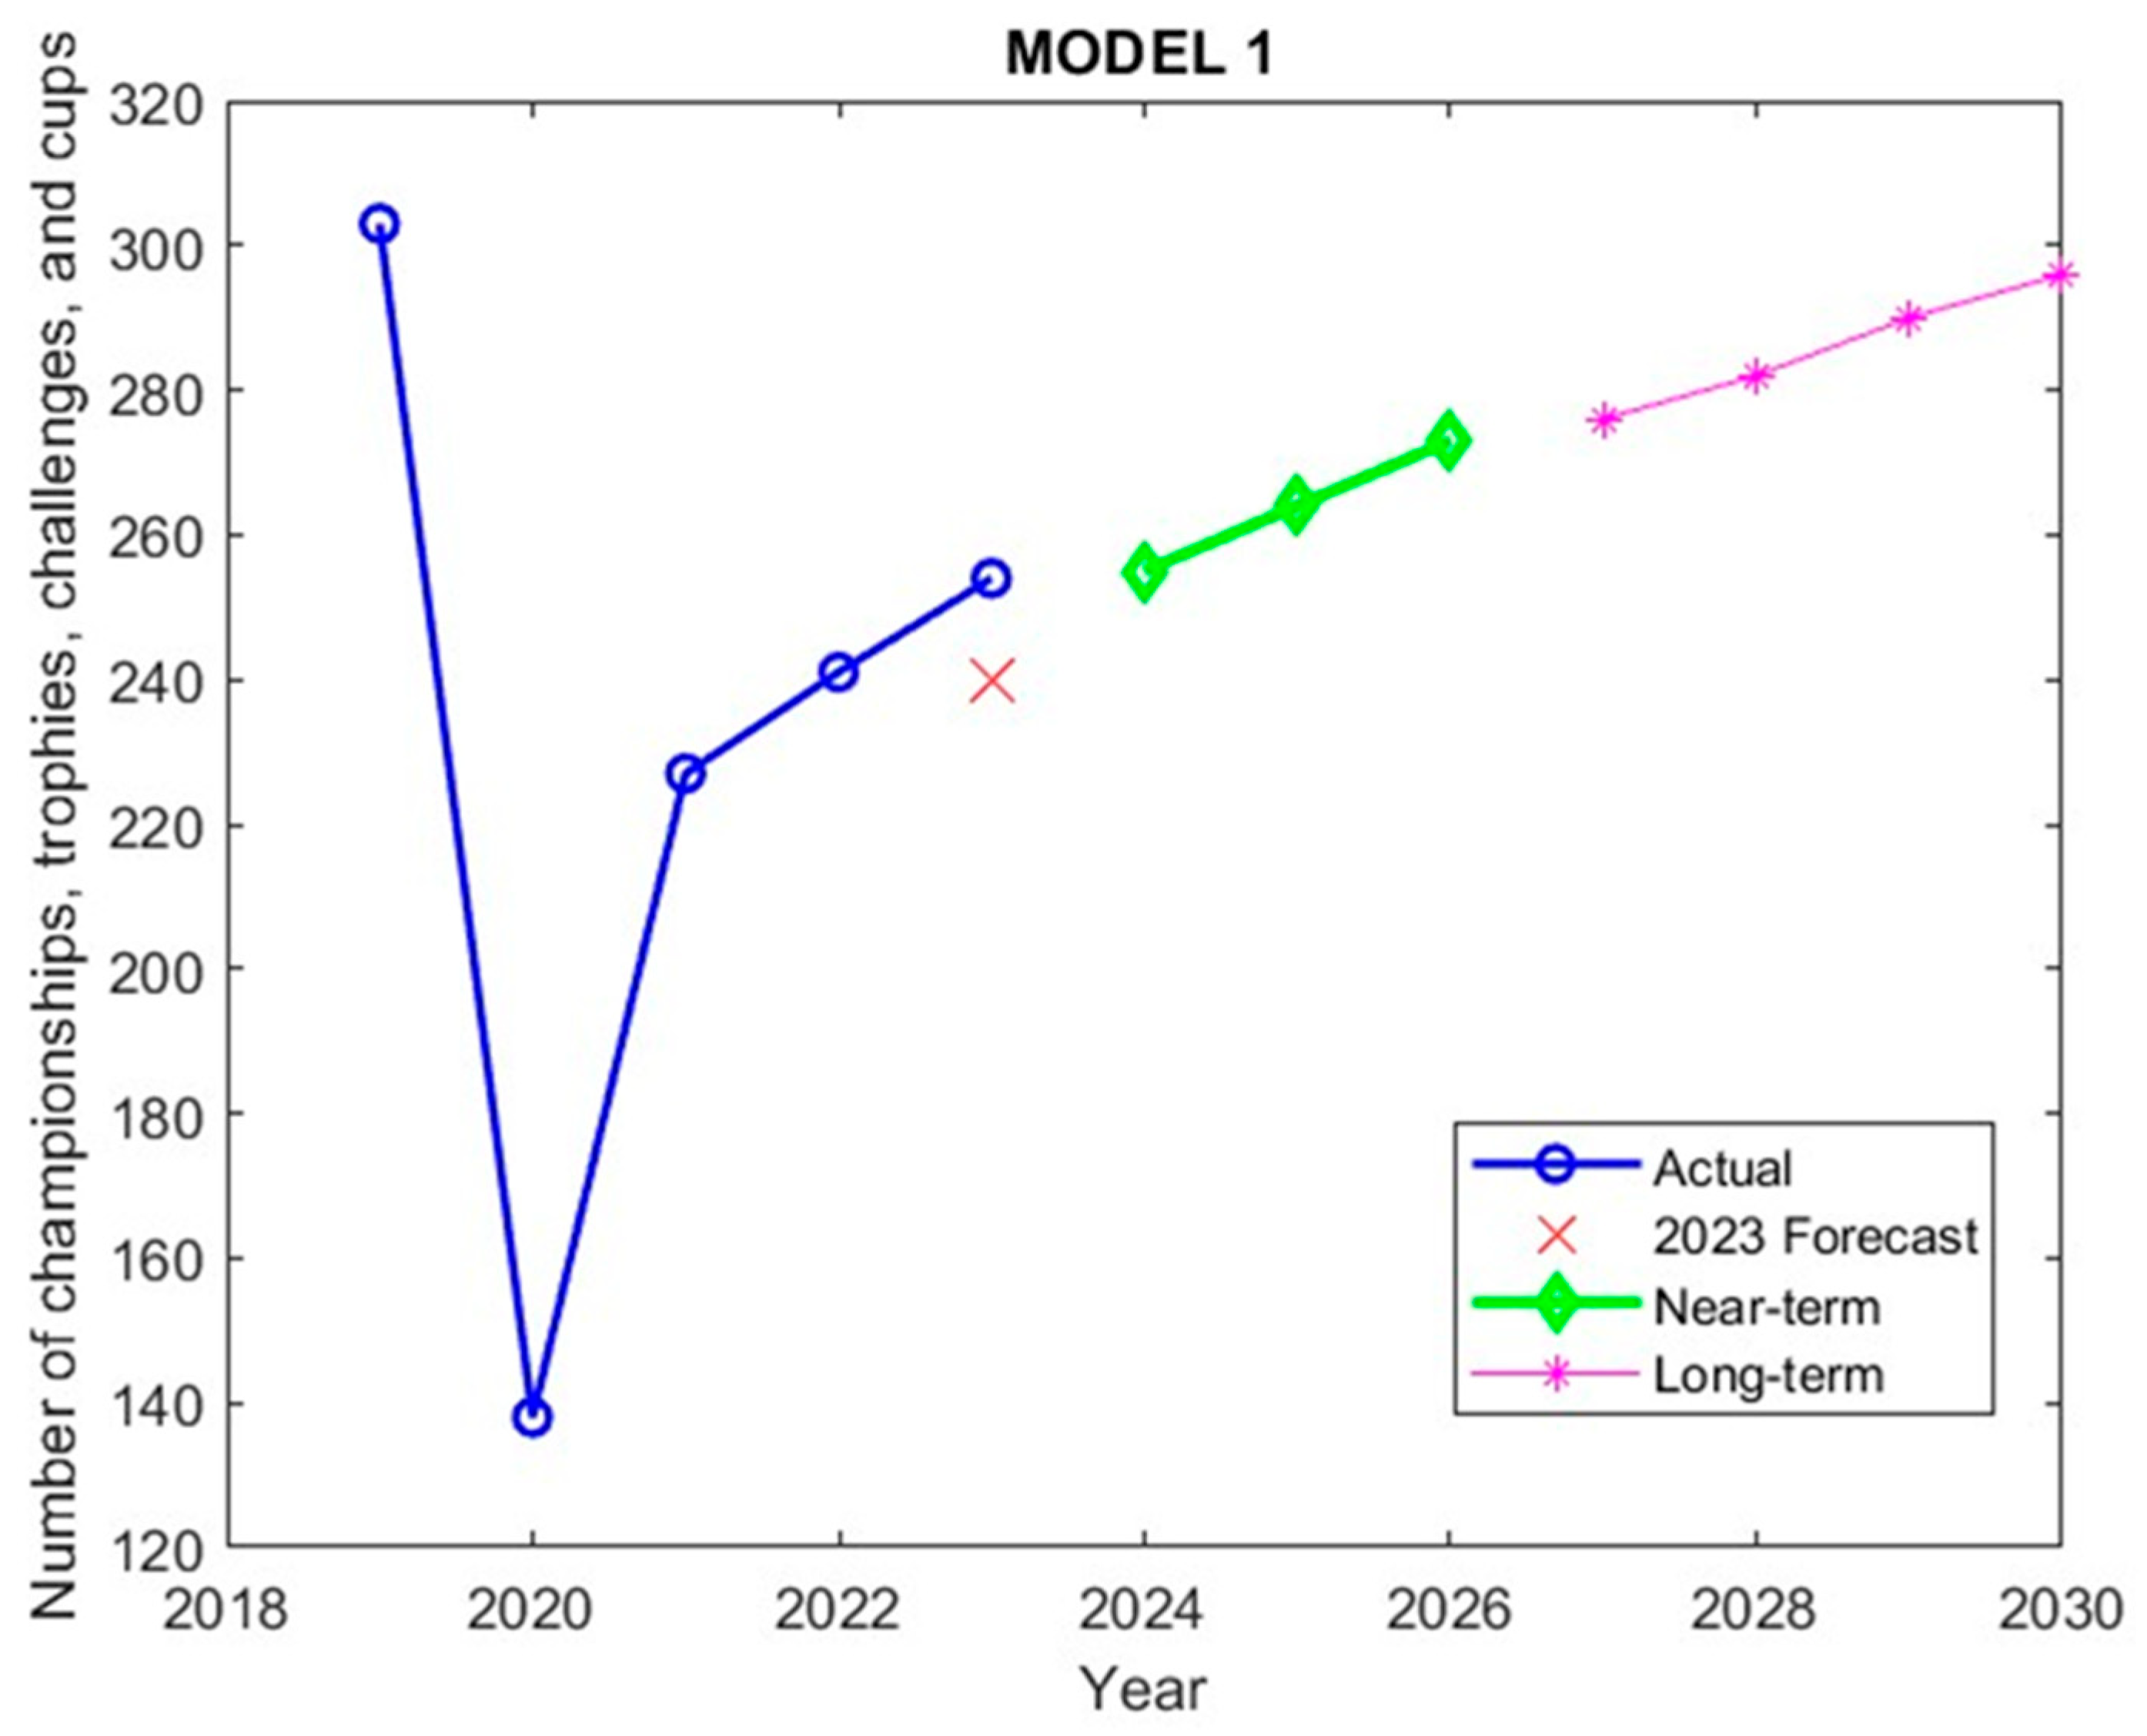
The first model evaluated the ability to predict the number of FIA championships, trophies, challenges, and cups using a rolling-window moving average with filtered growth adjustment. When validated on the 2023 season, the model forecasted 240 championships (raw: 240.39), compared to the actual count of 254. This results in a Mean Absolute Percentage Error (MAPE) of 5.36%, indicating high forecasting precision within acceptable margins for managerial decision-making. The forecast residual (observed—predicted) was 13.61, reflecting a modest underestimation and demonstrating the model’s generalizability without signs of over-fitting.
For long-term projections (2024–2030), the model adopts a dynamic structure that transitions from a 3-year moving average (2024–2026) to a 4-year moving average (2027–2030). This framework balances responsiveness in the near term with stability in the long term. Both windows are modulated by a filtered median growth rate to preserve recent trends while smoothing out anomalies. Final values are rounded for clarity.
As seen in Figure 4, the trajectory reflects a steady upward trend, consistent with historical recovery patterns post-pandemic and an expanding event calendar.

4.2.2. Model 2 Forecast

The second model focuses on forecasting business travel emissions using a rolling average combined with a decaying championship-based adjustment. The 2023 forecast was 13,511.34 compared to the actual observed value of 15,243.83, yielding a MAPE of 11.37%. The residual of +1732.49 suggests a modest underestimation but remains within planning tolerances.
Forecasts from 2024 to 2030 use a rolling average structure similar to the first model, with a transition from a 3-year to a 4-year window. Additionally, the model includes a decaying adjustment based on the number of championships, simulating the gradual adoption of emission-reducing policies such as sustainable travel protocols, remote coordination technologies, or carbon offset programs.
As seen in Figure 5, the forecasts suggest a controlled upward trend, guided by structural smoothing and policy-aware championship impacts. The slight increase in 2024 over 2023 aligns with expectations of continued recovery and operational scaling.

4.2.3. Model 3 Forecast

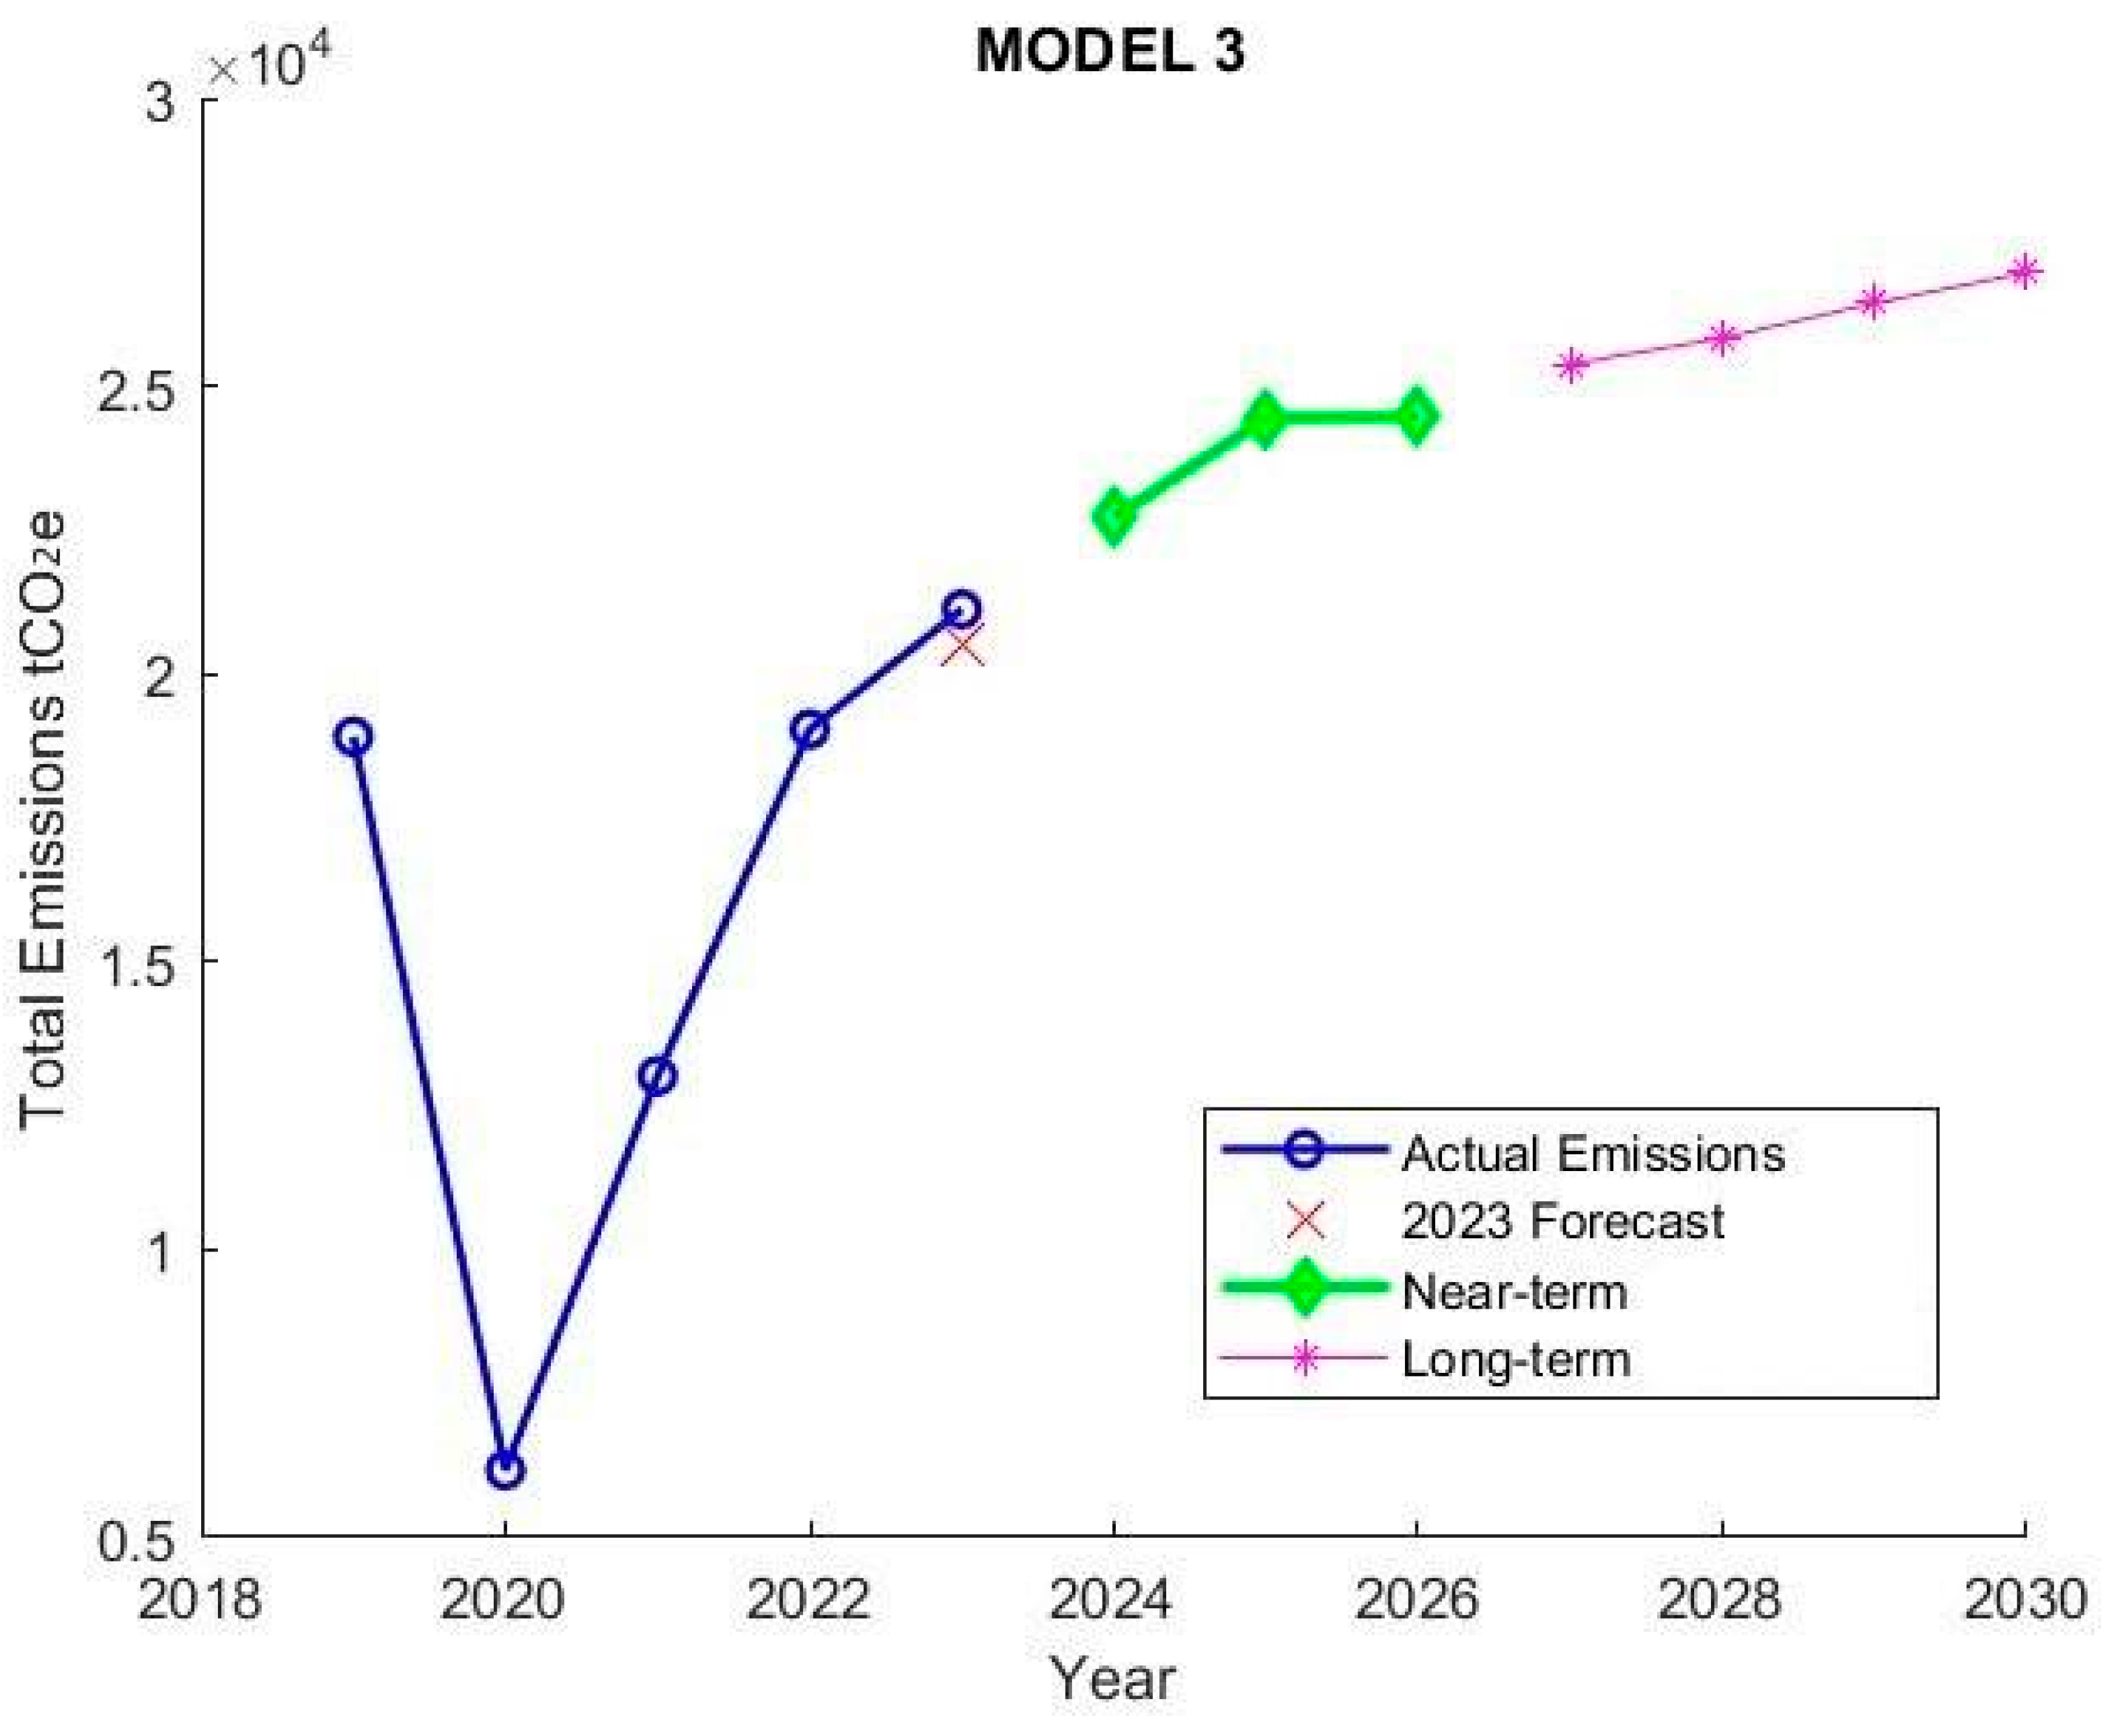
The final model integrates both championships and business travel emissions to forecast total emissions. For 2023, the predicted total emissions were 20,495.04, compared to an actual value of 21,120.63. This results in an MAPE of 2.96%, demonstrating the strongest predictive performance among the models. The forecast residual was +625.59, within strategic planning tolerances and supporting model reliability.
This model uses a forward-applied composite growth structure that incorporates rolling historical means and filtered drivers (championships and business travel). A transition to a 4-year window after 2026 reflects the increasing influence of structural constraints—such as plateauing activity, policy stabilization, and carbon reduction strategies—on future emission trajectories.
As seen in Figure 6, the results indicate a moderate and stable growth trajectory in total emissions. Notably, the 2030-to-2024 ratio is 1.18, suggesting the influence of sustainability initiatives and a natural ceiling effect on organizational emissions, even amidst ongoing operational expansion.

4.3. Sensitivity Analysis

4.3.1. Model 1 Results

Two forms of sensitivity testing were conducted: (1) a localized shock to the anomalous year 2020, and (2) systematic adjustments to the long-term median growth rate applied in the forecasting horizon.
  • Multi-Delta Analysis (2020 Perturbation): Artificial adjustments of ±5%, ±10%, and ±20% were applied to the 2020 data point to simulate noise or reporting inconsistencies. Across all future forecast years (2024–2030), these shocks produced no measurable impact on projected championship counts. The average, maximum, and minimum differences in forecasts remained at zero, confirming the model’s inherent resilience to outliers via its rolling-window smoothing mechanism.
  • Growth Rate Sensitivity (2024–2030): The model’s reliance on a filtered median growth rate was tested by varying it ±10% from the baseline. A 10% reduction in the growth rate led to a cumulative under projection of −2.5% by 2030 (310 vs. baseline 318), whereas a 10% increase elevated the forecast to 326 (+2.5%). While early forecast years exhibited only ±0.8% divergence (2024), this widened to ±2.5% by 2030.

4.3.2. Model 2 Results

The sensitivity analysis for the second model was designed to test the behavioral dynamics of championship-induced emissions and the effects of adjusting the growth blending ratio.
  • Championship Impact with Temporal Decay: A ±20 unit perturbation in championship counts was introduced to assess the impact on emissions forecasts. The influence was most pronounced in the immediate forecast year but decayed exponentially over time, reaching approximately 30% of its original strength by 2030. This decay rate (≈2% annually) aligns with documented half-life effects observed in event-related economic shocks. The model’s decay logic ensures that it remains responsive to near-term volatility while preventing long-term overreliance on transient anomalies.
  • Growth Rate Blending Sensitivity: Adjustments to the blend ratio between recent and historical growth revealed a trade-off between recency sensitivity and long-term stability. Under high recent growth (20%), the model activated a 15% growth cap when the blend ratio exceeded 0.6—consistent with econometric safeguards against over-extrapolation. Conversely, the model handled low-growth scenarios without requiring artificial constraints. The default ratio of 0.7 offered a balanced configuration, shown to optimize predictive accuracy by integrating recent volatility with structural trends.

4.3.3. Model 3 Results

To test the robustness of the total emissions model, which integrates inputs from both championships and business travel forecasts, a two-pronged sensitivity analysis was conducted: decay rate variation and One-At-A-Time (OAT) parameter perturbation.
  • Decay Rate Sensitivity (Sustainability Scenarios): The model tested three decay scenarios—0.9 (strong sustainability), 1.0 (baseline), and 1.1 (weak sustainability)—applied to the composite growth structure. Results revealed that stronger sustainability assumptions produced more tempered emissions growth, whereas weaker assumptions led to modestly elevated projections. Importantly, the baseline scenario already incorporated sustainability-aware adjustments through tapered business travel growth rates, making the decay rate analysis an exploration of second-order effects.
  • One-At-A-Time (OAT) Growth Rate Perturbation: Small perturbations (±5%) were applied to the annual growth rate while holding all other model components constant. This classical sensitivity method, appropriate for deterministic models with limited drivers, demonstrated smooth and proportional changes in output with no erratic behaviors or structural instabilities. These results validate the model’s internal coherence and its capacity to absorb minor forecasting errors or changes in planning assumptions.

4.4. Uncertainty Analysis

The study utilizes the Bayesian component not for forecasting but only for the sake of uncertainty quantification around the deterministic forecasts. Through Section 3, the MA + growth models are the only methods that yield the point forecasts, while the Bayesian inference is employed afterwards to obtain the forecast error probability distribution and credible intervals. According to the approach, the residuals are assumed to be normally distributed with uncertain mean (μ) and variance (σ2), which is described under a Normal-Inverse-Gamma prior with weakly informative hyperparameters. The posterior updates involved using the residuals from the training and validation period of 2019 to 2023, yielding 95% credible intervals that show increasing uncertainty over the forecast horizon. This way of doing things guarantees that the uncertainty quantification is in line with the statistics, and it does not affect the deterministic point forecasts.

4.4.1. Model 1 Results

For the championship forecast model, Bayesian inference was adopted due to the short historical record (2019–2023) and the volatility introduced by anomalous years such as 2020. Credible intervals were generated using prior distributions based on the mean and variance of the training data, with tunable hyperparameters (α = 2, β = 2) to balance prior strength and observation-based updates. A fixed random seed (rng(42)) was used to ensure reproducibility.
The posterior means and variances were assumed to follow approximate normality, enabling the construction of 95% credible intervals using a ±1.96 standard deviation range. For instance, the 2023 forecast resulted in a mean prediction of 245 championships with a 95% CI of [190, 299], which successfully captured the observed value of 254. The credible intervals for 2024–2030 exhibited controlled widening over time, consistent with expectations for long-term forecasts under data-limited conditions.

4.4.2. Model 2 Results

Uncertainty in the business travel emissions forecasts was similarly addressed using a Bayesian framework. Priors were applied to the effective growth rate and championship adjustment coefficient, incorporating domain knowledge with increased variance to accommodate realistic fluctuations. Posterior inference was performed using 5000 samples, with the growth rate constrained between 22% and 40%, and the championship effect limited to positive values in accordance with observed trends.
The 2023 forecast produced a posterior mean of 13,425.69 tons of CO2 with a 95% credible interval of [13,115.94, 13,728.20], reflecting the moderate predictability of business travel trends. The credible intervals for subsequent years widened gradually through 2030, accounting for compounding uncertainty while maintaining internal consistency.

4.4.3. Model 3 Results

For total emissions, the Bayesian framework was extended to account for the joint effects of business travel and championships as explanatory variables. Priors for the corresponding coefficients were specified as normal distributions based on expert assumptions, and a stochastic noise term was added to capture unobserved variability. Posterior distributions were calculated through Bayesian updating, and credible intervals were derived using quantiles.
The 2023 forecast yielded a mean estimate of 21,799.17 tons with a 95% credible interval of [19,260.18, 24,381.27], successfully bracketing the observed emissions of 21,120.63 tons. As expected, the credible intervals for 2024–2030 widened over time, reflecting increasing uncertainty associated with long-range forecasts and sustainability-related assumptions embedded in the business travel emissions model.

5. Discussion

5.1. Key Contributors to FIA’s Total Emissions

According to regression analysis, the two most significant determinants of FIA’s overall emissions are the number of championships and emissions from business travel. A particularly significant linear association was found for business travel (R2 = 0.992), confirming its key position as a measurable and manageable source of carbon emissions. This result is in line with past studies that show that mobility—particularly air travel—is a major source of emissions in event-based sectors like sports and MICE [3,4].
The number of championships also showed a strong positive association (R2 = 0.769), which is consistent with the finding that there is a substantial operational, transport, and logistical overhead associated with each competitive event. This confirms earlier findings that large-scale motorsport operations need a lot of resources and are directly related to calendar size [33,34].
These two variables adequately capture the majority of the variability in total emissions, as confirmed by the combined model’s statistical strength (R2 = 0.993). This makes the concept easier to understand and emphasizes how crucial it is to strategically optimize event scheduling and make targeted cuts to travel-related activities. These results also support the FIA’s current Environmental Strategy, which gives Scope 3 emissions—such as freight and business travel—priority [7].
The quantitative relationship allows for a direct comparison of each driver’s marginal impact. The regression Equation (17) shows that the coefficient for the number of championships (3.033) is lower and represents the cost of a discrete, structural decision—adding an entire event. Business travel, however, has a coefficient of 1.299, which acts as a multiplier on a continuous operational variable, underscoring its role as a pervasive operational lever. For example, a reduction of 1000 tonnes in business travel emissions would decrease total emissions by approximately 1299 tonnes—an impact equivalent to cancelling over 428 championships. This comparison reveals that while controlling the calendar’s growth is important, managing business travel offers a far more potent, immediate, and flexible route for emissions reduction.

5.2. Emission Trajectories to 2030

According to the multi-stage forecasting models, predicted emissions would rise through 2030 in a regulated and moderate manner. The ratio of total emissions from 2030 to 2024 is just 1.18, indicating a steady tapering, even if projections indicate an upward trend. This result is the result of striking a balance between sustainability initiatives and operational recovery.
The business travel model, for instance, predicted an increase, but this was offset by a decaying championship-based adjustment, a method used to model policy-driven emission reductions. In emissions modeling, these mechanisms align with the literature that emphasizes scenario-based decay and adaptive planning [35,36]. A steady upward trend was also shown by the championship forecast, which was confirmed by an MAPE of 5.36%. This suggests that competitive activity will probably increase, but only within reasonable limitations that the FIA’s sustainability strategy can support.
In order to minimize the problems associated with oversimplified extrapolation, the forecasting models combined rolling averages with filtered growth rates. Across high-emission industries like public infrastructure and transportation, similar methodological approaches—where essential drivers are embedded into dynamic models—have shown success in emissions research [37,38]. This puts the current study in line with an increasing number of thorough, hybrid modeling attempts that seek to forecast the future while dealing with data limitations.

5.3. Realism of FIA’s Sustainability Targets

According to FIA’s Environmental Strategy 2020–2030, the organization will cut emissions by 50% by 2030 (compared to a baseline set in 2019), and thereafter reach net-zero emissions. Figure 7 [39] displays the anticipated future total emissions. Considering that emissions have almost reached 2019 levels by 2022, the FIA’s target of a 50% reduction in emissions by 2030 from a 2019 baseline seems ambitious. The correctness of the model is confirmed by the modeled forecast, which only forecasts an 18% increase from 2024 to 2030 and a MAPE of 2.96% when tested using 2023 data. The path to a 50% drop is still steep, though, as the 2022 levels have already almost matched the 2019 levels unless more drastic measures are taken right now.
The results indicate that the FIA is unlikely to achieve its 50% reduction goal in the absence of significant structural or behavioral changes. Emissions are predicted to increase slightly, even with decay functions incorporated into the model to approximate sustainability initiatives, suggesting that present efforts may stabilize but not substantially reverse emission trajectories.
This supports earlier criticisms that, despite their structure, FIA’s tactics run the risk of becoming symbolic action unless they are combined with legally binding restrictions and advancements in digital coordination, logistics, and environmentally friendly transportation [4].
Researchers examining sustainability transitions in similar industries have mirrored these insights, which highlight the significance of moving from target-setting to impact-measuring and from reporting to enforcement [35].

5.4. The Value of Early Forecasting in Climate Governance

While some people might doubt the reliability of forecasts that rely on limited historical data, catching trends early is still crucial for creating policies based on solid evidence. Even small datasets—when analyzed carefully—can provide valuable insights, reveal systemic weaknesses, and aid in scenario-based stress testing [40].
Our method, which uses bootstrapped confidence intervals, Bayesian simulations, and sensitivity analysis, makes sure that our findings aren’t just over-fitted or too rigid. As we gather more data, the forecasting framework we’ve laid out can be updated continuously, enhancing its accuracy and relevance for policy decisions over time [41].
This approach mirrors successful practices in other high-emission and data-limited contexts. For instance, Tang et al. (2023) [18] conducted a two-phase emissions forecast for China’s transport sector using just five years of historical data. By combining LASSO regression for driver identification with neural network-based forecasting, they demonstrated that even short time series can yield actionable insights when paired with robust validation techniques and scenario modeling [18].

5.5. Strategic Recommendations for Faster Decarbonization

The FIA has made some real progress in putting sustainability initiatives into action across its operations and championships. They’ve seen key successes, such as a rise in the use of sustainable fuels, an expansion of their Environmental Accreditation Programme, and better governance around emissions. Yet, despite these efforts, the actual emissions for 2023 reached 21,120.63 tonnes of CO2 emissions, which is a significant overshoot of the FIA’s target of 15,500 tonnes for the year [40]—based on the decarbonization path set by the Science-Based Target Initiative (SBTi). This represents about a 12% increase from 2022 (19,037.43 tonnes of CO2 emissions) and a roughly 30% jump from the 2019 baseline (18,910.69 tonnes of CO2 emissions). This discrepancy—over 5600 tonnes above the target—clearly shows that the current emissions reduction strategies are falling short. The ongoing dominance of emissions from business travel underscores the urgent need for structural changes.
These findings highlight a growing gap in implementation that cannot be bridged by voluntary measures alone. To effectively close this gap and speed up emissions reductions, we suggest making some improvements to the current initiatives:

5.5.1. Incorporate AI-Driven Freight and Travel Optimization

Event clustering, freight routing, and logistics planning may all be dynamically optimized with the use of artificial intelligence and machine learning. AI-driven optimization has been shown to reduce CO2 emissions in complex freight networks, with research showing that it can eliminate redundant freight trips by up to 18% in logistics-intensive businesses [42]. However, this strategy is not taken into consideration in the current FIA reports, which highlight a chance for innovation-led emissions reductions. One of the real-world applications would be creating a “sustainability dashboard” for calendar planning powered by AI. Such a system would calculate the freight and travel emissions of various championship schedules and let the FIA select a calendar that automatically reduces its carbon footprint even before the season is closed.

5.5.2. Enhance Real-Time Emissions Monitoring and Transparency

Emissions are currently reported annually and aggregately. To increase data resolution and facilitate quicker feedback loops, the FIA should make investments in IoT-enabled environmental dashboards and real-time, GPS-tracked freight emissions monitoring. Given that research shows a growing emphasis on digital technologies like artificial intelligence (AI) and the Internet of Things (IoT) in port management and navigation to improve environmental sustainability, this would bring the FIA into line with new best practices in digital sustainability governance [43]. Moreover, a crucial tactic for facilitating real-time emission management is the deployment of IoT-based pollution monitoring systems [43]. One specific change that the FIA might implement is requiring telematics systems to be used by all its recognized shippers to know the total miles traveled, the amount of time the engines were running while the vehicles were standing still, and the fuel consumed. If this information were to be consolidated on a single platform, emissions reporting would shift from annual retrospect to a real-time management tool, thus allowing interventions during the season itself and giving a verified basis for its Environmental Accreditation Programme.

5.5.3. Responsible Event Planning

Our analysis shows that the number of championships, trophies, and cups is a significant structural driver of total emissions, mainly through logistics and business travel. However, there are no restrictions to limit calendar extension in the FIA’s current approach. Previous research highlights that one of the best strategies to lower transportation emissions is to limit the frequency of events and cluster competitions geographically [44]. The FIA should implement an emissions-based event budgeting system to ensure that new events are only organized if they fall under annual carbon limitations and take place at environmentally recognized sites to integrate structural planning with climate goals. Reversing the emissions increase will require more than just operational improvements if this upstream element is not addressed. A feasible action would be to incorporate this financial plan straight away into the FIA’s Environmental Accreditation Programme. To gain the top (Three-Star) accreditation, a championship might be necessitated not only to assess its footprint but also to remain within a carbon budget set by the FIA. This would turn out to be a tempting force for the organizers of the events to come up with new ideas regarding the logistics and the site selection, and thus, their place in the events calendar would be secured.

5.6. Policy and Practical Implications

The gap between the emissions trajectory projected by the FIA and the target set for 2030 is not just a numerical indication but a strong request for immediate policy intervention. Our driver-based analysis provides the needed quantitative support for the decarbonization efforts all the way to the prioritization stage. The FIA gives the impression of having moved from abstract sustainability pledges to specific, evidence-based actions by pinpointing business travel and championship count as the main drivers of change.
This situation calls for a shift in policy from voluntary reporting to mandatory governance. The FIA’s Environmental Accreditation Programme could benefit greatly from the application of the findings of this research. To illustrate, it could be required that Three-Star accreditation be granted only if per-event travel emissions reduction is proved or an overall carbon budget for a championship series is followed. Moreover, the forecasting model developed by us provides policymakers with a very handy tool for “what-if” scenario analysis. The FIA policymakers can apply this framework to estimate the emission effects of possible actions—like 20% cuts in air travel or a new championships in far-off places moratorium—before adopting them and, thus, ensuring their strategic planning is not too risky. This leads to the conclusion that sustainability has not only been made obligatory for the reporting but has also been made an essential part of the operational and strategic decision-making process.

5.7. Limitations and Future Research

This research represents a crucial and initial evaluation; nevertheless, the results need to be taken with caution due to the study’s methodological limitations. The main limitation is the short time period (2019–2023), which makes the regression analysis more prone to overfitting and decreases the power to identify significant relationships. Even though the out-of-sample testing and robust sensitivity analyses that were part of our model validation do help to lower this risk, the coefficients, of which the multiple regression model has the most, should be considered as pointing to strong associations rather than to exactly estimated parameters. Also, the COVID-19 pandemic year is a structural outlier. Although our forecasting models applied filtering techniques to reduce their impact, their unavoidable presence still adds volatility to the growth rates and the historical baselines. More research, which will be supported by more years of FIA reporting, will be necessary for confirming the initial trends, refining the forecasting models, and strengthening the statistical robustness of the driver analysis. This study should be regarded as a foundational, not a conclusive, evaluation of the FIA’s development.

6. Conclusions

This paper offers one of the first systematic, data-driven analyses of the FIA’s emissions trajectory, evaluating progress toward the 2030 sustainability targets using a three-stage forecasting model and regression diagnostics. With almost 99% of the observed variance explained by business travel and the number of championships, the results validate that these factors are the most significant contributors to overall emissions. Notwithstanding integrated sustainability decay processes, projections based on these variables point to a moderate rising trend in emissions through 2030, up 18% from 2024. Despite falling short of the FIA’s 50% reduction target, this trend indicates stabilization and highlights a crucial implementation gap.
The findings show that, despite their sound orientation, the current efforts could not be enough in the absence of more structural changes. The efficacy of current initiatives could be significantly increased by innovations like AI-based logistics optimization, real-time emissions monitoring, and emissions-budgeted event planning. Furthermore, this study emphasizes how crucial early-stage forecasting is for supporting evidence-based governance and course correction, even with little data.
It is important to note that these projections are subject to the inherent limitations of the model, primarily the short historical data series (2019–2023) and the structural uncertainty of long-range forecasting. The forecasts represent a likely trajectory based on current trends and not a deterministic outcome, as highlighted by the Bayesian credible intervals.
In the end, the FIA’s journey to net-zero emissions will necessitate more than a few efficiency improvements; it will call for legally binding guidelines, deliberate restriction in event growth, and a persistent dedication to quantifiable climate impact. The modeling approach created here offers a reproducible basis for monitoring advancements and guiding future investment and policy choices both inside and outside of the sport.

Author Contributions

Methodology, A.A.-r. and S.N.; Software, A.A.-r.; Investigation, A.A.-r. and S.N.; Resources, A.A.-r. and S.N.; Data curation, A.A.-r.; Writing—original draft, A.A.-r. and S.N.; Writing—review and editing, S.N.; Supervision, S.N.; Funding acquisition, A.A.-r. All authors have read and agreed to the published version of the manuscript.

Funding

This research received no external funding.

Institutional Review Board Statement

Not applicable.

Informed Consent Statement

Not applicable.

Data Availability Statement

The original contributions presented in this study are included in the article. Further inquiries can be directed to the corresponding author.

Conflicts of Interest

The authors declare no conflict of interest.

References

  1. Dolf, M.; Teehan, P. Reducing the carbon footprint of spectator and team travel at the University of British Columbia’s varsity sports events. Sport Manag. Rev. 2015, 18, 244–255. [Google Scholar] [CrossRef]
  2. Wilby, R.L.; Orr, M.; Depledge, D.; Giulianotti, R.; Havenith, G.; Kenyon, J.A.; Matthews, T.K.R.; Mears, S.A.; Mullan, D.J.; Taylor, L. The impacts of sport emissions on climate: Measurement, mitigation, and making a difference. Ann. N. Y. Acad. Sci. 2023, 1519, 20–33. [Google Scholar] [CrossRef]
  3. Zanella, M.; Ashraf, N.; Mahmood, Z. Carbon accounting for sustainability management: Case study of MICE events. J. Account. Organ. Change 2025, 21, 1–15. [Google Scholar] [CrossRef]
  4. Sturm, D.; Andrews, D.L.; Miller, T.; Bustad, J. Green light or black flag? Greenwashing environmental sustainability in Formula One and Formula E. Ann. Leis. Res. 2025, 28, 116–135. [Google Scholar] [CrossRef]
  5. Öztopcu, A. Environmental sustainability in sport: Formula 1’s SDGs responsiveness. Environ. Dev. Sustain. 2024, 26, 31075–31097. [Google Scholar] [CrossRef]
  6. Fédération Internationale de l’Automobile. FIA Environmental Strategy 2020–2030: Summary. Available online: https://www.fia.com/action-environment (accessed on 9 February 2025).
  7. Fédération Internationale de l’Automobile (FIA). FIA Environmental Report 2023: Based on Results Achieved in 2022; FIA: Geneva, Switzerland, 2023. [Google Scholar]
  8. Fédération Internationale de l’Automobile (FIA). FIA Environmental Accreditation Programme Guidelines (Version 1); FIA: Geneva, Switzerland, 2020. [Google Scholar]
  9. Chen, W.; Wu, X. Evaluating Effectiveness of Low-Carbon Transition Policy Mix Based on Urban Private Car Trajectory Data. Sci. Program. 2022, 2022, 4702095. [Google Scholar] [CrossRef]
  10. Ferrer, A.L.C.; Thomé, A.M.T. Carbon Emissions in Transportation: A Synthesis Framework. Sustainability 2023, 15, 8475. [Google Scholar] [CrossRef]
  11. Xu, X.; Du, H.; Lian, Z. Discussion on Regression Analysis with Small Determination Coefficient in Human-Environment Researches. Indoor Air 2022, 32, e13117. [Google Scholar] [CrossRef]
  12. Jing, Q.-L.; Liu, H.-Z.; Yu, W.-Q.; He, X. The Impact of Public Transportation on Carbon Emissions—From the Perspective of Energy Consumption. Sustainability 2022, 14, 6248. [Google Scholar] [CrossRef]
  13. Guo, L.; Chen, B.; Zhang, H.; Xu, G.; Lu, L.; Lin, X.; Kong, Y.; Wang, F.; Li, Y. Improving PM2.5 Forecasting and Emission Estimation Based on the Bayesian Optimization Method and the Coupled FLEXPART-WRF Model. Atmosphere 2018, 9, 428. [Google Scholar] [CrossRef]
  14. Cui, X.; Zhao, K.; Zhou, Z.; Huang, P. Examining the uncertainty of carbon emission changes: A systematic approach based on peak simulation and resilience assessment. Environ. Impact Assess. Rev. 2021, 91, 106667. [Google Scholar] [CrossRef]
  15. Kafle, S.C. Correlation and Regression Analysis Using SPSS. OCEM J. Manag. Technol. Soc. Sci. 2019, 1, 125–132. [Google Scholar]
  16. Esakki, N. Environmental Economics and Statistical Modeling: An SPSS-Based Approach. Trends Financ. Econ. 2025, 3, 63–75. [Google Scholar]
  17. Holzbecher, E. Environmental Modeling: Using MATLAB®, 2nd ed.; Springer: Berlin, Germany, 2012; pp. 1–450. [Google Scholar] [CrossRef]
  18. Tang, J.; Yang, Y.; Li, L.; Dong, K.; Yu, W.; Yang, X.; Zhang, X. Scenario analysis of transportation carbon emissions in China based on machine learning and deep neural network models. Environ. Res. Lett. 2023, 18, 064018. [Google Scholar] [CrossRef]
  19. Alhindawi, R.; Abu Nahleh, Y.; Kumar, A.; Shiwakoti, N. Projection of Greenhouse Gas Emissions for the Road Transport Sector Based on Multivariate Regression and the Double Exponential Smoothing Model. Sustainability 2020, 12, 9152. [Google Scholar] [CrossRef]
  20. Javanmard, M.E.; Tang, Y.; Wang, Z.; Tontiwachwuthikul, P. Forecast energy demand, CO2 emissions and energy resource impacts for the transportation sector. Appl. Energy 2023, 338, 120830. [Google Scholar] [CrossRef]
  21. Fédération Internationale de l’Automobile. Appendix 1—FIA Sustainability Report. Available online: https://sustainabilityreport.fia.com/appendices/appendix-1/ (accessed on 9 February 2025).
  22. Fédération Internationale de l’Automobile. Appendix 2—FIA Sustainability Report. Available online: https://sustainabilityreport.fia.com/appendices/appendix-2/ (accessed on 9 February 2025).
  23. Fédération Internationale de l’Automobile. FIA Activity Reports. Available online: https://www.fia.com/fia-activity-reports (accessed on 9 February 2025).
  24. IBM Corp. IBM SPSS Statistics for Windows, Version 25.0; IBM Corp: Armonk, NY, USA, 2022. [Google Scholar]
  25. Field, A. Discovering Statistics Using IBM SPSS Statistics, 4th ed.; SAGE Publications: Thousand Oaks, CA, USA, 2013. [Google Scholar]
  26. Shrestha, N. Detecting Multicollinearity in Regression Analysis. Am. J. Appl. Math. Stat. 2020, 8, 39–42. [Google Scholar] [CrossRef]
  27. Stataiml. Thresholds for Detecting Multicollinearity. Available online: https://stataiml.com/posts/60_multicollinearity_threshold_ml/ (accessed on 5 July 2024).
  28. MathWorks. MATLAB R2024b. 2024. Available online: https://www.mathworks.com/products/new_products/latest_features.html (accessed on 9 February 2025).
  29. Kumari, S.; Singh, S.K. Machine learning-based time series models for effective CO2 emission prediction in India. Environ. Sci. Pollut. Res. 2023, 30, 116601–116616. [Google Scholar] [CrossRef]
  30. Rahaman, S.U.; Abdul, M.J. Quantifying uncertainty in economics policy predictions: A Bayesian & Monte Carlo based data-driven approach. Int. Rev. Financ. Anal. 2025, 102, 104157. [Google Scholar] [CrossRef]
  31. Akter, J. Bootstrapped Durbin-Watson Test of Autocorrelation for Small Samples. ABC J. Adv. Res. 2014, 3, 68–72. [Google Scholar] [CrossRef]
  32. Grace-Martin, K.; Interpreting the Intercept in a Regression Model. The Analysys Factor. Available online: https://www.theanalysisfactor.com/interpreting-the-intercept-in-a-regression-model/ (accessed on 21 December 2022).
  33. Cooper, J.A.; McCullough, B.P. Bracketing sustainability: Carbon footprinting March Madness to rethink sustainable tourism approaches and measurements. J. Clean. Prod. 2021, 318, 128475. [Google Scholar] [CrossRef]
  34. Osner, O. F1 and Sustainability—How can a Motorsport Exist in a Climate-Friendly World? Sports Analytics Group Berkeley. Available online: https://sportsanalytics.studentorg.berkeley.edu/articles/f1-sustainability.html (accessed on 17 May 2024).
  35. Mathison, C.; Burke, E.J.; Munday, G.; Jones, C.D.; Smith, C.J.; Steinert, N.J.; Wiltshire, A.J.; Huntingford, C.; Kovacs, E.; Gohar, L.K.; et al. A rapid-application emissions-to-impacts tool for scenario assessment: Probabilistic Regional Impacts from Model patterns and Emissions (PRIME). Geosci. Model Dev. 2025, 18, 1785–1808. [Google Scholar] [CrossRef]
  36. Lye, Y.X.; Chew, Y.E.; Foo, D.C.Y.; How, B.S.; Andiappan, V. Carbon emission reduction strategy planning and scheduling for transitioning process plants towards net-zero emissions. RSC Sustain. 2024, 3, 929–945. [Google Scholar] [CrossRef]
  37. Rottoli, M.; Dirnaichner, A.; Kyle, P.; Baumstark, L.; Pietzcker, R.; Luderer, G. Coupling a Detailed Transport Model to the Integrated Assessment Model REMIND. Environ. Model. Assess. 2021, 26, 891–909. [Google Scholar] [CrossRef]
  38. Speizer, S.; Fuhrman, J.; Lopez, L.A.; George, M.; Kyle, P.; Monteith, S.; McJeon, H. Integrated assessment modeling of a zero-emissions global transportation sector. Nat. Commun. 2024, 15, 4439. [Google Scholar] [CrossRef] [PubMed]
  39. Fédération Internationale de l’Automobile (FIA). FIA sustainability and D&I Report 2023; FIA: Geneva, Switzerland, 2023. [Google Scholar]
  40. Bryce, K.; Hunter, K.L. Enhancing climate change planning and adaptive management in marine protected areas through targets, thresholds, and social-ecological objectives. Front. Mar. Sci. 2024, 11, 1339871. [Google Scholar] [CrossRef]
  41. Martin, G.M.; Frazier, D.T.; Loaiza-Maya, R.; Huber, F.; Koop, G.; Maheu, J.; Nibbering, D.; Panagiotelis, A. Bayesian Forecasting in the 21st Century: A Modern Review (Working Paper No. 01/23); Monash University, Department of Econometrics and Business Statistics: Melbourne, Australia, 2023. [Google Scholar]
  42. Chen, W.; Men, Y.; Fuster, N.; Osorio, C.; Juan, A.A. Artificial Intelligence in Logistics Optimization with Sustainable Criteria: A Review. Sustainability 2024, 16, 9145. [Google Scholar] [CrossRef]
  43. Wulandari, R.S.; Cahyadi, T.; Winarno, W.; Harianto, B.B. Exploring a decade of maritime transportation studies: Trends and developments. Int. J. Innov. Res. Sci. Stud. 2025, 8, 3807–3819. [Google Scholar] [CrossRef]
  44. Xuan, S.; Zhou, Z.-K.; Zhou, J.-X.; Xia, Q.-F.; Qin, Y.-N.; Wu, J.-P. The Impact of Sporting Events on Carbon Emissions and the Emission Reduction Measures: A Systematic Review from 2019 to 2024. Pol. J. Environ. Stud. 2025, 34, 1–15. [Google Scholar] [CrossRef]
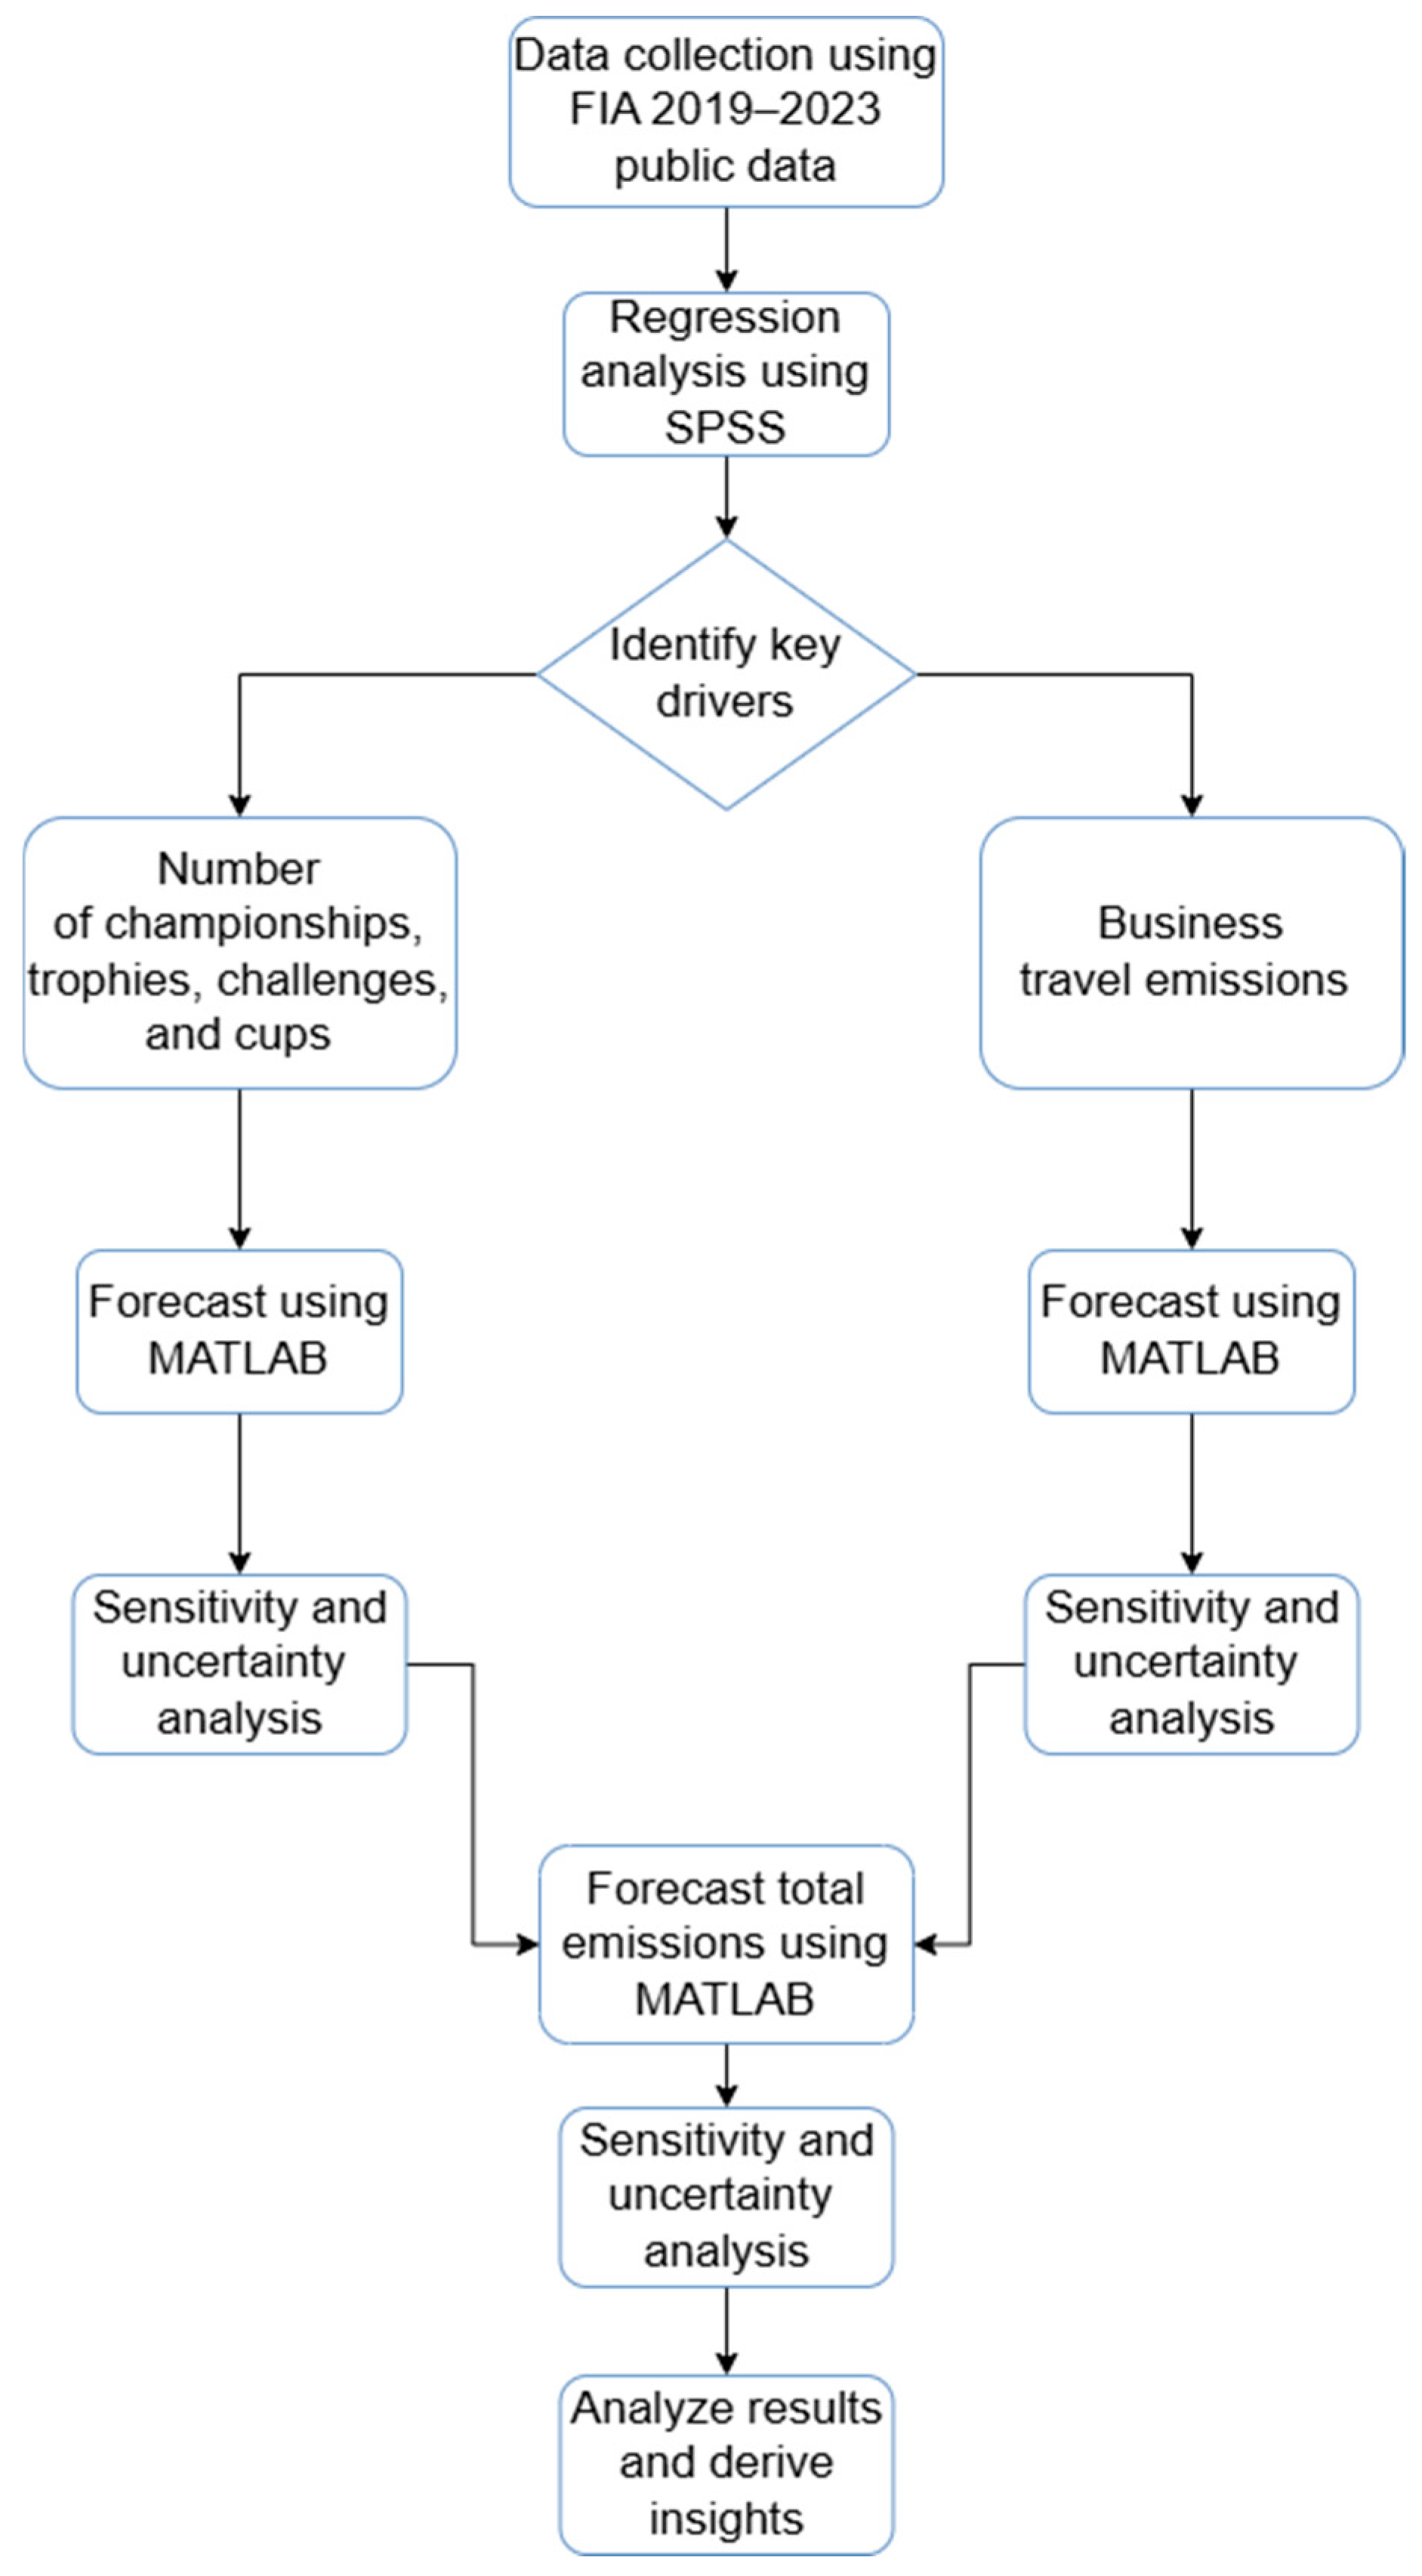
Figure 1. Research conceptual framework.
Sustainability 17 10633 g001
Figure 2. Scatterplot of total emissions against the number of championships, trophies, challenges, and cups.
Sustainability 17 10633 g002
Figure 3. Scatterplot of total emissions against business travel emissions.
Sustainability 17 10633 g003
Figure 4. Projected number of championships, trophies, challenges, and cups.
Sustainability 17 10633 g004
Figure 5. Projected business travel emissions.
Sustainability 17 10633 g005
Figure 6. Projected total emissions.
Sustainability 17 10633 g006
Figure 7. FIA total emissions trajectory [39].
Sustainability 17 10633 g007
Table 1. Regression results predicting total emissions.
PredictorBSEtp
(Intercept)564.45806.880.700.535
Business Travel Emissions1.3340.06719.88<0.001
Note: Model R2 = 0.992, F(1,3) = 395.00, Durbin–Watson = 1.727.
Table 2. Multiple linear regression model predicting total emissions.
PredictorBSEtp
(Intercept)254.451613.800.160.889
Number of Championships, Tro-phies, Challenges, and Cups3.0312.590.240.832
Business Travel Emissions1.300.177.820.016
Note: R2 = 0.993, Adjusted R2 = 0.985, F(2, 2) = 135.52, p = 0.007; Durbin–Watson = 2.012. Dependent Variable: Total Emissions.
Disclaimer/Publisher’s Note: The statements, opinions and data contained in all publications are solely those of the individual author(s) and contributor(s) and not of MDPI and/or the editor(s). MDPI and/or the editor(s) disclaim responsibility for any injury to people or property resulting from any ideas, methods, instructions or products referred to in the content.