Article

Source Identification of PM2.5 and Organic Carbon During Various Haze Episodes in a Typical Industrial City by Integrating with High-Temporal-Resolution Online Measurements of Organic Molecular Tracers

1
School of Environmental and Chemical Engineering, Shanghai University, Shanghai 200444, China
2
The Joint Graduate School of Energy and Environment, King Mongkut’s University of Technology Thonburi, Bangkok 10140, Thailand
*
Authors to whom correspondence should be addressed.
These authors contributed equally to this work.
Sustainability 2025, 17(23), 10587; https://doi.org/10.3390/su172310587
Submission received: 27 September 2025 / Revised: 21 November 2025 / Accepted: 22 November 2025 / Published: 26 November 2025

Abstract

Achieving sustainable air quality improvements in rapidly industrializing regions requires a clear understanding of the emission sources that drive the formation of PM2.5 pollution. This study identified the sources of PM2.5 and its organic carbon (OC) in Zibo, a typical industrial city in Northern China Plain, using the Positive Matrix Factorization (PMF) model during five pollution episodes (P1–P5) from 26 November 2022 to 9 February 2023. A high-temporal-resolution online observation of 61 organic molecular tracers was conducted using an Aerodyne TAG stand-alone system combined with a gas chromatograph–mass spectrometer (TAG-GC/MS) system. The results indicate that during pollution episodes, PM2.5 was contributed by 32.4% from coal combustion and 27.1% from inorganic secondary sources. Moreover, fireworks contributed 13.1% of PM2.5, primarily due to the extensive fireworks during the Gregorian and Lunar New Year celebrations. Similarly, coal combustion was the largest contributor to OC, followed by mobile sources and secondary organic aerosol (SOA) sources, accounting for 16.2% and 15.3%, respectively. Although fireworks contributed significantly to PM2.5 concentrations (31.6% in P4 of 20–24 January 2023), their impact on OC was negligible. Overall, a combination of local and regional industrial combustion emissions, mobile sources, extensive residential heating during cold weather, and unfavorable meteorological conditions led to elevated secondary aerosol concentrations and the occurrence of this haze episode. The high-temporal-resolution measurements obtained using the TAG-GC/MS system, which provided more information on source-indicating organic molecules (tracers), significantly enhanced the source apportionment capability of PM2.5 and OC. The findings provide science-based evidence for designing more sustainable emission control strategies, highlighting that the coordinated management of coal combustion, mobile emissions, and wintertime heating is essential for long-term air quality and public health benefits.

1. Introduction

Clean air is a prerequisite for sustainable environmental development; however, rapid urbanization and large-scale industrial activities have led to haze pollution characterized by high concentrations of fine paniculate matter (PM2.5, particles with an aerodynamic diameter of less than 2.5 μm), which has become one of China’s most pressing environmental issues [1,2]. PM2.5 not only significantly reduces visibility [3], but its fine particle size also enables it to penetrate deep into the respiratory tract, triggering respiratory and cardiovascular diseases [4]. Therefore, reducing PM2.5 concentrations is crucial for protecting public health and promoting sustainable environmental development.
To curb the trend of air pollution, China has successively issued policy documents since 2013, including the Air Pollution Prevention and Control Action Plan, the 13th Five-year Comprehensive Work Plan for Energy Conservation and Emission Reduction, and the Three-Year Action Plan to Win the Battle for a Blue Sky. Various provinces and cities have implemented corresponding control measures, resulting in continuous improvements in air quality, with a significant decrease in national PM2.5 concentrations [5,6]. However, PM2.5 exceedance episodes still occur frequently [7], and current concentration levels remain far above the annual guideline value recommended by the WHO Global Air Quality Guidelines.
The Action Plan for Continuous Air Quality Improvement released by the State Council in 2023 explicitly identifies PM2.5 reduction as the central task for achieving sustained air quality improvement. Furthermore, the Opinions of the CPC Central Committee and the State Council on Comprehensively Advancing the Construction of a Beautiful China issued in 2024 sets a clear target of reducing the national annual average PM2.5 concentration to below 28 μg/m3 by 2027. These increasingly stringent national air-quality requirements impose substantial and sustained pressure on many Chinese cities to further reduce PM2.5 concentrations.
In northern Chinese cities, the widespread use of household coal for winter heating adds substantially to baseline emissions. Combined with stagnant winter meteorological conditions that hinder pollutant dispersion, these factors contribute to frequent haze episodes characterized by elevated PM2.5 concentrations, particularly in the Beijing–Tianjin–Hebei region and the surrounding “2 + 36” cities [6,7]. Conducting PM2.5 source apportionment studies in typical cities of this region to quantitatively identify the sources of high concentrations of PM2.5 provides crucial support for the government in formulating PM2.5 emission reduction decisions, and is of great academic and practical significance.
The primary objective of this study is to perform high-time-resolution online measurements of organic tracer molecules in Zibo, a representative industrial city in northern China, and to identify the sources of atmospheric PM2.5 during pollution episodes using Positive Matrix Factorization (PMF) modeling and backward trajectory analysis. The findings aim to provide scientific and technological support for informed decision-making in PM2.5 pollution prevention and control.

2. Literature Review

Organic aerosol (OA) is an important component of PM2.5, accounting for 20% to 80% of PM2.5 under heavy pollution conditions [8,9]. It can have adverse effects on the atmospheric environment, human health, and climate [10]. OA has a complex composition and a wide range of sources, and some organic components can serve as indicators of specific pollution sources. For example, levoglucosan and mannosan, which are sugars, can indicate biomass burning [11,12], while hopanes can indicate emissions from motor vehicles [13,14]. Therefore, accurate identification of the chemical composition and source of organic aerosols in PM2.5 is essential for the development of effective fine pollution control strategies.
Traditional studies of organic aerosols have primarily relied on offline filter-based sampling followed by laboratory analysis [15], which involves a considerable time lag and limits the ability to capture real-time emission sources or track aerosol evolution [16]. While aerosol mass spectrometer (AMS) provides high-temporal-resolution measurements of major organic compounds, it cannot accurately quantify individual organic tracers [17,18]. The thermal desorption aerosol gas chromatography-mass spectrometry system (TAG-GC/MS), developed by Professor Goldstein’s research group at the University of California, Berkeley, addresses this limitation by enabling online, hourly resolution observation of individual organic molecular tracers in atmospheric PM2.5 [18,19,20]. The adoption of TAG-GC/MS has significantly advanced PM2.5 source identification, allowing for detailed characterization of individual tracers during pollution episodes, thereby providing a powerful tool for elucidating the sources of urban and industrial aerosols.
In recent years, TAG has attracted increasing attention in the study of organic molecular tracers, making it possible to analyze the sources of these tracers at an hourly temporal resolution. For instance, He et al. [18] applied TAG-GC/MS to investigate OA tracers in urban Shanghai and concluded that SOA formation was more pronounced during pollution episodes. Future more, Li et al. [21] conducted the source apportionment analysis based on Molecular Marker-based Positive Matrix Factorization (MM-PMF) with TAG-GC/MS measurements with auxiliary data and found that the contribution of SOA to PM2.5 increased significantly during the observation period in Shanghai. Current studies utilizing TAG for online measurements of organic molecular tracers in urban environments have primarily focused on the impacts of sources such as traffic emissions, cooking, and biomass burning [18,22,23]. This significantly enhances the efficiency of collecting and analyzing organic molecular tracers in PM2.5, which is crucial for tracer analysis and precise pollution source tracing.
Zibo City, situated in central Shandong Province, is a typical industrial city on the North China Plain, primarily dominated by energy-intensive and high-emission sectors such as thermal power, petrochemical industry, material manufacturing, chemical production, and glass manufacturing [24]. The terrain is higher in the south and lower in the north, surrounded on three sides by mountains, with prevailing northwest winds in winter. The city’s unique industrial structure, geographical location, and climatic characteristics contribute to frequent pollution episodes during winter [25]. Using Zibo as a case study, gaining a deeper understanding of the sources of PM2.5 and its organic carbon (OC) is crucial for developing effective emission control strategies to mitigate PM2.5 pollution for industrial cities.
In this study, a TAG-GC/MS system was used to measure organic molecular tracers, and supplemented by other PM2.5 chemical composition data (e.g., soluble ions, elemental carbon/organic carbon (OC/EC)), a Positive Matrix Factorization (PMF) model and back trajectory clustering analysis (Hybrid single-particle Lagrangian integrated trajectory, HYSPLIT) were used to conduct an in-depth source analysis of PM2.5 during five pollution episodes that occurred in Zibo City. The aim is to enhance the understanding of the fine sources of PM2.5 and its components, especially OC, in a typical industrial city, providing scientific support for targeted PM2.5 pollution prevention and control, especially for firework control policies during the Spring Festival, and offering a reference for other similar industrial cities.

3. Methodology

3.1. Technical Framework

Figure 1 illustrates the overall technical framework of this study. Measurements of organic molecular markers were performed using an Aerodyne TAG standalone system coupled with a gas chromatograph-mass spectrometer (GC-MS; Agilent GC 7890B/MS 5977B, Agilent, CA, USA). To ensure the comprehensiveness and reliability of PM2.5 component detection, PM2.5 mass concentrations were reconstructed based on chemical speciation. During the observational period, five distinct pollution episodes (designated P1–P5) were identified in Zibo City. The PMF receptor model was applied to identify and quantify sources of PM2.5, and backward air trajectory clustering was conducted using the Hybrid Single-Particle Lagrangian Integrated Trajectory (HYSPLIT) model to investigate potential transport pathways.

3.2. The Descriptions of the Observation Station

The observations were conducted at the Super Observation Station, in suburban Zibo City, Shandong Province (36.84° N, 118.13° E). The station is situated approximately 25 m above ground and about 1.6 m above the rooftop. It is surrounded by a gas station (∼210 m west), Lutai Avenue (∼100 m south), Lushan Avenue (∼500 m east), and residential housing (∼1 km north), as shown in Figure 2. The area surrounding the observation station is predominantly covered by vegetation, primarily consisting of deciduous broadleaf species. It is also surrounded by a considerable number of industrial zones, residential areas, and a school.

3.3. Measurements of Organic Molecules and Other Species

The measurements of Organic molecules were conducted using an Aerodyne TAG stand-alone system combined with a gas chromatograph-mass spectrometer (GC-MS) (Agilent GC 7890B/MS 5977B, Agilent, CA, USA) from 26 November 2022, to 9 February 2023, with a frequency of every two hours. Each session lasted 45 min, resulting in a total of 747 valid data sets being collected throughout the observation period. A small portion of the data was missing due to factors such as internal and external calibration of the instruments, derivatization reagent injections, blank sample tests, and power outages at the observation station.
TAG-GC/MS was employed to measure the concentration of molecular organic compounds with a two-hourly resolution. The instrument’s operating cycle consists of four main stages: sampling and GC/MS analysis, loading and injection of standard solution, thermal desorption and derivatization, and blowback. The specific operation process of the instrument is shown in Figure S1. The TAG sampling head functioned as a cyclone separator with a PM2.5 cutting head. The particulate matter samples were collected into the TAG-GC/MS system pipeline at a flow rate of 5 L/min through the cyclone separator, and the gaseous VOCs were removed through a filter to ensure the phase separation. The collected particulate matter is then directed into a 9-hole nozzle impactor and a Collection and Thermal Desorption (CTD) unit. After thermal desorption, in situ derivatization occurred in a helium gas flow saturated with derivatization reagents. The analyte was subsequently re-concentrated into a 45 °C focusing trap, which was then heated to 315 °C before being transferred to a gas chromatography column with a carrier gas, followed by detection using GC/MS. Each GC/MS analysis lasted 60 min. At the same time, CTD collected the following environmental samples. It should be noted that in this study, TAG collected samples and performed analysis only during even hours, meaning organic molecules were measured at 2 h intervals, whereas the online instruments for other species were with hourly resolution.
In this study, in addition to online measurements of organic molecule concentrations, data from other online instruments at the super observatory were also used, including PM2.5 and its components. PM2.5 concentration data were obtained using the Thermo 5014i Beta environmental particulate continuous monitoring instrument manufactured by Thermo Fisher Scientific with one-hourly resolution (beta-attenuation principle, flow rate 16.67 L/min, detection limit: <1 μg/m3 over 24 h); the concentrations of inorganic water-soluble ion components in PM2.5 were measured by the In situ Gas and Aerosol Compositions Monitor (IGAC, S-611-191003) with one-hourly resolution (Ion chromatography, Relative standard deviation ≤ 3%, detection limit: ≤ 0.002 μg/m3); the concentrations of carbonaceous components in PM2.5 were measured using the Atmospheric OC/EC online analyzer (ECOC-610) with one-hourly resolution (Based on the principle of thermophotometry method, combined with NDIR measurement technology); the monitoring instrument for metal and non-metal elements in PM2.5 was the HMCA-3200 Atmospheric Heavy Metal Automatic Monitoring System with one-hourly resolution (X-ray Fluorescence Spectrometry).

3.4. PM2.5 Mass Reconstruction

To ensure the comprehensiveness and reliability of PM2.5 component detection, the IMPROVE method [26] was used for reconstructing PM2.5 mass concentrations. On the basis of the existing methods, combined with the environmental and pollution characteristics of the observation location, The PM2.5 mass concentrations were reconstructed based on the following chemical components: crustal materials, nitrates, sulfates, ammonium, organic matter (OM), elemental carbon (EC), chloride (Cl), other elements (OE), and other ions (OI). Since the total OM concentration could not be directly measured in this study, it was estimated by multiplying OC by a correction factor (CFoc). The CFoc value used was 1.93, based on the average values in suburban and urban areas of the North China Plain during the autumn and winter seasons [27]. The content of crustal materials was calculated based on the relative abundance of each element in the Earth’s crust. The formula for calculating the reconstructed PM2.5 mass concentration is as follows:
Crustal = 2.20 × [Al] + 2.49 × [Si] + 1.63 × [Ca] + 2.42 × [Fe] + 1.94 × [Ti]
RePM2.5 = [Crustal] + [NO3] + [SO42−] + [NH4+] + 1.93 × [OC] + [EC] + [CI-] + [OE] + [OI]
The results showed that the correlation between observed PM2.5 and reconstructed quality reached 0.95 (Figure S1), and organic matter (OM) accounted for 24% of the total mass of PM2.5 (Figure S2).

3.5. PMF Model

The PMFv5.0 receptor model was used to analyze the sources of PM2.5 in Zibo City during the observation period. The PMF model is a multivariate statistical analysis method that estimates the composition of pollution sources and their contributions to the environmental concentration of pollutants based on a large amount of observational data from receptor sites. The principle of PMF is based on the assumptions of mass conservation and chemical mass balance between emission sources and receptors, quantifying the contribution of sources to the concentration of air pollutants at receptor monitoring stations. This method has the advantage of not requiring prior input of source profile information and has been widely applied in studies of atmospheric PM2.5 source apportionment [28]. The mathematical expression of the PMF model is as follows:
X i j = K = 1 P G i k × F k j × E i j
In the equation, Xij represented the measured concentration of the j component in the i sample, Gik denoted the contribution of the k pollution source in the i sample, Fkj indicated the concentration of the j component from the k pollution source, Eij was the residual between the measured concentration of the j component in the i sample and its analytical value, and P was the number of sources.
The PMF model determined the number of pollution source factors and the contribution profile of pollution sources by seeking the solution that minimizes the objective function Q.
Q = i = 1 n j = 1 m ( E i j U i j ) 2
In the formula, Uij represents the uncertainty of the j-th component in the i-th sample, and its value was calculated using the following formula based on species concentration (c), method detection limit (MDL), and analytical error (EF). In this study, the EF values for observed species in the PMF model were set between 0.1 and 0.3. Furthermore, missing values of species were replaced by the median of the target substance, with their uncertainty assigned as four times the species mean; for data below the MDL, half of the MDL value was used for substitution, and the corresponding uncertainty was calculated as five-sixths of the MDL. To maintain consistency in the temporal resolution of the PMF model input data, the concentrations of Tag-based molecular tracers and other PM2.5 chemical components were standardized to a 2 h interval.

3.6. Trajectory Statistics Model and Backward Trajectory Cluster

A clustering analysis of the backward airflow trajectories in Zibo City during the observation period was conducted using the Hybrid Single-Particle Lagrangian Integrated Trajectory Model (HYSPLIT). The location of the observation station was set as the endpoints for the backward trajectories, and the height of the trajectory endpoints was set at 500 m. The meteorological data utilized in this analysis were sourced from the Global Data Assimilation System (GDAS) provided by the National Centers for Environmental Prediction (NCEP). The backward trajectory calculations were conducted every hour of every day for 48 h, and a clustering analysis was performed based on the length and angle of all simulated backward trajectories [21,29].

4. Results

4.1. Concentrations of PM2.5 Components

During the entire observation period, the air quality in Zibo City was categorized as follows: 6 days of excellent, 42 days of good, 19 days of light pollution, 6 days of moderate pollution, and 7 days of heavy pollution. The primary pollutant during the pollution periods was PM2.5. During the entire observation period, the hourly concentration of PM2.5 ranged from 4 to 416 μg/m3, with an average concentration of 70 ± 59 μg/m3, indicating the high PM2.5 concentration levels. Among the main components of PM2.5, secondary inorganic ions accounted for the highest proportion (about 53%), with average concentrations of NO3 at 15.0 ± 15.4 μg/m3, SO42− at 9.4 ± 9.8 μg/m3, and NH4+ at 11.1 ± 10.3 μg/m3. The average concentration of OM was 11.8 ± 7.4 μg/m3. The concentrations of EC, crustal elements, Cl, and other elements were 3.4 ± 2.4 μg/m3, 4.7 ± 5.0 μg/m3, 2.4 ± 3.5 μg/m3, and 1.6 ± 3.5 μg/m3, respectively.
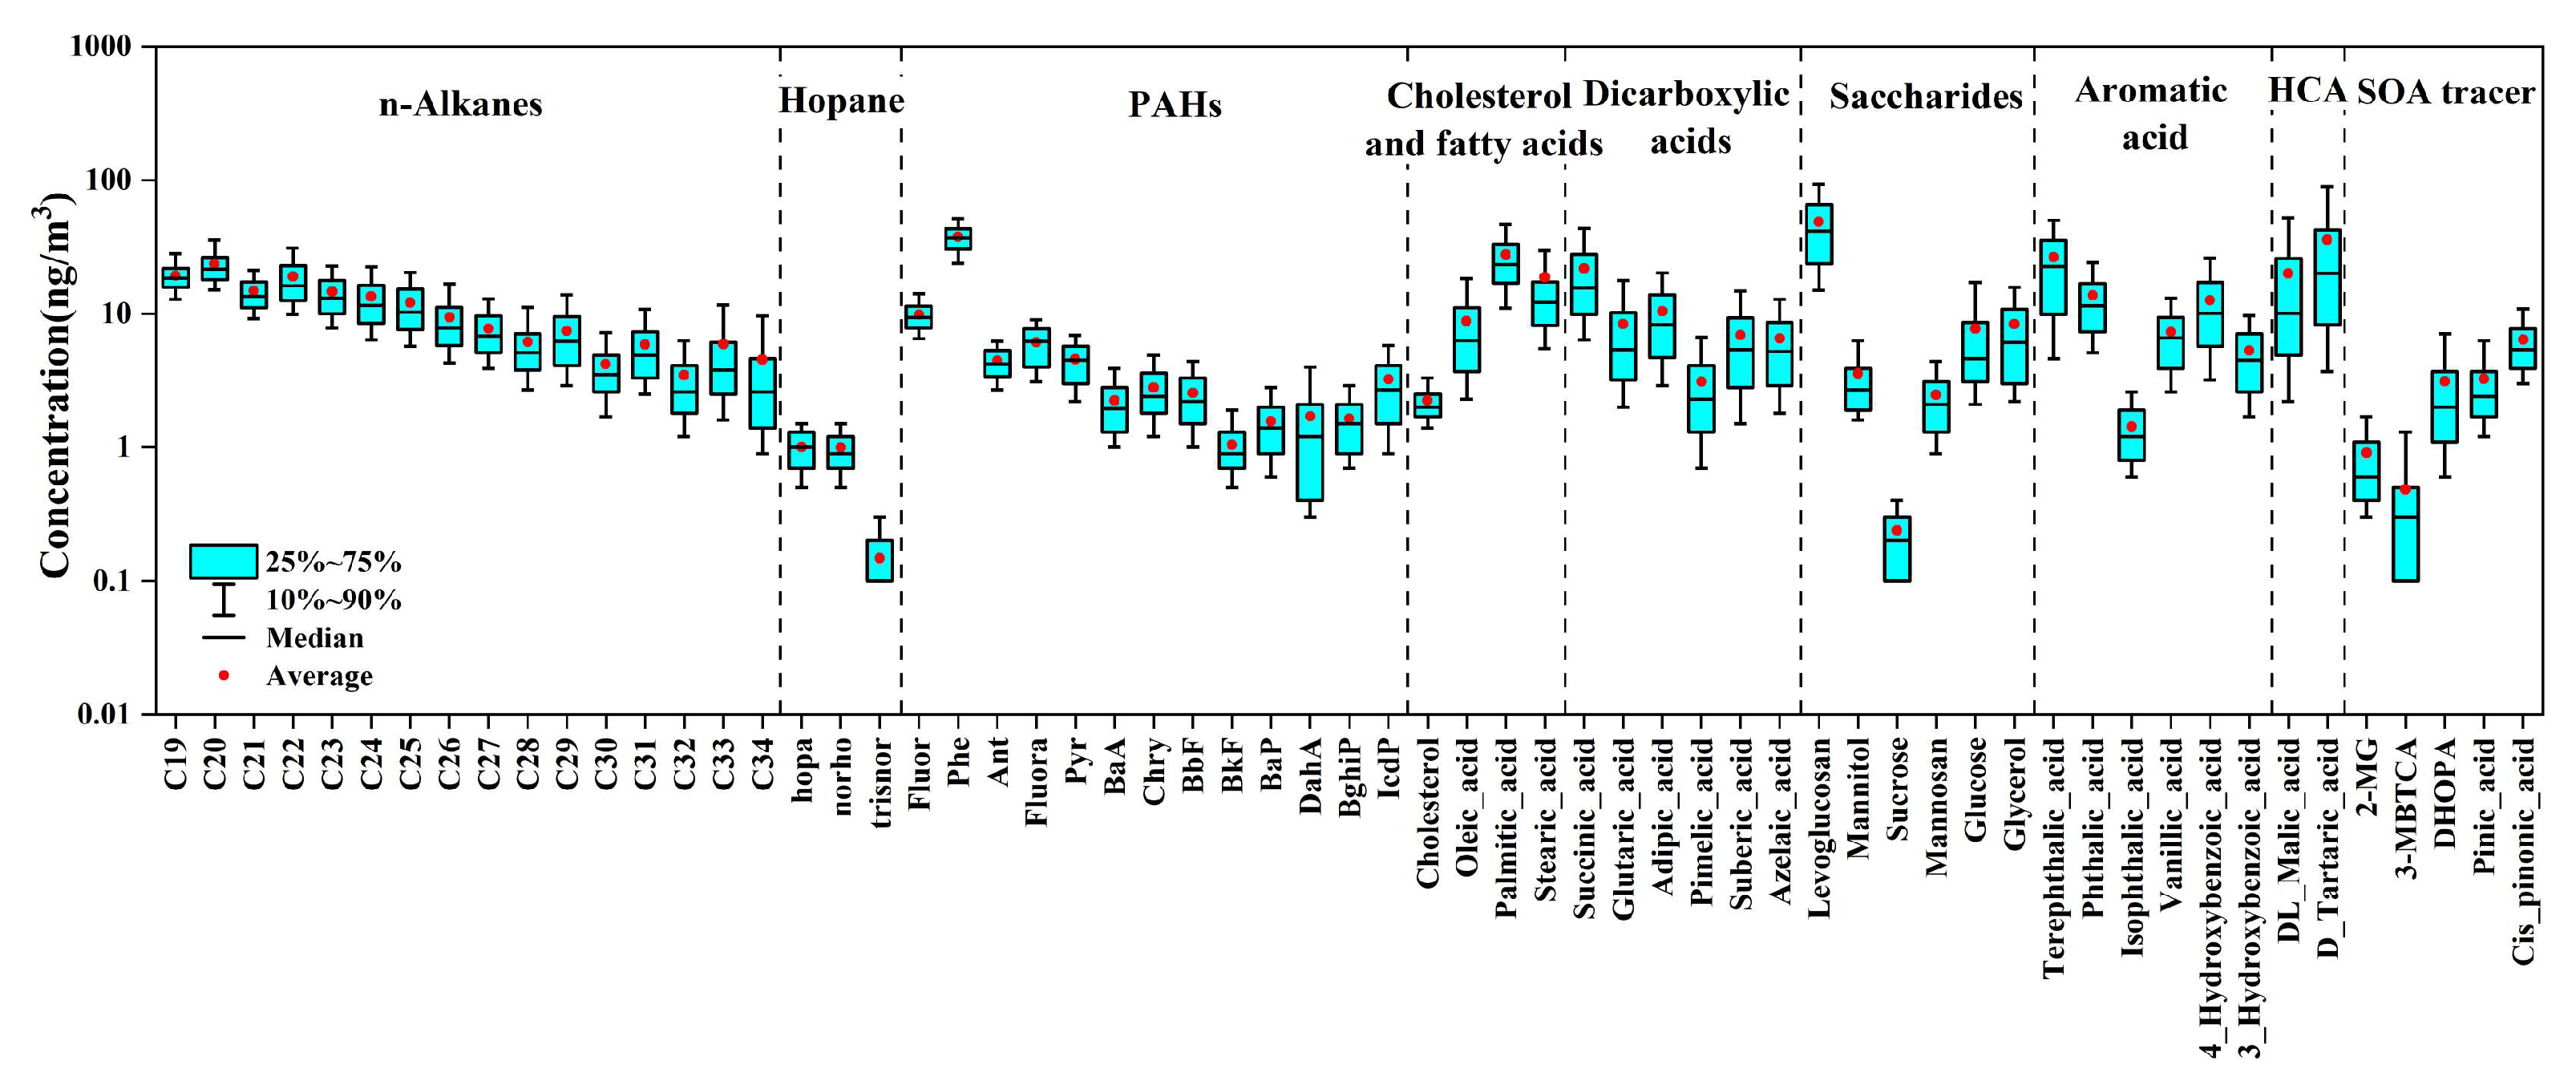
A total of 61 types of organic molecules were measured by the TAG system, which were categorized into nine classes based on their chemical properties. These include 16 types of n-alkanes, 13 types of polycyclic aromatic hydrocarbons (PAHs), four types of cholesterol and fatty acids, six types of dicarboxylic acids, six types of saccharides, six types of aromatic acids, two types of hydroxycarboxylic acids, three types of hopanes, and five types of secondary organic aerosol (SOA) tracers, as shown in Figure 3. The average concentrations of each class of substances are presented in Table 1.

4.2. Concentration Characteristics

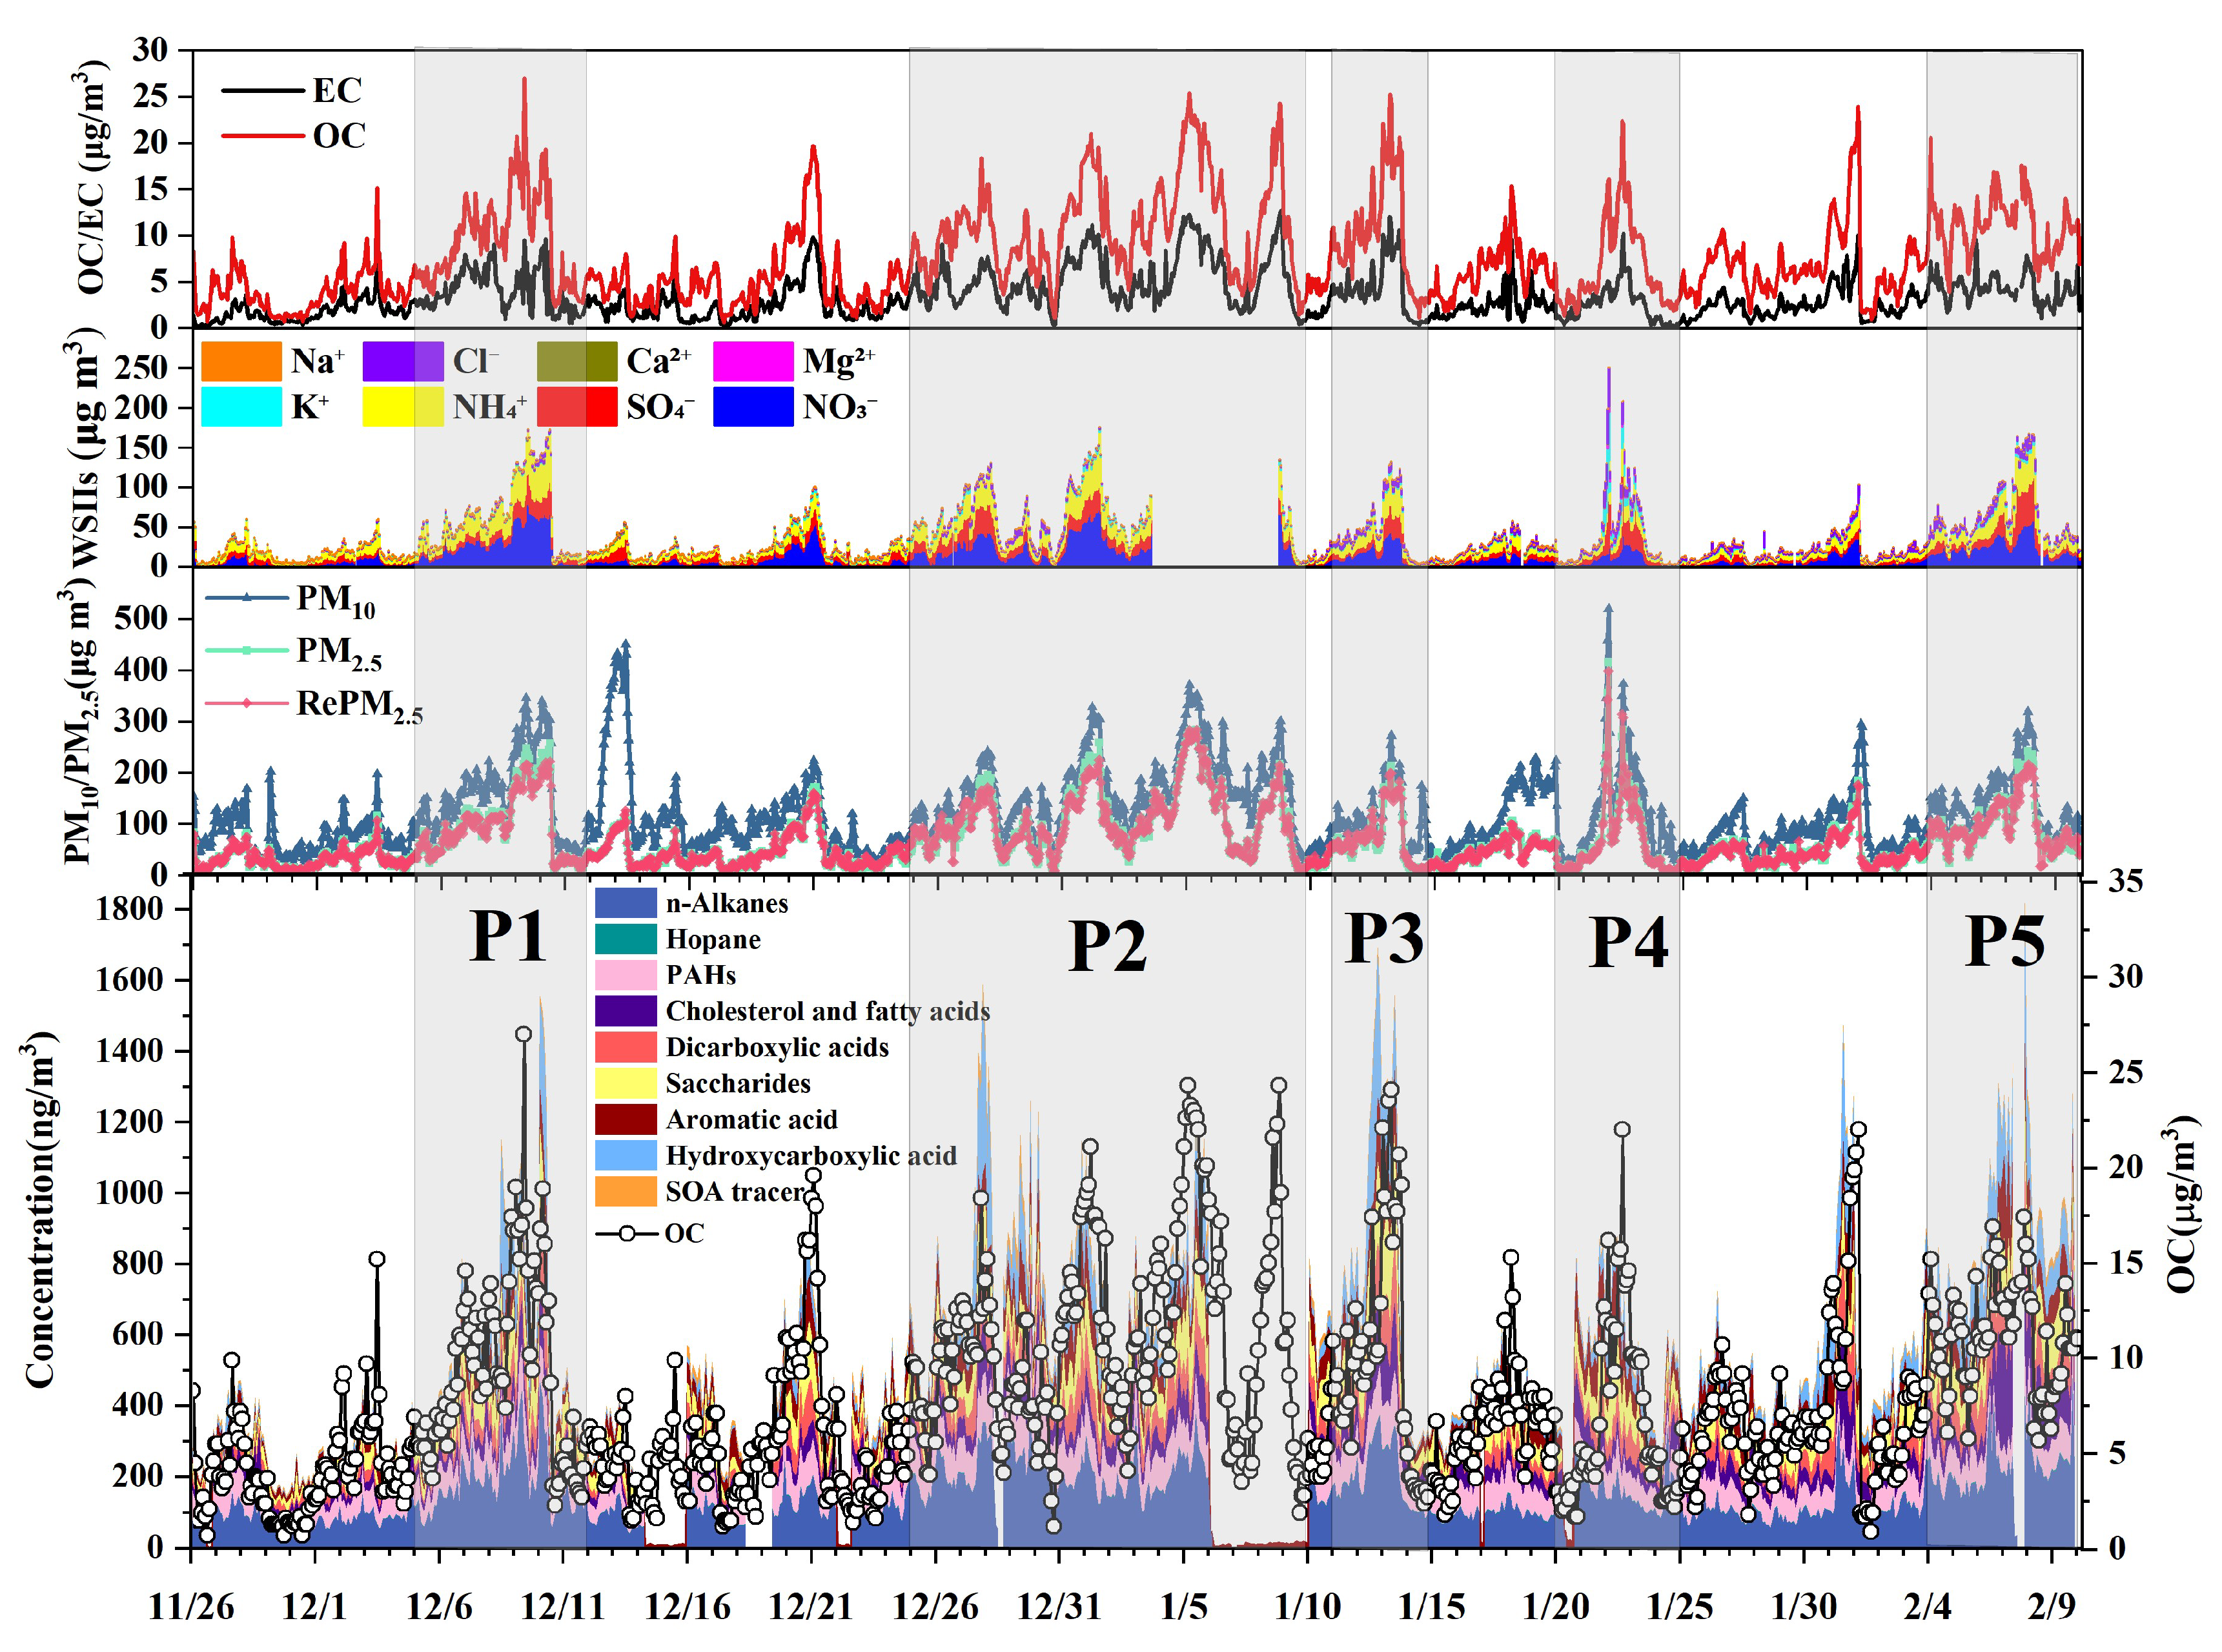
According to the National Ambient Air Quality Standards (NAAQS) of China, a pollution day is defined as one where the daily average concentration of PM2.5 exceeds 75 μg/m3. To better understand the pollution process, consecutive pollution days, along with the day immediately before and after, were grouped and treated as a single pollution episode in this study. As shown in Figure 4, during the observation period, Zibo City experienced five pollution episodes: P1 (5–11 December 2022), P2 (25 December 2022–9 January 2023), P3 (11–14 January 2023), P4 (20–24 January 2023), and P5 (4–9 February 2023). Notably, 22 January 2023, coincided with the Lunar New Year in China, and the following several days were the Chinese New Year holiday.

4.2.1. Inorganic Components

During periods of severe pollution, water-soluble inorganic ions (WSIIs) in PM2.5 are primarily composed of NO3, SO42−, and NH4+, with average concentrations of 15.0 ± 15.4 μg/m3, 9.4 ± 9.8 μg/m3, and 11.1 ± 10.3 μg/m3, respectively. These ions account for 37.4%, 23.5%, and 27.7% of WSIIs. The proportions of these three ions in PM2.5 concentrations are 21.6%, 13.6%, and 16.0% (Figure S2). NO3 has the highest proportion among secondary inorganic salt components in PM2.5 during winter. indicating that NOx emission reduction is crucial for alleviating PM2.5 pollution in the winter months of Zibo. Concentrations of K+, Mg2+, and Cl surge dramatically during the Chinese New Year fireworks period (Figure 4).

4.2.2. Organic Molecule Tracers

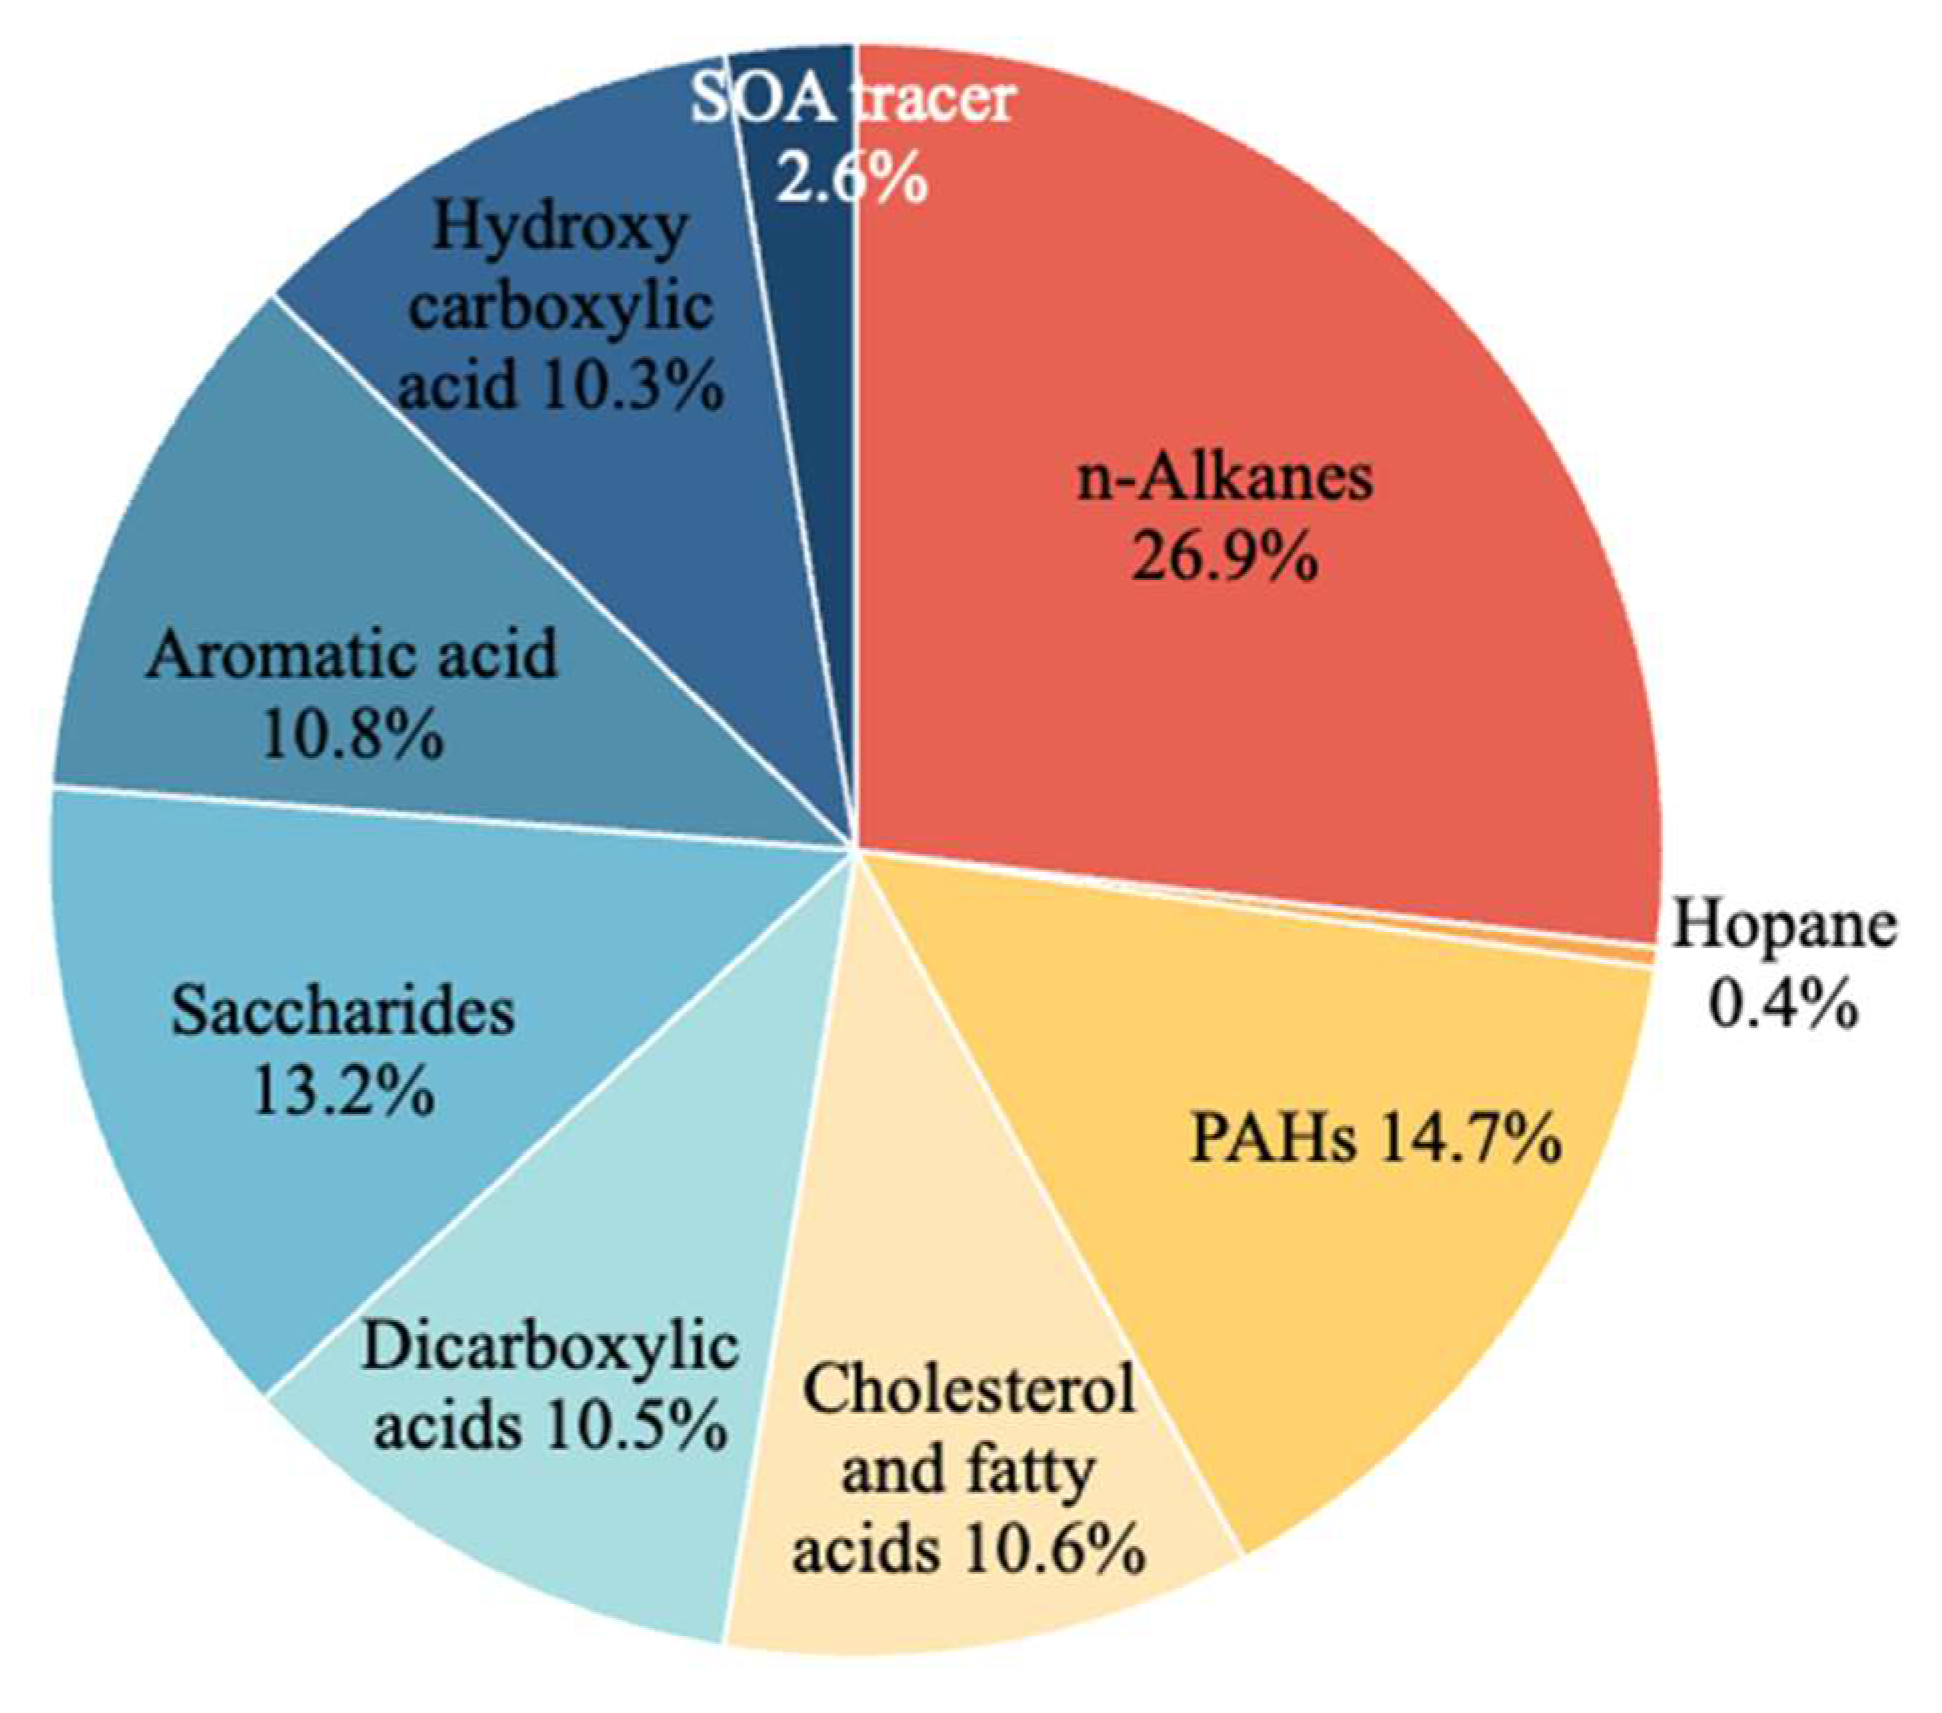
During the observation period, the total concentration of organic molecular tracers in PM2.5 was 659.0 ± 360.8 ng/m3. As shown in Figure 5, the proportions of various types of substances within the total measured organic matter, ranked from highest to lowest, are as follows: C19–C34 n-alkanes (145.7 ng/m3, 26.9%), PAHs (79.5 ng/m3, 14.7%), saccharides (71.2 ng/m3, 13.2%), aromatic acids (58.7 ng/m3, 10.8%), cholesterol and fatty acids (57.4 ng/m3, 10.6%), dicarboxylic acids (56.7 ng/m3, 10.5%), hydroxy carboxylic acids (55.7 ng/m3, 10.3%), secondary organic aerosol tracers (14.1 ng/m3, 2.6%), and hopanes (2.2 ng/m3, 0.4%).
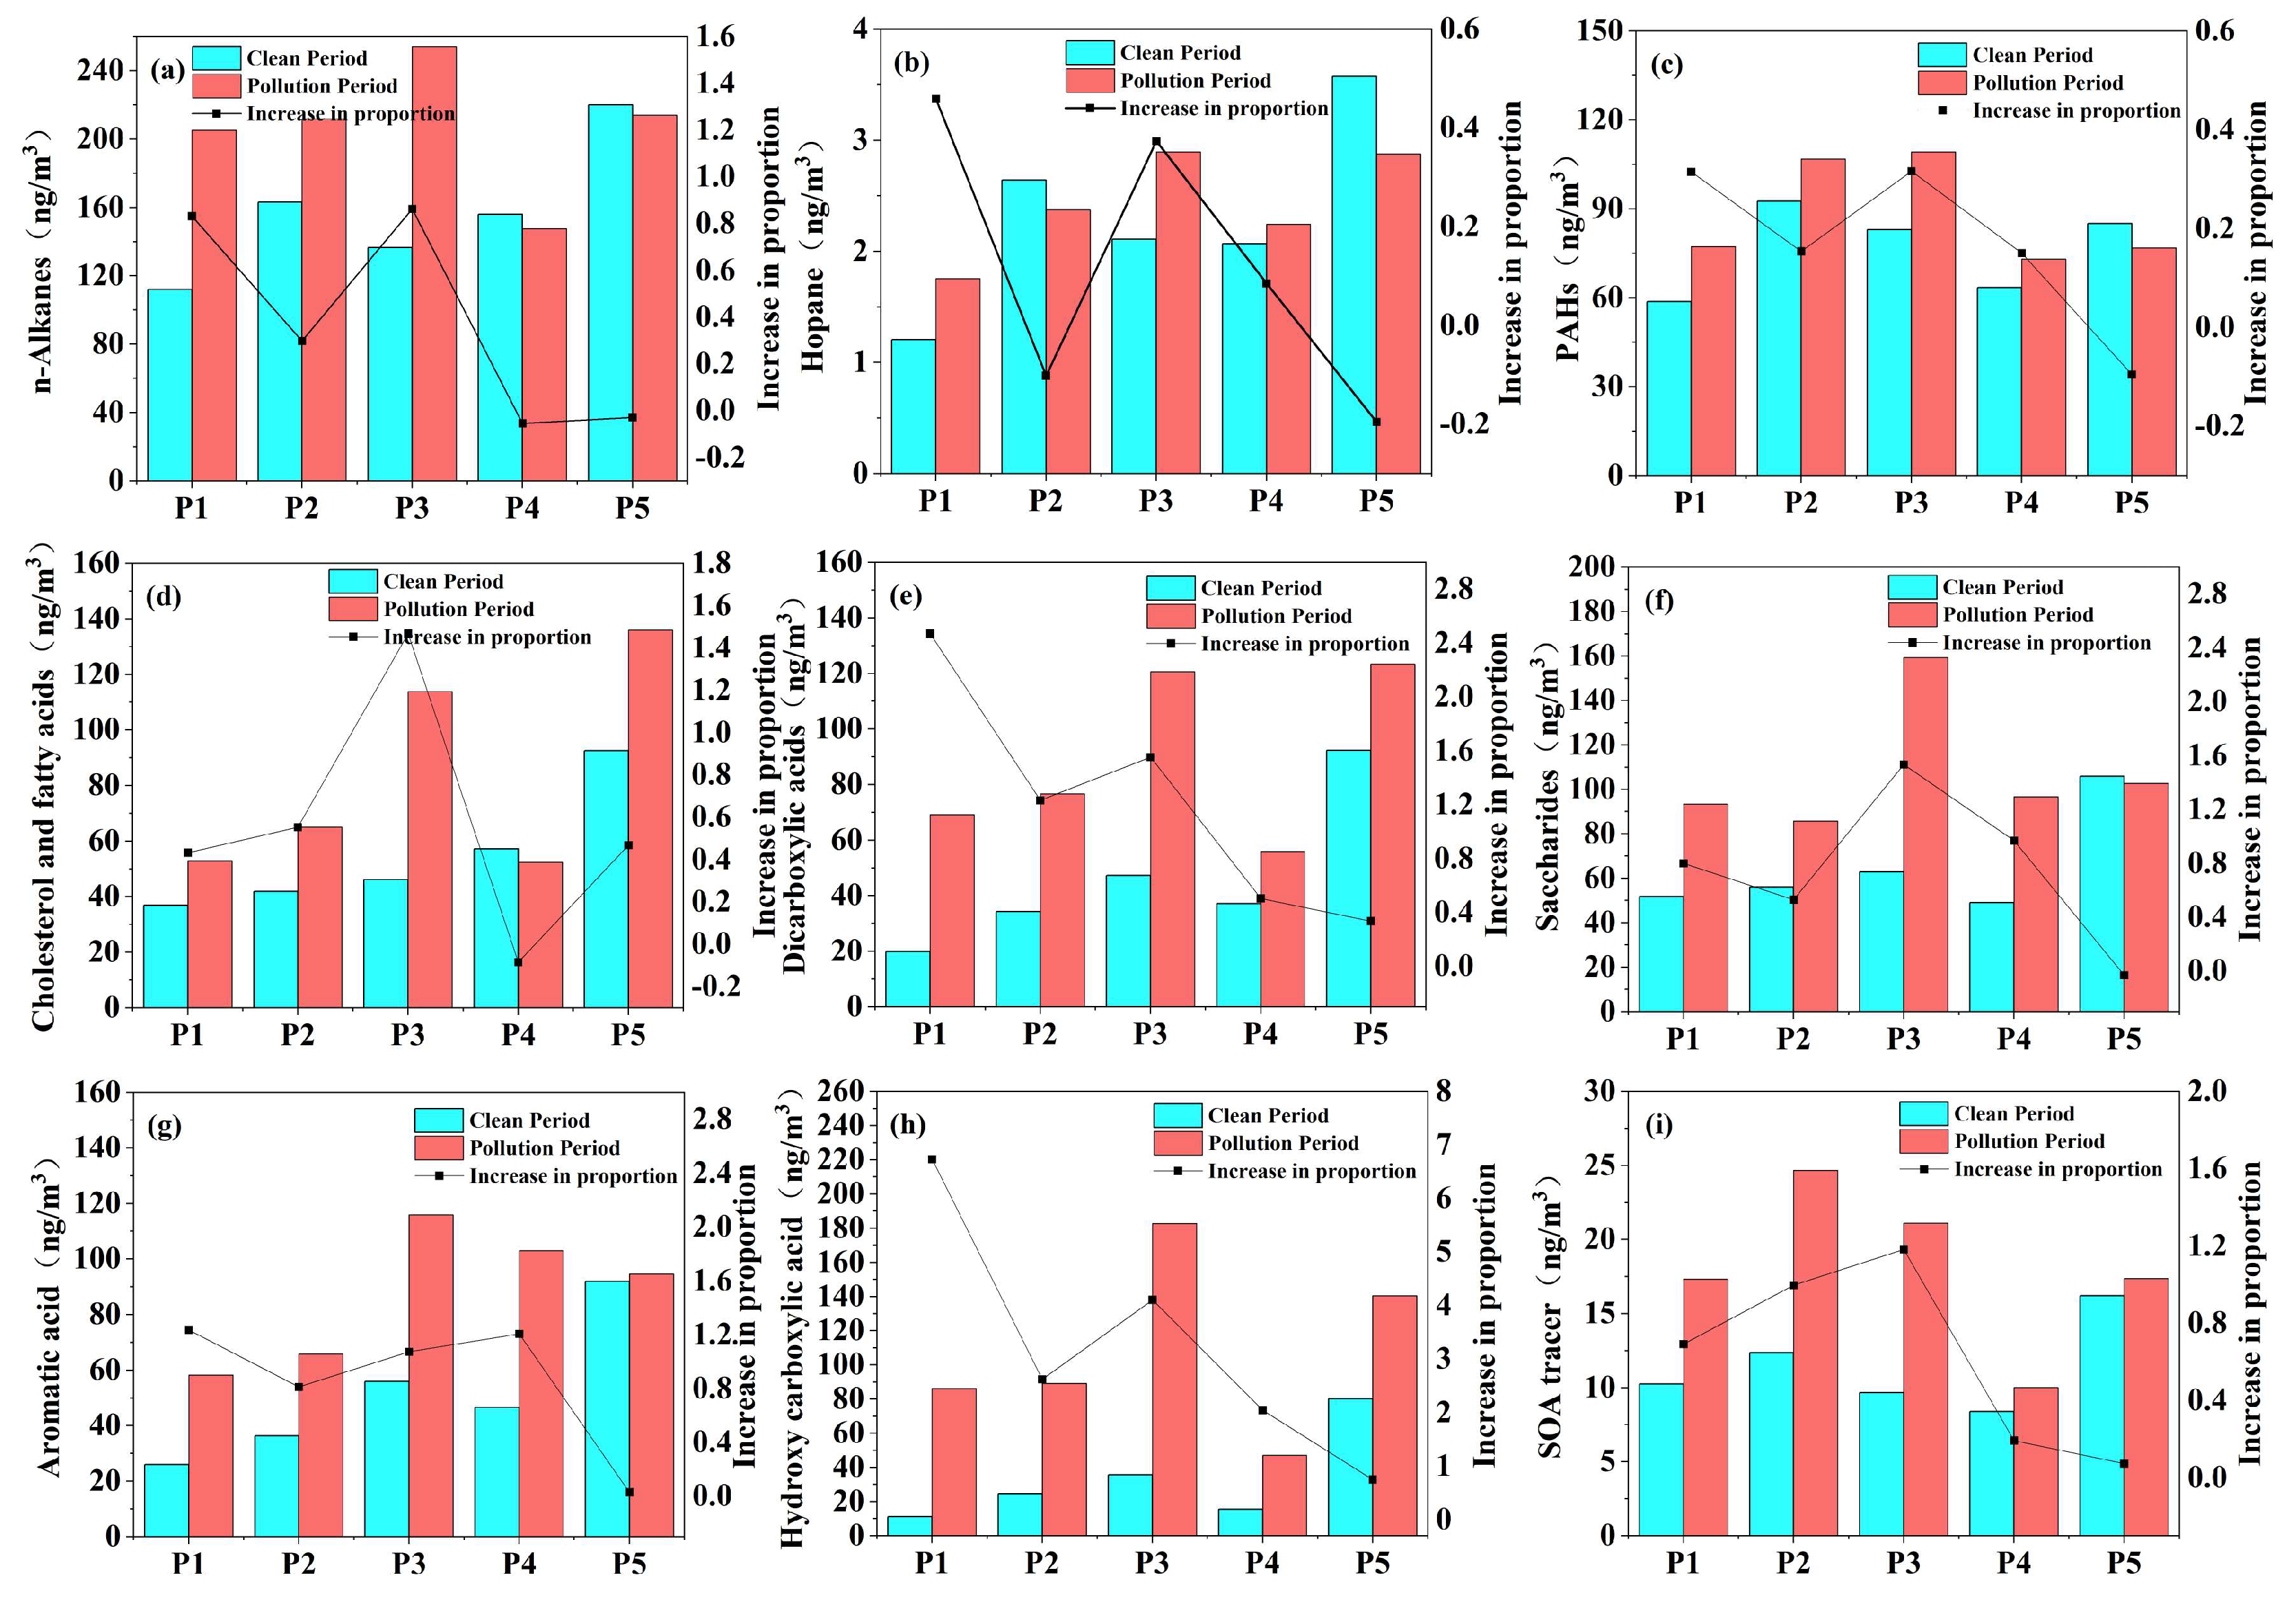
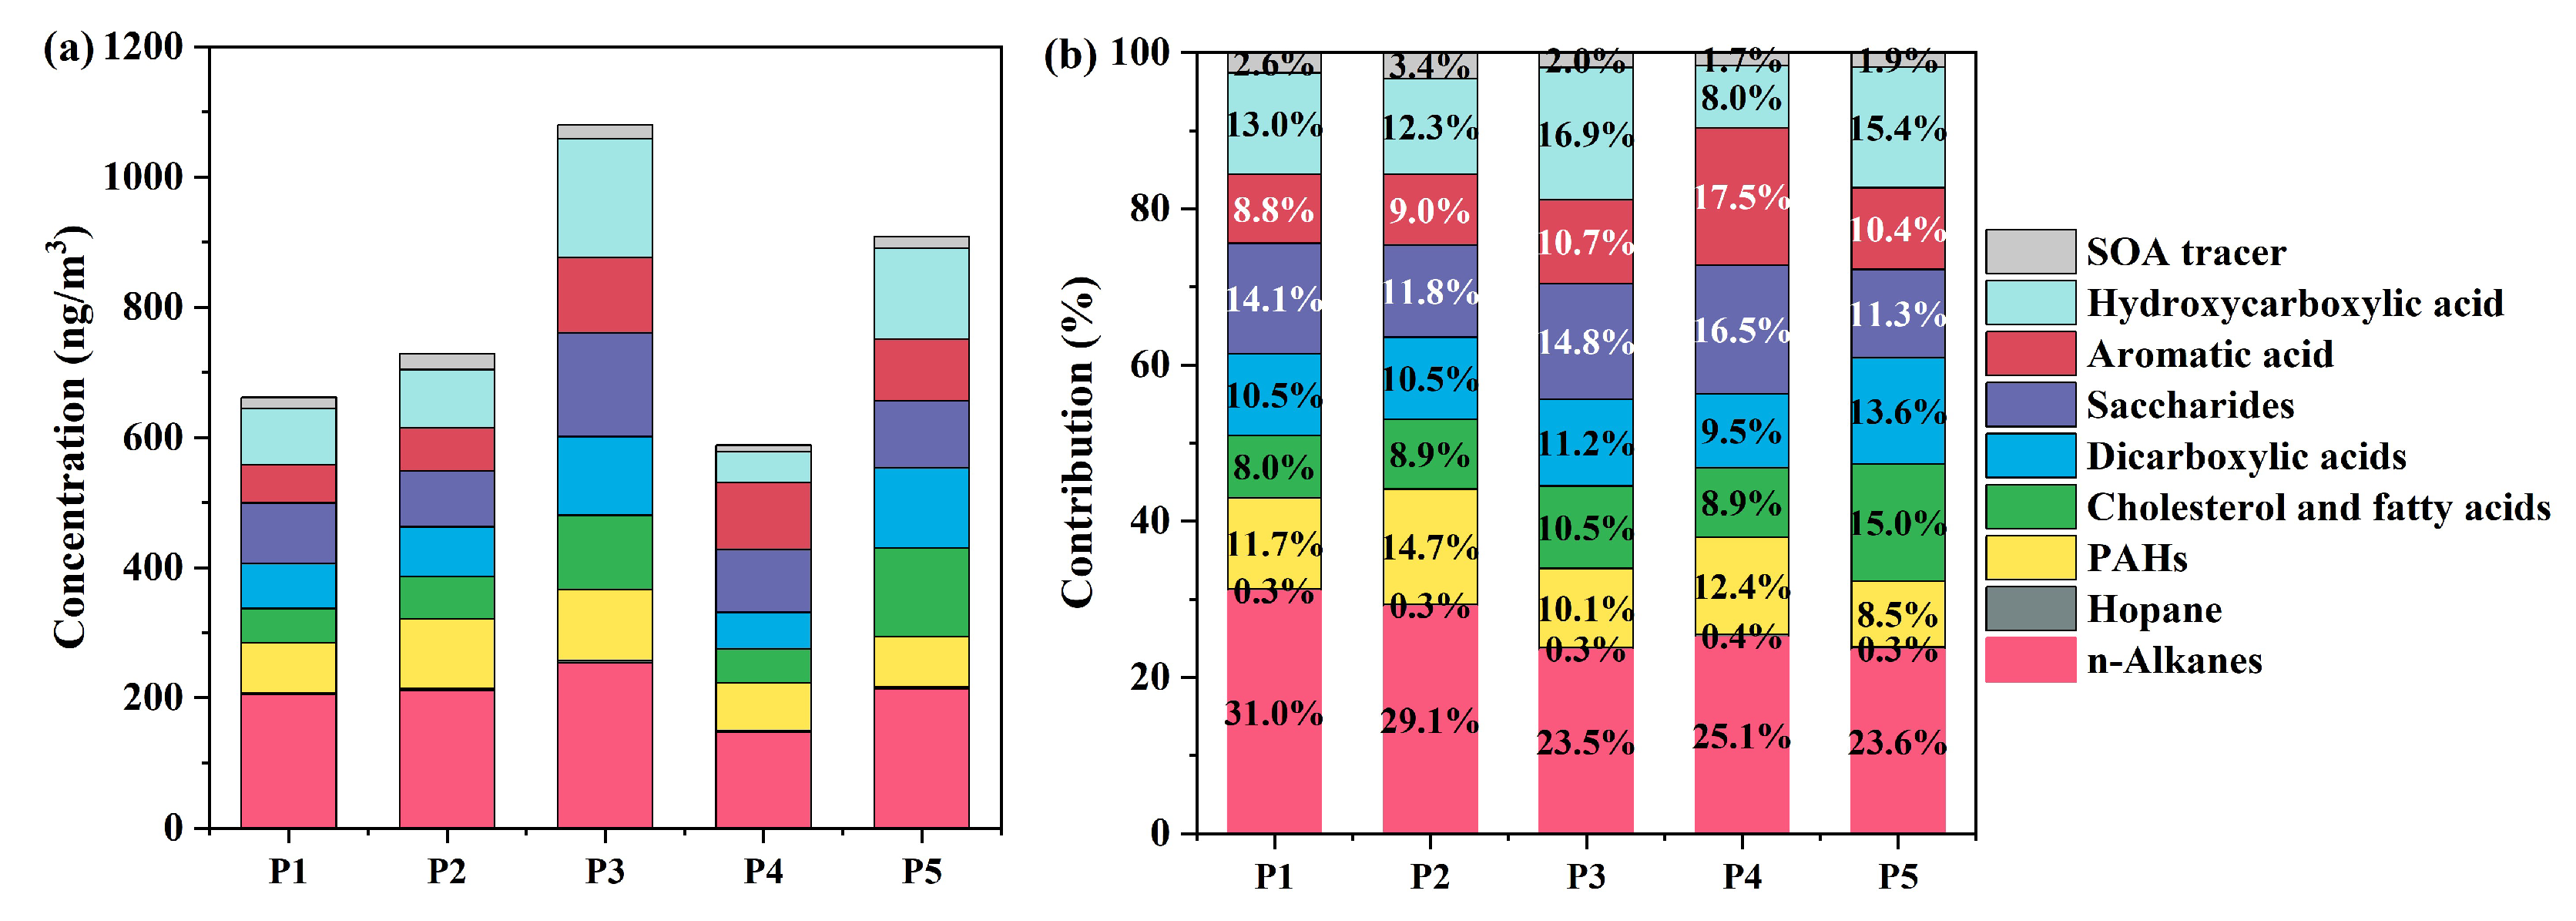
Figure 6 shows the changes in nine categories of substances during each pollution episode compared with the clean periods. The concentration of n-alkanes showed a significant increase during periods P1, P2, and P3, reaching 254.3 ng/m3 at P3, which is 0.9 times higher than that in the clean period. During the first four pollution episodes PAHs concentrations also increased with a notable increase during P3 (109.2 ng/m3), a 32% increase compared to the clean period.
Compared with the clean periods, Cholesterol and fatty acids showed significant increases during P1, P2, P3, and P5, with the increase amplitude being particularly remarkable during P3 and P5. The concentration duringP3 pollution period reached 113.9 ng/m3. Particularly, the concentration exceeded 136.0 ng/m3 in P5. Dicarboxylic acids exhibited a marked increase during all five haze pollution episodes, with the most significant rise occurring during P3 (1.5 times that of the clean period), reaching a concentration of 120.7 ng/m3. Saccharides showed an increase during the polluted periods of the four pollution episodes, particularly in P3 and P4, with a concentration of 159.3 ng/m3 during P3.
Both aromatic acids and hydroxycarboxylic acids exhibited concentration trends during the P1–P3 pollution periods similar to those of saccharides and dicarboxylic acids relative to clean periods. Aromatic acids increased notably during P3, reaching 115.9 ng/m3, 1.1 times the concentration in the clean period, indicating a considerable impact from mobile road sources during P3. Hydroxycarboxylic acids showed notable increases across all five pollution episodes, particularly during P1, P2, and P3, with concentrations rising 6.7-fold, 2.6-fold, and 4.1-fold, respectively, compared to the clean period. During P3, concentrations reached 182.8 ng/m3. The SOA tracers also increased in all five pollution episodes, particularly during P1, P2, and P3, where concentrations were approximately double those in the clean periods, respectively.
Additionally, among the five pollution episodes, the total concentration of organic molecules was the highest during P3, followed by P5, and the lowest during P4. For n-alkanes, their proportion in the total concentration of organic molecules across all pollution episodes was no less than 23.5%, with the highest proportion (31.0%) observed in P1. For PAHs, the highest proportion (14.7%) occurred during P2. The proportion of cholesterol and fatty acids peaked at 15.0% in P5. Hydroxycarboxylic acids had the largest proportion (16.9%) in P3, whereas aromatic acids reached their largest proportion (17.5%) in P4 (Figure 7).

4.3. Source Identification Based on the PMF Model

The input data for the PMF model consists of concentration data for 35 species, including 5 water-soluble inorganic ions (NO3, SO42–, NH4+, K+, Mg2+), 14 elements (Ca, Cr, Cu, Fe, Mn, Ni, Pb, Ti, Zn, V, As, Se, Al, Si), OC, EC, and 14 species which were lumped or single organic molecular tracers. To minimize collinearity in the PMF model, organic tracers with common sources were grouped into 14 species as the input organic species. Quantitative analysis of 2-MGA and phthalic acid was performed using authentic standards. The detection limits (LOD) for the SOA tracers are presented in Table 2. The organic compounds were measured by TAG-GC/MS. The composition, average concentration, and main source indicators of each species are presented in Table 2.
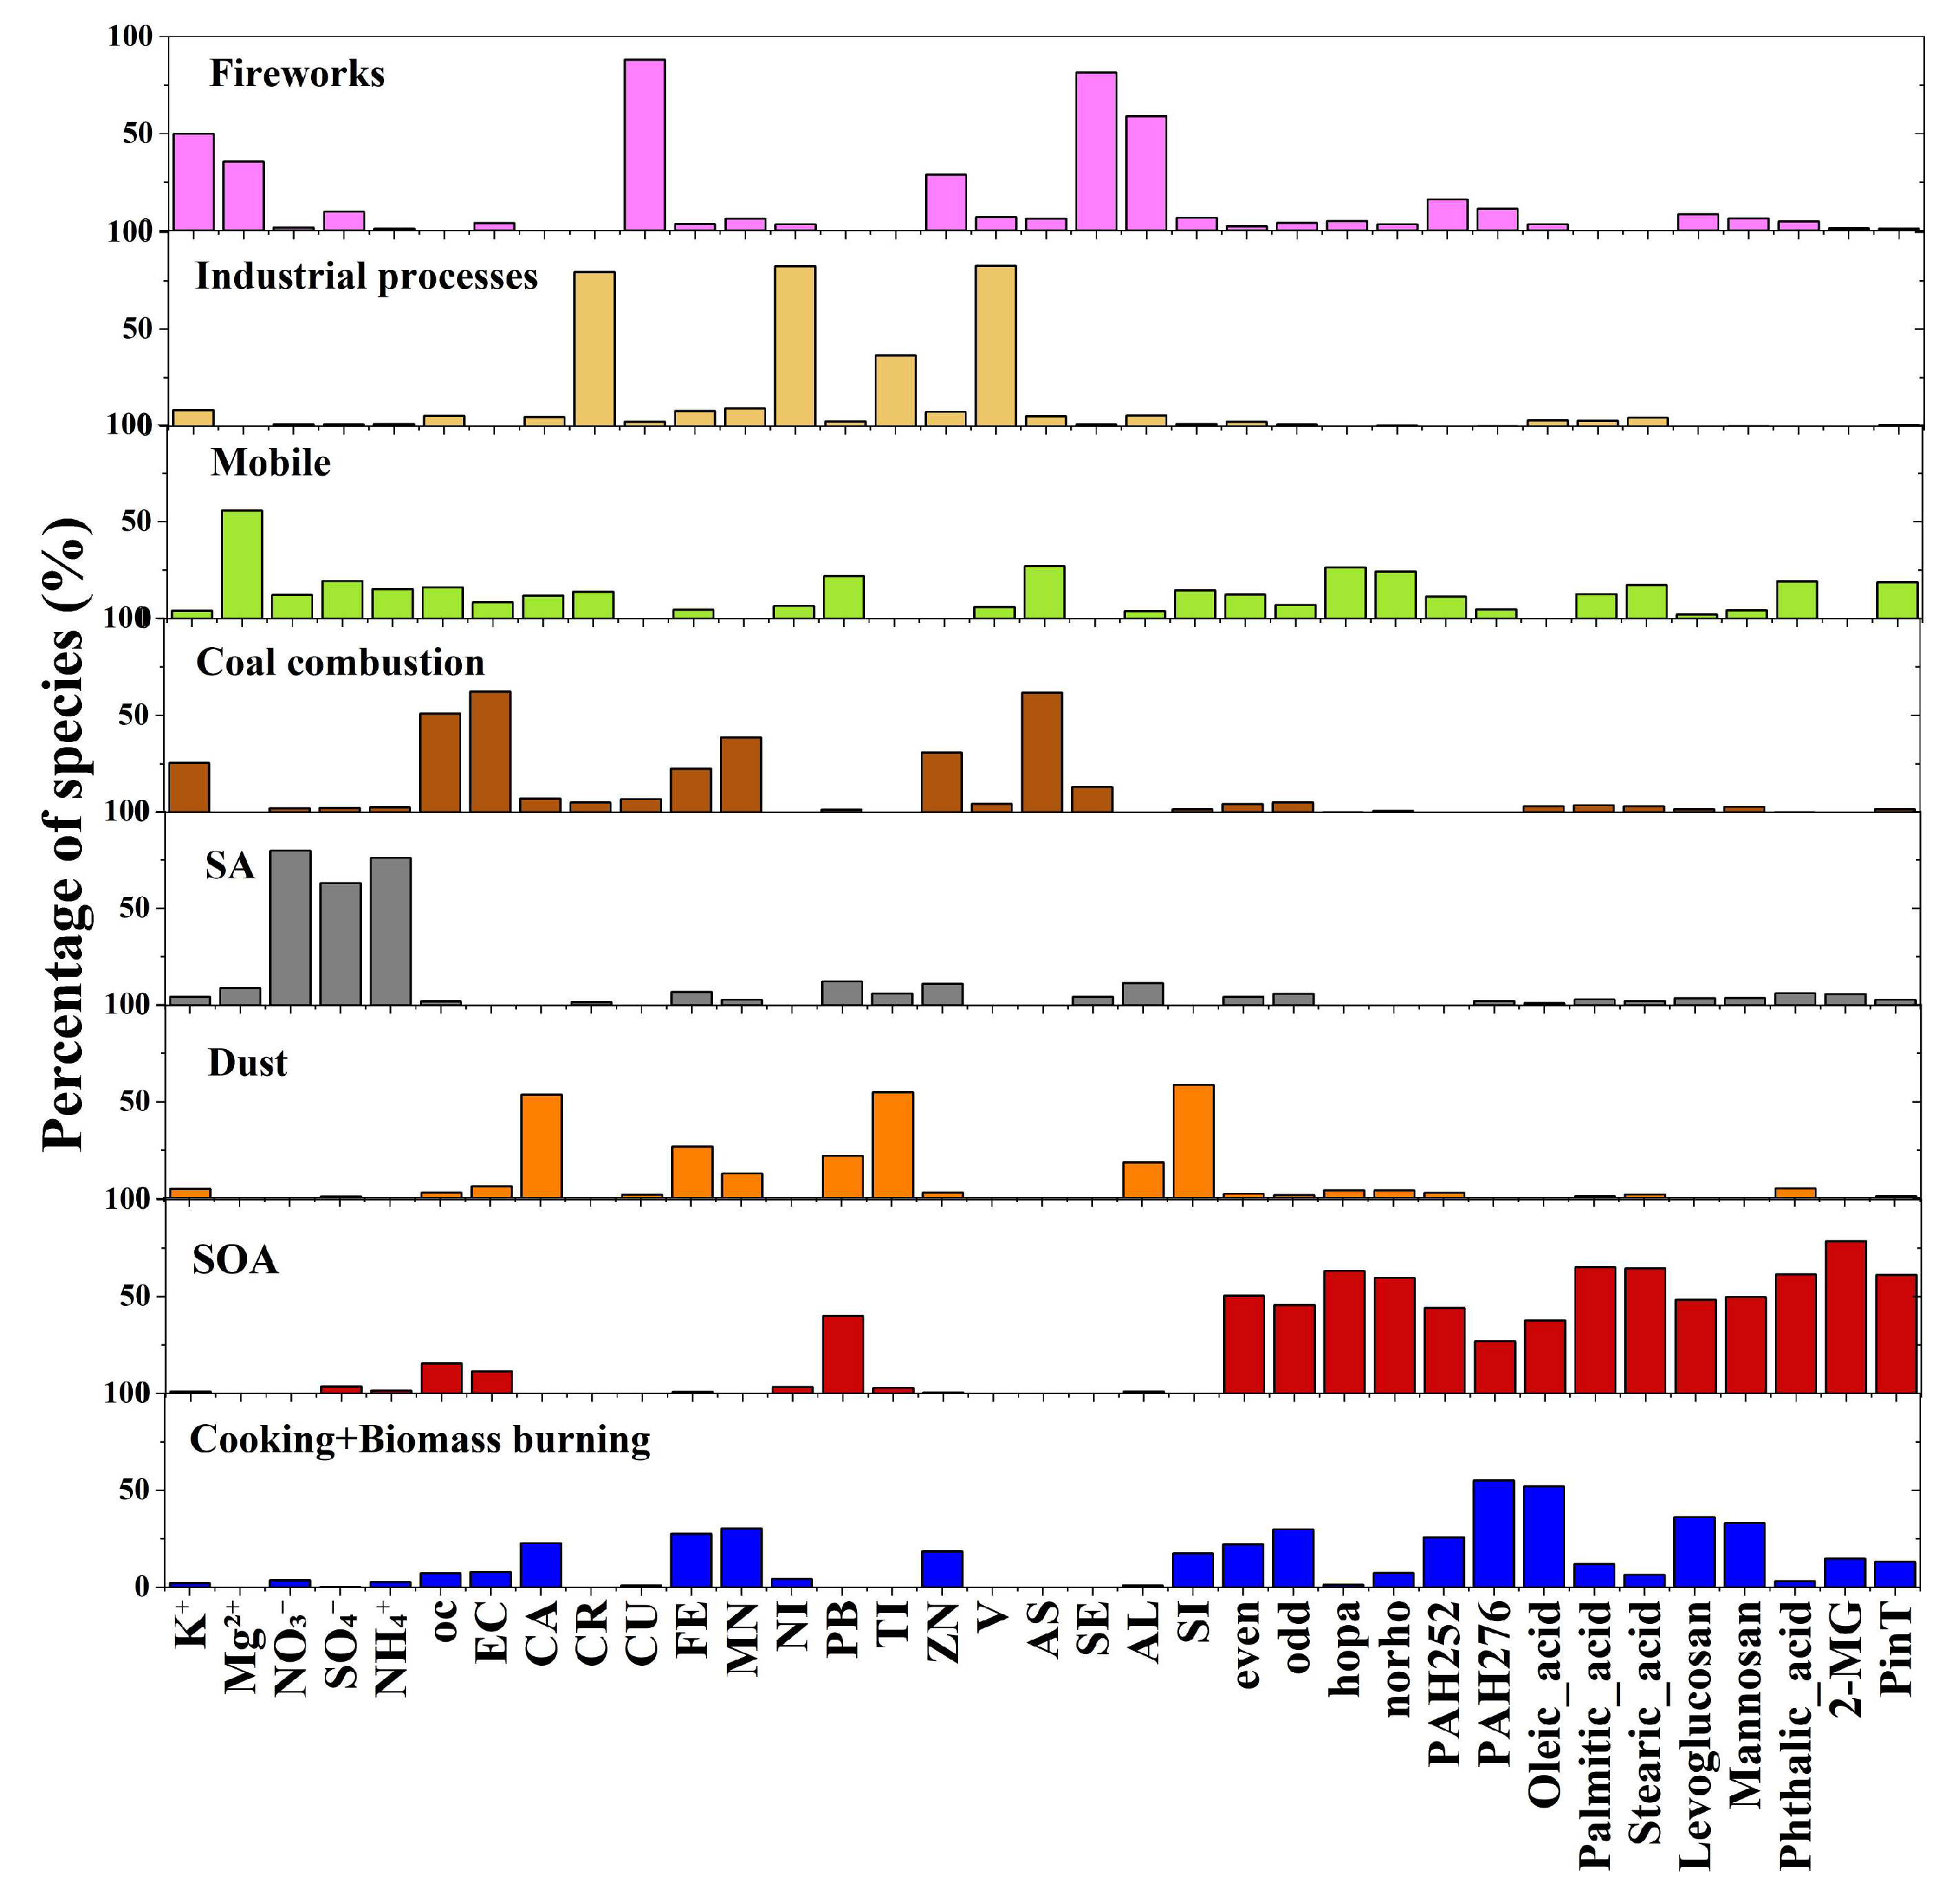
Through multiple tests, the PMF model result with the source apportionment covering 8 factors was the most reasonable and stable. There were 2 categories of factors of secondary sources, and 6 categories of factors of primary emission sources, which were identified, as shown in Figure 8. The characteristic indicator of each source (factor) is as follows:
(1)
Fireworks source: This kind of source was characterized by high loads of ions K+, Mg2+, Cu, and Se, which possess distinctive flame colors and are primarily sourced from fireworks during the Spring Festival [50].
(2)
Industrial processes source: Characterized by Cr, Ni, V, and other elements, representing the contribution of industrial activities and industrial fuel use to PM2.5 [51].
(3)
Mobile source: Characterized by contributions from n-alkanes, hopanes, PAHs, and EC, primarily from the combustion of fossil fuels [52].
(4)
Coal combustion sources: Primarily generated from coal combustion, characterized by high contributions of As, OC, EC, and other elements [53]. Furthermore, a portion of the contribution stems from biomass burning emissions characterized by K+ ions.
(5)
SA source: This factor is primarily associated with emissions from mobile sources, industrial processes, coal combustion, and agricultural activities. These emissions undergo secondary atmospheric reactions, producing substantial amounts of SO42−, NO3, and NH4+, along with a minor fraction of organic matter.
(6)
Dust source: Characterized by high proportions of Ca, Si, and Fe elements, primarily sourced from road dust, sand dust, and construction dust [54].
(7)
SOA source: This factor is characterized by secondary reaction products derived from biogenic emissions of isoprene and α-pinene. It also contains substantial fractions of alkanes, aromatic hydrocarbons, naphthalene, levoglucosan, and hopanes, as well as oxidation products originating from mobile sources and biomass burning.
(8)
Cooking and Biomass burning source: Characterized by high proportions of oleic acid, stearic acid, palmitic acid, levoglucosan, and mannosan [55]. In addition, coal burning during cooking activities can also produce PAHs [56].
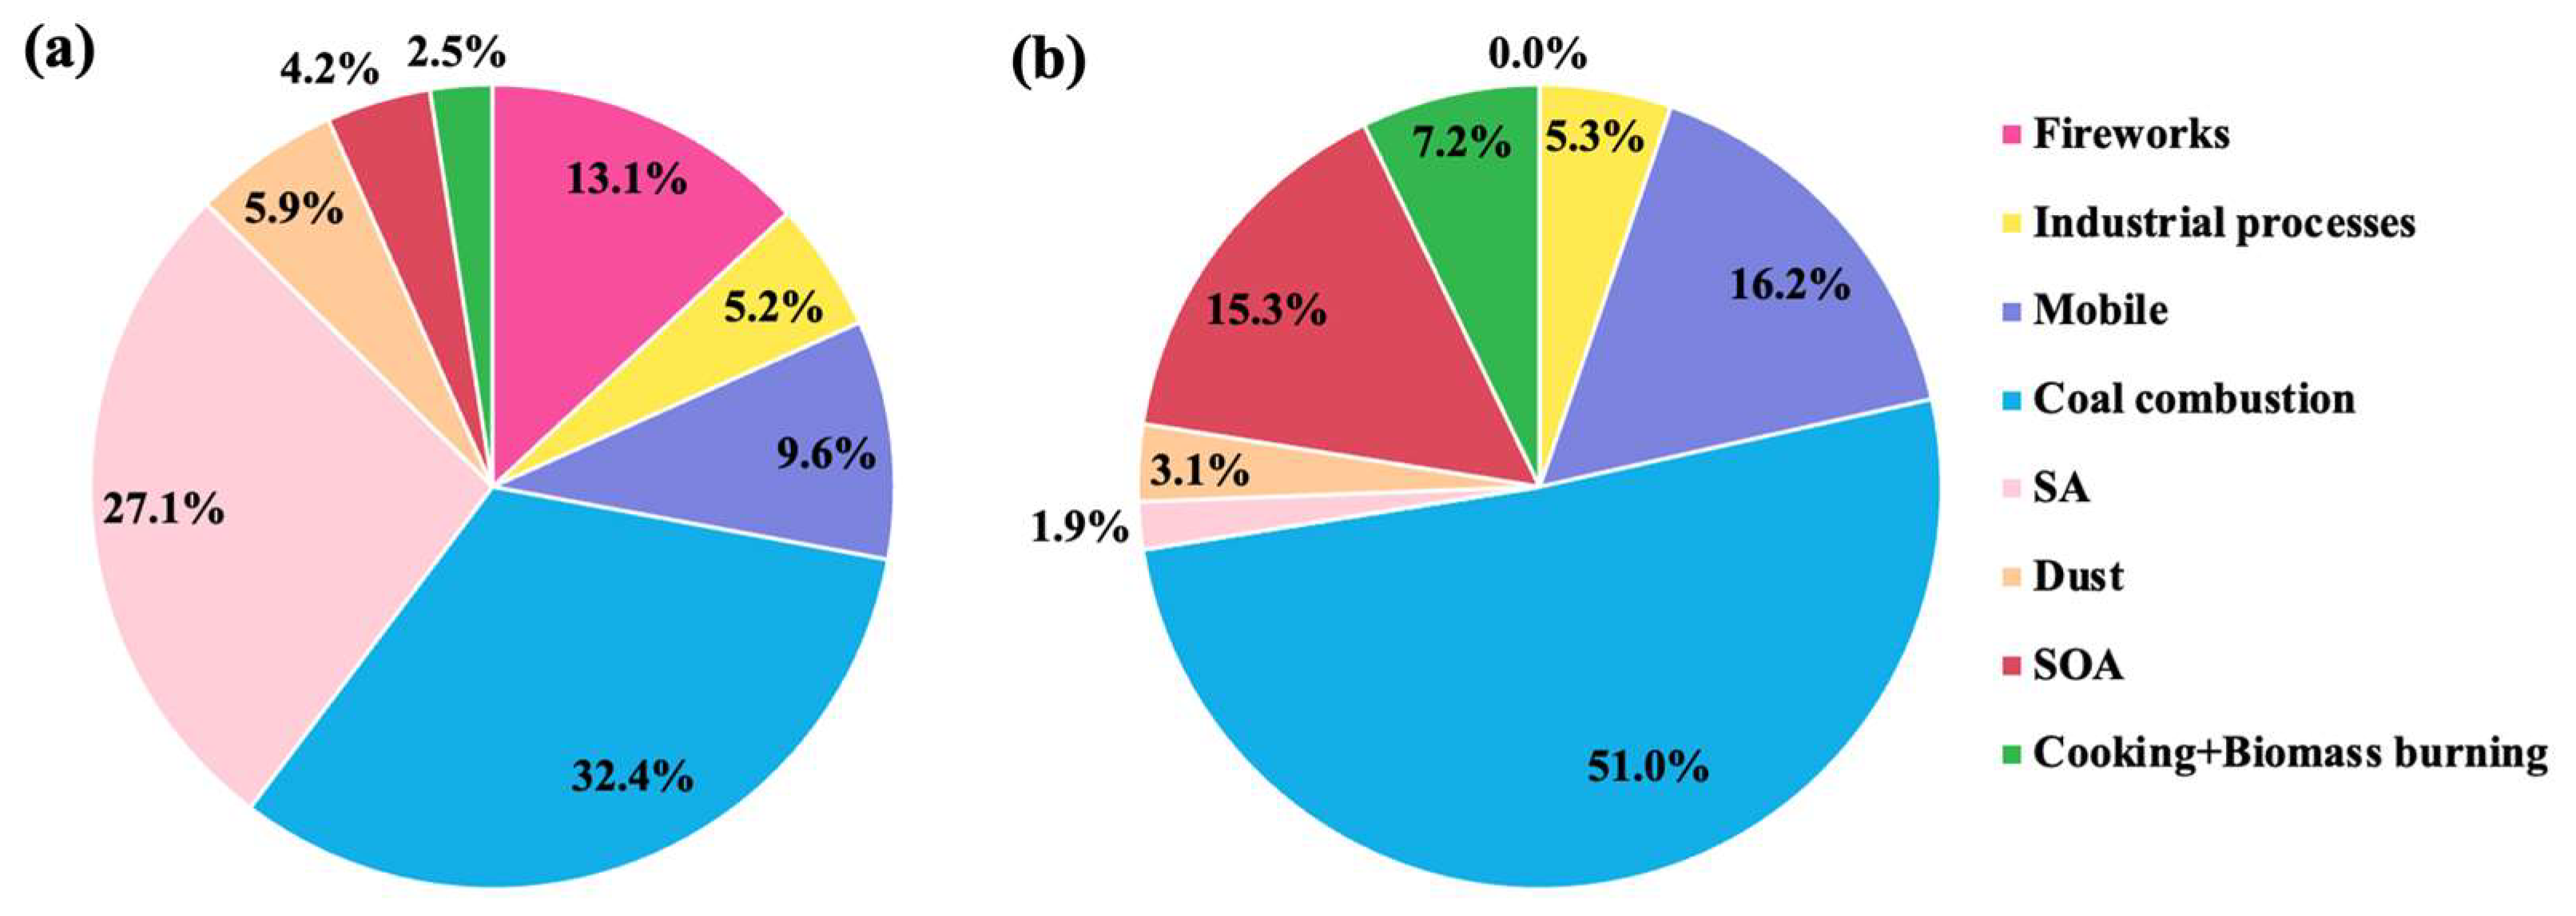
As shown in Figure 9, the source apportionment results indicate that during pollution episodes, coal combustion was the largest contributor to PM2.5, accounting for 32.4%, followed by SA sources, fireworks, mobile sources and industrial process, with contributions of 27.1%, 13.1%, 9.6% and 5.9%, respectively. SOA sources contributed 4.2% of PM2.5, and the combination of SOA and SA as the secondary sources contributed about 31.3% of PM2.5.
Regarding OC in PM2.5, the largest contributors is coal combustion, accounting for 51.0% of the total OC. This contribution also includes a portion from biomass burning. Mobile sources and SOA sources are also the big contributors, with contribution percentages of 16.2% and 15.3%, respectively. Cooking and biomass burning sources, as well as industrial processes sources followed with contribution percentages of 7.2% and 5.3%. Additionally, although fireworks contributed significantly to PM2.5 concentrations, their contribution to OC is negligible. Overall, combustion sources, including industrial combustion and residential combustion, are the main contributors to OC in PM2.5 during haze pollution episodes.
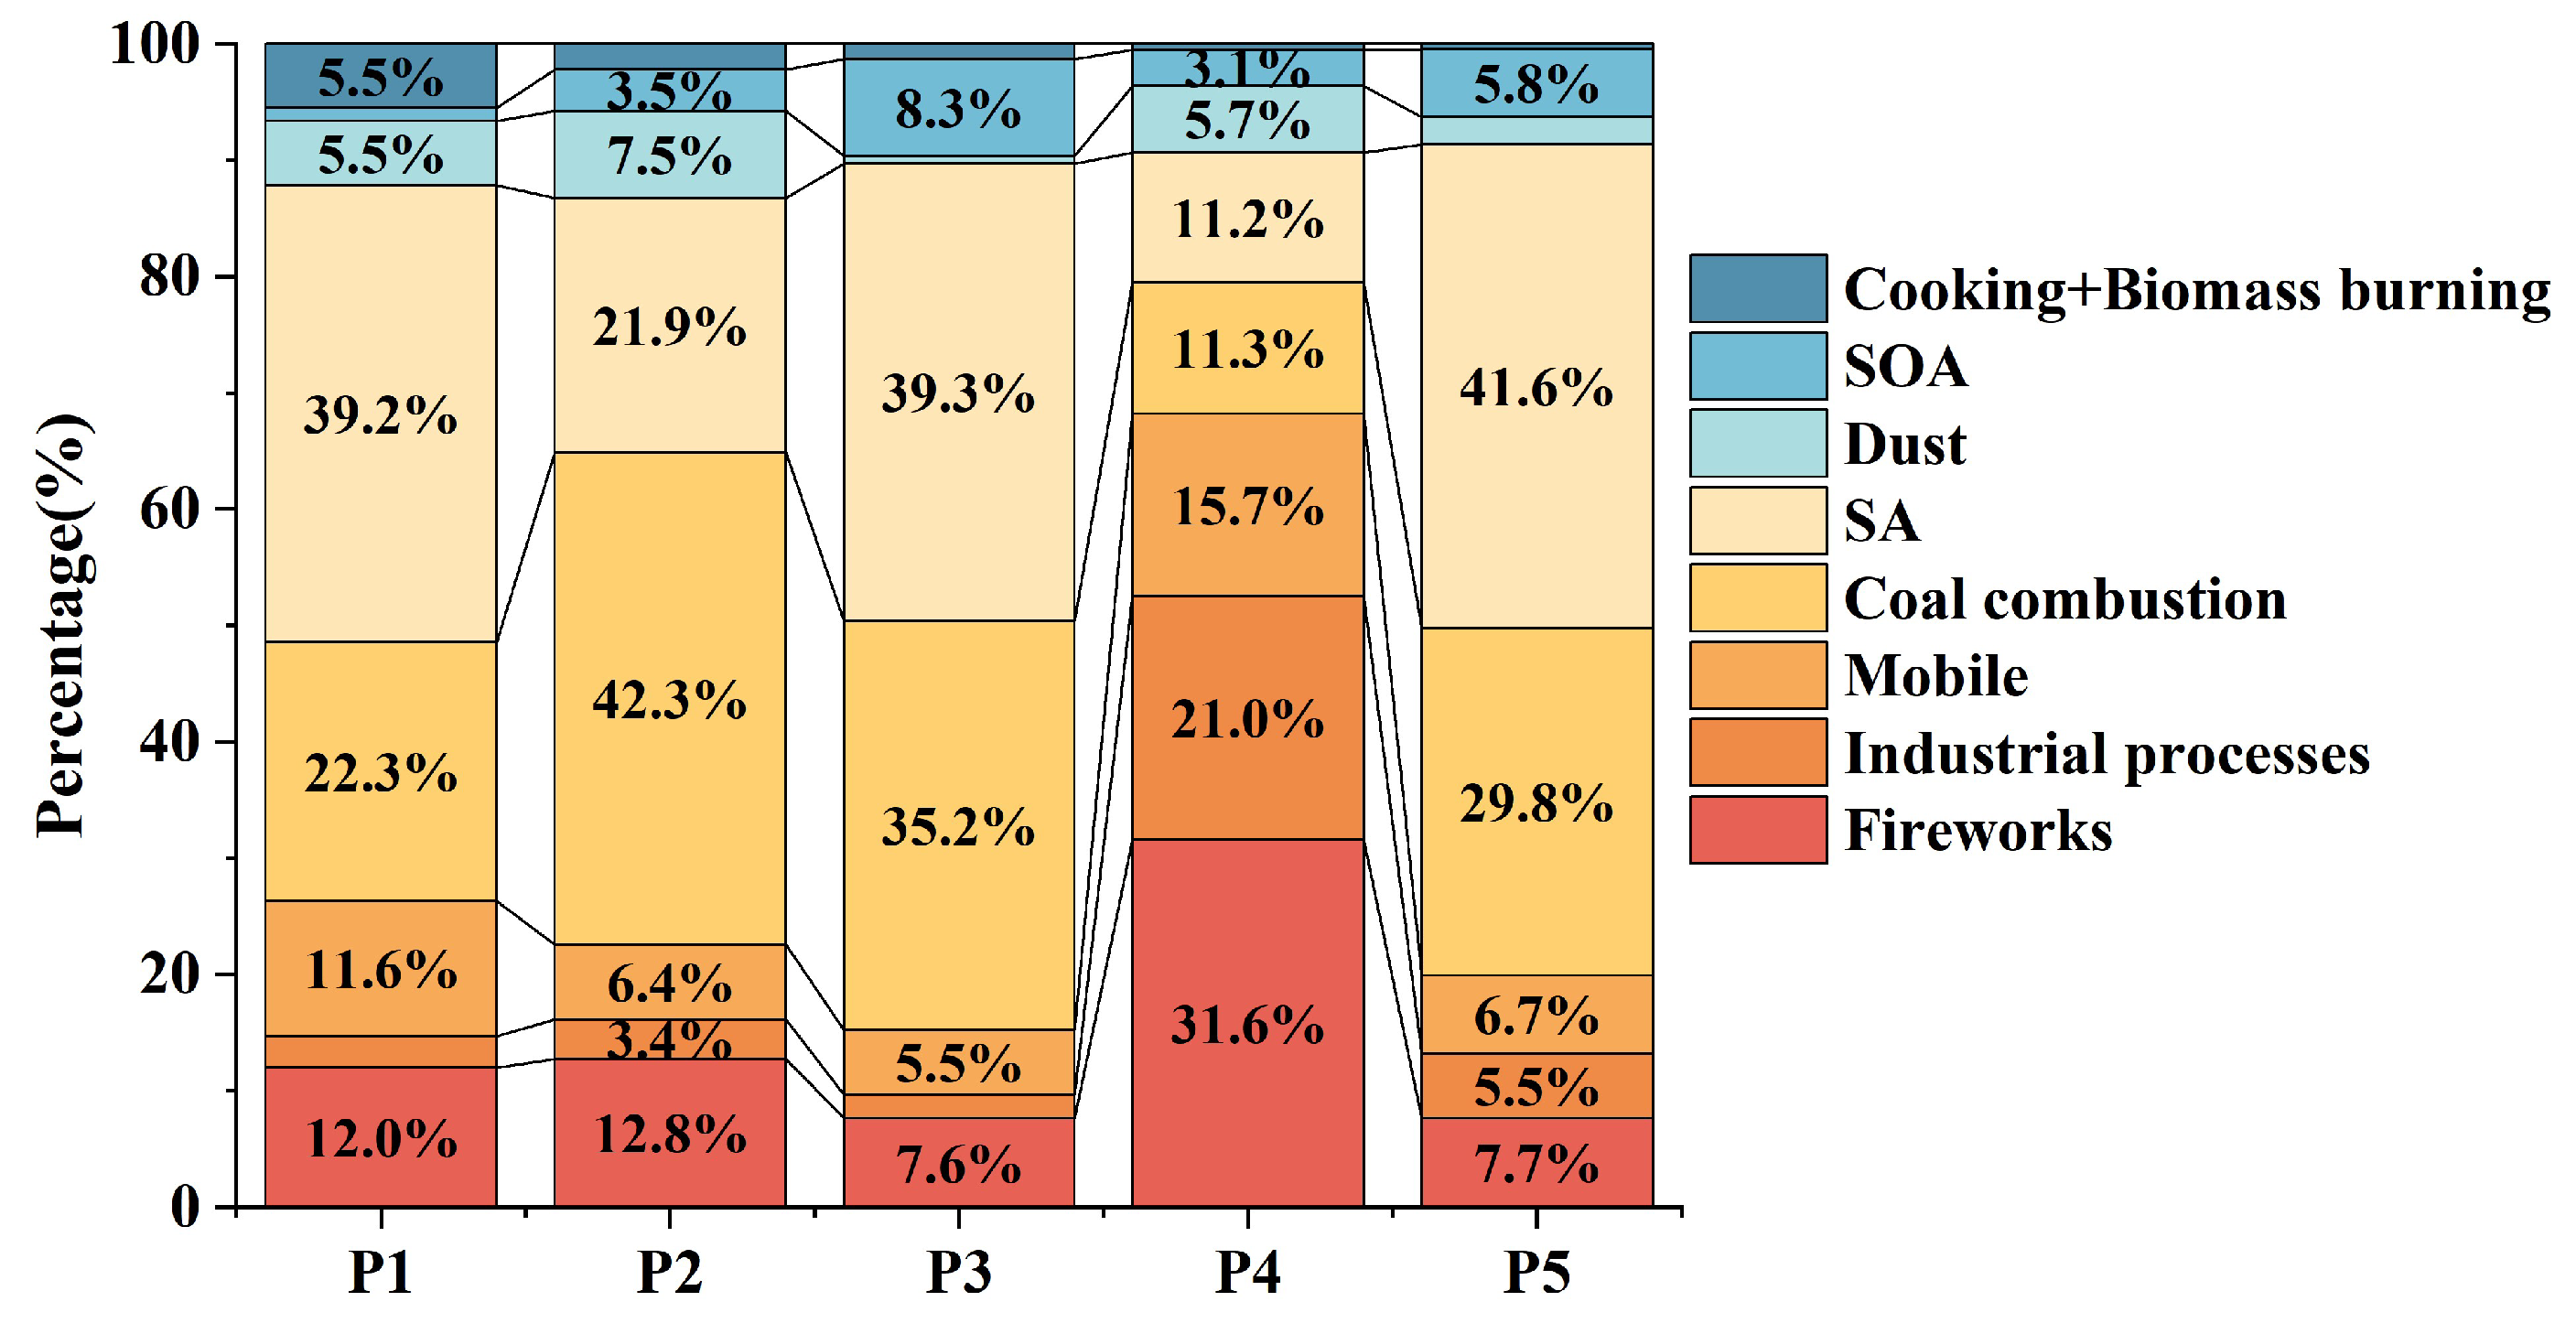
As shown in Figure 10, the largest contributors to PM2.5 during P1, P3, and P5 were consistently SA sources, accounting for 39.2%, 39.3%, and 41.6%, respectively. In contrast, SA sources contributed only 21.9% during P2 and 11.2% during P4. Instead, fireworks and industrial processes dominated during P4, contributing 31.6% and 21.0%, respectively.

4.4. Backward Trajectories of Pollution Process

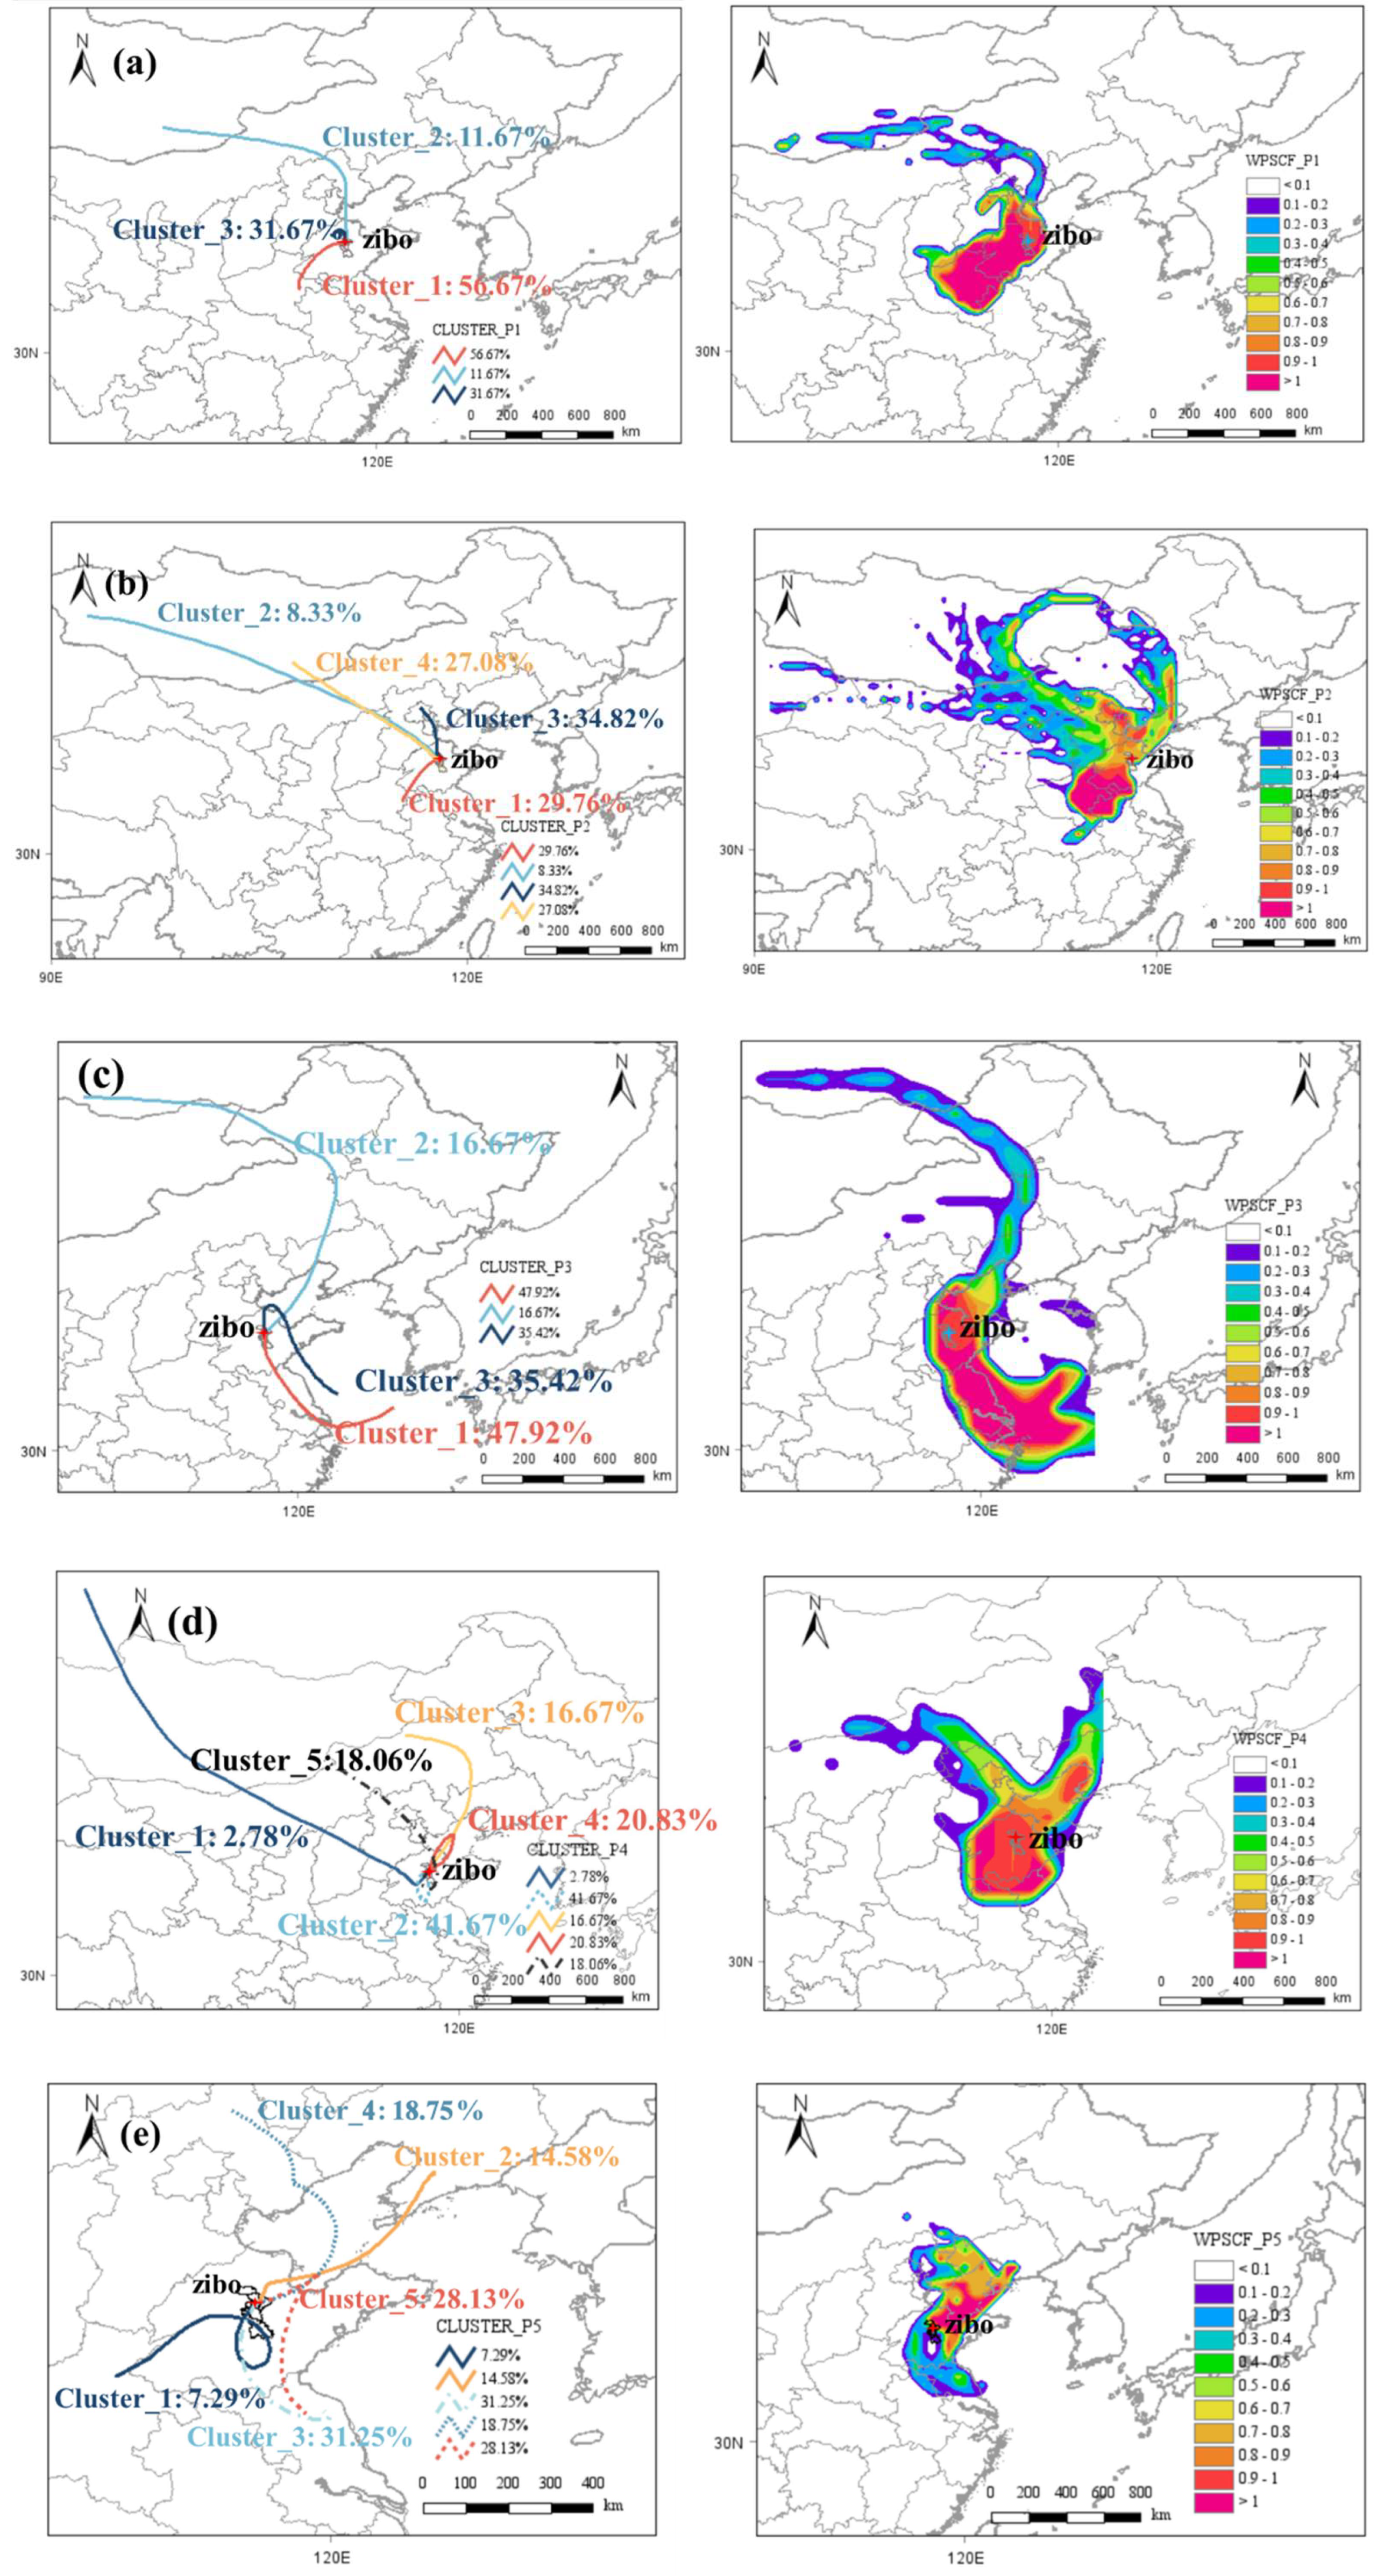
In this study, backward trajectory analysis was conducted to investigate the transport pathways for five pollution episodes using GDAS data with a spatial resolution of 1° × 1°. All trajectories were terminated at the Zibo Super Observation Station (36.84°N, 118.13°E), with an elevation of 500 m. The backward trajectory analysis for each air mass was conducted over a 48 h period (GMT+8). A clustering analysis of the air mass trajectories for each haze pollution episode was performed, and the results are shown in Figure 11.
During the P1 episode, the air masses primarily originated from local and south-southwest regions (Trajectories 3 and 1), as shown in Figure 11. Trajectory 3, associated with a PM2.5 concentration of 204.8 µg/m3 (Table 3), represented a low-moving air mass that lingered for a longer period locally, indicating a significant influence of local emissions. Due to unfavorable meteorological conditions, pollutants were unable to disperse. The main contributors to PM2.5 during the P1 pollution episode were SA (39.2%), coal combustion (22.3%), fireworks including some biomass burning (12.0%) and mobile sources (11.6%), (Figure 10). During the P2 episode, air masses mainly came from the northwest, north, and south-southwest regions (Clustered trajectories 1, 3, and 4), all of which corresponded to relatively high PM2.5 concentrations. Among these, the highest concentration was observed along Trajectory 1, which passed through Jinan from the southwest, reaching 180.1 μg/m3.
During Period P3, the air masses primarily came from the southeast-south, with Trajectory 1 (47.92%) coming from the East China coastal region and Trajectory 3 (35.42%) passing through the Yellow Sea and Bohai Sea before returning to the observation site. The PM2.5 concentration along Trajectory 3 reached 172.5 µg/m3, with the air mass lingering over the northeastern and eastern areas of Zibo for an extended period. During the P4 episode, high PM2.5 concentrations were mainly concentrated in Trajectory 3 (157.2 µg/m3) and Trajectory 4 (139.5 µg/m3).
During the P5 episode, the highest PM2.5 concentration of 206.2 µg/m3 was recorded in Trajectory 2. This trajectory took a relatively short path, starting from Liaoning Province and passing through Bohai Bay before entering the airspace above Shandong. The other trajectories primarily stayed within Shandong, with the highest density of trajectories within Shandong province. Additionally, the second-highest PM2.5 concentration was recorded in Trajectory 5 (145.8 µg/m3), which lingered for an extended period over the northeastern and eastern parts of Zibo.

5. Discussion

5.1. Interpretation of Pollution Formation Based on Measurements

Observations during the study period highlight a significant PM2.5 pollution problem in Zibo City. The 32 polluted days of varying intensity in Zibo during the observation period highlight PM2.5 as the primary pollutant amid frequent pollution episodes. The measurement of 61 organic molecular tracers by the TAG system provided essential data for source apportionment, establishing the system as a vital tool for investigating the composition and formation of SOA in PM2.5. The chemical composition of PM2.5 revealed that secondary inorganic ions were the dominant components, contributing approximately 53% of the mass concentration. This finding strongly suggests that active atmospheric secondary transformation was the key mechanism driving the formation of heavy pollution during the observation period.
During the observation period, the five identified pollution episodes (P1–P5) represent typical persistent pollution events in Zibo during winter. It is noteworthy that although P3 was relatively short in duration, concentrations of multiple pollutants peaked simultaneously, making it the most severe and complex episode in terms of pollution sources. Furthermore, P5 coincided with the Spring Festival fireworks period, with its unique compositional characteristics (sharp increases in K+, Mg2+, and Cl) indicating significant impacts from specific anthropogenic activities.

5.2. Influence of Transport Pathways

By integrating backward trajectory analysis with PMF source apportionment, this study clearly demonstrated that the five observed pollution episodes (P1-P5) were driven by both local emissions and regional transport, while the dominant mechanisms varied substantially among them.
During the P1 episode, a combination of local and neighboring industrial emissions, mobile sources, substantial residential heating during cold weather, and unfavorable meteorological conditions resulted in high SA contributions and the observed haze episode. During the P2 episode, the backward trajectories highlights the considerable impact of local emissions and neighboring cities in Shandong Province. Notably, this severe pollution episode coincided with the full reopening following the COVID-19 pandemic, when industrial production and the resumption of work led to increased anthropogenic emissions. Under unfavorable meteorological conditions, pollutants accumulated, causing elevated PM2.5 concentrations during the P2 episode. During Period P3, the high PM2.5 concentrations in Zibo during P3 were influenced not only by Shandong Province but also significantly by the East China coastal regions, including Jiangsu and Shanghai. During the P4 episode, notably, Trajectory 4 exhibited a significant pattern of pollutant recirculation. This period coincided with New Year’s Eve and the first day of the Lunar New Year, during which the impact of fireworks and firecrackers in local and nearby cities on PM2.5 levels was particularly significant. During the P5 episode, the trajectory suggests that during this pollution episode, the PM2.5 concentration at the observation site was affected by both local emissions and transport from the northeast region.
During winter, the prevalent stagnant air, temperature inversions, and a depressed planetary boundary layer markedly weaken atmospheric dispersion capacity. These conditions collectively facilitate the accumulation of pollutants emitted from the ground and the progression of secondary atmospheric reactions.
Generally, winter haze pollution in Zibo is a complex outcome driven by local emissions, intra-provincial transport, and cross-regional transport. The severity of pollution episodes depends not only on the accumulation and secondary transformation of local pollutants but is also significantly influenced by long-range transport associated with air masses originating from the southwest (inland Shandong), southeast (Yangtze River Delta), and northeast (Northeast China). Therefore, effective air quality management strategies must strengthen local emission reductions while simultaneously establishing and enhancing regional joint prevention and control mechanisms to address this complex pollution challenge.

5.3. Source Analysis

In the PMF model input data, organic tracers with common sources were lumped together, thereby effectively minimizing collinearity and enhancing the stability and reliability of the source apportionment results. The final 8-factor solution was proven to be the most reasonable and stable. The high temporal resolution measurements of organic molecules using the TAG-GC/MS system provided more concentration data of source-indicating organic molecules (tracers), enhancing the source apportionment capability of PM2.5 and organic matter.
From 26 November 2022 to 9 February 2023, Zibo experienced five pollution episodes, totaling 32 days of pollution and 7 days of heavy pollution. The pollution rate and heavy pollution rate were 40.0% and 8.8%, respectively, indicating a high occurrence of PM2.5 pollution days in Zibo, China, and the urgent need for significant efforts in mitigating of PM2.5 pollution. Moreover, throughout the observation period, coal combustion (32.4%) and secondary inorganic aerosols (27.1%) emerged as the two predominant sources of PM2.5 on average. Collectively accounting for nearly 60% of the total mass, this finding precisely pinpoints the root cause of winter pollution in Zibo: intensive coal-burning emissions underwent vigorous secondary transformation under meteorological conditions unfavorable for pollutant dispersion.
The concentration of n-alkanes showed a significant increase during periods P1, P2, and P3, indicating a substantial contribution from fossil fuel combustion and emissions from higher plants. Compared with the clean periods, Cholesterol and fatty acids showed significant increases during P1, P2, P3, and P5, suggesting that cooking sources have a notable contribution to the haze pollution in Zibo. Dicarboxylic acids exhibited a marked increase during all five haze pollution episodes, highlighting the notable influence of aged air masses. The SOA tracers also increased in all five pollution episodes, particularly during P1, P2, and P3, where concentrations were approximately double those in the clean periods, respectively, indicating a significant conversion of precursors to SOA during these three pollution episodes. Saccharides showed an increase during the polluted periods of the four pollution episodes, particularly in P3 and P4, indicating a higher contribution from biomass burning.
A total of 61 organic molecules were quantified based on the TAG-GC/MS system and classified into nine categories according to their chemical properties. The total concentration of the measured organic tracers was 541.3 ± 344.5 ng/m3 during the pollution episodes. Among them, the concentration of n-alkanes was the highest, followed by PAHs and Saccharides. Compared to the clean period, the concentration of organic molecules during the pollution period was significantly higher. Hydroxycarboxylic acids showed a noticeable increase during all five haze pollution episodes, especially during the P1, P2, and P3 periods, where the concentrations increased by 6.7, 2.6, and 4.1 times, respectively, compared to the clean period. This indicates that PM2.5 during the pollution period was significantly influenced by aged air masses.
During the five haze pollution episodes, the PM2.5 concentrations were strongly influenced by local emissions. Particularly during the P4 episode, pollution was primarily influenced by the local fireworks and firecrackers during the Chinese New Year holiday. In the P2 (25 December 2022–9 January 2023) episode, the PM2.5 concentrations were also impacted by the fireworks and firecrackers set off during the New Year’s Eve celebration, but the impact was much smaller compared to P4 (20–24 January 2023). However, the P4 episode occurred during the Spring Festival period. Its source structure changed significantly, with the contribution of secondary sources plummeting to just 11.2%. This sharp decline is likely attributable to the widespread suspension of industrial and production activities during the holiday, which led to a substantial reduction in the emissions of precursors for secondary aerosol formation. Conversely, the contribution from fireworks sources (31.6%) was 2.5 to 4 times higher than in other episodes. The extensive setting off of fireworks and firecrackers during the Chinese Spring Festival has a significant impact on PM2.5 concentrations, even causing PM2.5 concentrations to surge to approximately 400 μg/m3 in a short period, offering a clear illustration of the substantial impact of festive traditions on air quality.
During haze pollution episodes, coal combustion was the biggest contributor to PM2.5, accounting for 32.4%, followed by SA sources and fireworks with contributions of 27.1% and 13.1%, respectively. Notably, the extensive setting off of fireworks and firecrackers during the Chinese Spring Festival has a significant impact on PM2.5 concentrations, even causing them to surge to approximately 400 μg/m3 in a short period. Regarding OC in PM2.5, the largest contributors are coal combustion, accounting for 51.0% of the total OC. This contribution also includes a portion from biomass burning. Mobile sources and SOA are also the big contributors. Although fireworks contributed significantly to PM2.5 concentrations, their contribution to OC is negligible. Overall, combustion sources, including industrial and residential combustion, are the main contributors of OC in PM2.5 during haze pollution episodes.

5.4. Limitations and Future Research

While this study provides insightful source apportionment of PM2.5 and OC in Zibo using high-temporal-resolution tracer data and the PMF model, it is still subject to several limitations. The inherent uncertainties of the PMF model, such as rotational ambiguity and factor collinearity, may affect the precise separation and quantification of certain sources. Future research should focus on integrating satellite data for robust model validation. Future studies are recommended to conduct in-depth source apportionment using multiple models, including chemical transport models and furthermore towards sustainable environmental and health policy design through co-benefit assessment.

6. Conclusions

From 26 November 2022 to 9 February 2023, Zibo, a prefecture-level city in Shandong Province, China, experienced five PM2.5 pollution episodes. In this study, source identification of PM2.5 and OC during these episodes was conducted by integrating high-temporal-resolution online measurements of organic molecular tracers.
As a typical industrial city in northern China, Zibo experienced a high frequency of PM2.5 pollution during winter, with the overall pollution rate and heavy pollution rate reaching 40.0% and 8.8%, respectively, highlighting the urgent need for substantial efforts to mitigate PM2.5 pollution. It is noteworthy that coal combustion and secondary formation are the dominant contributors to PM2.5 pollution in most cases. However, during the Spring Festival, fireworks become the dominant source, driving PM2.5 concentrations to extreme levels. Therefore, the accelerated development of cleaner, low-emission fireworks is recommended, allowing festive celebrations to proceed while minimizing their impact on air quality.
Winter haze pollution in Zibo resulted from a complex interplay of local emissions, intra-provincial transport, and long-range regional transport. The severity of pollution episodes was determined not only by the accumulation and secondary transformation of local pollutants but also by air masses originating from the southwest (inland Shandong), southeast (Yangtze River Delta), and northeast (Northeast China). Consequently, effective air quality management requires both rigorous local emission reductions and the development of coordinated regional prevention and control strategies to address this multifaceted pollution challenge.

Supplementary Materials

The following supporting information can be downloaded at: https://www.mdpi.com/article/10.3390/su172310587/s1, Figure S1: Results of PM2.5 mass reconstruction during the observation period; Figure S2: The percentage of each component in PM2.5.

Author Contributions

N.C. and Y.D.: Writing—original draft, Visualization, Software, Methodology, Formal analysis. Y.W.: Conceptualization, Writing—original draft, Methodology, Formal analysis. J.F.: Formal analysis, Validation. Y.Y., K.Z. and X.Y.: Measurement, Formal analysis, Validation. C.W., L.H. and K.M.: Methodology, Writing—review and editing. L.L.: Conceptualization, Writing—review and editing, Supervision, Funding acquisition. All authors have read and agreed to the published version of the manuscript.

Funding

This study was financially supported by Jing-Jin-Ji Regional Integrated Environmental Improvement-National Science and Technology Major Project (NO. 2025ZD1202005) and the National Natural Science Foundation of China (NO. 42375102). Chaiwat Wilasang received a postdoctoral fellow-ship from King Mongkut’s University of Technology Thonburi, Thailand.

Institutional Review Board Statement

Not applicable.

Informed Consent Statement

Not applicable.

Data Availability Statement

Data will be made available on request.

Conflicts of Interest

The authors declare that they have no conflict of interest.

References

  1. Gao, M.; Beig, G.; Song, S.; Zhang, H.; Hu, J.; Ying, Q.; Liang, F.; Liu, Y.; Wang, H.; Lu, X.; et al. The Impact of Power Generation Emissions on Ambient PM2.5 Pollution and Human Health in China and India. Environ. Int. 2018, 121, 250–259. [Google Scholar] [CrossRef] [PubMed]
  2. Zhang, Z.; Song, N.; Wang, J.; Liu, J.; Shi, L.; Du, J. Effect of PM2.5 Air Pollution on the Global Burden of Neonatal Diarrhea from 1990 to 2019. Environ. Pollut. 2025, 367, 125604. [Google Scholar] [CrossRef]
  3. Gui, X.; Ren, J.; Wang, G.; Wang, Y.; Zhang, M.; Wang, X. Retrieval of Atmospheric Visibility and Its Driving Factors in Shanghai, China. Atmosphere 2025, 16, 1181. [Google Scholar] [CrossRef]
  4. Hu, X.; Belle, J.H.; Meng, X.; Wildani, A.; Waller, L.A.; Strickland, M.J.; Liu, Y. Estimating PM2.5 Concentrations in the Conterminous United States Using the Random Forest Approach. Environ. Sci. Technol. 2017, 51, 6936–6944. [Google Scholar] [CrossRef]
  5. Chow, W.S.; Liao, K.; Huang, X.H.H.; Leung, K.F.; Lau, A.K.H.; Yu, J.Z. Measurement Report: The 10-Year Trend of PM2.5 Major Components and Source Tracers from 2008 to 2017 in an Urban Site of Hong Kong, China. Atmos. Chem. Phys. 2022, 22, 11557–11577. [Google Scholar] [CrossRef]
  6. Yu, Y.; Dai, C.; Wei, Y.; Ren, H.; Zhou, J. Air Pollution Prevention and Control Action Plan Substantially Reduced PM2.5 Concentration in China. Energy Econ. 2022, 113, 106206. [Google Scholar] [CrossRef]
  7. Volckens, J. Summertime Trends in U.S. Population Exposure to Fine Particulate Air Pollution (PM2.5) from Wildfire Smoke. Environ. Sci. Technol. Lett. 2024, 11, 1182–1186. [Google Scholar] [CrossRef]
  8. Zhang, Q.; Jimenez, J.L.; Canagaratna, M.R.; Allan, J.D.; Coe, H.; Ulbrich, I.; Alfarra, M.R.; Takami, A.; Middlebrook, A.M.; Sun, Y.L.; et al. Ubiquity and Dominance of Oxygenated Species in Organic Aerosols in Anthropogenically-influenced Northern Hemisphere Midlatitudes. Geophys. Res. Lett. 2007, 34, 2007GL029979. [Google Scholar] [CrossRef]
  9. Zhu, S.; Zhou, M.; Qiao, L.; Huang, D.D.; Wang, Q.; Wang, S.; Gao, Y.; Jing, S.; Wang, Q.; Wang, H.; et al. Evolution and Chemical Characteristics of Organic Aerosols during Wintertime PM2.5 Episodes in Shanghai, China: Insights Gained from Online Measurements of Organic Molecular Markers. Atmos. Chem. Phys. 2023, 23, 7551–7568. [Google Scholar] [CrossRef]
  10. Shi, T.; Hu, Y.; Liu, M.; Li, C.; Zhang, C.; Liu, C. How Do Economic Growth, Urbanization, and Industrialization Affect Fine Particulate Matter Concentrations? An Assessment in Liaoning Province, China. Int. J. Environ. Res. Public Health 2020, 17, 5441. [Google Scholar] [CrossRef]
  11. Fabbri, D.; Torri, C.; Simoneit, B.R.T.; Marynowski, L.; Rushdi, A.I.; Fabiańska, M.J. Levoglucosan and Other Cellulose and Lignin Markers in Emissions from Burning of Miocene Lignites. Atmos. Environ. 2009, 43, 2286–2295. [Google Scholar] [CrossRef]
  12. Sullivan, A.P.; May, A.A.; Lee, T.; McMeeking, G.R.; Kreidenweis, S.M.; Akagi, S.K.; Yokelson, R.J.; Urbanski, S.P.; Collett, J.L., Jr. Airborne Characterization of Smoke Marker Ratios from Prescribed Burning. Atmos. Chem. Phys. 2014, 14, 10535–10545. [Google Scholar] [CrossRef]
  13. Tian, Y.; Liu, X.; Huo, R.; Shi, Z.; Sun, Y.; Feng, Y.; Harrison, R.M. Organic Compound Source Profiles of PM2.5 from Traffic Emissions, Coal Combustion, Industrial Processes and Dust. Chemosphere 2021, 278, 130429. [Google Scholar] [CrossRef]
  14. Wong, Y.K.; Huang, X.H.H.; Cheng, Y.Y.; Yu, J.Z. Estimating Primary Vehicular Emission Contributions to PM2.5 Using the Chemical Mass Balance Model: Accounting for Gas-Particle Partitioning of Organic Aerosols and Oxidation Degradation of Hopanes. Environ. Pollut. 2021, 291, 118131. [Google Scholar] [CrossRef]
  15. Graham, B.; Mayol-Bracero, O.L.; Guyon, P.; Roberts, G.C.; Decesari, S.; Facchini, M.C.; Artaxo, P.; Maenhaut, W.; Köll, P.; Andreae, M.O. Water-soluble Organic Compounds in Biomass Burning Aerosols over Amazonia 1. Characterization by NMR and GC-MS. J. Geophys. Res. Atmos. 2002, 107, LBA-14. [Google Scholar] [CrossRef]
  16. Wang, G.; Kawamura, K. Molecular Characteristics of Urban Organic Aerosols from Nanjing: A Case Study of a Mega-City in China. Environ. Sci. Technol. 2005, 39, 7430–7438. [Google Scholar] [CrossRef]
  17. Sun, Y.-L.; Zhang, Q.; Schwab, J.J.; Demerjian, K.L.; Chen, W.-N.; Bae, M.-S.; Hung, H.-M.; Hogrefe, O.; Frank, B.; Rattigan, O.V.; et al. Characterization of the Sources and Processes of Organic and Inorganic Aerosols in New York City with a High-Resolution Time-of-Flight Aerosol Mass Apectrometer. Atmos. Chem. Phys. 2011, 11, 1581–1602. [Google Scholar] [CrossRef]
  18. He, X.; Wang, Q.; Huang, X.H.H.; Huang, D.D.; Zhou, M.; Qiao, L.; Zhu, S.; Ma, Y.; Wang, H.; Li, L.; et al. Hourly Measurements of Organic Molecular Markers in Urban Shanghai, China: Observation of Enhanced Formation of Secondary Organic Aerosol during Particulate Matter Episodic Periods. Atmos. Environ. 2020, 240, 117807. [Google Scholar] [CrossRef]
  19. Huang, D.D.; Zhu, S.; An, J.; Wang, Q.; Qiao, L.; Zhou, M.; He, X.; Ma, Y.; Sun, Y.; Huang, C.; et al. Comparative Assessment of Cooking Emission Contributions to Urban Organic Aerosol Using Online Molecular Tracers and Aerosol Mass Spectrometry Measurements. Environ. Sci. Technol. 2021, 55, 14526–14535. [Google Scholar] [CrossRef] [PubMed]
  20. Williams, B.J.; Goldstein, A.H.; Kreisberg, N.M.; Hering, S.V. An In-Situ Instrument for Speciated Organic Composition of Atmospheric Aerosols: T Hermal Desorption a Erosol G C/MS-FID (TAG). Aerosol Sci. Technol. 2006, 40, 627–638. [Google Scholar] [CrossRef]
  21. Li, R.; Wang, Q.; He, X.; Zhu, S.; Zhang, K.; Duan, Y.; Fu, Q.; Qiao, L.; Wang, Y.; Huang, L.; et al. Source Apportionment of PM2.5 in Shanghai Based on Hourly Organic Molecular Markers and Other Source Tracers. Atmos. Chem. Phys. 2020, 20, 12047–12061. [Google Scholar] [CrossRef]
  22. Li, Q.; Zhang, K.; Li, R.; Yang, L.; Yi, Y.; Liu, Z.; Zhang, X.; Feng, J.; Wang, Q.; Wang, W.; et al. Underes-timation of Biomass Burning Contribution to PM2.5 Due to Its Chemical Degradation Based on Hourly Meas-urements of Organic Tracers: A Case Study in the Yangtze River Delta (YRD) Region, China. Sci. Total Environ. 2023, 872, 162071. [Google Scholar] [CrossRef]
  23. Li, R.; Zhang, K.; Li, Q.; Yang, L.; Wang, S.; Liu, Z.; Zhang, X.; Chen, H.; Yi, Y.; Feng, J.; et al. Characteristics and Degradation of Organic Aerosols from Cooking Sources Based on Hourly Observations of Organic Molecular Markers in Urban Environments. Atmos. Chem. Phys. 2023, 23, 3065–3081. [Google Scholar] [CrossRef]
  24. Li, H.; Ma, Y.; Duan, F.; He, K.; Zhu, L.; Huang, T.; Kimoto, T.; Ma, X.; Ma, T.; Xu, L.; et al. Typical Winter Haze Pollution in Zibo, an Industrial City in China: Characteristics, Secondary Formation, and Regional Contribution. Environ. Pollut. 2017, 229, 339–349. [Google Scholar] [CrossRef] [PubMed]
  25. Li, K.; Wang, X.; Li, L.; Wang, J.; Liu, Y.; Cheng, X.; Xu, B.; Wang, X.; Yan, P.; Li, S.; et al. Large Variability of O3-Precursor Relationship during Severe Ozone Polluted Period in an Industry-Driven Cluster City (Zibo) of North China Plain. J. Cleaner Prod. 2021, 316, 128252. [Google Scholar] [CrossRef]
  26. Solomon, P.A.; Crumpler, D.; Flanagan, J.B.; Jayanty, R.K.M.; Rickman, E.E.; McDade, C.E. U.S. National PM2.5 Chemical Speciation Monitoring Networks—CSN and IMPROVE: Description of Networks. J. Air Waste Manag. Assoc. 2014, 64, 1410–1438. [Google Scholar] [CrossRef]
  27. Yao, L.; Yang, L.; Chen, J.; Wang, X.; Xue, L.; Li, W.; Sui, X.; Wen, L.; Chi, J.; Zhu, Y.; et al. Characteristics of Carbonaceous Aerosols: Impact of Biomass Burning and Secondary Formation in Summertime in a Rural Area of the North China Plain. Sci. Total Environ. 2016, 557–558, 520–530. [Google Scholar] [CrossRef] [PubMed]
  28. Paatero, P.; Tapper, U. Positive Matrix Factorization: A Non-negative Factor Model with Optimal Utilization of Error Estimates of Data Values. Environmetrics 1994, 5, 111–126. [Google Scholar] [CrossRef]
  29. Bressi, M.; Sciare, J.; Ghersi, V.; Mihalopoulos, N.; Petit, J.-E.; Nicolas, J.B.; Moukhtar, S.; Rosso, A.; Féron, A.; Bonnaire, N.; et al. Sources and Geographical Origins of Fine Aerosols in Paris (France). Atmos. Chem. Phys. 2014, 14, 8813–8839. [Google Scholar] [CrossRef]
  30. Rogge, W.F.; Hildemann, L.M.; Mazurek, M.A.; Cass, G.R.; Simoneit, B.R.T. Sources of Fine Organic Aerosol. 2. Noncatalyst and Catalyst-Equipped Automobiles and Heavy-Duty Diesel Trucks. Environ. Sci. Technol. 1993, 27, 636–651. [Google Scholar] [CrossRef]
  31. Yang, J.; Lei, G.; Liu, C.; Wu, Y.; Hu, K.; Zhu, J.; Bao, J.; Lin, W.; Jin, J. Characteristics of Particulate-Bound n -Alkanes Indicating Sources of PM2.5 in Beijing, China. Atmos. Chem. Phys. 2023, 23, 3015–3029. [Google Scholar] [CrossRef]
  32. Chen, T.; Deng, L.; Zhang, H.; Li, Y.; Li, J. Polycyclic Aromatic Hydrocarbons and Normal Alkanes in Condensable Particulate Matter of Coal Combustion. J. Energy Inst. 2023, 111, 101398. [Google Scholar] [CrossRef]
  33. Li, C.; Li, Z.; Wang, H. Characterization and Risk Assessment of Polycyclic Aromatic Hydrocarbons (PAHs) Pollution in Particulate Matter in Rural Residential Environments in China-a Review. Sustain. Cities Soc. 2023, 96, 104690. [Google Scholar] [CrossRef]
  34. Pei, B.; Cui, H.; Liu, H.; Yan, N. Chemical Characteristics of Fine Particulate Matter Emitted from Commercial Cooking. Front. Environ. Sci. Eng. 2016, 10, 559–568. [Google Scholar] [CrossRef]
  35. Olson, C.N.; Galloway, M.M.; Yu, G.; Hedman, C.J.; Lockett, M.R.; Yoon, T.; Stone, E.A.; Smith, L.M.; Keutsch, F.N. Hydroxycarboxylic Acid-Derived Organosulfates: Synthesis, Stability, and Quantification in Ambient Aerosol. Environ. Sci. Technol. 2011, 45, 6468–6474. [Google Scholar] [CrossRef]
  36. Ho, K.F.; Huang, R.-J.; Kawamura, K.; Tachibana, E.; Lee, S.C.; Ho, S.S.H.; Zhu, T.; Tian, L. Dicarboxylic Acids, Ketocarboxylic Acids, α-Dicarbonyls, Fatty Acids and Benzoic Acid in PM2.5 Aerosol Collected during CAREBeijing-2007: An Effect of Traffic Restriction on Air Quality. Atmos. Chem. Phys. 2015, 15, 3111–3123. [Google Scholar] [CrossRef]
  37. Vincenti, B.; Paris, E.; Carnevale, M.; Palma, A.; Guerriero, E.; Borello, D.; Paolini, V.; Gallucci, F. Saccharides as Particulate Matter Tracers of Biomass Burning: A Review. Int. J. Environ. Res. Public Health 2022, 19, 4387. [Google Scholar] [CrossRef]
  38. He, X.; Huang, X.H.H.; Chow, K.S.; Wang, Q.; Zhang, T.; Wu, D.; Yu, J.Z. Abundance and Sources of Phthalic Acids, Benzene-Tricarboxylic Acids, and Phenolic Acids in PM2.5 at Urban and Suburban Sites in Southern China. ACS Earth Space Chem. 2018, 2, 147–158. [Google Scholar] [CrossRef]
  39. Schauer, J.J.; Kleeman, M.J.; Cass, G.R.; Simoneit, B.R.T. Measurement of Emissions from Air Pollution Sources. 5. C1 −C32 Organic Compounds from Gasoline-Powered Motor Vehicles. Environ. Sci. Technol. 2002, 36, 1169–1180. [Google Scholar] [CrossRef] [PubMed]
  40. Albinet, A.; Lanzafame, G.M.; Srivastava, D.; Bonnaire, N.; Nalin, F.; Wise, S.A. Analysis and Determination of Secondary Organic Aerosol (SOA) Tracers (Markers) in Particulate Matter Standard Reference Material (SRM 1649b, Urban Dust). Anal. Bioanal. Chem. 2019, 411, 5975–5983. [Google Scholar] [CrossRef]
  41. Zhao, Y.; Tkacik, D.S.; May, A.A.; Donahue, N.M.; Robinson, A.L. Mobile Sources Are Still an Important Source of Secondary Organic Aerosol and Fine Particulate Matter in the Los Angeles Region. Environ. Sci. Technol. 2022, 56, 15328–15336. [Google Scholar] [CrossRef]
  42. Cass, G.R. Organic Molecular Tracers for Particulate Air Pollution Sources. TrAC Trends Anal. Chem. 1998, 17, 356–366. [Google Scholar] [CrossRef]
  43. Wang, Q.; Shao, M.; Zhang, Y.; Wei, Y.; Hu, M.; Guo, S. Source Apportionment of Fine Organic Aerosols in Beijing. Atmos. Chem. Phys. 2009, 9, 8573–8585. [Google Scholar] [CrossRef]
  44. Hildemann, L.M.; Markowski, G.R.; Cass, G.R. Chemical Composition of Emissions from Urban Sources of Fine Organic Aerosol. Environ. Sci. Technol. 1991, 25, 744–759. [Google Scholar] [CrossRef]
  45. Duan, L.; Yu, H.; Wang, Q.; Cao, Y.; Wang, G.; Sun, X.; Li, H.; Lin, T.; Guo, Z. PM2.5-Bound Polycyclic Aromatic Hydrocarbons of a Megacity in Eastern China: Source Apportionment and Cancer Risk Assessment. Sci. Total Environ. 2023, 869, 161792. [Google Scholar] [CrossRef]
  46. Wang, Q.; Liu, M.; Yu, Y.; Li, Y. Characterization and Source Apportionment of PM2.5-Bound Polycyclic Aromatic Hydrocarbons from Shanghai City, China. Environ. Pollut. 2016, 218, 118–128. [Google Scholar] [CrossRef]
  47. Zhang, Z.; Zhu, W.; Hu, M.; Wang, H.; Tang, L.; Hu, S.; Shen, R.; Yu, Y.; Song, K.; Tan, R.; et al. Secondary Organic Aerosol Formation in China from Urban-Lifestyle Sources: Vehicle Exhaust and Cooking Emission. Sci. Total Environ. 2023, 857, 159340. [Google Scholar] [CrossRef]
  48. Kumar, V.; Slowik, J.G.; Baltensperger, U.; Prevot, A.S.H.; Bell, D.M. Time-Resolved Molecular Characterization of Secondary Organic Aerosol Formed from OH and NO3 Radical Initiated Oxidation of a Mixture of Aromatic Precursors. Environ. Sci. Technol. 2023, 57, 11572–11582. [Google Scholar] [CrossRef]
  49. Surratt, J.D.; Gómez-González, Y.; Chan, A.W.H.; Vermeylen, R.; Shahgholi, M.; Kleindienst, T.E.; Edney, E.O.; Offenberg, J.H.; Lewandowski, M.; Jaoui, M.; et al. Organosulfate Formation in Biogenic Secondary Organic Aerosol. J. Phys. Chem. A 2008, 112, 8345–8378. [Google Scholar] [CrossRef] [PubMed]
  50. Ren, Y.; Wang, G.; Zhang, Q.; Tao, C.; Ji, S.; Wang, Q.; Wang, W. The Impact of Chinese New Year on Air Quality in North China Based on Machine Learning. Atmos. Environ. 2025, 342, 120874. [Google Scholar] [CrossRef]
  51. Wang, K.; Gao, J.; Liu, K.; Tong, Y.; Dan, M.; Zhang, X.; Liu, C. Unit-Based Emissions and Environmental Impacts of Industrial Condensable Particulate Matter in China in 2020. Chemosphere 2022, 303, 134759. [Google Scholar] [CrossRef] [PubMed]
  52. Jasiński, R.; Strzemiecka, B.; Koltsov, I.; Mizeracki, J.; Kurzawska, P. Physicochemical Analysis of the Particulate Matter Emitted from Road Vehicle Engines. Energies 2021, 14, 8556. [Google Scholar] [CrossRef]
  53. Adesina, J.A.; Piketh, S.J.; Qhekwana, M.; Burger, R.; Language, B.; Mkhatshwa, G. Contrasting Indoor and Ambient Particulate Matter Concentrations and Thermal Comfort in Coal and Non-Coal Burning Households at South Africa Highveld. Sci. Total Environ. 2020, 699, 134403. [Google Scholar] [CrossRef] [PubMed]
  54. Harrison, R.M. Airborne Particulate Matter. Philos. Trans. R. Soc. A Math. Phys. Eng. Sci. 2020, 378, 20190319. [Google Scholar] [CrossRef]
  55. Adam, M.G.; Tran, P.T.M.; Bolan, N.; Balasubramanian, R. Biomass Burning-Derived Airborne Particulate Matter in Southeast Asia: A Critical Review. J. Hazard. Mater. 2021, 407, 124760. [Google Scholar] [CrossRef]
  56. Sima, A.K.; Szettele, A.-L.M.; Neuberger, M. Fine and Ultrafine Particle Pollution before and after a Smoking Ban in the Catering Industry in Vienna. Int. J. Occup. Environ. Med. 2021, 1, 18–28. [Google Scholar] [CrossRef]
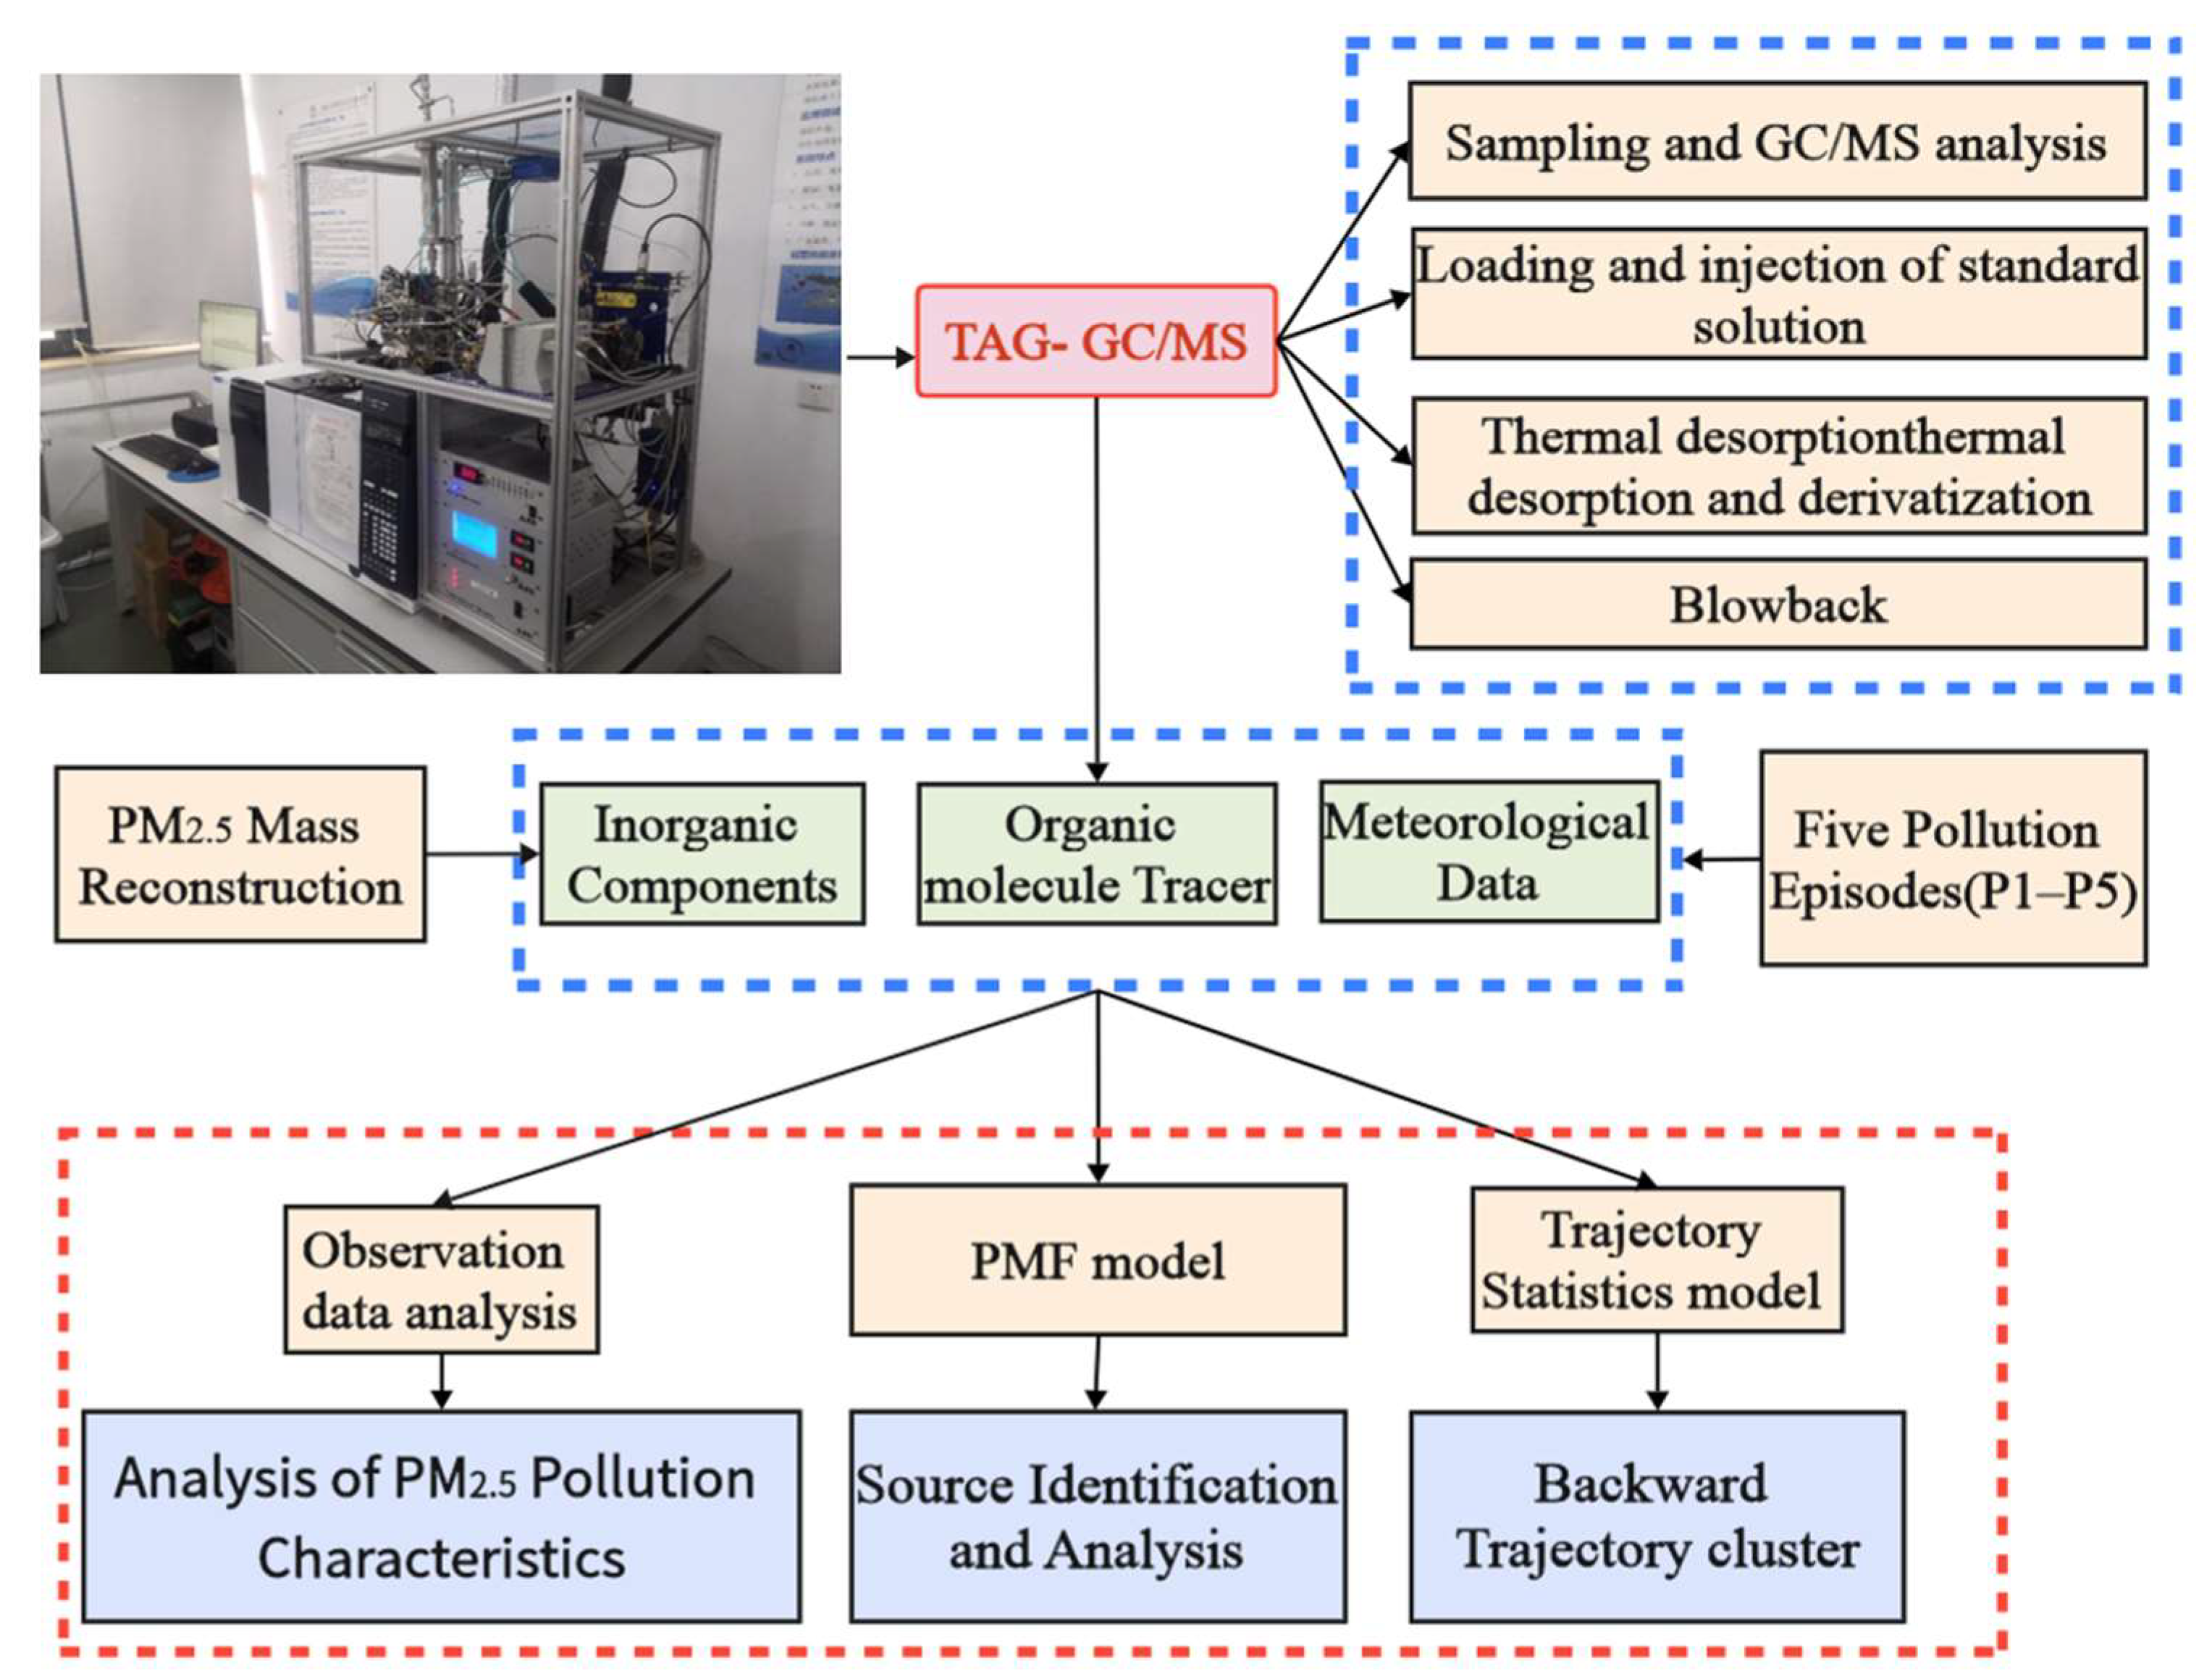
Figure 1. Technical framework of this study.
Sustainability 17 10587 g001
Figure 2. Geographical location of the sampling site.
Sustainability 17 10587 g002
Figure 3. Average concentrations of organic tracers during the observation period.
Sustainability 17 10587 g003
Figure 4. Time series of concentrations of PM10, PM2.5, and the components during the observation period.
Sustainability 17 10587 g004
Figure 5. Mass proportion of each type of organic molecules measured by the TAG-GC/MS system during the observation period.
Sustainability 17 10587 g005
Figure 6. Comparison of the concentrations for each type of organic tracer during the pollution episodes with those during clean periods ((a): n-Alkanes; (b): Hopanes; (c): PAHs; (d): Cholesterol and fatty acids; (e): Dicarboxylic acids; (f): Saccharides; (g): Aromatic acids; (h): Hydroxy carboxylic acids; (i): SOA tracers).
Sustainability 17 10587 g006
Figure 7. Concentration (a) and percentage (b) of each type of organic molecules during various pollution episodes.
Sustainability 17 10587 g007
Figure 8. Percentage of Explanatory Variables for the PMF Eight Factors.
Sustainability 17 10587 g008
Figure 9. The average source apportionment results of PM2.5 (a) and OC (b) during the pollution episodes based on the PMF model.
Sustainability 17 10587 g009
Figure 10. The average source apportionments of PM2.5 for various pollution episodes based on the PMF model.
Sustainability 17 10587 g010
Figure 11. Backward trajectories and potential source contributions for five pollution episodes, with P1–P5 represented by (ae).
Sustainability 17 10587 g011
Table 1. Organic molecule tracers measured by TAG during the entire observation period.
No.TypeTypes of Organic MoleculesConcentration (ng/m3)Main Sources
1n-AlkanesC19–C34145.7 ± 77.2Fossil fuel combustion & terrestrial plant release et al. [30,31]
2Hopanesαβ-Hopane, αβ-Norhopane, 17α(H)-22,29,30-Trisnorhopane2.2 ± 0.8Fossil fuel combustion [14]
3PAHsFluorene, Phenanthrene, Anthracene, Fluoranthene, Pyrene, Benzo_a_anthracene, Chrysene, Benzo_b_fluoranthene, Benzo_k_fluoranthene, Benzo_a_pyrene, Dibenz_a_h_anthracene, Benzo_ghi_perylene, Indeno_123_cd_pyrene79.5 ± 24.2Various combustion sources (mainly coal combustion sources) [32,33]
4Cholesterol and fatty acidsOleic acid, stearic acid, palmitic acid, and cholesterol57.4 ± 43.0Cooking [34]
5Dicarboxylic acidssuccinic acid, glutaric acid, adipic acid, pimelic acid, suberic acid, azelaic acid56.7 ± 40.7secondary formation [35]
6SaccharidesDextran, mannitol, sucrose, mannan, glucose, glycerol71.2 ± 41.7Industry sources, biomass burning & terrestrial plant release [36,37]
7Aromatic acidTerephthalic acid, phthalic acid, isophthalic acid, vanillic acid, 4-hydroxybenzoic acid, 3-hydroxybenzoic acid58.7 ± 38.8road mobile sources & secondary formation [38,39]
8Hydroxycarboxylic acidMalic acid, tartaric acid55.7 ± 68.5Secondary formation [35]
9SOA tracer2-methylglyceric acid, 3-methyl-1,2,3-butanetricarboxylic acid, 2,3-dihydroxy-4-oxopentanoic acid, pinic acid, Cis-pinonic acid14.1 ± 9.6SOA [40,41]
10Total amount of TAG substance 541.3 ± 344.5
Table 2. Organic compound-derived species used as input data for PMF model.
No.SpeciesOrganic MoleculesAverage Concentration (ng/m3)Main SourcesLOD
1Alk_oddn-C25, n-C27, n-C29, n-C31 and n-C3344.6 ± 26.8terrestrial plant release, Fossil fuel combustion [42]/
2Alk_evenn-C24, n-C26, n-C28, n-C30 and n-C3241.1 ± 24.5Fossil fuel combustion [43]/
3HopaneHopane1.0 ± 0.5Fossil fuel combustion [44]/
4NorhopaneNorhopane1.0 ± 0.5Fossil fuel combustion [44]/
5PAHs_252Benzo[b+k]fluoranthene, Benzo[a]pyrene3.8 ± 2.4Combustion source [45]/
6PAHs_276Benzo[g,h,i]perylene, Indeno[1,2,3-cd]pyrene5.1 ± 4.2Combustion source [46]/
7Oleic_acidOleic acid8.5 ± 8.6Cooking [47]/
8Palmitic_acidPalmitic acid30.1 ± 21.0Cooking [47]/
9Stearic_acidStearic acid21.5 ± 31.6Cooking [47]/
10LevoglucosanLevoglucosan56.5 ± 39.5biomass burning [44]/
11MannosanMannosan2.7 ± 2.1biomass burning [44]/
12Phthalic_acidPhthalic acid11.8 ± 11.1Oxidation of naphthalene and its derivatives [48]0.009
132_MGA2-Methylglyceric acid0.7 ± 0.5Isoprene oxidation products [49]0.0717
14α-PinTPinic acid, Cis-pinonic acid10.3 ± 7.8α- Pinene Oxidation Products [49]0.0143
Table 3. Average concentrations of PM2.5 (μg/m3) carried by different air masses for the five pollution episodes.
ClusterP1P2P3P4P5
Cluster_198.2180.176.735.587.8
Cluster_241.888.856.934.2206.2
Cluster_3204.898.9172.5157.289.8
Cluster_4 119.7 139.560.3
Cluster_5 43.1145.8
Disclaimer/Publisher’s Note: The statements, opinions and data contained in all publications are solely those of the individual author(s) and contributor(s) and not of MDPI and/or the editor(s). MDPI and/or the editor(s) disclaim responsibility for any injury to people or property resulting from any ideas, methods, instructions or products referred to in the content.