A Climate-Driven Dynamic Model for Highway Emissions in Arid Cities Modifying AP-42 and EEA Algorithms with Silt Loading, Building Geometry, and Fuel Density Parameters
Abstract
1. Introduction
2. Methodology
2.1. Study Area and Route Selection
2.2. Data Sources and Preprocessing
2.3. Vehicular Air Pollutant Model Development
2.3.1. Particulate Matter (PM10 and PM2.5)
(gasoline cars) + PM (diesel cars).
2.3.2. Carbon Monoxide (CO) and Nitrogen Dioxide (NO2)
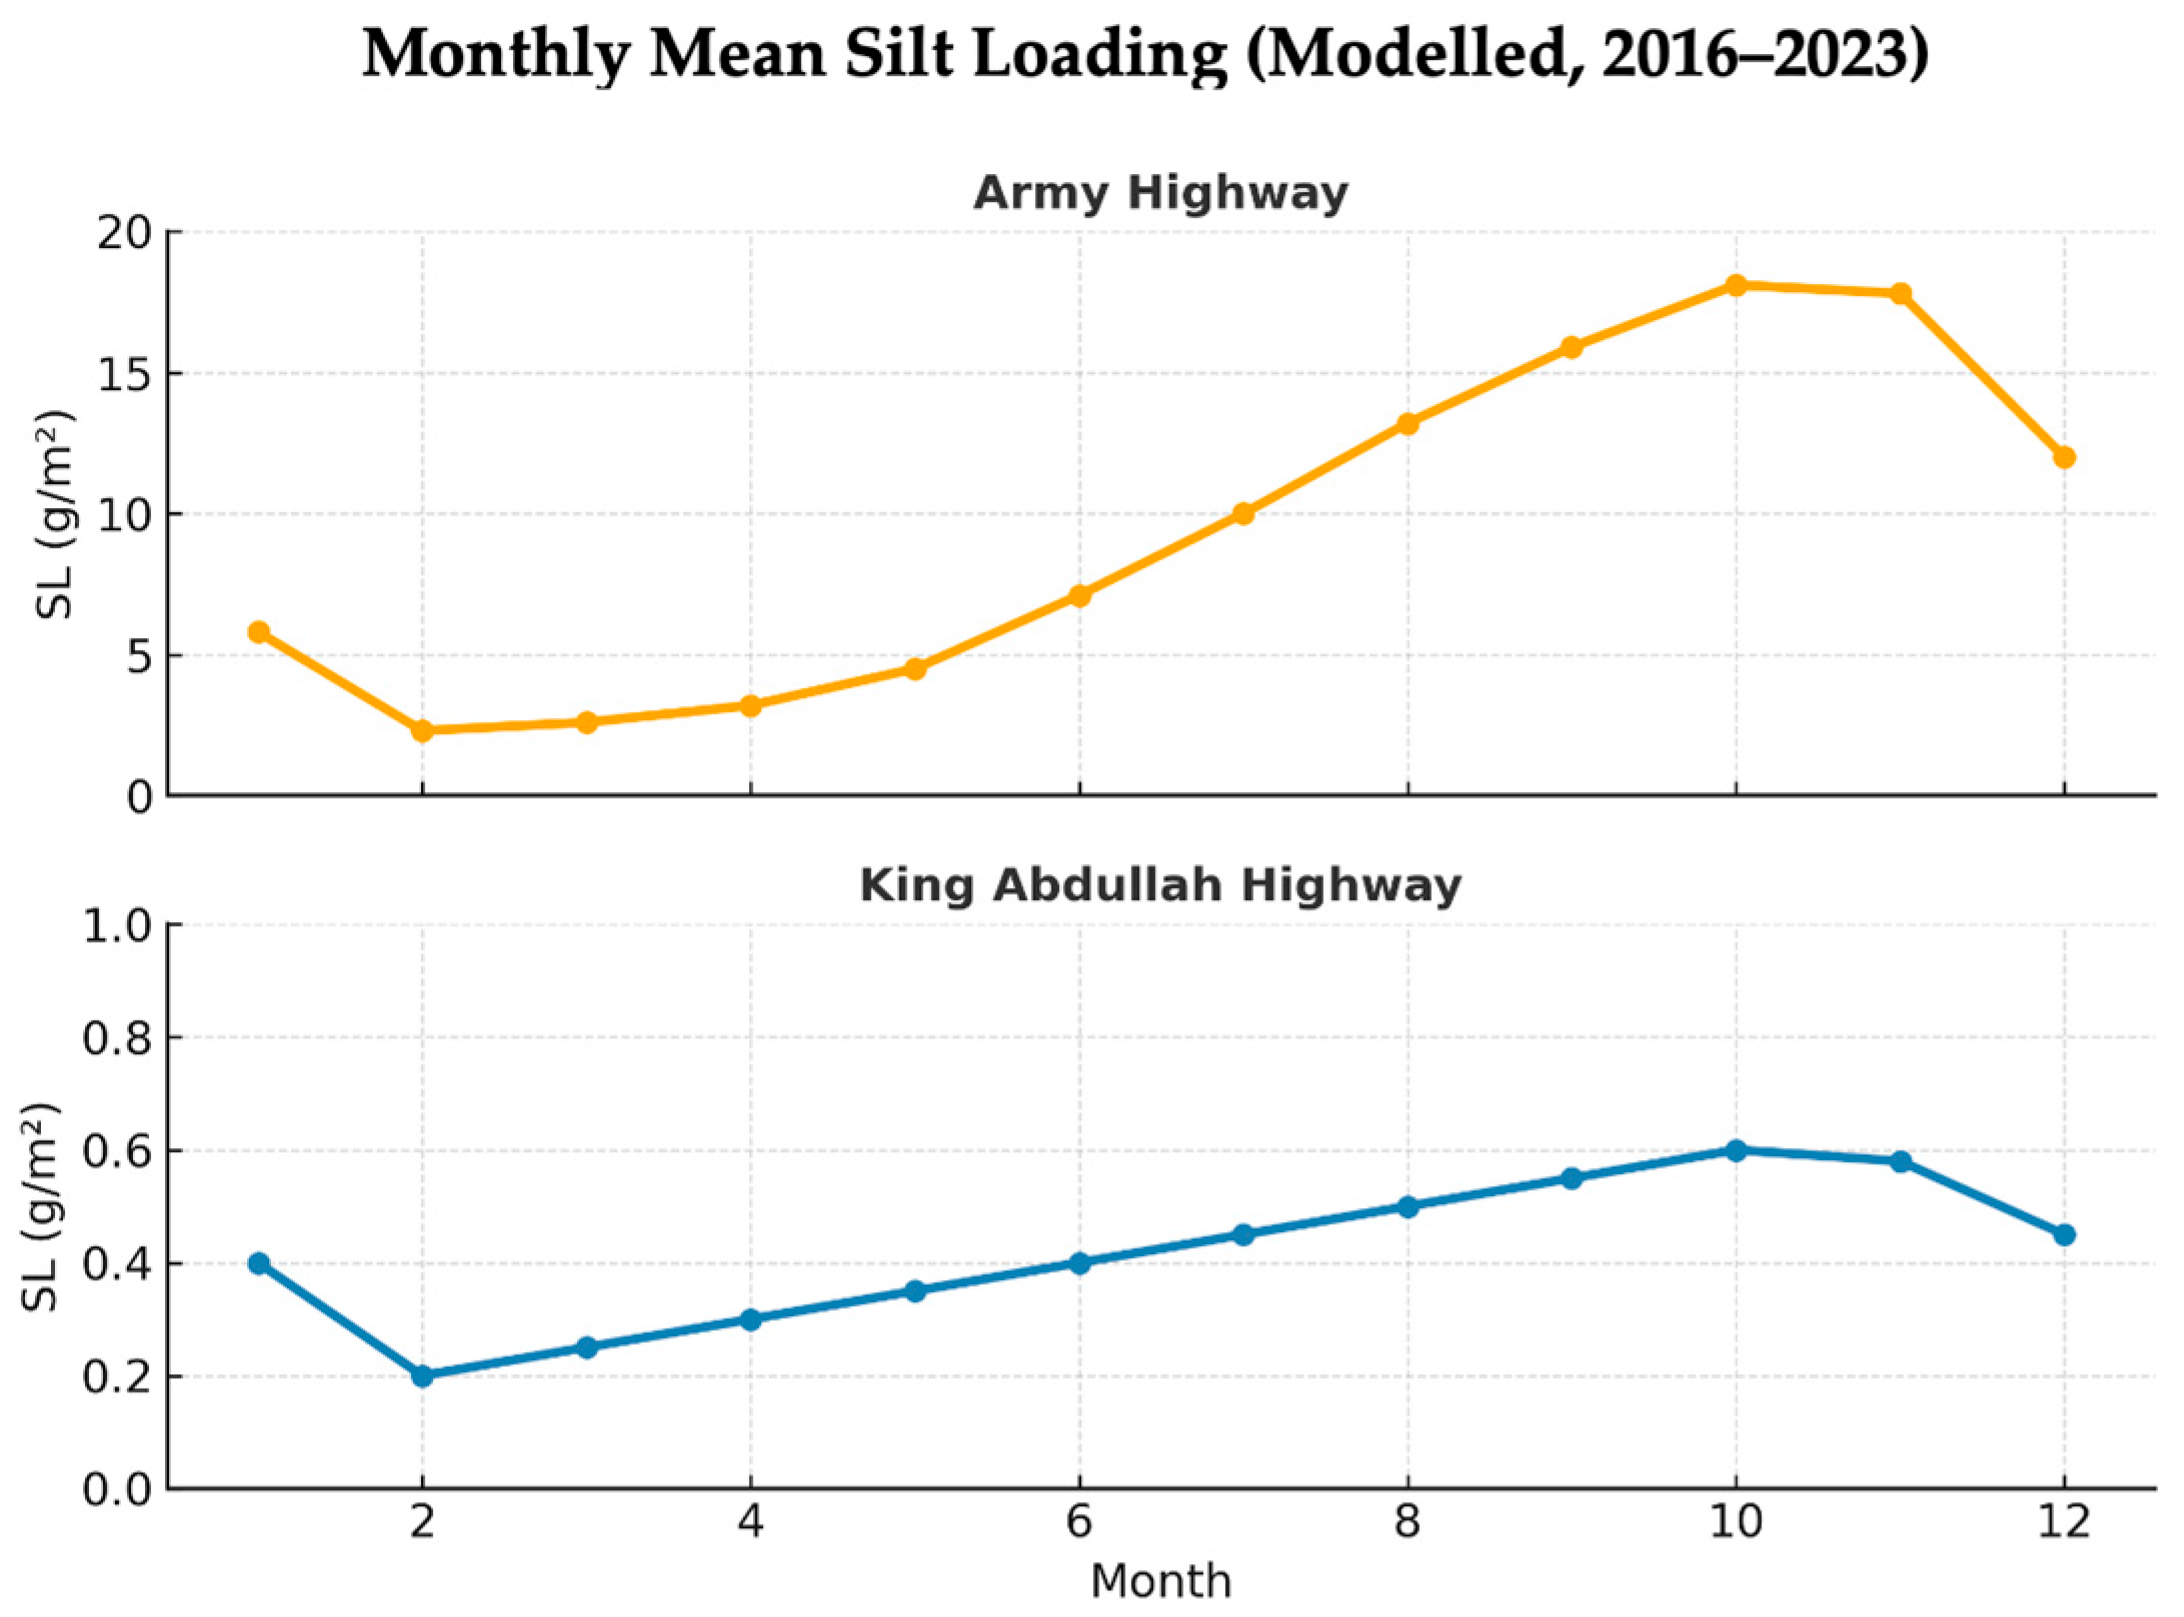
2.3.3. Dynamic Silt Loading Model
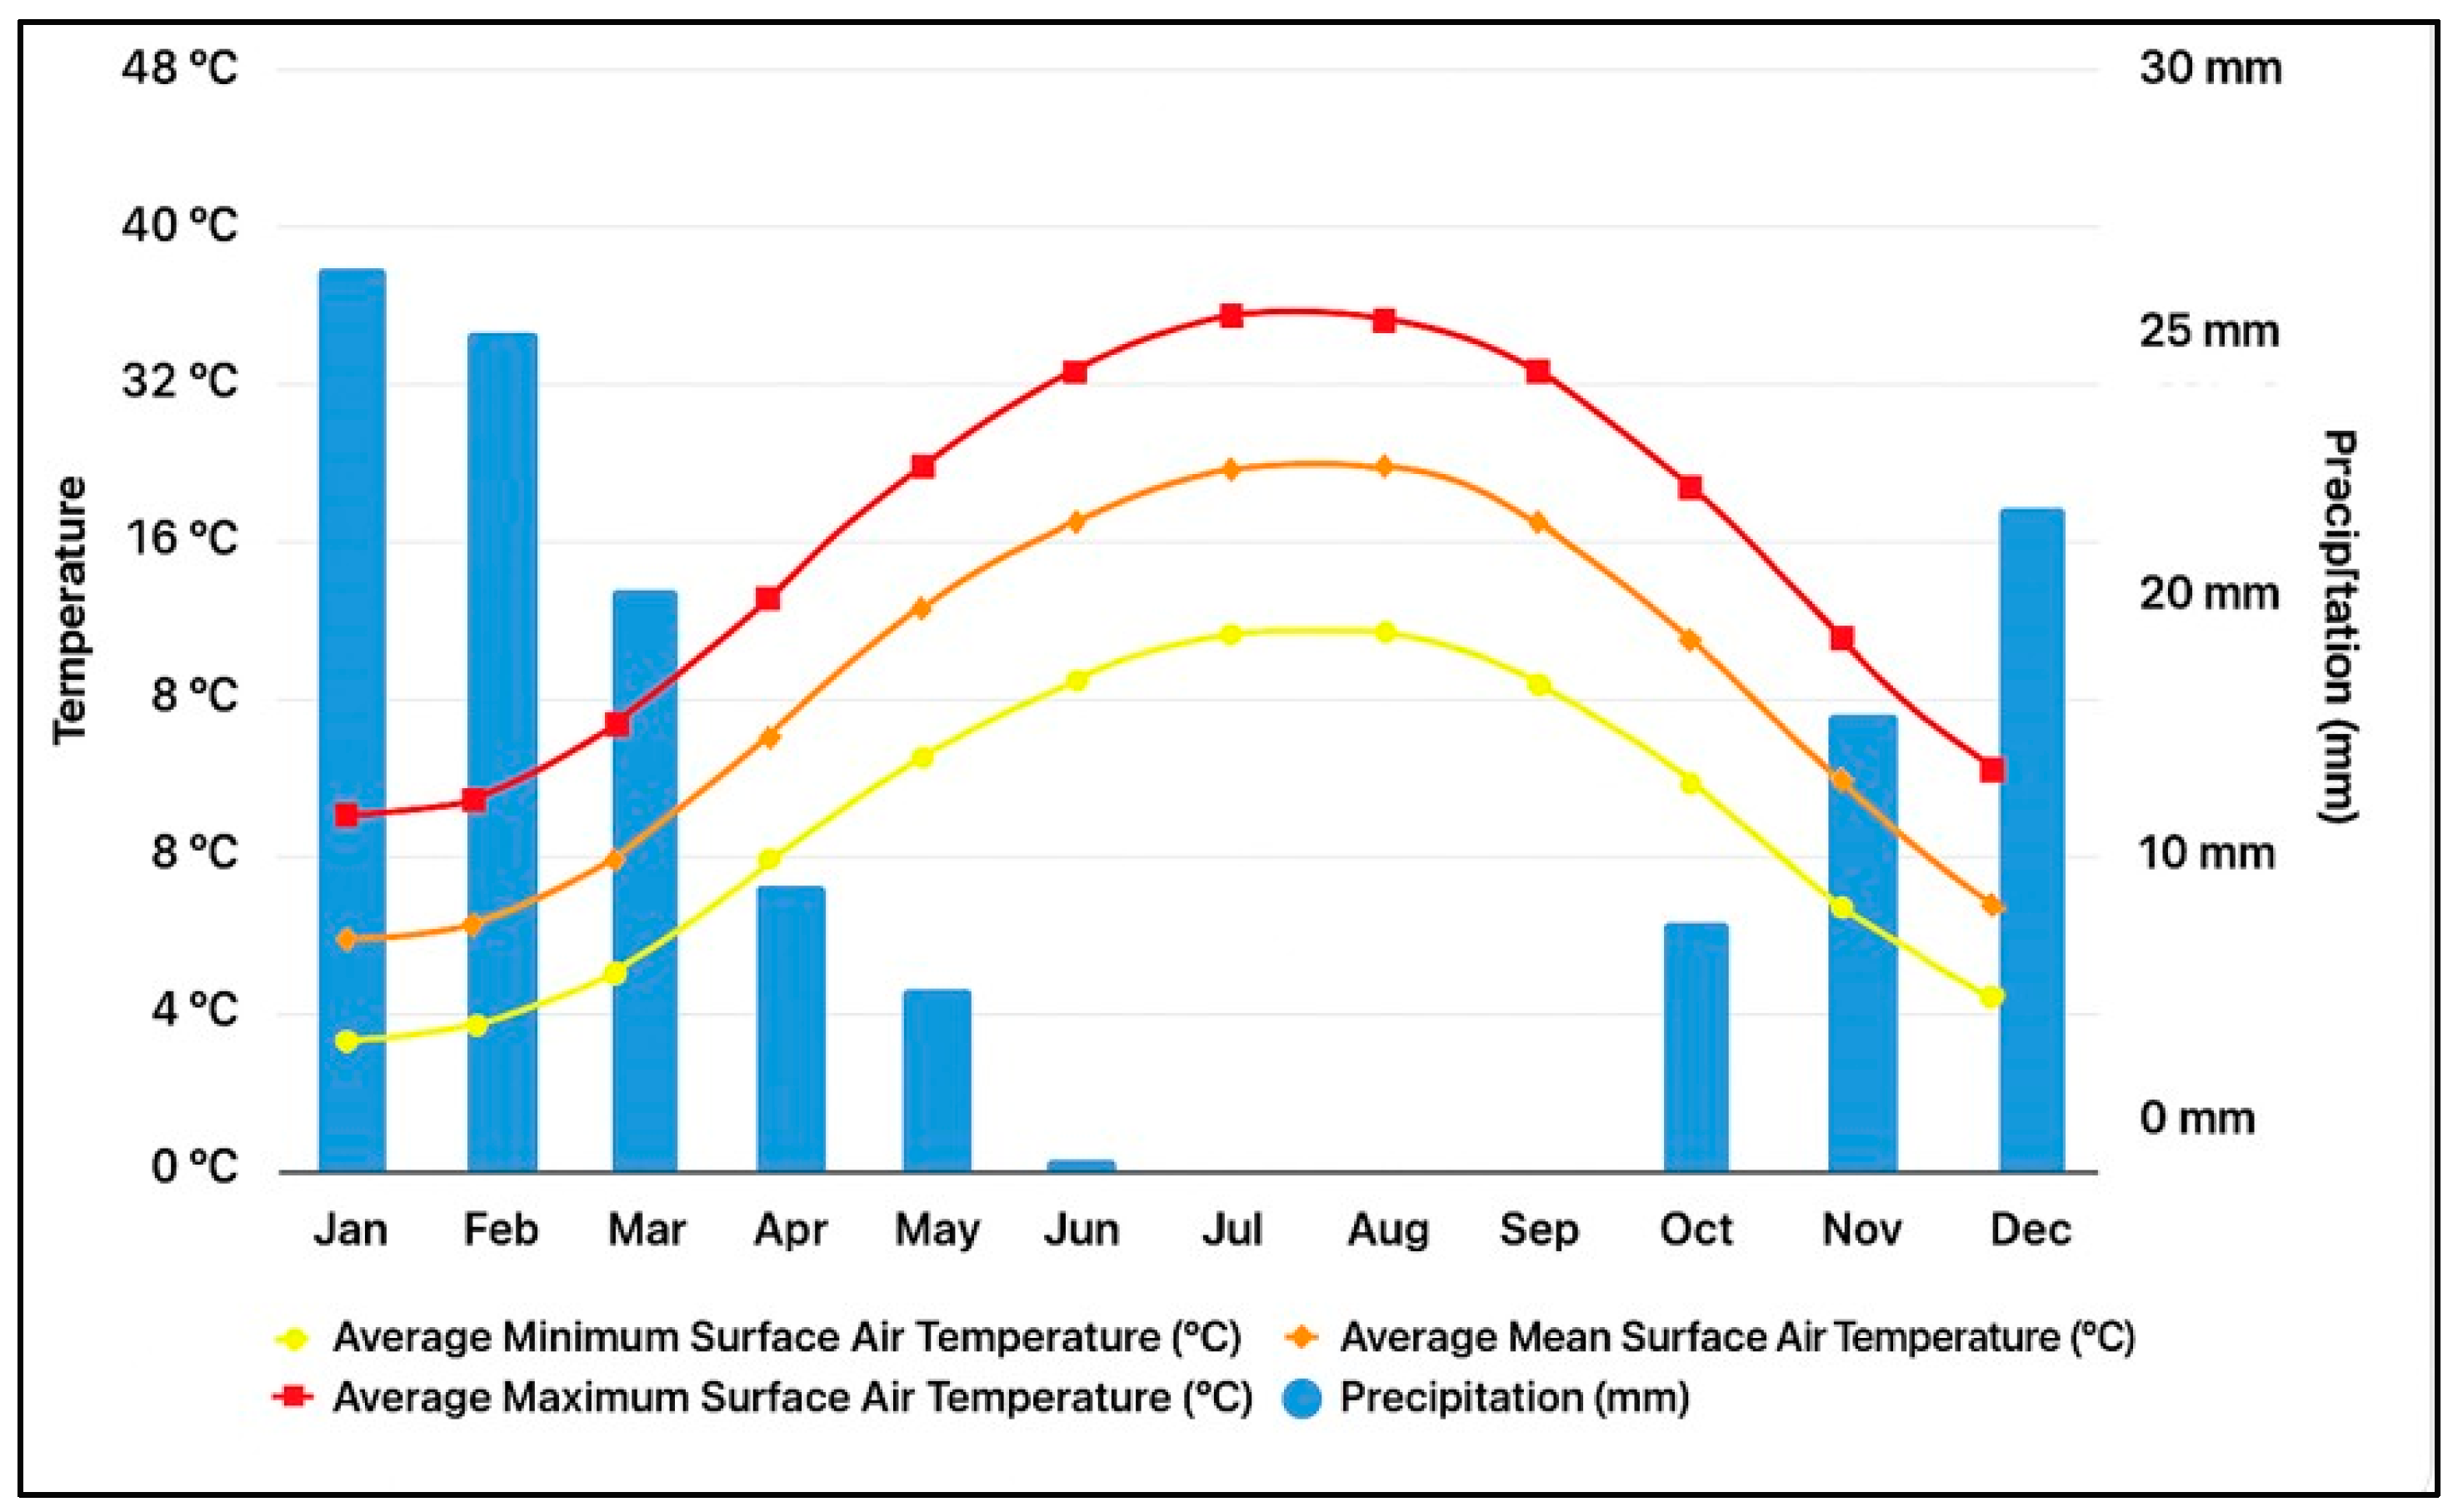
2.3.4. Model Validation and Statistical Analysis
3. Results and Discussion
3.1. Model Inputs and Rationale for Modifications
- A.
- Parameterization of the Urban Canyon Effect: The incorporation of the cross-sectional aspect ratio, defined as the highway width to the mean adjacent building height (I/H), directly addresses the perturbation of atmospheric dispersion mechanics in semi-enclosed urban morphologies. This geometric parameter is a primary determinant of airflow regimes and vortex formation, governing the entrapment and recirculation of pollutants within the street canyon. Consequently, this modification mechanistically accounts for the elevated residence time of airborne particulates, which directly influences the potential for resuspension and the resulting ambient concentrations, a phenomenon entirely neglected in the original AP-42 formulation. While the Army Highway exhibits a marginally higher I/H ratio (2.33) compared to the King Abdullah corridor (1.92). Both I/H ratios (2.33 and 1.92) indicate significant canyon configurations that substantially influence pollutant dispersion patterns, necessitating this correction for any meaningful assessment in arid urban environments [31].
- B.
- Mass-balance correction for fuel consumption: The explicit integration of fuel density (ρ_gasoline = 0.75 kg L−1; ρ_diesel = 0.85 kg L−1) rectifies a fundamental oversight in the application of the EEA guidebook methodology when primary data is volumetric. The standard approach of applying mass-based emission factors (in g kg fuel−1) to volumetric consumption data (in L) without this conversion violates mass-balance principles and introduces a systematic error [32]. This modification ensures a physically accurate and dimensionally consistent calculation of exhaust emissions, establishing a robust foundation for the estimation of CO and NO2 fluxes from the vehicular fleet [33].
3.2. Comparative Analysis of Emission Trends
3.3. Quantitative Model Validation and Performance
3.4. Implementation and Performance of the Climate-Driven Silt Loading Model
3.5. Comparative Analysis with Established Modeling Frameworks
3.6. Implications and Future Directions
4. Conclusions
- These advancements provide a critical tool for environmental management, as follow:
- [1]
- High-resolution policymaking through precise hotspot identification;
- [2]
- Climate-resilient planning by accounting for how seasonal and meteorological variations affect emission inventories;
- [3]
- Robust cost–benefit analysis of mitigation measures like low-emission zones or street cleaning schedules.
Author Contributions
Funding
Institutional Review Board Statement
Informed Consent Statement
Data Availability Statement
Acknowledgments
Conflicts of Interest
References
- Herath Bandara, S.J.; Thilakarathne, N. Economic and Public Health Impacts of Transportation-Driven Air Pollution in South Asia. Sustainability 2025, 17, 2306. [Google Scholar] [CrossRef]
- Miller, M.R.; Newby, D.E. Air pollution and cardiovascular disease: Car sick. Cardiovasc Res. 2019, 116, 279–294. [Google Scholar] [CrossRef] [PubMed]
- Sinharay, R.; Gong, J.; Barratt, B.; Ohman-Strickland, P.; Ernst, S.; Kelly, F.J.; Zhang, J.J.; Collins, P.; Cullinan, P.; Chung, K.F. Respiratory and cardiovascular responses to walking down a traffic-polluted road compared with walking in a traffic-free area in participants aged 60 years and older with chronic lung or heart disease and age-matched healthy controls: A randomised, crossover study. The Lancet 2018, 391, 339–349. [Google Scholar] [CrossRef]
- Meo, S.A.; Ahmed Alqahtani, S.; Saad Binmeather, F.; Abdulrhman AlRasheed, R.; Mohammed Aljedaie, G.; Mohammed Albarrak, R. Effect of environmental pollutants PM2.5, CO, O3 and NO2, on the incidence and mortality of SARS-CoV-2 in largest metropolitan cities, Delhi, Mumbai and Kolkata, India. J. King. Saud. Univ. Sci. 2022, 34, 101687. [Google Scholar] [CrossRef]
- Guerrero, C.C.; Günthardt-Goerg, M.S.; Vollenweider, P. Foliar Symptoms Triggered by Ozone Stress in Irrigated Holm Oaks from the City of Madrid, Spain. PLoS ONE 2013, 8, e69171. [Google Scholar] [CrossRef]
- Bdour, A.N.; Hamdi, M.R.; Shawaqfeh, M.S.; Al-Hussinat, M.M. Enhancing public participation in local air pollution assessment: A citizen participation prototype from Zarqa governorate, Jordan. Environ. Eng. Sci. 2008, 25, 451–456. [Google Scholar] [CrossRef]
- Khatatbeh, M.; Alzoubi, K.; Khabour, O.; Al-Delaimy, W. Adverse Health Impacts of Living Near an Oil Refinery in Jordan. Environ. Health Insights 2020, 14, 117863022098579. [Google Scholar] [CrossRef]
- Pant, P.; Harrison, R.M. Estimation of the contribution of road traffic emissions to particulate matter concentrations from field measurements: A review. Atmos Environ. 2013, 77, 78–97. [Google Scholar] [CrossRef]
- Abu-Allaban, M.; Abu-Qdais, H. Impact assessment of ambient air quality by cement industry: A case study in Jordan. Aerosol. Air Qual Res. 2011, 11, 802–810. [Google Scholar] [CrossRef]
- Ferm, M.; Sjöberg, K. Concentrations and emission factors for PM 2.5 and PM 10 from road traffic in Sweden. Atmos. Environ. 2015, 119, 211–219. [Google Scholar] [CrossRef]
- Campagnolo, D.; Borghi, F.; Fanti, G.; Keller, M.; Rovelli, S.; Spinazzè, A.; Cattaneo, A.; Cavallo, D.M. Factors affecting in-vehicle exposure to traffic-related air pollutants: A review. Atmos Environ. 2023, 295, 119560. [Google Scholar] [CrossRef]
- Nejadkoorki, F.; Nicholson, K.; Lake, I.; Davies, T. An approach for modelling CO2 emissions from road traffic in urban areas. Sci. Total Environ. 2008, 406, 269–278. [Google Scholar] [CrossRef]
- Cha, Y.; Lee, J.J.; Song, C.H.; Kim, S.; Park, R.J.; Lee, M.I.; Woo, J.H.; Choi, J.H.; Bae, K.; Yu, J.; et al. Investigating uncertainties in air quality models used in GMAP/SIJAQ 2021 field campaign: General performance of different models and ensemble results. Atmos Environ. 2025, 340, 120896. [Google Scholar] [CrossRef]
- Hooyberghs, H.; De Craemer, S.; Lefebvre, W.; Vranckx, S.; Maiheu, B.; Trimpeneers, E.; Vanpoucke, C.; Janssen, S.; Meysman, F.J.; Fierens, F. Validation and optimization of the ATMO-Street air quality model chain by means of a large-scale citizen-science dataset. Atmos Environ. 2022, 272, 118946. [Google Scholar] [CrossRef]
- Paunu, V.V.; Karvosenoja, N.; Segersson, D.; López-Aparicio, S.; Nielsen, O.K.; Schmidt Plejdrup, M.; Thorsteinsson, T.; Vo, D.T.; Kuenen, J.; Denier van der Gon, H.; et al. Air pollution emission inventory using national high-resolution spatial parameters for the Nordic countries and analysis of PM 2.5 spatial distribution for road transport and machinery and off-road sectors. Earth Syst. Sci. Data 2024, 16, 1453–1474. [Google Scholar] [CrossRef]
- Bishoi, B.; Prakash, A.; Jain, V.K. A Comparative Study of Air Quality Index Based on Factor Analysis and US-EPA Methods for an Urban Environment. Aerosol Air Qual Res. 2009, 9, 1–17. [Google Scholar] [CrossRef]
- U.S. Environmental Protection Agency. Air Emissions Models for Waste and Waste water. Off. Air Qual. Plan. Stand. Res. Triangle Park NC EPA-4 1994, 5, 4–8. [Google Scholar]
- Ghermandi, G.; Fabbi, S.; Veratti, G.; Bigi, A.; Teggi, S. Estimate of Secondary NO2 Levels at Two Urban Traffic Sites Using Observations and Modelling. Sustainability 2020, 12, 7897. [Google Scholar] [CrossRef]
- Veratti, G.; Fabbi, S.; Bigi, A.; Lupascu, A.; Tinarelli, G.; Teggi, S.; Brusasca, G.; Butler, T.M.; Ghermandi, G. Towards the coupling of a chemical transport model with a micro-scale Lagrangian modelling system for evaluation of urban NOx levels in a European hotspot. Atmos Environ. 2020, 223, 117285. [Google Scholar] [CrossRef]
- Kharabsheh, R.M.; Bdour, A.N. Impact of COVID-19 on the Yearly Concentration Reduction of Three Criteria Air Pollutants and Meteorological Parameters’ Effects on Aerosol Dispersion. Nat. Environ. Pollut. Technol. 2025, 24, 63–76. [Google Scholar] [CrossRef]
- Ruda Sarria, F.; Guerrero Delgado Mc Monge Palma, R.; Palomo Amores, T.; Sánchez Ramos, J.; Álvarez Domínguez, S. Modelling Pollutant Dispersion in Urban Canyons to Enhance Air Quality and Urban Planning. Appl. Sci. 2025, 15, 1752. [Google Scholar] [CrossRef]
- Woo, S.H.; Jang, H.; Lee, S.B.; Lee, S. Comparison of total PM emissions emitted from electric and internal combustion engine vehicles: An experimental analysis. Sci. Total Environ. 2022, 842, 156961. [Google Scholar] [CrossRef]
- European Environment Agency (EEA). EMEP/EEA Air Pollutant Emission Inventory Guidebook 2023: Technical Guidance to Prepare National Emission Inventories. Publications Office of the European Union. 2023. Available online: https://www.eea.europa.eu/en/analysis/publications/emep-eea-guidebook-2023 (accessed on 2 February 2025).
- Garan, N.; Dybe, S.; Paschereit, C.O.; Djordjevic, N. Consistent emission correction factors applicable to novel energy carriers and conversion concepts. Fuel 2023, 341, 127658. [Google Scholar] [CrossRef]
- Vîrghileanu, M.; Săvulescu, I.; Mihai, B.A.; Nistor, C.; Dobre, R. Nitrogen Dioxide (NO2) Pollution Monitoring with Sentinel-5P Satellite Imagery over Europe during the Coronavirus Pandemic Outbreak. Remote Sens. 2020, 12, 3575. [Google Scholar] [CrossRef]
- Darabi, H.; Mohamadi, S.; Karimidastenaei, Z.; Kisi, O.; Ehteram, M.; ELShafie, A.; Torabi Haghighi, A. Prediction of daily suspended sediment load (SSL) using new optimization algorithms and soft computing models. Soft. Comput. 2021, 25, 7609–7626. [Google Scholar] [CrossRef]
- Beddows, D.C.S.; Harrison, R.M. PM10 and PM2.5 emission factors for non-exhaust particles from road vehicles: Dependence upon vehicle mass and implications for battery electric vehicles. Atmos Environ. 2021, 244, 117886. [Google Scholar] [CrossRef]
- Abdallat, R.; Bdour, A.; Haifa, A.A.; Al Rawash, F.; Almakhadmah, L.; Hazaimeh, S. Global Journal of Environmental Science and Management Development of a sustainable, green, and solar-powered filtration system for E. coli removal and greywater treatment. Global J. Environ. Sci. Manag. 2024, 10, 435–450. [Google Scholar] [CrossRef]
- Cui, X.; Zhang, N.; Zhang, J.; Gao, Z. In situ tests simulating traffic-load-induced settlement of alluvial silt subsoil. Soil Dyn. Earthq. Eng. 2014, 58, 10–20. [Google Scholar] [CrossRef]
- Sokolovsky, K.V.; Gavras, P.; Karampelas, A.; Antipin, S.V.; Bellas-Velidis, I.; Benni, P.; Bonanos, A.Z.; Burdanov, A.Y.; Derlopa, S.; Hatzidimitriou, D.; et al. Comparative performance of selected variability detection techniques in photometric time series data. Mon. Not. R Astron. Soc. 2017, 464, 274–292. [Google Scholar] [CrossRef]
- Abdulateef, M.F.; Majeed, F.A.; Al-Alwan, H.A.S.; Qasim, M.B. Assessing canyon geometry effect on the thermal comfort in a hot semi-arid climate: Baghdad city as case study. Ain. Shams Eng. J. 2025, 16, 103247. [Google Scholar] [CrossRef]
- Wang, X.; Yue, X.; Huang, J.; Li, S. Integrating Traffic Dynamics and Emissions Modeling: From Classical Approaches to Data-Driven Futures. Atmosphere 2025, 16, 695. [Google Scholar] [CrossRef]
- Mancheno, G.; Jorquera, H. High spatial resolution WRF-Chem modeling in Quito, Ecuador. Environ. Sci. Adv. 2025, 4, 1310–1332. [Google Scholar] [CrossRef]
- Wang, S.X.; Zhao, B.; Cai, S.Y.; Klimont, Z.; Nielsen, C.P.; Morikawa, T.; Woo, J.H.; Kim, Y.; Fu, X.; Xu, J.Y.; et al. Emission trends and mitigation options for air pollutants in East Asia. Atmos. Chem. Phys. 2014, 14, 6571–6603. [Google Scholar] [CrossRef]
- Stirnweis, L.; Marcolli, C.; Dommen, J.; Barmet, P.; Frege, C.; Platt, S.M.; Bruns, E.A.; Krapf, M.; Slowik, J.G.; Wolf, R.; et al. Assessing the influence of NOx concentrations and relative humidity on secondary organic aerosol yields from α -pinene photo-oxidation through smog chamber experiments and modelling calculations. Atmos. Chem. Phys. 2017, 17, 5035–5061. [Google Scholar] [CrossRef]
- Qu, G.; Shi, Y.; Yang, Y.; Wu, W.; Zhou, Z. Methods, Progress and Challenges in Global Monitoring of Carbon Emissions from Biomass Combustion. Atmosphere 2024, 15, 1247. [Google Scholar] [CrossRef]
- Frampton, G.; Whaley, P.; Bennett, M.; Bilotta, G.; Dorne, J.L.; Eales, J.; James, K.; Kohl, C.; Land, M.; Livoreil, B. Principles and framework for assessing the risk of bias for studies included in comparative quantitative environmental systematic reviews. Environ. Evid. 2022, 11, 12. [Google Scholar] [CrossRef]
- Baker, K.R.; Valin, L.; Szykman, J.; Judd, L.; Shu, Q.; Hutzell, B.; Napelenok, S.; Murphy, B.; Connors, V. Photochemical model assessment of single source NO2 and O3 plumes using field study data. Sci. Total Environ. 2023, 903, 166606. [Google Scholar] [CrossRef] [PubMed]
- Oliveira, K.; Guevara, M.; Jorba, O.; Petetin, H.; Bowdalo, D.; Tena, C.; Montané Pinto, G.; López, F.; Pérez García-Pando, C. On the uncertainty of anthropogenic aromatic VOC emissions: Evaluation and sensitivity analysis. Preprints 2024, 9. [Google Scholar] [CrossRef]
- Chauhan, B.V.S.; Berg, M.J.; Smallbone, K.L.; Rautela, I.; Ballal, S.; Wyche, K.P. Machine Learning Driven Prediction and Analysis of NO2 and its Catalyst Based Reduction in Urban Environments. Top. Catal. 2025, 68, 2089–2108. [Google Scholar] [CrossRef]
- Liu, F.; van der, A.R.J.; Eskes, H.; Ding, J.; Mijling, B. Evaluation of modeling NO2 concentrations driven by satellite-derived and bottom-up emission inventories using in situ measurements over China. Atmos. Chem. Phys. 2018, 18, 4171–4186. [Google Scholar] [CrossRef]
- Prescott, A.B.; Pelletier, J.D. Climate-Driven Changes to Suspended--Sediment Yields by the End of the Century. Earths Future 2025, 13, e2025EF006125. [Google Scholar] [CrossRef]
- Antolínez, J.A.A.; Méndez, F.J.; Anderson, D.; Ruggiero, P.; Kaminsky, G.M. Predicting Climate-Driven Coastlines with a Simple and Efficient Multiscale Model. J. Geophys. Res. Earth Surf. 2019, 124, 1596–1624. [Google Scholar] [CrossRef]
- Elkollaly, M.; Sherif, M. Event-based rainfall dynamics and storm frequency in arid and semi-arid climates: An innovative standardized approach for rainstorm analysis. J. Hydrol. 2025, 659, 133231. [Google Scholar] [CrossRef]
- Aghazadeh, F.; Samadi, M.; Cheval, S.; Moshiri, S. Impacts of land use, vegetation, and air pollution on surface urban heat island spatiotemporal dynamics: Tehran as a case study. Int. J. Environ. Sci. Technol. 2025, 22, 14607–14633. [Google Scholar] [CrossRef]
- Khan, M.M.H.; Kurniawan, T.A.; Chandra, I.; Lei, T.M.T. Modeling PM10 Emissions in Quarry and Mining Operations: Insights from AERMOD Applications in Malaysia. Atmosphere 2025, 16, 369. [Google Scholar] [CrossRef]
- Faisal, M.; You, Z.J.; Akram, M.Z.; Ali, S. Quantifying the influence of urban road surface roughness on heavy metals pollution in road-deposited sediment’s accumulation and wash-off. Water Sci. Technol. 2023, 88, 2594–2610. [Google Scholar] [CrossRef]
- Zhao, Z.; Shen, L.; Yang, C.; Wu, W.; Zhang, M.; Huang, G.Q. IoT and digital twin enabled smart tracking for safety management. Comput. Oper. Res. 2021, 128, 105183. [Google Scholar] [CrossRef]

| Data Category | Specific Parameters | Source | Temporal Resolution | Application in Model |
|---|---|---|---|---|
| Traffic data | Vehicle count by type (Electric, Hybrid, Gasoline, Diesel) | Jordan Ministry of Transportation (roadside digital cameras) | Hourly/Daily (2016–2023) | Primary input for traffic flow (Tf) in all emission equations. |
| Road geometry | Segment Length (L), Width (I), Side Slope, Average Speed | Greater Amman Municipality; verified with Google Earth Pro | Static (Single survey) | Direct inputs for PM (Equations (1) and (2)) and canyon ratio (I/H). |
| Building data | Average Adjacent Building Height (H) | Google Earth Pro imagery; validated with municipal records | Static (Single survey) | Calculation of urban canyon ratio (I/H) for PM equations. |
| Fleet data | Average Vehicle Weight (W), Fleet Composition | Weighbridge data from public facilities | Annual Average | Direct input (W) for PM equations (Equations (1) and (2)). |
| Fuel data | Volumetric Fuel Consumption (V), Fuel Density (ρ) | Survey of 100 fueling stations; standard regional values | Annual Average | Primary inputs for CO/NO2 equations (Equation (4)). |
| Air quality | PM10, PM2.5, CO, NO2 Concentrations | Jordan Ministry of Environment (reference-grade sensors) | Hourly (2022, for validation) | Validation dataset for model outputs. |
| Meteorology | Daily Maximum Temperature (Tmax), Daily Precipitation (Rain) | Satellite-derived data | Daily (2016–2023) | Driving inputs for the dynamic silt loading model (Equation (5)). |
| Highway Name | Length (km) | Width (m) | Avg. Building Height (m) | I/H Ratio | SL (g/m2) | Rationale for SL |
|---|---|---|---|---|---|---|
| Army Hwy | 16.8 | 28 | 12 | 2.33 | 9.3 | High industrial activity (refineries, quarries, landfills) leading to substantial dust deposition. |
| King Abdullah Hwy | 22.4 | 23 | 12 | 1.92 | 0.3 | Urban-commercial corridor with standard public road maintenance. |
| Highway | Pollutant | ND (Modified) | ND (Old) | ND Improvement |
|---|---|---|---|---|
| Army Hwy | PM10 | 0.10 | 0.43 | 77% |
| PM2.5 | 0.04 | 0.11 | 64% | |
| CO | 0.09 | 0.32 | 72% | |
| NO2 | 0.47 | 0.49 | 4% | |
| King Abdullah Hwy | PM10 | 0.12 | 0.40 | 70% |
| PM2.5 | 0.06 | 0.15 | 60% | |
| CO | 0.09 | 0.32 | 72% | |
| NO2 | 0.03 | 0.05 | 40% |
| Highway | Pollutant | Model | ND | NMB | RMSE (Tons) | R2 | p-Value |
|---|---|---|---|---|---|---|---|
| Army Hwy | PM10 | modified | 0.10 | 0.08 | 0.15 | 0.92 | <0.001 |
| old | 0.43 | −0.32 | 0.42 | 0.71 | (reference) | ||
| PM2.5 | modified | 0.04 | 0.05 | 0.03 | 0.95 | 0.002 | |
| old | 0.11 | −0.25 | 0.08 | 0.78 | (reference) | ||
| CO | modified | 0.09 | 0.10 | 0.25 | 0.94 | <0.001 | |
| old | 0.32 | −0.28 | 0.75 | 0.65 | (reference) | ||
| NO2 | modified | 0.47 | −0.15 | 0.12 | 0.45 | 0.41 | |
| old | 0.49 | −0.18 | 0.13 | 0.42 | (reference) | ||
| King Abdullah Hwy | PM10 | modified | 0.12 | 0.06 | 0.08 | 0.90 | <0.001 |
| old | 0.40 | −0.30 | 0.28 | 0.60 | (reference) | ||
| PM2.5 | modified | 0.06 | 0.04 | 0.02 | 0.93 | 0.005 | |
| old | 0.15 | −0.22 | 0.05 | 0.70 | (reference) | ||
| CO | modified | 0.09 | 0.08 | 0.30 | 0.93 | <0.001 | |
| old | 0.32 | −0.25 | 0.95 | 0.62 | (reference) | ||
| NO2 | modified | 0.03 | −0.05 | 0.04 | 0.82 | 0.038 | |
| old | 0.05 | −0.10 | 0.06 | 0.75 | (reference) |
| Highway | Pollutant | Model | Scenario 1: Multi-Year Traffic Data | Scenario 2: 2019 Traffic Data | Δ in % Improv. | ||
|---|---|---|---|---|---|---|---|
| ND | % Improv. | ND | % Improv. | ||||
| Army Hwy | PM10 | Legacy | 0.43 | 77% | 0.45 | 76% | −1% |
| Modified | 0.10 | — | 0.11 | — | |||
| PM2.5 | Legacy | 0.11 | 64% | 0.12 | 67% | +3% | |
| Modified | 0.04 | — | 0.04 | — | |||
| CO | Legacy | 0.32 | 72% | 0.34 | 71% | −1% | |
| Modified | 0.09 | — | 0.10 | — | |||
| NO2 | Legacy | 0.49 | 4% | 0.51 | 6% | +2% | |
| Modified | 0.47 | — | 0.48 | — | |||
| King Abdullah Hwy | PM10 | Legacy | 0.40 | 70% | 0.42 | 69% | −1% |
| Modified | 0.12 | — | 0.13 | — | |||
| PM2.5 | Legacy | 0.15 | 60% | 0.16 | 63% | +3% | |
| Modified | 0.06 | — | 0.06 | — | |||
| CO | Legacy | 0.32 | 72% | 0.33 | 70% | −2% | |
| Modified | 0.09 | — | 0.10 | — | |||
| NO2 | Legacy | 0.05 | 40% | 0.06 | 33% | −7% | |
| Modified | 0.03 | — | 0.04 | — | |||
| Parameter | Description | Army Highway | King Abdullah Highway |
|---|---|---|---|
| Base accumulation rate | 0.082 g m−2 day−1 | 0.001 g m−2 day−1 | |
| Wash-off efficiency | 0.396 g m−2 mm−1 | 0.850 g m−2 mm−1 | |
| Post-wash loading | 2.0 g m−2 | 0.5 g m−2 | |
| Mean SL(t) | Modeled average | 9.299 g m−2 | 0.539 g m−2 |
| Std. Dev. SL(t) | Modeled variability | ±5.890 g m−2 | ±0.053 g m−2 |
| Year | Month of Peak SL | Observed SL (g m−2) | Modeled SL (g m−2) | Absolute Bias (g m−2) | Normalized Mean Error (NME, %) |
|---|---|---|---|---|---|
| 2019 | September | 14.9 | 15.6 | +0.7 | 4.7% |
| 2020 | August | 16.2 | 17.0 | +0.8 | 4.9% |
| 2021 | September | 17.8 | 18.3 | +0.5 | 2.8% |
| 2022 | October | 15.6 | 16.2 | +0.6 | 3.8% |
| Mean ± SD | — | 16.1 ± 1.2 | 16.8 ± 1.1 | +0.4 ± 0.2 | 6.8% |
Disclaimer/Publisher’s Note: The statements, opinions and data contained in all publications are solely those of the individual author(s) and contributor(s) and not of MDPI and/or the editor(s). MDPI and/or the editor(s) disclaim responsibility for any injury to people or property resulting from any ideas, methods, instructions or products referred to in the content. |
© 2025 by the authors. Licensee MDPI, Basel, Switzerland. This article is an open access article distributed under the terms and conditions of the Creative Commons Attribution (CC BY) license (https://creativecommons.org/licenses/by/4.0/).
Share and Cite
Kharabsheh, R.A.L.; Bdour, A.; Calderón-Guerrero, C. A Climate-Driven Dynamic Model for Highway Emissions in Arid Cities Modifying AP-42 and EEA Algorithms with Silt Loading, Building Geometry, and Fuel Density Parameters. Sustainability 2025, 17, 10586. https://doi.org/10.3390/su172310586
Kharabsheh RAL, Bdour A, Calderón-Guerrero C. A Climate-Driven Dynamic Model for Highway Emissions in Arid Cities Modifying AP-42 and EEA Algorithms with Silt Loading, Building Geometry, and Fuel Density Parameters. Sustainability. 2025; 17(23):10586. https://doi.org/10.3390/su172310586
Chicago/Turabian StyleKharabsheh, Raha A. L., Ahmed Bdour, and Carlos Calderón-Guerrero. 2025. "A Climate-Driven Dynamic Model for Highway Emissions in Arid Cities Modifying AP-42 and EEA Algorithms with Silt Loading, Building Geometry, and Fuel Density Parameters" Sustainability 17, no. 23: 10586. https://doi.org/10.3390/su172310586
APA StyleKharabsheh, R. A. L., Bdour, A., & Calderón-Guerrero, C. (2025). A Climate-Driven Dynamic Model for Highway Emissions in Arid Cities Modifying AP-42 and EEA Algorithms with Silt Loading, Building Geometry, and Fuel Density Parameters. Sustainability, 17(23), 10586. https://doi.org/10.3390/su172310586


