Article

How AR-Enhanced Cultural Heritage Landscapes Influence Perception in Rural Tourism Spaces: Evidence from Eye Tracking and HRV

1
Architecture College, Inner Mongolia University of Technology, Hohhot 010051, China
2
The Key Laboratory of Grassland Habitat System and Low-Carbon Construction Technology, Hohhot 010051, China
3
Key Laboratory of Green Building at Universities of Inner Mongolia Autonomous Region, Hohhot 010051, China
4
College of Design, Inner Mongolia Normal University, Hohhot 010028, China
*
Authors to whom correspondence should be addressed.
Sustainability 2025, 17(23), 10575; https://doi.org/10.3390/su172310575
Submission received: 18 October 2025 / Revised: 15 November 2025 / Accepted: 22 November 2025 / Published: 25 November 2025

Abstract

Against the backdrop of globalization, environmental pressures, and rapid tourism development, digital technologies are emerging as vital supplementary tools for cultural heritage preservation. This study investigates the impact of augmented reality (AR)-enhanced cultural heritage landscapes on rural tourists’ perceptions, validating their effects through two physiological dimensions: visual attention and autonomic nervous system regulation. Employing a mixed experimental design (n = 81), the research integrates heart rate variability, eye tracking, and subjective questionnaires, with the Aoluguya Village in Inner Mongolia serving as the testing site. Participants viewed videos and images of real and AR environments in an isolated space. Data were analyzed using repeated measures ANOVA and paired t-tests. The results revealed that AR significantly increased RMSSD in the native rural environment (t(89) = −3.606, p = 0.001, d = 0.38), indicating heightened parasympathetic activity, while no significant effect was observed in the artificially recreated environment (t(89) = −2.020, p = 0.407), demonstrating that physiological benefits depend on the setting. Eye tracking data revealed that both AR environments increased total gaze duration and gaze frequency (average increase of 1.5–2.0 gazes), enhancing visual attention. The questionnaire results (n = 26) supported this finding on attention focus, novelty, and esthetic dimensions, though improvements in authenticity and overall satisfaction were limited. This study demonstrates that AR environments significantly capture visitor attention, particularly when integrated with authentic local spaces to enhance visitor experiences. The findings provide practical insights for revitalizing traditional village cultural heritage and optimizing rural tourism.

1. Introduction

Cultural heritage, as a vital component of world heritage, embodies the history, culture, and traditions of a nation. However, with the accelerating pace of globalization and ongoing technological advances, cultural heritage is facing unprecedented pressures [1]. These pressures stem not only from climate change [2] and environmental degradation [3], but also from modernization processes, including human activities and urban development [4], placing some cultural heritage sites at risk of permanent loss [5]. Traditional preservation methods, such as physical restoration and on-site maintenance, have long served as primary strategies for safeguarding cultural heritage. Yet, these approaches are often constrained by limited funding, outdated techniques, and the inherent fragility of heritage materials, making it difficult to meet the growing need for scalable and inclusive conservation solutions. In response, the UNESCO “Memory of the World” program was launched in 1992 to promote the digitization of cultural heritage on a global scale.
Many nations have recognized the potential of digital technologies as effective supplements to traditional conservation methods and have begun integrating them into cultural heritage preservation practices. For instance, Li et al. achieved high-fidelity reconstruction of cultural heritage through 3D scanning [6]. Y. Xiao et al. explored the application of terrestrial laser scanning in cultural heritage conservation [7]. Kunta Hsieh et al. reviewed the use of web crawling and text-image matching technologies in the digital reconstruction, preservation, and virtual representation of cultural heritage [8]. M. Li et al. developed a digital twin virtual experience platform to support the dynamic transmission of cultural heritage [9]. Zhong et al. examined the application of virtual reality technology in the preservation of intangible cultural heritage [10]. Collectively, these digital technologies form the foundation of digital cultural heritage preservation. However, traditional digital approaches often rely on predefined, unidirectional interaction modes. While virtual reality (VR) can create immersive experiences, its fully virtual and enclosed environment isolates users from the real world, thereby limiting the perception of cultural heritage as a “spirit of place” and a living entity. Moreover, conventional digital techniques face challenges in transforming data into vivid and accessible cultural narratives. Although semantic modeling and knowledge graphs aim to address this issue, their outcomes are primarily tailored for specialized researchers. Deeper layers of cultural heritage information often depend heavily on extensive textual or audio annotations, making it difficult to convey cultural stories in an engaging manner to the general public. With the ongoing advancement of digital technologies, augmented reality (AR) has emerged as an evolution of VR. By employing registration and tracking techniques to overlay virtual information onto the real-world environment, AR enables real-time interaction and offers immersive, tangible experiences. This facilitates the dynamic association of expert knowledge with physical objects, thereby lowering the barriers to accessing and comprehending cultural heritage [11,12]. As a result, AR has been widely adopted in the field of cultural heritage preservation [13,14].
Heritage tourism, which centers on cultural or natural heritage as its core attraction, offers unique experiences to visitors [15,16,17]. Heritage revitalization involves transforming static and underutilized heritage resources into assets of both cultural and economic value through diverse strategies, thereby achieving a synergy between preservation and development [18]. With the evolving philosophy of cultural heritage conservation, the integration of revitalized heritage with tourism experiences has become a pivotal pathway for unlocking the multidimensional value of cultural heritage and promoting the sustainable development of cultural heritage tourism. Augmented Reality (AR) technology provides technical support for the deep integration of these two domains, and its application effectiveness has been extensively validated across multiple research dimensions [19,20,21]. This body of work offers theoretical and practical insights for the revitalization of cultural heritage and the sustainable development of cultural heritage tourism. However, existing research seldom provides a direct comparison between the authentic real-world environment and the AR environment constructed upon it. Furthermore, the differences in perceptions among various tourist groups across these environments have not been thoroughly investigated. Although research on cultural heritage tourism experiences is abundant, the underlying perceptual mechanisms remain underexplored. Recent studies have primarily relied on traditional quantitative methods, such as multi-dimensional cultural frameworks, questionnaires, and in-depth interviews, to examine cultural heritage tourism [22,23,24]. Nevertheless, subjective evaluations and conventional quantitative analyses often fall short of precisely elucidating the intrinsic mechanisms at play. In this context, the Cognitive Appraisal Theory of Emotion and Attention Restoration Theory offer a robust theoretical foundation. Meanwhile, the combined use of Heart Rate Variability (HRV) and eye tracking methodologies can effectively compensate for the limitations of subjective assessments, enabling a more comprehensive and precise capture of tourists’ authentic perceptual processes.
The Cognitive Appraisal Theory of Emotions (CATE) was initially proposed by Arnold and later expanded by Lazarus. It primarily describes the psychological processes individuals undergo when exposed to environmental stimuli, with its widely accepted framework being “cognitive appraisal, subjective emotion, subjective behavior.” Arnold emphasized that understanding the mechanisms of emotion generation in the brain requires an examination of emotional perception and behavioral operations. Lazarus further introduced different levels of cognitive appraisal and analyzed the relationship between environmental stimuli and emotions. The fundamental approach of this theory lies in redirecting the influence of the environment from external objective stimuli to the level of cognitive appraisal. Its core proposition is that stimuli must be cognitively appraised by the individual to elicit specific emotions. In tourism research, the Cognitive Appraisal Theory of Emotions is primarily employed to explore the antecedents of tourists’ emotions and the relationship between emotions and behavior [25]. For instance, using the cognitive appraisal framework, Hosany validated the antecedents of tourists’ emotional responses and found that goal consistency and self-compatibility are key determinants of positive emotions [26]. Similarly, grounded in this theoretical framework, a mixed-methods approach was employed by Xinyi Liu et al. to examine museums as distinctive environmental contexts [27]. The influence of the four elements of drama as stimuli on tourists’ cognitive appraisals and subjective emotions was investigated, thereby elucidating the internal pathway linking cognitive appraisal, subjective emotion, and associated behavioral responses in the context of environmental stimuli.
Research on the cognitive benefits of interacting with nature often employs the Attention Restoration Theory (ART) [28]. This theory proposes a cognitive restoration mechanism that relies on two components of attention: involuntary and voluntary. Involuntary attention refers to attention that is unconsciously captured by environmental stimuli, whereas voluntary attention is governed by controlled cognitive processes [29]. A growing body of evidence indicates that exposure to natural environments positively influences psychological and physiological processes, as well as attention and cognitive functioning [28,30]. In the cognitive domain, multiple studies have demonstrated the beneficial effects of natural settings on cognitive performance [31,32].
HRV is a significant non-invasive indicator in clinical fields such as cardiovascular disease and mental health. It has been demonstrated to reflect cardiac autonomic regulation by measuring the variation in time intervals between consecutive normal R–R waves, thereby capturing homeostatic adjustments in cardiovascular and other physiological functions modulated by the autonomic nervous system (ANS). HRV analysis is generally categorized into three types: time-domain analysis, frequency-domain analysis, and nonlinear analysis. Frequency-domain analysis evaluates HRV based on frequency components, while time-domain analysis assesses HRV based on time-series variations [33]. Nonlinear metrics are used to quantify the unpredictability and complexity of interbeat interval (IBI) time series. To date, numerous studies have employed physiological measurements to investigate HRV, confirming its validity and scientific value as a non-invasive physiological indicator for assessing cognitive states and perceptual processes in humans [34,35].
Vision is the primary means through which humans acquire information from the external environment. Eye movements, as behavioral manifestations of visual information processing, provide measurable indicators that reflect the overall cognitive process involved in perceiving external information [36]. Eye tracking technology, which utilizes specialized devices such as eye trackers and image processing algorithms, enables precise measurement of key visual information including gaze direction and fixation location. This technology has been widely applied across various fields such as medicine, consumer psychology, and tourism. By analyzing eye movement trajectories and fixation points, researchers are able to uncover individuals’ attentional focus and information processing mechanisms, thereby fostering innovation and development in multiple disciplines [37,38,39]. Previous empirical studies have demonstrated that eye tracking technology can effectively quantify differences in attention patterns among different populations when observing complex visual stimuli. It accurately reveals variations in visual attention and helps explain the underlying cognitive mechanisms responsible for these differences.
The existing research exhibits the following limitations:
(1)
The lack of a direct comparison between the authentic real-world environment and the AR environment constructed upon it makes it impossible to isolate the value added by AR elements to the cultural heritage tourism experience or to determine their potential impact on the perception of the authentic heritage setting.
(2)
There is insufficient investigation into perceptual differences among diverse demographic groups (gender, educational level and disciplinary background) within AR-enhanced cultural heritage tourism contexts. This gap hinders the development of personalized design approaches in cultural heritage tourism.
(3)
The assessment of cultural heritage tourism experiences relies predominantly on subjective methods such as questionnaires, neglecting the integration of objective physiological measures like eye tracking and heart rate variability. As a result, the comprehensive and accurate capture of tourists’ genuine perceptual processes is not achieved.
Addressing the limitations identified in existing literature, this study systematically examines the mechanisms by which augmented reality (AR) technology influences the perception of cultural heritage landscapes in rural tourism settings across diverse user profiles, as well as the objective physiological and cognitive foundations involved. The investigation is carried out by comparing perceptual differences between the authentic real-world environment and the AR environment constructed upon it, incorporating multidimensional user characteristics (gender, educational level and disciplinary background), and integrating objective physiological metrics such as eye tracking and heart rate variability. The research roadmap is illustrated in Figure 1, with the specific research objectives outlined below:
(1)
Eye movement and heart rate metrics were employed to compare participants’ perceptual differences across two types of authentic real-world environments and the augmented reality environments constructed upon them.
(2)
A comparative analysis of participants’ perceptual differences across the two augmented reality (AR) environments was performed using eye tracking metrics, heart rate data, and a 5-point Likert scale questionnaire.
(3)
To examine whether observed perceptual differences are influenced by demographic characteristics—such as gender, educational level, and disciplinary background—through a comprehensive analysis of physiological and psychological data.
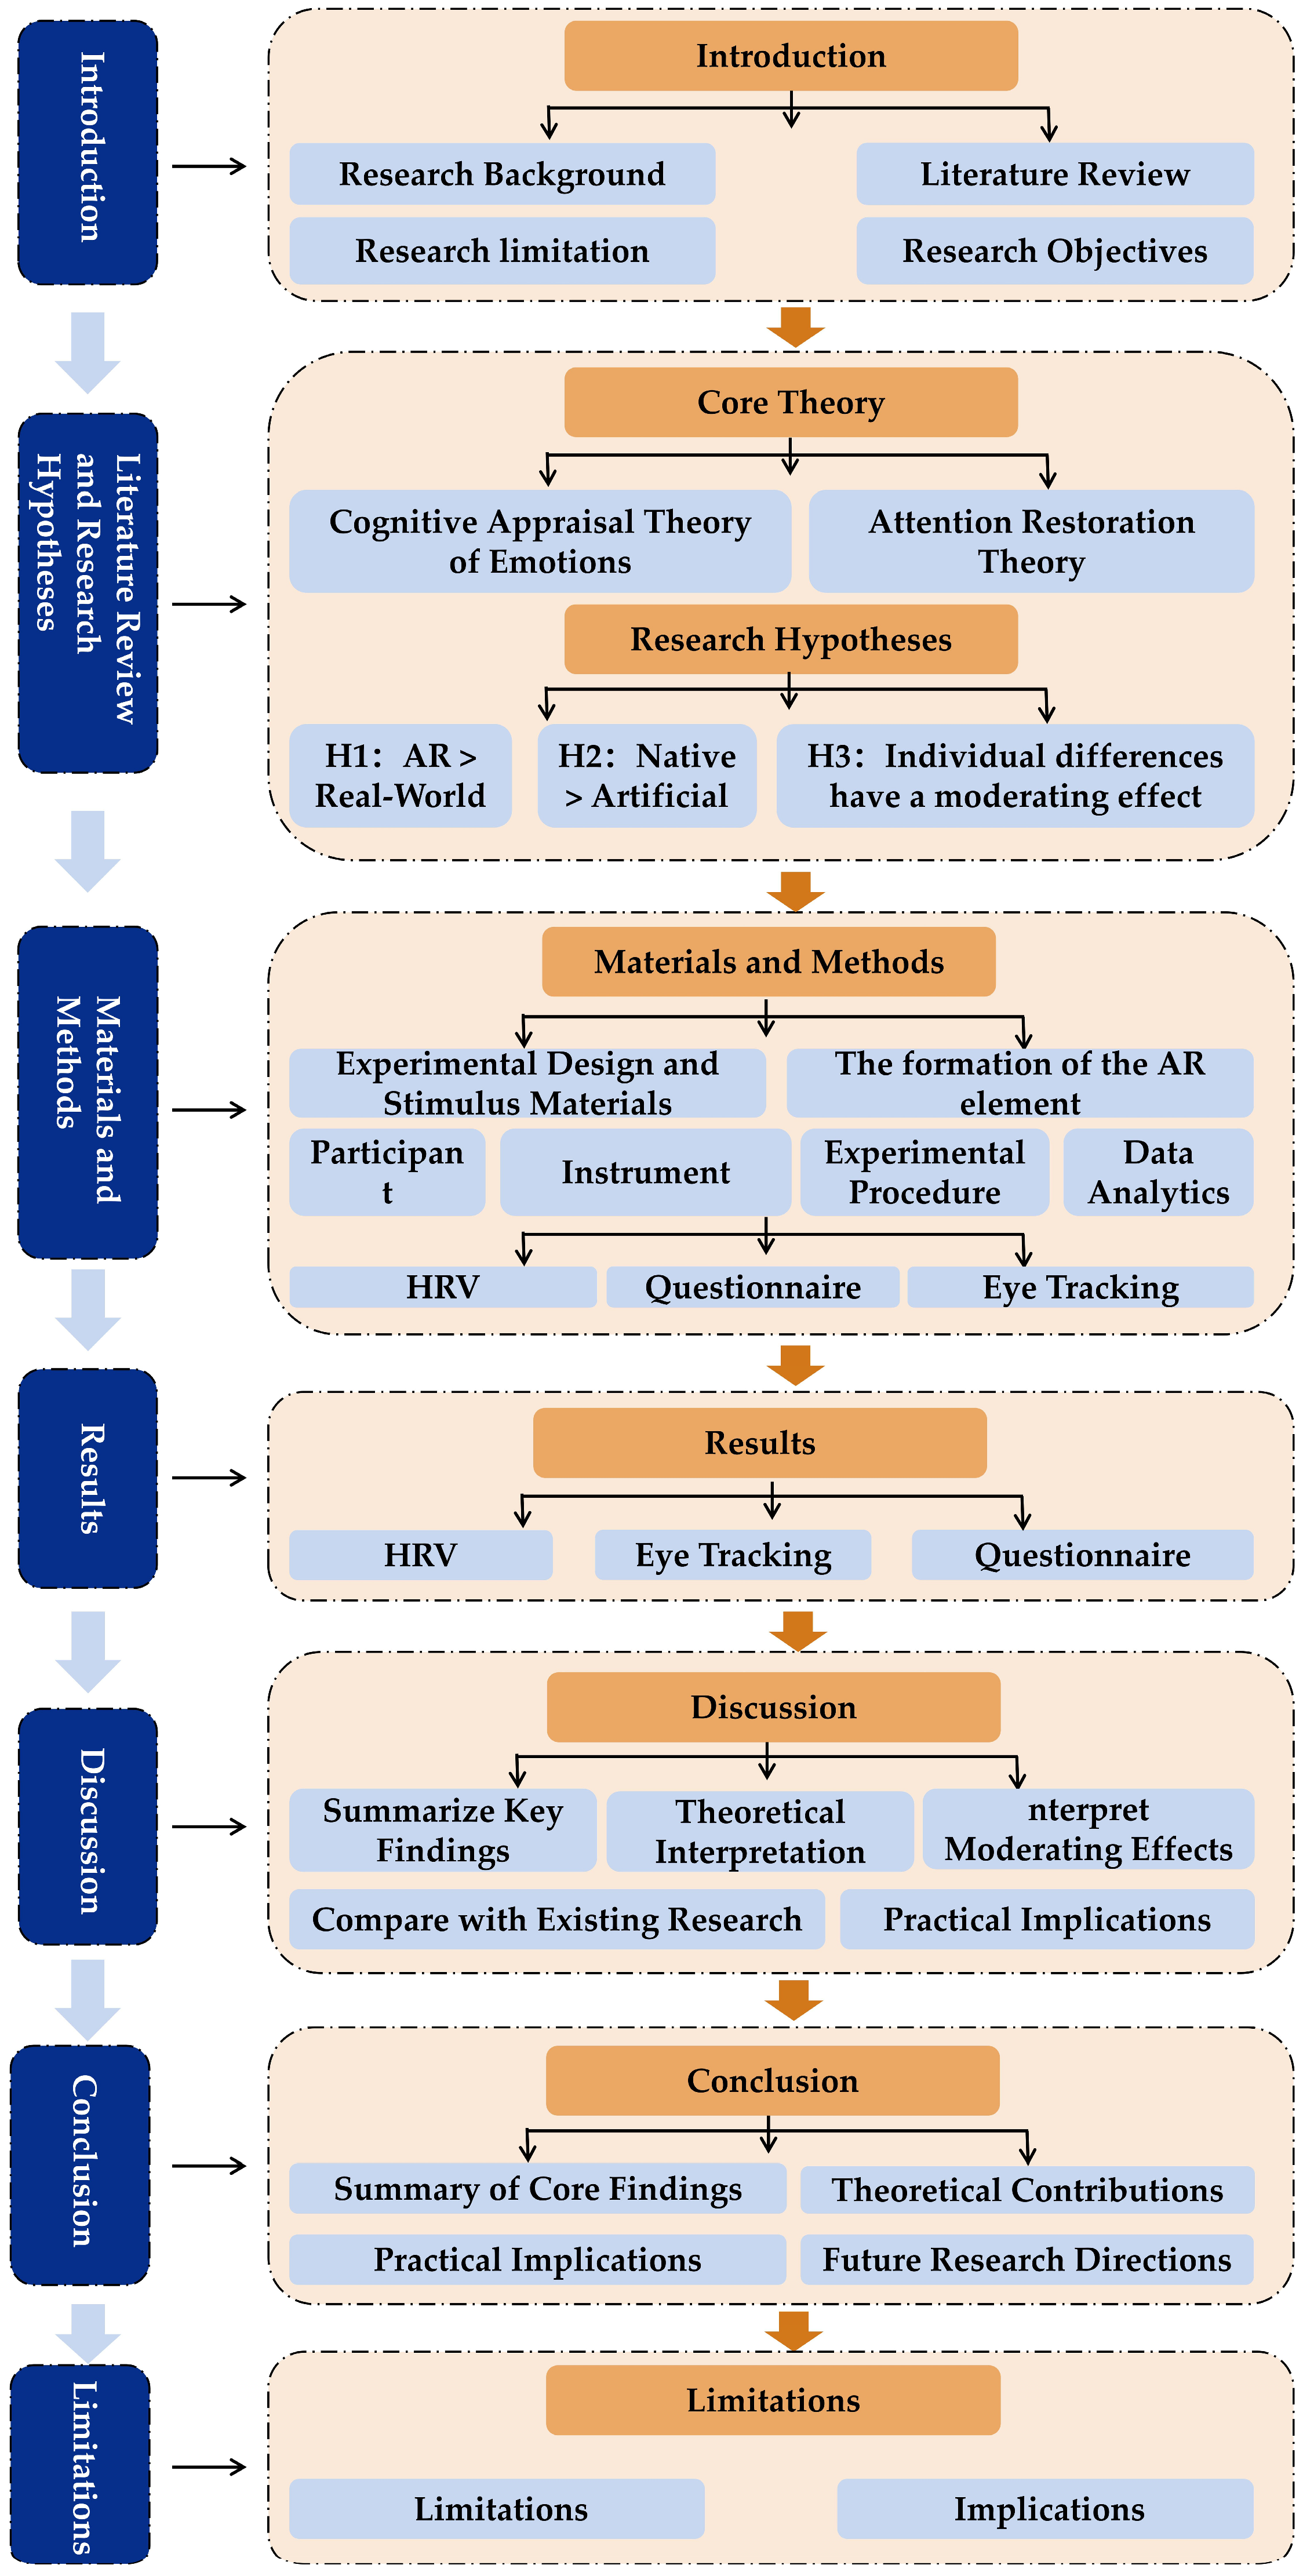
Figure 1. Research technical roadmap.
Sustainability 17 10575 g001

2. Literature Review and Research Hypotheses

Before proceeding with the detailed literature review, it is necessary to clarify the relationship between the research questions and the hypotheses proposed in this study, so as to enhance the structural clarity and theoretical coherence of the research. This paper focuses on the research question of how augmented reality-enhanced cultural heritage landscapes influence tourists’ perceptions, and based on this, three hypotheses are proposed. Specifically, to construct a clear theoretical framework for understanding how AR-enhanced cultural heritage landscapes affect tourist perception, the literature review will follow an internal logic and address four core themes in sequence: (1) reviewing the application of augmented reality technology in cultural heritage tourism to establish the background and motivation for the study; (2) clarifying the research on perception in cultural heritage tourism and identifying the limitations of current approaches that rely heavily on subjective methods such as questionnaires; (3) introducing the use of heart rate variability (HRV) and eye tracking in perceptual research to address the insufficiency of subjective data and to reveal the underlying mechanisms of perception in a more innovative and in-depth manner; and (4) elucidating the supporting role of relevant theories in tourism research, thereby laying a solid theoretical foundation for the formulation and testing of the study’s hypotheses.

2.1. Application of Augmented Reality in Cultural Heritage Tourism

Augmented Reality (AR) is a technology that integrates virtual information with the real world through the use of multimedia, 3D modeling, real-time tracking, intelligent interaction, and sensing. Its underlying principle involves the simulation and application of computer-generated virtual content—such as text, images, 3D models, music, and video—onto the physical environment [40]. Beyond simply superimposing virtual information onto real-world scenes, AR enables interactive experiences between users and virtual objects embedded in the actual environment. This interaction allows users to issue specific commands to virtual objects, which in turn can provide corresponding feedback, thereby enhancing the user experience [41]. When applied to tourist attractions, AR technology can reconstruct historical sites by merging real environments with virtual scenes through the use of smartphone cameras and screen-based software.
In recent years, a growing number of scholars have applied augmented reality (AR) technology to the field of tourism. For example, Songhong Chen et al. [42] focused on the recovery of domestic tourism and innovation in smart tourism in the post-pandemic era in China, exploring the application of AR in cultural heritage tourism. Their study found that the interactivity, vividness, and novelty of AR significantly enhance tourists’ perception and pleasure, effectively driving their willingness to recommend experiences, thereby providing theoretical and practical references for the sustainable development of cultural heritage tourism using AR. Marques da Silva António José et al. [43], taking the olive heritage of Madeira Island as a research context, investigated new applications of AR in sustainable cultural heritage tourism. By creating hybrid tour experiences that blend physical objects with digital avatars, they not only extended visitors’ stay through novel interactive attractions but also enriched itineraries by including niche or underdeveloped sites, significantly improving the tourist experience. Bhaskara Gde Indra et al. [44] studied cultural heritage sites in Kuta, Sanur, and Uluwatu in Bali, developing an AR application prototype that restores the scenic landscape, enhances the tourist experience, and helps visitors better appreciate Bali’s culture, history, and tourism value.
While the application and value of Augmented Reality (AR) in cultural heritage tourism have been explored from multiple perspectives in the academic literature, a significant research gap remains. The perceptual differences between the authentic real-world environment and the AR environment constructed upon it have rarely been systematically compared. Furthermore, existing studies often lack in-depth analysis of individual differences among tourists, making it difficult to comprehensively reveal the deeper impacts of AR technology or to identify pathways for its personalized adaptation.

2.2. Perception Research in Cultural Heritage Tourism

Qihangy Qiu et al. [45] took Longquan Celadon as a case study. Using methods such as questionnaires combined with a 5-point Likert scale, factor analysis, correlation analysis, and Bootstrap mediation effect tests, they measured tourists’ value perception and emotional attitude perception towards cultural heritage, and explored their relationship with travel intention. Tianning Lan et al. [46] selected Meizhou Island in Fujian Province—a tourism destination centered on the Mazu Belief and Customs, an intangible cultural heritage—as a case study to explore residents’ perceptions of tourism. A combined online and offline questionnaire survey was conducted, yielding 429 valid responses. Empirical analysis was performed using structural equation modeling (SEM). The study specifically investigated residents’ perceptions from two dimensions: the benefits and costs of tourism development. Yang Yang et al. [47] focused on tourists’ perceptions of the natural and humanistic environment in cultural heritage tourism. Using the Dunhuang Mogao Caves as a case study, they conducted an empirical test on data from 397 tourists, subjectively measured tourist perceptions, constructed a model of “emotional arousal, positive emotional experience, cultural identity, heritage protection behavior,” and explored the responses triggered by perception and the mediating roles of related variables.
The aforementioned studies have all adopted specific cultural heritage sites as case studies, employing subjective evaluation methods such as questionnaire surveys alongside traditional quantitative analysis to collect data and investigate the relationships among tourists’ value perception, emotional attitude, and travel intention. However, existing research exhibits notable limitations. First, these studies rely solely on subjective evaluations to measure perceptions, without incorporating objective physiological indicators to enable mutual validation between subjective and objective data. Second, they have not addressed the perceptual differences among diverse tourist groups.

2.3. Application of HRV and Eye Tracking in Tourism Perception

Yue et al. [48] integrated psychophysiological measures such as eye-tracking and heart rate with subjective questionnaires to investigate differences in tourists’ cognitive processes (e.g., attention and spatial perception) and emotional states in historic districts during daytime and nighttime. Their study emphasized the application of perception in optimizing day–night tourism experiences in historic neighborhoods. Weiyin Chang et al. [49] employed heart rate variability and anxiety scales, among other psychological tests, to examine the impact of forest-based tourism activities on stress emotions among university students, focusing on the role of perception in utilizing forest tourism to alleviate student stress. Feng Ye et al. [50] explored the relationship between eye tracking technology and three types of emotional experiences in cultural landscapes and visually stimulating tourism settings. They analyzed variations across different landscape types and tourism stages, constructing a predictive model to support the optimization of rural tourism environments and enhance tourists’ emotional experiences. Dongsheng Huang et al. [51], adopting a “cognition–emotion–behavior” framework, utilized VR eye tracking and other technologies to assess the impact of spatial quality on tourist experiences in historic and cultural districts. Their findings revealed the influence intensity of various spatial quality elements and mediating effects, offering support for digital-technology-enabled spatial governance of cultural blocks in the context of cultural and tourism integration.
Existing studies have largely applied eye-tracking and heart rate variability to perceptual research in tourism contexts such as historic districts, forests, and rural areas. However, their application in cultural heritage tourism perception remains relatively limited and warrants further exploration. The combination of eye-tracking and heart rate variability can effectively mitigate the subjectivity and one-sidedness inherent in subjective evaluations in tourism perception research.

2.4. The Supporting Role of Relevant Theories in Tourism Research

2.4.1. Cognitive Appraisal Theory of Emotions

The Cognitive Appraisal Theory of Emotions (CATE), initially proposed by Arnold and further developed by Lazarus, explains the generation of different emotions through the interaction between objective situations and the subjective self. “Cognitive appraisal, subjective emotion, and subjective behavior” are widely recognized as the core constructs of this theoretical framework. In tourism research, He Juan addressed the issue of visually indistinct and thematically incongruent tourism streetscapes by applying the Cognitive Appraisal Theory. She identified design elements at the material, behavioral, and cognitive levels to establish an evaluation system. Through quantitative analysis, key influencing factors were determined, and this evaluation approach was applied to the Yanqiao Road thematic street, providing insights for visual enhancement and highlighting the practical value of the theory in tourism contexts [52]. In another study, Ignacio Rodríguez del Bosque and colleagues examined 807 Spanish tourists using cognitive-affective theory to explore pre- and post-experience psychological processes. Their research developed a model linking tourism-related psychological variables, revealing how destination pre-image, expectations, and emotions influence tourist satisfaction and behavioral intentions [53].
Given the extensive empirical validation of the core constructs in the Cognitive Appraisal Theory of Emotions, this study adopts it as the foundational theoretical model. It aims to elucidate how augmented reality (AR)-enhanced cultural heritage landscapes in rural tourism settings influence tourists’ perceptions through the sequential mechanism of “cognitive appraisal, subjective emotion, subjective behavior.” This approach provides a theoretical basis for objectively analyzing the value-added effects of augmented reality technology on cultural heritage tourism experiences and uncovering the psychological mechanisms underlying differences in tourist perceptions.

2.4.2. Attention Restoration Theory (ART)

The concept of attention restoration originated in the field of environmental psychology. Over the past three decades, research in this area has primarily revolved around two core theories: the Stress Reduction Theory (SRT), proposed by Roger Ulrich in 1979, and the Attention Restoration Theory (ART), introduced by Stephen and Rachel Kaplan in 1983. According to Kaplan, exposure to natural environments can facilitate the recovery of directed attention, highlighting the critical role of such environments in replenishing attentional resources and reducing mental fatigue [54]. Subsequent research by Kaplan in 1995 further explored the mechanisms of directed attention and its effects on emotion and cognitive performance, findings that have since been supported by experimental evidence [55].
With the continuous advancement of research, the impacts of urban, natural, and mixed environments on human behavior and cognition have been extensively investigated, providing a theoretical foundation for understanding the relationship between environmental characteristics and attention restoration [56]. Substantial evidence has indicated that exposure to natural environments can exert positive effects on psychological, physiological, and cognitive functions, such as alleviating anxiety, improving mood, and enhancing cognitive performance. In contrast, although urban settings contain stressors, certain artificial elements with visual characteristics similar to those of nature may also contribute to restorative outcomes [57].
The recent emergence of augmented reality (AR) technology has introduced a novel contextual platform for cognitive restoration research. By superimposing virtual information onto real-world environments, AR enables interactive and immersive visualization, thereby opening new pathways for investigating the impact of hybrid environments on cognitive recovery. This advancement not only extends the applicability of Attention Restoration Theory and Stress Reduction Theory but also creates opportunities for further elucidating the mechanisms through which both natural and built environments contribute to cognitive restoration.
Meanwhile, interdisciplinary research in psychology and clinical medicine has further revealed that the effectiveness of attention restoration varies significantly across different life stages [58]. Due to differences in physiological basis, cognitive capacity, and life experiences, individuals exhibit diverse patterns of attention depletion, while the extent of cognitive recovery among different social groups is also influenced by specific environmental factors [59]. In the field of tourism, applied research has increasingly recognized such group differences [60,61]. This growing recognition not only provides a practical foundation for deepening and applying Attention Restoration Theory but also offers a theoretical basis for this study to examine cognitive and perceptual variations among tourists with different demographic characteristics.

2.5. Research Hypothesis

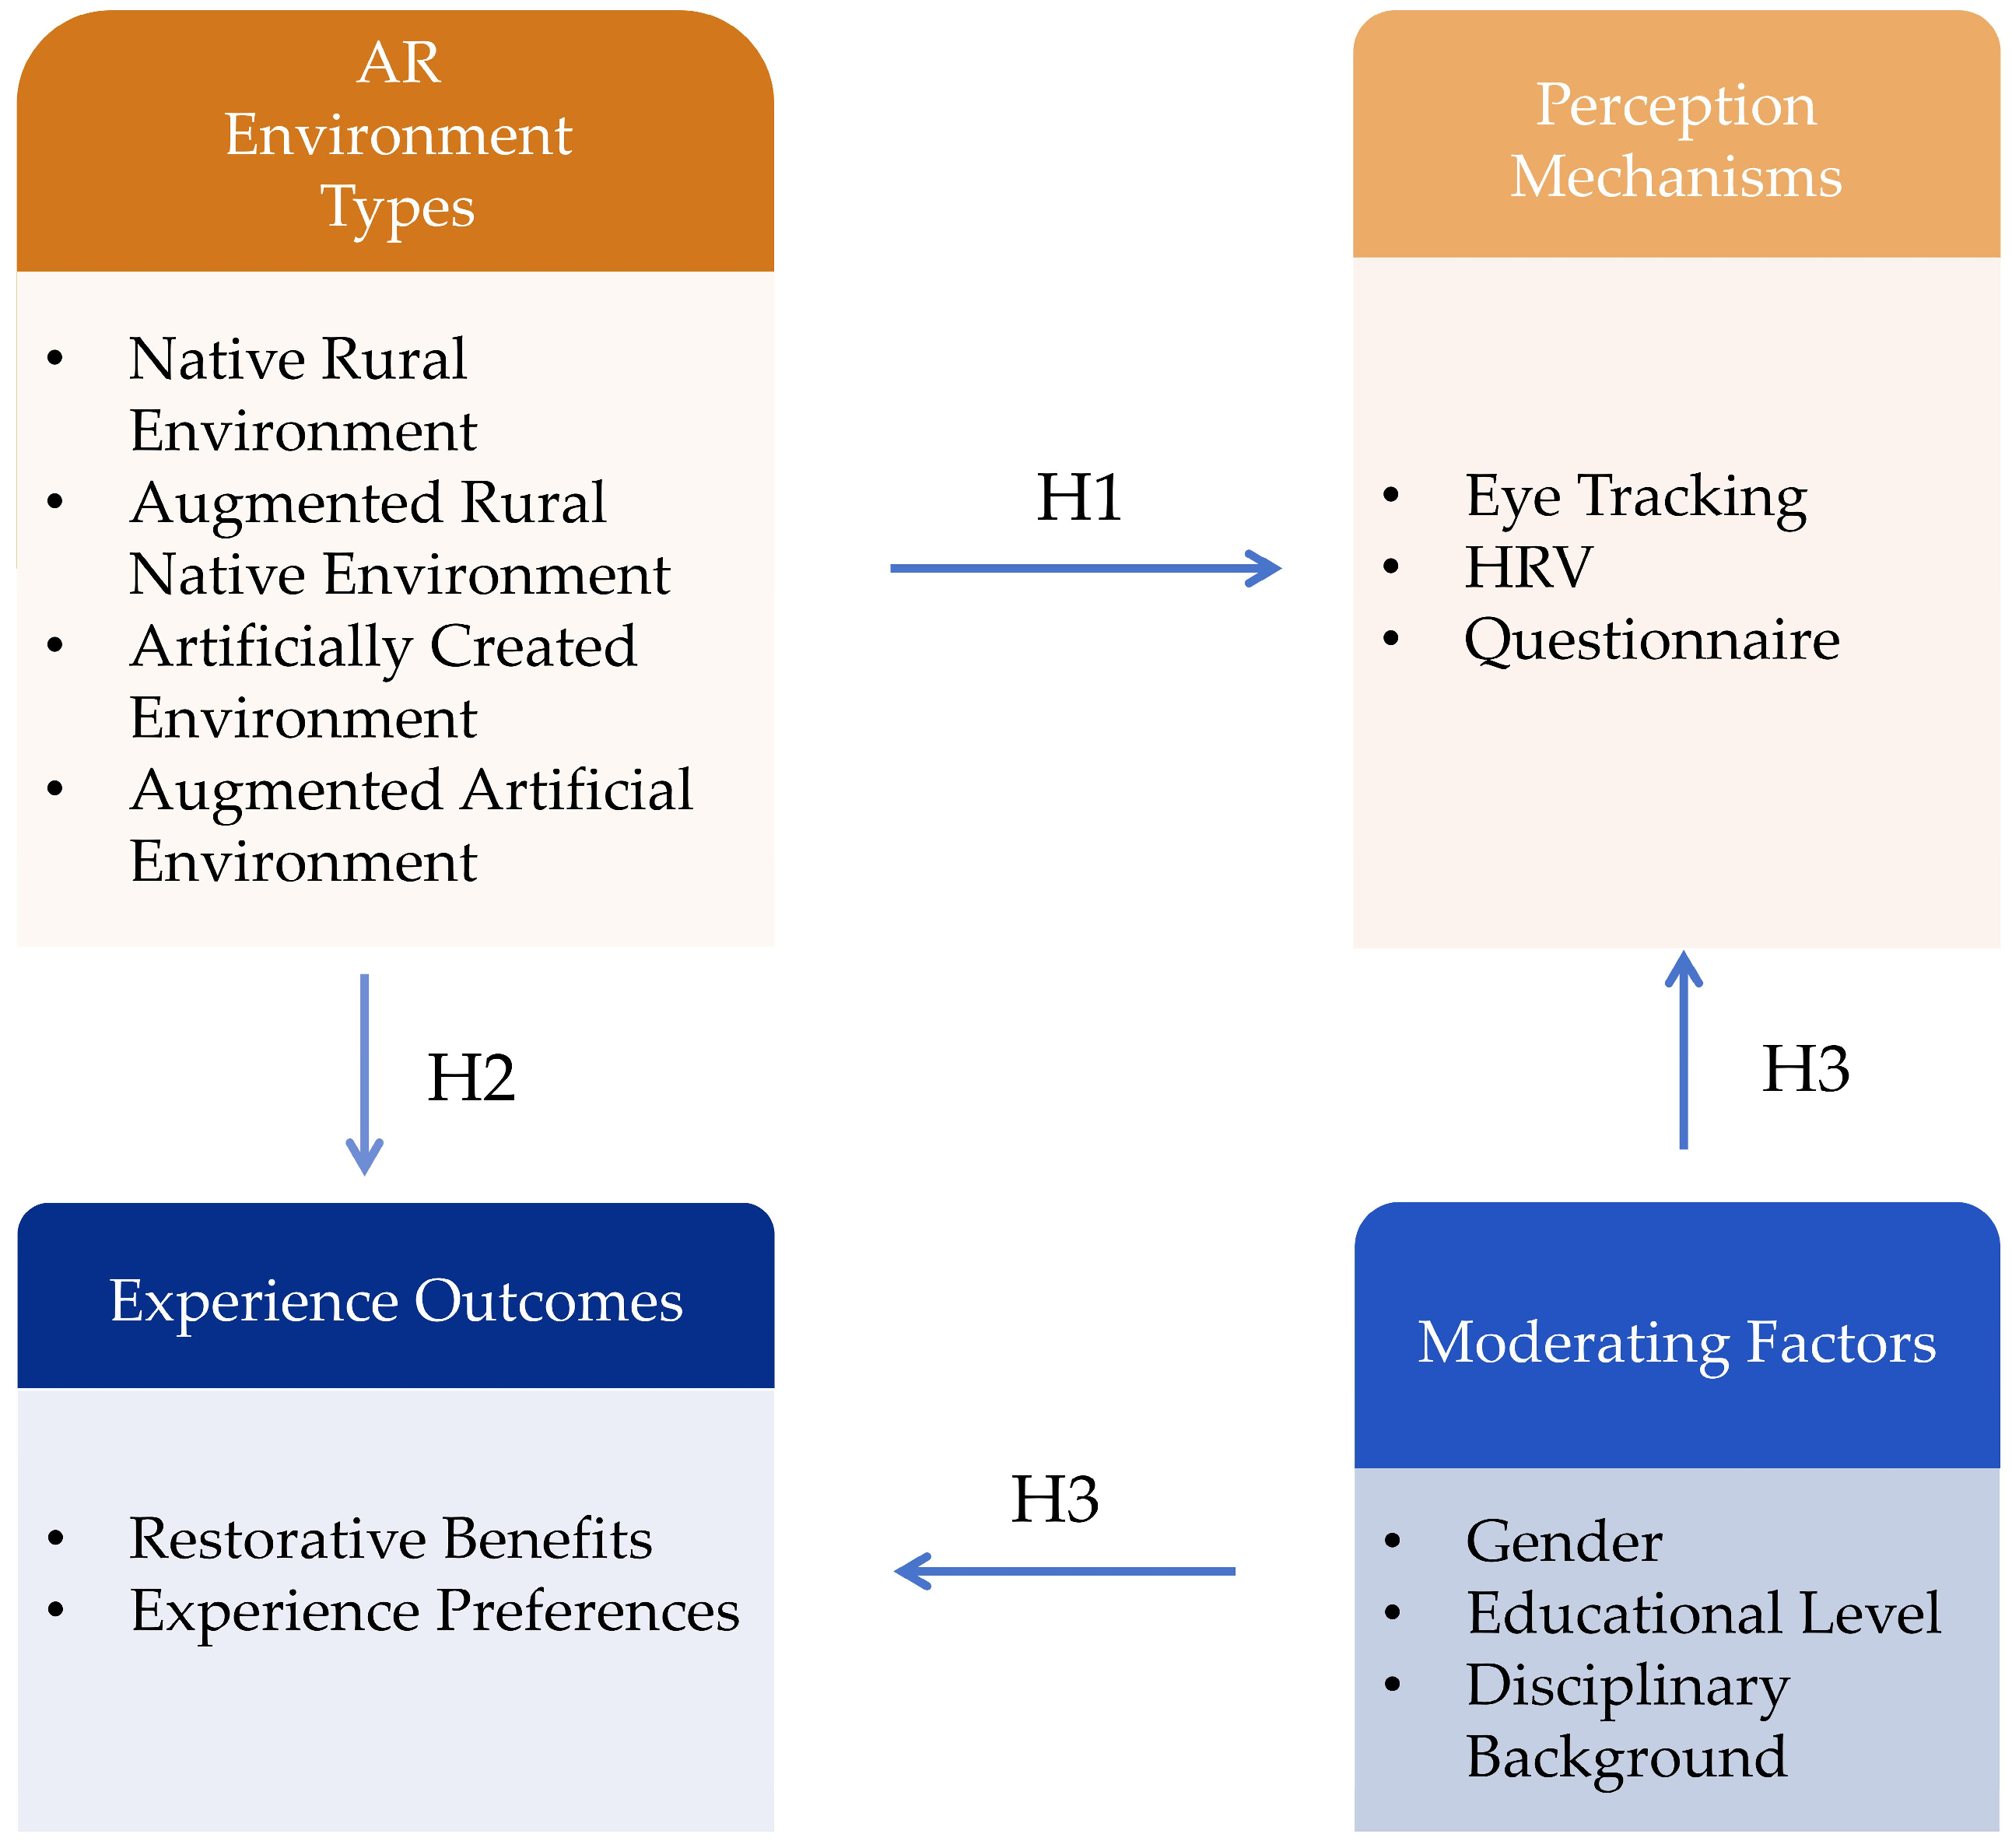
Augmented reality (AR) technology serves as a pivotal pathway for revitalizing cultural heritage and enhancing tourism experiences. By enabling real-time superimposition of virtual information onto physical environments, AR transcends the interactive limitations of conventional digital technologies and establishes a contextualized communication bridge between cultural heritage and the public. In cultural heritage tourism settings, AR facilitates the concretization of heritage narratives and strengthens immersive interactive experiences, thereby effectively stimulating visitors’ cognitive engagement and emotional resonance. This contributes to the symbiotic goals of heritage conservation and development. Notably, AR technology can reduce physical contact with and wear on heritage assets through digital replication, mitigating the impact of tourism development on both the heritage sites and their surrounding ecological environments. Moreover, it supports sustainable cultural heritage tourism by adopting low-energy, recyclable digital dissemination models in place of traditional high-consumption display methods. Based on the theoretical foundations of affective-cognitive evaluation, attention restoration theory, and integrated subjective–objective measurement approaches, this study proposes a research framework (Figure 2) to investigate the application mechanisms of AR in cultural heritage tourism, factors influencing perceptual differences, and pathways for realizing sustainable value.
Hypothesis 1 (H1).
Compared to real-world settings, augmented reality (AR) environments have been found to capture and sustain tourists’ visual attention more effectively while also eliciting a higher degree of emotional engagement.
Hypothesis 2 (H2).
It was verified that both the Native Rural Environment and the Augmented Rural Native Environment demonstrated significantly superior restorative benefits and experience preferences when compared to the Artificially Created Environment and the Augmented Artificial Environment.
Hypothesis 3 (H3).
The influence of augmented reality (AR) environments on tourists’ perceptions may be moderated by demographic characteristics, including gender, educational level, and disciplinary background.
Figure 2. Research structure.
Sustainability 17 10575 g002
Given the recognized potential of augmented reality (AR) technology in constructing immersive contexts and bridging the cognitive gap between cultural heritage and the public, as well as its notable advantages in stimulating visitors’ cognitive engagement and emotional resonance, this study aims to explore how AR-enhanced environments reshape tourists’ perceptual mechanisms. To systematically analyze these mechanisms and address gaps in the existing literature—such as comparisons between physical and augmented environments, variations across environmental types, and individual differences in perception—the following research questions are proposed:
Research Question 1: How are visitors’ visual attention and emotional responses shaped by AR-enhanced cultural heritage landscapes, and to what extent are these effects more pronounced compared to those in authentic environments?
Research Question 2: Do restorative experiences and visitor preferences vary across different types of augmented reality (AR) environments, and are these potential variations moderated by demographic characteristics such as gender, educational level, and disciplinary background?
To ensure clarity in the research, this study adopts an approach that pairs each hypothesis with its corresponding research question. This design not only clearly links the theoretical foundation to the hypotheses but also facilitates the systematic testing of each hypothesis pair in subsequent data analysis (Table 1).

3. Materials and Methods

3.1. Experimental Design and Stimulus Materials

To address the research questions, a mixed-methods experimental design comprising two sequential phases was employed. This approach integrated heart rate variability (HRV) monitoring using an polar H10 monitor (Polar Electro Oy, Kempele, Finland) and eye tracking techniques using an Tobii Pro Fusion eye tracker (KingFar International Inc., Beijing, China) to systematically evaluate participants’ visual and physiological responses to four distinct types of environments, examining both intrinsic physiological arousal and extrinsic visual attention. The same group of participants was used across both experimental phases to ensure internal consistency and validity of the data. Following these measurements, subjective feedback was collected via a questionnaire survey, thereby establishing a multi-dimensional analytical framework that combines both subjective and objective data.
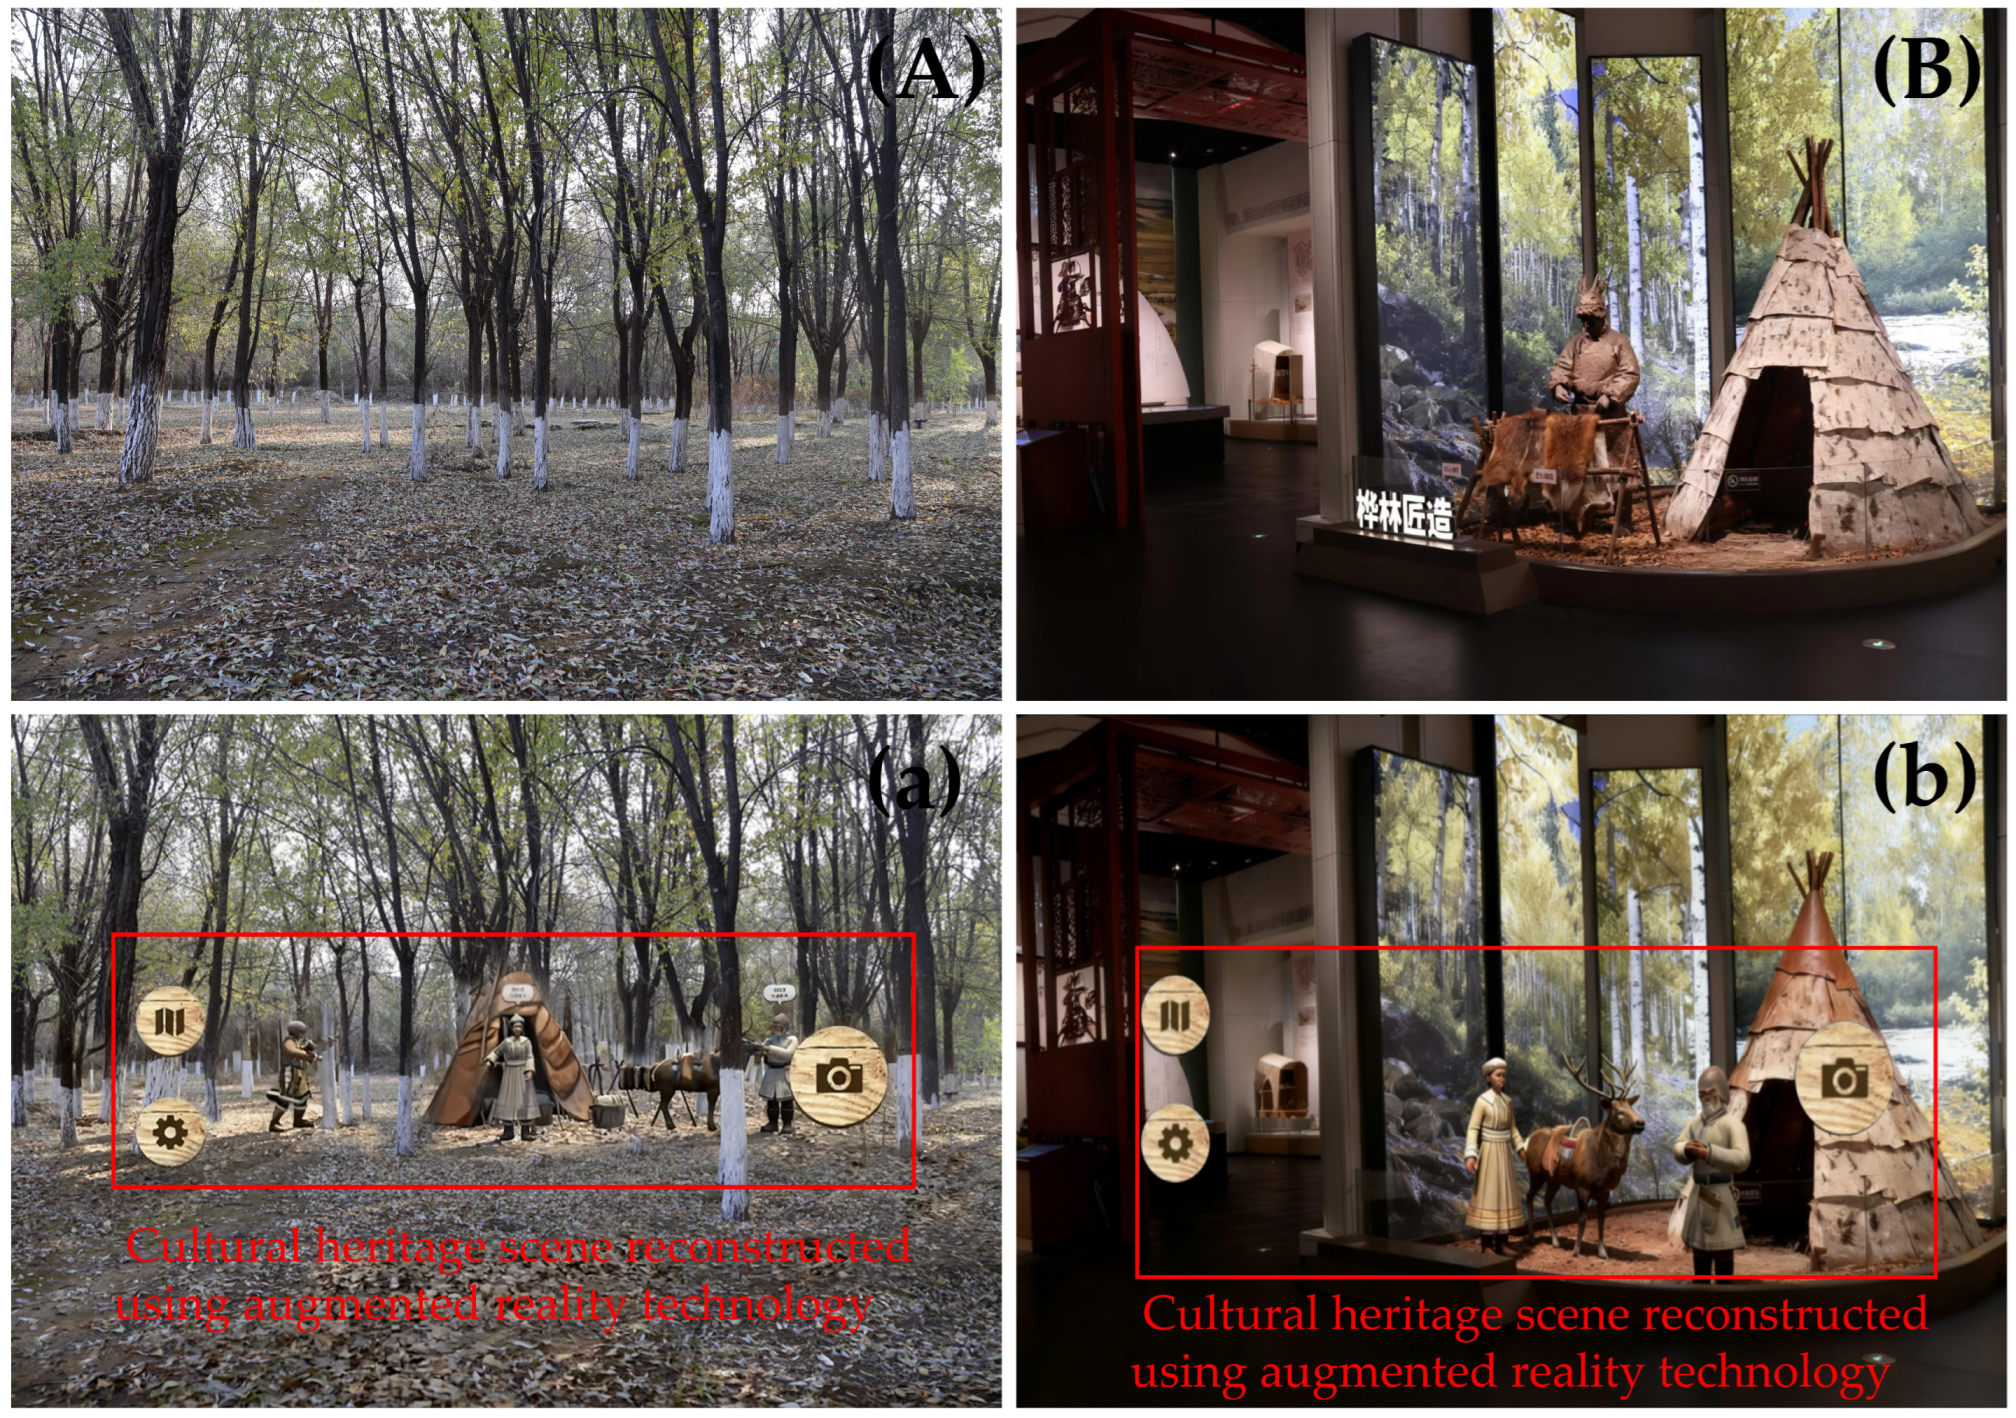
Figure 3 presents the flowchart of the research procedure, clearly illustrating the overall implementation process of the study. Furthermore, Figure 4 delineates the specific classification of the four environmental types. The categories defined in this table served as the core experimental stimuli for this research and provided essential criteria for subsequent investigations.
To investigate the perceptual differences between real-world environments and their corresponding augmented reality (AR) counterparts, this study adopts the representative Aoluguya Village as the research context. Firstly, two typical types of scenes within the village: native rural environment and artificially created environment were selected. Based on these two real environments, corresponding AR environments were constructed.
Secondly, a paired-matching visual stimulus material system is adopted (as shown in Figure 4). Group 1 consists of (A) and (a), while Group 2 is composed of (B) and (b).
All videos were recorded at 9:00 AM to minimize potential interference from varying lighting conditions. The videos were captured from a first-person perspective, maintaining a consistent viewing height and spatial trajectory. Additionally, the experimental site, observational perspectives, and participant demographics were kept uniform. Finally, participants passively viewed the AR presentations, thereby enabling a systematic exploration of perceptual differences between the two types of real environments and their AR equivalents.

3.2. The Formation of the AR Element

The reconstruction of the Oroqen cultural heritage scene in this study was conducted using Augmented Reality (AR) technology. The construction process is summarized in four key steps, as illustrated in Figure 5.
First, an in-depth field investigation and data collection were conducted in Aoluguya Village to systematically document its core cultural symbols, including the representations of the Evenki people, reindeer, traditional artifacts (such as birch bark canoes and hunting knives), and architectural forms (Cuoluozi dwellings). To achieve high-fidelity digital reproduction of these elements, the Einscan Pro EP (Shining 3D Technology Co., Ltd., Hangzhou, China) multi-functional non-contact 3D scanner was utilized for data acquisition. This device captures detailed geometric structures and color textures with an accuracy of 0.1 mm. The initial 3D point cloud data obtained were processed using Geomagic Wrap 2021 software for denoising, encapsulation, and optimization. Subsequently, the data were imported into Autodesk 3ds Max 2024, where high-poly models were retopologized to optimize mesh structure. UV unwrapping was performed to ensure seamless texture mapping, and PBR material painting was carried out based on reference photographs taken on-site, aiming to accurately replicate the physical properties of materials such as wood and animal hides under realistic lighting conditions. For dynamic presentation, a skeletal system was rigged for key characters (Evenki hunters), and keyframe animations were created to vividly depict traditional practices, such as the custom of carving relocation marks on tree trunks. In the auditory dimension, to enhance immersive experience, environmental sounds of locals chopping tree trunks were recorded on-site using a Sony PCM-D100 (Sony Group Corporation, Tokyo, Japan) portable recorder. Additionally, narrative audio was captured in a professional recording studio with an Austrian Audio OC18 (Austrian Audio GmbH, Vienna, Austria) condenser microphone, featuring cultural inheritors from the local community. The narratives covered three main themes: migration history, reindeer behavior, and the functionality of birch bark canoes. Together, these audio-visual materials form the multimedia resource library for the project.
Subsequently, during the content creation phase, the narrative framework and interaction logic for the AR experience were first established. A linear story script and branching dialog trees were designed, focusing on three core themes: the migration history of the Evenki people, the habits of reindeer, and the functionality of birch bark canoes. In terms of the interaction prototype, a trigger mechanism based on proximity sensing was implemented. Specifically, as a user holding a mobile device approaches a predefined physical marker (Evenki hunters), the AR application utilizes a combination of device GPS and image recognition for composite positioning. This automatically triggers the appearance of the virtual character and the playback of its accompanying narration. From a technical implementation perspective, the pre-processed 3D models, animations, and audio assets were subsequently imported into the Unity 2022 LTS engine. To ensure stable AR functionality, the Vuforia Engine 10.8 AR SDK (PTC Inc., Needham, MA, USA) was integrated and configured. During the development process, high-contrast image targets were created using Vuforia’s Target Manager. These targets were generated from photographs of physical markers taken on-site and were assigned properties for occlusion resistance and persistence. Logic was scripted in C# to link successful recognition events with functional modules responsible for model instantiation, animation playback, and audio triggering. This approach guaranteed that the virtual content was stably and accurately overlaid onto the real-world environment.
Furthermore, within the application development layer, a clean and intuitive user interface was designed using Unity’s UGUI system, primarily consisting of a main menu and interactive tooltips. The main menu enables users to initiate the AR experience, while contextual tooltips provide operational guidance when virtual content is triggered. The project was ultimately packaged for both Android and iOS platforms via Unity’s Build Settings. To facilitate deployment and testing on specific devices, the application was also compiled into a standalone version compatible with tablet computers. Once launched, users can activate the tablet’s camera and aim it at the real-world environment of the Aoluguya Village, thereby invoking real-time AR cultural heritage scenes. These digital scenes are superimposed onto the physical surroundings and support direct user interaction.
Finally, multiple key technologies are comprehensively integrated to ensure the quality of the final experience. Specifically, the core of AR entity tracking relies on the Model Target and Ground Plane detection capabilities of the Vuforia SDK, enabling accurate scaling and alignment of virtual characters, reindeer, and other models with real-world surfaces. For 3D model rendering, Unity’s Universal Render Pipeline is employed, with optimizations applied to shader complexity and draw calls to enhance mobile performance. Data from the mobile device’s gyroscope and accelerometer are utilized to support scene persistence and stability, allowing virtual objects to be anchored more naturally in real-world space as the user moves the device. Evaluations were conducted under various lighting conditions (morning light, noon, overcast) and from multiple viewing angles to assess target recall rates, tracking stability, and interaction trigger latency. Based on test feedback, iterative improvements were made, such as optimizing feature points in target images, reducing polygon counts in high-poly models, adjusting collider sizes, and refining event-trigger logic in C# scripts, thereby enhancing recognition robustness and interaction smoothness across diverse real-world environments.

3.3. Participant Basic Information

A total of 90 participants were recruited for this study. Their detailed demographic characteristics are summarized in Table 2. The sample consisted of 40 males (44.44%) and 50 females (55.56%). This sample size was determined to be sufficient to effectively detect differences between the real environment and the augmented reality environment constructed based on it, as well as to account for individual variations, thereby enhancing the reliability and validity of the research findings. All participants were selected from the 18–30 age range. In terms of educational background, the participant pool was primarily composed of students, reflecting a generally high level of academic attainment. Specifically, 40 participants (44.44%) held a master’s degree, while the remaining 50 (55.56%) held a bachelor’s degree. Regarding disciplinary background, 49 participants (54.44%) were from design-related fields, such as urban and rural planning, landscape architecture, environmental design, and graphic design. The other 41 participants (45.56%) came from diverse academic disciplines including education, mechanical manufacturing, electrical engineering, and business administration. Participants were selected based on their academic backgrounds to ensure that the experimental group possessed varied academic competencies.

3.4. Experimental Procedure

The experiment consisted of three parts: a heart rate variability (HRV) assessment, an eye tracking test, and a post-experiment questionnaire. The study was conducted in a laboratory classroom with minimal noise, controlled odors, and a thermally regulated environment. Stimuli were presented on a 24-inch desktop computer, with participants positioned at a fixed viewing distance of 50–60 cm, maintained by a chin rest.
Upon the participant’s arrival at the laboratory, the experimenter reconfirmed key criteria using a standardized script (“Have you consumed coffee, tea, or energy drinks in the past 24 h? How many hours did you sleep last night? Have you smoked?”). Responses were documented in the experimental procedure record by checking either “Meets exclusion criteria” or “Does not meet (excluded).” Only participants who reported no caffeine intake in the past 24 h, a sleep duration of ≥6 h, and no smoking behavior were included; those failing to meet these criteria were immediately excluded.
Stage 1: Physiological arousal was assessed through Heart Rate Variability (HRV) measurements
The experimenters prepared four video segments, each with a duration of one minute, to serve as experimental stimuli. Specifically, these included: (1) a native rural environment video; (2) an augmented rural native environment video; (3) an artificially created environment video; and (4) an augmented artificial environment video.
All videos were standardized to a resolution of 2560 × 1600 pixels, with consistent frame rates, luminance, and color parameters. AR elements were seamlessly introduced at approximately 20 s and persisted until the end of each clip. Electrocardiogram (ECG) data were continuously recorded using a Polar H10 (Polar Electro Oy, Kempele, Finland) heart rate sensor [62,63], a device validated in numerous prior studies.
Upon arrival at the laboratory, participants were briefed on the experimental procedures and provided written informed consent. Subsequently, a heart rate monitoring device was fitted to each participant. After being seated, participants were instructed to focus quietly on a gray fixation cross at the center of the screen for a duration of two minutes. This phase was designed to record baseline heart rate data under resting conditions. Following this rest period, they were presented with the four experimental videos in a fixed order: (1) Native Rural Environment, (2) Augmented Rural Native Environment, (3) Artificially Created Environment, and (4) Augmented Artificial Environment. The stimulus materials are presented in a fixed sequence designed to simulate a cognitive progression from natural benchmarks to technologically enhanced nature, and further to artificial benchmarks and their technologically enhanced counterparts. This structured approach enables participants to progressively experience and comprehend the contrasts between different environmental types and their enhanced versions. Thereby, potential conceptual confusion or reduced perception of contrast that may arise from randomized sequencing is effectively mitigated [64].
Each video was followed by a 30 s blank screen to allow for a return to a stable state. Heart rate data were recorded continuously throughout all video presentations. The raw heart rate signals were preprocessed and analyzed using Kubios HRV Standard software to extract relevant metrics.
Stage 2: Visual Attention Measurement Based on Eye Tracking
For the first experiment, keyframes were extracted from the four videos to serve as static stimulus images, thereby allowing rigorous control over the visual scene complexity. The continuously changing visual information in dynamic videos may introduce uncontrolled variables, whereas static presentation ensures that all participants are exposed to identical visual information, thereby enhancing the internal validity of the experiment. This approach represents a standard practice in eye tracking research for controlling stimulus materials [65,66]. All images were standardized to a resolution of 2560 × 1600 pixels. Eye movement data were recorded using a Tobii Pro Fusion (KingFar International Inc., Beijing, China) eye tracker, which has been widely employed in previous studies [67,68].
After Experiment 1, the participants proceeded to the eye tracking experiment. First, a 5-point calibration of the eye tracker was performed [69,70] to ensure the tracking accuracy met the required standards. Second, four categories of environmental images were presented sequentially in the experiment, with each image displayed for 10 s. Total Fixation Time (s) and Fixation Count (N) were selected as the core eye tracking indicators to explore the participants’ perceptual differences toward the four types of environments, as well as variations in eye movement responses across different population groups. The definition method of the Area of Interest (AOI) was as follows: the target AR element was identified, the AOI framework was delineated, and AOIs of consistent size were defined at the corresponding positions in the original images to establish a paired control system. For the analysis process, Duration (s) and Fixation Count (%) were chosen as the key indicators for targeted data interpretation. The collected data were processed using ErgoLAB 3.0, the analytical software accompanying the eye tracker.
Stage 3: Evaluation of Subjective Perceptions Using a Questionnaire Survey
This phase was designed to collect participants’ subjective perceptions of two types of augmented reality environments using a 5-point Likert scale, thereby providing complementary validation for objective physiological measures such as heart rate and eye movement data. Given time constraints and scheduling conflicts with some participants, a total of 30 individuals who had completed the first two phases of the experiment were selected to participate in this questionnaire survey. The sample size aligns with common practices in similar subjective evaluation studies [71,72,73]. Furthermore, no significant differences were observed in the demographic characteristics between these participants and the initial group of 81 subjects, ensuring the representativeness of the data.
The questionnaire was administered online using a standardized scale immediately following the eye tracking experiment. Under the supervision of the experimenter, participants independently provided subjective evaluations of the two types of augmented reality environments. The questionnaire took approximately 5 to 8 min to complete. During this process, the experimenter only provided procedural instructions without offering any suggestive cues. Upon completion, responses were automatically collected by the system. Invalid submissions—such as those with identical scores throughout or a completion time of less than 3 min—were excluded during the validity screening. Ultimately, 26 valid questionnaires were retained and subsequently analyzed using SPSS 27.0.

3.5. Instrument

3.5.1. Heart Rate Variability (HRV) Metrics and Analysis

Heart rate variability (HRV) refers to the fluctuation in time intervals between consecutive heartbeats, known as interbeat intervals (IBIs). It reflects neurocardiac function, which arises from the heart-brain interaction and dynamic, nonlinear processes of the autonomic nervous system. HRV is regarded as an indicator of health, self-regulatory capacity, and adaptability or resilience [74]. HRV metrics are categorized into three types: nonlinear measures, frequency-domain measures, and time-domain measures.
Frequency domain measures decompose heart rate oscillations into distinct frequency bands through spectral analysis, enabling the calculation of absolute or relative signal power within each band. Key bands include the very low frequency (VLF), low frequency (LF), and high frequency (HF) ranges. Oscillations in the VLF band, which require 24 h recordings, are defined as those with periods ≥ 5 min. The LF band (0.04–0.15 Hz) is generally considered to reflect baroreflex activity. The HF band (0.15–0.4 Hz), synchronized with the respiratory cycle, reflects respiratory sinus arrhythmia and serves as a marker of parasympathetic nervous system activity. The LF/HF ratio, a dimensionless index typically ranging from 0.5 to 5.0, is used to assess the balance between sympathetic and parasympathetic nervous activities [75].
Nonlinear indices are employed to quantify the unpredictability and complexity of IBI time series. Among these, SD1 and SD2 are parameters derived from the Poincaré plot. SD1 is interpreted as representing short-term heart rate variability, while SD2 reflects long-term heart rate variability [76].
Time-domain indices are utilized to quantify the total heart rate variability (HRV) observed during a monitoring period, which can range from less than one minute to over 24 h. Key metrics include the standard deviation of normal-to-normal intervals (SDNN), the root mean square of successive differences between normal heartbeats (RMSSD), and the proportion of adjacent NN intervals differing by more than 50 milliseconds (pNN50). SDNN represents the standard deviation of all normal interbeat intervals and is regarded as the clinical “gold standard” for assessing cardiac risk [77]. pNN50 refers to the percentage of consecutive normal interbeat intervals that differ by more than 50 ms. RMSSD, the root mean square of successive differences between adjacent normal interbeat intervals, primarily reflects parasympathetically mediated heart rate fluctuations and serves as a primary time-domain measure of the vagal contribution to HRV. The RMSSD index is suitable for short-term and even ultra-short-term assessments [78]. This has been supported in multiple studies; for instance, Lizawati Salahuddin et al. indicated that RMSSD can be effectively estimated using only 10 s of ECG recording, whereas SDNN requires at least 60 s [79]. Similarly, in an analysis of ECG data from 70 volunteers, Nussinovitch Udi et al. found that both 10 s and 1 min resting RMSSD values exhibited acceptable correlation with 5 min RMSSD values [80].
In this study, the RMSSD was selected as the primary metric for heart rate variability (HRV) analysis. As a key time-domain measure, RMSSD reflects vagally mediated changes in heart rate and is well-suited for short-term video-evoked stimulation scenarios involving four one-minute segments. Its application aligns with the requirements of short-term, and even ultra-short-term, HRV assessment.

3.5.2. Eye-Tracking Metrics and Analysis

Eye tracking technology is defined as a technique for detecting and recording eye movements to track gaze positions. Using specialized equipment such as eye trackers and image-processing algorithms, gaze direction, points of regard, and eye-in-head position can be measured with high precision [81]. The most commonly used eye movement metrics currently include fixation, saccade, and pupillary measures. Fixation refers to the maintenance of visual gaze on a single location for a certain duration. Fixation-related metrics comprise total fixation duration, fixation count, and heatmaps, among others [82]. Saccades are defined as rapid eye movements between successive fixation points. Saccade metrics include saccade count and average saccade amplitude. Pupillary metrics reflect changes in pupil diameter resulting from shifts in observer interest, encompassing measures such as mean pupil diameter, maximum pupil diameter, and minimum pupil diameter [83].
In this study, the analysis of eye movement data was conducted using two key quantitative metrics: Total Fixation Time (s) and Fixation Count (N). Additionally, heat map visualization was employed as a complementary technique for qualitative assessment.

3.5.3. Questionnaire Design

This study employed a 5-point Likert scale (1 = strongly disagree, 2 = disagree, 3 = uncertain, 4 = agree, 5 = strongly agree), adapted from Heather L. O’Brien’s engagement scale [84], to assess participants’ subjective perceptions of two types of augmented reality (AR) environments. A self-report questionnaire containing 17 items was developed based on theoretical frameworks of cultural heritage tourism and AR experiences. The instrument comprised five core dimensions: attentional focus (A1–A3), perceived novelty (B1–B3), authenticity (C1–C3), esthetic appeal (D1–D4), and overall satisfaction (Y1–Y4), as outlined in Table 3. These dimensions were used to examine user perceptions across the different AR conditions.
Prior to the main experiment, a pilot study was conducted with a sample of 52 participants to assess the reliability and validity of the questionnaire. The resulting data were statistically analyzed using SPSS version 27.0.
Reliability was assessed using Cronbach’s alpha to measure internal consistency. As presented in Table 3, the overall scale demonstrated excellent reliability (α = 00.918). All subscales also exhibited good reliability, exceeding the recommended threshold of 0.80: attentional focus (α = 0.894), novelty (α = 0.875), authenticity (α = 0.897), overall satisfaction (α = 0.911), and esthetic appeal (α = 0.821). These results indicate that the instrument possessed high internal consistency and reliability.
To examine the construct validity of the questionnaire, exploratory factor analysis (EFA) was conducted. As shown in Table 4, the Kaiser–Meyer–Olkin (KMO) measure of sampling adequacy was 0.808, and Bartlett’s test of sphericity was significant (χ2 = 602.886, p < 0.001), indicating that the data were suitable for factor analysis. Using principal component analysis with varimax rotation, a clear five-factor structure was extracted, which closely aligned with the five theoretically proposed dimensions. The cumulative variance explained reached 79.924%. The rotated component matrix (see Appendix A) revealed that all items loaded strongly on their intended factors (all loadings > 0.57), with no significant cross-loadings observed, thereby supporting good construct validity.
Based on the analysis of the pilot study, the questionnaire was confirmed to be a valid and reliable instrument. The final items of the formal questionnaire are provided in Appendix B.

3.6. Data Analytics

Statistical analyses were performed using SPSS version 27.0. Heart rate variability (RMSSD) and eye tracking metrics—specifically, total fixation time and fixation count—were analyzed using paired-samples t-tests and independent-samples t-tests. The paired-samples t-tests were employed to compare differences between the real-world and augmented reality environments, whereas independent-samples t-tests were used to examine variations across demographic factors such as gender, educational level, and academic background. Questionnaire evaluations were also assessed via independent-samples t-tests to determine whether significant differences existed between the two types of augmented reality environments across five core dimensions. The significance level was set at * p < 0.05 and ** p < 0.01. All data are presented as mean ± standard deviation.

4. Results

4.1. Heart Rate Metrics Analysis

4.1.1. Analysis of Differences Between Real Environments and Augmented Reality Environments Based on Heart Rate Variability

Following the experiment, a rigorous data screening process was conducted to ensure data quality. Invalid samples resulting from equipment malfunction, improper participant operation, or data anomalies were excluded. Consequently, a total of 81 valid samples were retained for subsequent analysis.
An analysis of four environmental types was performed using paired-sample t-tests. Descriptive statistics, presented in Table 5, indicated that for Pair 1, the mean score for the Native Rural Environment was 27.1802 (SD = 14.81018). A significantly higher mean score was found in the Augmented Rural Native Environment (M = 30.4556, SD = 13.37238). This difference was statistically significant (t = −3.606, p = 0.001). In Pair 2, the mean score for the Artificially Created Environment was 26.8012 (SD = 13.69268), which was lower than the mean score of the Augmented Artificial Environment (M = 29.8198, SD = 16.82638). However, this difference was not statistically significant (t = −2.020, p = 0.407).
Preliminary data from both groups indicated that the augmented reality environment scored higher than the real environment, and AR technology only produced a significant positive impact on participants in the native rural environment. In the native rural environment, participants’ RMSSD values increased significantly after the AR experience (p = 0.001), indicating enhanced parasympathetic nervous activity and a more relaxed physiological state. However, in the artificially constructed environment, although RMSSD values also increased after the AR experience, the difference was not statistically significant (p = 0.407). These results suggest that the effectiveness of AR technology in promoting psychophysiological relaxation is highly dependent on the environmental context. Implementing AR interventions in native rural settings yields more pronounced and reliable relaxation benefits.

4.1.2. Analysis of Gender Differences Based on Heart Rate Variability

In the Augmented Rural Native Environment, a significant increase in subjects’ RMSSD values was observed, indicating enhanced parasympathetic nervous activity and a more relaxed physiological state (as shown in Table 5). Based on this finding, gender differences in the relaxation effects within the Augmented Rural Native Environment were further examined. The results (Table 6) revealed a statistically significant difference in RMSSD values between male and female participants (t = −2.601, p = 0.011). Specifically, female participants exhibited a significantly higher mean RMSSD value (33.32 ± 14.97) compared to male participants (26.28 ± 9.36). This suggests that, in the Augmented Rural Native Environment, females experienced a greater enhancement in parasympathetic activity—associated with relaxation and recovery—within the autonomic nervous system, implying a more pronounced physiological relaxation response.

4.1.3. Analysis of Disciplinary Background Differences Based on Heart Rate Variability

To investigate whether disciplinary background influences participants’ perceptions of the Augmented Rural Native Environment, an independent samples t-test was conducted (Table 7). The results revealed that participants from design-related majors scored significantly higher (M = 33.35, SD = 14.39) than those from non-design majors (M = 26.02, SD = 10.37), with t = 2.662 and p = 0.009. These findings suggest that disciplinary background is a key factor influencing participants’ evaluations, indicating that individuals with relevant expertise demonstrate stronger recognition of or more positive responses to the Augmented Rural Native Environment.

4.1.4. Analysis of Educational Level Differences Based on Heart Rate Variability

Table 8 indicates that under the Augmented Rural Native Environment, no significant difference was observed in participants’ responses across different educational backgrounds (t = −1.846, p = 0.069). Specifically, the mean score of the postgraduate group (33.80 ± 15.85) was higher than that of the undergraduate group (28.27 ± 11.11). Although the p-value (0.069) did not reach strict statistical significance, it suggests a notable trend, implying that postgraduates may exhibit stronger physiological or psychological responses to the Augmented Rural Native Environment compared to undergraduates.

4.1.5. Baseline-Corrected RMSSD Change Scores

Prior to the commencement of the experiment, the root mean square of successive differences between normal heartbeats (RMSSD) was measured during a two-minute resting state to establish baseline values. For each of the four environmental conditions, change scores were computed by subtracting the resting baseline value from the corresponding environmental measurement (see Appendix C).
As shown in Table 9, two of the four environmental conditions exhibited positive mean values—the Augmented Rural Native Environment and the Augmented Artificial Environment—indicating that participants’ RMSSD values increased relative to the baseline period, reflecting a physiological relaxation response. The strongest relaxation effect was observed in the Augmented Rural Native Environment, with a mean value of 0.1243, suggesting the most significant improvement in relaxation level among participants. In contrast, the weakest effect was found in the Artificially Created Environment, which had a mean value of −0.0333, implying that not only was relaxation not induced, but a slight physiological stress response was elicited in this condition.
Table 10 examined whether there were significant differences in the mean RMSSD change scores across the four environments. The results demonstrated a statistically significant difference (p = 0.018), indicating that the extent of change in participants’ heart rate variability (RMSSD) differed significantly among the four spatial settings. It was thus concluded that the type of environment significantly affected the physiological responses of the subjects.

4.2. Eye Tracking Metrics Analysis Results

Following the eye tracking experiment, the same data screening procedure applied to the heart rate measurements was adopted to ensure data quality. Specifically, invalid samples resulting from device calibration failure, excessive head movement by participants, or data collection anomalies were excluded. Ultimately, eighty-one valid samples matching the heart rate dataset were retained for subsequent analysis.

4.2.1. Analysis of Differences Between Real Environments and Augmented Reality (AR) Environments Based on Eye Tracking Technology

As shown in Table 11, both the Augmented Rural Native Environment and the Augmented Artificial Environment exhibited higher mean values in Total Fixation Time (s) and Fixation Count (N) compared to the original environment. This indicates that the introduction of AR elements significantly increased participants’ visual attention engagement, reflected in longer fixation durations and more frequent visual exploration behaviors. The data preliminarily suggest that AR technology can effectively enhance the visual appeal or informational complexity of a scene, thereby leading to the allocation of more cognitive resources by the participants.
As shown in Table 12, both the Augmented Rural Native Environment and the Augmented Artificial Environment demonstrated significantly higher values in total fixation duration and fixation count compared to the Native Rural Environment and the Artificially Created Environment (p < 0.05). This finding indicates that AR technology can significantly enhance visual attention and exploratory behavior toward both types of environments, highlighting its potential advantages in fostering immersion and attracting user attention.

4.2.2. Analysis of Gender Differences Based on Eye Tracking Technology

To further investigate gender-specific characteristics in visual attention, eye tracking metrics of male and female participants were analyzed across two types of augmented reality (AR) environments (Table 13). The results revealed that females exhibited statistically significant increases in both Total Fixation Time and Fixation Count compared to males in both AR settings. This suggests that females generally demonstrated a higher level of visual attention and exploratory interest toward these environments. These findings indicate stable, robust differences between genders in the depth of AR experience, thereby providing empirical evidence at the eye-movement level for further investigation into the mechanisms underlying gender-based environmental preferences.

4.2.3. Analysis of Disciplinary Background Differences Based on Eye Tracking Technology

Table 14 presents an analysis of the differences in eye movement metrics among subjects with different disciplinary backgrounds. The results reveal that in the Augmented Rural Native Environment, subjects from design-related majors exhibited significantly higher Total Fixation Time and Fixation Count compared to those from non-design majors. In the Augmented Artificial Environment, Total Fixation Time was significantly greater for design-related majors, whereas no significant difference in Fixation Count was observed (p = 0.395). These findings suggest that disciplinary background selectively influences visual attention and exploratory behavior in augmented reality environments. Specifically, subjects with design-related backgrounds demonstrated more active visual exploration across different types of augmented reality environments, though slight variations were noted between the two settings.

4.2.4. Analysis of Educational Level Differences Based on Eye Tracking Technology

As shown in Table 15, in the Augmented Rural Native Environment, participants with a master’s degree demonstrated significantly higher Total Fixation Time and Fixation Count than those with a bachelor’s degree. Similarly, in the Augmented Artificial Environment, significantly greater Total Fixation Time and Fixation Count were observed among master’s degree holders compared to bachelor’s degree holders. These results indicate that educational level exerts a stable influence on visual attention and exploratory interest in augmented reality environments, with graduate participants exhibiting more active visual exploration across both settings.

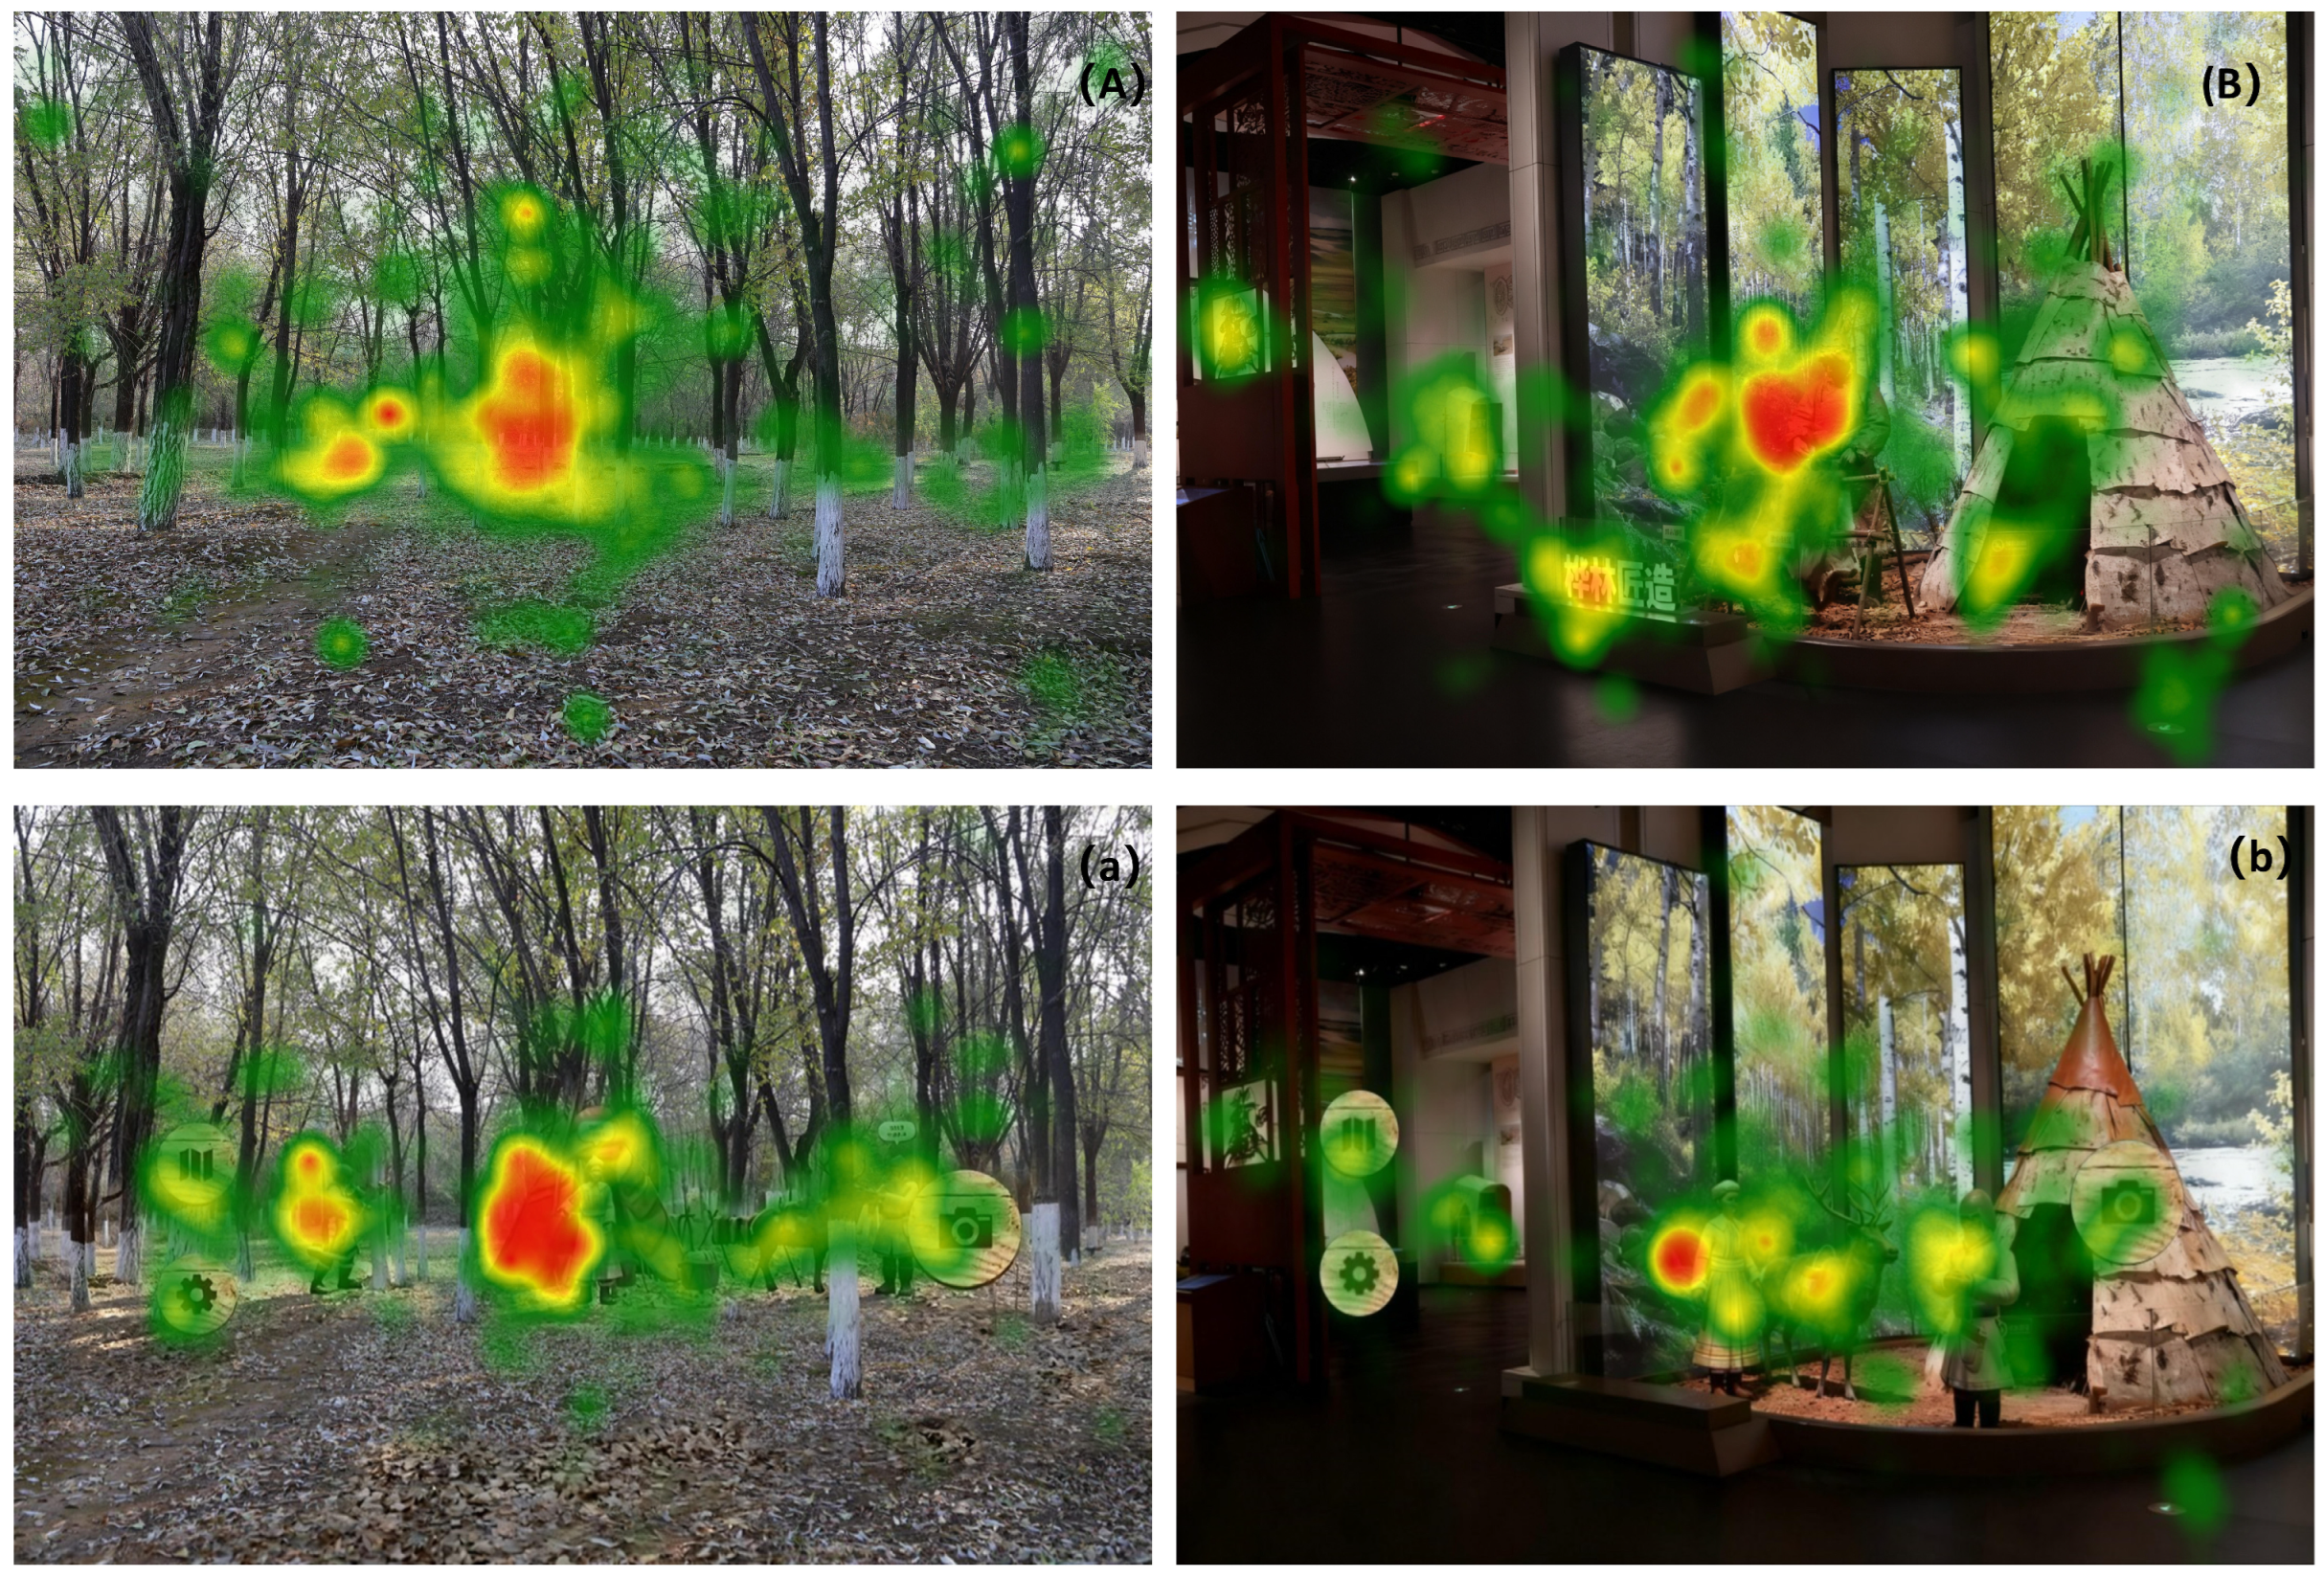
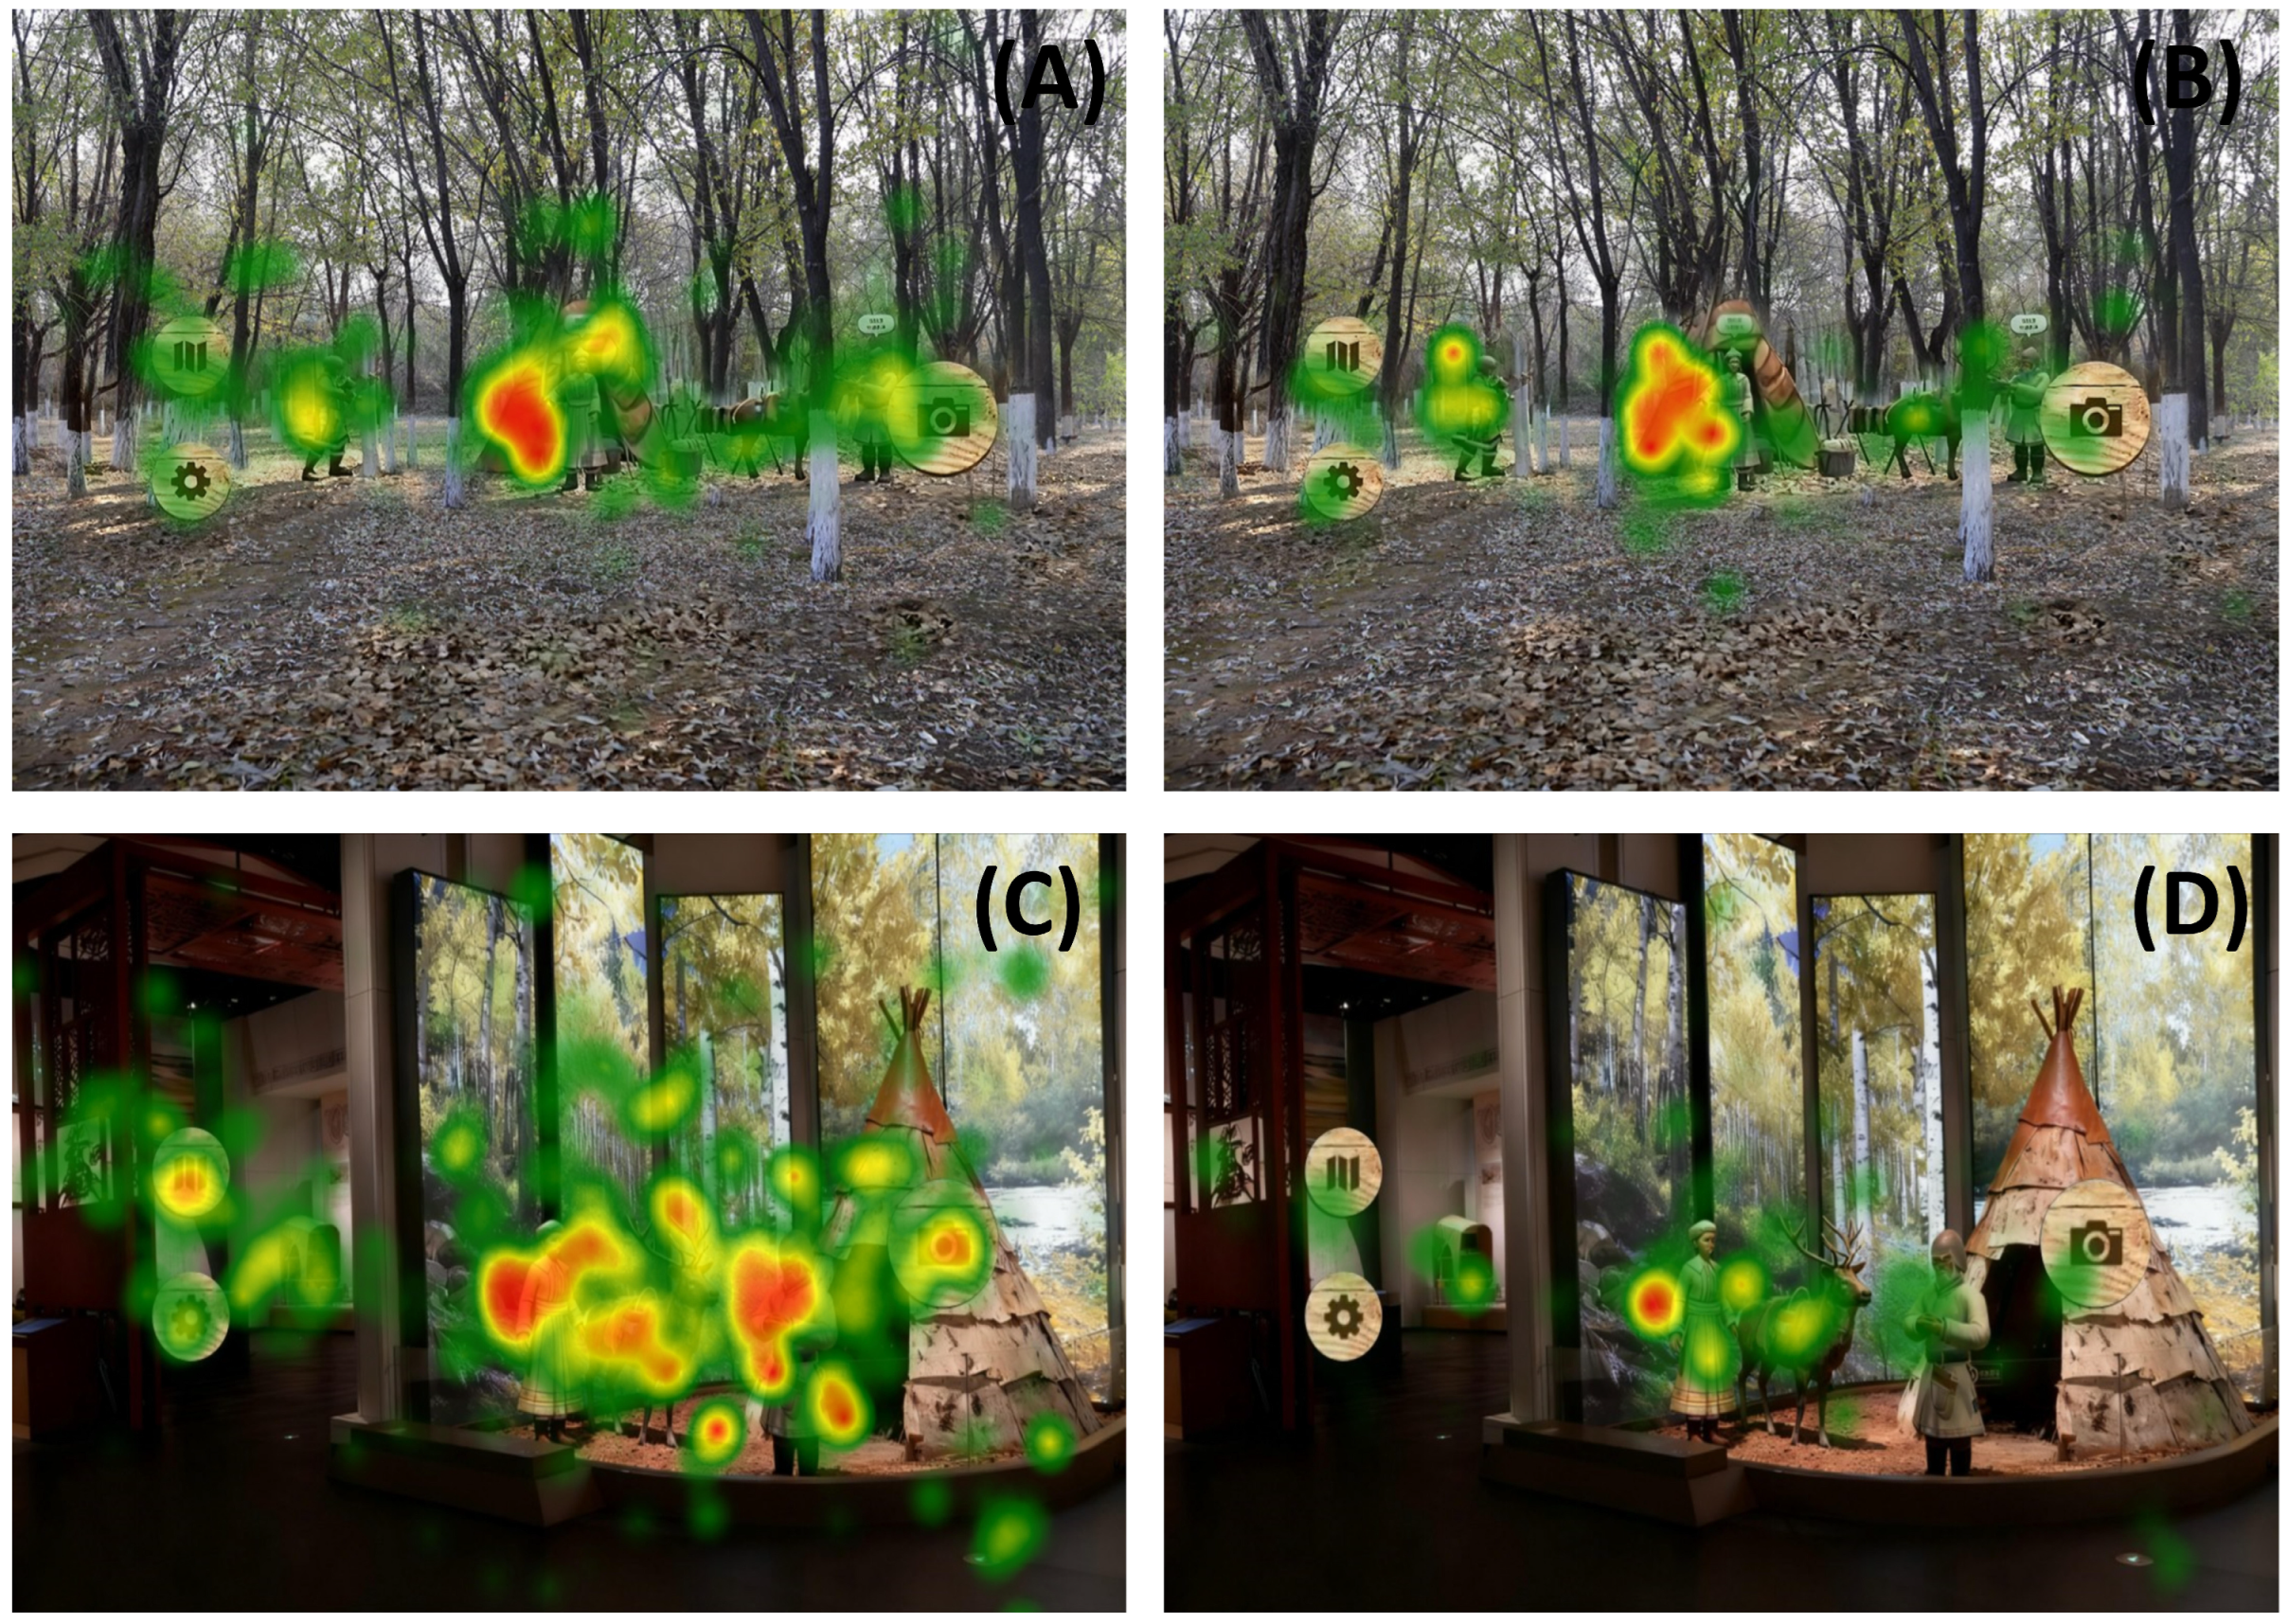
4.3. Eye Tracking Heatmap Analysis

Based on measurements of heart rate variability and eye tracking, which indicated significantly higher ratings for the augmented reality environment compared to the real-world setting, further analysis was conducted using eye tracking heatmaps.
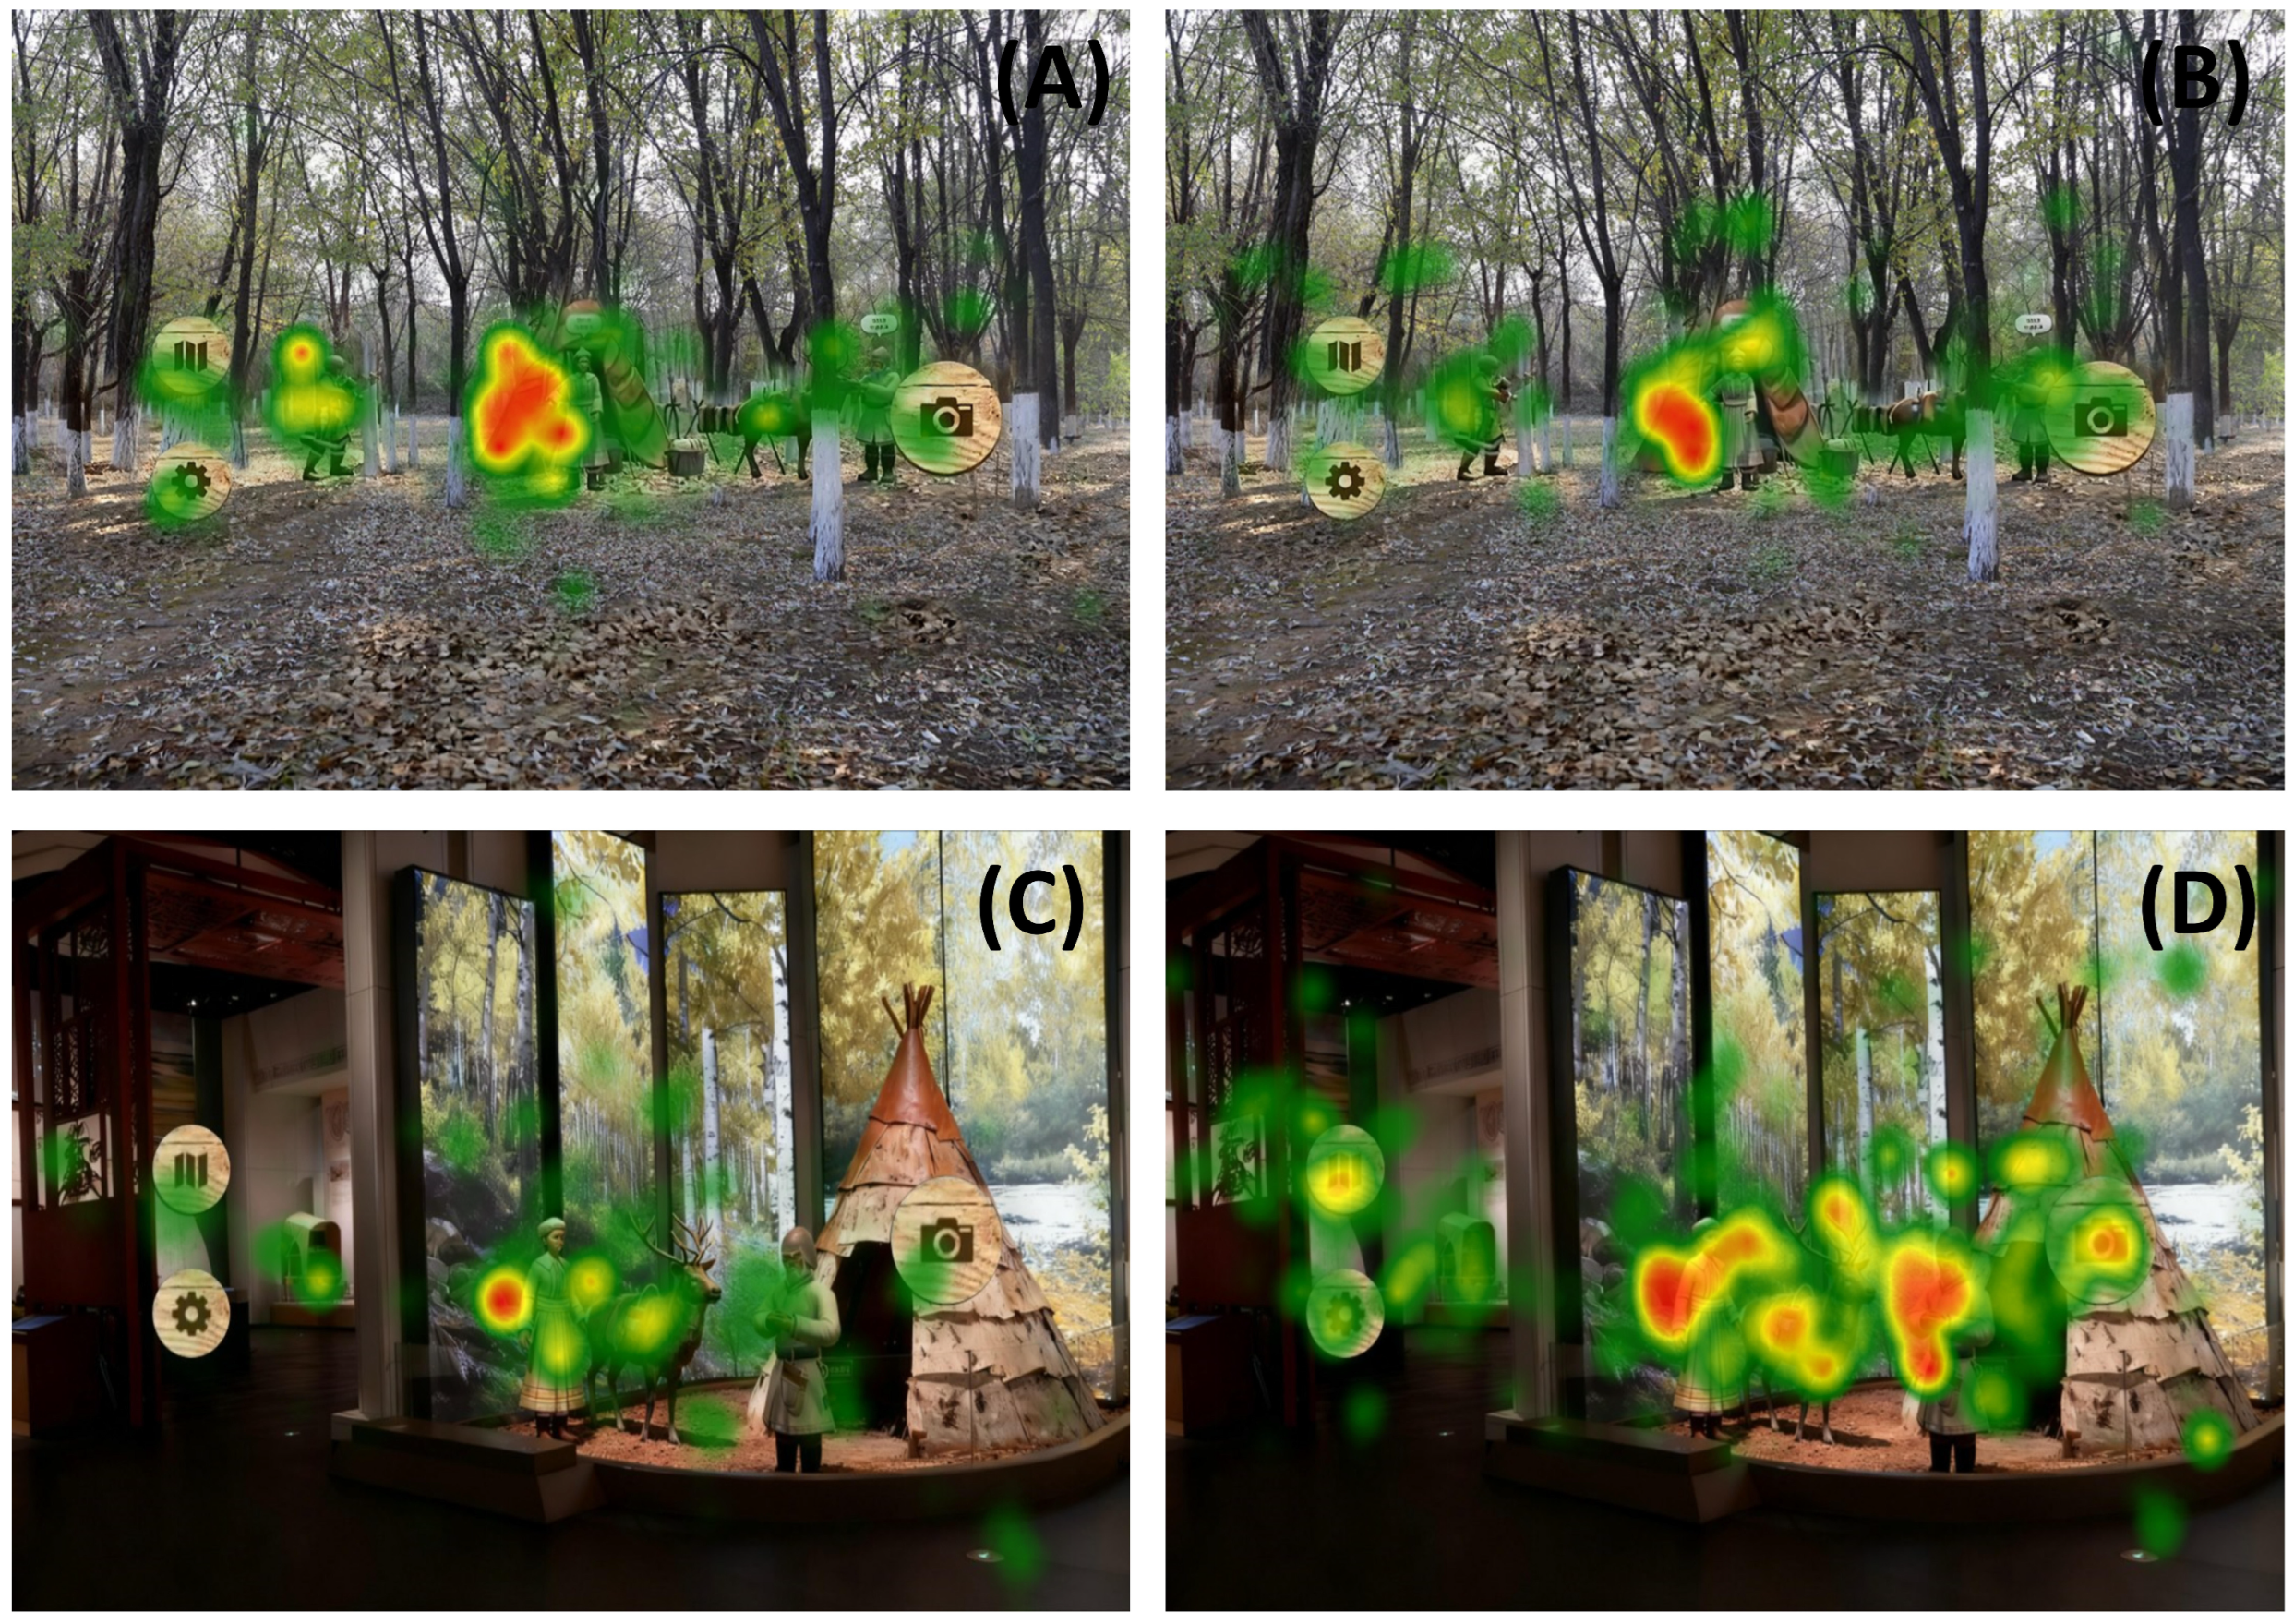
In eye tracking heatmaps, colors are typically used to intuitively represent the distribution density of fixations or their total duration. Red areas are designated as regions with the highest fixation density or the longest total dwell time, indicating where observers focused most frequently or for the longest periods. Yellow zones represent areas with moderate levels of attention, both in terms of fixation density and viewing duration, serving as an intermediate level of engagement between red and green regions. Green areas correspond to the lowest levels of fixation density or the shortest viewing durations, suggesting that these were sections where participants scanned but did not dwell extensively [85].
In eye tracking heatmaps, the level of attention is denoted by color, in the order of: red > yellow > green (from highest to lowest attention).

4.3.1. A Comparison of Eye Tracking Heatmaps Between Real-World Environment and Augmented Reality Environments in a Cohort of 81 Participants

Figure 6 illustrates that in the original space, the subjects’ visual focus was concentrated on the physical scene or the main exhibit (such as the birch forest area and the tent exhibit). However, with the introduction of AR elements, the visual focus became more dispersed, shifting attention from a single physical subject to an integrated area combining both physical and virtual elements.

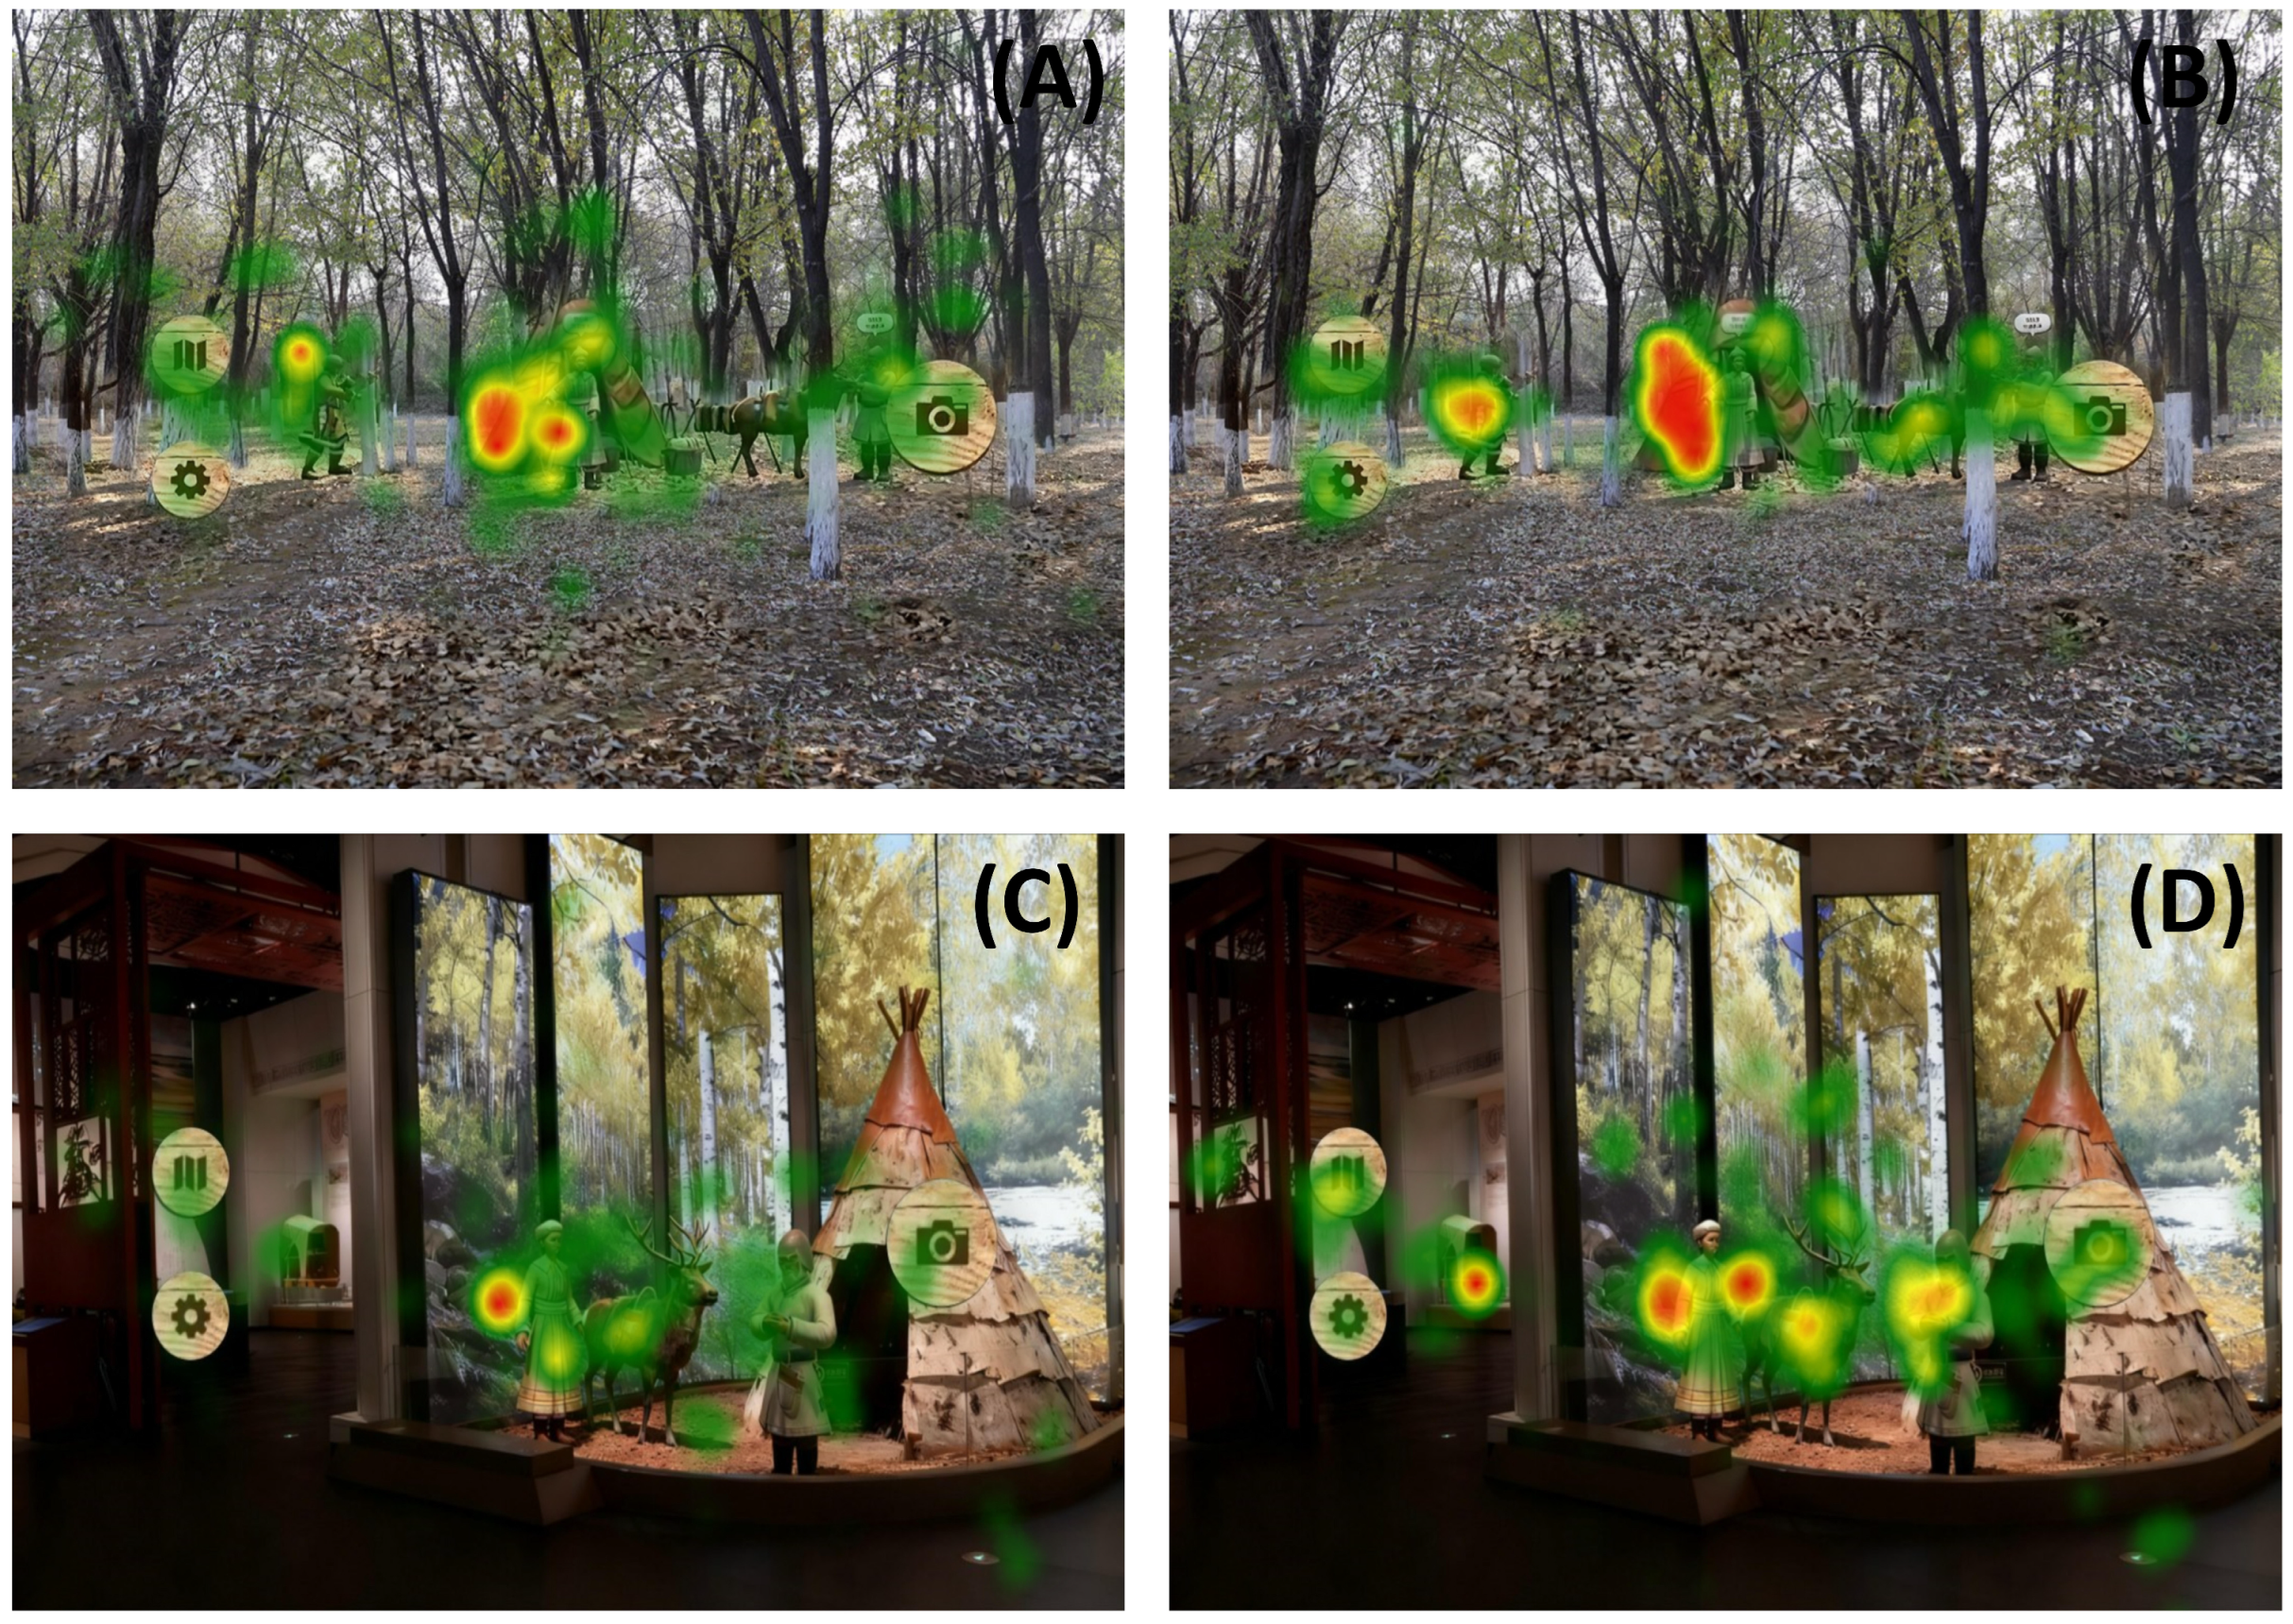
4.3.2. Analysis of Gender Differences Based on Eye Tracking Heatmaps

From a gender perspective (Figure 7), it was observed that male visual attention tends to be more directed, focusing predominantly on key areas to form a hierarchical structure of attention. In contrast, female visual attention demonstrates a multidimensional exploration of information, characterized by greater dispersion and breadth, resulting in a more balanced and multi-nodal pattern of observation.

4.3.3. Analysis of Differences in Disciplinary Background Based on Eye Tracking Heatmaps

From the perspective of disciplinary background (Figure 8), it was observed that subjects from Design-related majors exhibited a detailed, expert-level examination of the integration of AR elements with the real-world scene and their design details. In contrast, subjects from Non-design majors were more driven by immediate visual appeal, demonstrating a more intuitive, “interest-oriented” pattern of visual attention.

4.3.4. Analysis of Differences in Educational Levels Based on Eye Tracking Heatmaps

From the perspective of educational level (Figure 9), a tendency is observed among undergraduate students to focus more on superficial visual interests, demonstrating a relatively concentrated and direct pattern of visual attention. In contrast, at the master’s level, information is processed through more in-depth exploration and multidimensional analysis. This distinction highlights the significant influence of educational background on both the depth and breadth of visual cognition in augmented reality environments.

4.4. Area of Interest (AOI) Analysis

To accurately capture the visual processing characteristics of participants’ responses to AR elements, Area of Interest (AOI) analysis was incorporated into the eye tracking data processing. While heatmaps intuitively display the overall distribution of participants’ gazes, clearly revealing areas of concentrated visual attention as well as neglected regions, they only offer qualitative visual references and cannot quantify eye movement metrics within specific key areas. By defining AOIs, core eye tracking parameters—such as Duration and Fixation Count—within AR-related regions can be explicitly extracted. These metrics precisely reflect the level of attentional engagement, processing depth, and visual preference directed toward the AR elements, thereby enhancing the objectivity and rigor of the research findings.
This study employed a paired AOI delineation strategy for eye movement analysis across four types of experimental images. Specifically, a rectangular Area of Interest (AOI) was first delineated around the central region of the Native Rural Environment image. Subsequently, an identically sized rectangular AOI was defined in the corresponding spatial location within the Augmented Rural Native Environment image. Likewise, paired rectangular AOIs were established using the same methodology in the central areas of both the Artificially Created Environment image and the Augmented Artificial Environment image. Figure 10 presents the AOI (Area of Interest) mapping scheme for the four types of environments.
To investigate the impact of AR elements on visual attention within areas of interest (AOIs), a paired-samples t-test was conducted to compare the fixation duration and fixation count across four types of environments: Native Rural Environment, Augmented Rural Native Environment, Artificially Created Environment, and Augmented Artificial Environment. The results (Table 16) demonstrated that, compared to the Native Rural Environment, the Augmented Rural Native Environment elicited a significant increase in fixation duration (t(80) = −2.165, p = 0.033) and a highly significant decrease in fixation count (t(80) = 5.039, p < 0.001). In contrast, when the Augmented Artificial Environment was compared to the Artificially Created Environment, significant increases were observed in both fixation duration (t(80) = −2.116, p = 0.037) and fixation count (t(80) = −2.090, p = 0.040). These findings collectively indicate that the integration of AR elements significantly and differentially influenced the allocation of participants’ visual attention.

4.5. Survey Data Analysis

As shown in Table 17, the Augmented Rural Native Environment received significantly higher mean scores than the Augmented Artificial Environment across all five evaluation dimensions: Attentional Focus, Perceived Novelty, Authenticity, Esthetic Appeal, and Overall Satisfaction. Furthermore, all differences were statistically significant, with p-values less than 0.01 for each dimension. These results indicate that the Augmented Rural Native Environment performs significantly better in capturing attention, evoking a sense of novelty, creating authenticity, providing esthetic appeal, and delivering overall satisfaction compared to the Augmented Artificial Environment.

5. Discussion

This study systematically examined the effects of augmented reality (AR)-enhanced cultural heritage landscapes on tourist perceptions by integrating eye tracking, heart rate variability (HRV), and subjective questionnaires. The findings not only reveal the differential effects of AR technology across distinct environmental contexts but also underscore the key role of individual characteristics in shaping tourism experiences. In the following sections, these findings are interpreted in light of relevant theories and existing literature, and their theoretical contributions and practical implications are discussed.

5.1. The Synergistic Effect Between AR and the Natural Environment

The findings provide strong support for Hypothesis H1. Eye tracking data revealed that the integration of AR elements significantly increased both total fixation duration and the number of fixation points among visitors across natural and artificial environments. This outcome can be interpreted within the framework of Attention Restoration Theory (ART). According to Kaplan, natural environments effectively replenish directed attention resources [54]. In this study, AR elements functioned as novel and meaningful stimuli that engaged visitors’ involuntary attention, thereby encouraging more extensive visual exploration and information processing, as reflected in the enhanced eye tracking metrics [28,54]. Further objective evidence of the positive influence of AR was provided by heart rate variability (HRV) data. In the Native Rural Environment, the overlay of AR content resulted in a statistically significant increase in RMSSD values—a key indicator of parasympathetic nervous system activity associated with relaxation. This suggests that AR does not function in isolation but acts synergistically with the inherent restorative properties of the native environment. These findings deepen our understanding of the role of digital technology in natural settings, indicating that when digital content is thoughtfully aligned with authentic cultural and natural contexts, it can amplify the environment’s beneficial physiological effects. Moreover, the results align with the Cognitive Appraisal Theory of Emotions. It appears that visitors developed positive cognitive appraisals of the Augmented Rural Native Environment, which subsequently elicited more relaxed and positive emotional states, as evidenced by changes in autonomic nervous system activity [26,52].

5.2. Context-Dependent AR Benefits: Dual Support from Primary and Objective Evidence

The partial confirmation of Hypothesis H2 represents one of the central findings of this study, underscoring the context-dependent nature of AR effectiveness. A significant physiological relaxation benefit—as indicated by increased RMSSD—was observed exclusively in the Native Rural Environment with AR integration, while no such effect was found in the artificial setting. This outcome aligns with the argument advanced by Marques da Silva António José et al. [43] that AR should be coupled with authentic environments to foster deeper experiential engagement, though the present study further quantifies the value of such pairing through objective physiological evidence. Subjective questionnaire results revealed that the Augmented Rural Native Environment was rated significantly higher than the Augmented Artificial Environment across dimensions of perceived authenticity, esthetic appeal, and overall satisfaction. This is consistent with Songhong Chen et al. [42], who emphasized that the interactivity and vividness of AR can enhance visitor enjoyment. However, the current findings specify an essential precondition for such positive impact: the authenticity of the environment serves as the foundational basis for AR to achieve its optimal effect.

5.3. Individual Moderating Effects in the Augmented Reality Experience

Hypothesis H3 was supported, indicating that the AR experience is significantly moderated by demographic characteristics. These findings provide empirical support for the design of personalized tourism experiences.

5.3.1. Gender Differences

Female participants were found to exhibit longer fixation durations, a greater number of fixation points, and higher RMSSD values within the AR environment. These patterns suggest that a more extensive and divergent visual exploration was engaged in by females during the AR experience, which was accompanied by a greater degree of physiological relaxation. This finding is consistent with the gender difference pattern observed by Yue et al. [48] in a historical district study, indicating that across different types of tourism settings, females may generally adopt a more holistic and detail-oriented information processing mode. Consequently, this cognitive style appears to enable enhanced experiential richness and stronger restorative benefits to be derived from the environment.

5.3.2. Disciplinary Background Differences

Participants with design-related backgrounds were observed to exhibit stronger visual engagement and more positive physiological responses to the AR environment. This can likely be attributed to the greater sensitivity and appreciation for design details, spatial narratives, and esthetic integration cultivated through their professional training, which in turn enables the design intent and cultural value of AR-environment integration to be more readily comprehended.

5.3.3. Educational Level Differences

The graduate student group demonstrated more active visual exploration behavior within the AR environment compared to undergraduate students. This suggests that higher educational attainment may be associated with more sophisticated cognitive processing capabilities and greater intellectual curiosity, which appears to motivate individuals with advanced education to engage in deeper interpretation of the cultural and informational content embedded in AR scenarios.

5.4. Practical Implications for Sustainable Development and Heritage Revitalization

The findings of this study offer a novel pathway for the synergistic advancement of rural cultural heritage conservation, tourism economic development, and ecological protection, carrying significant practical implications for rural sustainable development.
The preservation of traditional rural cultural heritage has predominantly relied on physical restoration and static display methods, which remain vulnerable to natural erosion and human-induced damage. In contrast, augmented reality (AR) technology enables the permanent preservation of cultural assets through digital replication, while simultaneously enhancing visitors’ cultural awareness and identity via dynamic interaction and immersive experiences. This facilitates a shift from “static conservation” to “dynamic inheritance” of cultural heritage, thereby ensuring its sustainable continuity.
This study confirms that the Augmented Rural Native Environment significantly outperforms the Augmented Artificial Environment across multiple dimensions, including attentional engagement, perceived novelty, and esthetic experience. This distinctive tourism experience has been shown to effectively extend the duration of visitor stays, thereby stimulating growth in related sectors such as rural catering, accommodation, and handicraft industries. Furthermore, AR technology can integrate fragmented cultural and landscape resources into thematic tourism routes, enhancing the scalability and branding of rural tourism. Such integration fosters a virtuous cycle where enriched cultural experiences contribute directly to economic benefits.
In terms of synergistic sustainability benefits, the low energy consumption and reusability of AR technology align well with rural low-carbon development objectives. Unlike conventional tourism development—which often involves large-scale construction and physical landscape modification—AR-enhanced experiences can be delivered primarily through mobile devices, minimizing land use and construction material consumption. Consequently, ecological disruption associated with tourism development is substantially reduced. Additionally, tourism revenue generated through AR-assisted experiences can be reinvested into ecological governance and cultural heritage preservation, for instance, in native environment restoration or training programs for cultural inheritors. This establishes a tripartite collaborative mechanism linking cultural heritage protection, tourism-based income generation, and ecological conservation, collectively advancing comprehensive and sustainable rural development.

6. Conclusions

This study systematically investigates the impact of augmented reality (AR) technology on the perception of cultural heritage landscapes in rural tourism settings by integrating heart rate variability, eye tracking, and subjective questionnaire surveys. The findings reveal that AR technology significantly enhances visual attention and elicits positive physiological relaxation responses in specific environments, though these effects are markedly context-dependent and moderated by individual characteristics. Specifically, in native rural environments, the introduction of AR elements significantly increased parasympathetic nervous activity among participants, as reflected by a notable rise in RMSSD values, indicating AR’s potential to promote psychophysiological relaxation in such settings. In contrast, no significant physiological relaxation effect was observed in artificially created environments. Eye tracking data further confirmed that AR environments generally prolonged total fixation duration and increased fixation counts, suggesting enhanced visual exploration behavior. These effects were particularly pronounced among female participants, those with design-related backgrounds, and individuals with postgraduate education. Moreover, subjective questionnaire results indicated that the augmented rural native environment outperformed the augmented artificial environment across multiple dimensions, including concentration, novelty, authenticity, esthetic appeal, and overall satisfaction. Therefore, integrating AR technology into native environments should be prioritized in the development of cultural heritage tourism to maximize its positive impacts. Additionally, tourists’ demographic characteristics should be carefully considered to design differentiated and personalized AR experiences, thereby enhancing overall visitor satisfaction and engagement. These conclusions offer a new paradigm for the dynamic preservation of cultural heritage and sustainable tourism development, while providing in-depth insights and practical guidance for the precise design and marketing of tourism experiences.
Future research should expand the sample size to include more diverse tourist demographics, enabling the exploration of perceptual differences across broader populations. Additionally, studies should investigate the long-term effects of AR interaction methods on perception and incorporate a wider range of physiological indicators to more comprehensively reveal the underlying mechanisms through which AR influences visitor perception.

7. Limitations and Implications

7.1. Limitations

This study investigated the impact of augmented reality (AR) on tourist perception in rural cultural heritage tourism settings through the use of eye-tracking and heart rate variability. A comparison was also made between real-world and AR environments in terms of visual attention and physiological responses. However, several limitations remain, which should be addressed in future research to further refine and expand upon these findings.
(1)
The demographic profile of the study sample was relatively homogeneous. Participants were predominantly recruited from a student population aged 18 to 30. Although this group represents early adopters and key users of smart tourism technologies, their age distribution, educational background, consumption habits, and cognitive patterns exhibited considerable uniformity. Consequently, the findings may lack generalizability to broader tourist demographics, such as family travelers, middle-aged or older tourists, and individuals with varying educational backgrounds and levels of technological acceptance. Significant differences may exist across these groups in terms of their perceptions, interaction preferences, and physiological responses to augmented reality technologies. Therefore, future investigations should prioritize the inclusion of more diverse samples to validate the general applicability of the current findings and to explore potential heterogeneity among different demographic segments.
(2)
A gap exists between the experimental setting and authentic tourism experiences. To control for extraneous variables, the present study was conducted in a laboratory environment where stimuli were presented using passive viewing of videos and images. While this approach ensured internal validity, it may have compromised ecological validity to some extent. In actual rural tourism contexts, visitors engage in active exploration and interaction within a multisensory environment—encompassing sounds, scents, and temperatures. This sense of presence and active involvement constitutes a core component of the tourism experience. However, the passive experimental paradigm employed here may not fully capture the complete range of cognitive and emotional responses elicited by augmented reality (AR) technology in real-world, complex settings. Future research should be conducted in real-world cultural heritage tourism settings, employing longitudinal tracking of visitor behavior to more comprehensively and accurately evaluate the enhancement effects of augmented reality technology on cultural heritage tourism experiences.
(3)
Regarding the subjective evaluation data, the sample size is relatively insufficient. Due to practical reasons such as the tight course schedules of the participants and difficulties in time coordination, only 26 valid samples of subjective questionnaires were successfully collected in the end. Although this sample size has certain value in exploratory research and complements the sample size of objective physiological data (N = 81), its scale is still relatively small. A smaller sample size may limit the power of statistical tests, making it impossible to detect some subtle yet important differences in subjective perception. Meanwhile, it may also affect the stability and representativeness of the questionnaire data results. In subsequent research, expanding the sample size of the subjective evaluation part will be an important direction to verify and deepen the findings of this study.

7.2. Implications

(1)
For government bodies and policymakers, this study provides a critical scientific basis for decision making in the formulation of “Smart Cultural Tourism” and “Digital Heritage” strategies. It was objectively demonstrated through physiological data that augmented reality technology significantly enhances tourists’ relaxation and attention levels more effectively in native rural environments than in artificially created settings. These findings offer valuable insights for optimizing the allocation of public resources, supporting the prioritization of digitally augmented projects grounded in authentic cultural heritage. Such an approach helps avoid inefficient virtualization or excessive artificial construction, thereby facilitating high-quality development in rural tourism and enabling the targeted implementation of cultural revitalization strategies.
(2)
For managers of cultural heritage tourism sites, this study offers clear design guidelines and operational insights for the planning and implementation of AR projects. It is explicitly concluded that AR content should be prioritized in native spaces to achieve optimal experiential outcomes. Furthermore, significant differences in AR perception were identified among tourist groups based on gender and educational background. These findings provide empirical support for market segmentation, targeted marketing strategies, and the development of personalized experiences, enabling more precise services and enhanced operational effectiveness.
(3)
For technology companies and research institutions, this study establishes an integrated evaluation framework that combines subjective and objective measurements, offering significant methodological reference value. It was demonstrated that the integration of heart rate variability, eye tracking, and subjective questionnaires can provide deeper insights into tourists’ intrinsic perceptual mechanisms. This approach not only offers guidance for AR content developers in optimizing user experience design but also supplies a new, more scientific analytical tool for assessing the effectiveness of cultural heritage education and display.
(4)
For tourism development, this study demonstrates that augmented reality technology serves as a critical pathway for promoting tourism sustainability. Through digital storytelling, visitor experiences can be enhanced, the lifecycle of destinations extended, and their attractiveness increased, thereby generating sustained economic vitality for rural areas. Furthermore, as a low-environmental-impact solution, augmented reality reduces physical pressure and overdevelopment on cultural heritage and natural environments, effectively mitigating the negative impacts associated with conventional tourism. It was further found that the application of AR in native rural environments effectively promotes psychological restoration and deep concentration among tourists, providing a scientific basis for developing responsible, well-being-oriented high-quality tourism models.

Author Contributions

Conceptualization, W.F.; methodology, W.F.; software, N.L.; validation, C.L. and N.A.; formal analysis, C.L. and W.F.; investigation, W.F. and C.L.; resources, S.G.; data curation, W.F.; writing—original draft preparation, W.F.; writing—review and editing, S.G., C.L., N.L. and N.A.; visualization, W.F.; supervision, S.G., N.A. and N.L.; project administration, N.A.; funding acquisition, N.L. All authors have read and agreed to the published version of the manuscript.

Funding

This research was funded by Investigation and Study on the Productive Landscape Heritage of Beautiful Countryside in Inner Mongolia, General Project of Humanities and Social Sciences Research, Ministry of Education, Grant No. 24YJA760062; Research on Digital Preservation and Real-Scene Interaction Models of Rural Productive Landscape Heritage in Inner Mongolia, Natural Science Foundation of Inner Mongolia, Grant No. 2024LHMS05030; Discovering the Beauty of Productive Landscapes: Development of AR-Based Rural Virtual Tourism Products, Key Research and Development and Achievement Transformation Program of Inner Mongolia Autonomous Region, Grant No. 2022YFDZ0017; Establishment Framework and Key Technologies for Grassland Human Settlements, Project Approval No. YLXKZX-NGD-004.

Institutional Review Board Statement

This study was conducted in accordance with the principles of the Declaration of Helsinki and was approved by the Academic Committee of the School of Architecture, Inner Mongolia University of Technology (Approval No. 20250217, Date: 11 March 2025).

Informed Consent Statement

Prior to the commencement of the experiment, we provided all participants with a detailed explanation of the research objectives, procedures, potential risks, and benefits, and obtained their written informed consent. Participation in this study was voluntary, and participants had the right to withdraw at any time. As compensation, each participant received a monetary remuneration. Furthermore, we have supplemented the statement: “To protect participant privacy, all directly identifiable personal information was removed immediately upon completion of data collection. All subsequent analyses were conducted using a fully anonymized dataset”.

Data Availability Statement

The data supporting the results of the report are presented in the paper. For further consultation, you can contact the corresponding author.

Acknowledgments

The authors thank all those involved in the experiment and the support of the laboratory equipment provided by the college.

Conflicts of Interest

The authors declare no conflicts of interest.

Appendix A

Table A1. Rotated Factor Matrix.
Rotated Factor Matrix a
Factor
12345
A1 0.819
A2 0.830
A3 0.859
B1 0.840
B2 0.788
B3 0.789
C1 0.815
C2 0.857
C3 0.893
D10.845
D20.823
D30.853
D40.858
Y1 0.674
Y2 0.572
Y3 0.696
Y4 0.778
Extraction Method: Principal Component Analysis. Rotation Method: Varimax with Kaiser Normalization. a. Rotation converged in 6 iterations.

Appendix B

Table A2. Survey Questionnaire.
A Comparative Questionnaire on Tourist Perceptions in Two Types of Augmented Reality Environments
Dear Student,
  You are cordially invited to participate in this questionnaire survey concerning experiences with two types of augmented reality (AR) cultural heritage landscapes. During the earlier experimental session, you were sequentially exposed to two distinct AR scenarios: the Augmented Rural Native Environment and the Augmented Artificial Environment. This questionnaire is designed to assess and compare your specific perceptions and evaluations of these two AR environments. The evaluation is structured across five key dimensions: Attentional Focus, Perceived Novelty, Authenticity, Esthetic Appeal, and Overall Satisfaction. You are requested to provide ratings for each of the two environments separately. Your input is of vital importance to this research. All data collected will be kept strictly confidential and used solely for academic purposes.
  We sincerely appreciate your time and contribution.
Part 1:
1. Gender
Male
Female
2. Age Group
18–22 years old
23–26 years old
27–30 years old
3. Educational Level
Bachelor
Master or above
4. Disciplinary Background (Please specify your specific disciplinary background after your selection)
Design-related majors
Non-design majors
5. Prior Experience with AR Technology
Never experienced
Have experienced 1–2 times
Have experienced multiple times
Part 2:
Please rate the following statements based on your actual experience. A higher score indicates stronger agreement with the statement, while a lower score indicates stronger disagreement. (1 = strongly disagree, 2 = disagree, 3 = uncertain, 4 = agree, 5 = strongly agree)
strongly disagreedisagreeuncertainagreestrongly agree
Attentional FocusI was able to maintain focused attention while experiencing this AR environment.
This AR environment attracted my active attention to its detailed content.
I was not easily distracted by external stimuli during the experience.
Perceived NoveltyThis AR environment provided me with a novel experience.
I found the presentation of the AR elements to be innovative.
This AR environment stimulated my interest for further exploration.
AuthenticityThe AR elements were integrated naturally and coherently with the physical environment.
This AR environment enhanced the sense of authenticity of the cultural scene.
This AR environment allowed me to feel the cultural originality.
Esthetic AppealThis AR environment was visually appealing.
The design of the AR elements was consistent with the overall style of the environment.
This AR environment created a pleasant atmosphere.
I was satisfied with the overall visual experience of this AR environment.
Overall SatisfactionI was satisfied with this AR experience overall.
I would recommend this AR experience to others.
This AR experience exceeded my expectations.
I would be willing to experience a similar AR environment again.
Compared to the other AR environment, I prefer this one (the one I just experienced)

Appendix C

Table A3. Changes in Heart Rate Variability (RMSSD) from the Resting Baseline under Four Experimental Conditions.
Native Rural EnvironmentAugmented Rural Native EnvironmentArtificially Created EnvironmentAugmented Artificial Environment
0.06450.66950.2469−0.174
−0.428−0.397−0.817−0.855
−0.1370.4256−0.1870.2231
−1.001−0.596−0.16−0.47
0.55620.12560.42110.6912
−0.648−0.545−0.418−0.286
−0.2220.0635−0.2220.282
0.16220.05820.07680.0582
−0.2840.0799−0.486−0.215
−0.033−0.2640.0192−0.05
−0.31−0.101−0.094−0.213
0.28320.3139−0.543−0.493
−0.1680.09570.2438−0.272
0.44870.57840.4640.512
0.12410.4207−0.441−0.405
−0.5180.03660.21030.0569
−0.204−0.37−0.759−0.257
0.43710.17120.2110.5048
0.39290.42610.35420.5083
0.34760.48270.45250.479
0.24250.1544−0.074−0.92
−0.852−0.751−1.1250.2286
0.17860.16360.23640.2364
0.01530.0883−0.093−0.247
−0.247−0.409−0.2431.2498
−0.1010.0607−0.083−0.032
0.19570.87020.48341.0619
−0.306−0.233−0.047−0.279
0.02610.17010.38990.1701
0.18520.30350.24610.3497
−0.0770.58430.0715−0.218
0.2740.57080.22190.0299
0.08640.68970.24510.8293
0.39740.5120.43710.3769
−0.427−0.034−0.189−0.031
−0.0830.0066−0.174−0.404
0.09350.5069−0.2680.1229
−0.352−0.158−0.4840.5379
−0.0590.09390.1636−0.045
−0.175−0.311−0.135−0.646
−0.0050.78390.1823−0.057
0.0678−0.0870.1313−0.367
0.34590.23530.09720.6488
−0.030.02480.06480.0166
−0.346−0.2230.09110.0183
0.0511−0.032−0.076−0.155
0.37280.37280.47150.3304
0.18630.39740.3304−0.049
−0.0230.208−0.136−0.143
0.23470.25990.0442−0.088
0.15420.05990.01830.4537
−0.51−0.337−0.2770.1241
−0.3450.3046−0.142−0.298
−0.2210.5034−0.1940.2968
0.68320.66810.31210.6731
0.52290.48080.21790.2455
−0.9340.27440.0480.0243
0.0651.257−0.0460
0.02840.1218−0.0520.7354
0.28160.50590.48110.3058
0.43260.3986−0.5140.0254
−0.1460.039200.1689
−0.457−0.027−0.4080.1249
−0.0470.0114−0.394−0.161
0.37580.76910.58680.7772
0.38520.34760.37280.3769
−0.474−0.504−0.617−0.469
0.292−0.105−0.105−0.115
00.0084−0.008−0.004
−0.28−0.523−0.57−0.312
−0.0370.03590.19850.3611
−0.238−0.064−0.19−0.159
−0.66−0.556−0.731−0.587
0.43710.39330.4640.3769
0.0063−0.101−0.1630.0032
−0.116−0.250.0997−0.048
−0.108−0.31−0.275−0.296
0.00360.1539−0.1630.0614
0.08670.04630.07870.0867
−0.067−0.072−0.132−0.138
0.05360.04560.04960.0536

References

  1. Zhang, B.; Shi, H.; Wang, C.; Gu, M. Application of immersive VR in the digital preservation of cultural heritage. Period. Mineral. 2025, 94. [Google Scholar]
  2. De la Fuente, D.; Vega, J.M.; Viejo, F.; Díaz, I.; Morcillo, M. Mapping air pollution effects on atmospheric degradation of cultural heritage. J. Cult. Herit. 2013, 14, 138–145. [Google Scholar] [CrossRef]
  3. Carrera, G.L.; Castilla, J.T.; Castilla, S.M. Cultural heritage, the environment and climate change: Cultural damage from environmental deterioration in San Basilio de Palenque, Colombia. Soc. Identities 2025, 31, 279–293. [Google Scholar] [CrossRef]
  4. Eze-Uzomaka, P.; Oloidi, J.A. Modernization and its effect on cultural heritage in south-western Nigeria. AFRREV IJAH Int. J. Arts Humanit. 2017, 6, 81–93. [Google Scholar] [CrossRef]
  5. Wioletta, K.; Karol, K. Inclusion of Vanishing Cultural Heritage in a Sustainable Rural Development Strategy–Prospects, Opportunities, Recommendations. Sustainability 2023, 15, 3656. [Google Scholar] [CrossRef]
  6. Li, R.; Luo, T.; Zha, H. 3D digitization and its applications in cultural heritage. In Proceedings of the Euro-Mediterranean Conference, Lemessos, Cyprus, 8–13 November 2010; Springer: Berlin/Heidelberg, Germany, 2010; pp. 381–388. [Google Scholar]
  7. Xiao, Y.; Zhan, Q.; Pang, Q. 3D data acquisition by terrestrial laser scanning for protection of historical buildings. In Proceedings of the 2007 International Conference on Wireless Communications, Networking and Mobile Computing, Shanghai, China, 21–25 September 2007; IEEE: Piscataway, NJ, USA, 2007; pp. 5971–5974. [Google Scholar]
  8. Hsieh, K.; Tsaur, T.-S.S.; Chao, M.; Li, I.-C.; Huang, P.-C.; Lu, M.-J. Cultural Heritage Meets AI: Advanced Text-to-Image Models for Digital Reconstruction and Preservation. In Proceedings of the 2024 6th International Conference on Control and Robotics (ICCR), Yokohama, Japan, 5–7 December 2024; pp. 265–269. [Google Scholar] [CrossRef]
  9. Li, M.; Xu, S.; Tang, J.; Chen, W. Design and research of digital twin platform for handicraft intangible cultural heritage-Yangxin Cloth Paste. Herit. Sci. 2024, 12, 43. [Google Scholar] [CrossRef]
  10. Zhong, H.; Wang, L.; Zhang, H. The application of virtual reality technology in the digital preservation of cultural heritage. Comput. Sci. Inf. Syst. 2021, 18, 535–551. [Google Scholar] [CrossRef]
  11. Bai, J.; Sunar, M.S.; Mohd Suaib, N. Augmented reality interaction: A comprehensive review of gesture and speech integration techniques. Neural Comput. Appl. 2025, 37, 11347–11377. [Google Scholar] [CrossRef]
  12. Sun, Y. Augmented Reality in the Rhetoric and Symbolic Experience of Comic Book Images. Appl. Math. Nonlinear Sci. 2025, 10. [Google Scholar] [CrossRef]
  13. Wang, Y.; Deng, X.; Zhang, K.; Lang, Y. The Intangible Cultural Heritage Show Mode Based on AR Technology in Museums-Take the Li Nationality Non-Material Cultural Heritage as an Example. In Proceedings of the 2018 IEEE 3rd International Conference on Image, Vision and Computing (ICIVC), Chongqing, China, 27–29 June 2018; pp. 936–940. [Google Scholar] [CrossRef]
  14. Santano, D.; Zainuddin, M.; James, M.A.M. Exploring Cultural Preservation and Innovation: Augmented Reality Packaging Prototyping for the Mah Meri Tribe in Malaysia. In Proceedings of the 2024 Pacific Neighborhood Consortium Annual Conference and Joint Meetings (PNC), Seoul, Republic of Korea, 29–31 August 2024; pp. 33–38. [Google Scholar] [CrossRef]
  15. Timothy, D.J.; Nyaupane, G.P. (Eds.) Cultural Heritage and Tourism in the Developing World; Routledge: New York, NY, USA, 2009. [Google Scholar]
  16. Zhang, C.; Zhang, J.; Su, M.; Sun, Y.; Zou, T. The Concept and Connotation of Heritage Tourism: Serial Dialogues on “Rethinking Heritage Tourism” (Part 1). Tour. Forum 2021, 14, 1–9. [Google Scholar] [CrossRef]
  17. Seyfi, S.; Hall, C.M.; Rasoolimanesh, S.M. Exploring memorable cultural tourism experiences. J. Herit. Tour. 2020, 15, 341–357. [Google Scholar] [CrossRef]
  18. Wang, F.; Huang, Y.; Wu, B. Model Construction of Tourism Revitalization Path for Traditional Craftsmanship Cultural Heritage. Tour. Trib. 2021, 36, 92–103. [Google Scholar] [CrossRef]
  19. Shehade, M. Enhancing Cultural Heritage Tourism in Rural Areas Through Augmented Reality: A Case Study from Cyprus. In Proceedings of the International Conference of the International Association of Cultural and Digital Tourism, Corfu Island, Greece, 2–4 September 2025; Springer Nature Switzerland: Cham, Switzerland, 2024; pp. 281–294. [Google Scholar]
  20. Lu, Y.; Mi, G.; Lu, H.; Wang, Y. Immersive technologies in built heritage spaces: Understanding tourists’ continuance intention toward sustainable AR and VR applications at the terracotta warriors museum. Buildings 2025, 15, 3481. [Google Scholar] [CrossRef]
  21. Guo, J.; Xu, J.; Pan, Y. How do location-based AR games enhance value co-creation experiences at cultural heritage sites? A process perspective analysis. Appl. Sci. 2024, 14, 6812. [Google Scholar] [CrossRef]
  22. Cheng, Y.; Chen, W. Cultural Perception of Tourism Heritage Landscapes via Multi-Label Deep Learning: A Study of Jingdezhen, the Porcelain Capital. Land 2025, 14, 559. [Google Scholar] [CrossRef]
  23. Zhang, S.; Liu, J.; Pei, T.; Chan, C.-S.; Gao, C.; Meng, B. Perception in cultural heritage tourism: An analysis of tourists to the Beijing-Hangzhou Grand Canal, China. J. Tour. Cult. Change 2023, 21, 569–591. [Google Scholar] [CrossRef]
  24. Mteti, H.S.; Mpambije, J.C.; Manyerere, J.D. Unlocking cultural tourism: Local community awareness and perceptions of cultural heritage resources in Katavi Region in southern circuit of Tanzania. Soc. Sci. Humanit. Open 2025, 11, 101295. [Google Scholar] [CrossRef]
  25. Cai, L.; Cheng, X. Formation mechanism of heritage responsibility behaviour of tourists in cultural heritage cities from the perspective of affective-cognitive evaluation. J. Nat. Resour. 2024, 39, 1278–1298. [Google Scholar] [CrossRef]
  26. Lazarus, R.S. Emotion and Adaptation; Oxford University Press: Oxford, UK, 1991. [Google Scholar]
  27. Liu, X.; Yang, J.; Zhang, Y.; Yuan, Y. Dramaturgy for a serious leisure space: Testing tourists’ cognitive reflections and emotional arousal at the Sanxingdui Museum. J. Hosp. Tour. Manag. 2025, 63, 275–289. [Google Scholar] [CrossRef]
  28. Berman, M.G.; Jonides, J.; Kaplan, S. The cognitive benefits of interacting with nature. Psychol. Sci. 2008, 19, 1207–1212. [Google Scholar] [CrossRef]
  29. Liu, Y.; Zhang, J.; Liu, C.; Yang, Y. A Review of Attention Restoration Theory: Implications for Designing Restorative Environments. Sustainability 2024, 16, 3639. [Google Scholar] [CrossRef]
  30. Lackey, N.Q.; Tysor, D.A.; McNay, G.D.; Joyner, L.; Baker, K.H.; Hodge, C. Mental health benefits of nature-based recreation: A systematic review. Ann. Leis. Res. 2021, 24, 379–393. [Google Scholar] [CrossRef]
  31. Schutte, A.R.; Torquati, J.C.; Beattie, H.L. Impact of urban nature on executive functioning in early and middle childhood. Environ. Behav. 2017, 49, 3–30. [Google Scholar] [CrossRef]
  32. Bratman, G.N.; Daily, G.C.; Levy, B.J.; Gross, J.J. The benefits of nature experience: Improved affect and cognition. Landsc. Urban Plan. 2015, 138, 41–50. [Google Scholar] [CrossRef]
  33. Lyu, P.; Zhang, L.; Zhou, Z.; Zhang, Y.; Sun, L. Correlation between depressive symptoms and heart rate variability in patients with Parkinson’s disease. J. China-Jpn. Friendsh. Hosp. 2025, 39, 275–278, 284. [Google Scholar]
  34. Richter, P.; Wagner, T.; Heger, R.; Weise, G. Psychophysiological analysis of mental load during driving on rural roads-a quasi-experimental field study. Ergonomics 1998, 41, 593–609. [Google Scholar] [CrossRef]
  35. Hao, T.; Zheng, X.; Wang, H.; Xu, K.; Chen, S. Linear and nonlinear analyses of heart rate variability signals under mental load. Biomed. Signal Process. Control 2022, 77, 103758. [Google Scholar] [CrossRef]
  36. Golkar, K. Conceptual evolution of urban visual environment; from cosmetic approach through to sustainable approach. Environ. Sci. 2008, 5, 95–113. [Google Scholar]
  37. Kang, Y.; Chen, J.; Liu, L.; Sharma, K.; Mazzarello, M.; Mora, S.; Duarte, F.; Ratti, C. Decoding human safety perception with eye-tracking systems, street view images, and explainable AI. Comput. Environ. Urban Syst. 2026, 123, 102356. [Google Scholar] [CrossRef]
  38. Sarı, E.; Dindaroğlu, F.; Durmuş, B.; Amado, S. Exploring mandibular asymmetry: Insights from visual perception using eye-tracking technology. BMC Oral Health 2025, 25, 1670. [Google Scholar] [CrossRef]
  39. Kwon, J.; Schmidt, A.; Luo, C.; Jun, E.; Martinez, K. Visualizing Spatial Cognition for Wayfinding Design: Examining Gaze Behaviors Using Mobile Eye Tracking in Counseling Service Settings. ISPRS Int. J. Geo-Inf. 2025, 14, 406. [Google Scholar] [CrossRef]
  40. Chen, Y.; Wang, Q.; Chen, H.; Song, X.; Tang, H.; Tian, M. An overview of augmented reality technology. J. Phys. Conf. Ser. 2019, 1237, 022082. [Google Scholar] [CrossRef]
  41. Zlatanova, S. Augmented Reality Technology GISt Report No 17; Delft University of Technology: Delft, The Netherlands, 2002. [Google Scholar]
  42. Chen, S.; Tian, Y.; Pei, S. Technological Use from the Perspective of Cultural Heritage Environment: Augmented Reality Technology and Formation Mechanism of Heritage-Responsibility Behaviors of Tourists. Sustainability 2024, 16, 8261. [Google Scholar] [CrossRef]
  43. Daniela, P.G. Augmented Reality and Virtual Reality-Based Technology in Cultural Tourism. Entren.-Enterp. Res. Innov. 2021, 7, 307–314. [Google Scholar] [CrossRef]
  44. Bhaskara, G.I.; Sugiarti, D.P. Enhancing Cultural Heritage Tourism Experiencewith Augmented Reality Technology in Bali. E-J. Tour. 2019, 6, 102–118. [Google Scholar] [CrossRef]
  45. Qiu, Q.; Zheng, T.; Xiang, Z.; Zhang, M. Visiting Intangible Cultural Heritage Tourism Sites: From Value Cognition to Attitude and Intention. Sustainability 2020, 12, 132. [Google Scholar] [CrossRef]
  46. Lan, T.; Zheng, Z.; Tian, D.; Zhang, R.; Law, R.; Zhang, M. Resident-Tourist Value Co-Creation in the Intangible Cultural Heritage Tourism Context: The Role of Residents’ Perception of Tourism Development and Emotional Solidarity. Sustainability 2021, 13, 1369. [Google Scholar] [CrossRef]
  47. Yang, Y.; Wang, Z.; Shen, H.; Jiang, N. The Impact of Emotional Experience on Tourists’ Cultural Identity and Behavior in the Cultural Heritage Tourism Context: An Empirical Study on Dunhuang Mogao Grottoes. Sustainability 2023, 15, 8823. [Google Scholar] [CrossRef]
  48. Ma, Y.; Zhang, H.; Liu, M.; Feng, Y.; Zhang, X.; Shi, Y.; Jia, X. Cognitive and Emotional Differences in Daytime and Nighttime Tourist Experiences in Historic Neighborhoods: A Combined Eye-Tracking and Neuroergonomic Experiment. Res. Sq. 2025. preprint. [Google Scholar]
  49. Chang, W.-Y.; Wang, X.; Guo, D.-S.; Nguyen, L.-H.; Tran, N.-H.; Yang, S.-J.; Lin, H.-Z.; Wu, H.-C.; Huang, C.-F. Explore the effects of forest travel activities on university students’ stress affection. Front. Psychol. 2024, 14, 1240499. [Google Scholar] [CrossRef]
  50. Ye, F.; Yin, M.; Cao, L.; Sun, S.; Wang, X. Predicting Emotional Experiences through Eye-Tracking: A Study of Tourists’ Responses to Traditional Village Landscapes. Sensors 2024, 24, 4459. [Google Scholar] [CrossRef]
  51. Huang, D.; Gong, W.; Wang, X.; Liu, S.; Zhang, J.; Li, Y. A Cognition–Affect–Behavior Framework for Assessing Street Space Quality in Historic Cultural Districts and Its Impact on Tourist Experience. Buildings 2025, 15, 2739. [Google Scholar] [CrossRef]
  52. He, J. Research on Visual Image Evaluation and Design of Themed Blocks under Emotional Cognitive Theory. Master’s Thesis, Anhui Jianzhu University, Hefei, China, 2024. [Google Scholar] [CrossRef]
  53. Del Bosque, I.R.; San Martín, H. Tourist satisfaction a cognitive-affective model. Ann. Tour. Res. 2008, 35, 551–573. [Google Scholar] [CrossRef]
  54. Kaplan, R.; Kaplan, S. The Experience of Nature: A Psychological Perspective; Cambridge University Press: Cambridge, UK, 1989. [Google Scholar]
  55. Kaplan, S. The restorative benefits of nature: Toward an integrative framework. J. Environ. Psychol. 1995, 15, 169–182. [Google Scholar] [CrossRef]
  56. Jaggard, C.E. The Effect of Intentionally Engaging Attention when Viewing Restorative Environments: Exploring Attention Restoration Theory. Master’s Thesis, Indiana State University, Terre Haute, IN, USA, 2014. [Google Scholar]
  57. Ohly, H.; White, M.P.; Wheeler, B.W.; Bethel, A.; Ukoumunne, O.C.; Nikolaou, V.; Garside, R. Attention Restoration Theory: A systematic review of the attention restoration potential of exposure to natural environments. J. Toxicol. Environ. Health Part B 2016, 19, 305–343. [Google Scholar] [CrossRef]
  58. Berto, R. Assessing the restorative value of the environment: A study on the elderly in comparison with young adults and adolescents. Int. J. Psychol. 2007, 42, 331–341. [Google Scholar] [CrossRef]
  59. Reeves, J.P.; Knight, A.T.; Strong, E.A.; Heng, V.; Neale, C.; Cromie, R.; Vercammen, A. The application of wearable technology to quantify health and wellbeing co-benefits from urban wetlands. Front. Psychol. 2019, 10, 1840. [Google Scholar] [CrossRef]
  60. D’Argembeau, A.; Van der Linden, M. Individual differences in the phenomenology of mental time travel: The effect of vivid visual imagery and emotion regulation strategies. Conscious. Cogn. 2006, 15, 342–350. [Google Scholar] [CrossRef]
  61. Sweet, M.; Kanaroglou, P. Gender differences: The role of travel and time use in subjective well-being. Transp. Res. Part F Traffic Psychol. Behav. 2016, 40, 23–34. [Google Scholar] [CrossRef]
  62. Schaffarczyk, M.; Rogers, B.; Reer, R.; Gronwald, T. Validity of the polar H10 sensor for heart rate variability analysis during resting state and incremental exercise in recreational men and women. Sensors 2022, 22, 6536. [Google Scholar] [CrossRef]
  63. Rogers, B.; Schaffarczyk, M.; Gronwald, T. Estimation of respiratory frequency in women and men by Kubios HRV software using the polar H10 or movesense medical ECG sensor during an exercise ramp. Sensors 2022, 22, 7156. [Google Scholar] [CrossRef]
  64. Browning, M.H.E.M.; Mimnaugh, K.J.; van Riper, C.J.; Laurent, H.K.; LaValle, S.M. Can Simulated Nature Support Mental Health? Comparing Short, Single-Doses of 360-Degree Nature Videos in Virtual Reality with the Outdoors. Front Psychol. 2020, 10, 2667. [Google Scholar] [CrossRef] [PubMed] [PubMed Central]
  65. Henderson, J.M.; Hollingworth, A. High-level scene perception. Annu. Rev. Psychol. 1999, 50, 243–271. [Google Scholar] [CrossRef]
  66. Mital, P.K.; Smith, T.J.; Hill, R.L.; Henderson, J.M. Clustering of gaze during dynamic scene viewing is predicted by motion. Cogn. Comput. 2011, 3, 5–24. [Google Scholar] [CrossRef]
  67. Krumina, G.; Ceple, I.; Goliskina, V.; Kassaliete, E.; Ruza, T.; Serpa, E.; Svede, A.; Volberga, L. The Development of Objective and Quantitative Eye-Tracking-Based Method for the Diagnostics of Oculomotor Dysfunctions. In Proceedings of the Nordic-Baltic Conference on Biomedical Engineering and Medical Physics, Liepaja, Latvia, 12–14 June 2023; Springer Nature Switzerland: Cham, Switzerland, 2023; pp. 9–17. [Google Scholar]
  68. Röhrl, S.; Hauser, F.; Ezer, T.; Grabinger, L.; Mottok, J. WebGazeTrack: A Web-based Eye Tracking Tool. In Proceedings of the 6th European Conference on Software Engineering Education, Seeon, Germany, 2–4 June 2025; pp. 125–134. [Google Scholar]
  69. Kasprowski, P.; Harężlak, K.; Stasch, M. Guidelines for the eye tracker calibration using points of regard. In Information Technologies in Biomedicine, Volume 4; Springer Nature Switzerland: Cham, Switzerland, 2014; pp. 225–236. [Google Scholar]
  70. Harrar, V.; Le Trung, W.; Malienko, A.; Khan, A.Z. A nonvisual eye tracker calibration method for video-based tracking. J. Vis. 2018, 18, 13. [Google Scholar] [CrossRef] [PubMed]
  71. Eremenko, J.; Kosonogov, V.; Aksiotis, V.; Moiseeva, V.; Obukhova, A.; Godovanets, A.; Zinchenko, O.; Klucharev, V.; Shestakova, A. Neurophysiological study of consumer emotional reactions in a simulated multisensory retail environment. Front. Hum. Neurosci. 2025, 19, 1635673. [Google Scholar] [CrossRef] [PubMed]
  72. Zhong, Y. A Feasibility Study of Small Modular Reactor (SMR) Power-Performance Optimisations Based on the SMART System. Ph.D. Thesis, University of Birmingham, Birmingham, UK, 2022. [Google Scholar]
  73. Shubeck, K.T.; Craig, S.D.; Hu, X. Live-action mass-casualty training and virtual world training: A comparison. In Proceedings of the Human Factors and Ergonomics Society Annual Meeting, Washington, DC, USA, 19–23 September 2016; SAGE Publications: Los Angeles, CA, USA, 2016; Volume 60, pp. 2103–2107. [Google Scholar]
  74. McCraty, R.; Shaffer, F. Heart Rate Variability: New Perspectives on Physiological Mechanisms, Assessment of Self-regulatory Capacity, and Health risk. Glob Adv Health Med. 2015, 4, 46–61. [Google Scholar] [CrossRef] [PubMed] [PubMed Central]
  75. Lampert, R.; Bremner, J.D.; Su, S.; Miller, A.; Lee, F.; Cheema, F.; Goldberg, J.; Vaccarino, V. Decreased heart rate variability is associated with higher levels of inflammation in middle-aged men. Am Heart J. 2008, 156, 759.e1–759.e7. [Google Scholar] [CrossRef] [PubMed] [PubMed Central]
  76. Theorell, T.; Liljeholm-Johansson, Y.; Björk, H.; Ericson, M. Saliva testosterone and heart rate variability in the professional symphony orchestra after “public faintings” of an orchestra member. Psychoneuroendocrinology. 2007, 32, 660–668. [Google Scholar] [CrossRef] [PubMed]
  77. Hadase, M.; Azuma, A.; Zen, K.; Asada, S.; Kawasaki, T.; Kamitani, T.; Kawasaki, S.; Sugihara, H.; Matsubara, H. Very low frequency power of heart rate variability is a powerful predictor of clinical prognosis in patients with congestive heart failure. Circ. J. 2004, 68, 343–347. [Google Scholar] [CrossRef] [PubMed]
  78. Shaffer, F.; McCraty, R.; Zerr, C.L. A healthy heart is not a metronome: An integrative review of the heart’s anatomy and heart rate variability. Front Psychol. 2014, 5, 1040. [Google Scholar] [CrossRef] [PubMed] [PubMed Central]
  79. Salahuddin, L.; Cho, J.; Jeong, M.G.; Kim, D. Ultra short term analysis of heart rate variability for monitoring mental stress in mobile settings. In Proceedings of the Annual International Conference of the IEEE Engineering in Medicine and Biology Society, Lyon, France, 22–26 August 2007; pp. 4656–4659. [Google Scholar]
  80. Nussinovitch, U.; Elishkevitz, K.P.; Katz, K.; Nussinovitch, M.; Segev, S.; Volovitz, B.; Nussinovitch, N. Reliability of Ultra-Short ECG Indices for Heart Rate Variability. Annals of noninvasive electrocardiology. Ann. Noninvasive Electrocardiol. 2011, 16, 117–122. [Google Scholar] [CrossRef]
  81. Jiang, X.; Wu, X.; Chen, F.; Chen, Z.; Li, Z. Visual Perception of Environmental Elements Analysis in Historical District Based on Eye-Tracking and Semi-Structured Interview: A Case Study in Xining, Taishan. Buildings 2025, 15, 1554. [Google Scholar] [CrossRef]
  82. Meso, A.I.; Fletcher, K.; Barton, J.J.S. Eye tracking: A comprehensive guide to methods and measures, vision rehabilitation: Multidisciplinary care of the patient following brain injury. Perception 2012, 41, 1286–1288. [Google Scholar] [CrossRef]
  83. Rayner, K. Eye movements and attention in reading, scene perception, and visual search. Q. J. Exp. Psychol. 2009, 62, 1457–1506. [Google Scholar] [CrossRef]
  84. O’Brien, H.L.; Toms, E.G. The development and evaluation of a survey to measure user engagement. J. Am. Soc. Inf. Sci. Technol. 2010, 61, 50–69. [Google Scholar] [CrossRef]
  85. Koonsanit, K.; Tsunajima, T.; Nishiuchi, N. Evaluation of Strong and Weak Signifiers in a Web Interface Using Eye-Tracking Heatmaps and Machine Learning. In Proceedings of the International Conference on Computer Information Systems and Industrial Management, Ełk, Poland, 24–26 September 2021; Springer International Publishing: Cham, Switzerland, 2021; pp. 203–213. [Google Scholar]
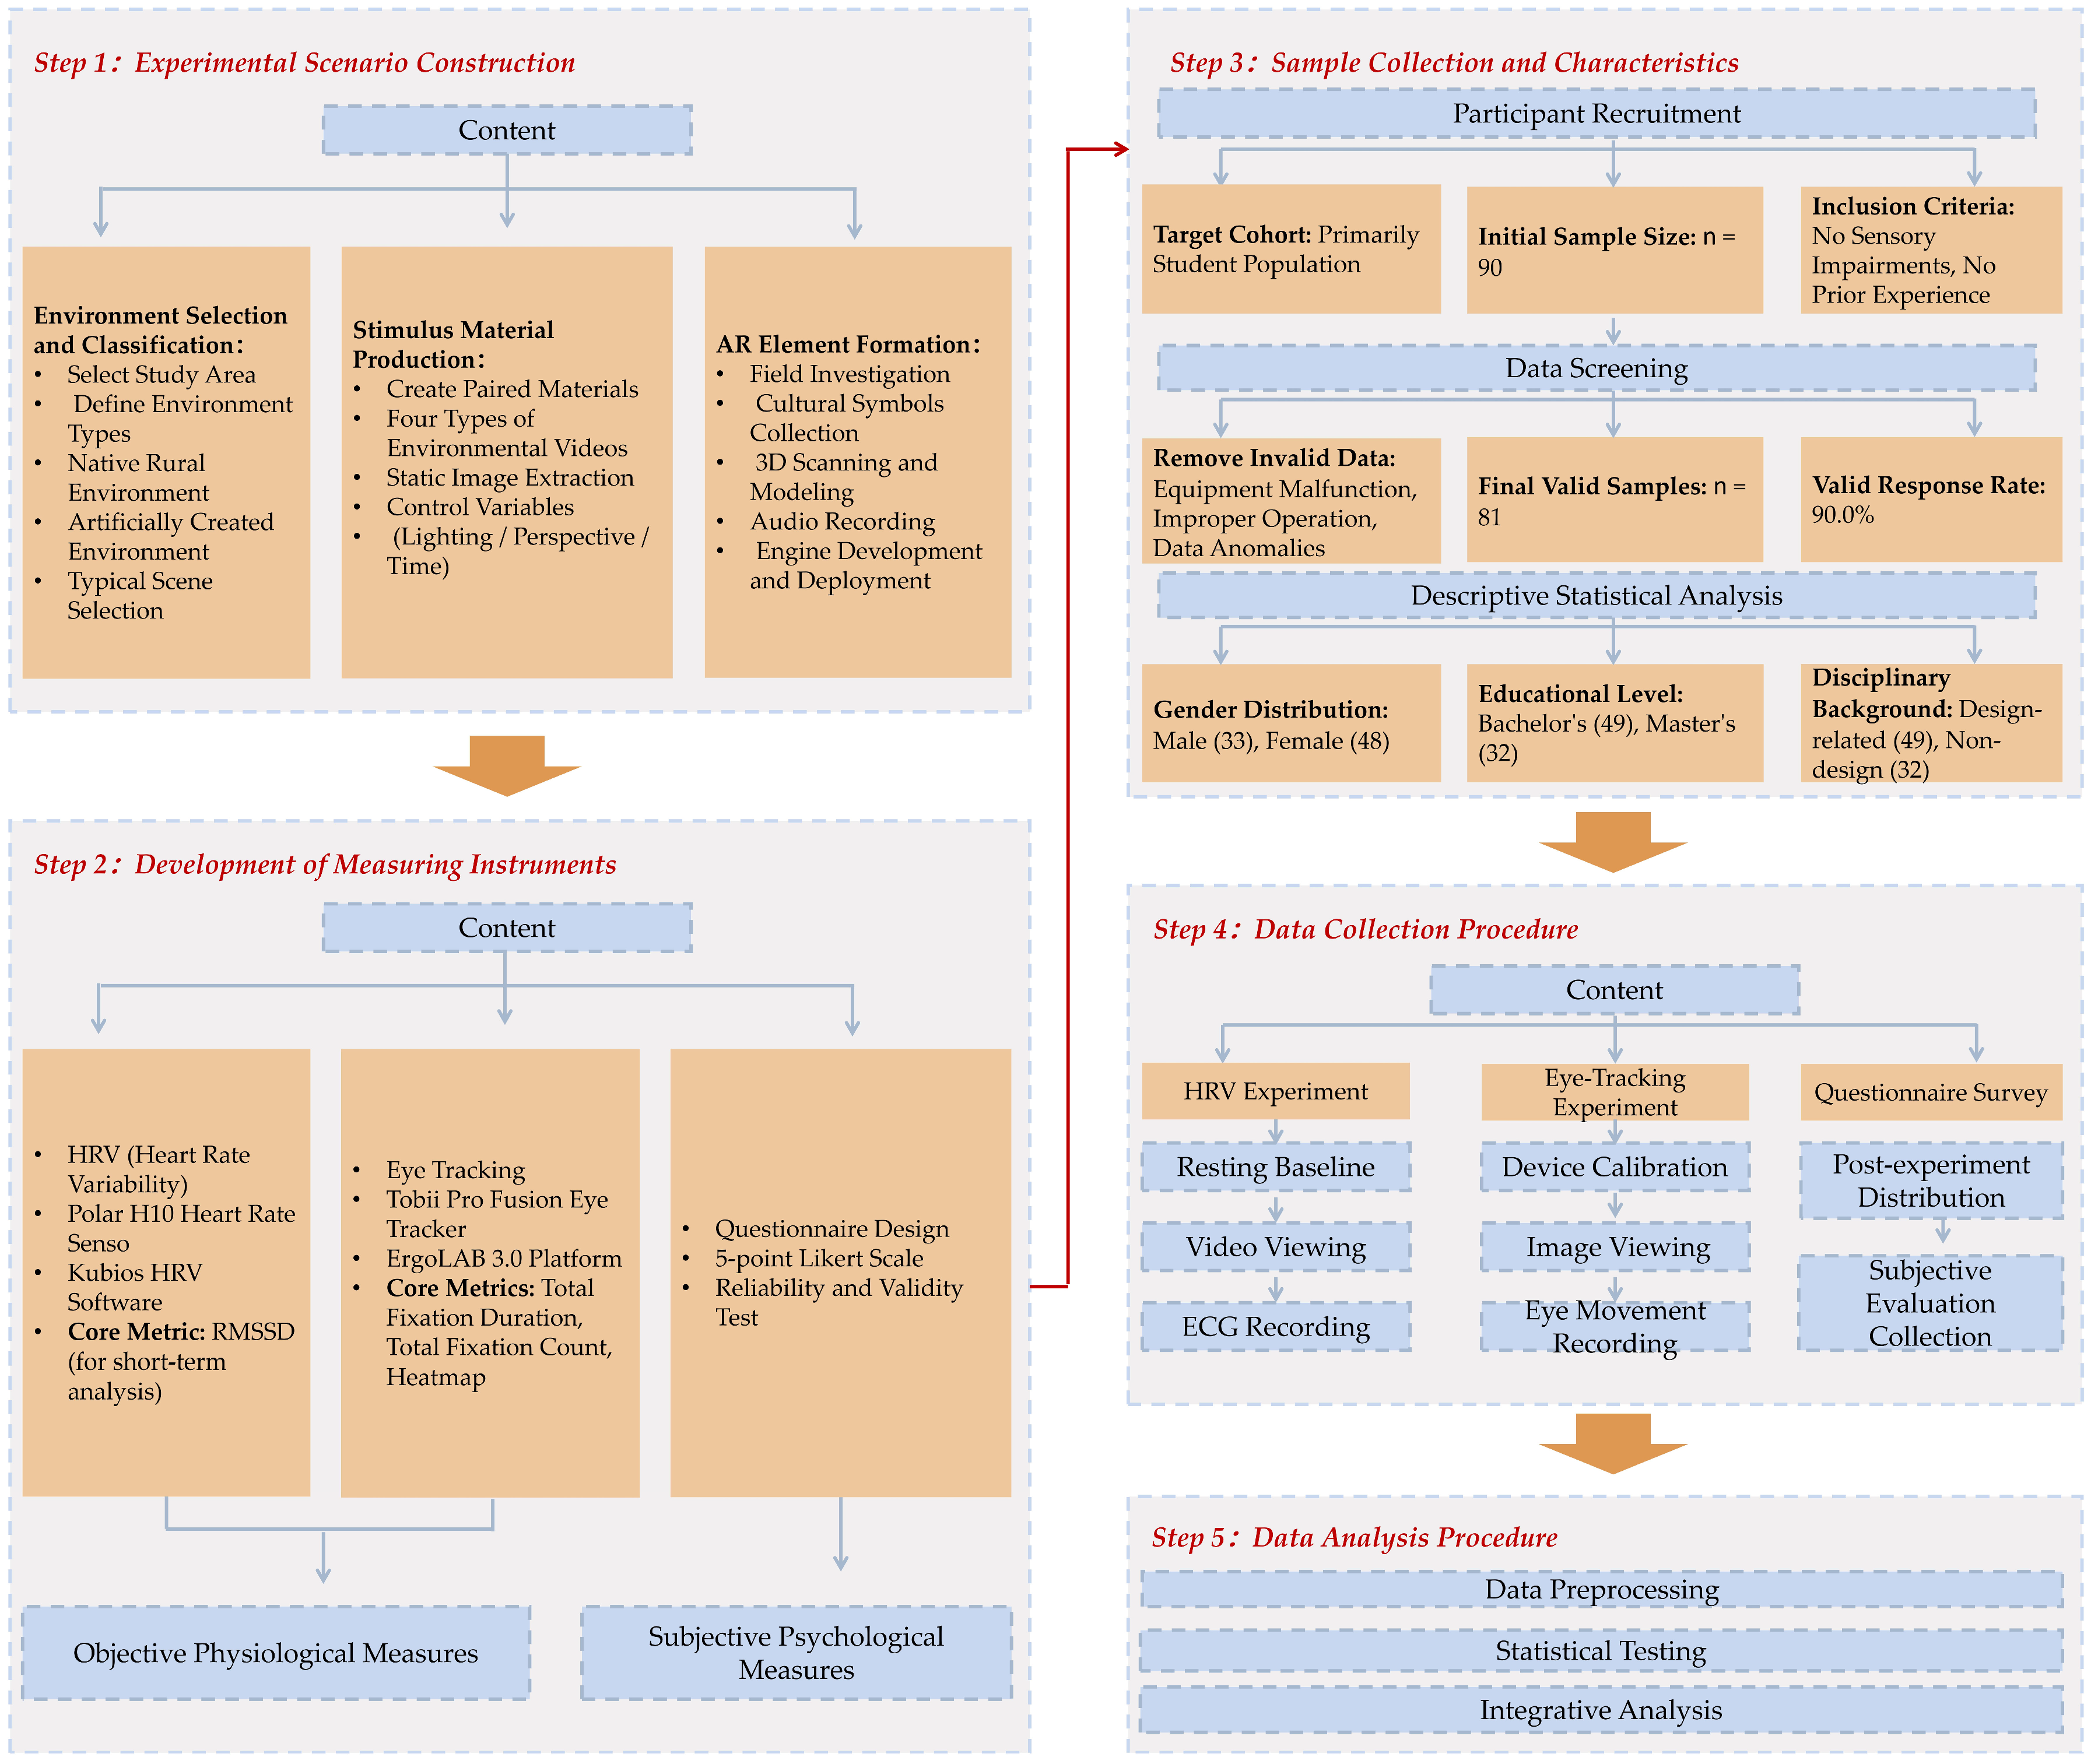
Figure 3. Research process flowchart.
Sustainability 17 10575 g003
Figure 4. Classification of four environmental types: (A) Native Rural Environment. (a) Augmented Rural Native Environment. (B) Artificially Created Environment. (b) Augmented Artificial Environment.
Sustainability 17 10575 g004
Figure 5. AR element construction flowchart.
Sustainability 17 10575 g005
Figure 6. The diagram shows four eye movement heatmaps from the average of 81 participants. Attention levels are indicated by colors, ranked from high to low as red > yellow > green. (A) Native Rural Environment. (a) Augmented Rural Native Environment. (B) Artificially Created Environment. (b) Augmented Artificial Environment.
Sustainability 17 10575 g006
Figure 7. (A,C) are the average fixation heatmaps of 33 male participants viewing the two types of augmented reality (AR) environments, while (B,D) are those of 48 female participants viewing the same two types of AR environments. Attention levels are indicated by colors, ranked from high to low as red > yellow > green.
Sustainability 17 10575 g007
Figure 8. (A,C) show the average eye-tracking heatmaps of 49 design-related major participants in the two augmented reality (AR) environments, while (B,D) present those of 32 non-design major participants in the same two AR environments. Attention levels are indicated by colors, ranked from high to low as red > yellow > green.
Sustainability 17 10575 g008
Figure 9. (A,C) are the average eye-tracking heatmaps of 49 participants with a bachelor’s degree while viewing the two types of augmented reality (AR) environments, and (B,D) are those of 32 participants with a master’s degree while viewing the same two AR environments. Attention levels are indicated by colors, ranked from high to low as red > yellow > green.
Sustainability 17 10575 g009
Figure 10. Delineation of Areas of Interest (AOI). (A) Native Rural Environment. (a) Augmented Rural Native Environment. (B) Artificially Created Environment. (b) Augmented Artificial Environment. Attention levels are indicated by colors, ranked from high to low as red > yellow > green.
Sustainability 17 10575 g010
Table 1. Mapping of research questions and corresponding hypotheses.
Research QuestionHypothesisExplanation
RQ1: How are visitors’ visual attention and emotional responses shaped by AR-enhanced cultural heritage landscapes, and to what extent are these effects more pronounced compared to those in authentic environments?H1: Compared to real-world settings, Augmented Reality (AR) environments have been found to capture and sustain tourists’ visual attention more effectively while also eliciting a higher degree of emotional engagement.This study examines whether augmented reality settings are superior to real-world environments in terms of both visual and emotional dimensions.
RQ2: Do restorative experiences and visitor preferences vary across different types of augmented reality (AR) environments, and are these potential variations moderated by demographic characteristics such as gender, educational level, and disciplinary background?H2: It was verified that both the Native Rural Environment and the Augmented Rural Native Environment demonstrated significantly superior restorative benefits and experience preferences when compared to the Artificially Created Environment and the Augmented Artificial Environment.The main effect of environment type and the moderating effect of demographic characteristics were examined.
H3: The influence of augmented reality (AR) environments on tourists’ perceptions may be moderated by demographic characteristics, including gender, educational level, and disciplinary background.
Table 2. Participant basic information.
GroupsCategoryFrequency (n)Percentage (%)
GenderMale4044.44%
Female5055.56%
educational levelBachelor5055.56%
Master4044.44%
disciplinary backgroundDesign-related majors4954.44%
Non-design majors4145.56%
Table 3. Core dimensions and reliability.
DimensionCronbach’s AlphaNumber of ItemsOverall Cronbach’s Alpha
Attentional Focus0.89430.918
Perceived Novelty0.8753
Authenticity0.8973
Esthetic Appeal0.9114
Overall Satisfaction0.8214
Table 4. Validity.
Table 4. Validity.
KMO and Bartlett’s Test
Kaiser-Meyer-Olkin Measure of Sampling Adequacy0.808
Bartlett’s Test of Sphericityapproximate chi-square602.886
df136
Sig.0.000
Table 5. Results of the paired-sample t-test between the real-world and augmented reality environments.
Paired-Samples t-Test
IndexPairEnvironment TypesMnSDSEMtp
RMSSD (ms)Pair 1Native Rural Environment27.18028114.810181.64558−3.6060.001 **
Augmented Rural Native Environment30.45568113.372381.48582
Pair 2Artificially Created Environment26.80128113.692681.52141−2.0200.407
Augmented Artificial Environment29.81988116.826381.86960
** p < 0.01 (indicating a statistically extremely significant difference).
Table 6. Gender differences in the Augmented Rural Native Environment.
Independent Samples t-Test
Augmented Rural Native EnvironmentGender (M ± SD)tp
M (n = 33)F (n = 48)
26.28 ± 9.3633.32 ± 14.97−2.6010.011 *
* p < 0.05 (indicating a statistically significant difference).
Table 7. Differences in disciplinary background in the Augmented Rural Native Environment.
Independent Samples t-Test
Augmented Rural Native EnvironmentDisciplinary Background (M ± SD)tp
Design-related majors (n = 49)Non-design majors (n = 32)
33.35 ± 14.3926.02 ± 10.372.6620.009 **
** p < 0.01 (indicating a statistically extremely significant difference).
Table 8. Differences in Augmented Rural Native Environment between educational level.
Independent Samples t-Test
Augmented Rural Native EnvironmentEducational Level (M ± SD)tp
Bachelor (n = 49)Master (n = 32)
28.27 ± 11.1133.80 ± 15.85−1.8460.069
Table 9. Descriptive statistics of RMSSD change scores across the four spatial environments.
Descriptive Statistics
Environment TypesnMSDSEM95% CIMinMax
LLUL
Native Rural Environment81−0.02590.341770.03797−0.10150.0496−1.000.68
Augmented Rural Native Environment810.12430.375920.041770.04120.2074−0.751.26
Artificially Created Environment81−0.03330.342920.03810−0.10920.0425−1.120.59
Augmented Artificial Environment810.05970.401880.04465−0.02910.1486−0.921.25
Total3240.03120.370540.02059−0.00930.0717−1.121.26
Table 10. ANOVA results for RMSSD change scores across spatial environments.
ANOVA
SourceSum of SquaresdfMean SquareFSig.
Between Groups1.37030.4573.4000.018
Within Groups42.9783200.134
Total44.348323
Table 11. Paired samples statistics for Eye Tracking Metrics across four environmental conditions.
Paired Samples Statistics
PairEye Movement IndexEnvironment TypesMnSDSEM
Pair 1Total Fixation Time (s)Native Rural Environment7.3380811.482180.16469
Augmented Rural Native Environment7.6181811.208330.13426
Pair 2Fixation Count (N)Native Rural Environment20.0617817.416780.82409
Augmented Rural Native Environment21.6173816.748270.74981
Pair 3Total Fixation Time (s)Artificially Created Environment7.2701811.259180.13991
Augmented Artificial Environment7.4797811.252970.13922
Pair 4Fixation Count (N)Artificially Created Environment21.3457816.919470.76883
Augmented Artificial Environment23.0123816.468180.71869
Table 12. Paired-sample t-test results for Total Fixation Time and Fixation Count of 81 subjects across four environments.
Paired-Samples t-Test
PairEye Movement IndexEnvironment TypesMSDSEMtdfp
Pair 1Total Fixation Time (s)Native Rural Environment0.280141.193820.132652.112800.038 *
Augmented Rural Native Environment
Pair 2Fixation Count (N)Native Rural Environment1.555566.129850.681092.284800.025 *
Augmented Rural Native Environment
Pair 3Total Fixation Time (s)Artificially Created Environment0.209580.926950.102992.035800.045 *
Augmented Artificial Environment
Pair 4Fixation Count (N)Artificially Created Environment1.666676.982120.775792.148800.035 *
Augmented Artificial Environment
* p < 0.05 (indicating a statistically significant difference).
Table 13. Differences in Total Fixation Count and Total Fixation Time between male and female participants in two types of augmented reality environments.
Environment TypesMetricsGendernMSDSEMtdfp (Two-Tailed)
Augmented Rural Native EnvironmentTotal Fixation Time (s)M337.25911.395050.22935−2.534790.013 *
F487.92000.939600.14165
Fixation Count (N)M3319.83786.326811.04012−2.230790.029 *
F4823.11366.796771.02465
Augmented Artificial EnvironmentTotal Fixation Time (s)M337.12401.577230.25930−2.413790.018 *
F487.77880.798530.12038
Fixation Count (N)M3320.78386.338311.04201−2.980790.004 **
F4824.88646.027900.90874
* p < 0.05 (indicating a statistically significant difference), ** p < 0.01 (indicating a statistically extremely significant difference).
Table 14. Comparison of differences in Total Fixation Time and Fixation Count among participants with different disciplinary backgrounds in two types of augmented reality environments.
Environment TypesMetricsDisciplinary BackgroundnMSDSEMtdfp (Two-Tailed)
Augmented Rural Native EnvironmentTotal Fixation Time (s)Design-related majors497.88260.799110.120472.199790.031 *
Non-design majors327.30361.514820.24904
Fixation Count (N)Design-related majors4923.18186.409560.966282.338790.022 *
Non-design majors3219.75686.751151.10988
Augmented Artificial EnvironmentTotal Fixation Time (s)Design-related majors497.58900.933810.140780.855790.395
Non-design majors327.34971.554090.25549
Fixation Count (N)Design-related majors4924.63645.494570.828342.547790.013 *
Non-design majors3221.08117.060761.16078
* p < 0.05 (indicating a statistically significant difference).
Table 15. Comparison of differences in Total Fixation Time and Fixation Count among participants with different educational levels in two types of augmented reality environments.
Environment TypesMetricsEducational LevelnMSDSEMtdfp (Two-Tailed)
Augmented Rural Native EnvironmentTotal Fixation Time (s)Bachelor497.38571.455280.20790−2.192790.031 *
Master327.97390.522160.09231
Fixation Count (N)Bachelor4920.18376.869840.98141−2.438790.017 *
Master3223.81256.018451.06392
Augmented Artificial EnvironmentTotal Fixation Time (s)Bachelor497.22941.530270.21861−2.282790.025 *
Master327.86290.418210.07393
Fixation Count (N)Bachelor4921.67356.631330.94733−2.371790.020 *
Master3225.06255.718881.01097
* p < 0.05 (indicating a statistically significant difference).
Table 16. The results of the paired comparisons for the Duration and Fixation Count metrics in the AOIs across the four environmental types.
Paired-Sample t-Test
PairMetricsEnvironment TypesMnSDSEMtdfp (Two-Tailed)
Pair 1Duration (s)Native Rural Environment9.9996810.006470.00072−2.165800.033 *
Augmented Rural Native Environment10.0020810.008030.00089
Pair 2Fixation Count (N)Native Rural Environment7.2593813.085360.342825.039800.000 **
Augmented Rural Native Environment5.3827812.977280.33081
Pair 1Duration (s)Artificially Created Environment9.9988810.005930.00066−2.116800.037 *
Augmented Artificial Environment10.0012810.007310.00081
Pair 2Fixation Count (N)Artificially Created Environment6.5556814.274930.47499−2.090800.040 *
Augmented Artificial Environment7.5679813.041130.33790
* p < 0.05 (indicating a statistically significant difference), ** p < 0.01 (indicating a statistically extremely significant difference).
Table 17. Results of the independent samples t-test for 26 subjects across five core dimensions in two types of augmented reality environments.
Independent-Samples t-Test
Core DimensionsGroup (M ± SD)tp
Augmented Rural Native Environment
(n = 26)
Augmented Artificial Environment
(n = 26)
Attentional Focus3.56 ± 0.972.56 ± 1.243.2410.002 **
Perceived Novelty3.86 ± 0.862.72 ± 1.044.2910.000 **
Authenticity3.54 ± 1.222.64 ± 0.903.0280.004 **
Esthetic Appeal3.49 ± 1.202.63 ± 1.092.7140.009 **
Overall Satisfaction3.70 ± 0.722.82 ± 0.933.8220.000 **
** p < 0.01 (indicating a statistically extremely significant difference).
Disclaimer/Publisher’s Note: The statements, opinions and data contained in all publications are solely those of the individual author(s) and contributor(s) and not of MDPI and/or the editor(s). MDPI and/or the editor(s) disclaim responsibility for any injury to people or property resulting from any ideas, methods, instructions or products referred to in the content.