1. Introduction
The transportation sector is a major contributor to greenhouse gas (GHG) emissions and global warming, accounting for approximately 15 to 23% of GHG emissions [
1,
2,
3]. The global vehicle fleet continues to expand rapidly, particularly in developing countries, and projections indicate that by 2040, the number of light-duty vehicles (LDVs) worldwide will reach between 1.7 and 2 billion [
4]. Despite accelerated progress in alternative technologies such as vehicle electrification and the use of alternative fuels, conventional vehicles powered by Internal Combustion Engines (ICEs) still dominate the global fleet, especially in regions where electrification infrastructure remains limited [
5]. Therefore, improving the fuel efficiency of ICE-powered vehicles remains a critical step toward achieving net-zero carbon targets. Several initiatives have highlighted the significance of decarbonizing the transportation sector. Among these initiatives is the Paris Agreement, established under the United Nations Framework Convention on Climate Change (UNFCCC), which encourages nations to include transport decarbonization strategies within their Nationally Determined Contributions (NDCs) [
6]. In response to growing energy demand and emissions, a determined shift toward sustainable mobility is underway. While the deployment of alternative energy carriers such as electricity [
7,
8,
9], green hydrogen [
10,
11,
12], advanced biofuels [
13,
14] and synthetic fuels [
15,
16] is expanding, their large-scale adoption depends not only on the sustainability of the fuels but also on enhancing the efficiency of existing vehicle technologies [
17]. Among powertrain subsystems, the transmission has a key role in determining the operational efficiency of the engine and overall fuel economy [
18]. Transmission types in ICE-powered vehicles are typically categorized into five main types: manual transmissions (MTs), automated manual transmissions (AMTs), automatic transmissions (ATs), dual-clutch transmissions (DCTs), and continuously variable transmissions (CVTs). While ATs, DCTs, and CVTs have become increasingly prevalent due to their smooth shifting and driver convenience, MTs remain widely used in many markets owing to their lower cost, mechanical simplicity, and durability. Unlike automatics, MTs require the driver to engage the clutch and select gears manually, introducing variability in fuel economy but also offering opportunities for performance improvement through optimized gear ratio design. Gear ratios play a significant role across all transmission types in terms of enabling the ICE’s operation near its optimal Brake Specific Fuel Consumption (BSFC) regions in conventional vehicles [
19] or by determining motor speed-torque mapping in electrified vehicles [
20]. Lower gears allow for a torque increase, enabling high-torque operating conditions such as acceleration or towing, whereas higher gears reduce engine rotational speed (RPM), improving fuel economy during light-load conditions such as cruising and highway driving. Excessive fuel consumption can result from operating the engine in sub-optimal BSFC zones due to improper gear ratio selection. In electrified vehicles, despite their relatively simpler transmission design compared to conventional systems, poor transmission or gear ratio selection can still force the traction motor to operate outside its high-efficiency zones on the motor efficiency map, leading to unnecessary energy losses and reduced driving range [
21].
Ebbesen et al. [
22] investigated the optimization of gear ratios for a hybrid electric vehicle (HEV) transmission through a novel model that combined Particle Swarm Optimization (PSO) and Dynamic Programming (DP). Their approach achieved a minimum fuel consumption of 3.67 L/100 km over a defined driving cycle, demonstrating the effectiveness of coordinated control strategies and gear optimization in reducing fuel consumption. Similarly, Oglieve et al. [
23] explored optimizing gear ratios and shift strategies to simultaneously minimize brake specific fuel consumption and NO
x emissions over the New European Driving Cycle (NEDC). Their results revealed that a six-speed configuration achieved up to a 7.5% BSFC reduction and a 6.75% NO
x emission reduction, showing the impact of fine-tuned gear design. Walker et al. [
24] analyzed the effect of gear ratios on hybrid versus conventional six-speed transmissions under the WLTC driving cycle. The study highlighted how adjusting gear ratios to maintain engine operation within more efficient BSFC regions enhances energy efficiency without compromising drivability. Wu et al. [
25] developed a multi-objective framework using the NSGA-III algorithm to optimize gear ratios in an AMT, balancing performance, economy, and shift comfort. Their model yielded improvements of 5.85% in power output, 7.07% in energy efficiency, and a notable 46.74% increase in shift quality. Ahssan et al. [
26] employed Gradient Descent (GD) and Pattern Search (PS) algorithms to optimize gear ratios and shift schedules for a two-speed transmission. Their findings showed energy savings ranging from 4% to 7.5% across several driving cycles, including urban, highway, and hilly conditions, highlighting the potential of hybrid optimization techniques in improving both motor efficiency and vehicle performance. Dynamic Programming (DP) was utilized in [
27] to fine-tune gear ratios while also coordinating the shift control strategy to eliminate torque interruptions. This integrated approach led to a noticeable improvement in energy efficiency, with the optimized configuration achieving up to an 11.4% gain in overall energy efficiency.
Although advancements in powertrain modeling and optimization have been extensively investigated, improving transmission efficiency remains one of the most effective and economical approaches to enhancing fuel economy in conventional vehicles without modifying major hardware components. It is also well established that optimizing gear ratio design directly influences engine operating conditions under various driving scenarios. However, most existing gear ratio optimization methods rely on evolutionary and/or gradient algorithms that either require extensive parameter tuning or involve high computational costs. In addition, prior studies focused on simplified vehicle models or treated the transmission as an independent subsystem, therefore limiting their ability to accurately capture the coupling effects between engine dynamics and real-world transient driving cycles such as the WLTC. This creates a gap in developing probabilistic optimization frameworks capable of efficiently learning from high-fidelity simulations and guiding design improvements under real driving conditions. To address these limitations, this study introduces a machine-learning-based BO framework integrated within the GT-SUITE vehicle modeling to optimize gear ratio configurations in a six-speed transmission representative of midsize passenger vehicles (D-segment). The specific objectives of this study are as follows:
Develop a high-fidelity GT-SUITE model of a conventional vehicle to accurately capture the transient interaction between the engine, transmission, and longitudinal vehicle dynamics under the WLTC driving cycle.
Implement and evaluate a Bayesian Optimization framework to minimize total fuel consumption by systematically adjusting transmission gear ratios.
Analyze the sensitivity of each gear ratio to overall fuel economy to identify the most influential design parameters.
Validate the optimized model against the baseline configuration to ensure compliance with the WLTP regulations and to quantify improvements in fuel consumption and performance without modifying engine or vehicle hardware.
2. Materials and Methods
The one-dimensional detailed vehicle model was developed using GT-SUITE (version 2023), representing a conventional ICE-powered vehicle equipped with a manual transmission. To ensure accurate and reliable fuel consumption, the model captured the transient interactions among key subsystems, including the internal combustion engine, transmission, vehicle body, and driver controller, within a dynamic simulation approach. These interactions were coupled with the vehicle’s longitudinal dynamics, enabling a detailed representation of real-world driving behavior and powertrain response under varying operating conditions. The tractive torque required to follow the driving cycle’s speed profile was computed by solving road-load losses, which incorporate inertial and resistive forces as expressed in Equation (1) [
28]:
where
is the vehicle side output torque of clutch, ω
drv is the driveline speed on the vehicle side of clutch.
Iaxl,
Idsh,
Itrans1,
Itrans2 are the axle, driveshaft, input-side, and output-side transmission moments of inertia, respectively.
Mveh is the vehicle mass,
rwhl is the wheel radius,
Faero,
Frol, Fgrd represent aerodynamic drag, rolling resistance, and road-grade forces, respectively.
Rd is the final drive ratio,
Rt is the transmission ratio, and
t is the time.
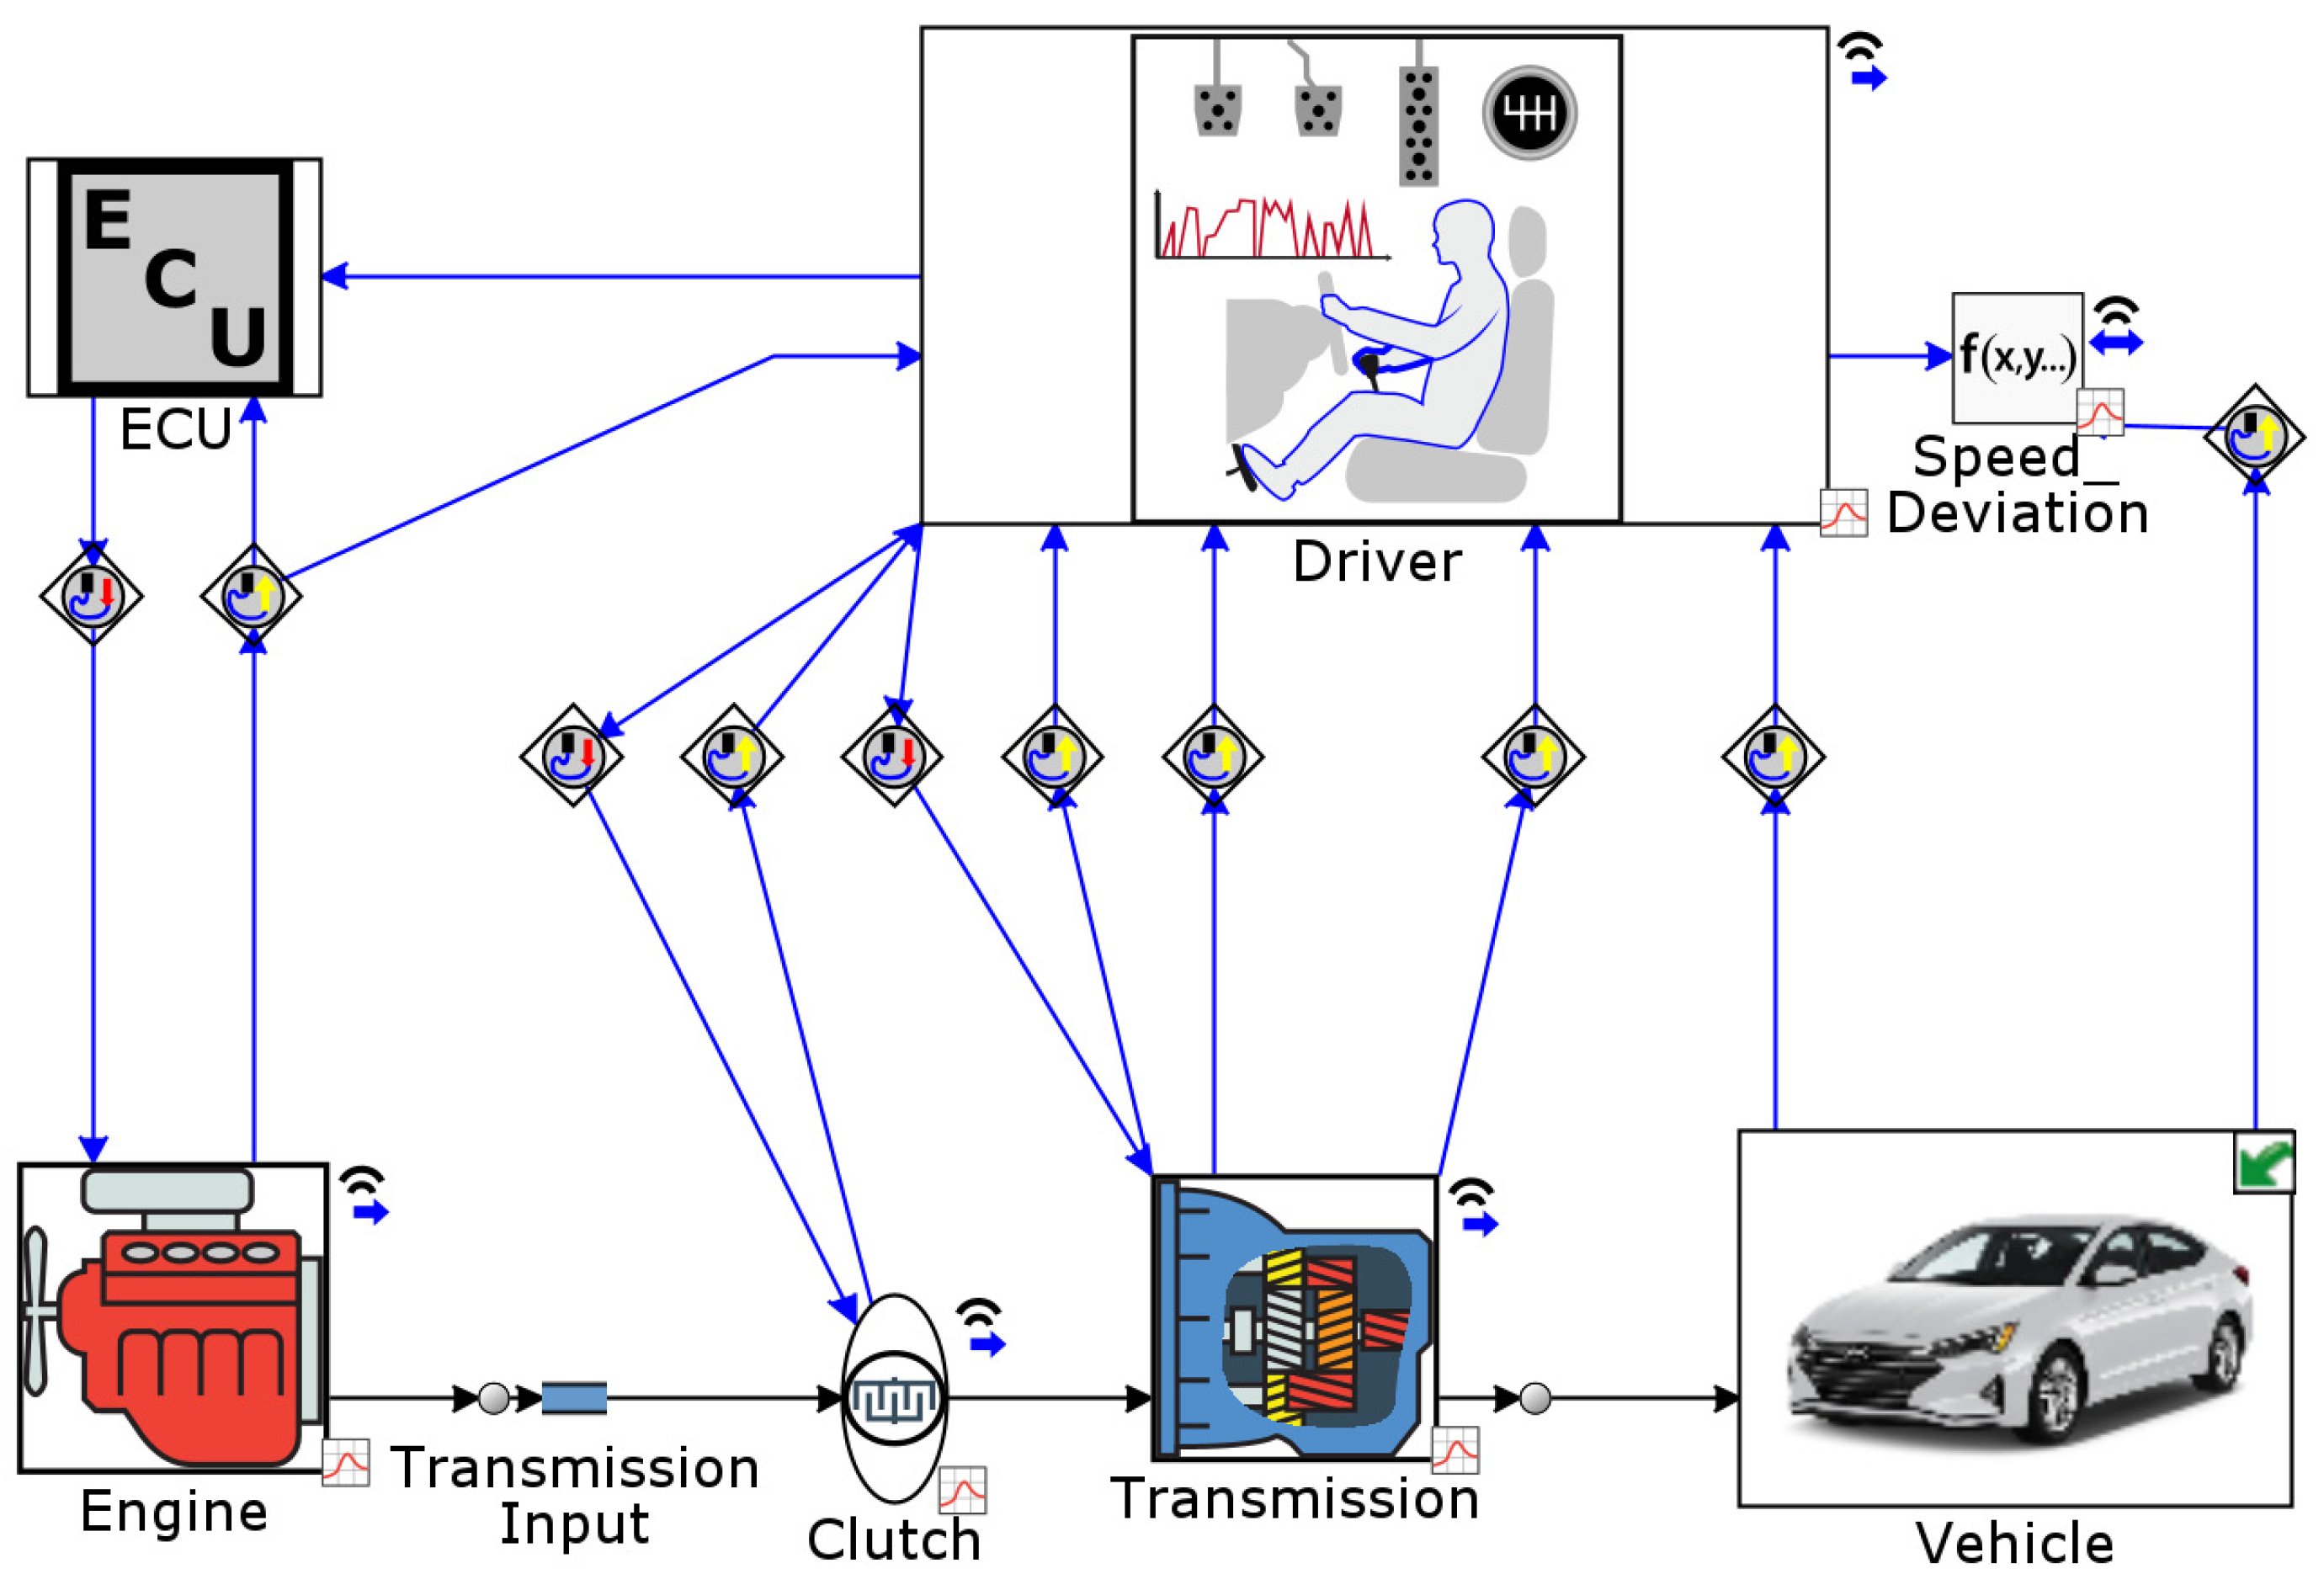
The conventional vehicle model is representative of the 2020 Hyundai Elantra 2.0 L MPI variant, equipped with a six-speed manual transmission [
29]. An overview of the complete vehicle model developed in GT-SUITE is illustrated in
Figure 1. The transmission was modeled using a lumped-parameter approach, which correlates the input and output inertias based on the defined gear ratios. Each gear is represented by a fixed ratio that accounts for frictional and meshing losses within the gearbox. The clutch engagement and disengagement were governed by signals received from the driver sub-model. During gear shifting, the clutch position varied between 0%, indicating full disengagement, and 100%, representing full engagement. The clutch torque was computed using Equation (2) [
28]:
where
is the clutch friction coefficient (0.3),
is the clamping force, and
is the effective clutch contact radius, which is 100 mm in the model. The key vehicle specifications used in this study are summarized in
Table 1.
To assess fuel economy and capture the transient behavior of the vehicle model, the WLTC was employed due to its international regulatory acceptance and greater representation of real-world driving conditions compared to earlier test cycles such as the New European Driving Cycle (NEDC) [
30,
31]. The gear-shifting strategy was implemented following the procedure outlined in the UN Global Technical Regulations No. 15 (GTR 15) [
32]. The inclusion of a prescribed gear-shifting schedule in the WLTC ensures test reproducibility across manufacturers by defining a fixed relationship between gear number and time. Under the Worldwide Harmonized Light Vehicles Test Procedure (WLTP), the shift schedule is pre-calculated based on several vehicle-specific parameters, including test mass, engine rated power, idle speed, and drivetrain configuration (e.g., number of gears and their ratios) [
33]. This standardized approach eliminates the influence of adaptive or dynamic shift strategies that might otherwise be used to improve test results compared to real-world performance. As a result, the WLTP framework provides a globally consistent and repeatable basis for evaluating vehicle fuel economy and emissions under transient operating conditions.
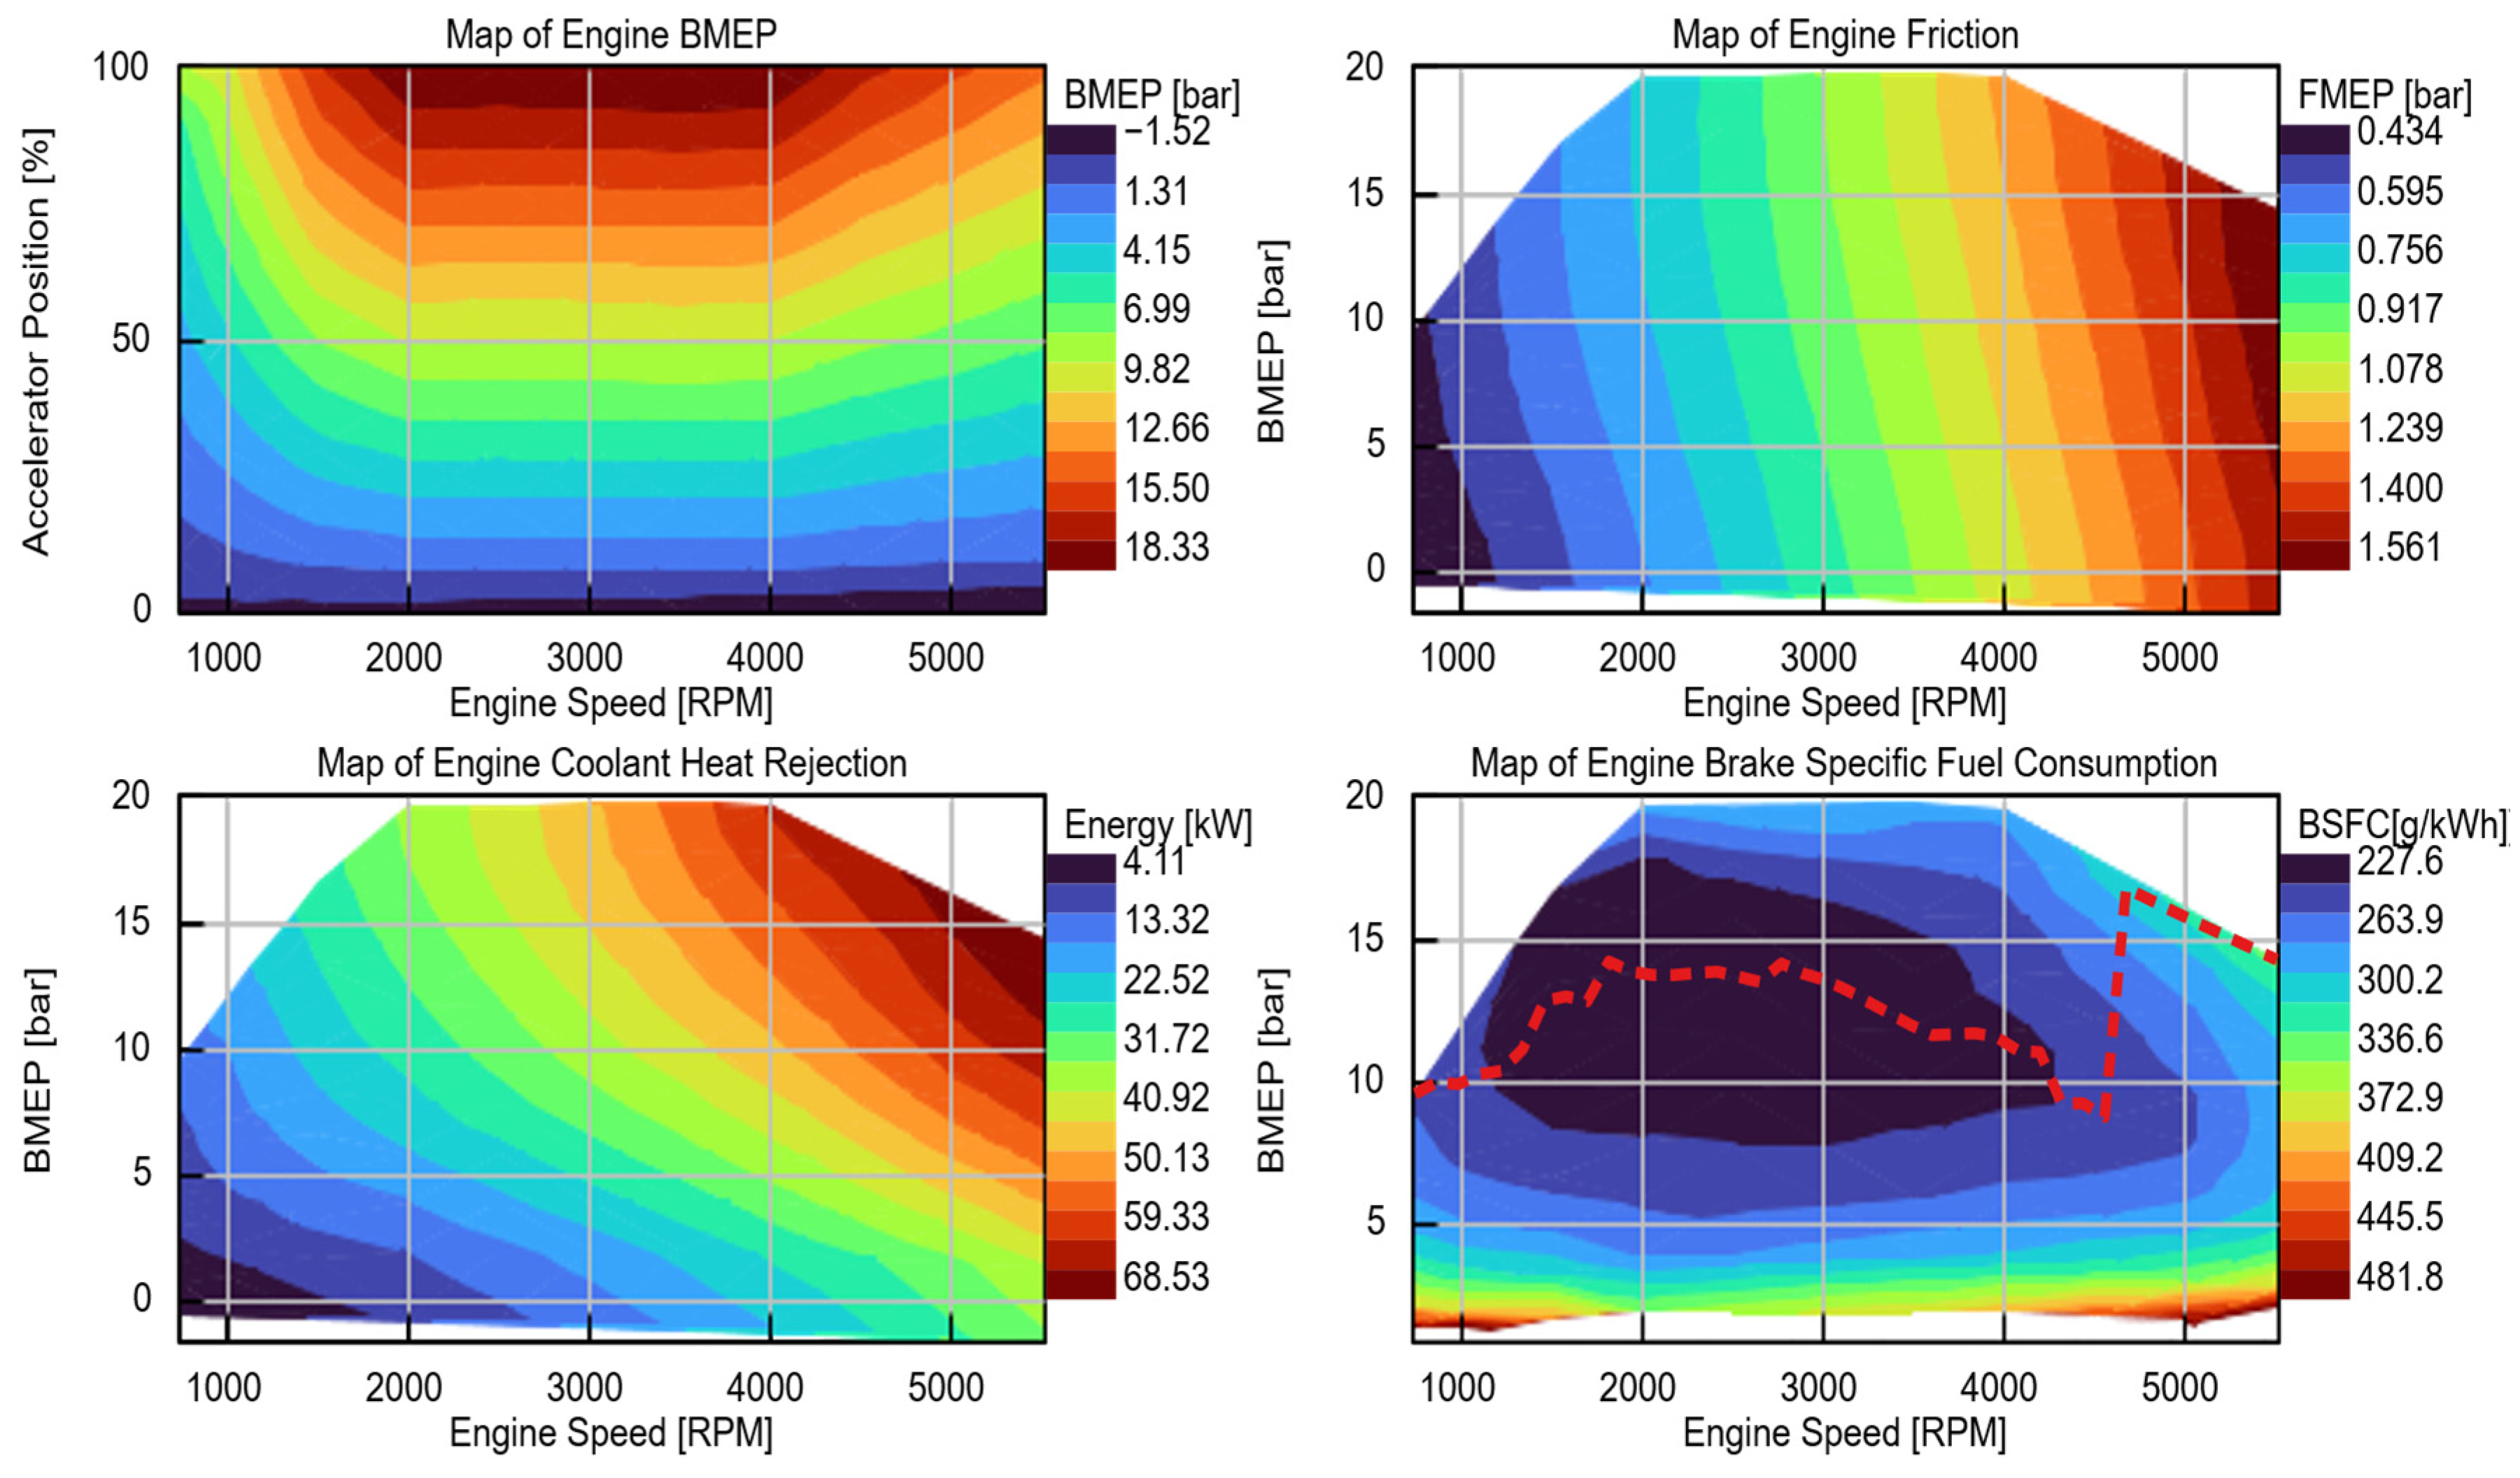
A 2.0-L, four-stroke, turbocharged gasoline engine was integrated into the vehicle model to represent the baseline powertrain configuration. The engine sub-model was developed using GT-SUITE’s map-based approach, leveraging performance maps obtained from the software’s internal database. The engine maps (
Figure 2) encompass Brake Specific Fuel Consumption (BSFC), Brake Mean Effective Pressure (BMEP), Friction Mean Effective Pressure (FMEP), and thermal rejection to coolant, each expressed as functions of engine speed and load.
The main objective of the driver controller was to accurately follow the predefined speed profile of the WLTC driving cycle. It incorporated both feed-forward and feedback mechanisms to calculate the necessary tractive or braking torques using a Proportional Integral (PI) controller, thereby minimizing the error between the target and instantaneous torque values [
28]. The required acceleration or deceleration events were calculated using Equation (3) [
28]:
where
is the target vehicle speed defined by the WLTC cycle and
is the actual vehicle speed and
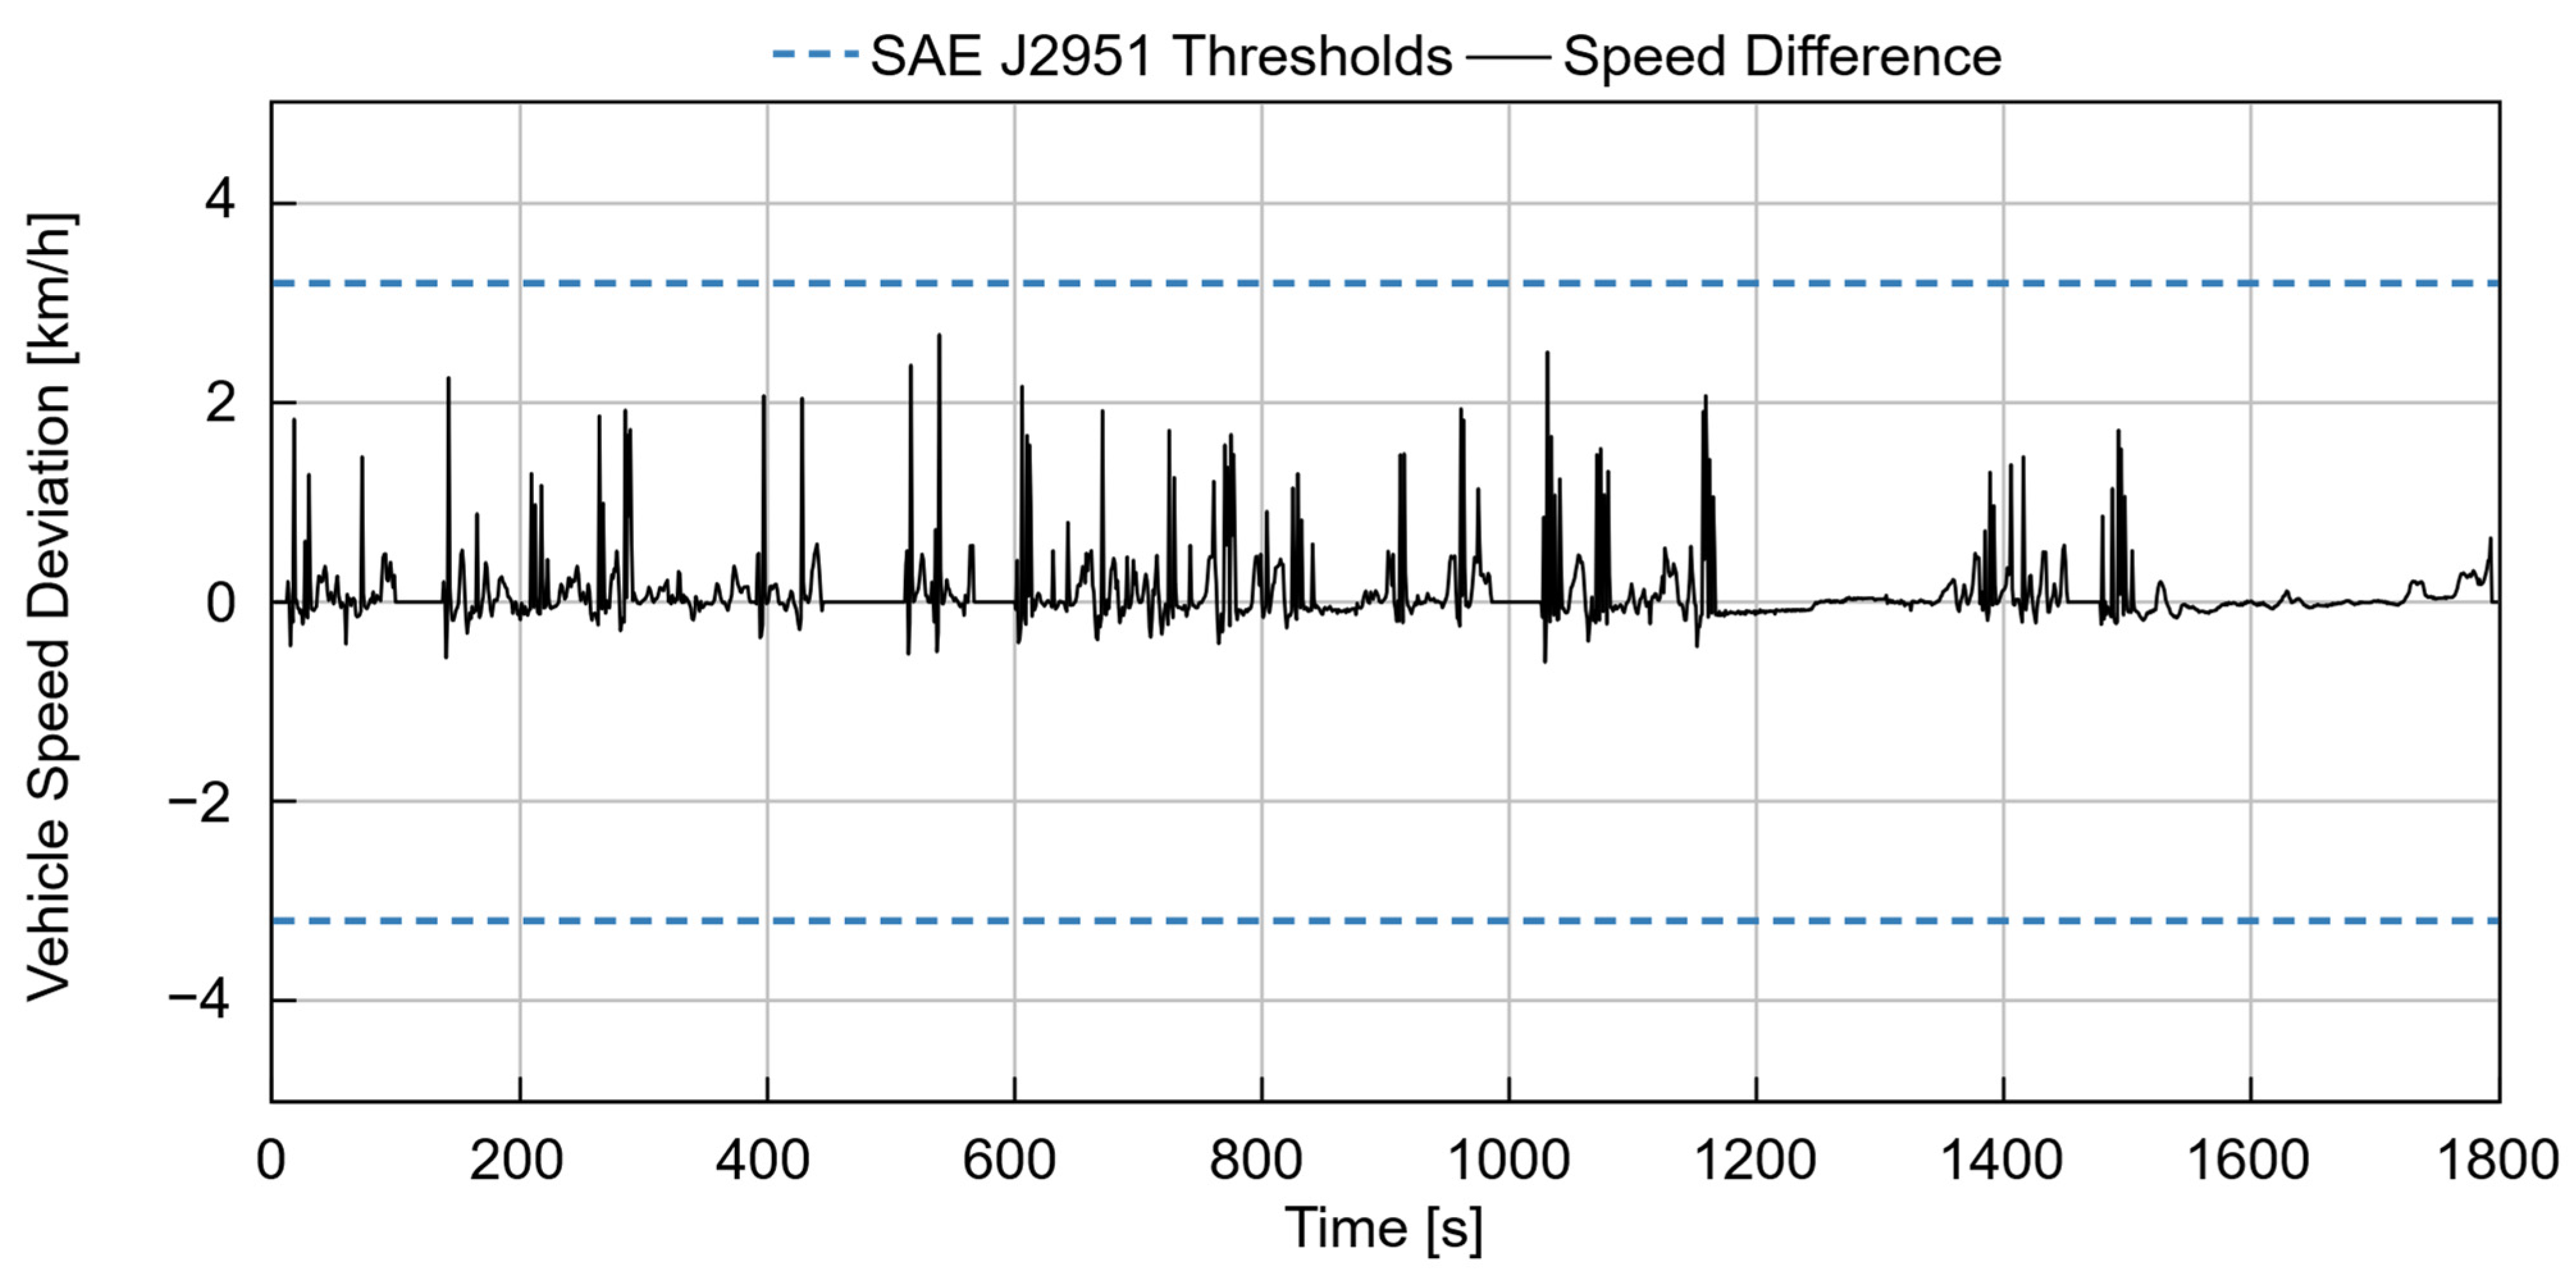
is the predefined aggressiveness factor, set to 5 in the driver controller. To maintain consistency and repeatability, the PI-based driver controller was employed to ensure deterministic vehicle operation during the WLTC simulation. This configuration ensured that the observed variations in fuel economy were solely attributable to gear ratio optimization, independent of stochastic variations in driver behavior. The controller was tuned to follow the target speed profile within the tolerance limits specified by SAE J2951 [
34], confirming that all observed improvements in fuel consumption were attributable solely to the optimized transmission calibration rather than variability in driver input. The Electronic Control Unit (ECU) dynamically managed engine operation based on the accelerator pedal position and idle state. When the engine speed dropped below the specified idle threshold, the ECU adjusted the throttle by selecting a higher value to prevent engine stalling.
In this study, the gear ratio set of the baseline vehicle model was optimized using the BO algorithm implemented within GT-SUITE’s Design Optimizer. BO is a sequential model-based global optimization technique designed for high-fidelity simulations that are computationally expensive and nonlinear. The main objective was to identify the optimal set of gear ratios
that minimizes total fuel consumption
over the WLTC cycle, as shown in Equation (4) [
35]:
where
denotes the bounded design space defined by the lower and upper limits of the six transmission gear ratios. A Gaussian-process (GP) surrogate
was constructed, and its estimated uncertainty
was used to guide the selection of subsequent designs via the Lower Confidence Bound (LCB) acquisition function for minimization, as defined in Equation (5) [
35,
36,
37]:
The exploration–exploitation weight
, known as “Kappa” parameter, was set to
, providing a balanced trade-off between convergence speed and global search robustness [
37]. Each gear ratio was assigned a sweep factor of 0.5, enabling systematic exploration of its influence on vehicle fuel economy across the WLTC cycle. The upper
and lower (
bounds for each gear ratio were determined according to Equation (6):
where
represents the baseline gear ratio defined in the original transmission configuration. This formulation allowed the optimizer to vary each gear ratio by ±50% of its baseline value, maintaining realistic drivetrain dynamics. These bounds were automatically enforced by GT-SUITE during the design-space sampling stage along with a fixed optimization seed (0.94565294) to prevent the generation of non-physical or mechanically incompatible gear ratios.
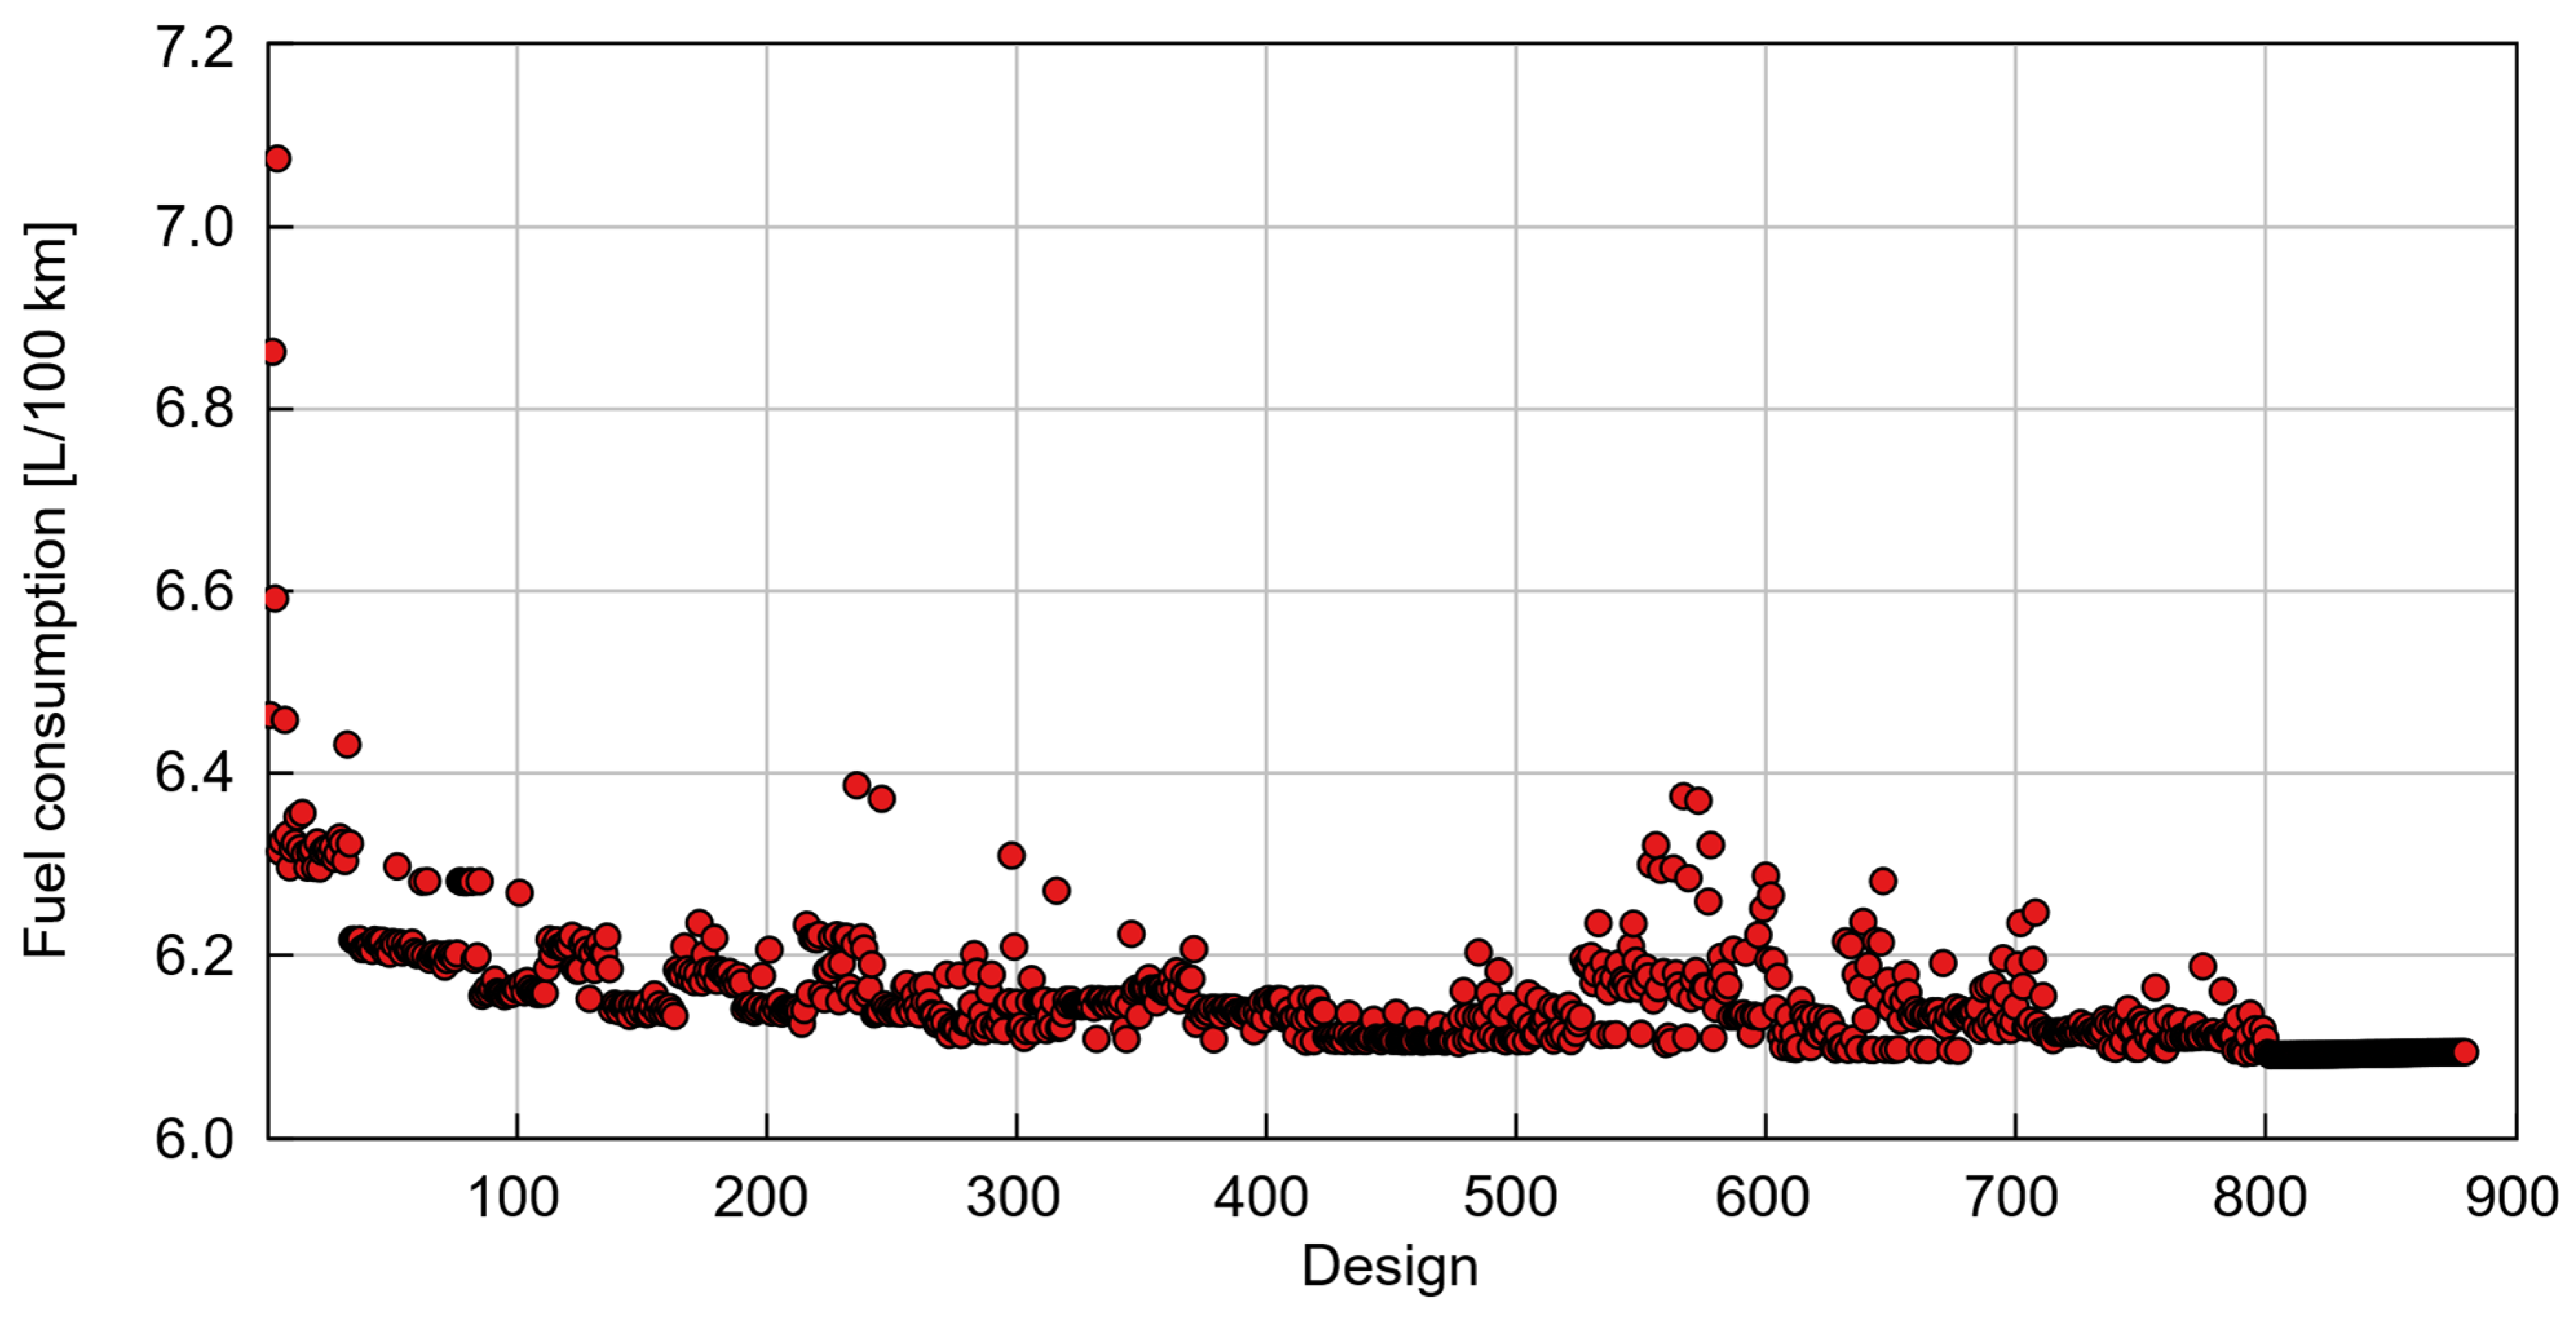
A penalty function was incorporated into the optimization process to ensure compliance with WLTP and SAE J2951 drive-quality criteria. The penalty was activated whenever the simulated vehicle speed deviated from the WLTC target trace by more than ±3.2 km/h for over 1 s or violated drivability constraints. This ensured that all optimized gear sets satisfied WLTP regulatory thresholds while minimizing fuel consumption. The BO was executed without a fixed iteration cap, and convergence was determined from the stabilization of the objective function across successive iterations. As illustrated in
Figure 3, convergence was effectively reached after 800 design evaluations; subsequent iterations yielded negligible improvements, with a standard deviation of 0.0010 and a total variation in fuel consumption below 0.06% indicating that the optimum is numerically stable. In total, 880 design evaluations were completed, each corresponding to a full WLTC transient simulation lasting 7.75 h of wall-clock time on an Intel i7 processor.
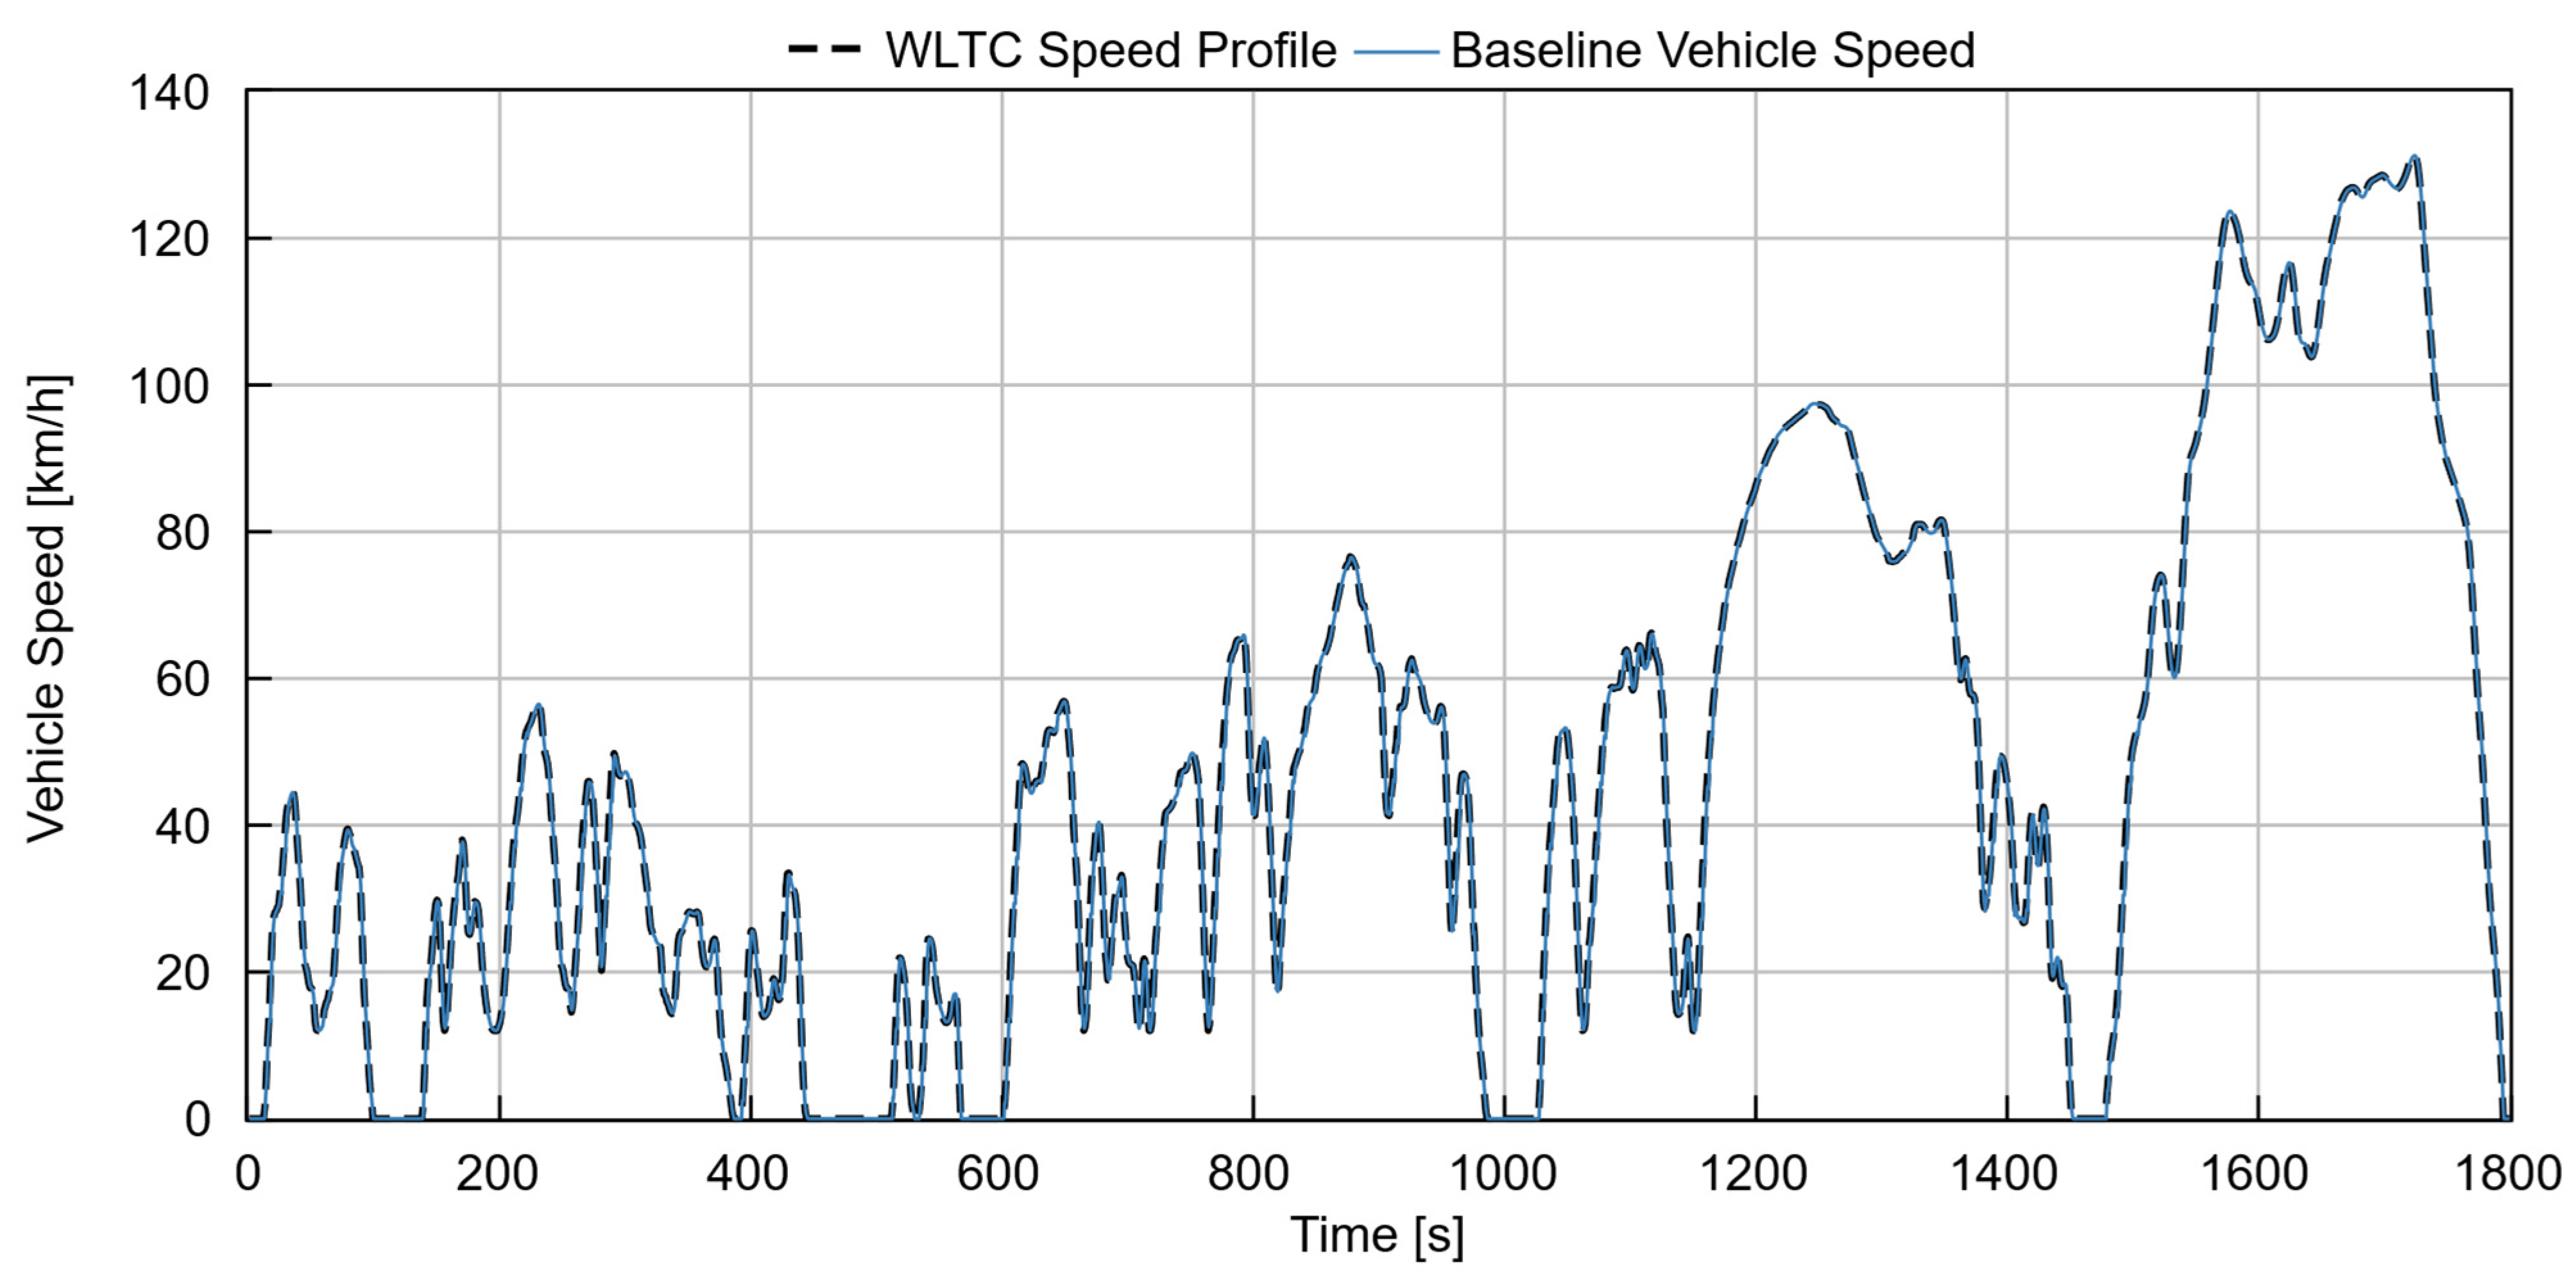
The vehicle performance simulation results of the baseline and the optimized model were validated against the target driving cycle speed profile. The main objective of this validation step was to ensure that the driver vehicle sub-model and the vehicle dynamics accurately followed the prescribed WLTC speed trace. As shown in
Figure 4, the actual vehicle speed closely matches the target WLTC speed profile throughout all driving phases, including low, medium, high, and extra high-speed segments.
To further ensure the reliability of the baseline vehicle model, the tracking performance of the driver sub-model was quantitatively evaluated in accordance with the SAE J2951 standard for drive-quality assessment [
37]. This standard specifies tolerance limits for the deviation between the target and actual vehicle speed traces. According to SAE J2951, the vehicle speed must remain within ±2 mph (±3.2 km/h) of the target trace within ±1 s at all times during the cycle [
37], If the vehicle speed remains within the thresholds, the drive quality is considered compliant. As shown in
Figure 5, the speed deviation curve of the baseline model remained consistently within the prescribed SAE J2951 tolerance band across all WLTC phases. This confirms the robust tracking capability of the driver model and validates the accuracy and reliability of the overall simulation for subsequent fuel-economy and performance analyses.
3. Results and Discussion
The fuel consumption breakdown for the baseline model across the WLTC phases is summarized in
Table 2. The driving cycle is categorized into four operational modes: acceleration, deceleration, cruising, and stationary idling. The results indicate that the vehicle spent 40.8% and 43.1% of total cycle time in acceleration and deceleration phases, respectively. Fuel consumption, however, was highly concentrated in the acceleration phase, accounting for 68.9% of the total fuel used. The deceleration phase contributed 23.9%, while cruising and stationary idling accounted for 3.3% and 3.9%, respectively. This indicates that transient driving conditions, mostly acceleration, dominate overall fuel usage in WLTC cycles, emphasizing the importance of optimizing transmission ratios to minimize unnecessary torque fluctuations and improve energy conversion efficiency.
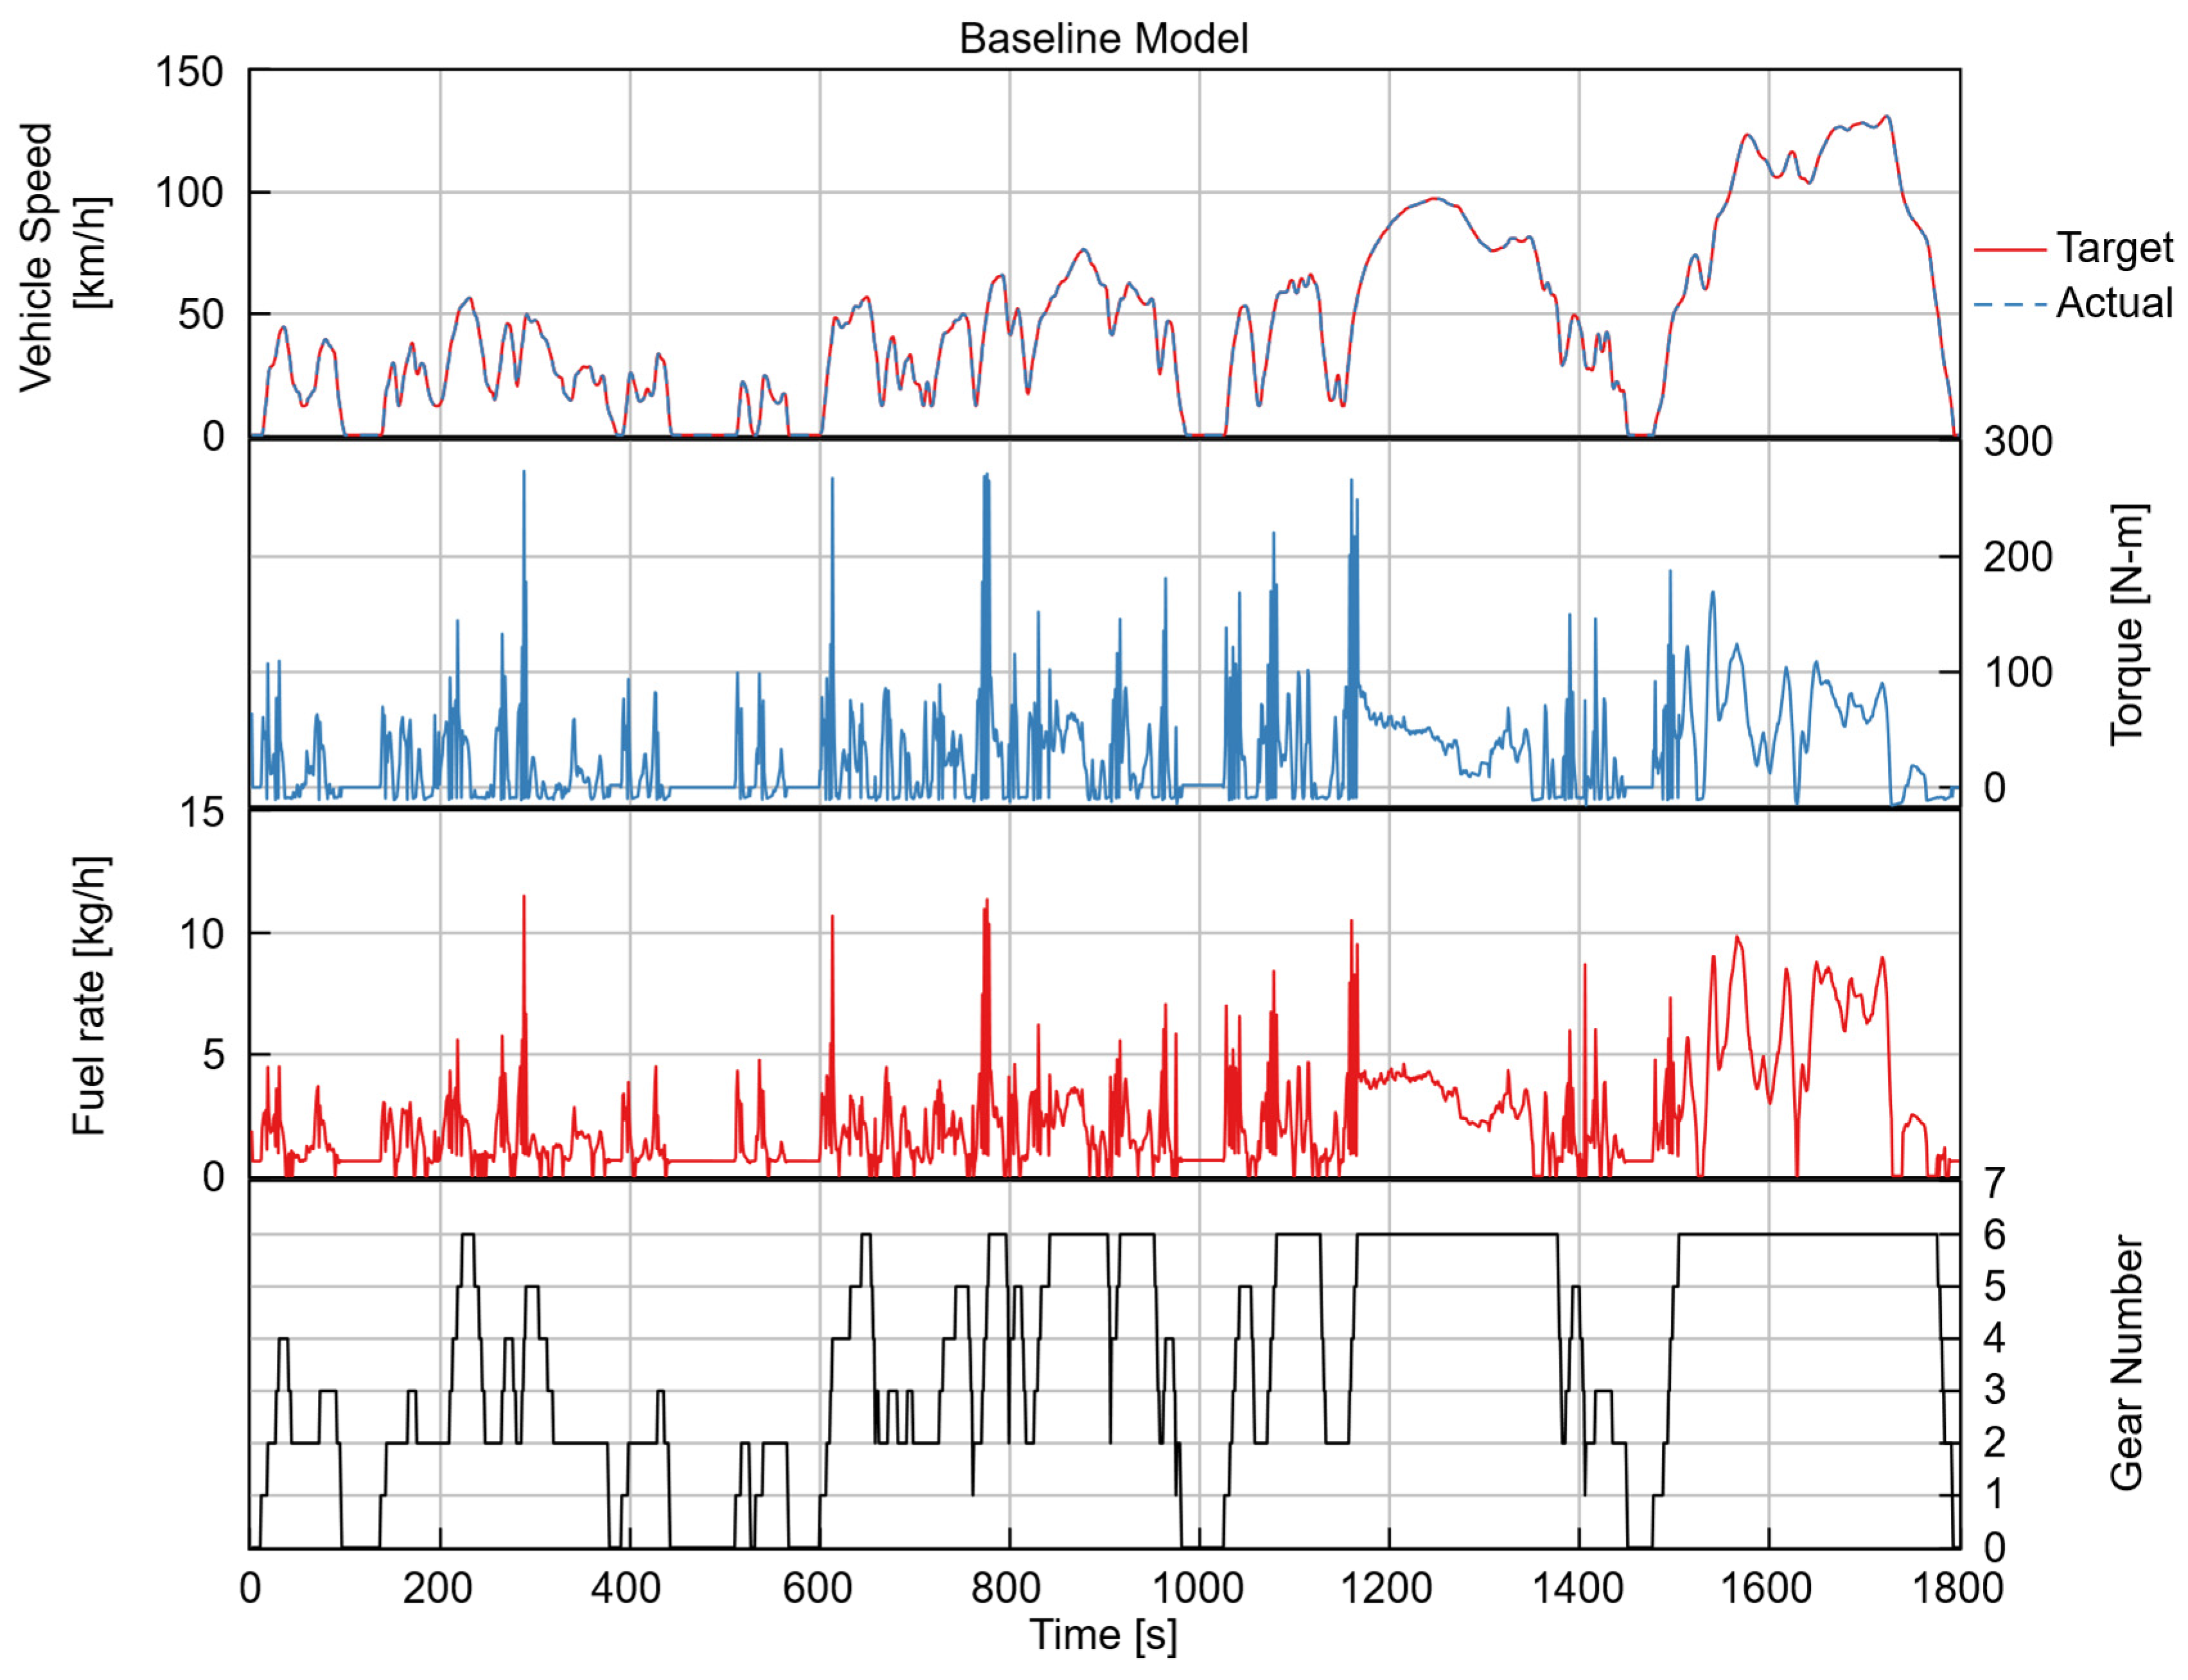
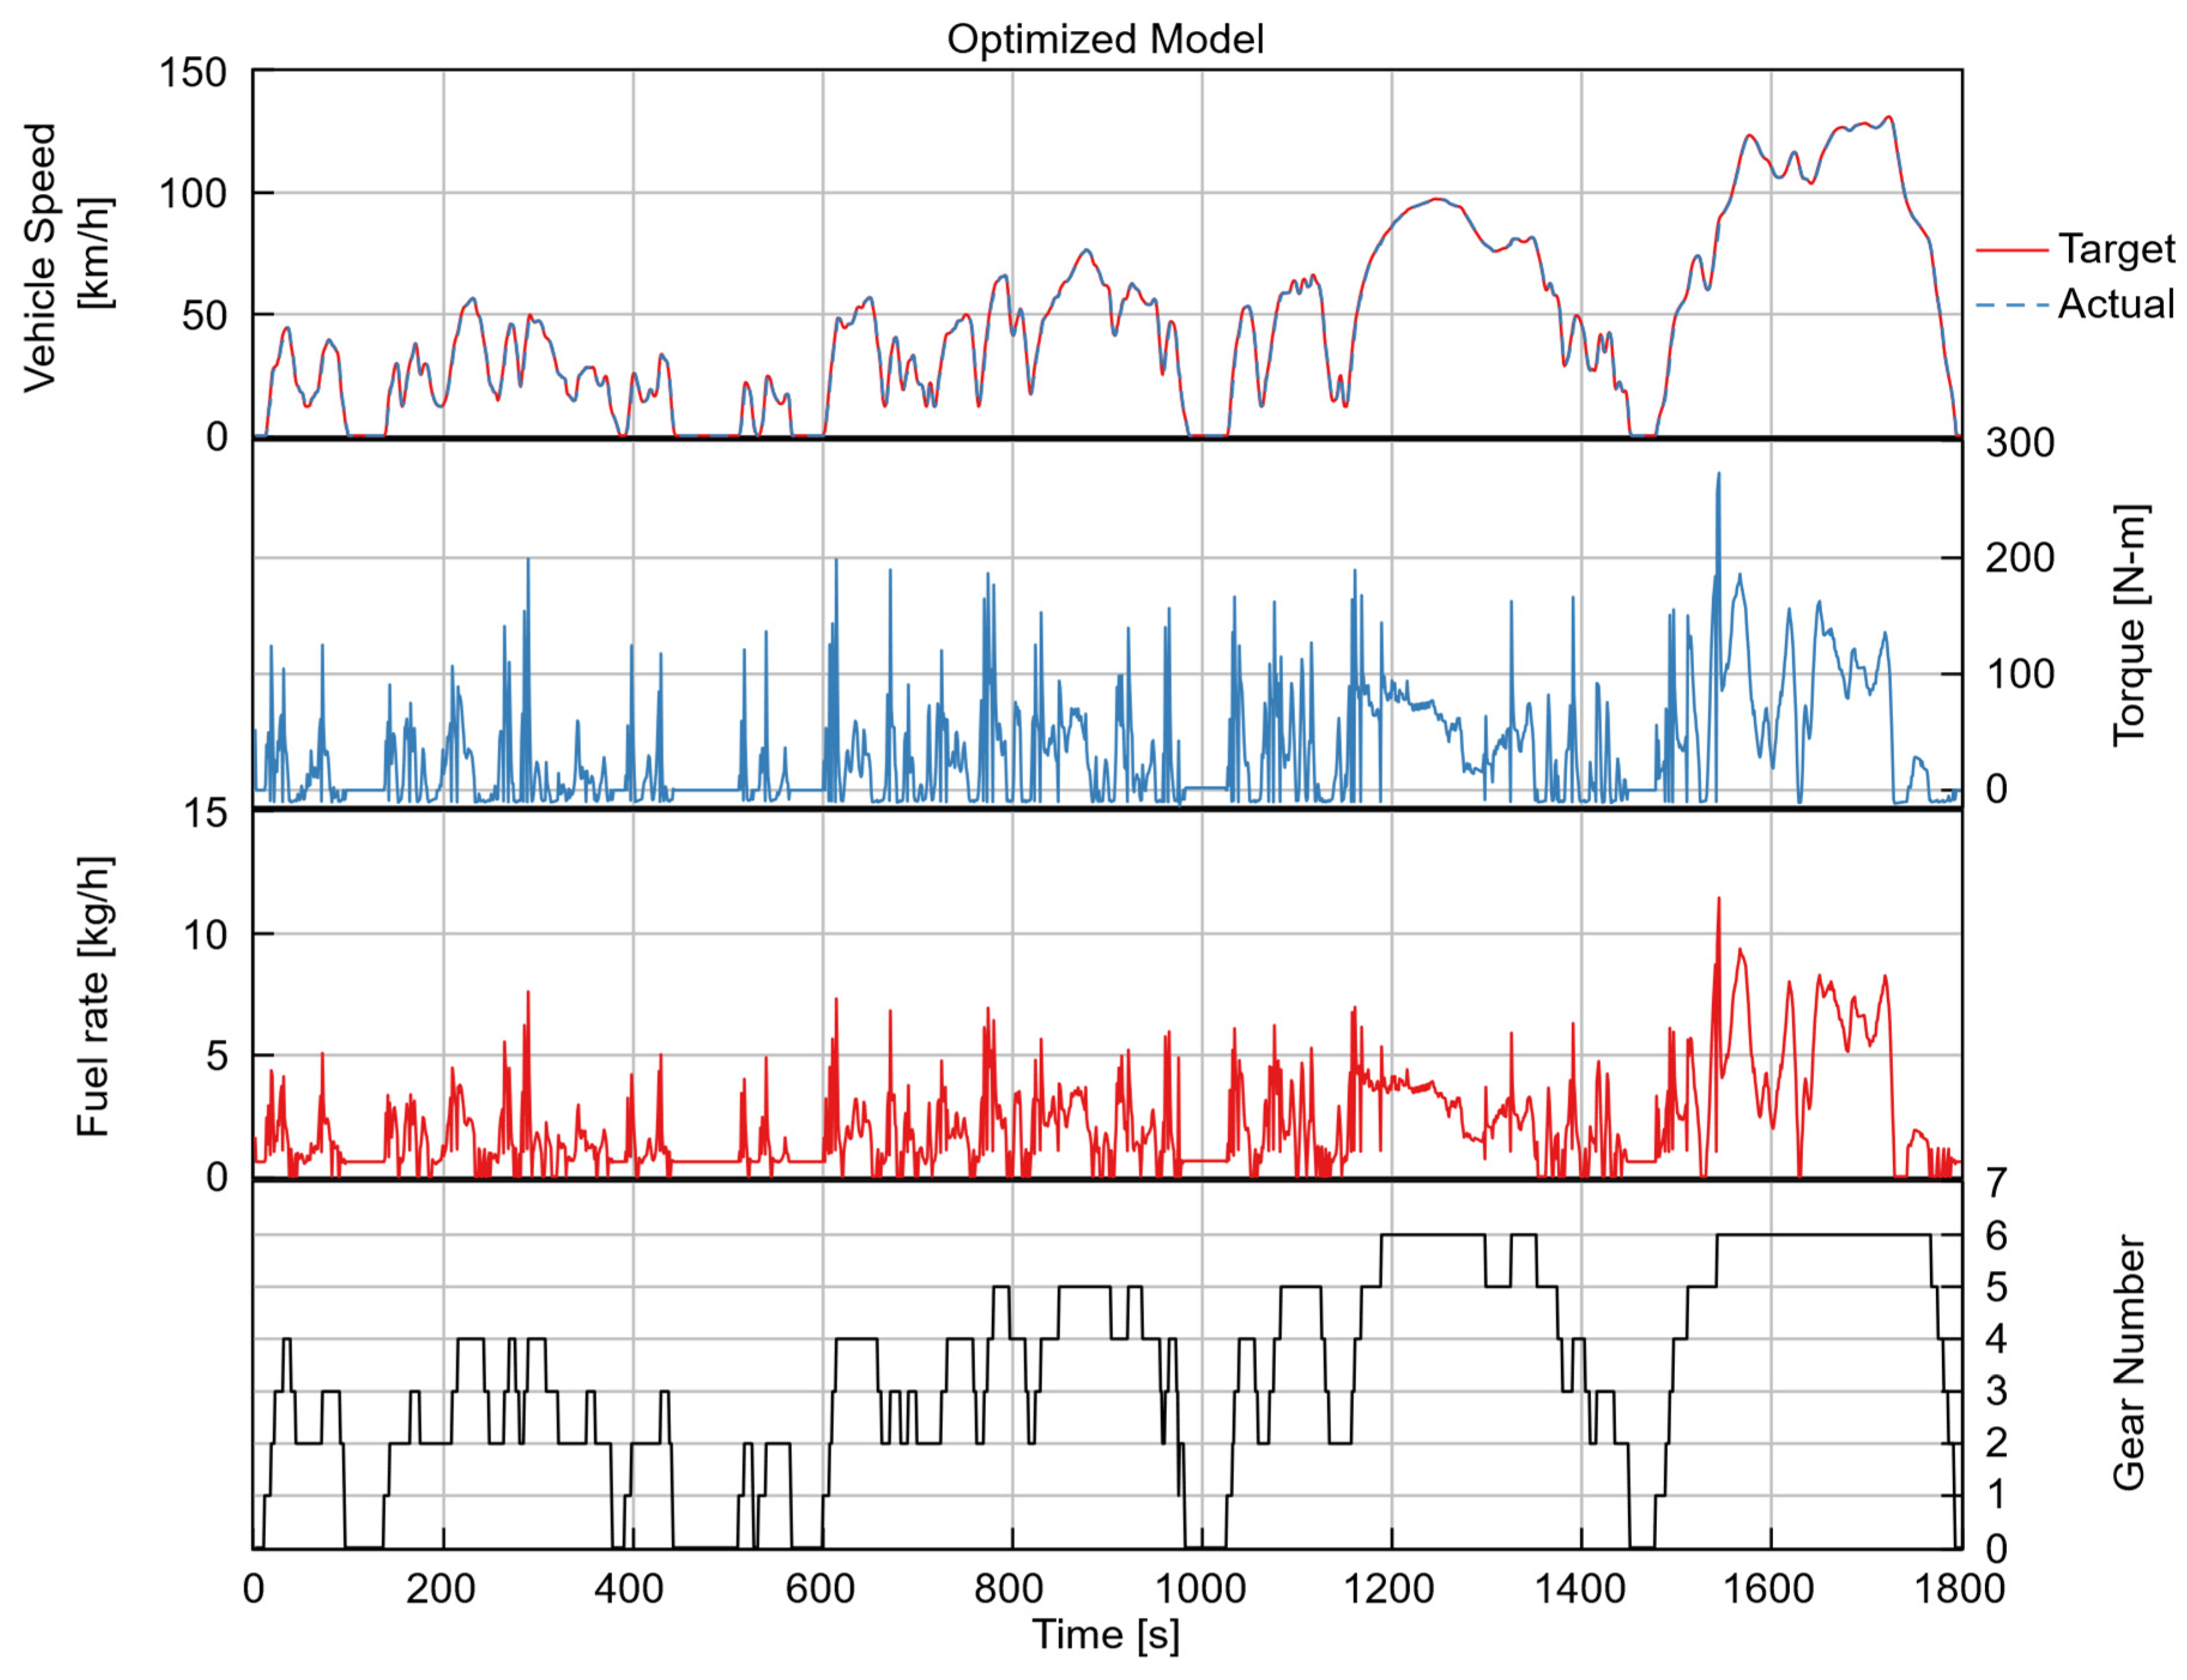
The main objective of the baseline simulation was to establish a benchmark for both vehicle performance and fuel consumption. Illustrated in
Figure 6 and
Figure 7 are the performance comparisons of the baseline and optimized vehicle models. Both configurations accurately followed the target WLTC speed profile, confirming that drivability and cycle compliance were not compromised by the optimization process. The engine torque response of the baseline model exhibited higher fluctuations, particularly during transient and high-torque-demand phases, indicating less efficient torque management and frequent operation at peak load conditions. The optimized model displayed a smoother torque with fewer extreme peaks in comparison to the baseline, particularly in the mid-to-high-speed ranges. This suggests that the optimized gear ratios enabled the engine to operate closer to the efficient regions and reduce torque oscillations. The fuel flow rate curve of the baseline model displayed sharper spikes compared with that of the optimized model, reflecting suboptimal fuel-demand control. In terms of the gear-shifting pattern, the baseline model exhibited more frequent gear changes with relatively shorter dwell times in each gear, demonstrating less efficient utilization of the transmission range. In contrast, the optimized model demonstrated smoother gear transitions and longer dwell times in higher gears. This adjustment allowed the engine to operate at lower rotational speeds while still delivering adequate torque, thus improving overall fuel economy. Additionally, the optimized gear ratios eliminated unnecessary downshifts and promoted a more stable operation near the minimum BSFC region. This resulted in enhanced thermal efficiency and reduced transient load variations, confirming the positive impact of optimized transmission gear ratios calibration on fuel-saving performance.
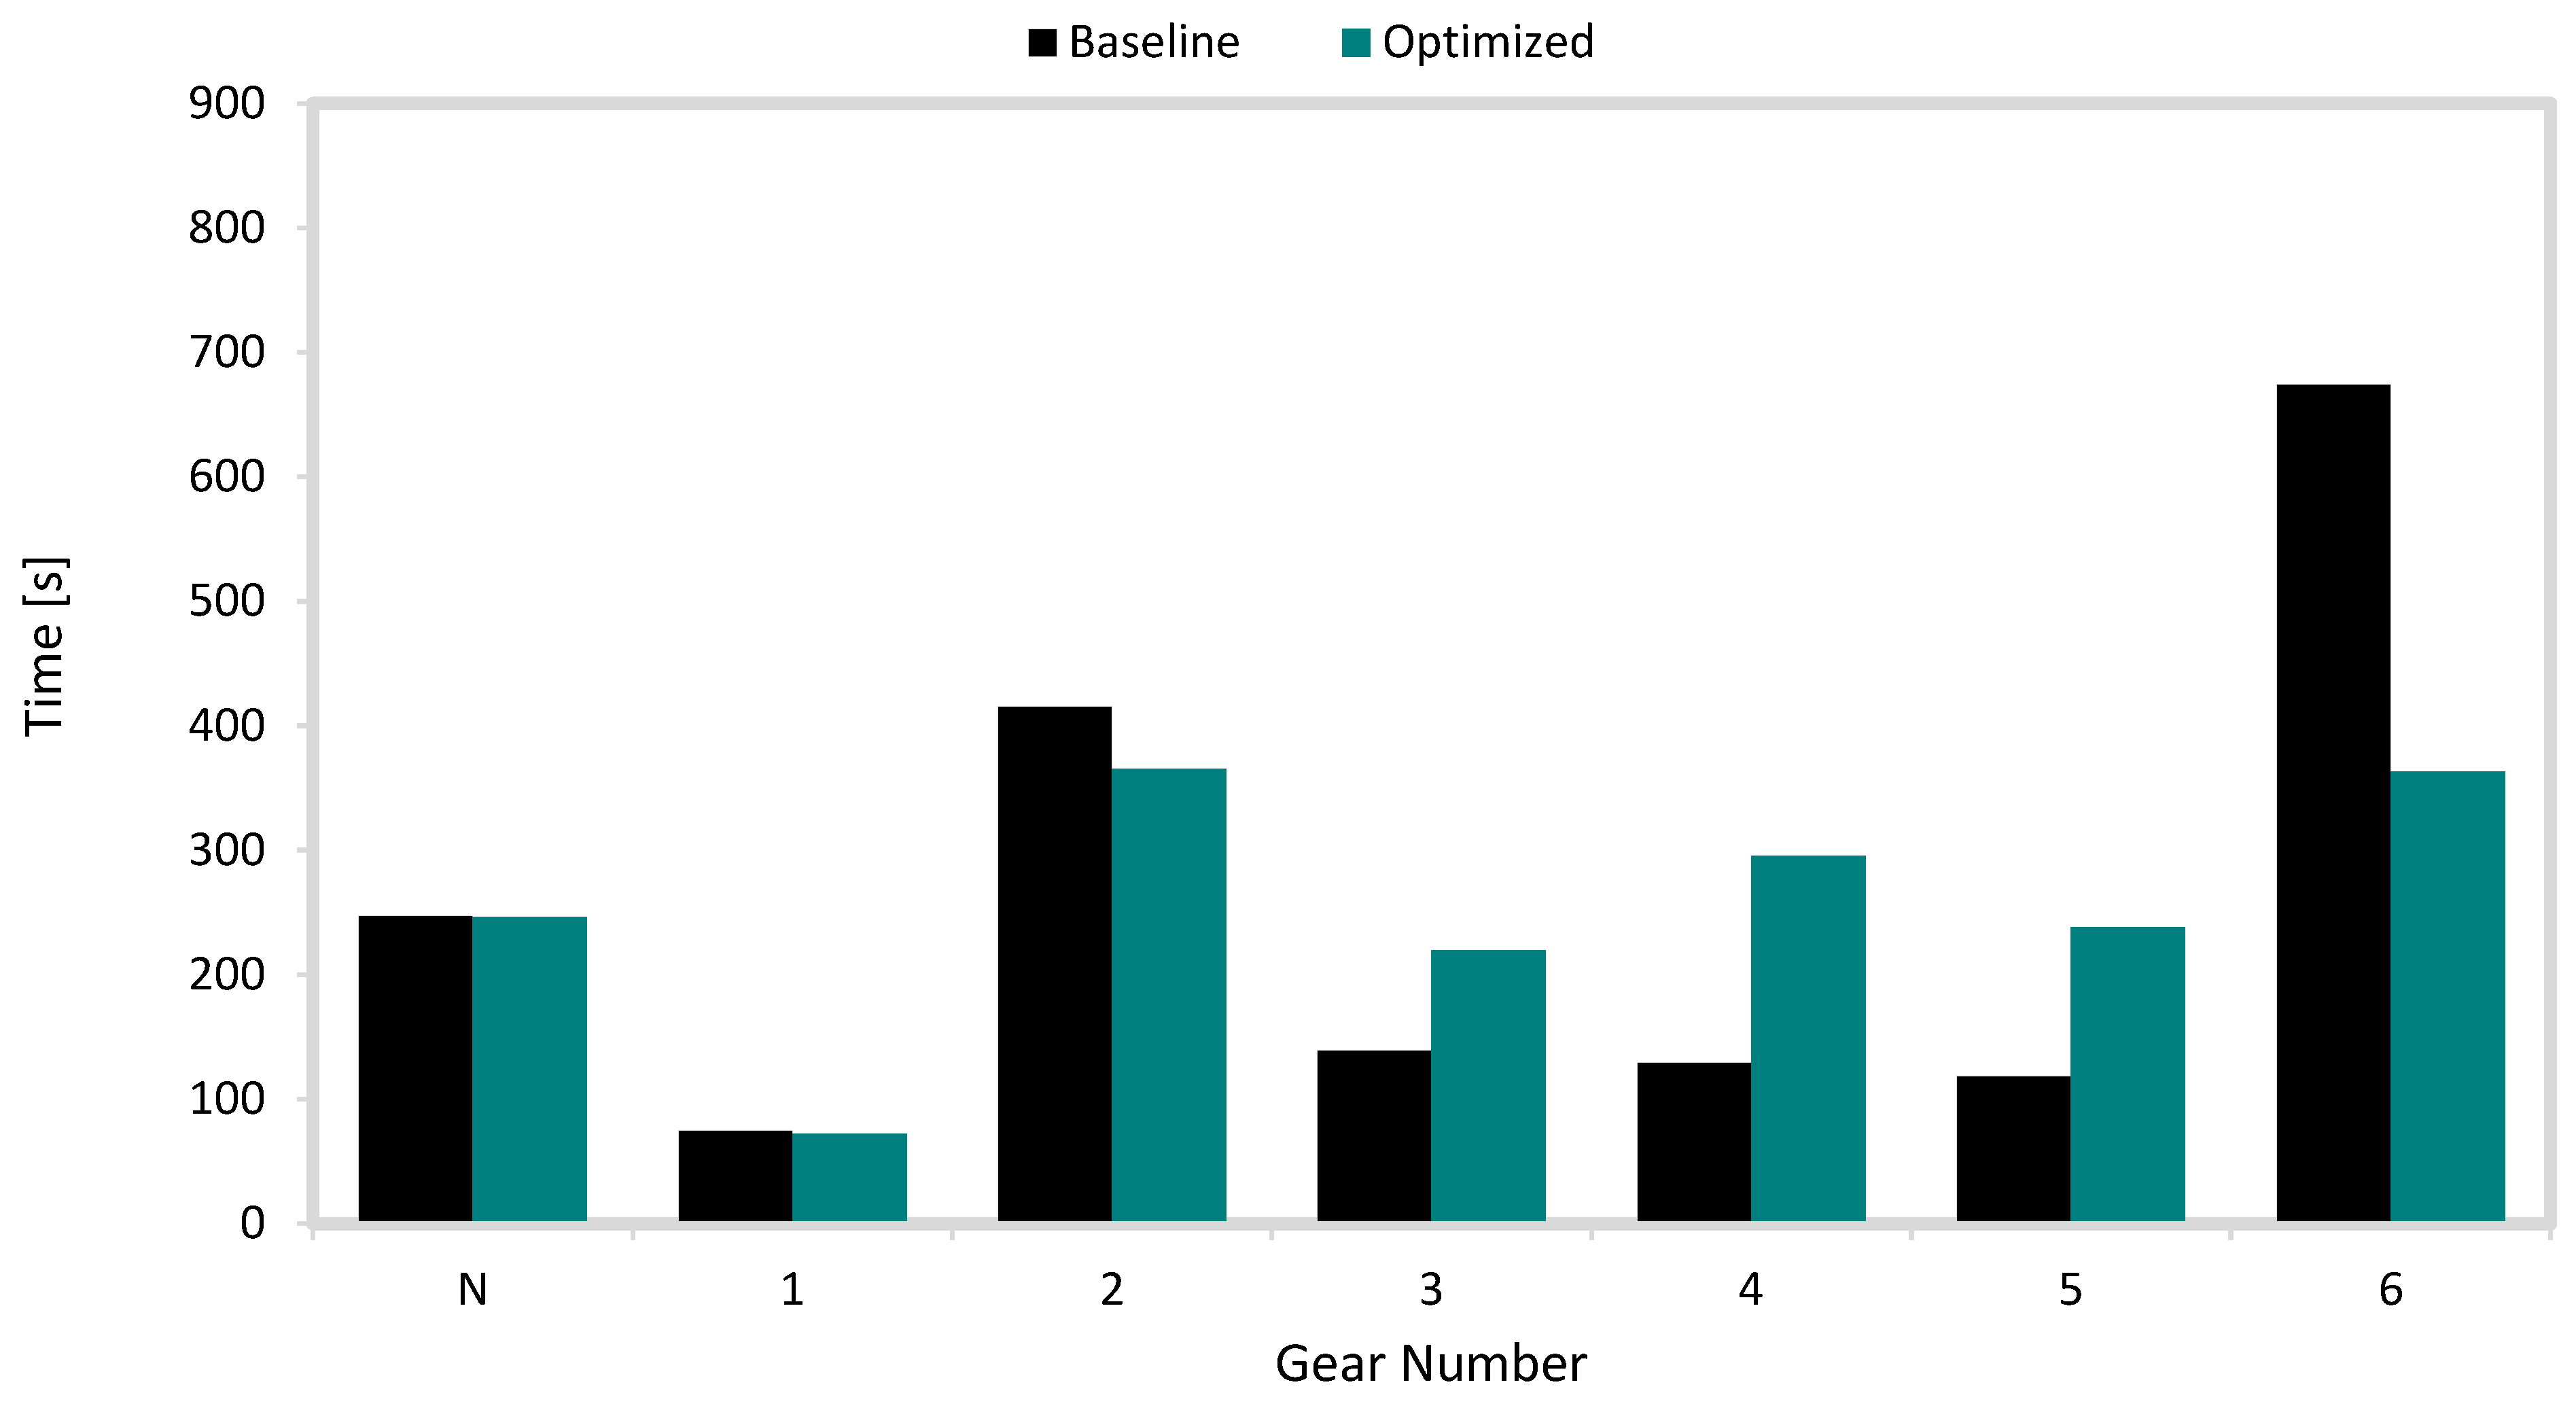
The time spent in each gear for the baseline and optimized vehicle models is depicted in
Figure 8. The results reveal that the optimized configuration significantly altered the gear utilization to improve overall drivetrain efficiency. The redistribution of gear utilization in the baseline and optimized vehicle models was a direct outcome of the modified gear ratios, which necessitated a recalculation of the gear-shifting schedule in accordance with UN GTR 15 regulations. Under this standard, any change in gear ratio configuration requires a re-determination of the shift points to preserve compliance with the predefined procedure based on vehicle mass, rated power, and drivetrain configuration. No enhancements or modifications to the shifting logic were introduced in the present study; instead, the observed differences emerged from the recalculated shift schedule generated by GT-SUITE’s automated shift strategy for WLTP.
In the baseline case, the vehicle spent most of the cycle time in 2nd and 6th gears, accounting for 416 s and 674 s, respectively, suggesting limited mid-gear utilization and a tendency to operate outside the engine’s high efficiency BSFC region. In contrast, the optimized vehicle model exhibited a more balanced distribution, with a noticeable increase in the time spent in 3rd, 4th, and 5th gears, reflecting smoother progression and improved load adaptation. The time in 6th gear decreased significantly to 363 s, indicating better matching of final drive and aerodynamic resistance under cruising conditions. This adjustment allowed the engine to maintain moderate speeds and reduced transient shifting frequency, leading to enhanced fuel efficiency. Neutral and idle durations remained unchanged, confirming that the observed fuel economy improvements were driven by optimized gear ratios rather than changes in idling or coasting behavior.
3.1. BO Optimization Process and Convergence
Illustrated in
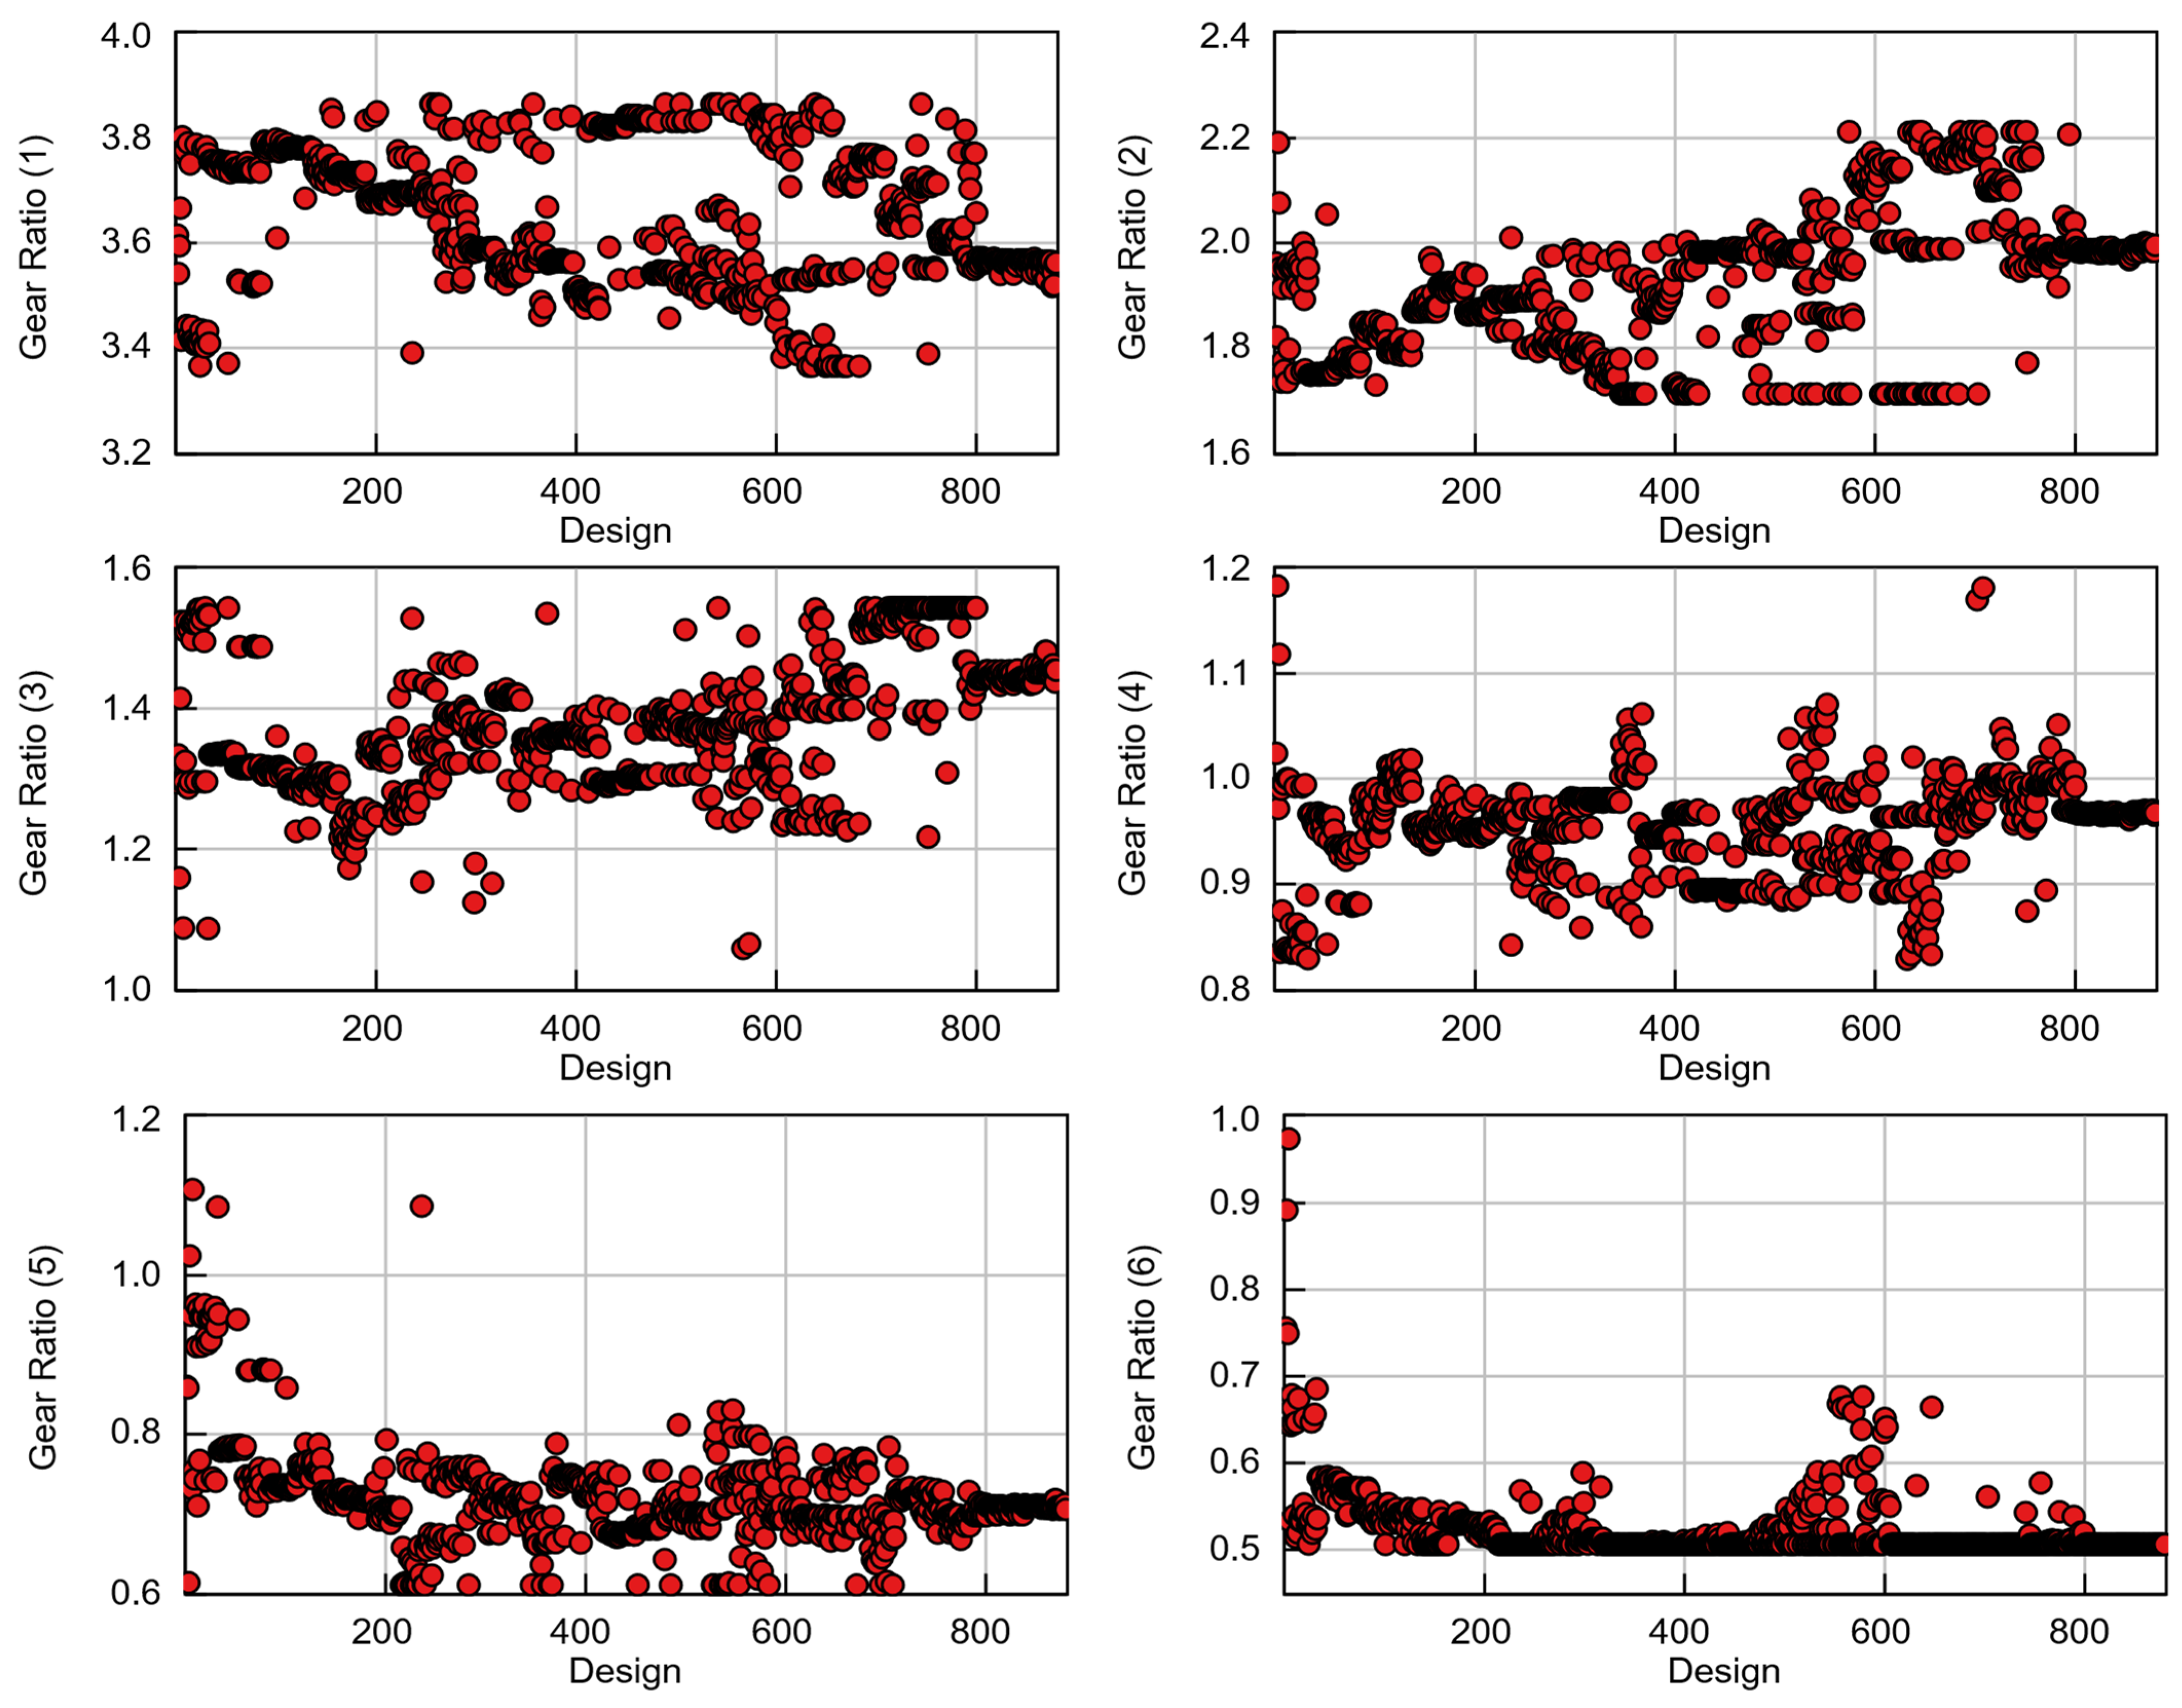
Figure 9 are the scatter distributions of the individual gear ratios (1st through 6th) plotted against the number of design evaluations. In the early stage, the scatter is wide for most gears, reflecting active exploration by the acquisition function. During the middle stage, clustering emerges as the surrogate model identifies regions yielding lower fuel consumption. After 800 designs, all gear ratios formed tight, nearly horizontal bands indicating convergence; beyond this point, additional evaluations produce negligible improvement relative to computational cost. The 1st gear exhibits a relatively narrow range throughout, with modest late converging to 3.5–3.6, suggesting limited influence on cycle fuel economy. Similarly, the 2nd gear stabilizes around 1.8–2.0, supporting smoother torque handover from the launch phase to low-speed cruising. The mid-range gears (3rd and 4th) show broader dispersion through approximately the first 300 iterations and then contract, reflecting a balance between urban WLTC transients and BSFC access. The 3rd gear fluctuates between 1.2–1.5 before stabilizing near 1.45, while the 4th converges within 0.90–1.00. The 5th gear gradually decreases from 0.90 to approximately 0.75, and the 6th converges sharply from 0.70 to 0.50 after about 600 iterations. The consistent downward trend in these upper gears indicates that the optimizer facilitates configurations that reduce engine speed (RPM) during cruising and extra-high-speed operation, thus minimizing pumping and frictional losses. The dense clustering of solutions near the end of the optimization demonstrates a high level of confidence in the global optimum identified by the BO framework.
3.2. Comparison Between Baseline and Optimized Gear Ratios
The baseline and optimized transmission gear ratios from the BO process are compared in
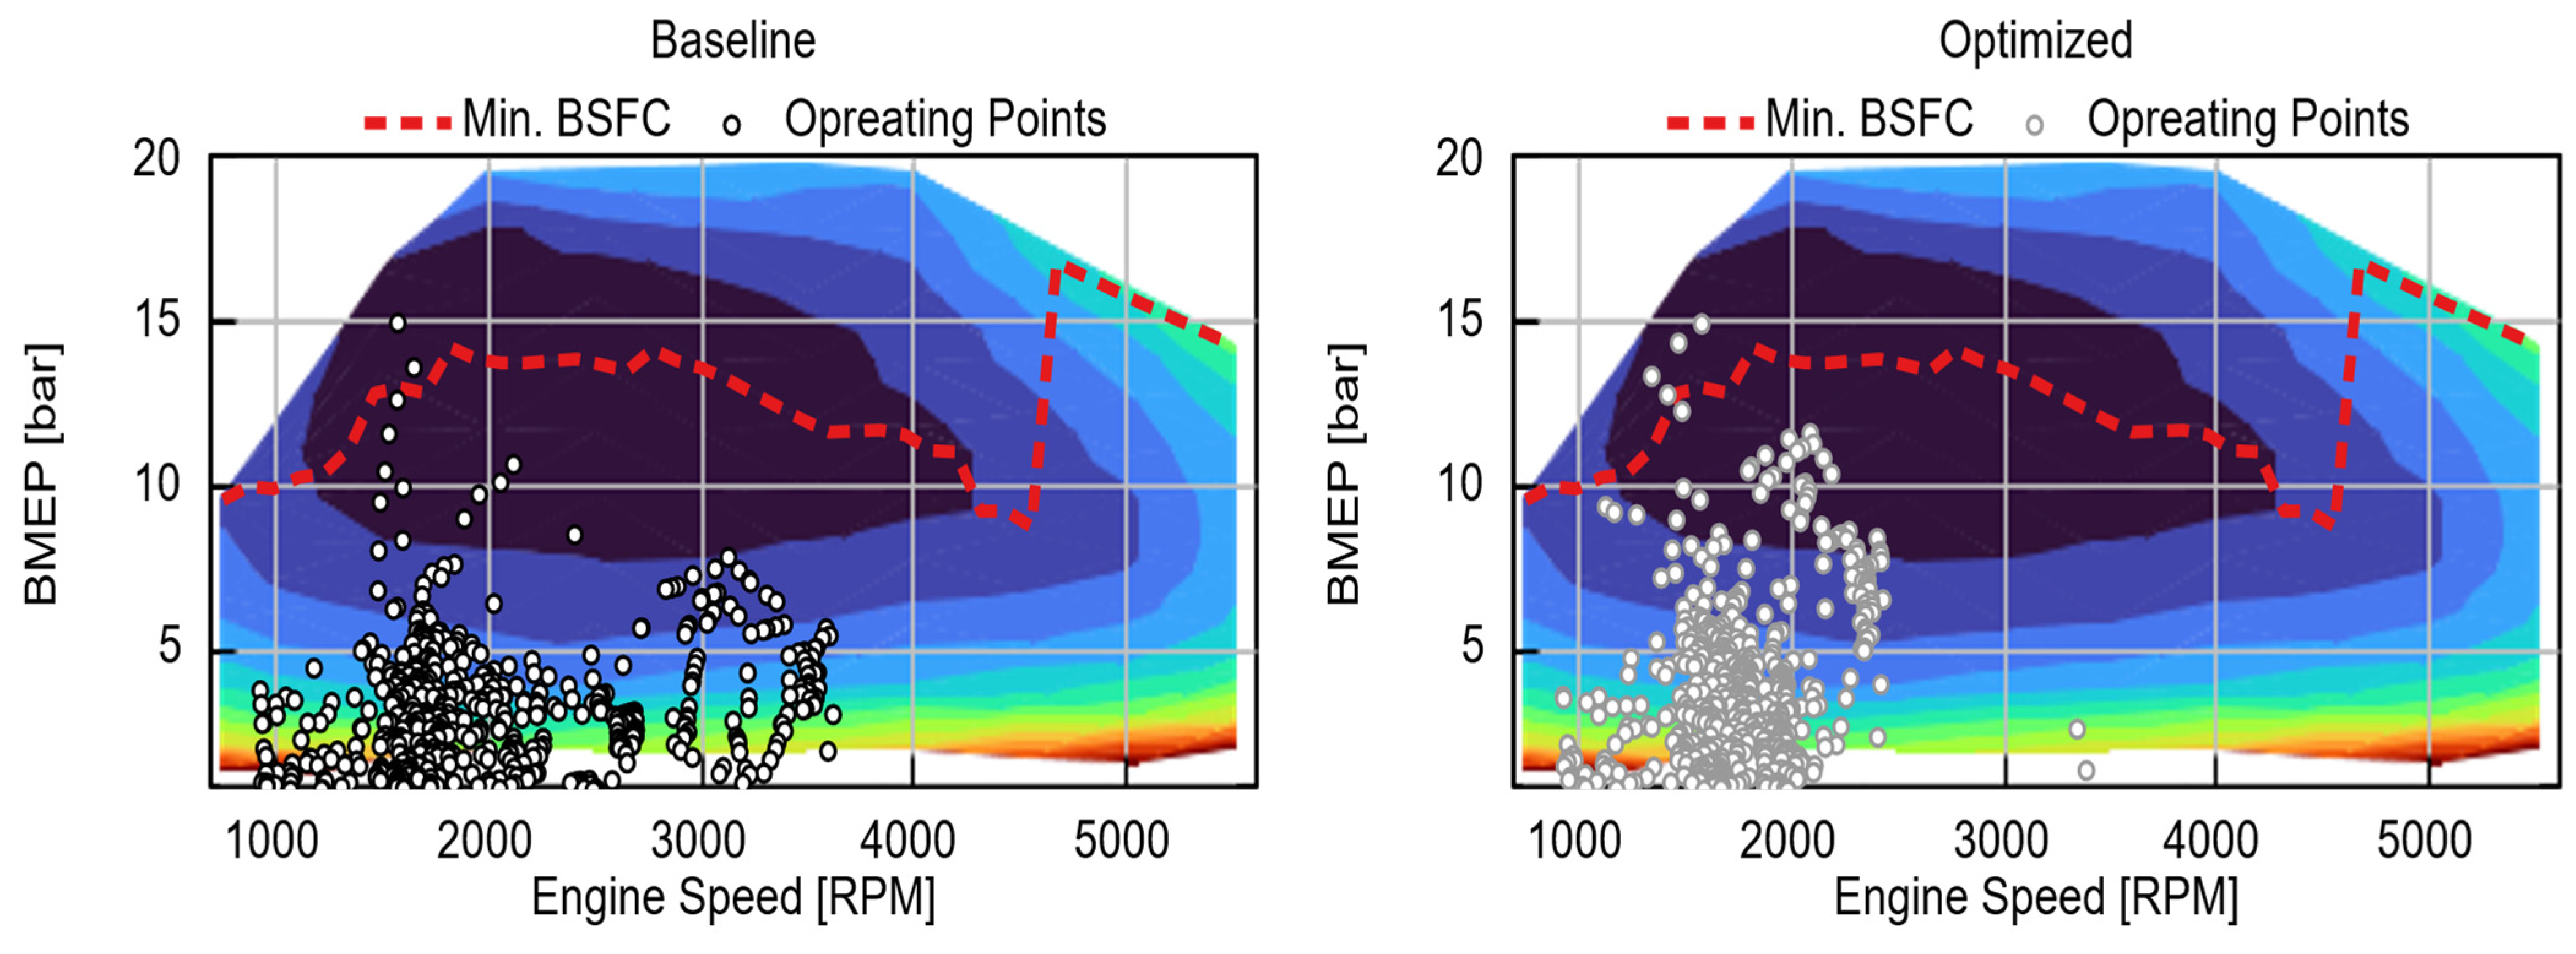
Table 3. The results demonstrate a clear trend: 1st gear decreased slightly (−1.7%), 2nd gear increased slightly (+1.5%), and 3rd gear increased moderately (+10.8%), while the upper gears were reduced: 4th −5.3%, 5th −18.9%, and 6th −33.1%. The small adjustments in 1st and 2nd preserve launch and low-speed drivability, whereas the increase in 3rd supports smoother mid-range acceleration and more efficient torque delivery in urban conditions. By contrast, the substantial reductions in 5th and 6th, and the moderate reduction in 4th reflect the optimizer’s emphasis on lowering engine speed during cruising and extra-high-speed phases of the WLTC. These changes shift engine operating points toward lower BSFC regions, improving steady-state efficiency without compromising drivability or performance. This outcome is validated in
Figure 10, which presents the BSFC maps for the baseline and optimized cases together with the corresponding WLTC operating points. In the baseline, points are distributed between 1000 and 3750 RPM, largely below 10 bar BMEP and frequently lie outside the optimal BSFC regions, indicating suboptimal operation and higher fuel use. In the optimized case, operating points cluster more tightly within 1000–2500 RPM at approximately 6–10 bar BMEP, with a larger fraction falling near or along the minimum BSFC region.
3.3. Sensitivity Analysis of Gear Ratios
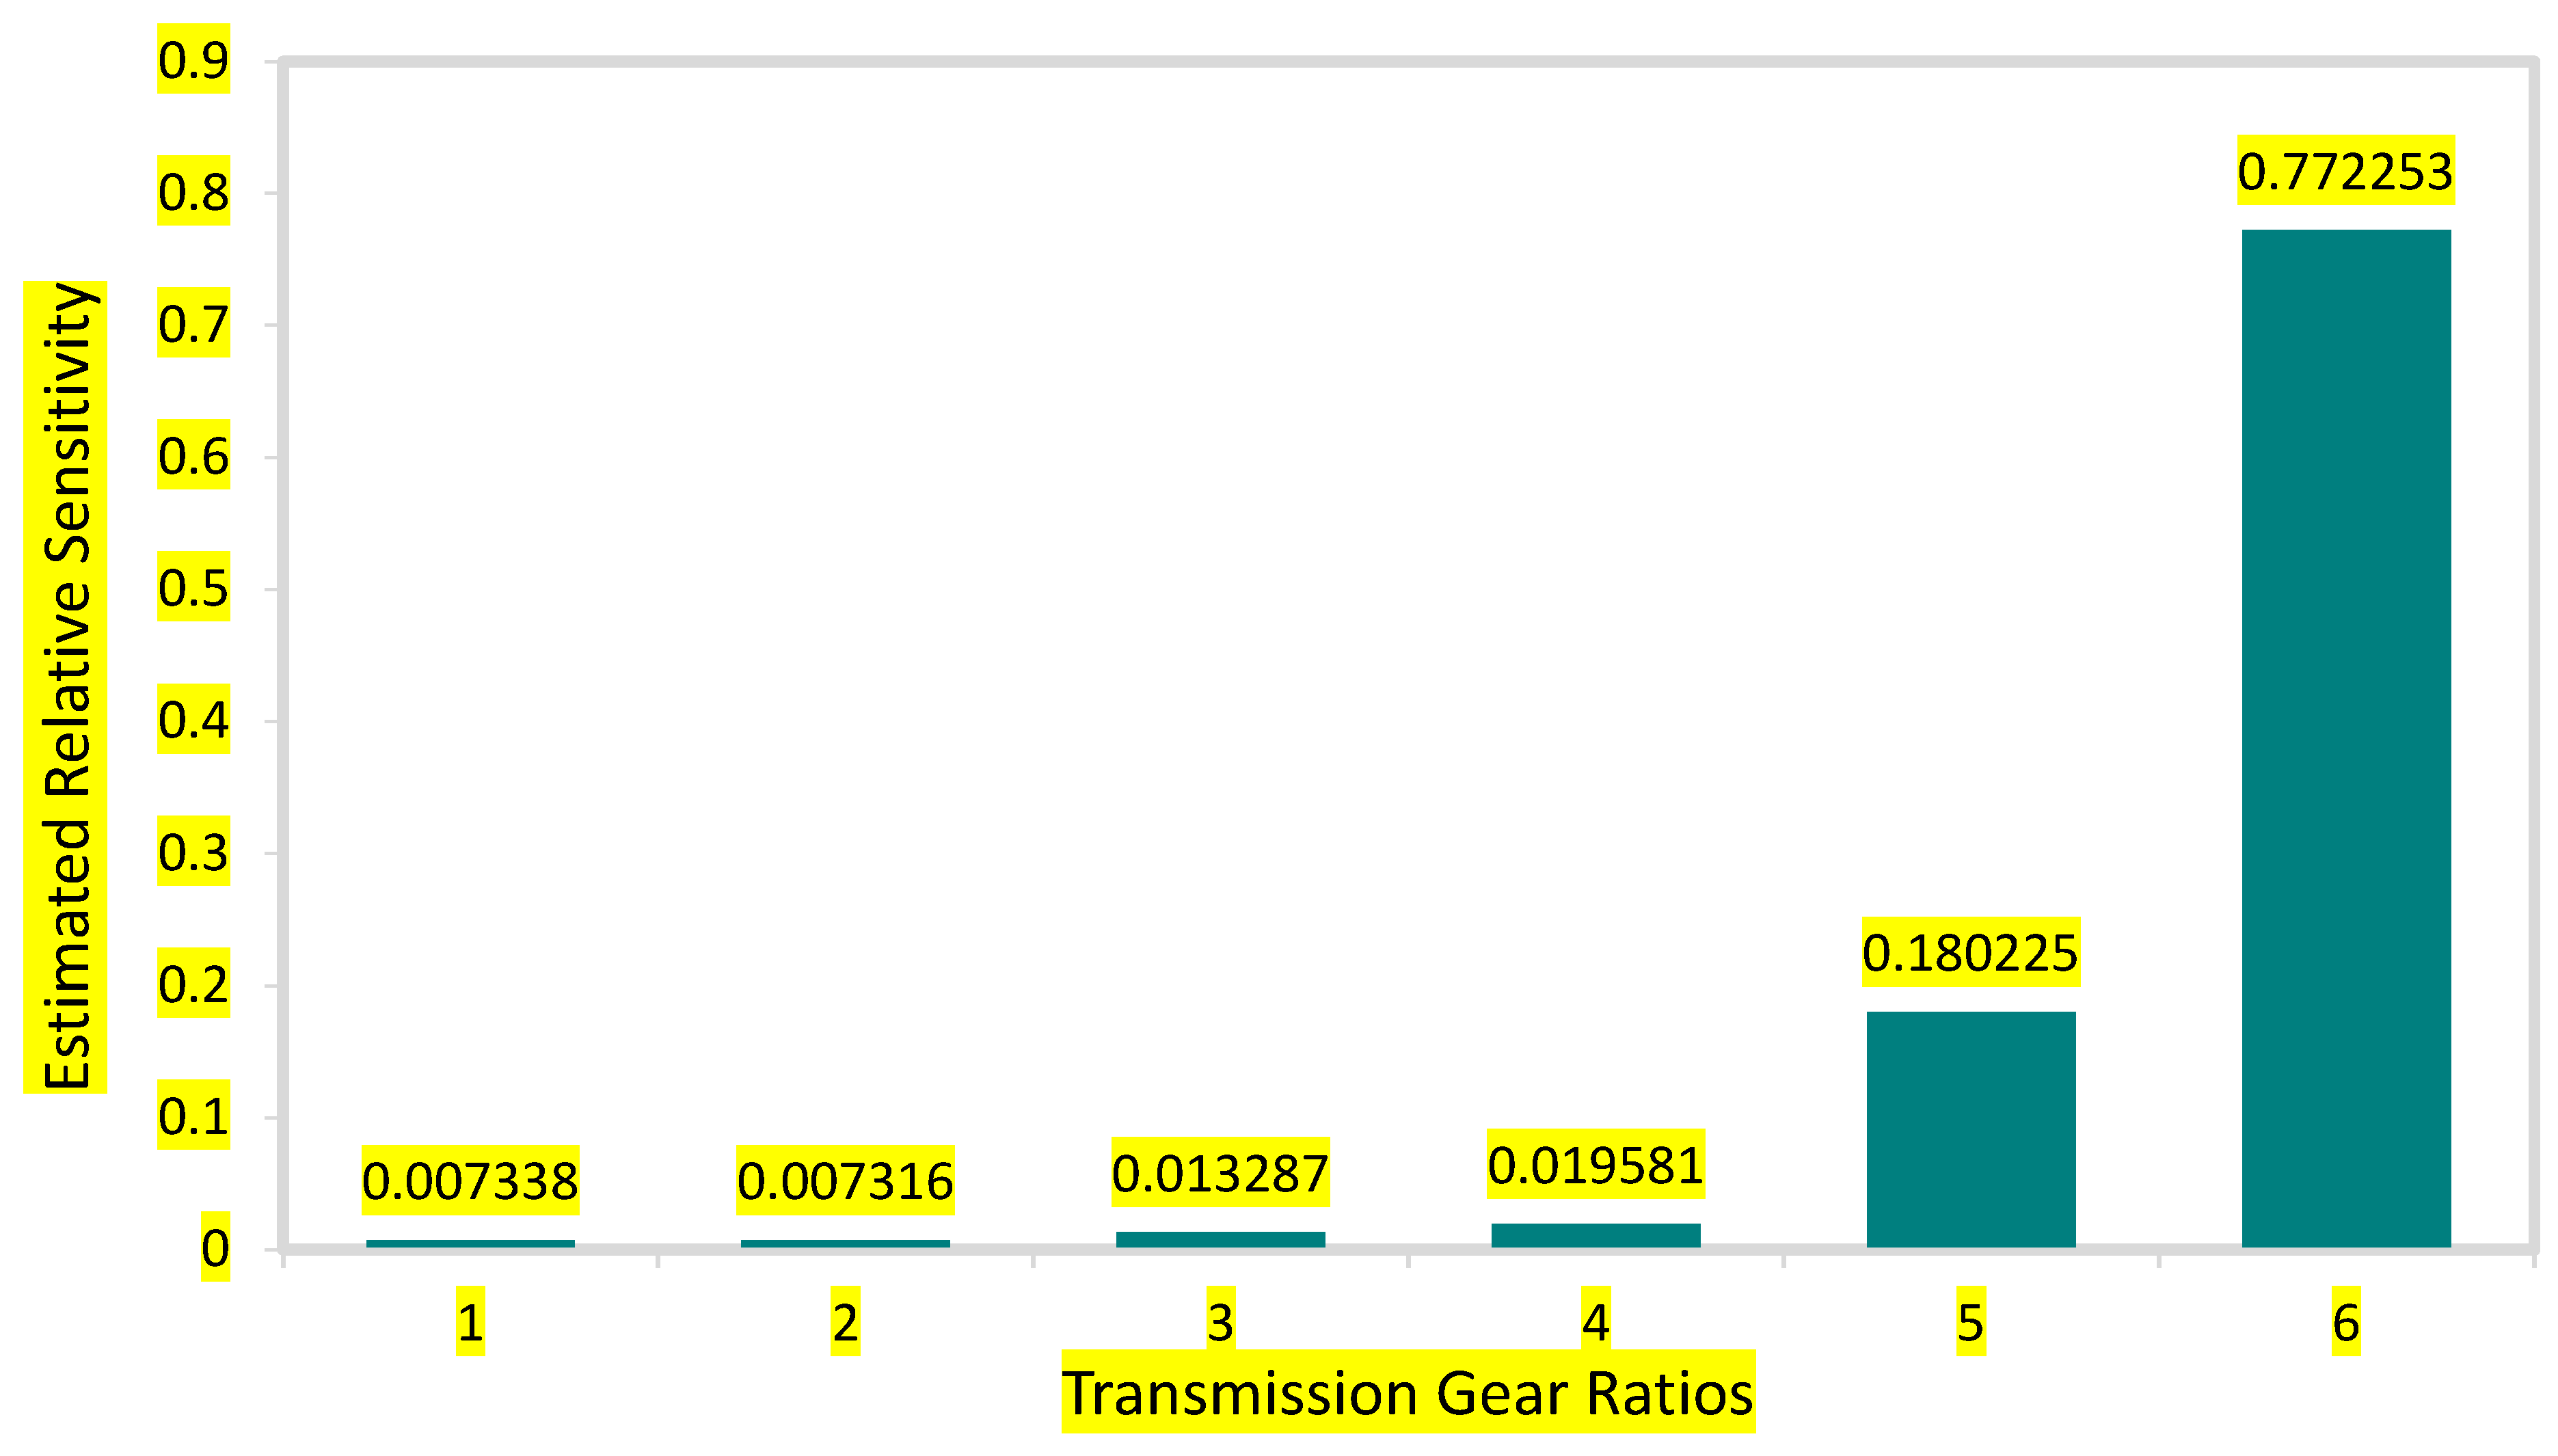
Figure 11 illustrates the relative sensitivity of each gear ratio and its corresponding influence on overall fuel economy. The analysis reveals that the first and second gears exhibit negligible sensitivity values, 0.0073, indicating their limited contribution to the optimization outcome. The mid-range gears display moderate sensitivity values, 0.0133 (3rd) and 0.0196 (4th), reflecting their role in transitions between acceleration and cruising phases. The fifth gear has a marked effect (0.1802), while the sixth gear dominates the profile with a sensitivity of 0.7723, accounting for the vast majority of the optimization impact. It confirms that the sixth gear ratio has the most impact in minimizing fuel consumption. This indicates that the top gear plays the most significant role in reducing fuel consumption by maintaining lower engine speeds during steady-state, high-speed operation. The result emphasizes that optimizing the upper gear ratios is critical for achieving significant improvements in fuel economy under WLTC driving conditions.
3.4. Phase-Based Fuel Economy Improvement
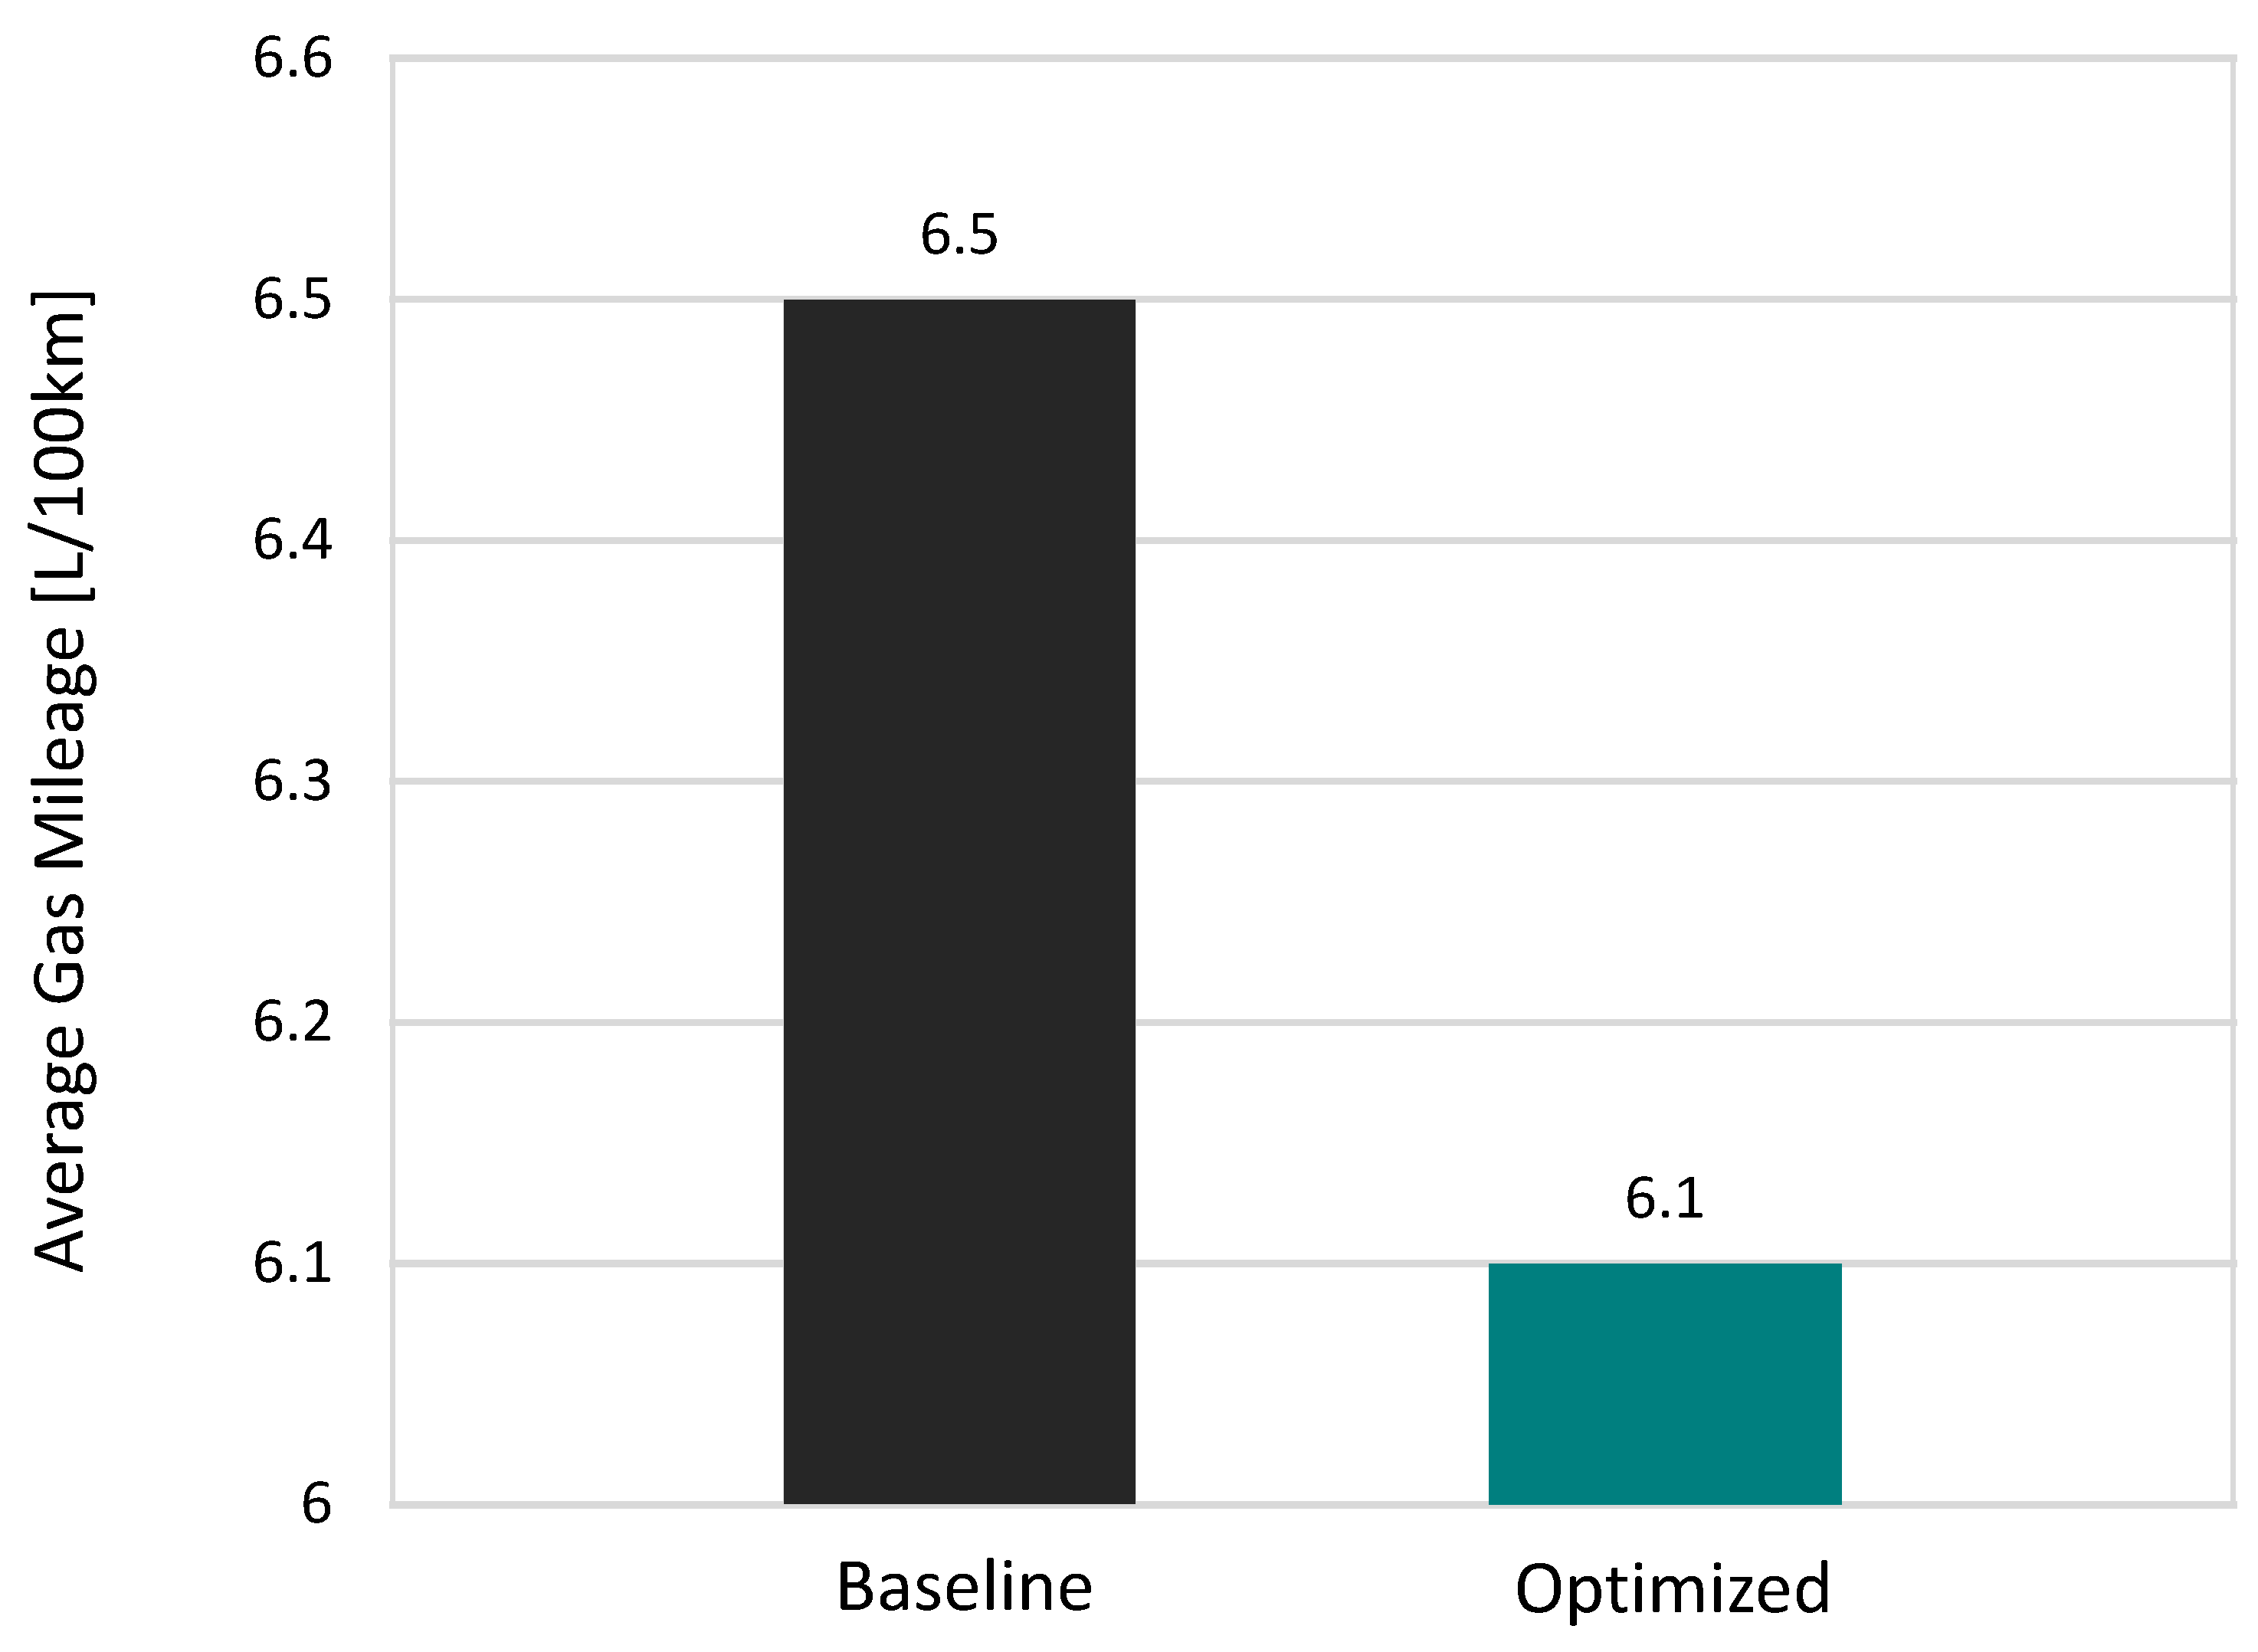
The optimized model achieved a 6.2% overall reduction in fuel consumption, corresponding to a saving of 80 g of fuel over the WLTC cycle, as illustrated in
Figure 12. This improvement indicates that the engine operated more frequently within its high-efficiency regions as a result of the optimized gear ratio calibration. To further investigate phase-specific performance,
Figure 13 depicts the fuel economy breakdown of the baseline and optimized models across the four main driving phases: acceleration, deceleration, cruising, and stationary. The most notable reductions were recorded during the cruising phase, where fuel consumption decreased by around 23% (from 37 g to 29 g), and during the deceleration phase, with approximately 14.4% reduction (from 272 g to 233 g). These findings specify that the optimized gear ratios were particularly effective in minimizing unnecessary fuel consumption under low-load and steady-state driving conditions. Although the percentage improvements in these two phases were significant, their contribution to the total fuel savings was smaller, as deceleration and cruising phases together account for only about 27% of the total fuel consumption. During the acceleration phase, fuel consumption decreased by 4.2% compared to the baseline, reflecting improved engine alignment with the efficient zones of the BSFC map. Conversely, the stationary phase exhibited a marginal increase of 0.7% (44.5 to 44.8), which can be attributed to idling periods, where gear ratio optimization has minimal influence.
4. Conclusions
This study set out to develop and optimize a midsize D-segment passenger vehicle model in GT-SUITE, focusing on improving fuel economy through Bayesian Optimization (BO) of transmission gear ratios. The vehicle model was validated against the WLTC driving cycle using the SAE J2951 drive-quality criteria, demonstrating accurate speed-tracking performance within the allowable tolerance limits and ensuring model fidelity and compliance with WLTP standards. The key findings of this study are summarized as follows:
The baseline simulation revealed that the acceleration phase accounted for 68.9% of total fuel consumption, confirming that transient, high-torque operating conditions dominate overall vehicle energy demand. This highlights the importance of optimizing transmission ratios to minimize unnecessary fuel use during frequent speed transitions and load variations.
The Bayesian Optimization of gear ratios achieved a 6.2% overall reduction in total fuel consumption without any modifications to the engine or hardware components. This improvement was realized purely through software-based calibration, demonstrating that data-driven optimization can significantly enhance vehicle efficiency at minimal cost and implementation complexity.
Notable fuel economy improvements were observed during the deceleration phase (14.4% reduction) and cruising phase (22.9% reduction), confirming the optimizer’s ability to improve efficiency under low-load and steady-state conditions, areas where conventional calibration techniques often overlook optimization potential. These results emphasize the influence of strategic adjustments to higher gear ratios in delivering measurable fuel savings during sustained driving phases. Deceleration contributed the largest absolute share of the total saving, whereas acceleration contributed a significant share owing to its dominant baseline consumption (68.9%) despite a smaller relative reduction (−4.2%).
The optimized configuration effectively shifted the engine operating points toward lower BSFC regions, aligning combustion with the most efficient torque–speed zones. This shift reduced engine speed and torque fluctuations, particularly at medium-to-high-speed operation, resulting in smoother torque delivery and reduced transient fuel spikes.
Sensitivity analysis revealed that the sixth gear ratio contributed over 77% of the total optimization influence, emphasizing the critical role of upper gears in determining steady-state fuel economy. This finding provides valuable insight into the importance of precise top-gear calibration in future optimization frameworks for both ICE and hybrid powertrains.
Beyond the demonstrated fuel-economy gains, the proposed BO framework offers advantages in development cost, calibration time, and resource efficiency. The BO framework can be integrated into existing powertrain calibration workflows to pre-screen large numbers of candidate gear-ratio sets in simulation, significantly reducing the reliance on chassis-dynamometer testing and physical prototyping. For manual and automated manual transmissions, the optimized ratios can be applied directly during gearbox design or minor geartrain modifications without altering engine or driveline architecture. In electronically controlled systems such as AT, AMT, or DCT, the optimized gear ratios can be implemented through Transmission Control Unit (TCU) calibration updates, enabling refined shift-schedule tuning. This machine-learning-driven approach thus complements traditional calibration processes by providing data-driven initial configurations that accelerate design convergence and reduce development costs.
Overall, this research demonstrated that integrating machine learning-based Bayesian Optimization with physics-based GT-SUITE vehicle modeling provides a robust and computationally efficient framework for transmission calibration. The proposed approach effectively captures the nonlinear coupling between gear ratios, engine performance, and transient vehicle dynamics, enabling systematic exploration of design alternatives with reduced computational cost. Future work can expand this methodology to include adaptive and real-world driving behaviors, where driver variability, road gradients, and traffic conditions dynamically influence fuel economy and shift patterns. Although the present investigation concentrates on a six-speed manual transmission, the developed BO GT-SUITE framework is fully extendable to other transmission and powertrain architectures, including AT, AM, DCT, and hybrid configurations. In parallel, future studies will examine the robustness of the optimized gear ratios across varying ambient temperatures, vehicle masses, road grades, and additional real-world driving cycles. Additionally, incorporating multi-objective optimization to account for trade-offs among fuel consumption, emissions, performance, and shift quality will establish a more comprehensive design framework for next-generation powertrain systems aligned with sustainable mobility and CO2 reduction goals.
