Article

Evaluation of Capsaicin as a Selector for Growth Promotional Bacteria Isolated from Capsicum Peppers

Department of Plant Biology, Rutgers University, New Brunswick, NJ 08901, USA
*
Author to whom correspondence should be addressed.
Sustainability 2025, 17(23), 10549; https://doi.org/10.3390/su172310549
Submission received: 29 October 2025 / Revised: 16 November 2025 / Accepted: 21 November 2025 / Published: 25 November 2025
(This article belongs to the Special Issue Climate Change and Sustainable Agricultural System)

Abstract

Plant growth-promoting bacteria (PGPB) can act as biostimulants, improving the growth of plants in sustainable agriculture systems that seek to reduce synthetic agrochemical input. Bacteria present in seeds are closely associated with vertical transmission and thus represent a potential trove of biostimulants. Capsicum species are notable for producing capsaicin, a compound with antimicrobial activity that may influence microbial communities associated with pepper fruits and seeds. Using Luria–Bertani (LB) media infused with capsaicin, we isolated bacteria from bell peppers, jalapeno peppers, and habanero peppers, which we verified to have different levels of capsaicin through high-performance liquid chromatography with ultraviolet detection (HPLC-UV). Minimum inhibitory concentration (MIC) assays indicated that the capsaicin resistance of isolated bacteria did not correlate with the pungency level of the host pepper variety. Of the total isolated bacteria, four showed promise as plant growth promoters; two belong to the genera Pseudomonas, one Agrobacterium, and one Bacillus. Our isolates tested positively for potassium and phosphate solubilization, urease production, and indole-3-acetic acid (IAA) phytohormone production. Inoculation of these bacteria into surface-sterilized red clover (Trifolium pratense) and Kentucky bluegrass (Poa pratensis) showed significant improvements in germination rate, seedling root length, and seedling shoot height. These results show that the pungency of peppers does not influence the capsaicin resistance of isolated bacteria. Additionally, seedborne PGPB have the potential for plant growth improvement through various mechanisms, reducing the need for synthetic chemicals.

1. Introduction

Sustainable agriculture aims to reduce reliance on synthetic fertilizers and pesticides, which are energy-intensive to produce and contribute to greenhouse gas emissions [1,2,3,4]. Plant growth-promoting bacteria (PGPB) can assist their host plant in many different ways, including: improved nutrient acquisition, production of phytohormones and secondary metabolites, and defense against biotic and abiotic stresses [5,6]. By promoting plant growth, these PGPB can theoretically reduce the input of synthetic agrochemicals [4]. Some of the common methods used to validate the growth promotion capacity of PGPB include the use of differential media like Pikovskaya agar or Aleksandrow agar, which can determine phosphorus and potassium solubilization, respectively; the use of colorimetric assays like the Salkowski assay and chrome azurol S assay to determine phytohormone production and siderophore production, respectively; and the use of dual culture assays pairing pathogens with PGPB to determine biotic resistance [7,8,9,10]. After determination of growth promotion traits in vitro, PGPB are then tested in planta through inoculation studies to determine whether they can realistically confer growth benefits to host plants.
PGPB may reside in any plant tissue, with diverse communities present in roots (rhizosphere), leaves (phyllosphere), fruits, and even seeds [11,12]. Because of their rich metabolic potential, PGPB can be bioprospected to be used as biostimulant products for agriculture. Due to their ubiquity, however, it is important to formulate hypotheses that help to narrow down potential plant species, cultivars, and tissues on which to focus bioprospecting efforts. Many culture-independent studies have explored plant-microbiome interactions in various host species, and vertical transmission of PGPB has been reported in a wide range of plant species [13,14]. To aid in the selection of promising plants or tissues, researchers can look for uniqueness in a host plant for inspiration; either metabolically, or due to a particularly strenuous abiotic environment [15,16].
Pepper fruits (Capsicum sp.) contain the spice compound capsaicin and are an important part of diets worldwide. Capsaicin, in addition to being valued as a food commodity, also has antibiotic properties, having been tested in various efforts against a wide range of common bacterial pathogens [17,18,19,20]. Depending on the bacterial species, capsaicin exhibits either bacteriostatic or bactericidal properties [17,19,21,22,23,24]. Within the anatomy of the fruit, capsaicin is at its highest concentration in the pith or placenta, with appreciably lower concentrations in the seed and pericarp [25]. The placenta nourishes developing seeds through independent vascular tissue—which is also the route of bacterial movement within a plant—and physically anchors seeds [26,27]. Though research on placenta-mediated bacterial vertical transmission is scarce, we assume that any vertically transmitted seed bacteria must be exposed to placental capsaicin, at least during bacterial transit. Because of this, Capsicum species present a unique opportunity for bioprospecting: any bacteria found within seeds of pepper fruits are hypothesized to have a strong evolutionary link to the host plant, being selectively driven to develop capsaicin resistance.
If seed-associated bacteria are exposed to capsaicin during fruit development, selection may favor strains with tolerance mechanisms [28,29,30]. However, the extent of such exposure varies with fruit anatomy and remains unclear. Therefore, whether pungency influences seed microbial traits remains an open question. We set out to test the hypothesis that the isolation of capsaicin-resistant bacteria from pepper fruits, especially from spicier varieties, should yield strong PGPB candidates.

2. Materials and Methods

2.1. Obtaining Fruits and Quantifying Capsaicin Levels with High Performance Liquid Chromatography

Ripe, conventionally grown bell, jalapeño, and habanero peppers were obtained from a single commercial supplier in April 2023 (Cuttler Produce, Eatontown NJ, USA). All fruits were processed within 72 h of purchase and stored at 4 °C under identical conditions to minimize variation.
High-performance liquid chromatography with ultraviolet detection (HPLC-UV) was used to assess the concentrations of capsaicin in each fruit type. Three fruits of each type were pooled per variety, dried at 50 °C for 7 days, and finely ground (to a particle size of 2 mm) with a spice grinder. 100 mg of the pulverized sample was weighed out in triplicate for each variety, then extracted in 10 mL of ACS-grade 100% ethanol (64-17-5, Sigma-Aldrich Inc., St. Louis, MO, USA). The extract was vortexed for 5 s, sonicated for 15 min, then placed in an 80 °C water bath for an hour. Extracts were left to settle for 24 h before centrifuging at 14,000 rpm for 10 min.
Extracts were placed in HPLC autosampler vials and assessed using the Agilent 1290 II system. The column used was the WatersTM ACQUITY UPLC BEH C18 column (1.7 µm, 2.1 mm × 50 mm). Gradient elution was performed with the gradient program detailed in Table A1, and flow rate was set to 0.5 mL/min. LC-MS grade water (7732-18-5, Sigma-Aldrich Inc., St. Louis, MO, USA), acetonitrile (75-05-8, Sigma-Aldrich Inc., St. Louis, MO, USA), and formic acid (64-18-6, Sigma-Aldrich Inc., St. Louis, MO, USA) were used in the gradient program. Detection wavelength was set to 280 nm and the injection volume used was 0.5 uL. Column temperature was set to 40 °C.
A calibration curve for capsaicin (404-86-4, U.S. Pharmacopeia, Washington, DC, USA) was generated using known amounts of capsaicin, starting with 1 mg/mL and performing a 15-series dilution. Using this calibration curve, average capsaicin concentrations for each variety were obtained. The standards and samples were analyzed in triplicate.

2.2. Bacterial Isolation

Culturable seed-associated PGPB were isolated from the seeds and flesh of pepper fruits plant-beneficial bacteria. LB media infused with different concentrations of capsaicin were prepared by dissolving 100 mg of pure capsaicin extract in 5 mL of 95% ethanol, then mixing specific volumes of the ethanol extract with autoclaved LB agar and allowing the agar to solidify in Petri dishes. Capsaicin concentrations used for isolation included 0, 50, 100, and 150 μg/mL.
Fruits were aseptically processed in a biosafety hood. For each variety, three replicate fruits were used for seed extraction. The outer fruit surface was surface-disinfected with 70% EtOH and air dried. Autoclaved tweezers and scalpels were used to dissect fruits and obtain seeds.
Approximately 0.5 g of seeds were macerated with a sterile mortar and pestle, along with 1 mL of sterile deionized water to constitute a slurry. The resulting slurry was serially diluted to 1 × 10⁻⁷ concentration, and 100 μL of the 1 × 10⁻⁵, 1 × 10⁻⁶, and 1 × 10⁻⁷ dilutions was spread on capsaicin-infused LB plates with sterile spreaders. These dilutions were spread onto low—(50 μg/mL), medium—(100 μg/mL), and high-capsaicin (150 μg/mL) plates in triplicate.
Fruit flesh was prepared by incising numerous 2 × 2 cm segments of the mesocarp and endocarp of the fruit, taking care to exclude the exocarp. Approximately 1 g of these fruit flesh segments was macerated with a sterile mortar and pestle, and the slurry was serially diluted and plated in the same manner as the seed tissue.
Plates were incubated at approximately 23 °C for up to 1 week. At the end of this incubation period, all bacterial colonies were grouped based on colony morphology–including color, size, shape, and texture. Afterwards, distinct bacterial colonies were streaked for isolation onto regular LB plates, then streaked again if necessary to obtain pure cultures.

2.3. Capsaicin Broth Microdilution Assay

Minimum inhibitory concentration (MIC) assay was performed according to the standards set by the Clinical and Laboratory Standards Institute to determine the lowest concentration of capsaicin which inhibited the visible growth of bacterial isolates. A capsaicin stock in absolute ethanol (10 mg/mL) was prepared and stored at −20 °C.
Capsaicin dilutions were made at 500 μg/mL, 250 μg/mL, 125 μg/mL, 62.5 μg/mL, and 31.25 μg/mL. These concentrations were based on a 2021 review article on the antibacterial properties of capsaicin [31]. All bacterial isolates were tested with cation-adjusted Mueller-Hinton broth; sterile broth was used as a negative control.
In addition to our pepper-isolated bacteria, we also tested two isolates from mint (ID: Mint1 and Mint2) and two isolates from tomato seeds (ID: Tomato1 and Tomato2). These are meant to serve as counterexamples of bacteria that did not evolve in the presence of capsaicinoids. Respectively, their genus-level identifications were determined to be Bacillus, Pantoea, Paenibacillus, and Terribacillus. See Section 2.5 for details on genus-level identification using 16S rRNA Sanger sequencing.
To determine whether the pungency of a pepper host influences the capsaicin resistance of its culturable microbes, we averaged the maximum growth inhibition of all bacteria isolated from each pepper variety and performed type III ANOVA in R. Additionally, we performed Fisher’s exact test in R to determine whether the distributions of the optimal dose (the capsaicin concentration that elicits the highest growth inhibition) were significantly different among all bacteria isolated from each pepper variety.

2.4. Assessing Bacterial Isolates: Plant Growth Promotion Assays

The bacterial isolates obtained were tested for various plant growth promotion traits. All tests were performed using 24–48 h old bacterial colonies cultured on LB agar plates, which were subcultured 1–2 times from a glycerol stock.

2.4.1. Phosphate and Potassium Solubilization

Phosphate and potassium solubilization are attributes that can assist plants with the uptake of organic phosphate and potassium, by solubilizing them into inorganic, plant-accessible forms [32,33]. These traits were qualitatively assessed by streaking each bacterial isolate on Pikovskaya and Aleksandrow agar, respectively. After incubating at 23 °C for up to one week, any clearing of the opaque media was observed as solubilizing activity.

2.4.2. Protease Activity

Protease activity has been documented to correlate with antipathogenic activity of beneficial bacteria [34]. Each bacterial isolate was tested for this property using skim milk agar [35]. After incubating at 23 °C for up to one week, clearing of the media was observed as protease activity.

2.4.3. IAA Production

IAA production was measured using the Salkowski test described by Gang et al., 2008 [9]. Bacteria were pre-cultured in 1.3% (w/v) nutrient broth for 24 h, then transferred to 1.3% nutrient broth containing 0.15% (w/v) tryptophan and incubated in shaking condition (100 rpm) in dark condition for 48 h. Afterwards, 1.5 mL of culture broth was centrifuged and 1mL of the resulting supernatant was mixed with an equal volume of Salkowski reagent. Uninoculated broth served as a blank. These solutions were incubated in the dark for 30 min at 30 °C, after which a pink color change denoted the ability of the bacterial isolate to have metabolized IAA from the tryptophan precursor. The absorbance at 536 nm was recorded using Thermo ScientificTM (Waltham, MA, USA) NanoDrop OneC Microvolume Spectrophotometer. A standard curve was also generated using known IAA concentrations ranging from 0 to 200 μg/mL.
Plants have been shown to be highly sensitive to IAA. At an optimal level, IAA is involved in plant development through the modulation of cell division and growth [36]. However, at levels exceeding a plant host’s optimum, IAA can inhibit plant growth [37,38]. Because of the importance of IAA in determining the outcome of host-bacterial relationships, we decided to reduce our pool of biostimulant candidates from the original list of 20 isolates to the 4 that produce IAA.

2.4.4. Urease Activity

Urease is an enzyme produced by bacteria, fungi, and plants that plays a significant role in the decomposition of urea to ammonia [39]. Ammonia, an inorganic compound, is more readily plant-available than urea; therefore, any microbe that produces urease may be important in facilitating plant uptake of N [40].
Urease activity was tested for the 4 IAA-producing isolates using Christensen’s urea agar [41]. Media slants were inoculated with bacteria and incubated at 35 °C for up to 5 days. The slants were observed at 6 h post-inoculation and every 24 h post-inoculation for a pink color change, which would suggest urea decomposition.

2.4.5. Siderophore Production

Siderophores are iron-chelating compounds produced by some bacteria that can help with iron acquisition [10]. Siderophore production was tested for the 4 IAA-producing isolates using an assay based on chrome azurol sulphonate (CAS) dye, which turns from blue to orange when iron is liberated from the CAS-iron complex [10]. Bacteria were cultured overnight in LB broth, after which the supernatant was acquired from 0.5 mL of the broth culture. 100 μL of this supernatant was mixed with equal volume of CAS reagent [42]. The mixture was incubated at ambient temperature for 20 min, after which the absorbance at 630 nm was recorded using Thermo ScientificTM NanoDrop OneC Microvolume Spectrophotometer.

2.5. Identifying Bacteria Through 16S rRNA Sequencing

Bacteria were cultured overnight in LB broth, after which an aliquot was taken and a pellet obtained to extract for total DNA using the GenElute™ Bacterial Genomic DNA Kit (NA2110-1KT, Sigma-Aldrich, St Louis, MO, USA). The following forward and reverse primers for amplifying the 16S rRNA gene were used:
  • 27F (5′-AGA GTT TGA TCC TGG CTC AG);
  • 1492R (5′-CGG TTA CCT TGT TAC GAC TT).
Polymerase chain reactions were performed with the following cycles (repeated 30 times):
  • Denaturation: 94 °C for 30 s;
  • Annealing: 55 °C for 30 s;
  • Extension: 72 °C for 60 s.
Amplified DNA was sent to Genewiz (South Plainfield, NJ, USA) for 16S Sanger sequencing. Sequences were referenced to the NCBI 16S ribosomal RNA sequences database using nBLAST version 11.0.
Maximum likelihood (ML) phylogenetic trees were constructed using the MEGA: Molecular Evolutionary Genetics Analysis version 11.0 software. Analyses were performed using the Kimura-2 parameter substitution model with discrete gamma distribution and invariant sites for the 16S rRNA gene. The ML Heuristic model used was Nearest-Neighbor-Interchange. Clade stability was assessed using a bootstrap analysis with 1000 replicates [43,44].

2.6. Dual Culture Assays with Common Fungal Pathogens

Fusarium oxysporum, Colletotrichum acutatum, Rhizoctonia solani, and Clarireedia jacksonii are among the most common phytopathogenic fungi [45,46]. The F. oxysporum species complex consists of more than 120 forma speciales, each of which is responsible for causing disease in a narrow host range [45]. On the other hand, C. acutatum has a broad host range for which it is the causal agent of anthracnose [46]. R. solani is another pathogen with a broad host range, able to induce a variety of symptoms like root rot, stem canker, damping off, etc., on a multitude of plant families [47]. C. jacksonii is a narrow host range pathogen that causes dollar spot disease in turfgrasses. We tested our promising bacterial isolates against F. oxysporum f. sp. lycopersici, C. acutatum, R. solani, and C. jacksonii on potato dextrose agar using a dual culture assay, in order to screen our isolates’ capabilities in plant pathogen protection [48]. Bacteria were streaked on the plates approximately 1 cm from the center of the plate, and 1 cm diameter fungal plugs were taken with a cork borer and placed opposite to the bacterial streak. Cultures were left to grow at ambient lab conditions for 7 days. Inhibition of the fungus was calculated as follows:
% inhibition = ((R1 − R2)/R1) × 100, with R1 being the radial distance of the pathogen growing on the control plate (without any opposing bacteria) and R2 being the radial distance of the pathogen growing towards the direction of the bacteria.

2.7. Inoculation Tests with Trifolium pratense and Poa pratensis

To assess whether the isolates promote plant growth, inoculation tests were performed on Trifolium pratense and Poa pratensis. These plants were chosen based on the ease with which they can be effectively surface-sterilized, as well as their evolutionary distance. T. pratense is a eudicot, while P. pratensis is a monocot; inoculation tests on these two species can elucidate the host compatibility range of the bacterial candidates. Seeds of T. pratense were surface sterilized by rinsing with 4% sodium hypochlorite (approximately 50% Clorox bleach) for 30 min, followed by 8 rinses with sterilized deionized water for 3 min each. Seeds of P. pratensis were surface sterilized by rinsing first with 70% ethanol for 1 min, followed by 3 sterilized deionized water rinses, followed by a 60-min rinse with 4% sodium hypochlorite, and finally by 15 sterilized deionized water rinses. The seed sterilization protocols used were modified from Zhang et al. (2022) [43] and three seeds were placed on LB plates for up to 3 days to confirm lack of culturable bacterial growth.
Seeds were then soaked for 10 min with bacterial inocula. Inocula were prepared by diluting bacterial colonies from overnight LB agar cultures in sterilized deionized water to an OD600 of 0.5. After soaking for 10 min, seeds were sown into magenta boxes containing approximately 100mL of sphagnum peat-based potting mix (PRO-MIX® BX, Premier Tech Horticulture, Quakertown, PA, USA), previously autoclaved three times, and 30 mL of sterilized deionized water. Each box contained 10 seeds and treatments were in triplicate.
Magenta boxes were maintained in 12 h:12 h light/dark cycle at ambient lab conditions for 2 weeks for T. pratense, and 3 weeks for P. pratensis. LED lights were used and plants were exposed to an approximate light intensity of 5000 lux. Afterwards, plant seedlings were removed, counted, and measured for plant growth parameters including root and shoot length, number of roots formed, and number of leaves formed. Inoculations were confirmed to be successful by placing three seedlings of each treatment group on LB media and observing for visible growth of the bacteria re-emerging from the plant within 72 h. Sterility of soil was confirmed by placing three uninoculated seedlings and any adhering soil particles on LB media for up to 72 h and observing lack of bacterial growth.
Each growth parameter was statistically analyzed using type III ANOVA in R, followed by posthoc Tukey’s HSD test in R.

3. Results

3.1. HPLC-UV Determination of Capsaicin Concentrations

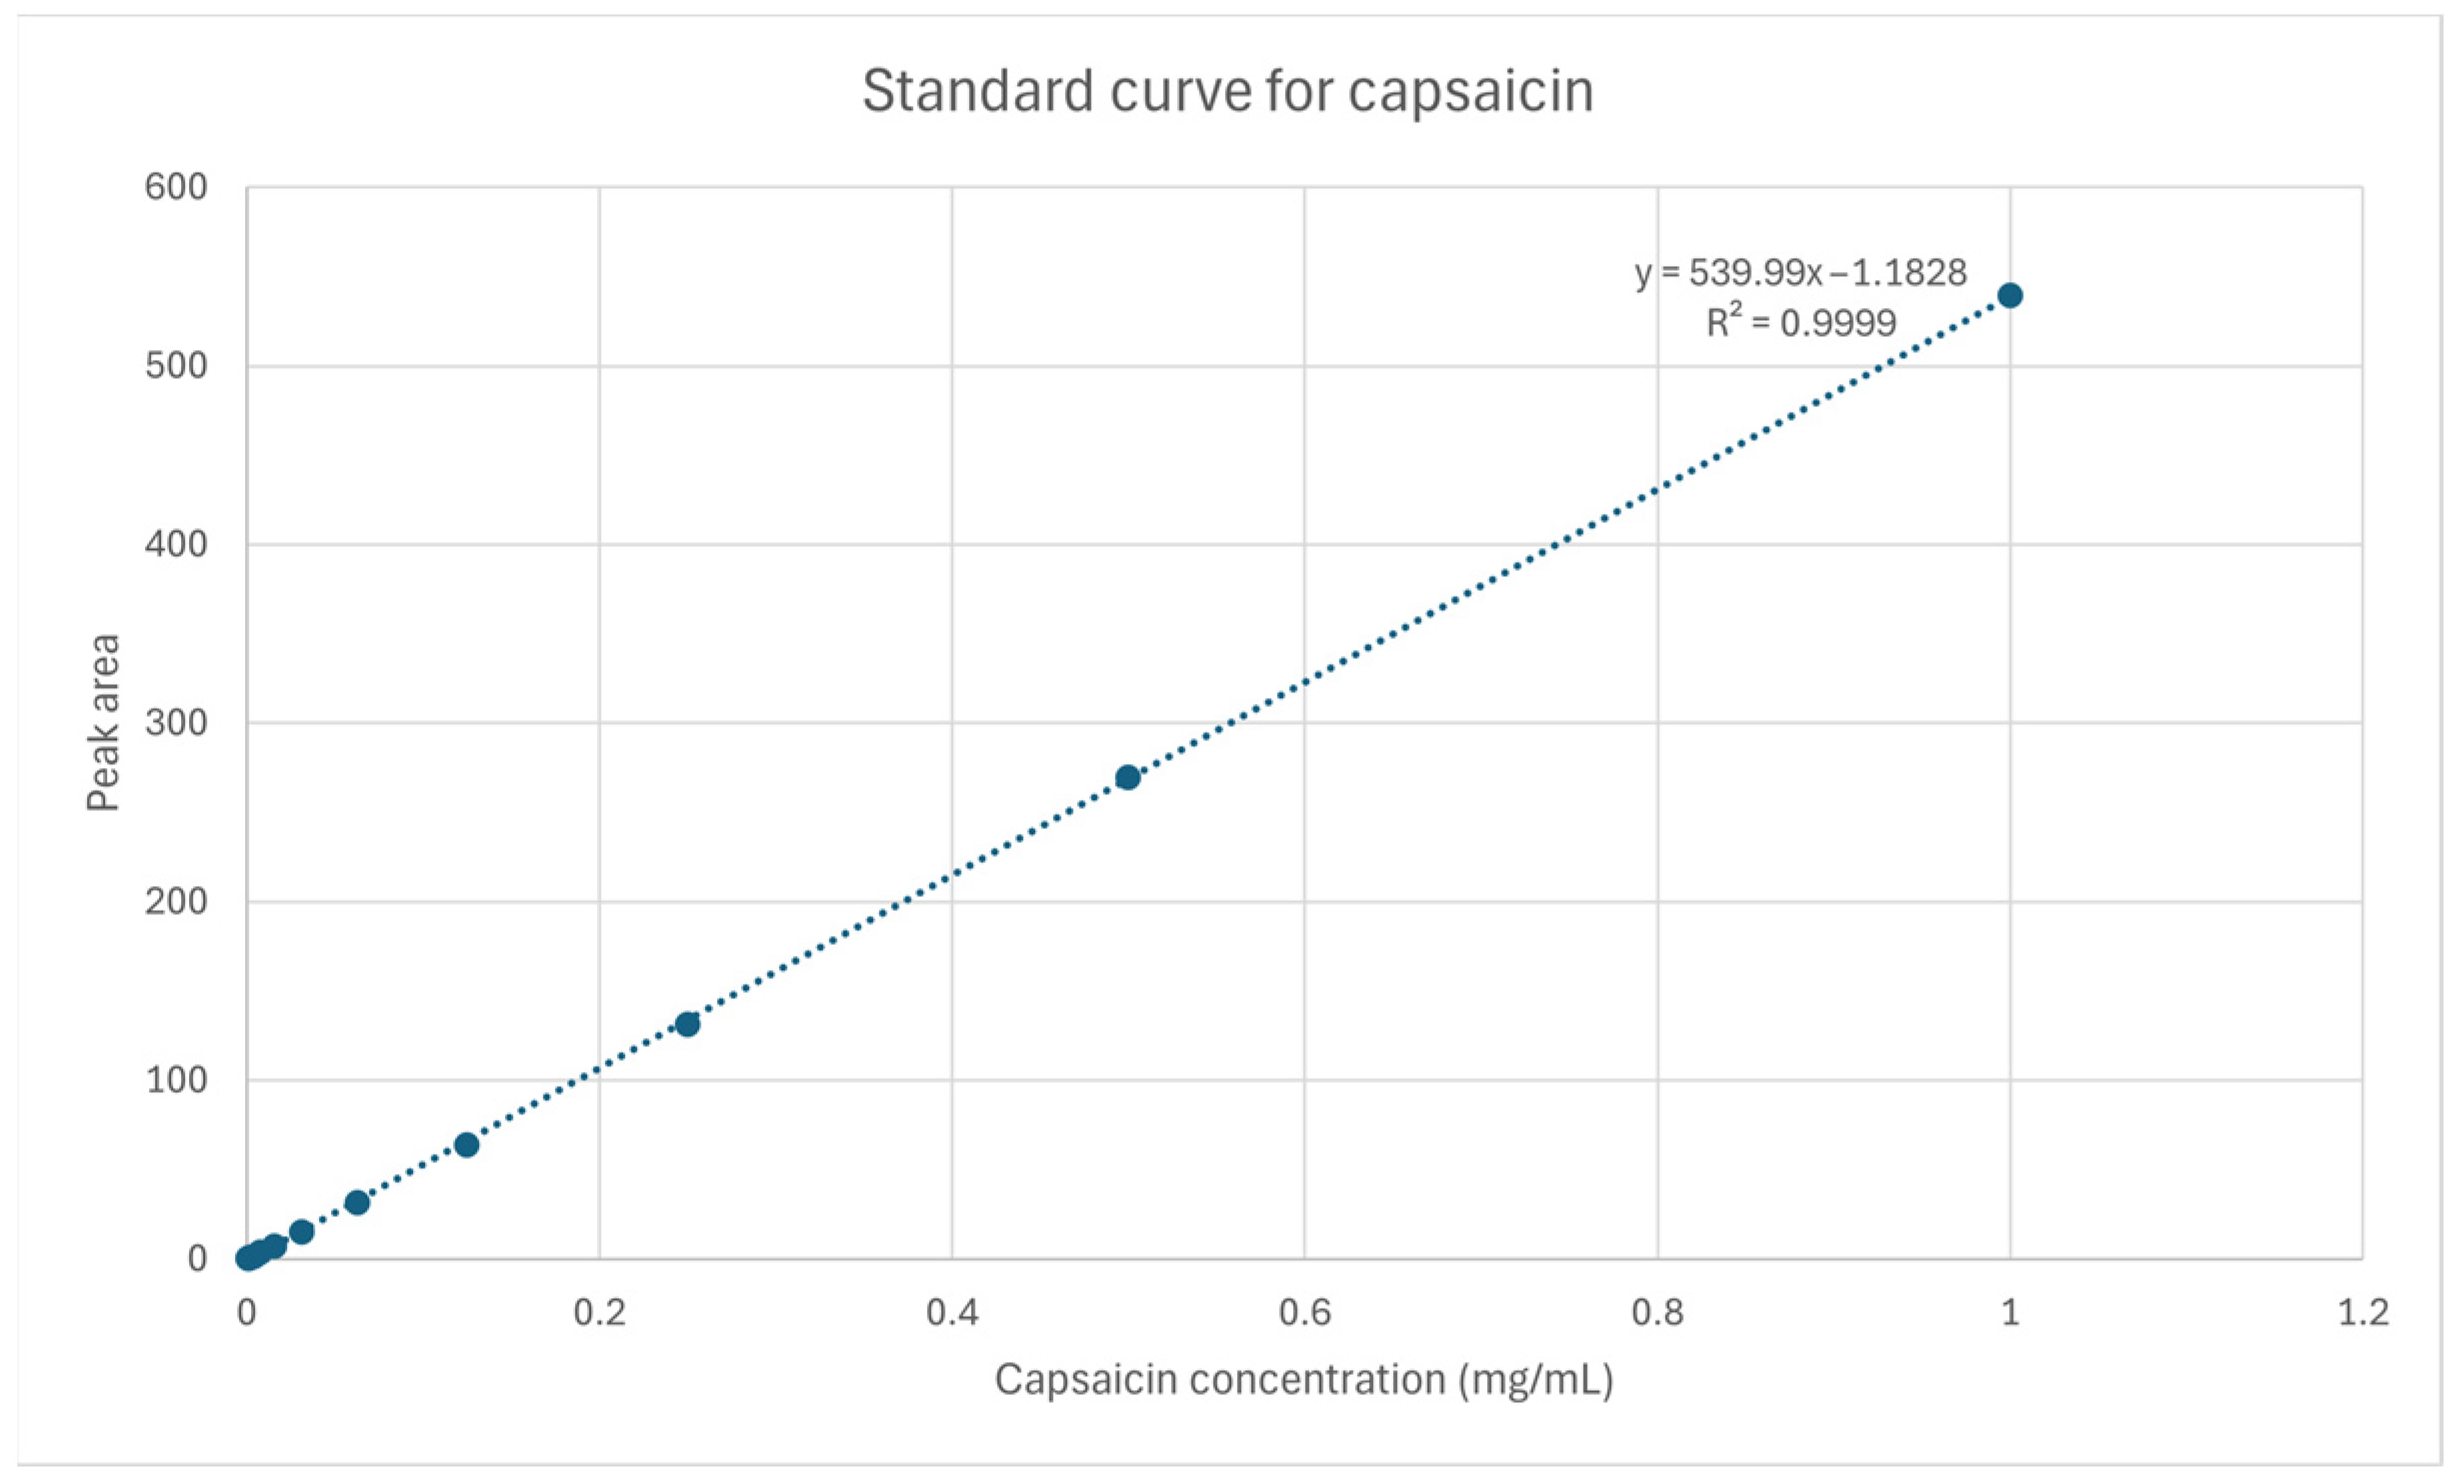
Using our HPLC-UV method, capsaicin was determined to have a retention time around 1.78 min. A linear regression analysis was conducted in Excel, showing a linear response between peak area and concentration (mg/mL), with R2 > 0.0999 (Figure A1). The limit of quantification (LOQ) for capsaicin was determined to be approximately 0.488 μg/mL at a signal-to-noise ratio of ≥10; the limit of detection (LOD) was determined to be approximately 0.244 μg/mL at a signal-to-noise ratio of ≥3. Bell pepper samples showed no significant peak at the retention time of 1.78 min, suggesting that the capsaicin amounts in these samples were below the LOD. Jalapeno samples had small peaks, and habanero samples had significantly larger peaks, as shown in Figure 1.
By comparing to a standard curve generated with known capsaicin concentrations (Figure A1), we estimated the concentrations of capsaicin in each composite fruit sample in Table 1. We also converted capsaicin concentrations to Scoville Heat Units (SHU)—a measure of pungency—by multiplying each concentration by a factor of 16 [49,50]. Values in Table 1 are averages of three technical replicates.

3.2. Bacterial Isolates Recovered from Peppers and Their Capsaicin Resistances

In total, 20 morphologically unique culturable bacteria were isolated; of these, 8 were recovered from bell pepper, 3 from jalapeno, and 9 from habanero (Table 2). Bacteria were recovered from both fruit flesh and seeds for bell pepper and habanero; for jalapeno, however, only the fruit flesh yielded bacteria. Table 2 details the capsaicin concentration (μg/mL) of the LB media in which the bacteria were isolated, as well as the capsaicin concentration (μg/mL) that elicited the greatest inhibition of growth observed in the capsaicin broth microdilution assay.
No pepper isolate was fully inhibited by the tested capsaicin concentrations in the MIC assay (Table 3). Many bacteria experienced faster growth at higher capsaicin levels, which is consistent with the Eagle effect [51,52]. With no MIC values to report, we instead determined percentage growth inhibition (compared to control) based on OD600 readings.
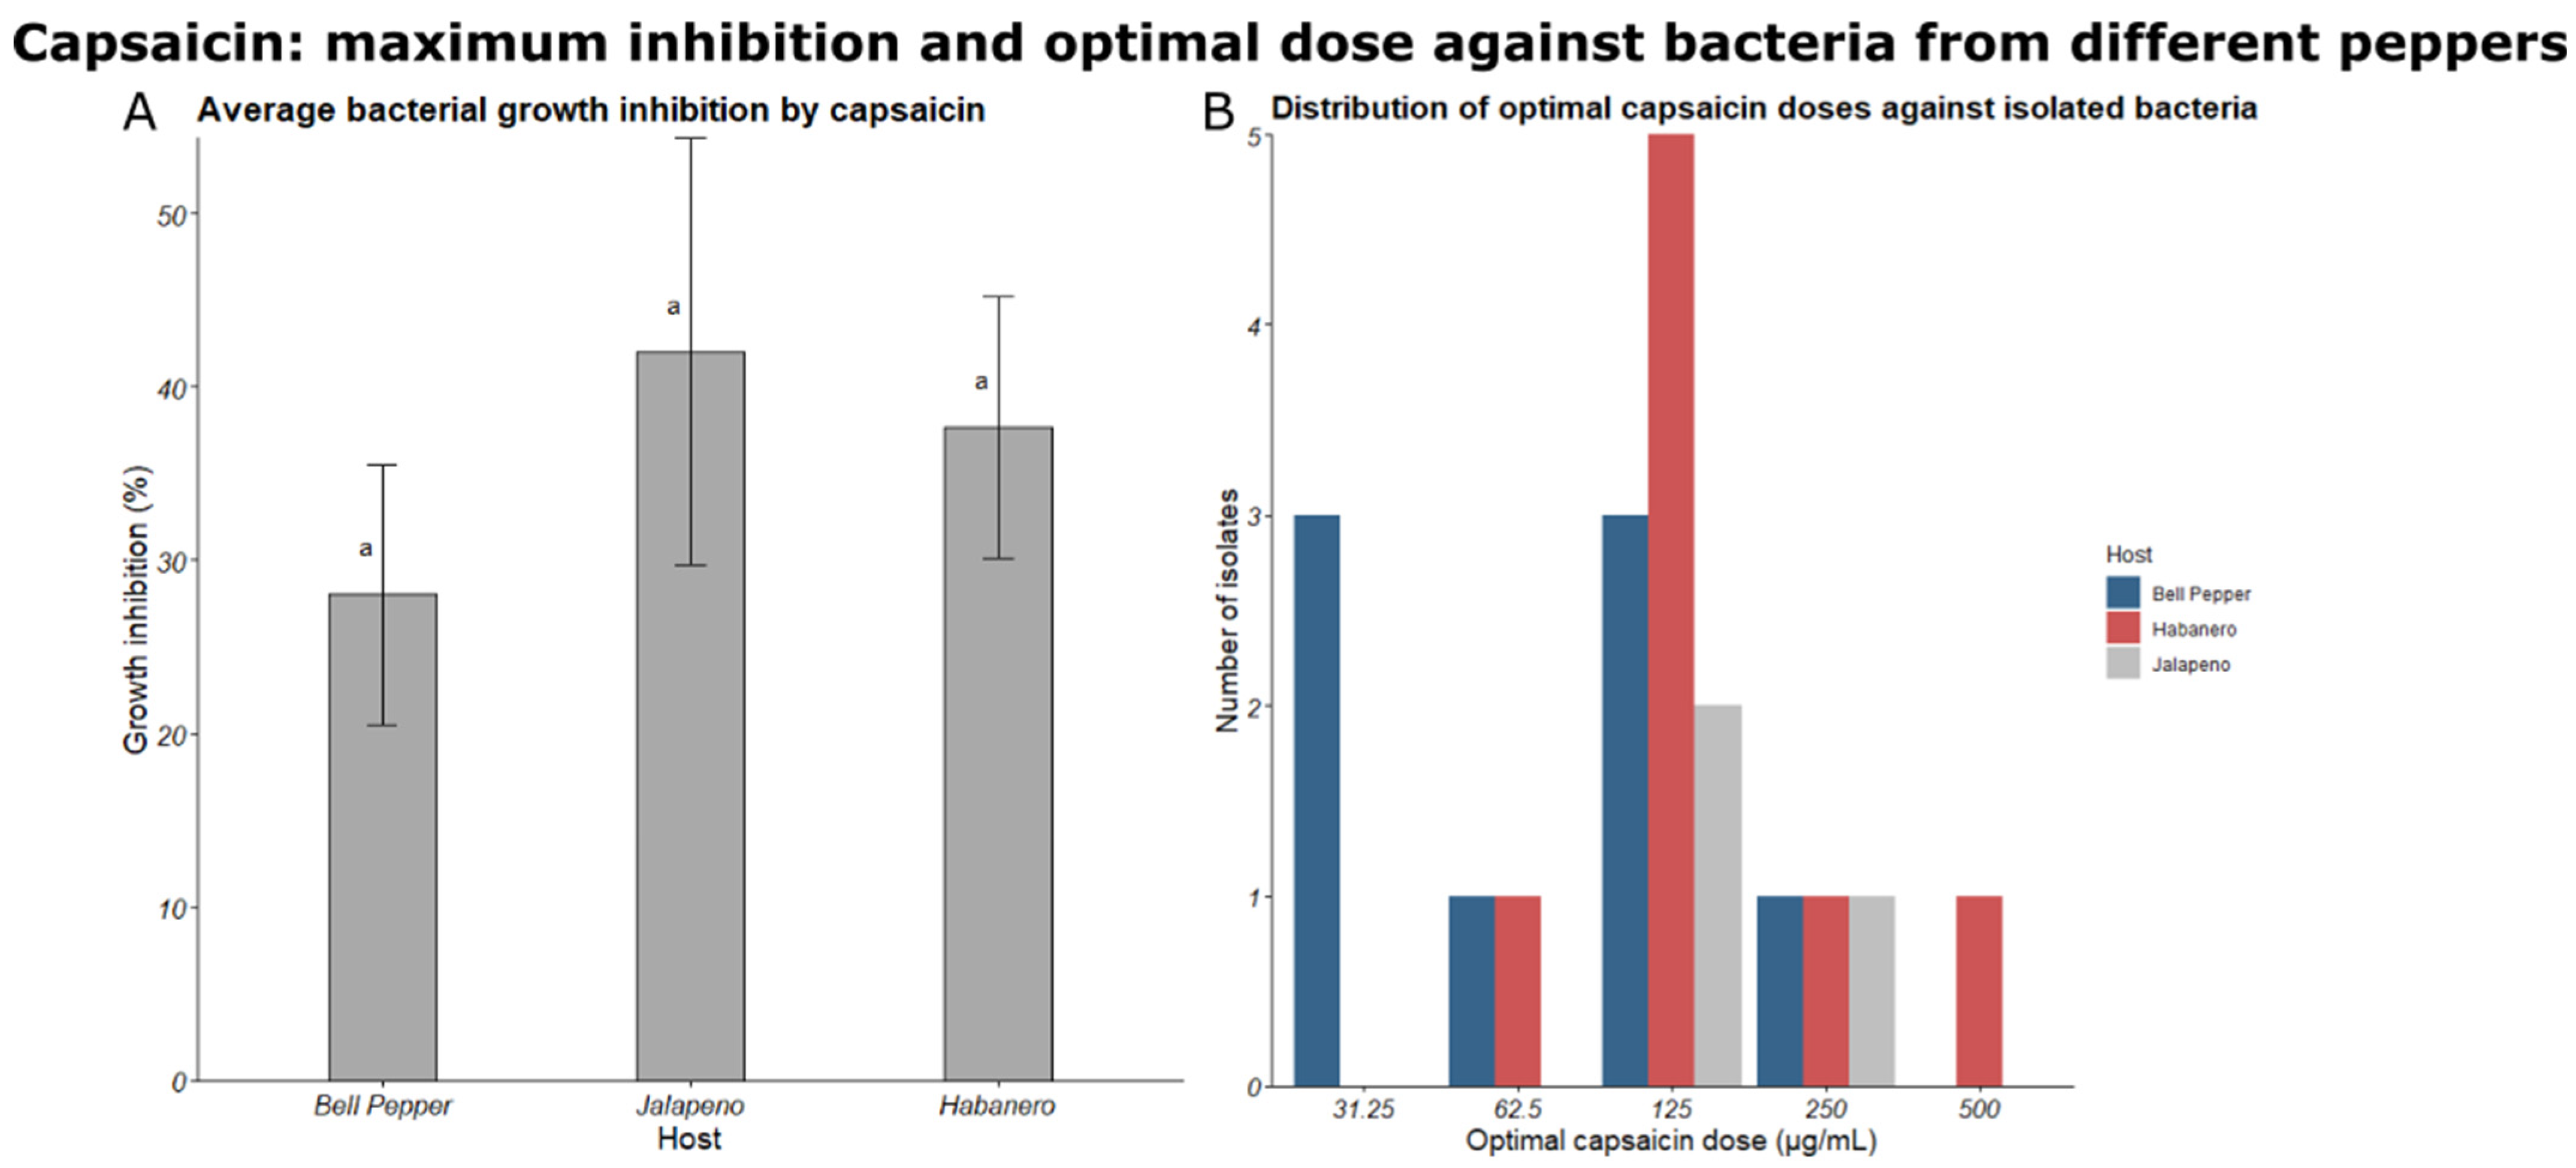
Figure 2A shows the maximum percentage of growth inhibition observed for each bacterium among all tested capsaicin concentrations, averaged for each group; no significant differences were found between the groups. Figure 2B shows the distribution of the optimal capsaicin dose—the concentration that elicits the greatest growth inhibition—for each group. The bacteria belonging in the “Bell pepper” group generally had lower optimal doses (3 isolates were most inhibited at 31.25 μg/mL; 1 at 62.5 μg/mL; and 2 at 125 μg/mL). The bacteria belonging to the “Jalapeno” group had optimal doses at the medium capsaicin concentrations (2 isolates were most inhibited at 125 μg/mL and 1 at 250 μg/mL). The bacteria belonging to the “Habanero” group mostly had optimal doses around 125 μg/mL (5 isolates), with 2 isolates at 250 and 500 μg/mL, and 1 isolate at 31.25 μg/mL. The distribution of optimal capsaicin dose did not significantly differ with pepper type, according to Fisher’s exact test.

3.3. Growth Promotion Trait Testing

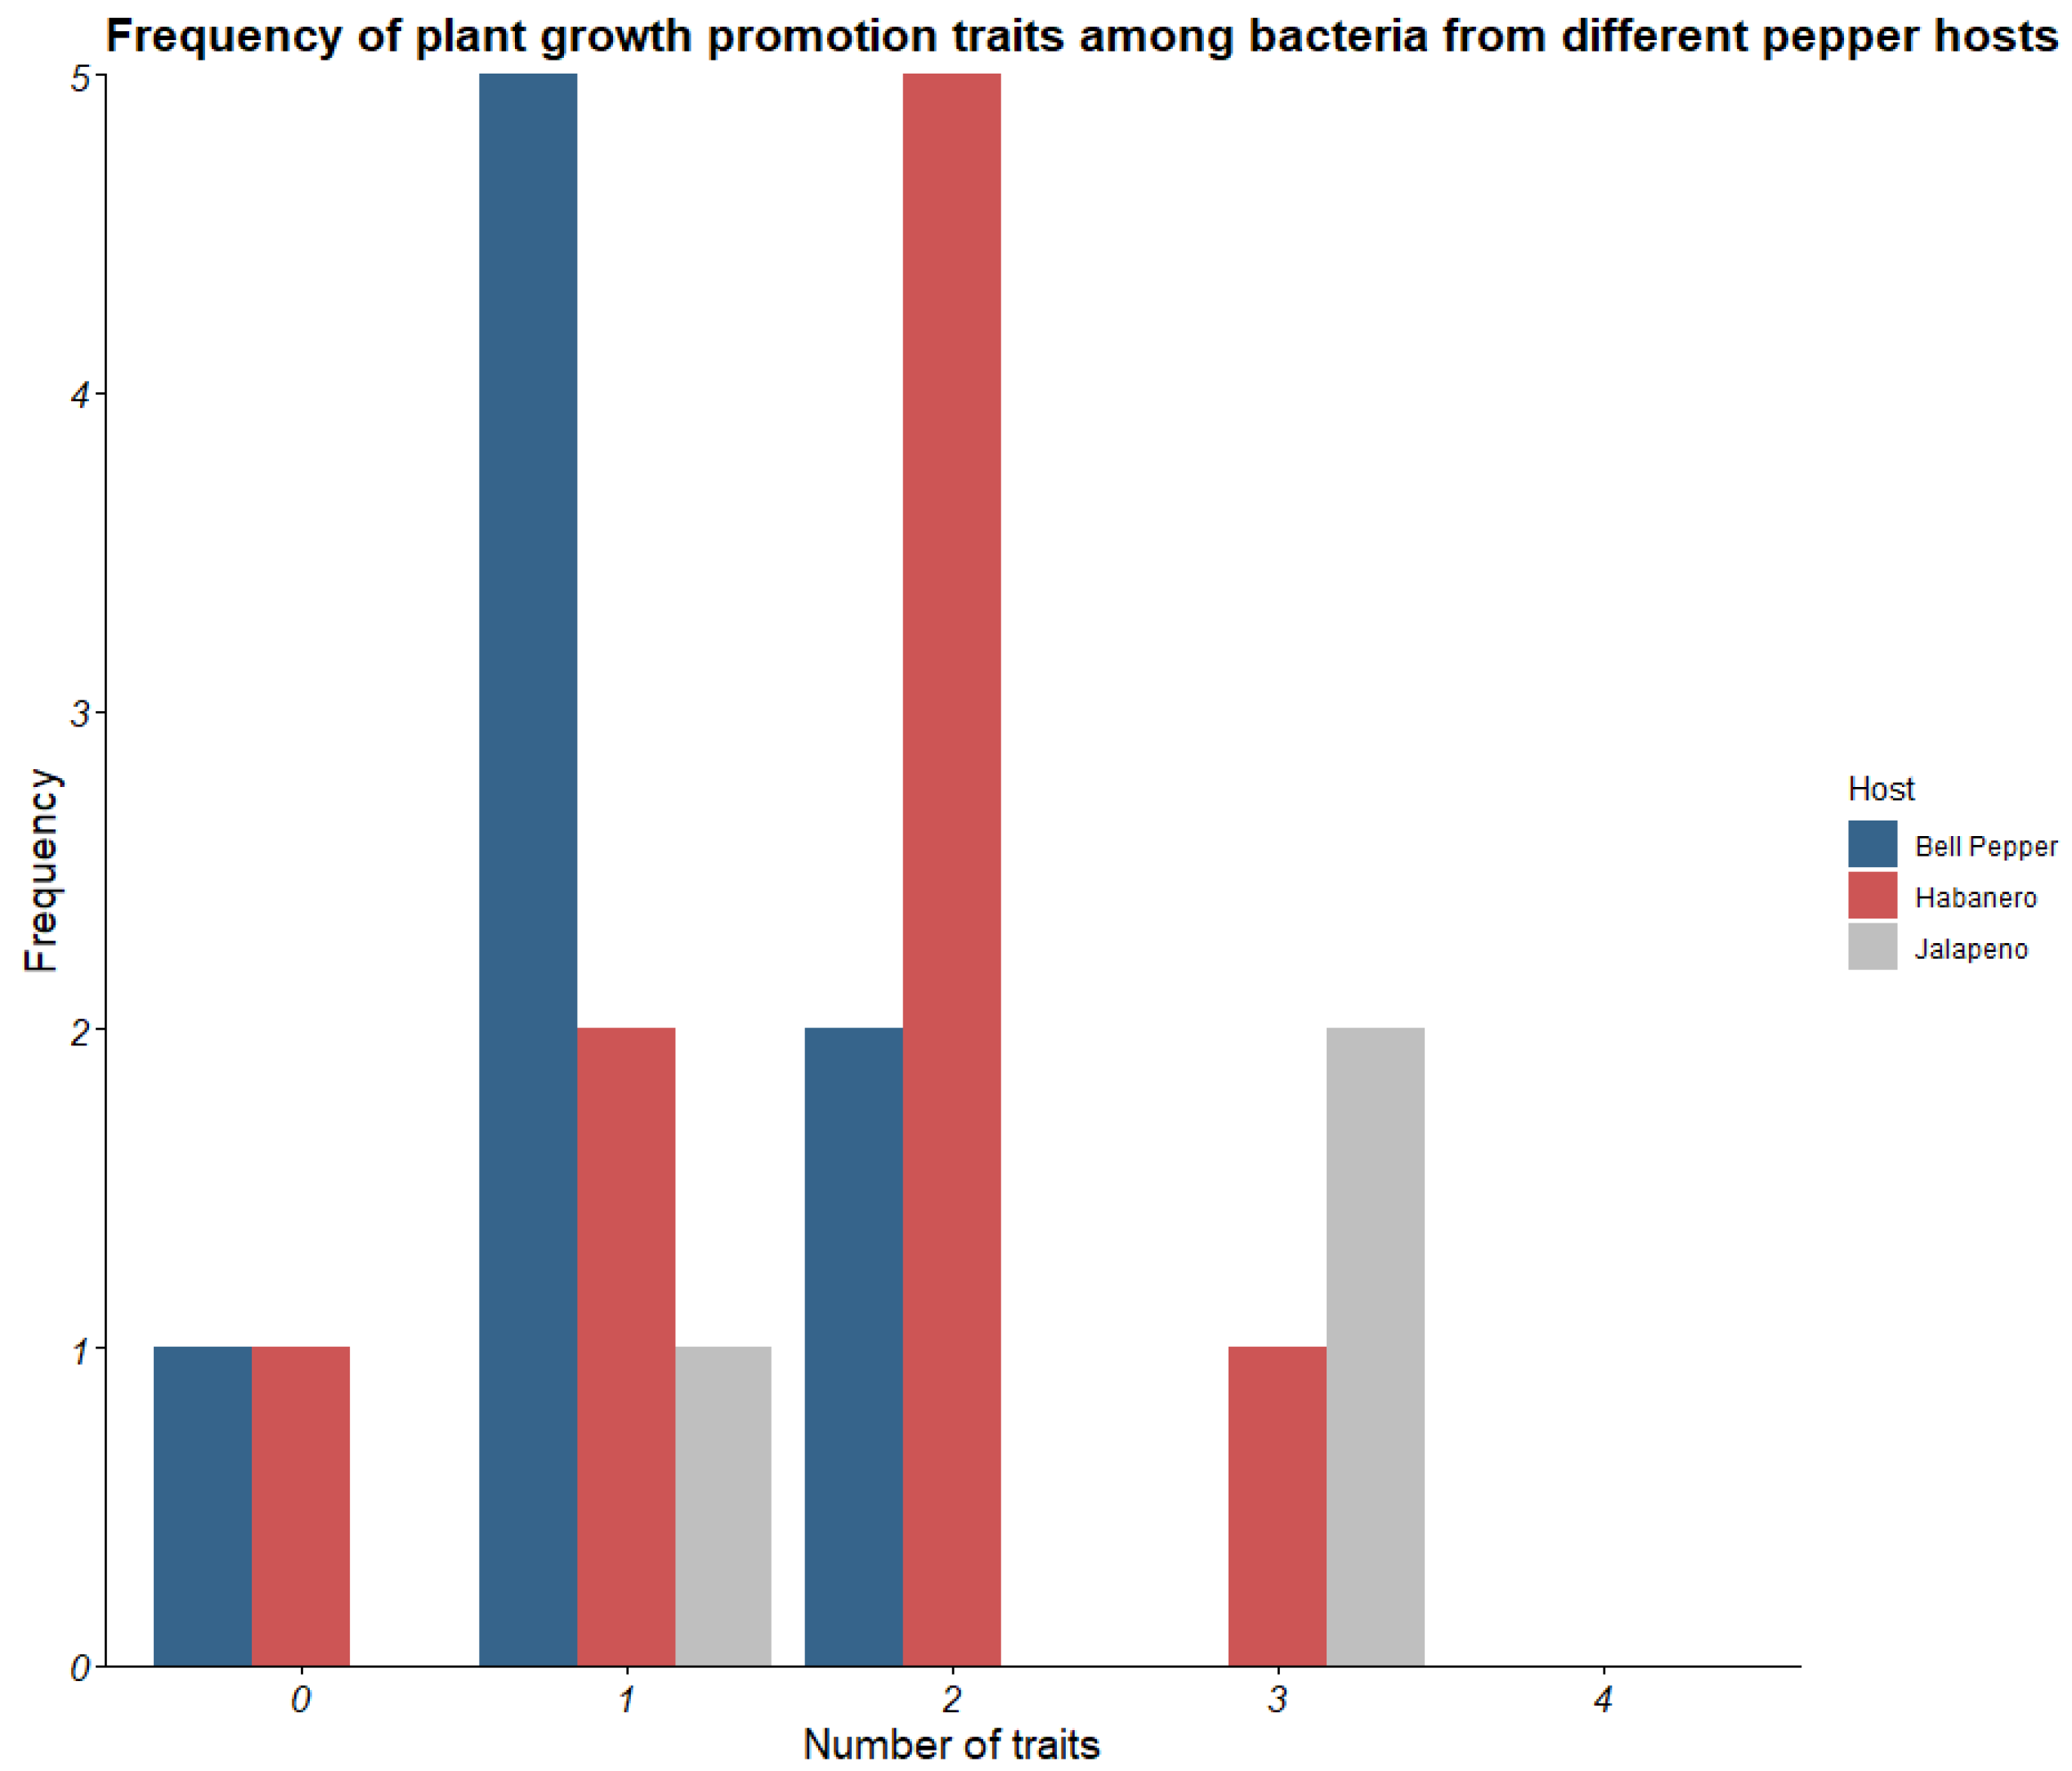
Growth promotion traits tested in the first phase include phosphate solubilization (of which 3 bacteria were positive); potassium solubilization (of which 9 bacteria were positive); protease activity (of which 15 bacteria were positive); and IAA production (of which 4 bacteria were positive). Table 4 shows recovered bacterial isolates and whether they tested positive (+) or negative (−) for each growth promotion trait. The distribution of growth promotion traits did not significantly differ with pepper type, according to Fisher’s exact test (Figure A2).

3.4. Choosing the Best Bacteria: Additional Tests and Identification

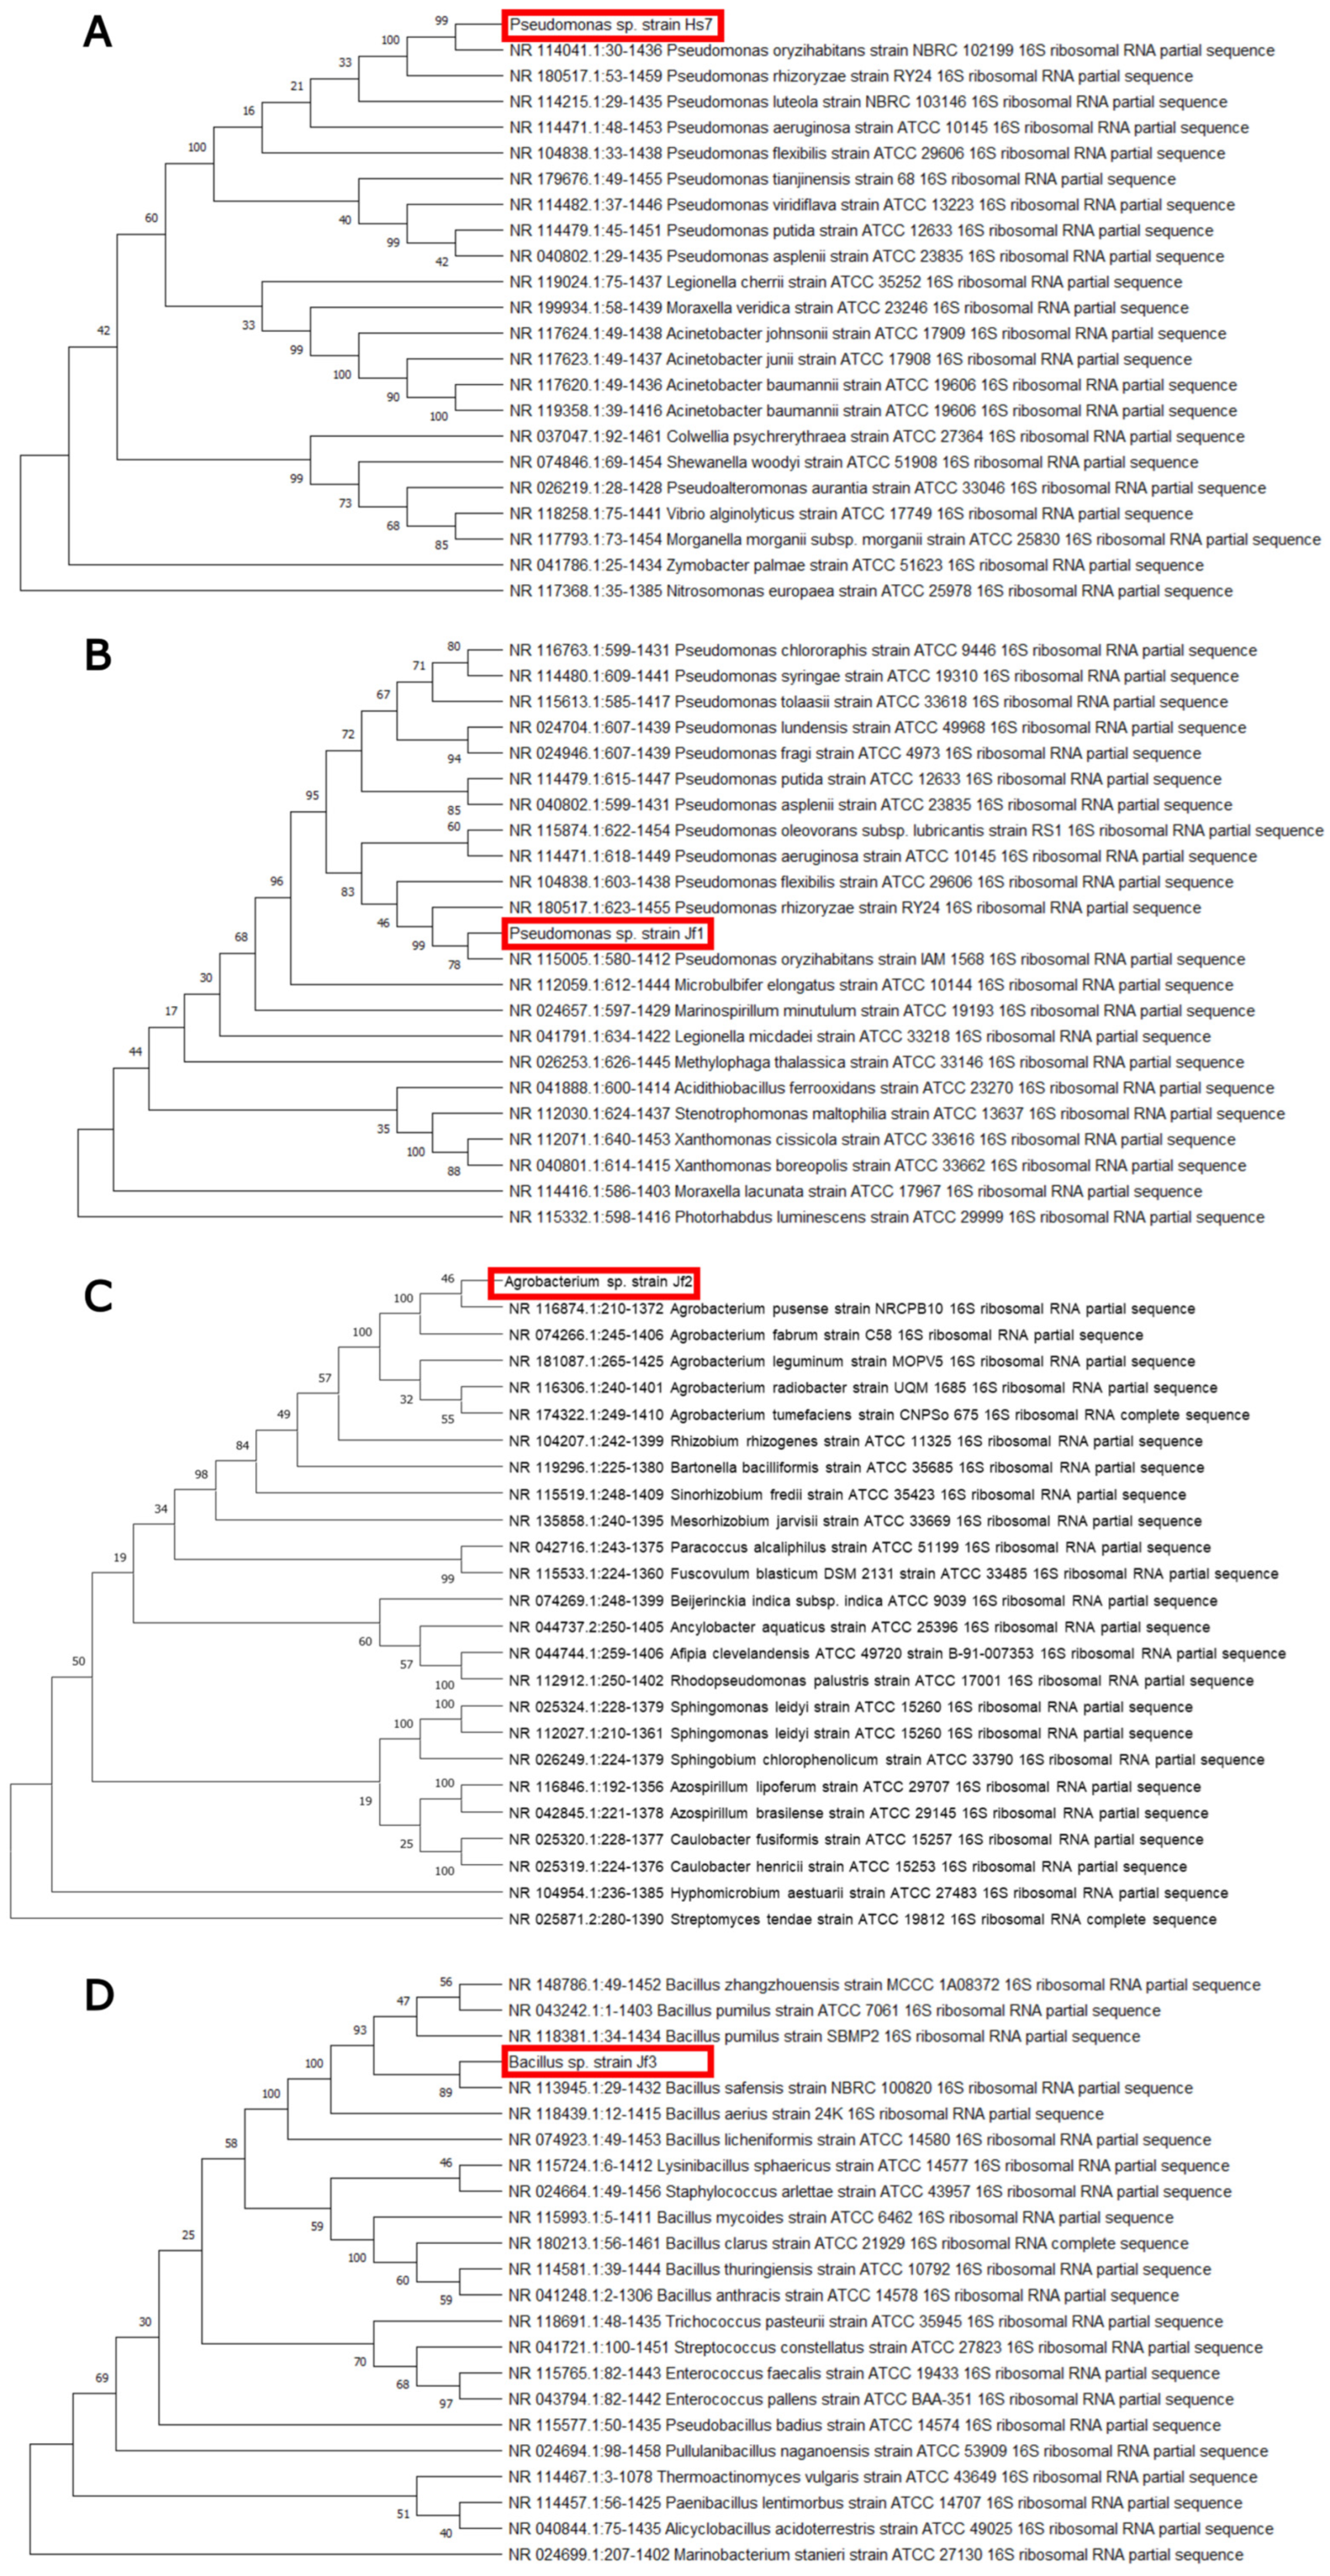
Based on growth promotion traits, we narrowed down our list of prospective PGPB to four (Table 5). Jf1, Jf2, and Jf3 were isolated from jalapeno fruit flesh, while Hs7 was isolated from habanero seeds. Jf1 and Hs7 were able to solubilize phosphate and potassium and produced IAA at a rate of 220 and 202 μg/mL, respectively. Jf2 was only capable of producing IAA at a rate of 263 μg/mL. Jf3 could solubilize phosphate, produce proteases, and produce IAA at a rate of 132 μg/mL. These four isolates were identified by 16S rRNA sequencing and ML phylogenetic tree construction to belong to the genera Pseudomonas (Jf1 and Hs7), Agrobacterium (Jf2), and Bacillus (Jf3). These results are shown in Figure 3.
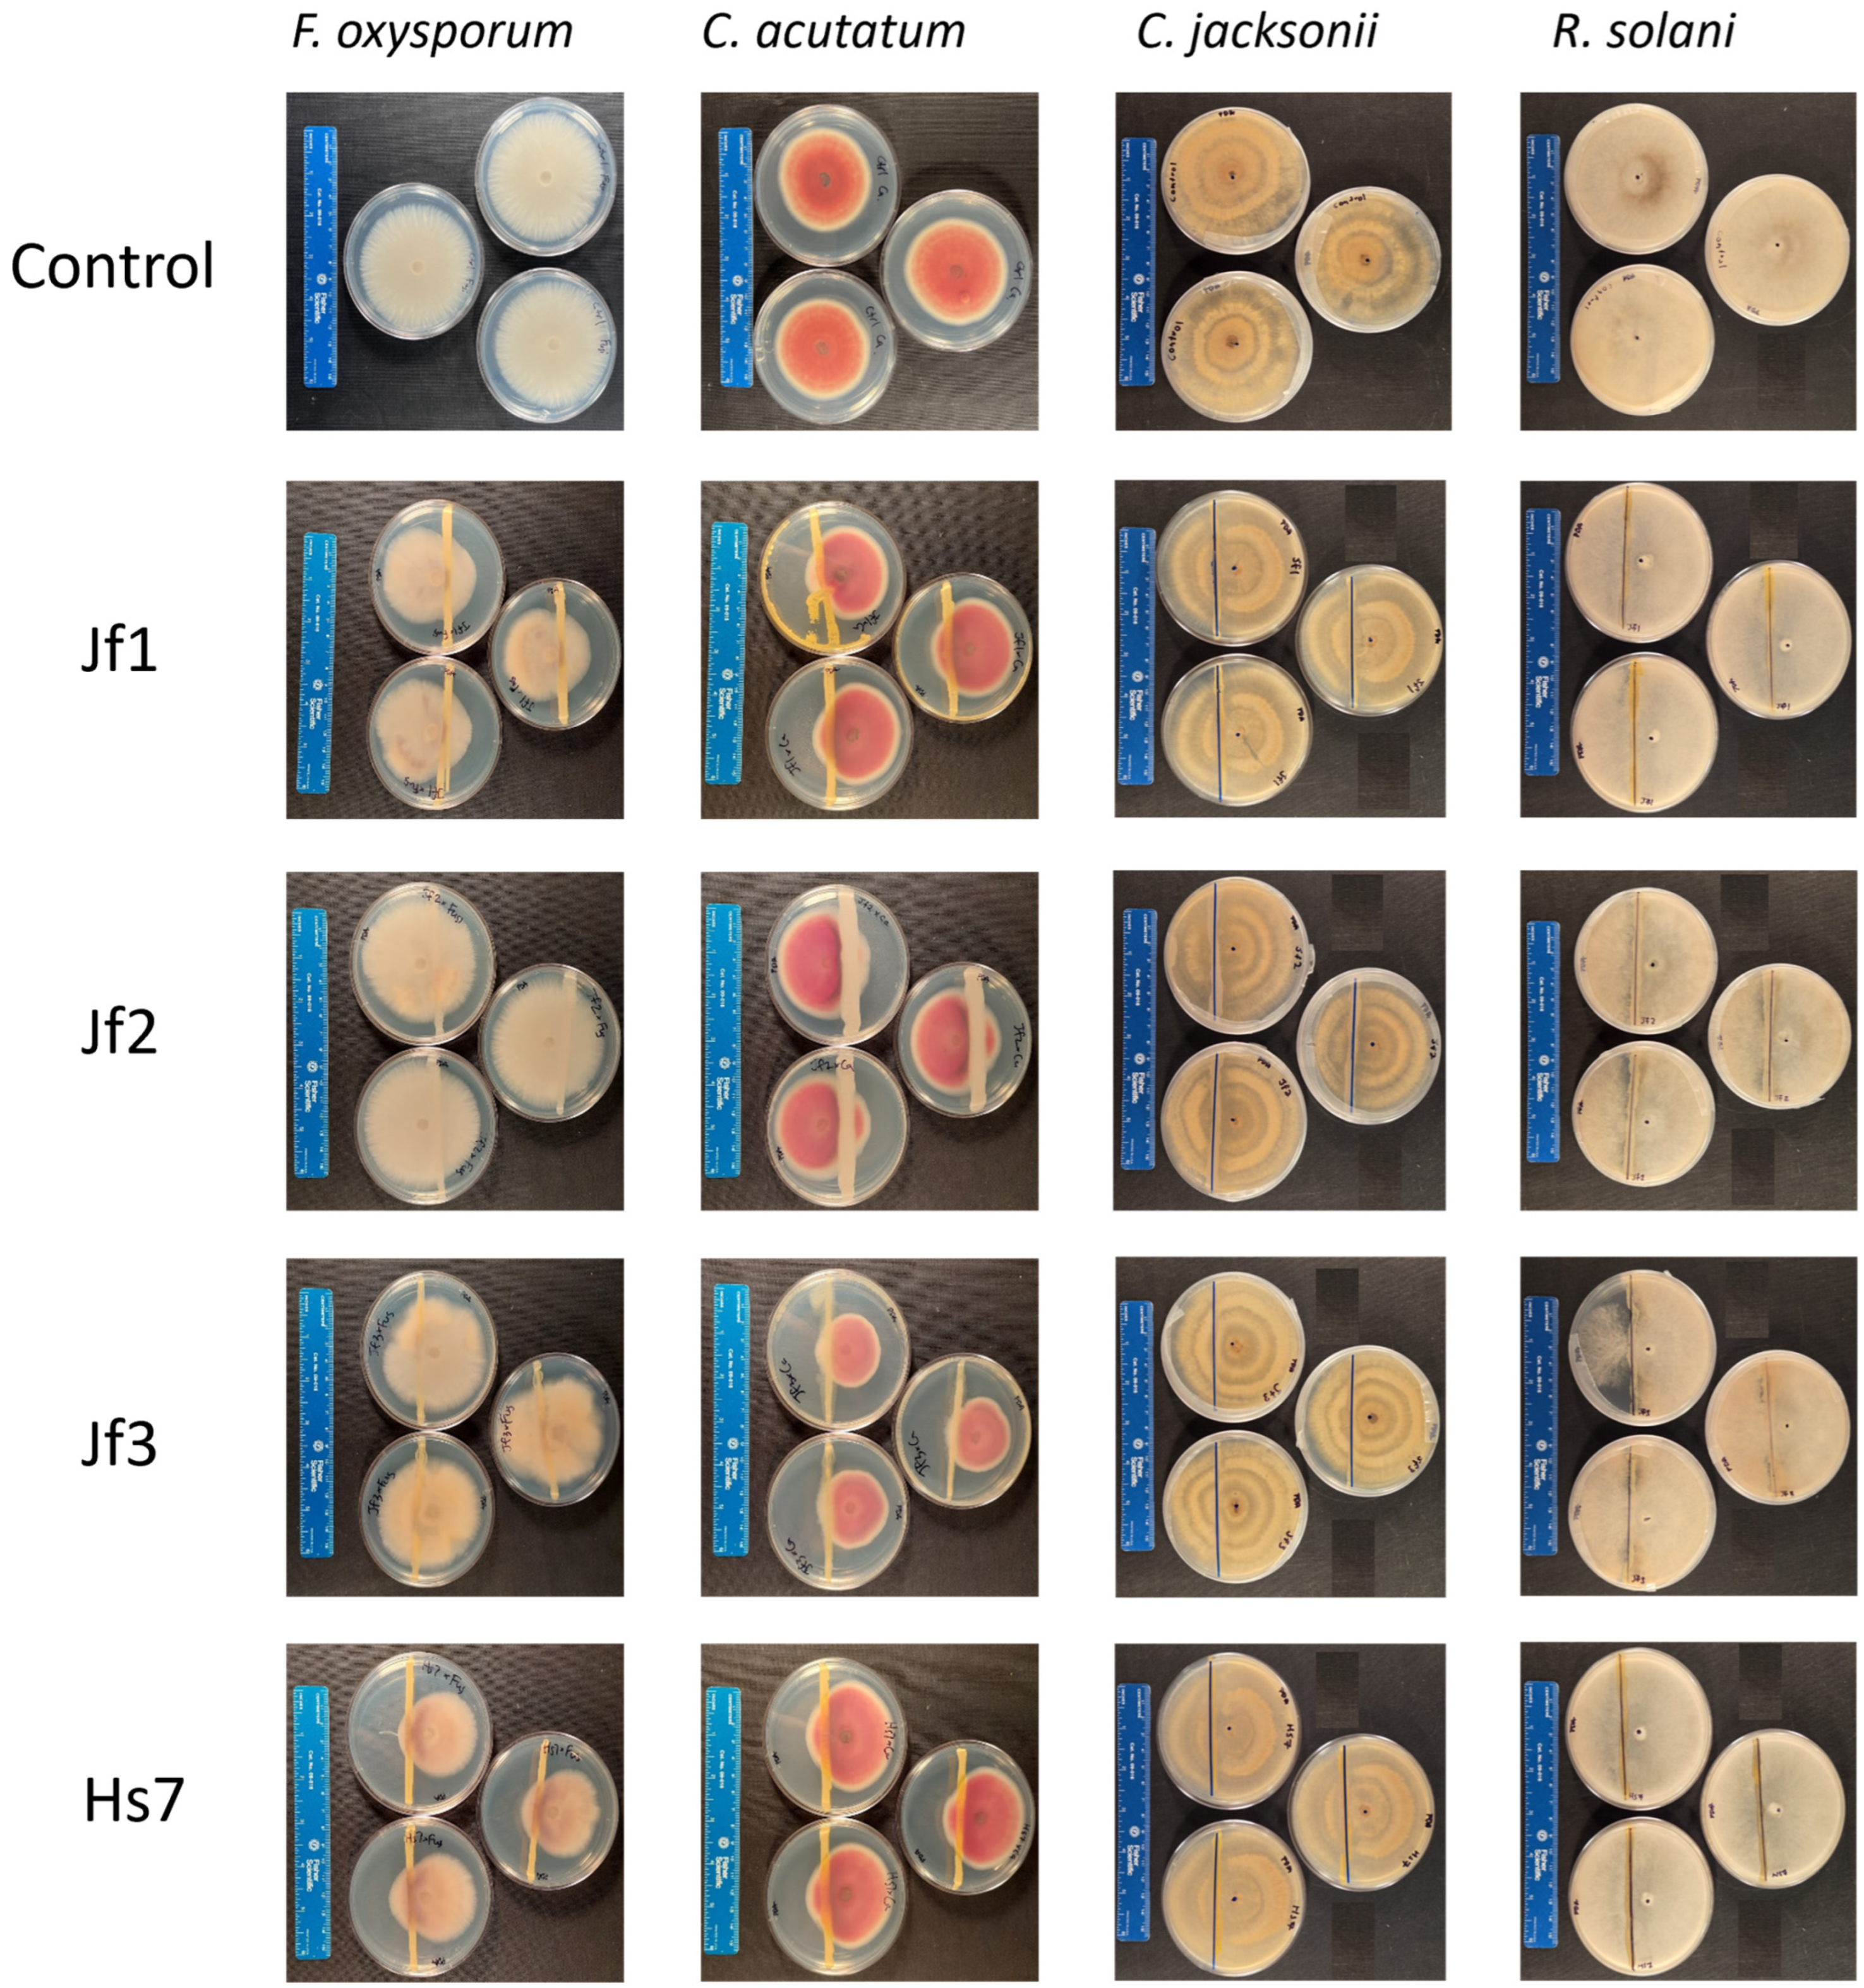
Additional tests were performed to assess urease activity and siderophore production. All four isolates tested positive for urease activity, and all four tested negative for siderophore production (Table 5). These four isolates were also tested for inhibition against F. oxysporum f. sp. lycopersici, C. acutatum, R. solani, and C. jacksonii. Percent radial inhibition of F. oxysporum f. sp. lycopersici was greatest for Hs7 and Jf1, at 37.61% and 28.44%, respectively; and lowest for Jf2 (5.50%) and Jf3 (no measurable inhibition). For C. acutatum, Jf3 effected the greatest radial inhibition at 30.59%; Jf1, Hs7, and Jf2 resulted in 14.12%, 11.76%, and no measurable inhibition, respectively. None of the isolates showed any inhibitory effect on R. solani and C. jacksonii (Table 5). Photographs of the dual culture tests were taken after 7 days of growth (Figure A3).

3.5. Growth Promotion Testing in Inoculation Experiments

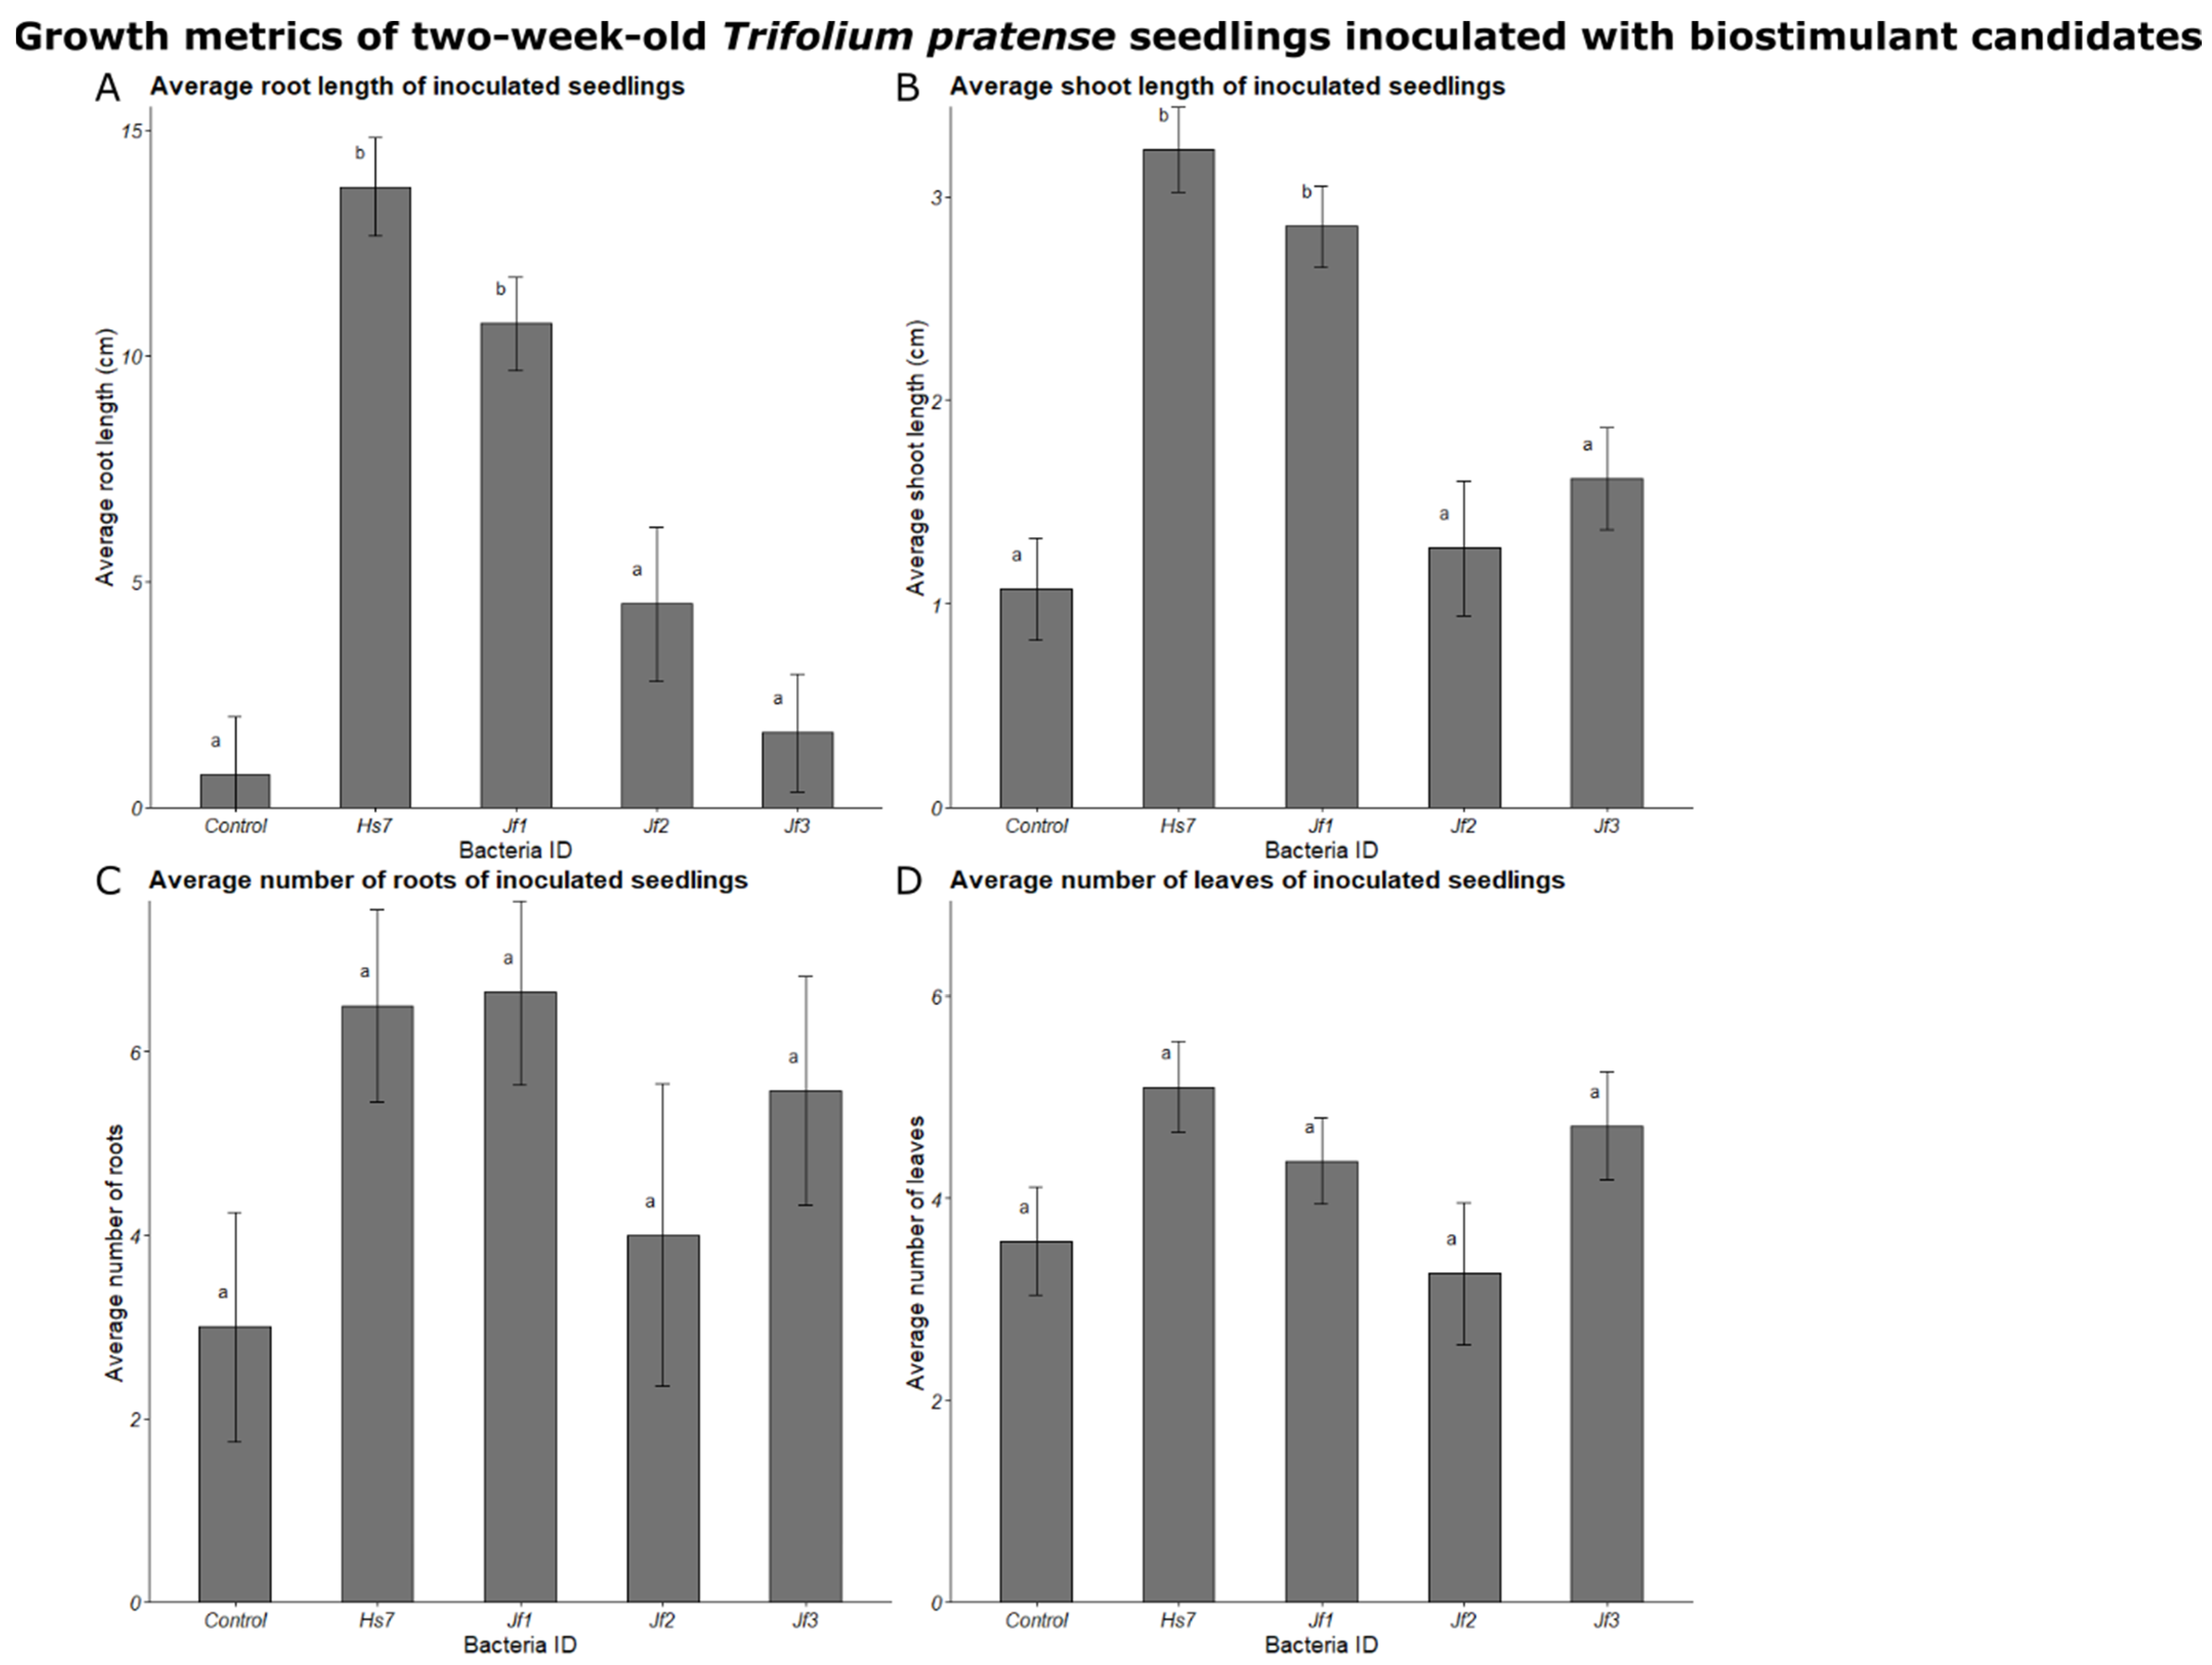
The isolates Jf1, Jf2, Jf3, and Hs7 were used in inoculation experiments on T. pratense and P. pratensis seeds, due to the ease with which they can be surface-sterilized. The growth parameters measured—root length, shoot length, number of roots, and number of leaves—are shown in Figure 4. T. pratense seedlings responded to inoculation through differences in root length (Figure 4A) and shoot length (Figure 4B). Both Jf1 and Hs7 significantly increased both root and shoot length compared to control, while Jf2 and Jf3 showed a nonsignificant increase. The number of leaves (Figure 4C) and roots (Figure 4D) were not significantly impacted.
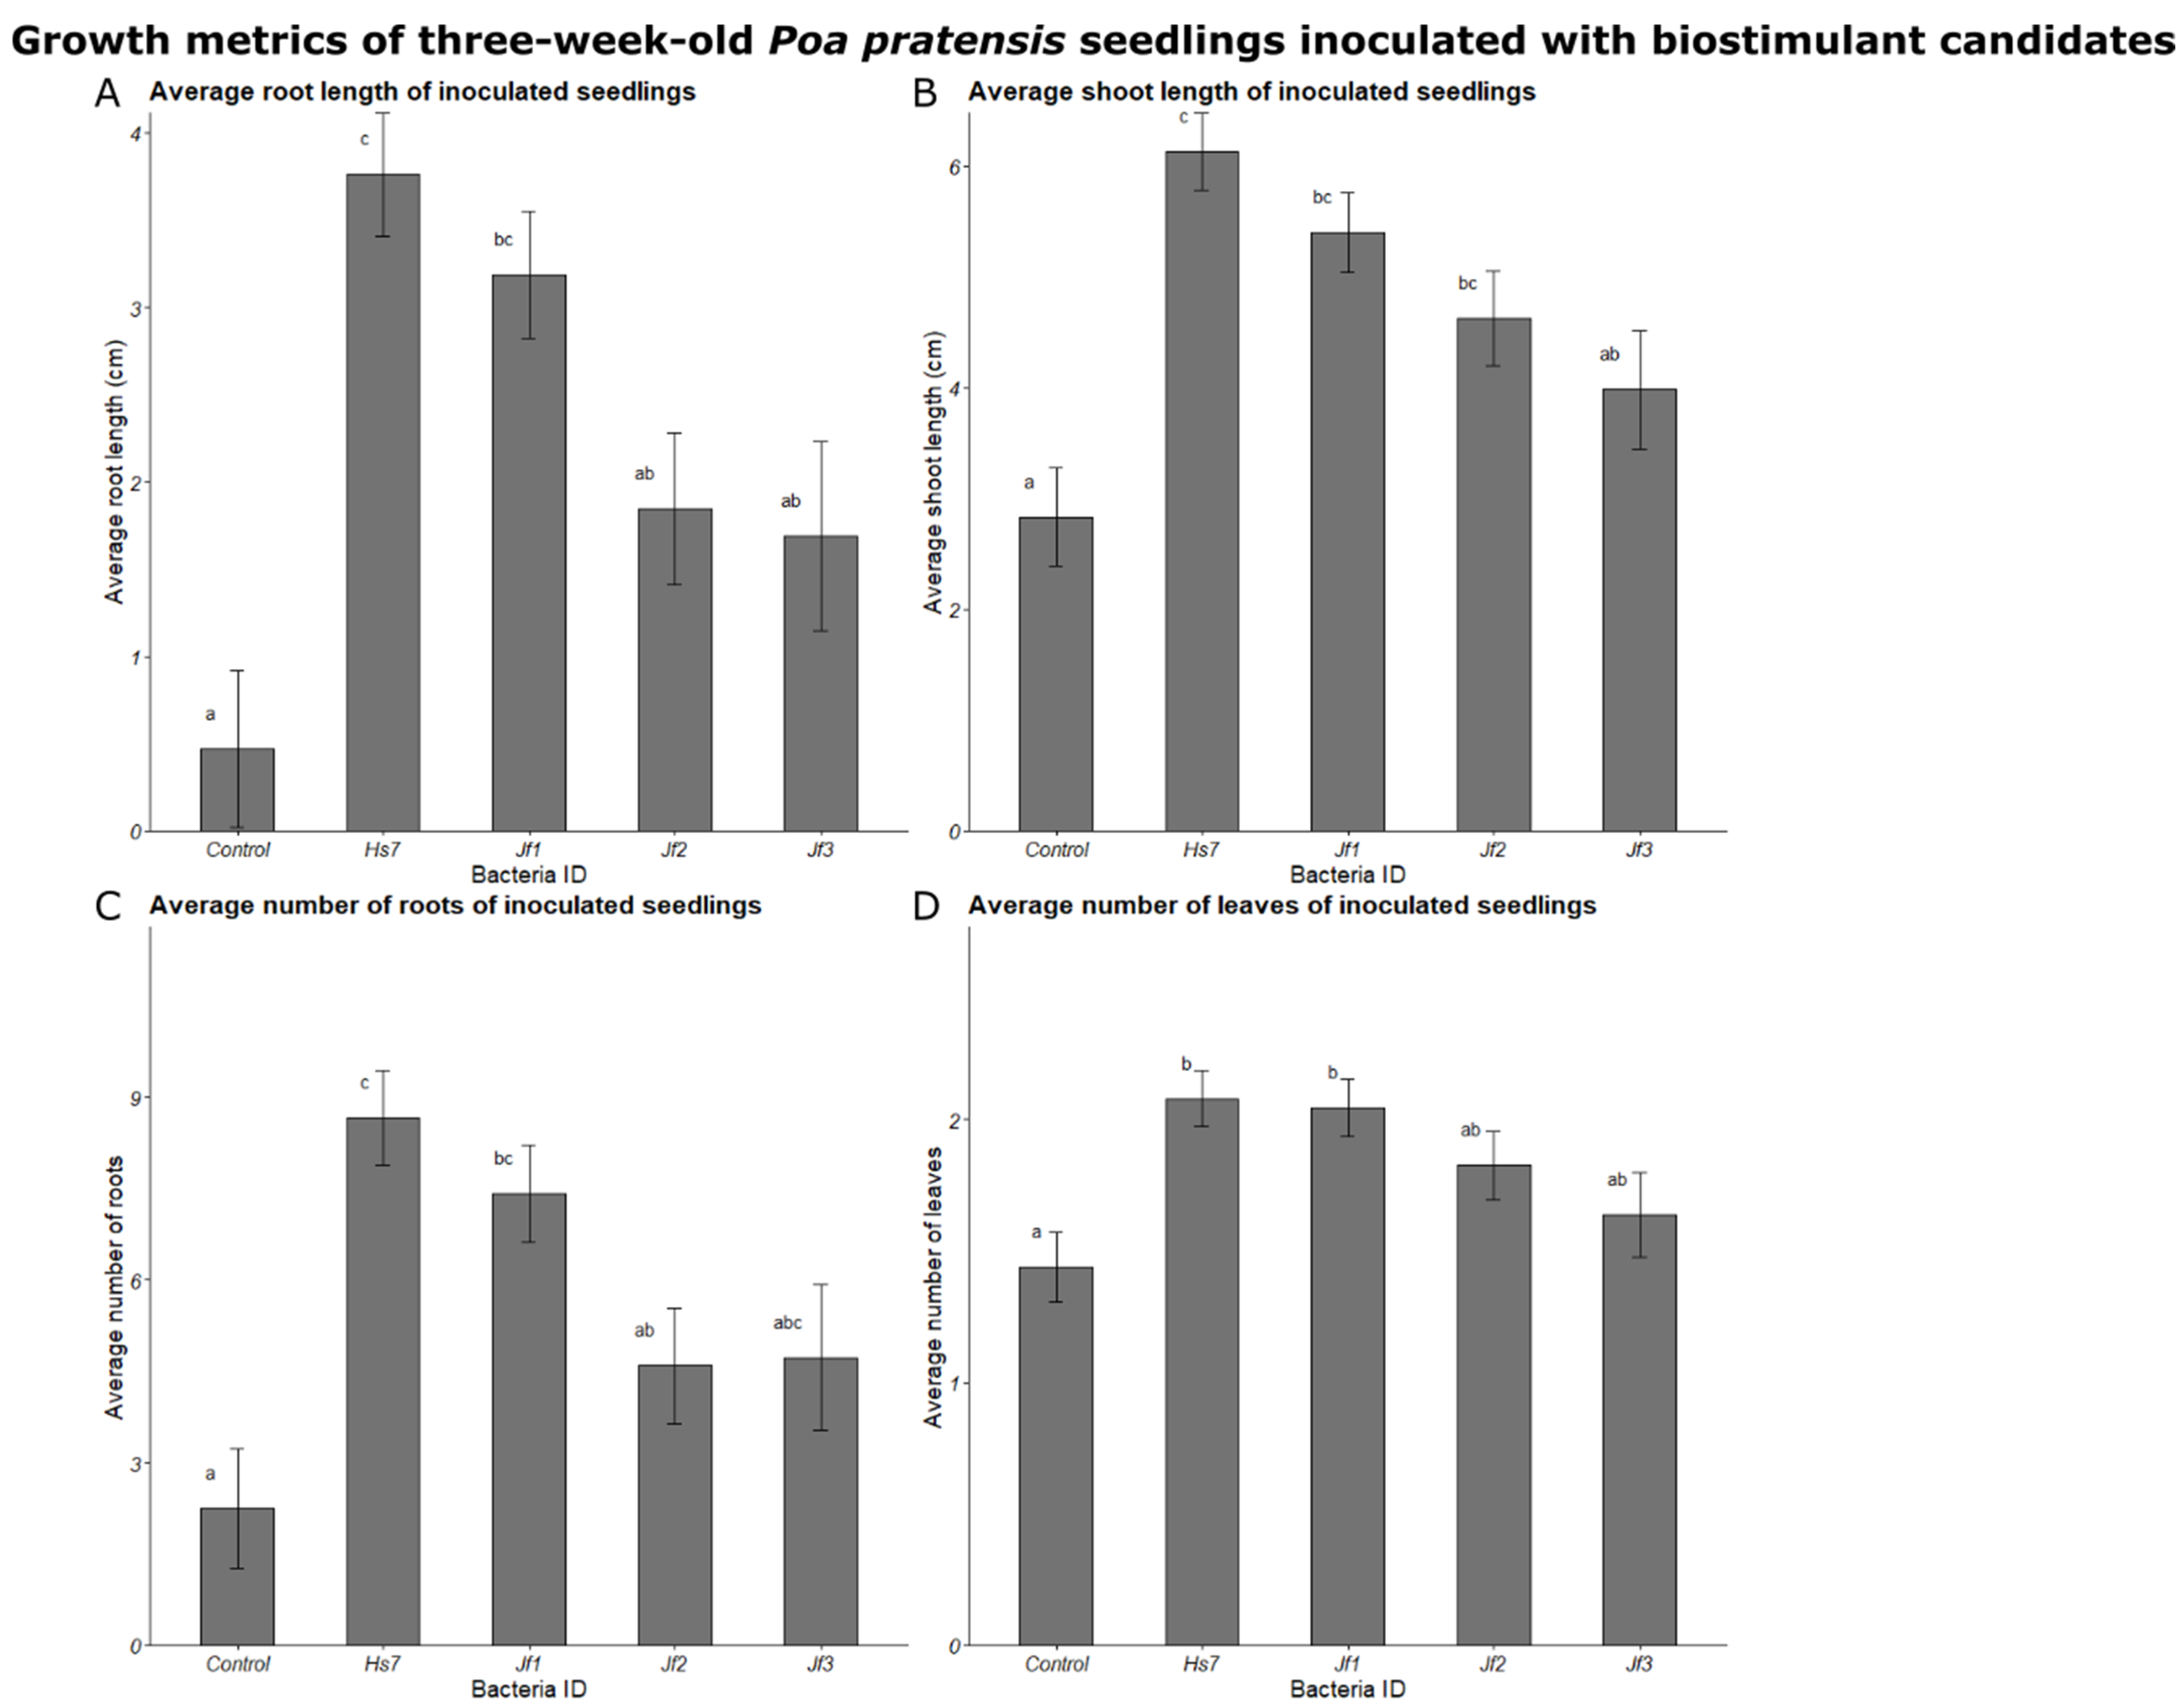
The same four isolates were used in inoculation experiments on P. pratensis seeds. P. pratensis seedlings responded to inoculation primarily through differences in root length (Figure 5A) and shoot length (Figure 5B). Jf1 and Hs7 significantly increased both root length compared to control. Jf1, Jf2, and Hs7 significantly increased shoot length compared to control. Additionally, Jf1 and Hs7 significantly increased the average number of seedling roots (Figure 5C) and leaves (Figure 5D).
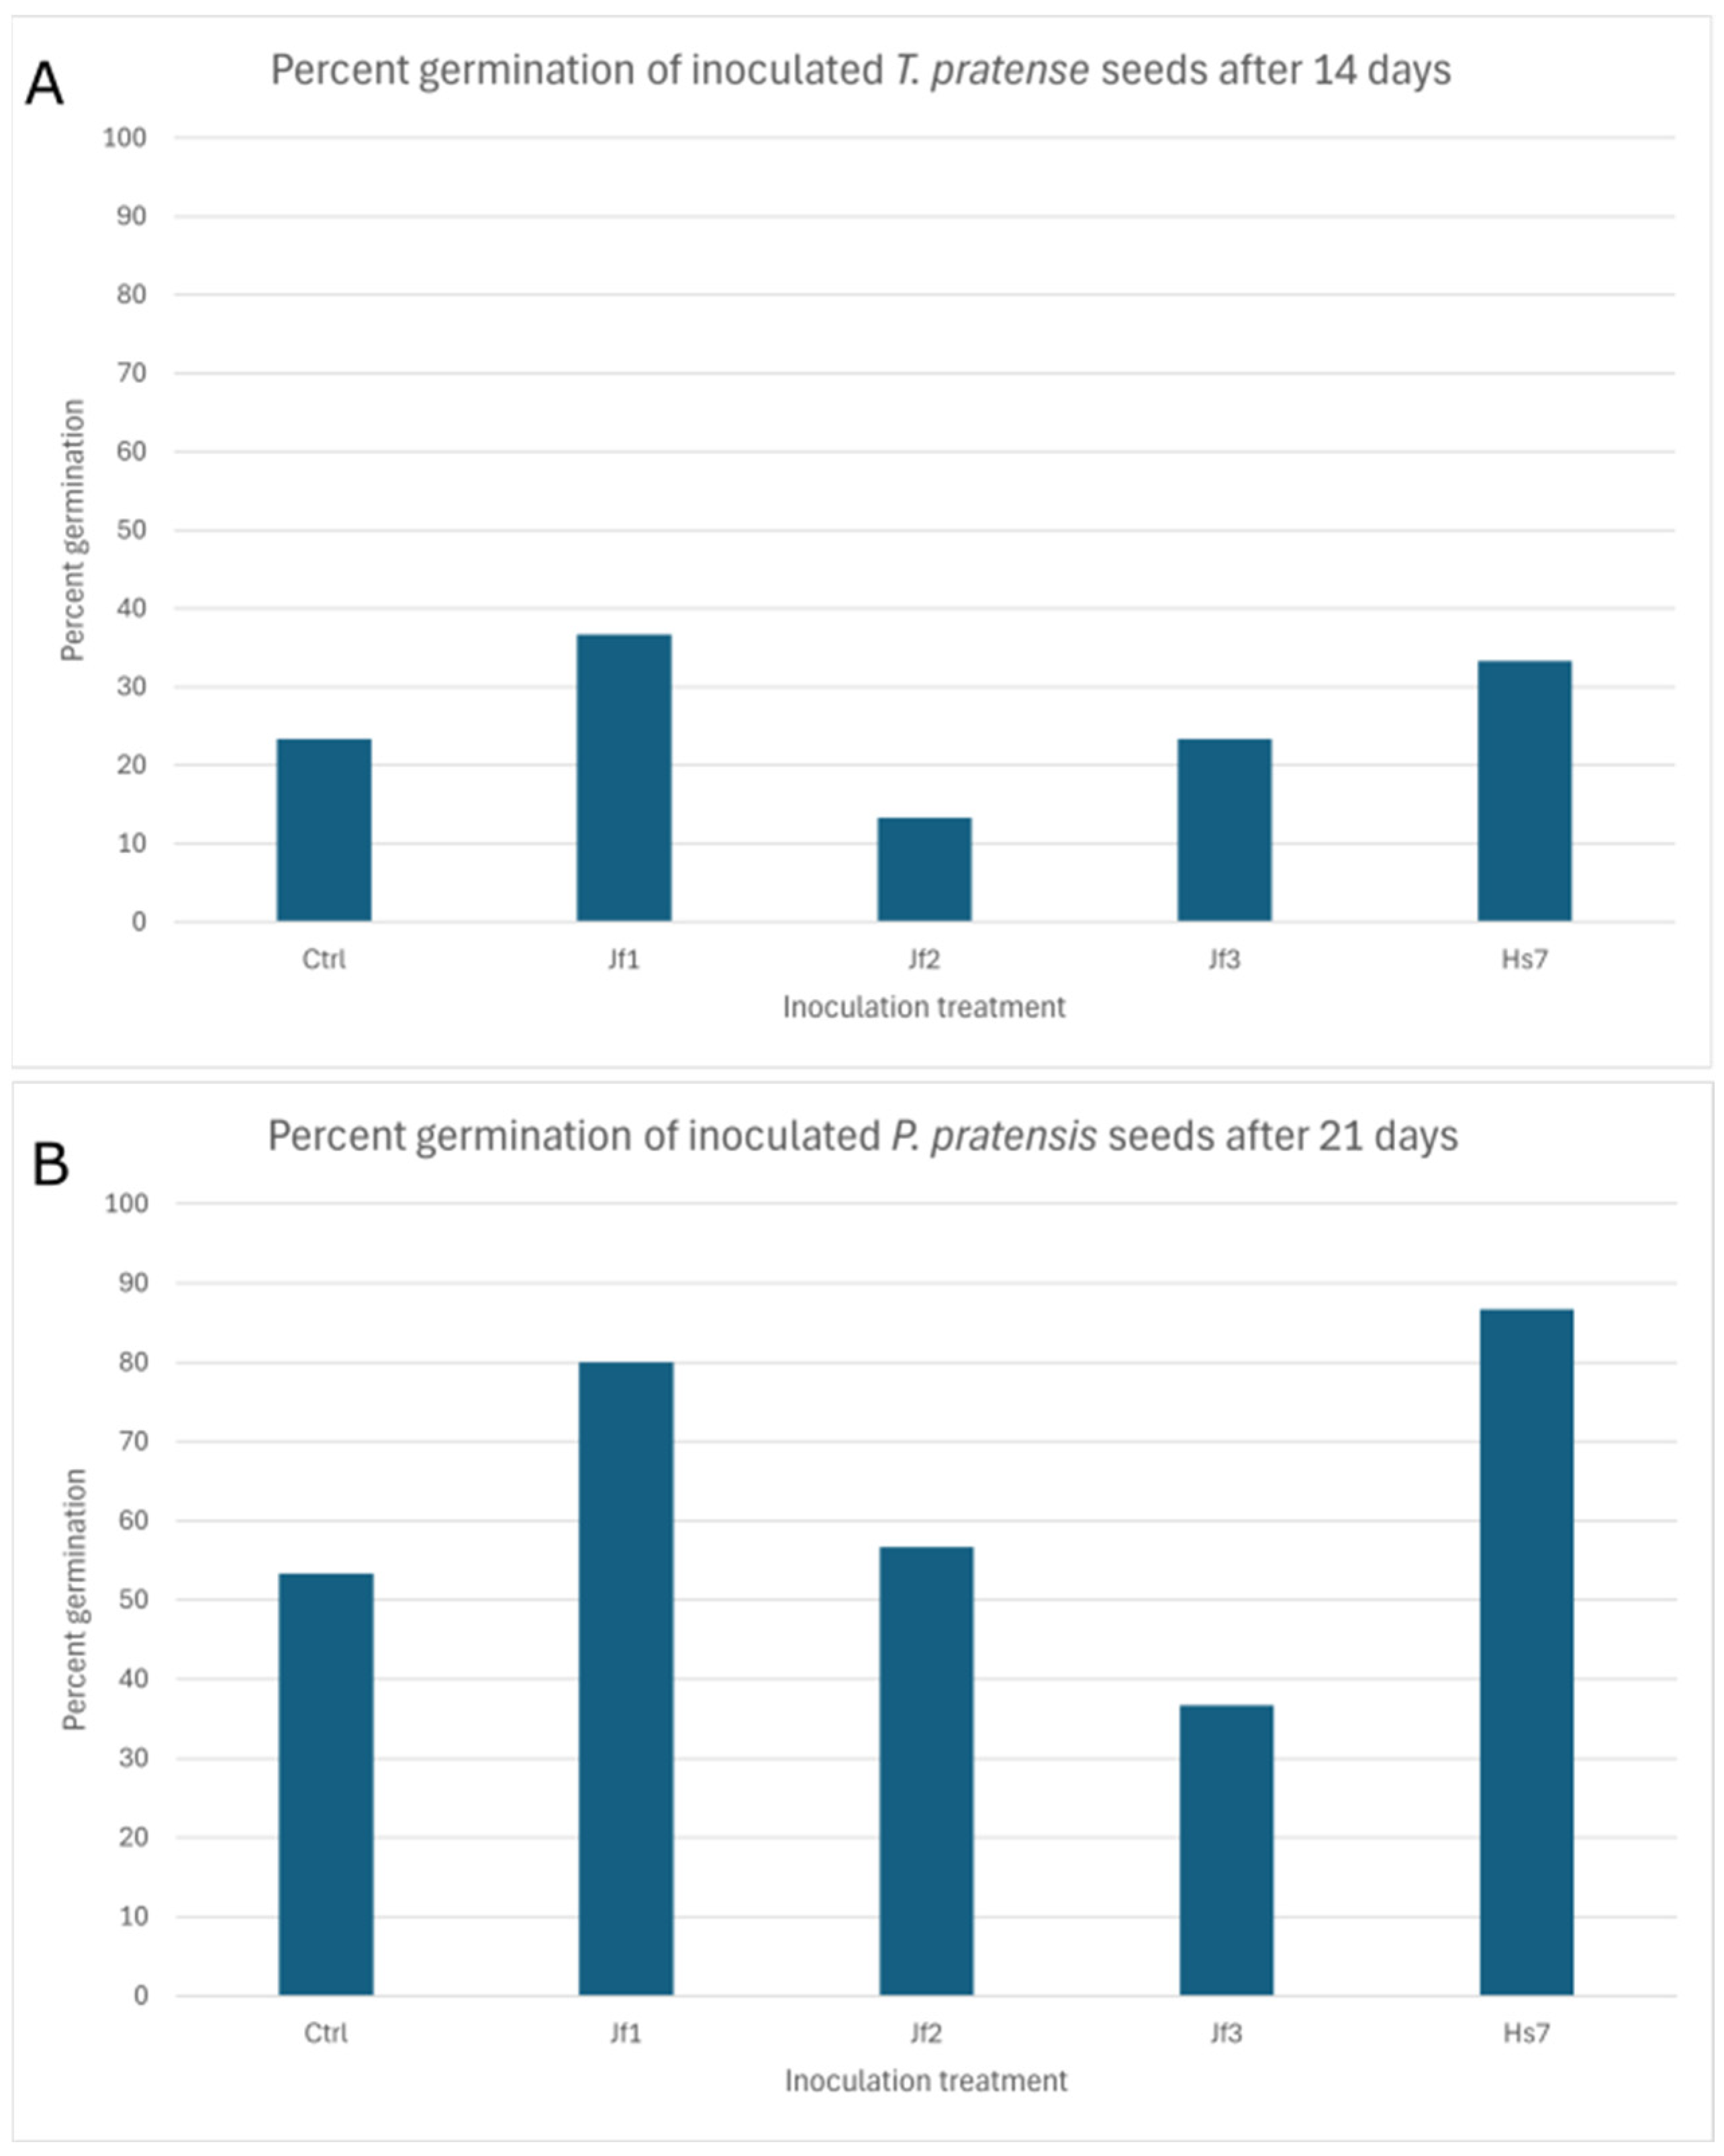
Germination was qualitatively assessed at the end of both experiments and is shown in Figure A4. For T. pratense, the percentage of seeds germinated by the end of the experiment was 23.33% for both the control group and the Jf3-inoculated treatment (Figure A4A). Inoculation with Hs7 and Jf1 slightly increased germination to 33.33% and 36.67%, respectively; inoculation with Jf2 decreased germination to 13.33%. For P. pratensis, the percentage of seeds germinated by the end of the experiment was 53.33% for the control group; 80% for the Jf1 treatment; 56.67% for the Jf2 treatment; 36.67% for the Jf3 treatment; and 86.67% for the Hs7 treatment (Figure A4B).

4. Discussion

HPLC-UV determination of capsaicin confirmed our bell, jalapeno, and habanero pepper samples to have capsaicin concentrations relatively consistent with those found in the literature (Table 1) [53,54,55].
Our isolations resulted in 8 morphologically distinct bacteria from bell pepper fruit flesh and seeds; 9 from habanero fruit flesh and seeds; and 3 from jalapeno fruit flesh only (Table 4). We had hypothesized that increasing capsaicin would reduce the amount of culturable bacteria, due to its antibiotic effects. Specifically, we expected bell pepper to yield the lowest diversity of culturable bacteria on capsaicin-infused media, since that variety does not contain capsaicin. However, our results showed that bell pepper yielded more distinct bacteria than did jalapeno, which has comparatively higher capsaicin. There may be several possible explanations for this finding. The general consensus in the literature is that there is no clear correlation between the diversity and richness of culturable bacteria, compared to unculturable bacteria [56,57,58]. Although our findings suggest jalapeno fruits and seeds to be lower in culturable microbial diversity compared to bell pepper, this is likely an imperfect picture of the true microbiome. Studies on Capsicum annuum varieties using 16S metabarcoding found increasing capsaicinoid content to correlate with microbial diversity in fruits and roots [59,60].
Each group of culturable bacteria boasted different growth promotion traits, including phosphate solubilization, potassium solubilization, protease activity, and IAA production (Table 4). Generally, jalapeno and habanero isolates tested for a higher number of positive traits than did bell pepper isolates, though given the small sample size (8 bell pepper isolates, 3 jalapeno isolates, and 9 habanero isolates), a statistically significant difference could not be determined by Fisher’s exact test (Figure A2).
Broth microdilution assays did not reveal any of our 20 isolates to be fully inhibited by capsaicin at concentrations up to 500 μg/mL (Table 3). Maximum inhibition among all isolates ranged from 1% to 60% reduction in growth, compared to the growth control well which contained no capsaicin. Maximum growth reductions in response to capsaicin did not significantly vary among bacteria from the different pepper varieties (Figure 2A). The growth of one habanero isolate, Hs1, was observed to be stimulated by capsaicin. We also tested additional bacterial isolates from mint (Mint1 and Mint2) and tomato (Tomato1 and Tomato2), finding that both mint isolates were relatively insensitive to capsaicin and both tomato isolates were strongly inhibited by it (Table 3).
In the literature, bacteria of different strains have been shown to have widely variable responses to capsaicin, ranging from complete inhibition to relative insensitivity to the compound [17,19,31]. The fact that none of our isolates were greatly inhibited by capsaicin, even at high doses, suggests that bacteria associated with the fruits of all 3 pepper varieties have some degree of resistance. We cannot, however, claim that bacteria from peppers are uniquely resistant to capsaicin, as both of the mint isolates (Mint1 and Mint2) were also highly resistant. The tested tomato isolates (Tomato1 and Tomato2), on the other hand, had low MICs at 62.5 and 125 μg/mL, respectively. This outcome suggests that the capsaicin resistance of plant-associated bacteria is distributed rather stochastically among different host species. When considering only the three pepper varieties, the optimal capsaicin dose that elicits the greatest reduction in growth is distributed stochastically as well (Figure 2B). Though there were more bell pepper bacteria with an optimal capsaicin dose at 31.25 μg/mL and more habanero bacteria with optimal capsaicin doses of 250 and 500 μg/mL, this observed difference in distribution is not statistically significant, when tested with Fisher’s exact test (Figure 2B).
Our broth microdilution test for capsaicin resistance thus does not support the idea that bacteria isolated from peppers of different pungency levels will have different levels of resistance to capsaicin. This outcome is consistent with the anatomical distribution of capsaicin, which is concentrated primarily in placental tissue rather than within the seeds themselves [25]. Therefore, seed-associated microbes may not be exposed to selective pressures related to capsaicin concentration. Although the placenta serves as a pathway for the transfer of nutrients and water to the developing seed, the internal seed environment itself may be adequately protected from any possible antimicrobial effects of capsaicin. Thus, bacteria that inhabit the internal seed environment may not have evolved in the presence of capsaicin and therefore may not have experienced the selective pressure to adapt capsaicin resistance.
It should be noted that the pungency of peppers is also influenced by dihydrocapsaicin and nordihydrocapsaicin, which similarly have antibacterial properties [23]. Dihydrocapsaicin, specifically has been shown to have much lower MIC values for Gram-positive bacteria [23]. Future studies that seek to further clarify the relationship between host pepper pungency and the capsaicinoid resistance of their culturable bacteria should evaluate the role of dihydrocapsaicin and nordihydrocapsaicin as well.
In short, our initial findings suggest that capsaicin levels of a host pepper are not a strong determinant of the capsaicin resistance or the growth-promotional potential of its isolated bacteria. A limitation of our study was the relatively low culturable microbial diversity of our pepper samples. Future studies that assess more Capsicum varieties may be useful in clarifying our findings.
Despite this, we isolated several growth-promoting bacteria. The four most promising candidates to develop as biostimulant bacteria are Jf1, Jf2, Jf3, and Hs7; these were identified by 16S rRNA sequencing to belong to the genera Pseudomonas, Agrobacterium, Bacillus, and Pseudomonas, respectively. These genera are commonly used as biostimulants for various crops [61,62,63,64]. These four isolates were chosen based on their IAA-producing ability and were additionally tested positive for urease production (Table 5). The radial inhibition of fungal pathogens by these isolates was variable but generally low; as such, the growth promotion ability of these isolates is likely not attributed to their antifungal activity.
Capsaicin, along with other capsaicinoids, has been tested in various in vivo and in vitro studies for antifungal capabilities, and has been shown to inhibit a multitude of fungal pathogens like Botrytis spp., Cladosporium spp., and—relevant to our study—Colletotrichum spp., Fusarium spp., and Rhizoctonia solani [65]. Though studies on efficacy are scarce, Capsicum plants could theoretically rely on these capsaicinoids for antifungal defense, especially in the fruit or seeds, which are embedded in capsaicin-rich placenta (for pungent varieties). In the literature, bacteria with biocontrol properties may produce various antifungal compounds, such as chitinases, phenazines, alkanes, hexanoic acid, polyketides, etc.; consequently, the host plant is aided by the reduction in pathogen virulence, while the host-associated bacteria can outcompete fungal pathogens [66,67,68]. However, in the absence of fungal pathogens, the production of these antifungal compounds represents a metabolic burden for the bacteria [69,70]. In the fruit environment, where pungent peppers produce copious capsaicinoids that could limit the load of fungal pathogens, host-associated bacteria may no longer need to produce antifungal compounds. This reasoning could explain why our isolated bacteria are not very potent biocontrol agents using our screening methods.
Due to their ease of surface-disinfection, T. pratense and P. pratensis were used as plant hosts to test the growth promotion ability of the biostimulant candidates. Additionally, these two plant species represent a dicot and monocot evolutionary history, respectively. Our isolates Jf1 and Hs7 showed the most promise as plant growth promoting bacteria, being able to significantly promote growth for both tested plant hosts. Figure 4 shows the growth improvements for T. pratense, and Figure 5 shows the growth improvements for P. pratensis. Jf1 and Hs7 increased germination rates slightly for T. pratense, and greatly for P. pratensis (Figure A4), though we were unable to statistically test this. Jf1 and Hs7 also significantly increased root and shoot length for both hosts (Figure 2A,B and Figure 3A,B), and significantly increased the number of roots and leaves of P. pratensis (Figure 3C,D). The increase in growth may be due to the production of IAA. As one of the principal auxin compounds, IAA plays an important role in regulating cell growth and division at apical meristems [9,38]. IAA-producing bacteria have been shown in various studies to improve plant root and shoot growth [71,72,73]. Interestingly, the isolates Jf2 and Jf3, while also producing IAA, were not able to significantly increase root and shoot length for both plant hosts to the same degree (Figure 2B, Figure 3A,B and Figure 4A). This finding may be explained by the observation in the literature that plants have an optimal amount of supplemental IAA; perhaps the amounts produced by Jf1 and Hs7 are closer to the optimum for T. pratense and P. pratensis, thoμgh more research is needed to determine the optimal IAA concentration [36,38].
Other possible traits of Jf1 and Hs7 that may have contributed to growth promotion are their ability to solubilize potassium and phosphate (Table 4). Our inoculation experiments were carried out in magenta boxes containing PRO-MIX®® BX, a potting mix based on 75–85% sphagnum peat moss. Sphagnum peat moss is an organic material often used as a supplement to potting mix, it contains mostly organic forms of nitrogen, phosphorus, and potassium, but also has lower amounts of inorganic, plant-accessible nutrients [74,75]. In our growth promotion experiments, sphagnum peat moss was the sole component of the growing media; any bacterial ability for phosphate and potassium solubilization may have improved the plant-accessibility of the organic nutrients and contributed to the improved growth of the host, while the non-inoculated plants could only rely on the inorganic, accessible nutrients. On the other hand, traits like siderophore production and protease activity did not contribute to growth improvements in our study.

5. Conclusions

We assessed three pepper varieties and found that increasing pungency levels did not correlate with the capsaicin resistance nor the number of growth-promotional traits of the isolated bacterial members, suggesting that capsaicin alone may not be a strong determinant of bacterial host specificity or growth-promotional potential. However, several isolates demonstrated strong plant growth–promoting traits, including IAA production and phosphate solubilization. In particular, two Pseudomonas isolates significantly enhanced seedling growth in both Trifolium pratense and Poa pratensis. These findings indicate the potential for these isolates to function across multiple plant hosts; however, further testing is needed to evaluate their effectiveness in additional crop species.

Author Contributions

Conceptualization, P.C., K.Z.W. and K.L.K.; methodology, P.C., K.Z.W. and K.L.K.; formal analysis, P.C. and K.Z.W.; investigation, P.C., K.Z.W., K.L.K., S.L. and F.V.; writing—original draft preparation, P.C.; writing—review and editing, K.Z.W., K.L.K., S.L., F.V. and J.F.W.; visualization, P.C.; supervision, J.F.W. All authors have read and agreed to the published version of the manuscript.

Funding

This research received no external funding.

Institutional Review Board Statement

Not applicable.

Informed Consent Statement

Not applicable.

Data Availability Statement

The raw data supporting the conclusions of this article will be made available by the authors on request.

Conflicts of Interest

The authors declare no known competing financial interests or personal relationships that could have influenced the work reported in this paper.

Abbreviations

The following abbreviations are used in this manuscript:
PGPBPlant growth-promoting bacteria
LBLuria–Bertani
IAAIndole-3-acetic acid
HPLC-UVHigh-performance liquid chromatography with ultraviolet detection
MICMinimum inhibitory concentration
ANOVAAnalysis of variance
CASChrome azurol S
LODLimit of detection
LOQLimit of quantification
SHUScoville heat unit

Appendix A

Table A1. Gradient program used for the HPLC-UV method for capsaicin.
TimeChannel A:
100.0% Water
0.1% Formic Acid
Channel B
100.0% Acetonitrile
0.1% Formic Acid
10.70 min55.00%45.00%
23.50 min55.00%45.00%
33.60 min0.00%100.00%
43.70 min0.00%100.00%
54.00 min60.00%40.00%
65.00 min60.00%40.00%
Figure A1. Standard curve for HPLC-UV determination of capsaicin values for peppers. Standard curve was generated by measuring known quantities of analytical grade capsaicin, dissolved in 100% ethanol, with concentrations ranging from 1 mg/mL to approximately 30.5176 ng/mL, achieved by a series of 2-fold dilutions. Y-axis represents peak area calculated by integrating chromatogram peaks for each concentration; X-axis represents capsaicin concentration (mg/mL). The calibration equation is y = 539.99x − 1.1828, with a correlation coefficient (R2) of 0.9999.
Sustainability 17 10549 g0a1
Figure A2. Distribution of the number of plant growth promotion traits among bacteria isolated from bell pepper (blue), jalapeno (gray), and habanero (red). Differences in distribution were not significant, as tested by Fisher’s exact test in R.
Sustainability 17 10549 g0a2
Figure A3. Dual culture assay photos of the biostimulant candidates Jf1, Jf2, Jf3, and Hs7 against F. oxysporum f. sp. lycopersici, C. acutatum, C. jacksonii, and R. solani. Photos are shown of growth on potato dextrose agar at 7 days post inoculation.
Sustainability 17 10549 g0a3
Figure A4. Percent germination of (A) T. pratense, and (B) P. pratensis, seeds inoculated with the biostimulant candidates and with sterile deionized water (Ctrl). A total of 30 seeds were assessed for each plant type.
Sustainability 17 10549 g0a4

References

  1. Bulgari, R.; Cocetta, G.; Trivellini, A.; Vernieri, P.; Ferrante, A. Biostimulants and Crop Responses: A Review. Biol. Agric. Hortic. 2015, 31, 1–17. [Google Scholar] [CrossRef]
  2. Velten, S.; Leventon, J.; Jager, N.; Newig, J. What Is Sustainable Agriculture? A Systematic Review. Sustainability 2015, 7, 7833–7865. [Google Scholar] [CrossRef]
  3. Babaniyi, G.G.; Akor, U.J.; Odeseye, A.A. Pesticide Contributions to Greenhouse Gas Emissions. In The Interplay of Pesticides and Climate Change: Environmental Dynamics and Challenges; Babaniyi, B.R., Babaniyi, E.E., Eds.; Springer Nature: Cham, Switzerland, 2025; pp. 173–230. ISBN 978-3-031-81669-7. [Google Scholar]
  4. Audsley, E.; Stacey, K.F.; Parsons, D.J.; Williams, A.G. Estimation of the Greenhouse Gas Emissions from Agricultural Pesticide Manufacture and Use; Cranfield University: Bedford, UK, 2009. [Google Scholar]
  5. Compant, S.; Clément, C.; Sessitsch, A. Plant Growth-Promoting Bacteria in the Rhizo- and Endosphere of Plants: Their Role, Colonization, Mechanisms Involved and Prospects for Utilization. Soil Biol. Biochem. 2010, 42, 669–678. [Google Scholar] [CrossRef]
  6. Glick, B.R. Plant Growth-Promoting Bacteria: Mechanisms and Applications. Scientifica 2012, 2012, e963401. [Google Scholar] [CrossRef]
  7. Paul, N.B.; Sundara Rao, W.V.B. Phosphate-Dissolving Bacteria in the Rhizosphere of Some Cultivated Legumes. Plant Soil 1971, 35, 127–132. [Google Scholar] [CrossRef]
  8. Sheng, X.F. Growth Promotion and Increased Potassium Uptake of Cotton and Rape by a Potassium Releasing Strain of Bacillus edaphicus. Soil Biol. Biochem. 2005, 37, 1918–1922. [Google Scholar] [CrossRef]
  9. Gang, S.; Sharma, S.; Saraf, M.; Buck, M.; Schumacher, J. Analysis of Indole-3-Acetic Acid (IAA) Production in Klebsiellaby LC-MS/MS and the Salkowski Method. Bio Protoc. 2019, 9, e3230. [Google Scholar] [CrossRef]
  10. Arora, N.K.; Verma, M. Modified Microplate Method for Rapid and Efficient Estimation of Siderophore Produced by Bacteria. 3 Biotech 2017, 7, 381. [Google Scholar] [CrossRef]
  11. Trivedi, P.; Leach, J.E.; Tringe, S.G.; Sa, T.; Singh, B.K. Plant–Microbiome Interactions: From Community Assembly to Plant Health. Nat. Rev. Microbiol. 2020, 18, 607–621. [Google Scholar] [CrossRef]
  12. Hamonts, K.; Trivedi, P.; Garg, A.; Janitz, C.; Grinyer, J.; Holford, P.; Botha, F.C.; Anderson, I.C.; Singh, B.K. Field Study Reveals Core Plant Microbiota and Relative Importance of Their Drivers. Environ. Microbiol. 2018, 20, 124–140. [Google Scholar] [CrossRef] [PubMed]
  13. Vannier, N.; Mony, C.; Bittebiere, A.-K.; Michon-Coudouel, S.; Biget, M.; Vandenkoornhuyse, P. A Microorganisms’ Journey Between Plant Generations. Microbiome 2018, 6, 79. [Google Scholar] [CrossRef]
  14. Kim, H.; Jeon, J.; Lee, K.K.; Lee, Y.-H. Longitudinal Transmission of Bacterial and Fungal Communities from Seed to Seed in Rice. Commun. Biol. 2022, 5, 772. [Google Scholar] [CrossRef] [PubMed]
  15. Zhang, Q.; White, J.F. Bioprospecting Desert Plants for Endophytic and Biostimulant Microbes: A Strategy for Enhancing Agricultural Production in a Hotter, Drier Future. Biology 2021, 10, 961. [Google Scholar] [CrossRef] [PubMed]
  16. Brader, G.; Compant, S.; Mitter, B.; Trognitz, F.; Sessitsch, A. Metabolic Potential of Endophytic Bacteria. Curr. Opin. Biotechnol. 2014, 27, 30–37. [Google Scholar] [CrossRef]
  17. Marini, E.; Magi, G.; Mingoia, M.; Pugnaloni, A.; Facinelli, B. Antimicrobial and Anti-Virulence Activity of Capsaicin Against Erythromycin-Resistant, Cell-Invasive Group A Streptococci. Front. Microbiol. 2015, 6, 1281. [Google Scholar] [CrossRef]
  18. Notashfard, A.; Nojavan Asghari, M. Inhibitory and Bactericidal Effect of Aqueous Pepper Extract (Capsicum annum L.), Capsaicin, and Capsaicin Combination with Amoxicillin Against Streptococcus Pyogenes. J. Med. Microbiol. Infect. Dis. 2024, 12, 259–269. [Google Scholar] [CrossRef]
  19. Periferakis, A.-T.; Periferakis, A.; Periferakis, K.; Caruntu, A.; Badarau, I.A.; Savulescu-Fiedler, I.; Scheau, C.; Caruntu, C. Antimicrobial Properties of Capsaicin: Available Data and Future Research Perspectives. Nutrients 2023, 15, 4097. [Google Scholar] [CrossRef]
  20. Guo, T.; Li, M.; Sun, X.; Wang, Y.; Yang, L.; Jiao, H.; Li, G. Synergistic Activity of Capsaicin and Colistin Against Colistin-Resistant Acinetobacter baumannii: In Vitro/Vivo Efficacy and Mode of Action. Front. Pharmacol. 2021, 12, 744494. [Google Scholar] [CrossRef]
  21. Akyuz, L.; Kaya, M.; Mujtaba, M.; Ilk, S.; Sargin, I.; Salaberria, A.M.; Labidi, J.; Cakmak, Y.S.; Islek, C. Supplementing Capsaicin with Chitosan-Based Films Enhanced the Anti-Quorum Sensing, Antimicrobial, Antioxidant, Transparency, Elasticity and Hydrophobicity. Int. J. Biol. Macromol. 2018, 115, 438–446. [Google Scholar] [CrossRef] [PubMed]
  22. Nishimura, C.; Ohashi, Y.; Sato, S.; Kato, T.; Tabata, S.; Ueguchi, C. Histidine Kinase Homologs That Act as Cytokinin Receptors Possess Overlapping Functions in the Regulation of Shoot and Root Growth in Arabidopsis. Plant Cell 2004, 16, 1365–1377. [Google Scholar] [CrossRef]
  23. Nascimento, P.L.A.; Nascimento, T.C.E.S.; Ramos, N.S.M.; Silva, G.R.; Gomes, J.E.G.; Falcão, R.E.A.; Moreira, K.A.; Porto, A.L.F.; Silva, T.M.S. Quantification, Antioxidant and Antimicrobial Activity of Phenolics Isolated from Different Extracts of Capsicum frutescens (Pimenta Malagueta). Molecules 2014, 19, 5434–5447. [Google Scholar] [CrossRef]
  24. Chatterjee, S.; Asakura, M.; Chowdhury, N.; Neogi, S.B.; Sugimoto, N.; Haldar, S.; Awasthi, S.P.; Hinenoya, A.; Aoki, S.; Yamasaki, S. Capsaicin, a Potential Inhibitor of Cholera Toxin Production in Vibrio cholerae. FEMS Microbiol. Lett. 2010, 306, 54–60. [Google Scholar] [CrossRef] [PubMed]
  25. Pandhair, V.; Sharma, S. Accumulation of Capsaicin in Seed, Pericarp and Placenta of Capsicum annuum L Fruit. J. Plant Biochem. Biotechnol. 2008, 17, 23–27. [Google Scholar] [CrossRef]
  26. Guo, X.-M.; Yu, Y.-Y.; Bai, L.; Gao, R.-F. Dianthus chinensis L.: The Structural Difference Between Vascular Bundles in the Placenta and Ovary Wall Suggests Their Different Origin. Front. Plant Sci. 2017, 8, 1986. [Google Scholar] [CrossRef]
  27. Guo, X.-M.; Xiao, X.; Wang, G.-X.; Gao, R.-F. Vascular Anatomy of Kiwi Fruit and Its Implications for the Origin of Carpels. Front. Plant Sci. 2013, 4, 391. [Google Scholar] [CrossRef]
  28. Chowdhury, F.R.; Findlay, B.L. Fitness Costs of Antibiotic Resistance Impede the Evolution of Resistance to Other Antibiotics. ACS Infect. Dis. 2023, 9, 1834–1845. [Google Scholar] [CrossRef]
  29. Melnyk, A.H.; Wong, A.; Kassen, R. The Fitness Costs of Antibiotic Resistance Mutations. Evol. Appl. 2015, 8, 273–283. [Google Scholar] [CrossRef] [PubMed]
  30. Vogwill, T.; MacLean, R.C. The Genetic Basis of the Fitness Costs of Antimicrobial Resistance: A Meta-Analysis Approach. Evol. Appl. 2015, 8, 284–295. [Google Scholar] [CrossRef]
  31. Füchtbauer, S.; Mousavi, S.; Bereswill, S.; Heimesaat, M.M. Antibacterial Properties of Capsaicin and Its Derivatives and Their Potential to Fight Antibiotic Resistance—A Literature Survey. Eur. J. Microbiol. Immunol. 2021, 11, 10–17. [Google Scholar] [CrossRef]
  32. Zaidi, A.; Khan, M.; Ahemad, M.; Oves, M. Plant Growth Promotion by Phosphate Solubilizing Bacteria. Acta Microbiol. Immunol. Hung. 2009, 56, 263–284. [Google Scholar] [CrossRef]
  33. Etesami, H.; Emami, S.; Alikhani, H.A. Potassium Solubilizing Bacteria (KSB): Mechanisms, Promotion of Plant Growth, and Future Prospects—A Review. J. Soil. Sci. Plant Nutr. 2017, 17, 897–911. [Google Scholar] [CrossRef]
  34. Raaijmakers, J.M.; Paulitz, T.C.; Steinberg, C.; Alabouvette, C.; Moënne-Loccoz, Y. The Rhizosphere: A Playground and Battlefield for Soilborne Pathogens and Beneficial Microorganisms. Plant Soil 2009, 321, 341–361. [Google Scholar] [CrossRef]
  35. Dogan, G.; Taskin, B. Hydrolytic Enzymes Producing Bacterial Endophytes of Some Poaceae Plants. Pol. J. Microbiol. 2021, 70, 297–304. [Google Scholar] [CrossRef]
  36. Bunsangiam, S.; Thongpae, N.; Limtong, S.; Srisuk, N. Large Scale Production of Indole-3-Acetic Acid and Evaluation of the Inhibitory Effect of Indole-3-Acetic Acid on Weed Growth. Sci. Rep. 2021, 11, 13094. [Google Scholar] [CrossRef]
  37. Skoog, F. Experiments on Bud Inhibition with Indole-3-Acetic Acid. Am. J. Bot. 1939, 26, 702–707. [Google Scholar] [CrossRef]
  38. Park, J.-M.; Radhakrishnan, R.; Kang, S.-M.; Lee, I.-J. IAA Producing enterobacter Sp. I-3 as a Potent Bio-Herbicide Candidate for Weed Control: A Special Reference with Lettuce Growth Inhibition. Indian J. Microbiol. 2015, 55, 207–212. [Google Scholar] [CrossRef]
  39. Joseph, P.S.; Musa, D.A.; Egwim, E.C.; Uthman, A.; Joseph, P.S.; Musa, D.A.; Egwim, E.C.; Uthman, A. Function of Urease in Plants with Reference to Legumes: A Review. In Legumes Research-Volume 2; IntechOpen: London, UK, 2022; ISBN 978-1-80356-915-4. [Google Scholar]
  40. Witte, C.-P. Urea Metabolism in Plants. Plant Sci. 2011, 180, 431–438. [Google Scholar] [CrossRef]
  41. Christensen, W.B. Urea Decomposition as a Means of Differentiating Proteus and Paracolon Cultures from Each Other and from Salmonella and Shigella Types. J. Bacteriol. 1946, 52, 461–466. [Google Scholar] [CrossRef]
  42. Schwyn, B.; Neilands, J.B. Universal Chemical Assay for the Detection and Determination of Siderophores. Anal. Biochem. 1987, 160, 47–56. [Google Scholar] [CrossRef]
  43. Zhang, Q.; Kingsley, K.L.; White, J.F. Endophytic pseudomonas Sp. from Agave Palmeri Participate in the Rhizophagy Cycle and Act as Biostimulants in Crop Plants. Biology 2022, 11, 1790. [Google Scholar] [CrossRef] [PubMed]
  44. Tamura, K.; Stecher, G.; Kumar, S. MEGA11: Molecular Evolutionary Genetics Analysis Version 11. Mol. Biol. Evol. 2021, 38, 3022–3027. [Google Scholar] [CrossRef]
  45. Arie, T. Fusarium Diseases of Cultivated Plants, Control, Diagnosis, and Molecular and Genetic Studies. J. Pestic. Sci. 2019, 44, 275–281. [Google Scholar] [CrossRef] [PubMed]
  46. Damm, U.; Cannon, P.F.; Woudenberg, J.H.C.; Crous, P.W. The Colletotrichum acutatum Species Complex. Stud. Mycol. 2012, 73, 37–113. [Google Scholar] [CrossRef]
  47. Ajayi-Oyetunde, O.O.; Bradley, C.A. Rhizoctonia Solani: Taxonomy, Population Biology and Management of Rhizoctonia Seedling Disease of Soybean. Plant Pathol. 2018, 67, 3–17. [Google Scholar] [CrossRef]
  48. Verma, S.K.; Kingsley, K.; Bergen, M.; Kowalski, K.; White, J. Fungal Disease Prevention in Seedlings of Rice (Oryza sativa) and Other Grasses by Growth-Promoting Seed-Associated Endophytic Bacteria from Invasive Phragmites australis. Microorganisms 2018, 6, 21. [Google Scholar] [CrossRef]
  49. Othman, Z.A.A.; Ahmed, Y.B.H.; Habila, M.A.; Ghafar, A.A. Determination of Capsaicin and Dihydrocapsaicin in Capsicum Fruit Samples Using High Performance Liquid Chromatography. Molecules 2011, 16, 8919–8929. [Google Scholar] [CrossRef] [PubMed]
  50. Guzmán, I.; Bosland, P.W. Sensory Properties of Chile Pepper Heat–and Its Importance to Food Quality and Cultural Preference. Appetite 2017, 117, 186–190. [Google Scholar] [CrossRef]
  51. Eagle, H.; Musselman, A.D. The Rate of Bactericidal Action of Penicillin In Vitro as a Function of Its Concentration, and Its Paradoxically Reduced Activity at High Concentrations Against Certain Organisms. J. Exp. Med. 1948, 88, 99–131. [Google Scholar] [CrossRef] [PubMed]
  52. Prasetyoputri, A.; Jarrad, A.M.; Cooper, M.A.; Blaskovich, M.A.T. The Eagle Effect and Antibiotic-Induced Persistence: Two Sides of the Same Coin? Trends Microbiol. 2019, 27, 339–354. [Google Scholar] [CrossRef]
  53. Popelka, P.; Jevinová, P.; Šmejkal, K.; Roba, P. Determination of Capsaicin Content and Pungency Level of Different Fresh and Dried Chilli Peppers. Folia Vet. 2017, 61, 11–16. [Google Scholar] [CrossRef]
  54. Ekwere, M.; Udoh, E.D. Extraction and Comparative Analysis of Moisture and Capsaicin Contents of Capsicum Peppers. J. Pain. Relief 2016, 5, 2167-0846. [Google Scholar] [CrossRef]
  55. Palma-Orozco, G.; Orozco-Álvarez, C.; Chávez-Villeda, A.A.; Mixtega-Martínez, A.; Castro-Muñoz, R. Capsaicin Content in Red Habanero Chilli (Capsicum chinense Jacq.) and Its Preservation after Drying Process. Future Foods 2021, 4, 100070. [Google Scholar] [CrossRef]
  56. Youseif, S.H.; Abd El-Megeed, F.H.; Humm, E.A.; Maymon, M.; Mohamed, A.H.; Saleh, S.A.; Hirsch, A.M. Comparative Analysis of the Cultured and Total Bacterial Community in the Wheat Rhizosphere Microbiome Using Culture-Dependent and Culture-Independent Approaches. Microbiol. Spectr. 2021, 9, e00678-21. [Google Scholar] [CrossRef] [PubMed]
  57. Hinsu, A.; Dumadiya, A.; Joshi, A.; Kotadiya, R.; Andharia, K.; Koringa, P.; Kothari, R. To Culture or Not to Culture: A Snapshot of Culture-Dependent and Culture-Independent Bacterial Diversity from Peanut Rhizosphere. PeerJ 2021, 9, e12035. [Google Scholar] [CrossRef] [PubMed]
  58. Müller, T.; Ruppel, S. Progress in Cultivation-Independent Phyllosphere Microbiology. FEMS Microbiol. Ecol. 2014, 87, 2–17. [Google Scholar] [CrossRef] [PubMed]
  59. Peng, Y.; He, X.; Tao, Y.; Zhou, C.; Li, X. The Changes of the Endophytic Bacterial Community from Pepper Varieties with Different Capsaicinoids. Microorganisms 2025, 13, 596. [Google Scholar] [CrossRef]
  60. Li, X.; Zhang, Y.; Zhou, C.; Li, X.; Zou, X.; Ou, L.; Tao, Y. The Changes of Rhizosphere Microbial Communities in Pepper Varieties with Different Capsaicinoids. Front. Microbiol. 2024, 15, 1430682. [Google Scholar] [CrossRef]
  61. Agbodjato, N.A.; Adoko, M.Y.; Babalola, O.O.; Amogou, O.; Badé, F.T.; Noumavo, P.A.; Adjanohoun, A.; Baba-Moussa, L. Efficacy of Biostimulants Formulated With Pseudomonas putida and Clay, Peat, Clay-Peat Binders on Maize Productivity in a Farming Environment in Southern Benin. Front. Sustain. Food Syst. 2021, 5, 666718. [Google Scholar] [CrossRef]
  62. del-Canto, A.; Sanz-Saez, Á.; Sillero-Martínez, A.; Mintegi, E.; Lacuesta, M. Selected Indigenous Drought Tolerant Rhizobium Strains as Promising Biostimulants for Common Bean in Northern Spain. Front. Plant Sci. 2023, 14, 1046397. [Google Scholar] [CrossRef]
  63. Fahde, S.; Boughribil, S.; Sijilmassi, B.; Amri, A. Rhizobia: A Promising Source of Plant Growth-Promoting Molecules and Their Non-Legume Interactions: Examining Applications and Mechanisms. Agriculture 2023, 13, 1279. [Google Scholar] [CrossRef]
  64. Tsotetsi, T.; Nephali, L.; Malebe, M.; Tugizimana, F. Bacillus for Plant Growth Promotion and Stress Resilience: What Have We Learned? Plants 2022, 11, 2482. [Google Scholar] [CrossRef]
  65. Costa, J.; Sepúlveda, M.; Gallardo, V.; Cayún, Y.; Santander, C.; Ruíz, A.; Reyes, M.; Santos, C.; Cornejo, P.; Lima, N.; et al. Antifungal Potential of Capsaicinoids and Capsinoids from the Capsicum Genus for the Safeguarding of Agrifood Production: Advantages and Limitations for Environmental Health. Microorganisms 2022, 10, 2387. [Google Scholar] [CrossRef]
  66. Xu, X.; Qu, R.; Wu, W.; Jiang, C.; Shao, D.; Shi, J. Applications of Microbial Co-Cultures in Polyketides Production. J. Appl. Microbiol. 2021, 130, 1023–1034. [Google Scholar] [CrossRef]
  67. Kobayashi, D.Y.; Reedy, R.M.; Bick, J.; Oudemans, P.V. Characterization of a Chitinase Gene from Stenotrophomonas maltophilia Strain 34S1 and Its Involvement in Biological Control. Appl. Environ. Microbiol. 2002, 68, 1047–1054. [Google Scholar] [CrossRef]
  68. Chin-A-Woeng, T.F.C.; Bloemberg, G.V.; Lugtenberg, B.J.J. Phenazines and Their Role in Biocontrol by Pseudomonas Bacteria. New Phytol. 2003, 157, 503–523. [Google Scholar] [CrossRef] [PubMed]
  69. Kafri, M.; Metzl-Raz, E.; Jona, G.; Barkai, N. The Cost of Protein Production. Cell Rep. 2016, 14, 22–31. [Google Scholar] [CrossRef] [PubMed]
  70. Kintaka, R.; Makanae, K.; Namba, S.; Kato, H.; Kito, K.; Ohnuki, S.; Ohya, Y.; Andrews, B.J.; Boone, C.; Moriya, H. Genetic Profiling of Protein Burden and Nuclear Export Overload. eLife 2020, 9, e54080. [Google Scholar] [CrossRef] [PubMed]
  71. Defez, R.; Andreozzi, A.; Dickinson, M.; Charlton, A.; Tadini, L.; Pesaresi, P.; Bianco, C. Improved Drought Stress Response in Alfalfa Plants Nodulated by an IAA Over-Producing Rhizobium Strain. Front. Microbiol. 2017, 8, 2466. [Google Scholar] [CrossRef]
  72. Ganesh, J.; Hewitt, K.; Devkota, A.R.; Wilson, T.; Kaundal, A. IAA-Producing Plant Growth Promoting Rhizobacteria from Ceanothus velutinus Enhance Cutting Propagation Efficiency and Arabidopsis Biomass. Front. Plant Sci. 2024, 15, 1374877. [Google Scholar] [CrossRef]
  73. Lata, D.L.; Abdie, O.; Rezene, Y. IAA-Producing Bacteria from the Rhizosphere of Chickpea (Cicer arietinum L.): Isolation, Characterization, and Their Effects on Plant Growth Performance. Heliyon 2024, 10, e39702. [Google Scholar] [CrossRef]
  74. Lee, S.-Y.; Kim, E.-G.; Park, J.-R.; Ryu, Y.-H.; Moon, W.; Park, G.-H.; Ubaidillah, M.; Ryu, S.-N.; Kim, K.-M. Effect on Chemical and Physical Properties of Soil Each Peat Moss, Elemental Sulfur, and Sulfur-Oxidizing Bacteria. Plants 2021, 10, 1901. [Google Scholar] [CrossRef] [PubMed]
  75. Wen, Y.; Wang, S.; Mu, W.; Yang, W.; Jönsson, P. Pyrolysis Performance of Peat Moss: A Simultaneous in-Situ Thermal Analysis and Bench-Scale Experimental Study. Fuel 2020, 277, 118173. [Google Scholar] [CrossRef]
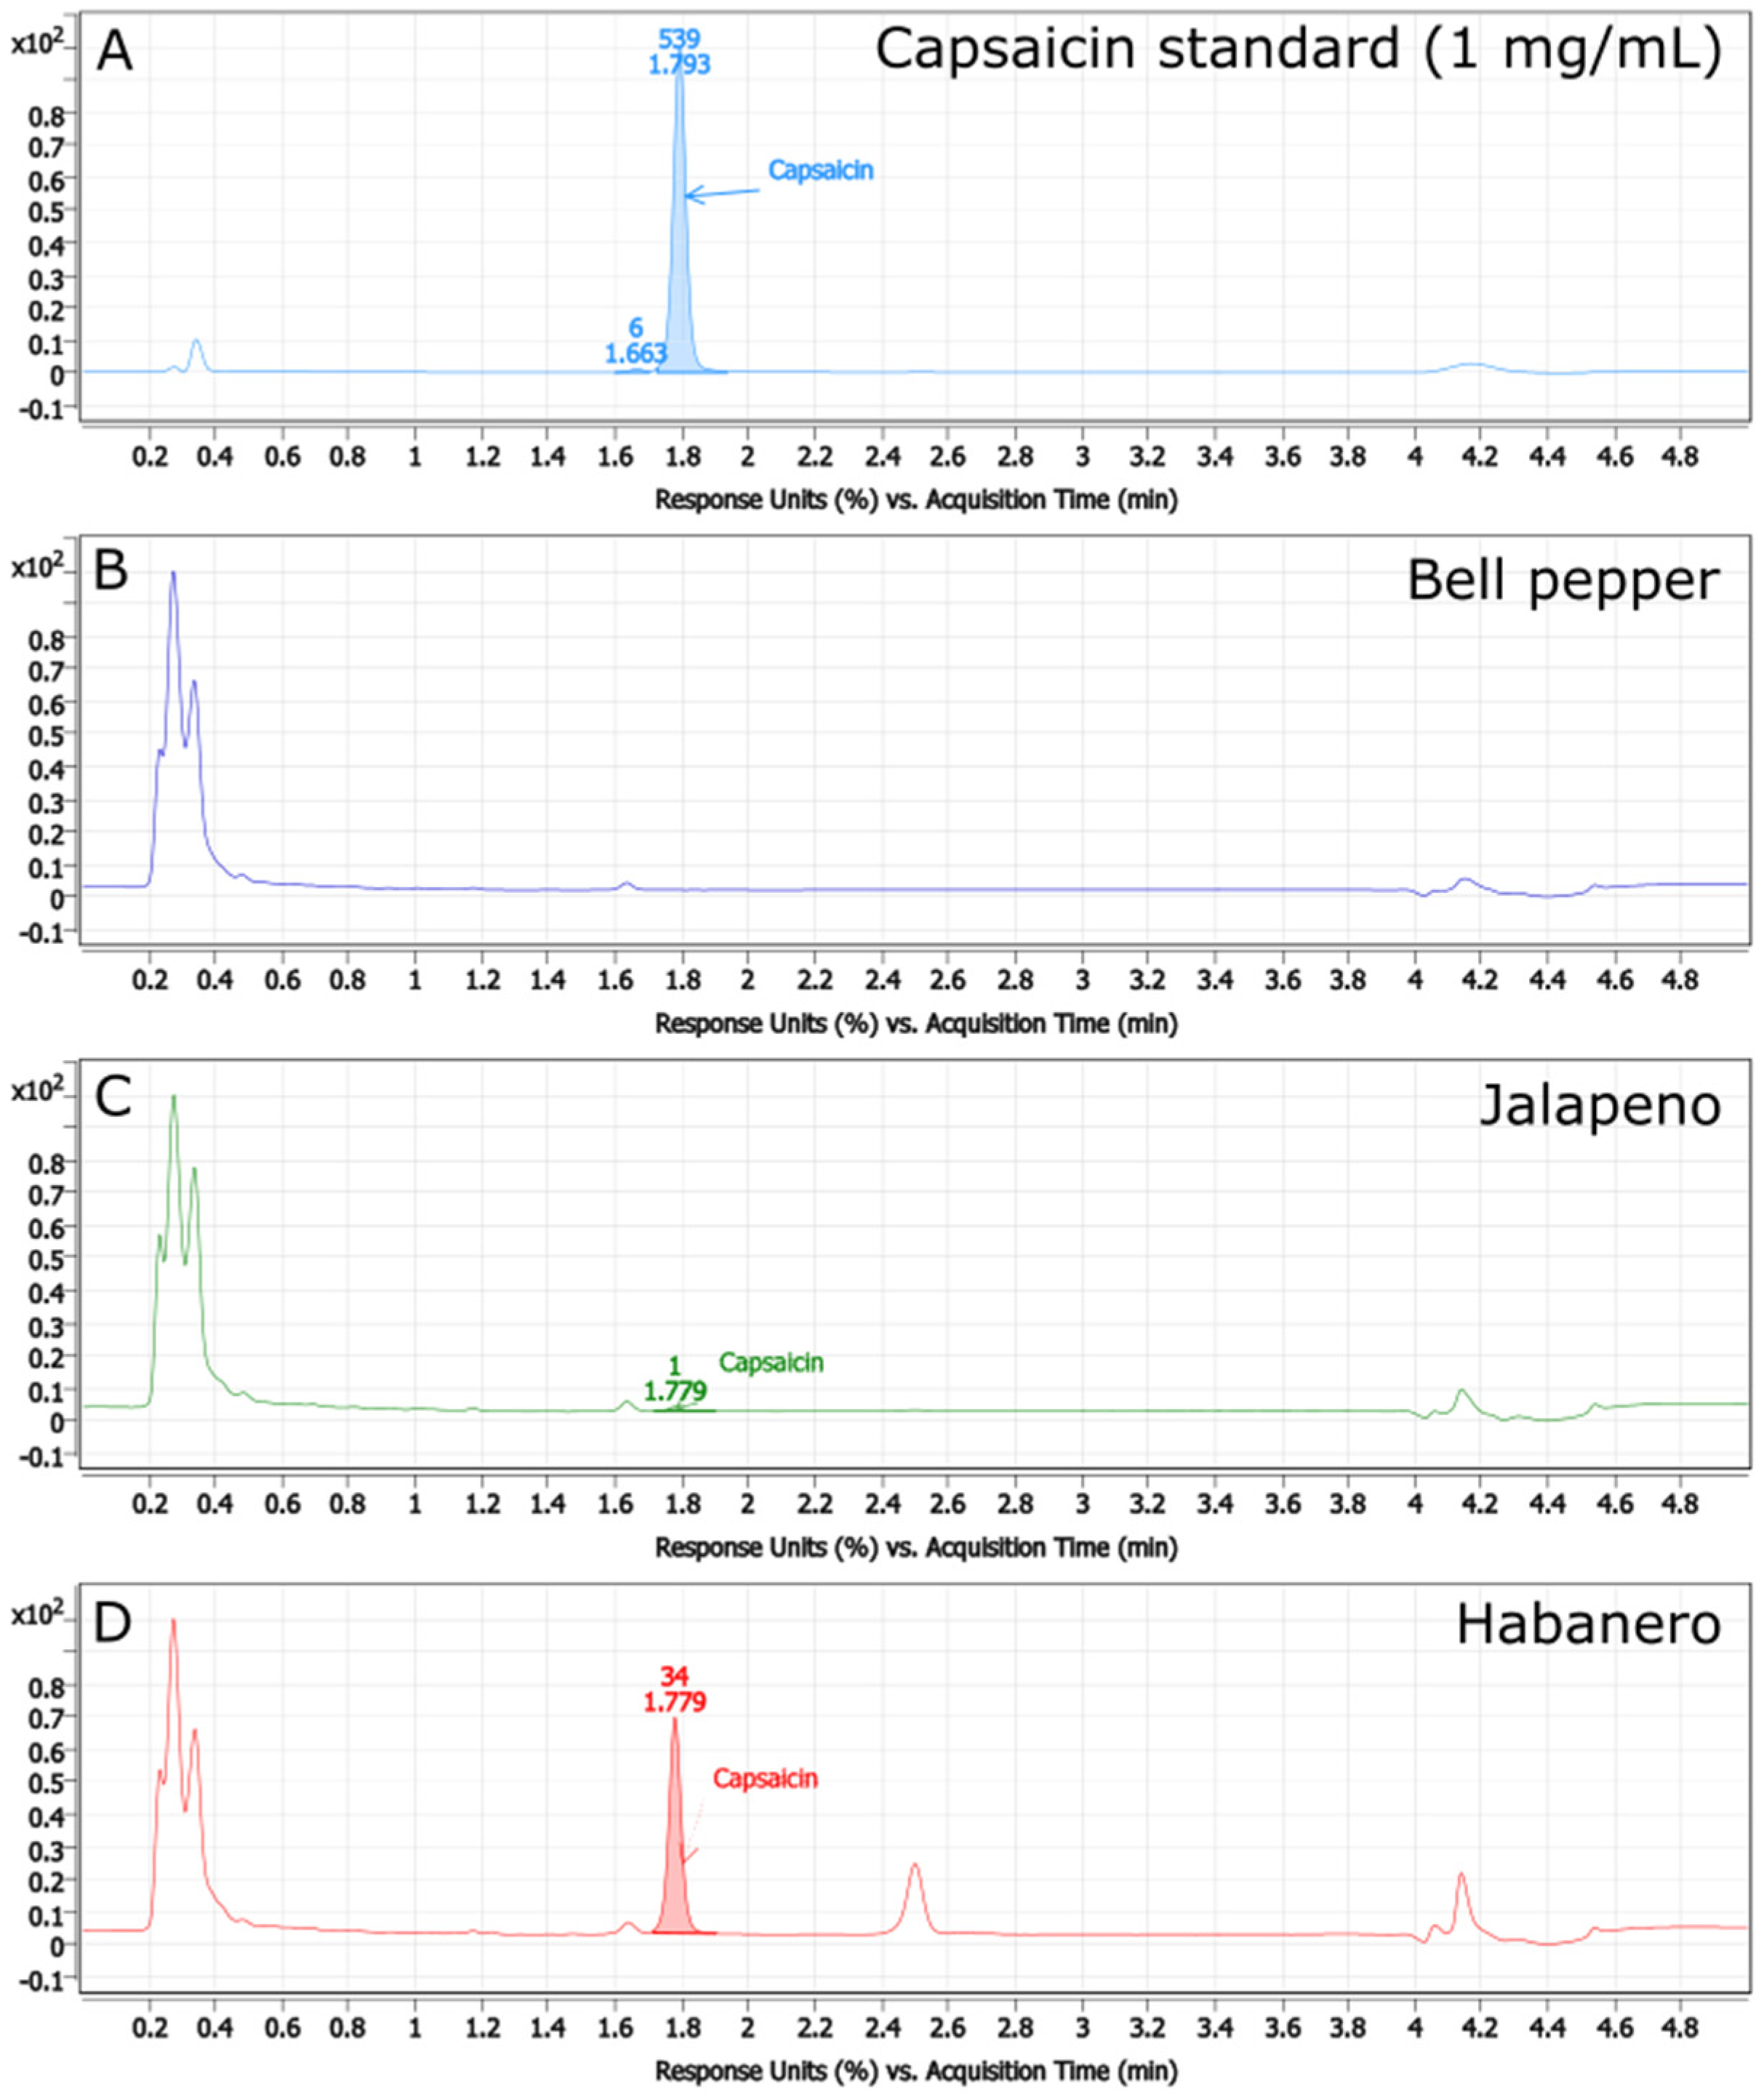
Figure 1. Chromatograms of (A) the capsaicin standard used, at a concentration of 1 mg capsaicin/1 mL 100% ethanol; and one technical replicate each of (B) composite bell pepper sample, (C) composite jalapeno sample, and (D) composite habanero sample. X-axis represents acquisition time (minutes), and Y-axis represents response units (%). Capsaicin peaks for each chromatogram are annotated with the peak area and the retention time, with the exception of the bell pepper chromatogram, since the bell pepper capsaicin concentrations are below the LOD.
Sustainability 17 10549 g001
Figure 2. Growth inhibition of bacterial isolates by capsaicin. (A) Maximum growth inhibition observed in a bacterial culture incubated over 24 h with tested concentrations of capsaicin, compared to non-antibiotic growth control. Values are averaged across n = 8, n = 3, and n = 8 bacteria isolated from the three pepper varieties, arranged from left to right along the x-axis. Error bars represent standard error. Means were not significantly different (p > 0.05), as tested by type III ANOVA in R and denoted by the shared significance letter ‘a’. (B) Distribution of optimal capsaicin dose observed for bell pepper (blue), jalapeno (gray), and habanero (red). Differences in distribution were not significant, as tested by Fisher’s exact test in R.
Sustainability 17 10549 g002
Figure 3. Maximum likelihood phylogenetic tree of (A) Hs7, (B) Jf1, (C) Jf2, and (D) Jf3, based on the 16S rRNA gene. The number at the branches indicates the percentage of occurrences of that branch over 1000 bootstrap replications. The positions of our isolates are indicated by the red boxes.
Sustainability 17 10549 g003
Figure 4. Effects of bacterial inoculation on T. pratense seedling growth parameters after 14 days. Each growth parameter was statistically analyzed using type III ANOVA in R, followed by posthoc Tukey’s HSD test. Lowercase letters indicate significance groups. The figure shows average root length (cm) (A), shoot length (B), number of roots (C), and number of leaves (D) of T. pratense seedlings.
Sustainability 17 10549 g004
Figure 5. Effects of bacterial inoculation on P. pratensis seedling growth parameters after 21 days. Each growth parameter was statistically analyzed using type III ANOVA in R, followed by posthoc Tukey’s HSD test. Lowercase letters indicate significance groups. The figure shows average root length (cm) (A), shoot length (B), number of roots (C), and number of leaves (D) of P. pratensis seedlings.
Sustainability 17 10549 g005
Table 1. Composite pepper samples and their estimated capsaicin concentrations and pungency.
SampleEstimated Capsaicin Concentration (μg/g)Estimated Pungency (Scoville Heat Units)
Bell Pepper00
Jalapeno344.9693513 ± 4.8996301995519.509621 ± 78.39408318
Habanero6560.516553 ± 81.99346599104,968.2648 ± 1311.895456
Table 2. Recovered bacterial isolates and their optimal capsaicin dose.
Origin TissueIDCapsaicin Concentration of LB Media in Which Bacteria Was Isolated (μg/mL)MIC Assay: Capsaicin Concentration at
Maximum Inhibition (μg/mL) *
Bell pepper seedsBPs115062.5
BPs2150ND
BPs3150125
BPs5031.25
Bell pepper fruit fleshBPf1150250
BPf215031.25
BPf60S125
BPf10150125
Jalapeno fruit fleshJf1150125
Jf2150250
Jf30125
Habanero seedsHs1150ND
Hs3150125
Hs7150125
Habanero fruit fleshHf1150125
Hf4150500
Hf5150125
Hf6150125
Hf7100250
Hf1115062.5
* ND = not determined. Bacteria were not noticeably inhibited by any tested level of capsaicin.
Table 3. Bacterial growth differences in response to capsaicin concentrations.
Percent Difference in Bacterial Growth at Each Capsaicin Level, Compared to Wells Containing the Growth Control Treatment (0 μg/mL Capsaicin)
ID0 μg/mL31.25 μg/mL62.50 μg/mL125 μg/mL250 μg/mL500 μg/mL
BPs10 (reference)−19−22−6+5−14
BPs20−1+19+3+11+33
BPs30−12−15−23−17−21
BPs50−19−19−18+2−7
BPf10−33−37−41−50−39
BPf20−50−39−15−4+5
BPf60−44−47−50−43−49
BPf100−6−9−10−4+33
Jf10−32−66−71−63−59
Jf20+7+4−25−34−13
Jf30−4−13−21−15−3
Hs10+3+8+14+34+90
Hs30−2+2−5−4−3
Hs70+7−38−56−50−26
Hf10−40−48−60−48−32
Hf40−1−8−160−41
Hf50−29−35−42−41−34
Hf60−13−17−25+2−24
Hf70+16−7−12−13+17
Hf110−38−60−47+10−34
Tomato10−45−96−100−77−2
Tomato20−77−100−77+15−100
Mint10+4+9−7−14−43
Mint20+19−13−16−4−24
Table 4. Recovered bacterial isolates and associated traits.
Origin TissueIDPhosphate SolubilizationPotassium SolubilizationProtease Activity IAA Production (μg/mL)
Bell pepper seedsBPs1
BPs2+
BPs3+
BPs5+
Bell pepper fruit fleshBPf1+
BPf2+
BPf6++
BPf10++
Jalapeno fruit fleshJf1++220
Jf2263
Jf3++132
Habanero seedsHs1++
Hs3
Hs7++202
Habanero fruit fleshHf1++
Hf4+
Hf5++
Hf6++
Hf7++
Hf11+
Table 5. Identity of promising bacterial candidates and additional tests.
% Radial Inhibition Against Fungal Pathogens
ID16S rRNA ID—Accession No.IAA (μg/mL)Urease ActivitySiderophore ProductionF. oxysporum f. sp.
lycopersici
C. acutatumR. solaniC. jacksonii
Jf1Pseudomonas sp.—PX349277220+28.44 ± 2.7514.12 ± 4.08No inhibitionNo inhibition
Jf2Agrobacterium sp.—PX349278263+5.50 ± 3.18No inhibitionNo inhibitionNo inhibition
Jf3Bacillus sp.—PX349279132+No inhibition30.59 ± 2.04No inhibitionNo inhibition
Hs7Pseudomonas sp.—PX349280202+37.61 ± 9.6711.76 ± 0.00No inhibitionNo inhibition
Disclaimer/Publisher’s Note: The statements, opinions and data contained in all publications are solely those of the individual author(s) and contributor(s) and not of MDPI and/or the editor(s). MDPI and/or the editor(s) disclaim responsibility for any injury to people or property resulting from any ideas, methods, instructions or products referred to in the content.