Article

Low-Carbon Design Strategies for Transparent Building Envelopes in Hot-Summer–Cold-Winter Climate Zones—Experimental and Numerical Simulation Study Based on the High-Performance Sunroom Laboratory in Central-Southern Anhui

1
School of Environment and Energy Engineering, Anhui Jianzhu University, Hefei 230601, China
2
Engineering Research Center of Building Energy Efficiency Control and Evaluation, Ministry of Education, Anhui Jianzhu University, Hefei 230022, China
3
Anhui Jinsanhuan Metal Technology Co., Ltd., Chuzhou 239599, China
4
College of Architecture and Engineering, Chuzhou Polytechnic, Chuzhou 239000, China
5
School of Geography and Urban Planning, Chizhou University, Chizhou 247000, China
6
State Key Laboratory of Fire Science, University of Science and Technology of China, Hefei 230601, China
*
Author to whom correspondence should be addressed.
Sustainability 2025, 17(23), 10544; https://doi.org/10.3390/su172310544
Submission received: 11 September 2025 / Revised: 11 November 2025 / Accepted: 17 November 2025 / Published: 25 November 2025
(This article belongs to the Special Issue Energy and Environment: Policy, Economics and Modeling)

Abstract

The widespread use of transparent building envelope structures satisfies people’s needs for architectural esthetics and daylighting. However, they also feature notable drawbacks such as high energy consumption, poor thermal insulation performance of traditional glass curtain walls, significant solar heat gain in summer and heat loss in winter, which lead to “cold in winter and hot in summer” indoors, reliance on high-power air conditioning, and energy consumption far exceeding that of opaque walls. Even when coated or insulated glazing is adopted, improper design can still fail to effectively reduce the overall heat transfer coefficient, placing higher demands on the daylighting performance and solar radiation control of transparent envelopes in existing buildings. Through experiments and numerical simulations, this study systematically analyzes the performance of different types of glass used in transparent building envelope structures and their impacts on building energy consumption. Based on the climatic characteristics of central-southern Anhui, measured data were compared between a Low E-glass sunroom and a conventional tempered glass sunroom. The results show that the solar radiation transmittance of the Low-e glass is only 45.31% of that of ordinary glass, the peak indoor temperature is reduced by 6–7 °C, and nighttime temperature fluctuations are smaller, verifying its excellent thermal insulation performance and thermal stability. To further investigate, the Ecotect software 2011 was used to simulate the daylighting performance of 12 types of glazing and the radiation transmittance under 19 conditions. The results indicate: triple-glazed vacuum composite silver-coated glass exhibits excellent shading performance suitable for summer; single-silver-coated glass has the best daylighting performance, and Triple-Silver coatings combined with high-transmission substrates can improve the daylight factor by 10.55%; argon-filled insulated glazing reduces radiation by 6.5% compared with ordinary IGUs, making it more suitable for the climate of central-southern Anhui. The study shows that optimization of transparent envelopes must be predicated on regional climate, combining experimentally validated glazing thermal parameters with simulation-based design optimization to provide theoretical support and technical references for glass selection and transparent envelope design in near-zero energy buildings in central-southern Anhui.

1. Introduction

With the continuous increase in urbanization and the improvement of residents’ living standards, people have higher requirements for indoor thermal comfort, while building energy consumption increases accordingly. In China’s building sector, energy consumption caused by windows has risen to approximately 40–50% of the total energy due to the building envelope. On 22 September 2020, General Secretary Xi Jinping stated at the United Nations General Assembly that China will strive to peak CO2 emissions before 2030 and achieve carbon neutrality before 2060 [1,2,3]. To achieve this goal, China will adopt stronger policy measures to promote green energy development, improve energy efficiency, and gradually transition to a low-carbon economy. Promoting green, energy-efficient buildings in the construction sector is an important technical approach to actively respond to national calls, address climate change, conserve energy and reduce emissions, adjust energy structures, and ensure energy security.
The building envelope is the core link of building energy conservation; its thermal performance directly affects the building’s energy consumption level and indoor environmental quality. By optimizing envelope design and adopting high-performance materials and intelligent technologies, energy consumption can be significantly reduced. Transparent building envelope structures, favored for their esthetics and daylighting performance, are widely used in modern architecture. They meet architectural esthetics and natural lighting needs and are extensively applied and promoted, but they also present significant shortcomings, such as high energy consumption and light pollution [4,5,6]. To balance functionality and sustainability, high-performance materials, intelligent control systems, and ecological design strategies must be employed to improve thermal insulation, optimize daylighting, and reduce light pollution, achieving the coordinated development of esthetics, energy conservation, and environmental protection in transparent envelopes.
Some scholars have conducted relevant research on the thermal performance of transparent envelopes. Du Feng et al. [7] demonstrated through measured comparisons of four types of glass curtain walls that Low-e glass offers significantly better energy savings than ordinary clear glass, validating the role of optical properties in regulating energy consumption.
Ren Jing et al. [8] used simulation to study the impact of secondary heat transfer processes in shading-transparent envelope composites on indoor thermal comfort. The results indicate that the secondary heat transfer of the composite has a much greater impact on the inner surface of the transparent envelope than the heat transfer coefficient; compared to the indoor air temperature, the mean radiant temperature is more affected by the inner surface temperature of the transparent envelope.
Zhao Kang et al. [9] measured typical large-space buildings such as airport terminals and passenger stations, which extensively use transparent envelopes, and studied the impact of solar radiation on occupant thermal comfort. The measurements show that the use of large-area transparent envelopes greatly increases indoor solar radiation, significantly elevates inner surface temperatures compared to general public buildings, and causes overheating of indoor air temperature, negatively affecting thermal comfort.
Ascione F. [10] proposed a multi-objective optimization method to solve the energy-efficient design of building envelopes. Through coupling the programsMatLab and EnergyPlus, they proposed minimizing energy consumption, energy cost, and thermal discomfort time as the optimization criteria.
Ahn et al. [11] focused on improving energy use efficiency in existing residences, emphasizing the relationship between window performance and energy-saving rate, identifying optimal K and SHGC (Overall Heat Transfer Coefficient and Solar Heat Gain Coefficient) values for windows, and proposing a standardized window retrofit strategy.
Based on the above, domestic and international scholars have achieved a series of results on the thermal performance of transparent envelopes and their impact on building energy consumption. However, the thermal performance of transparent envelopes is dual-sided: it is beneficial for heating in winter but increases cooling load in summer. This issue is especially prominent in hot-summer–cold-winter regions. Taking central-southern Anhui as an example, the climate is characterized by hot and humid summers and cold and damp winters, demanding dual “insulation-heat preservation” performance from the envelope. Existing research often focuses on static scenarios or single indicators, lacking dynamic climate response and multi-parameter collaborative optimization mechanisms [12]. In this context, exploring the solar radiation transmittance of glass under different scenarios and its coupling mechanism with building energy use becomes a critical entry point to break through current research limitations.
Some scholars have conducted multi-parameter collaborative optimization studies by scenarios. Husin, S.N.S. et al. [13] conducted targeted studies on typical residential windows in Malaysia, analyzing indoor lighting and thermal environments corresponding to different windows, and pointed out that when determining window area and glass transmittance, various factors including lighting environment, thermal environment, and window energy efficiency should be comprehensively considered.
Missoum M. et al. [14] studied housing in northwestern Algeria and proposed that reasonable selection of rural housing orientation, customization of energy-saving exterior doors and windows, and the adoption of appropriate insulation measures for the envelope can effectively improve living conditions.
Xu and Ojima [15] conducted field experiments on a lightweight residence in Japan using a double-skin glass curtain wall system and found appropriate modes under winter, summer, and autumn conditions, with energy savings of 10–15% in summer and 20–30% in winter.
Baldinelli [16], focusing on Italy’s warm climate, integrated the outer glass of double-skin façades with movable shading blades into a movable mechanism and demonstrated via simulation that changes in the façade envelope can effectively adapt to hot summers and cold winters.
A. Zallner et al. [17] experimentally tested exterior glass on a building in Germany and found that the impact of solar radiation intensity on the air in the thermal channel is mainly related to the ratio of the thermal channel to its height.
Shaik Saboor et al. [18] conducted a thermal and cost analyses of 30 double-glazed reflective IGUs in India’s composite climate. The combination of gray reflective glass-10 mm air gap-golden reflective glass was found optimal. Bokel [19] explored the impact of sun-facing exterior windows on building energy savings and derived the relationship between window size and performance and annual heating and cooling energy consumption.
Li et al. [20] studied typical hot-summer–cold-winter cities such as Changsha, comparing the performance of ordinary insulated glass units (IGUs) with windows equipped with transparent insulation strips under various building shading conditions. The study found that as shading increased, both the effective daylight intensity and total solar heat gain of insulated windows exhibited context-dependent variations, and design recommendations were provided for shading height and spacing in all four orientations.
Based on the above studies, optimizing the thermal performance of transparent envelopes must be closely aligned with regional climatic features and dynamic usage needs. The type of glazing, as a core factor affecting solar heat gain and building energy use, directly determines the bi-directional “insulation-heat preservation” performance of an envelope [21,22]. Especially in hot-summer–cold-winter regions with complex climatic characteristics, the optical-thermal parameters of different glazing types significantly influence annual energy consumption by changing the proportions of radiation transmission, reflection, and absorption.
Saroglou, Tanya et al. [23] found that in a corridor-type double-skin curtain wall of a high-rise building in Tel Aviv, Israel, increasing the cavity width from 0.2 m to 0.5 m significantly reduced cooling load, with further significant reductions from 0.5 to 1.0 m and 1.0 to 2.0 m. Chow, Tin-tai et al. [24] linked the energy performance of various glazing systems with window technologies, finding that PV-laminated glass shows a higher SHGC than clear glass and Low-e coated glass; compared with double-glazed clear windows and Low-e windows, double-glazed PV windows reduced indoor temperatures by 200% and 53%, respectively. Chan et al. [25] showed via energy simulation of a typical office building in Hong Kong that using single-layer clear glass as the inner skin and double-layer reflective glass as the outer skin can achieve excellent energy savings. Perez-Grande et al. [26] studied the impact of glass properties on double-skin glass façades and computed the proportions of building façades with different glass combinations. Yu et al. [27] compared energy consumption under different glazing and window-opening scenarios. The results indicated that glass combinations with lower shading coefficients and higher visible transmittance effectively reduced annual total energy use, with Low-e glass outperforming others due to its lower thermal transmittance (U-value), smaller shading coefficient, and higher visible transmittance.
After clarifying the mechanisms by which different types of glazing affect the thermal performance of transparent envelopes, a key support for design optimization is how to quantify their dynamic energy performance through rigorous simulation or measurement methods. Domestic and international research has formed multi-scale, multi-method analytical systems for transparent envelopes.
Liu Meng et al. [28] used the open-source EnergyPlus8.5 to simulate an external-circulation double-skin façade, comparing winter heating energy and annual building energy consumption between single and double glazing, and analyzed the impact of different strategies on energy use. Li et al. [29] targeted the Shanghai Tower, using the actual temperature monitoring data of the outer curtain wall from an integrated real-time structural health monitoring system to develop a data-driven model based on artificial neural networks (ANN). Using wind speed, wind direction, and public meteorological data, they predicted the temperature distribution of curtain walls, providing new insights for the maintenance of the Shanghai Tower and the design of glass curtain walls for super high-rise buildings. Yuan Juntuan [30] used a five-story office building in a severe cold region as a prototype and employed the simulation platform DeST to simulate the energy consumption of different envelopes, including Low-e coated IGU (Insulated Glazing Unit) curtain walls, and under different building orientations. The results show that buildings with glass curtain wall systems have greater energy-saving potential than those with other envelopes in severe cold regions, with more pronounced savings in winter. Elisabeth Gratia [31] et al. analyzed building loads using experimental and simulation methods, finding that orientation, the color and location of shading devices, inner glazing, outdoor wind speed, curtain wall height, and the size and position of vents all affect building loads.
Yao et al. [32] optimized parameters such as window-to-wall ratio for rural houses in cold regions of China using a multi-objective genetic algorithm for models with and without sunrooms; the results showed that comprehensive optimization of transparent envelopes can significantly improve daylighting, energy consumption, and thermal comfort.
Gul Koçlar Oral [33] simulated building energy consumption for several window constructions, organized the data, and derived unit load indicators. The results show the relationships between summer thermal metrics of windows and building energy consumption, ultimately proposing optimal energy-saving combinations. Wu and Zhang et al. [34] focused on the environmental performance of building envelopes in residential buildings located in China’s hot-summer–cold-winter regions. They developed a multi-objective optimization framework that integrates daylighting, energy consumption, and thermal comfort, using EnergyPlus coupled with the Octopus genetic algorithm for collaborative solving. The results revealed the trade-off relationship between daylighting quality and building energy consumption. Schultz et al. [35] developed the dynamic process simulator WinSim, which can quickly and effectively calculate the thermal performance of windows and the indoor heating/cooling loads induced by them; its results are highly consistent with those of advanced building software. Arild Gustavsen [36] used the Therm software 7.0 to simulate the influences of glazing materials, frame materials, glass surface emissivity, and spacer forms on window thermal performance, proposing energy-saving optimization strategies for these factors.
In summary, the integrated application and optimization design of transparent envelopes still have considerable research and development potential. However, three core gaps remain, which this study aims to address: (1) Existing studies on hot-summer–cold-winter zones often neglect the high humidity and significant seasonal temperature differences in central-southern Anhui, lacking targeted analysis of glass performance under such climatic conditions; (2) The coupling relationship between glazing types and regional sub-climates has not been quantitatively defined, making it difficult to establish precise thermal performance thresholds for glass selection; (3) Few studies combine experimental validation with numerical simulation to form a “dynamic performance verification–optimization” loop, resulting in conclusions that are either overly theoretical or lack general applicability.
The central-southern Anhui region experiences a hot-summer–cold-winter climate characterized by hot, humid summers with intense solar radiation and cold, damp winters. Based on these conditions, this study designs both experiments and simulations—unlike tropical regions focusing on shading or cold regions emphasizing insulation, this area requires a dual balance of “summer insulation and winter heat preservation.” Therefore, a high-performance sunroom laboratory was constructed as the research platform, with Ecotect used for dynamic energy and daylight simulations. Both the experimental and simulated sunrooms follow standardized designs, isolating variables to focus solely on the performance of transparent envelopes and minimizing irrelevant interference to ensure the reliability of conclusions.
This study establishes three specific objectives: (1) Conduct on-site experiments comparing Low-e glass and ordinary tempered glass sunrooms to quantify differences in solar radiation transmittance, indoor temperature fluctuation, and thermal stability during transitional and summer seasons in the region; (2) use Ecotect simulations to analyze daylighting performance of 12 glazing types and solar radiation transmittance under 19 configurations, determining the optimal glazing types and key thermal parameters; (3) compare the thermal performance and energy consumption of various glazings between Hefei (central Anhui) and Huangshan (southern Anhui), proposing regionally adaptive design strategies corresponding to latitude-based climate variations. Ultimately, by integrating simulations and empirical experiments, this study develops design strategies for transparent envelopes in hot-summer–cold-winter zones, providing quantitative references for glazing parameter selection in central-southern Anhui, promoting the transformation of sunroom construction toward refinement and low carbonization, and offering regional empirical support for implementing near-zero energy building standards in transparent envelope design.

2. Thermal Performance Analysis of Transparent Building Envelopes

2.1. Mechanisms of Glass Daylighting and Heat Transfer

Exterior windows are among the key energy-saving components of near-zero energy buildings [37], and high-performance window systems play a substantial role. Glass is the main component of windows, accounting for over 80% of the window area. The main factors affecting window performance include the number of panes, glass type, and fill gas. Transparent envelopes mainly bring in solar heat gains; thus, understanding the daylighting and heat transfer characteristics of glass is crucial for better assessing window heat gains [38].
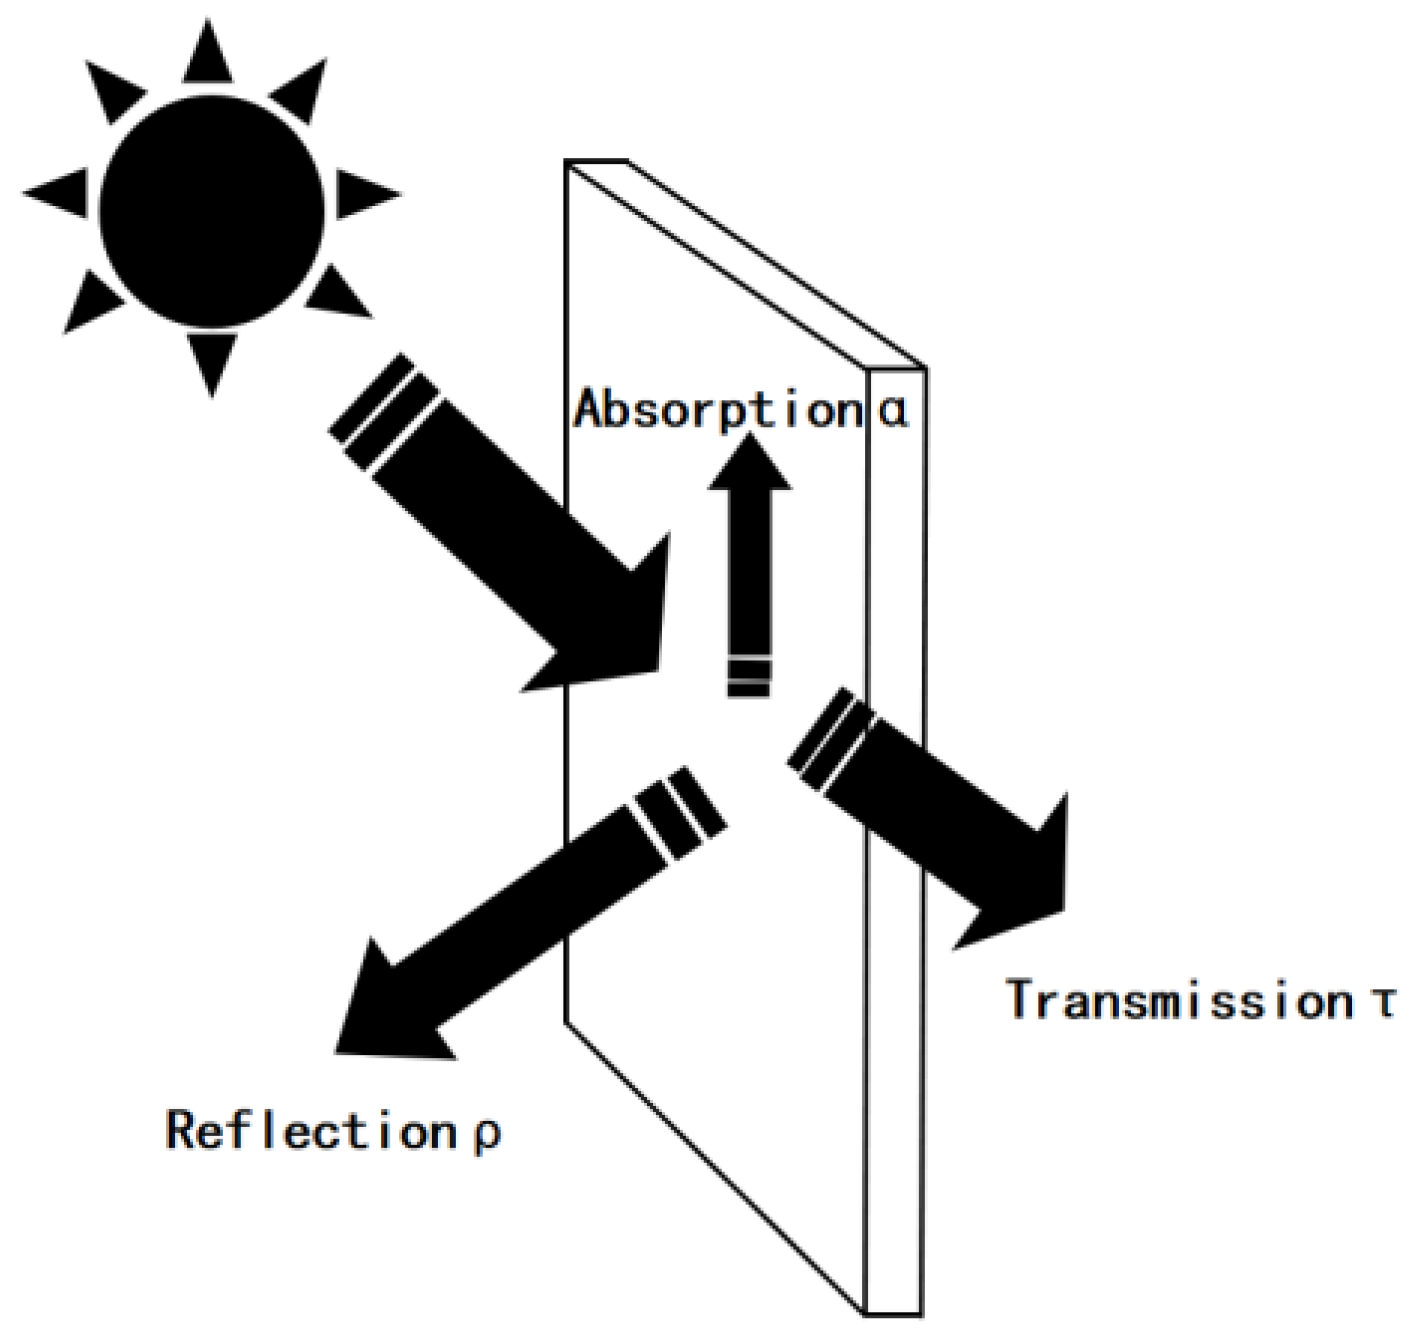
Solar radiation is electromagnetic radiation from the sun. As shown in Figure 1, the solar spectrum and visible wavelengths indicate that the components that can be converted into heat energy are mainly in the visible and infrared ranges, accounting for about 7%. Solar radiation causes changes in the temperature of the Earth’s surface and the atmosphere and drives and dominates various climatic phenomena. When the radiative heat Q from the sun is incident on the glass surface, as shown in Figure 2, the reflectance, absorptance, and transmittance of glass are denoted by ρ , α , and τ , respectively. Q ρ is reflected; Q τ is transmitted through the glass directly into the room and becomes heat gain; and Q α is absorbed by the glass and increases the glass temperature, after which heat is transferred to both indoors and outdoors via long-wave thermal radiation and convection.
According to the law of conservation of energy: that is,
α + τ + ρ = 1
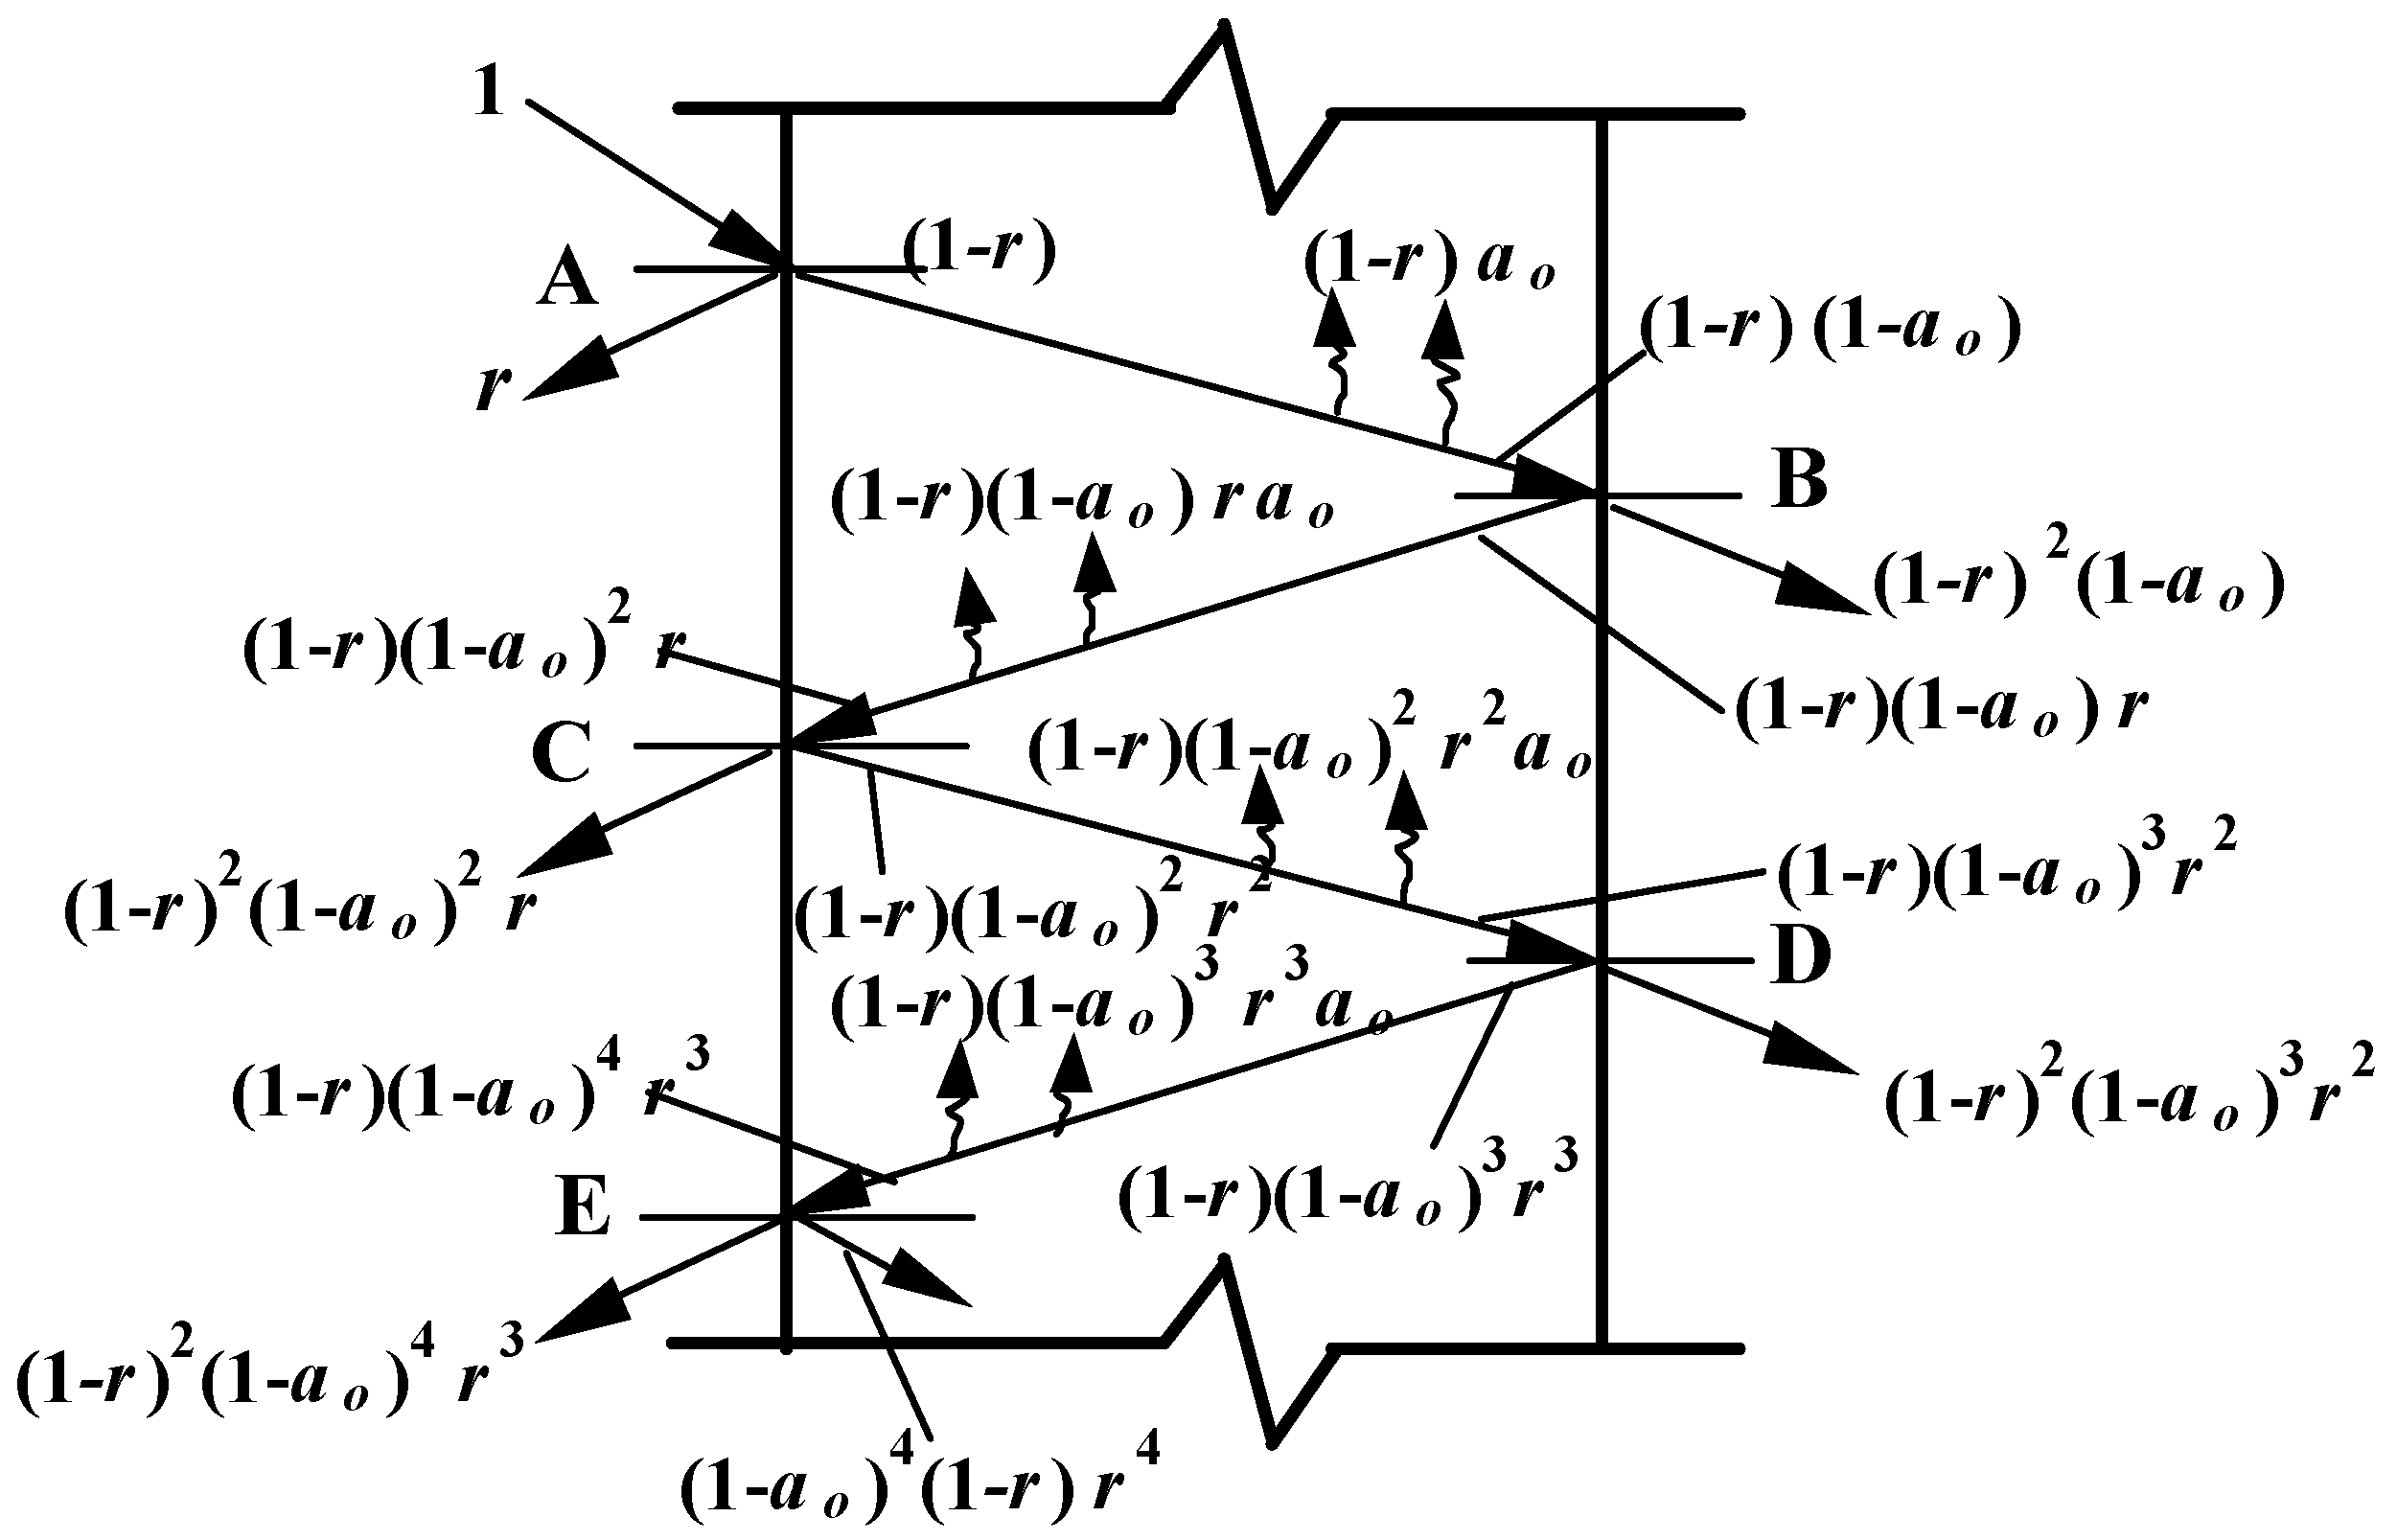
The ratios of each part of energy, Q ρ Q , Q α Q , Q τ Q lie between 0 and 1. Transmission of solar radiation through single glazing is shown in Figure 3. When sunlight is incident on glass, light undergoes infinite reflections, absorptions, and transmissions within the glass layer. As shown in Equations (2)–(4), the total reflectance, total absorptance, and total transmittance of glass for solar radiation are an infinite series summing up the repeated processes [39].
Where: r is the reflectance of glass, representing the fraction of incident solar radiation reflected by the glass surface;
a 0 is the absorptance of glass, representing the fraction of incident solar radiation absorbed within the glass material.
The total absorptance of single glazing is as follows:
a = a 0 ( 1 r ) n = 0 r n ( 1 a 0 ) n = a 0 ( 1 r ) 1 r ( 1 a 0 )
The total reflectance of single glazing is as follows:
ρ = r + r ( 1 a 0 ) 2 ( 1 r ) 2 n = 0 r 2 n ( 1 a 0 ) 2 n = r 1 + ( 1 a 0 ) 2 ( 1 r ) 2 1 r 2 ( 1 a 0 ) 2
The total transmittance of single glazing is as follows:
T glass = ( 1 a 0 ) ( 1 r ) 2 n = 0 r 2 n ( 1 a 0 ) 2 n = ( 1 a 0 ) ( 1 r ) 2 1 r 2 ( 1 a 0 ) 2
When sunlight is incident on double glazing, not only the properties (reflectance, absorptance, and transmittance) of each pane must be considered, but also the infinite multiple reflections between the two semi-transparent layers and the transmission of the reflected radiation, etc. Similarly, when sunlight is incident on triple glazing or even quadruple glazing and above, the total reflectance, total transmittance, and absorptance of each pane can be solved using this method [40].
According to the latest requirements of near-zero energy buildings for transparent envelopes, the overall heat transfer coefficient of transparent enclosures must meet the specified limits. Generally, triple glazing with two cavities is required for windows to comply.

2.2. Solar Heat Gain Coefficient and Shading Coefficient

The instantaneous heat gain through the transparent envelope into the room, as in Equation (5), includes two parts: direct solar radiation transmitted indoors and the heat transferred indoors by conduction after being absorbed by the glass.
Q = K wind F wind t a , out ( τ ) t a , in ( τ ) + ( S H G C ) F wind I
where: K wind —is the overall heat transfer coefficient of the transparent envelope, W/(m2·°C);
F wind is the heat transfer area of the transparent envelope, m2; and
I is the solar irradiance, W/m2.
The Solar Heat Gain Coefficient ( S H G C ) describes the thermal performance of glass windows or glass curtain walls [41]. It is widely internationally recognized and dimensionless, as in Equation (6) [42].
S H G C = τ + i = 1 n i N i a i
where: τ is the total transmittance of solar radiation through the window;
a i is the absorptance of the i -th pane;
n is the number of panes; and
N i is the fraction of the heat from radiation absorbed in the i -th pane that is conducted inward.
Because solving N i is complicated—it depends on the indoor/outdoor convective heat transfer coefficients of surfaces, long-wave radiation among indoor surfaces, the overall heat transfer coefficient of the window, etc.—the heat transfer model of windows and the indoor thermal balance model need to be solved simultaneously. For convenience, the shading coefficient S C is introduced. S C is an intrinsic property of glass used to describe the thermal characteristics of different transparent envelopes [42], with the following Formula (7):
S C = S H G C S H G C ref
Note: Under normal incidence, S H G C ref has a value of 0.87.
In central-southern Anhui, large areas of transparent envelopes are commonly used on building façades, hence studying their thermal performance is particularly important. The region needs additional heating in winter and effective shading in hot summers. This paper mainly investigates radiation transmittance by changing the type and number of glass panes in response to seasonal changes.

2.3. Evaluation Method for Natural Daylighting

The daylight factor [43] is an important indicator for evaluating the daylighting of buildings [44]. It represents the proportion of daylight that can illuminate the building interior and is usually expressed as a percentage. The calculation considers a variety of factors, including façade height, interior wall reflectance, window size, and orientation. The daylight factor method, initially proposed in 1923, later developed by BRS (Building Research Station), LBNL (Lawrence Berkeley National Laboratory), MIT (Massachusetts Institute of Technology), SERI (Solar Energy Research Institute, later renamed NREL), and ultimately adopted by CIE (Commission Internationale de l’Éclairage).
The daylight factor is defined under CIE overcast sky conditions as the ratio of the horizontal illuminance En at an indoor measurement point due to diffuse sky light to the simultaneous outdoor horizontal illuminance EW without diffuse light on the plane, expressed as a percentage, as in Equation (8):
C = E n E w × 100 %
The daylight factor C at a point indoors consists of three components: the sky component C d , the outdoor reflected component C o u t , r e f , and the indoor reflected component C i n , r e f , as in Equation (9):
C = C d + C o u t , r e f + C i n , r e f
Among these, C d represents the sky component at a given indoor point and is the main component of the daylight factor.
Since outdoor surfaces are complex, in general daylighting calculations the outdoor reflected component C o u t , r e f is often neglected or assumed to be 10% of the sky component and not calculated separately.
C i n , r e f represents the natural illuminance at a given indoor plane point obtained from indoor reflecting surfaces under full sky illuminance, relative to the illuminance on the same plane outdoors [45,46].
Table 1 presents standard values of daylight factor on work planes and indoor natural illuminance standards for various task areas in China, indicating indoor daylighting standards for different daylighting modes. Class I has the highest daylighting requirement and Class V the lowest. Table 2 shows daylighting requirements for rooms with different functions; Class I is the highest (e.g., operating rooms), and general office spaces are typically Class III.

3. Experimental Study on Thermal Performance of the High-Performance Sunroom Laboratory

3.1. Experimental Objectives and Arrangement

Central-southern Anhui belongs to a hot-summer–cold-winter climate region, where the importance of envelope insulation is the most prominent. To better study the thermal performance of transparent envelopes, we built two sunrooms of identical shape and size, using Low-e glazing and ordinary glass, respectively, to test their insulation and heat preservation performance and solar radiation transmittance in practical applications. The study examines how different glazing materials affect indoor temperature, quantitatively analyzes glazing performance under different environmental conditions and its impact on energy consumption, and validates the simulation data presented later. It provides a basis for the performance of transparent envelopes in central-southern Anhui, offers data support for architectural design, and theoretical data for materials science and energy management.
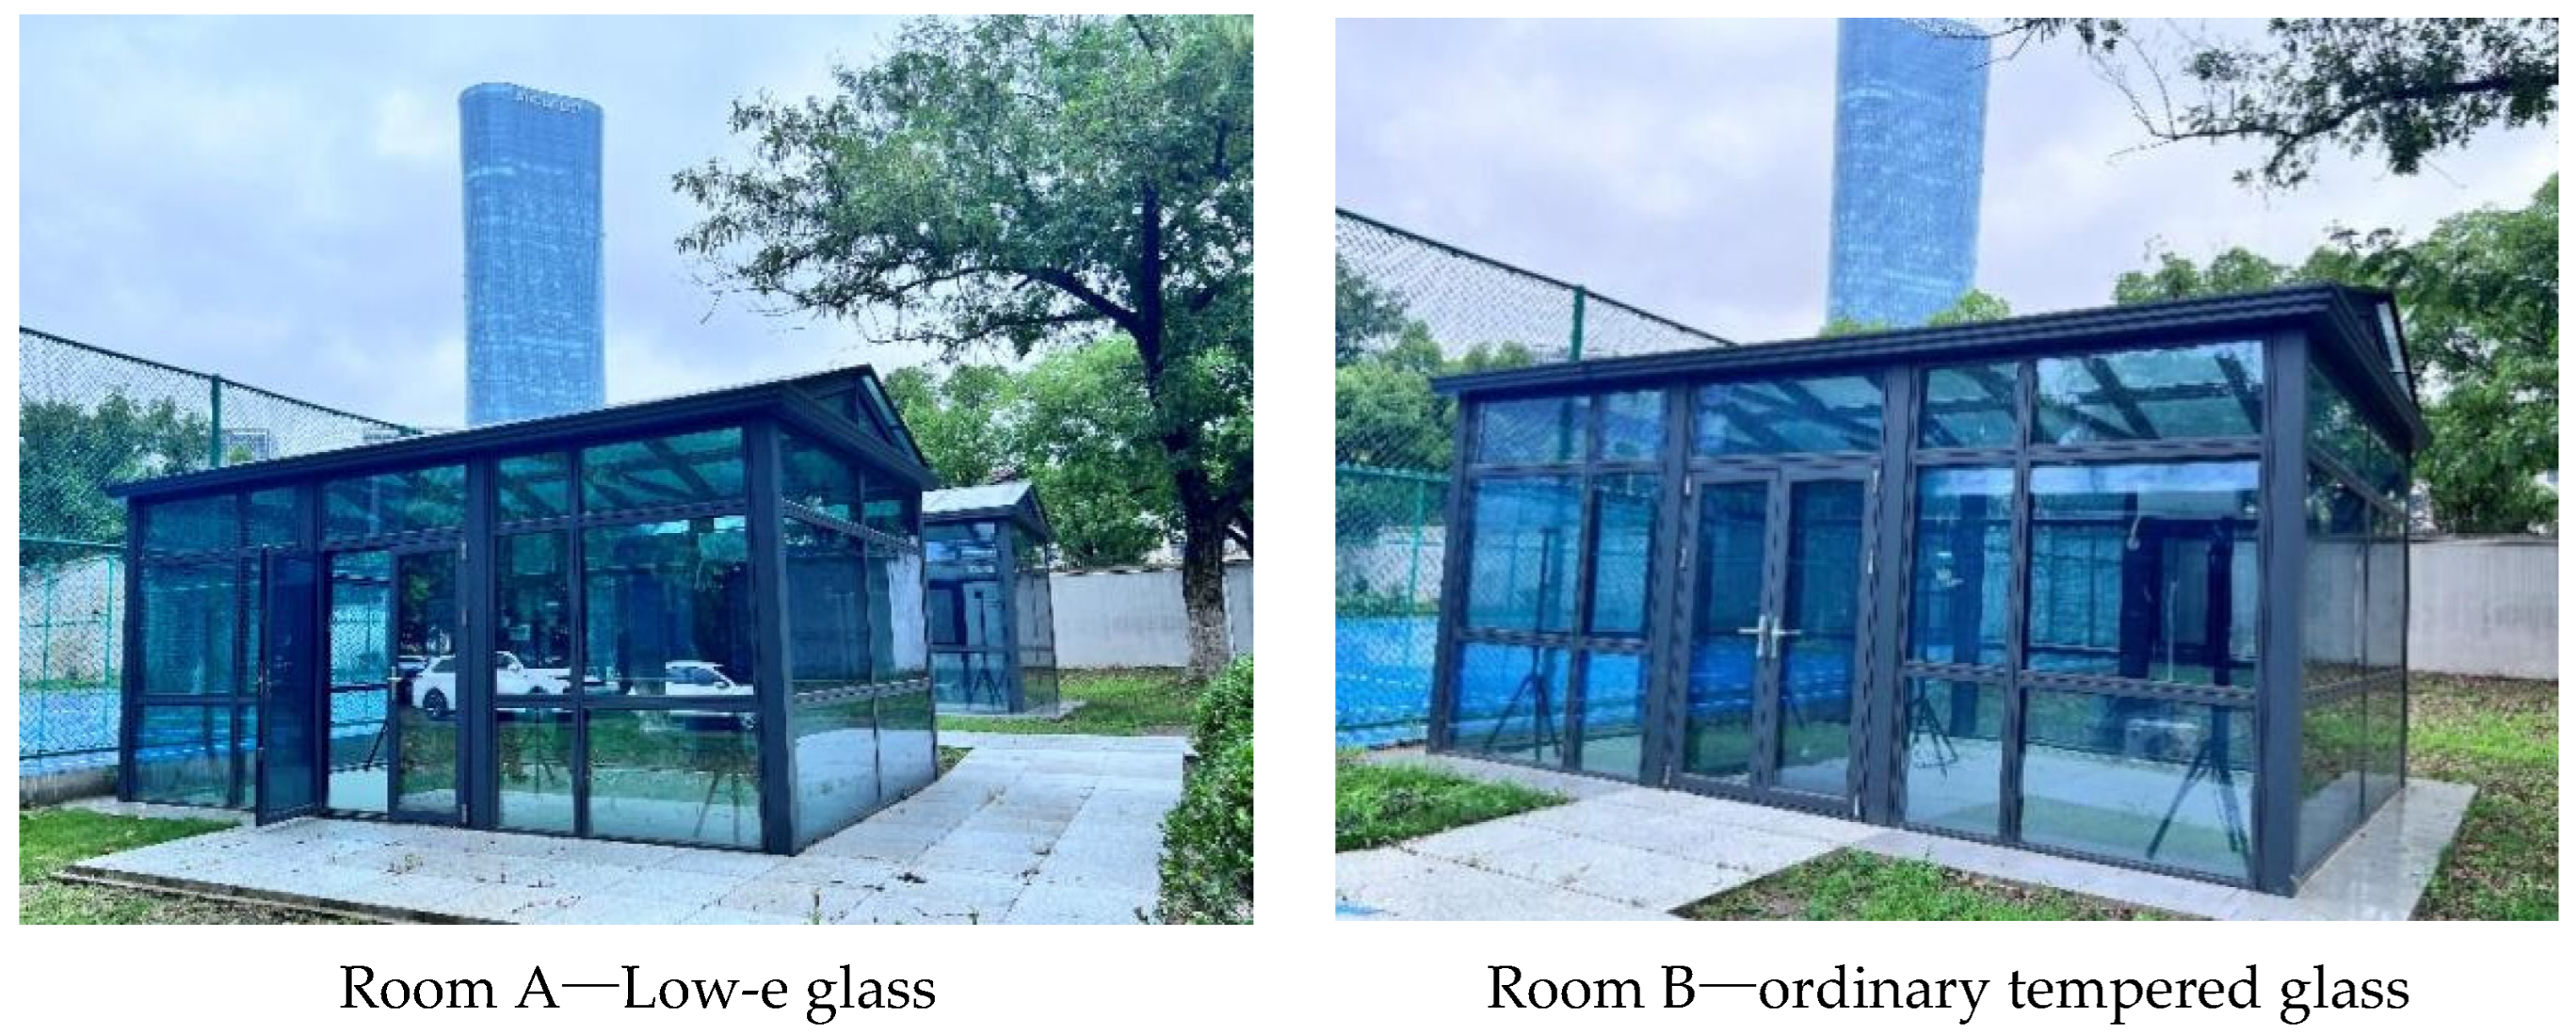
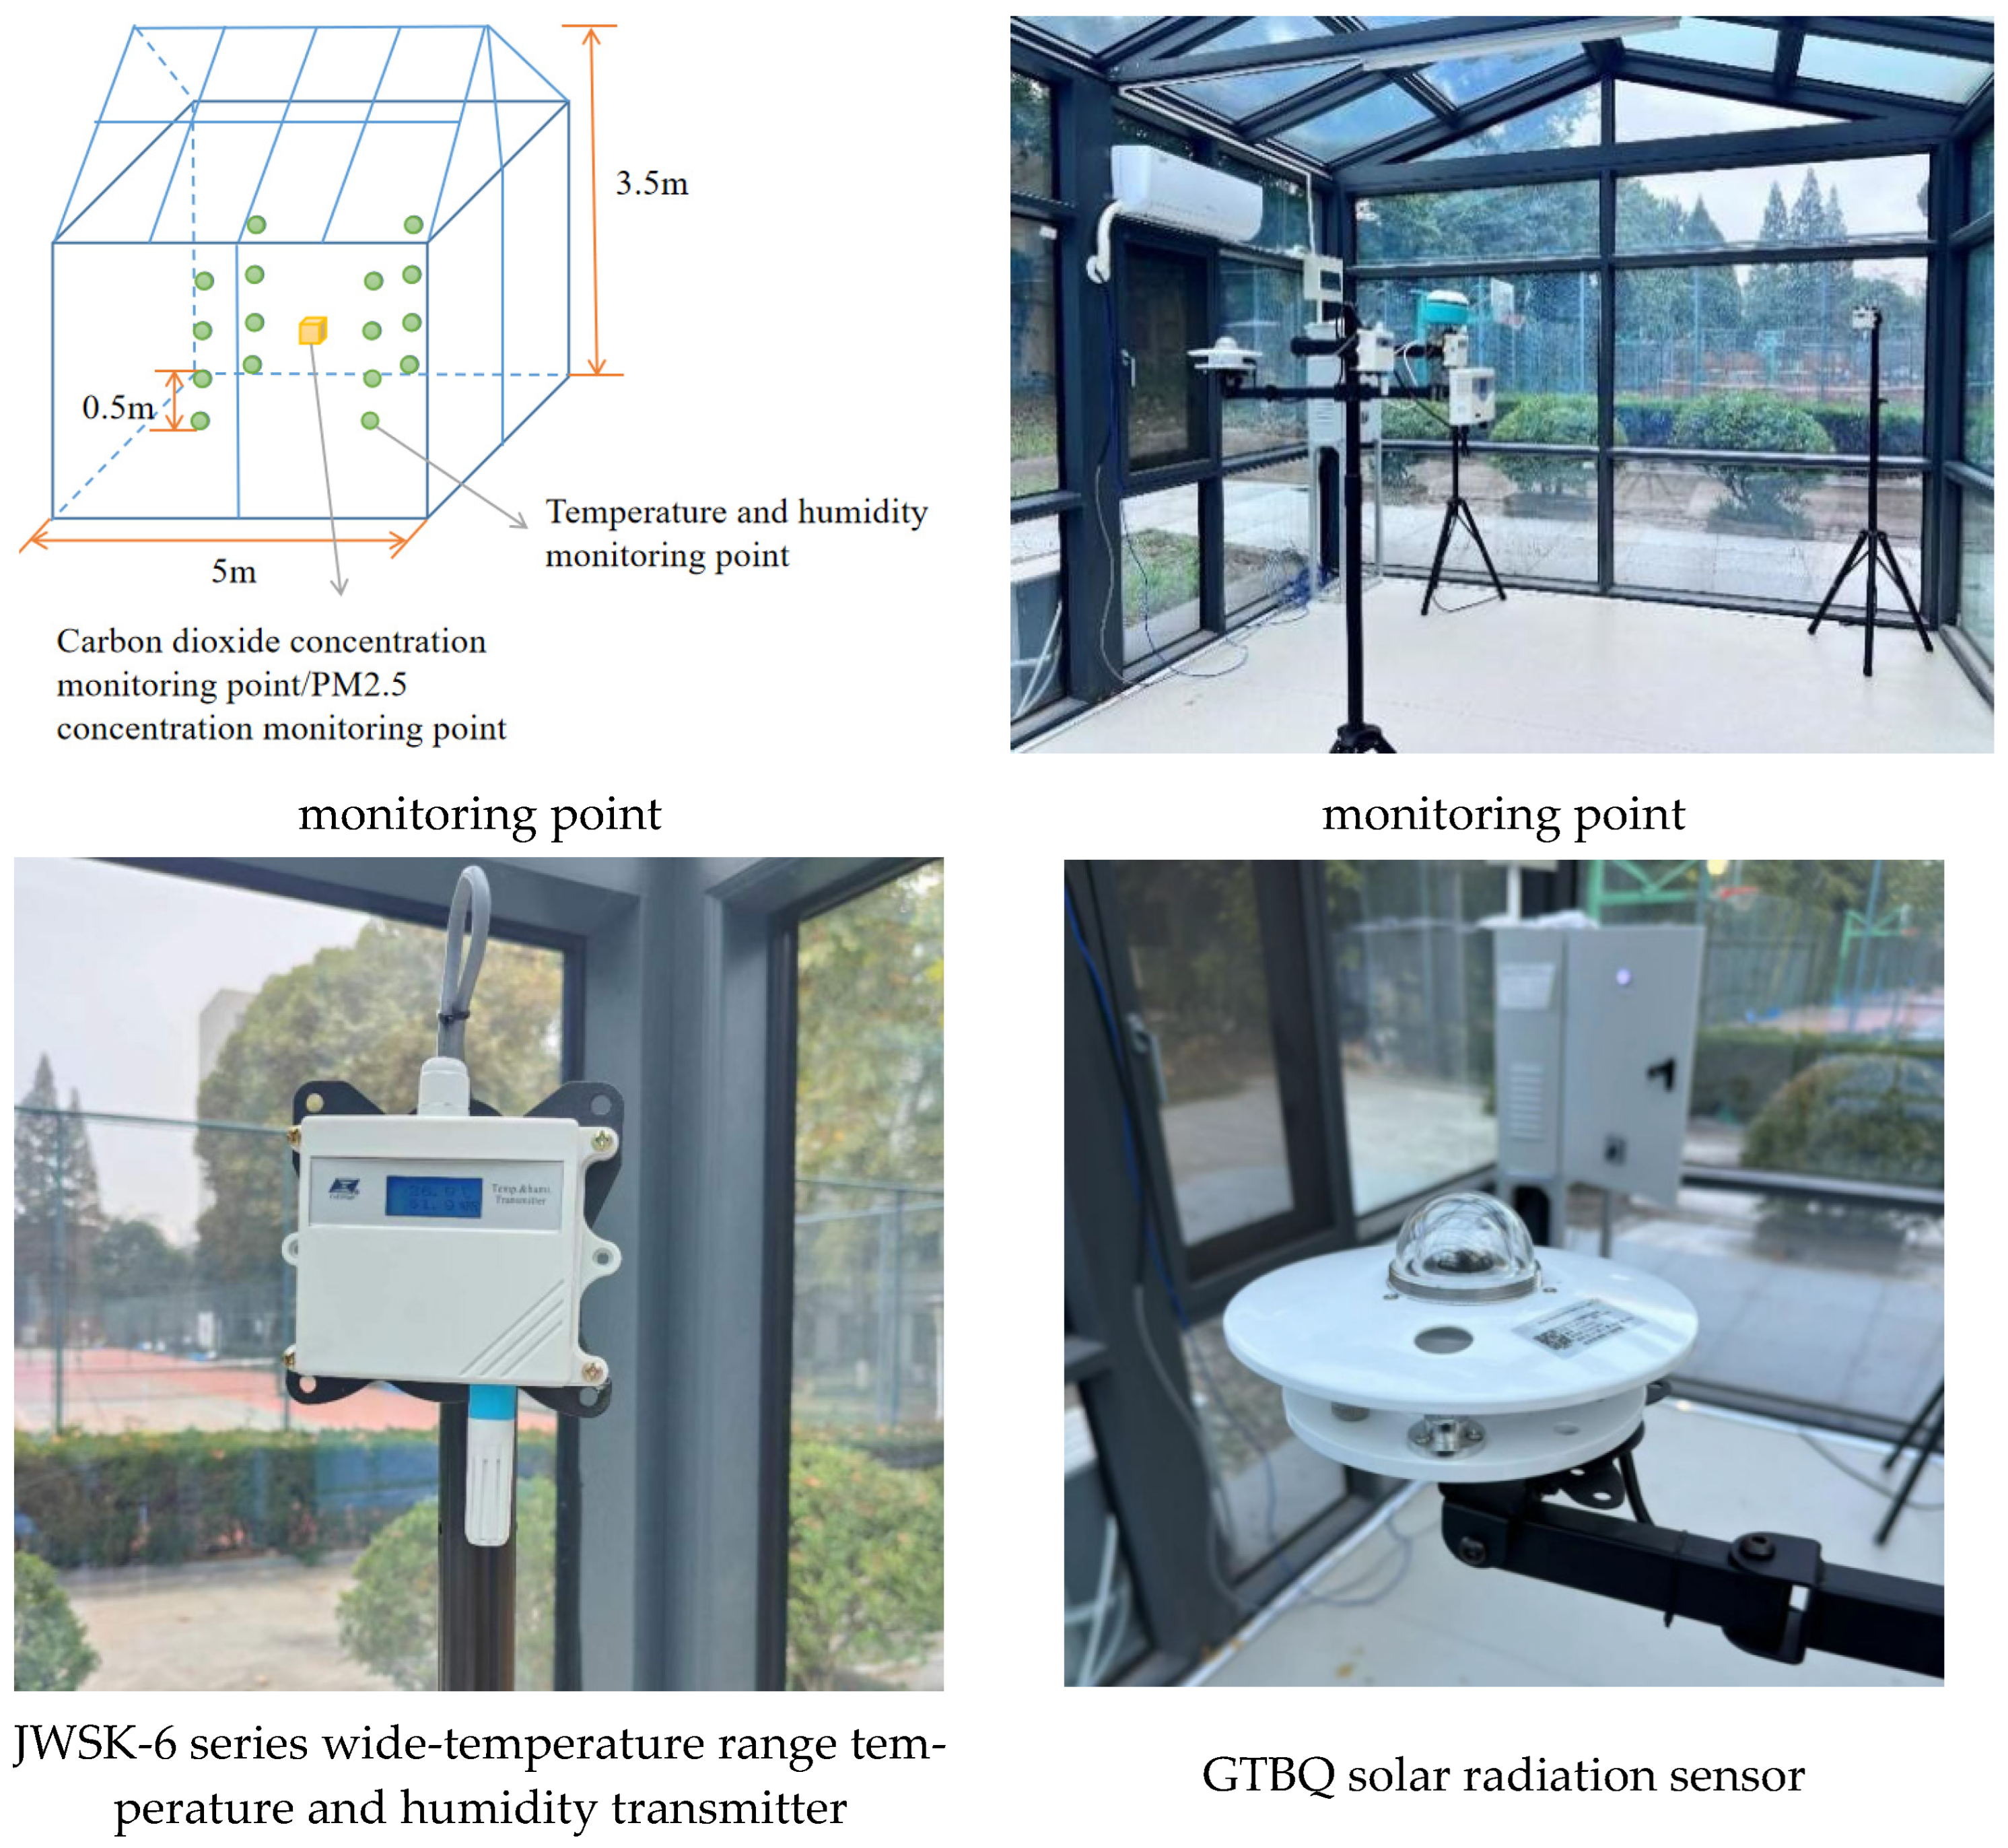
The sunrooms measure 6 m × 1.2 m × 3.5 m, with a building volume of 25.2 m3. One is Sunroom A with Low-e glazing and the other is Sunroom B with ordinary tempered glass. The parameters of the two types of glazing are shown in Table 3, and site photos are given in Figure 4. Temperature, humidity, and thermal radiation measurement points were arranged in both sunrooms. The monitoring point arrangement is described in Table 4, with the indoor measurement point layout and equipment shown in Figure 5. The measurement points were set according to the standard sitting and standing heights used in thermal comfort evaluation, ensuring comparability with commonly used operative temperature and mean radiant temperature indices. The sensors were installed following laboratory-standard procedures: suspended on independent brackets; maintaining an insulation gap of at least 50 mm from walls or glazing to avoid conduction and reflection interference; wiring was routed along the back of the bracket and secured to minimize disturbance to local airflow and radiation fields. The specific information of the experimental equipment is as shown in Table 5. Details of the experimental equipment are listed in Figure 5.
Table 3 parameters are cited from the manufacturer’s certified report, with testing conducted in accordance with ISO 9001 standards [48]; all values are verified through third-party CE certification.

3.2. Measured Analysis of Sunrooms with Different Glazing

In central-southern Anhui, March represents a transitional season with a diurnal temperature difference of 8–12 °C, ideal for capturing the dynamic thermal stability of glass and reflecting the region’s pronounced spring–autumn temperature variations. July marks the high-temperature, high-humidity season, suitable for testing thermal insulation performance. Therefore, experiments were conducted in both transitional and summer periods for the two sunrooms. Considering local climate fluctuations and equipment stability, data were recorded every 5 min. The monitoring lasted from March to August 2024 (six months), with three consecutive clear days selected for comparative analysis. Since solar irradiance fluctuates rapidly due to clouds and obstructions, a 5 s sampling interval was used to avoid missing peak or valley readings. For analysis, this paper selects three consecutive days in transitional seasons and summer under clear outdoor conditions.
Potential systematic errors were analyzed. The main sources of experimental error include sensor calibration bias, data acquisition delay, environmental disturbances, and installation deviations. By using multiple measurement points and repeated sampling, the influence of outliers was controlled within ±0.5 °C. Temperature and humidity sensors were factory-calibrated with accuracies of ±0.5 °C and ±2% RH, respectively, while the solar radiation sensors had ±2% accuracy. The overall system error is estimated to be within ±5%.

3.2.1. Comparative Analysis of Indoor Temperature

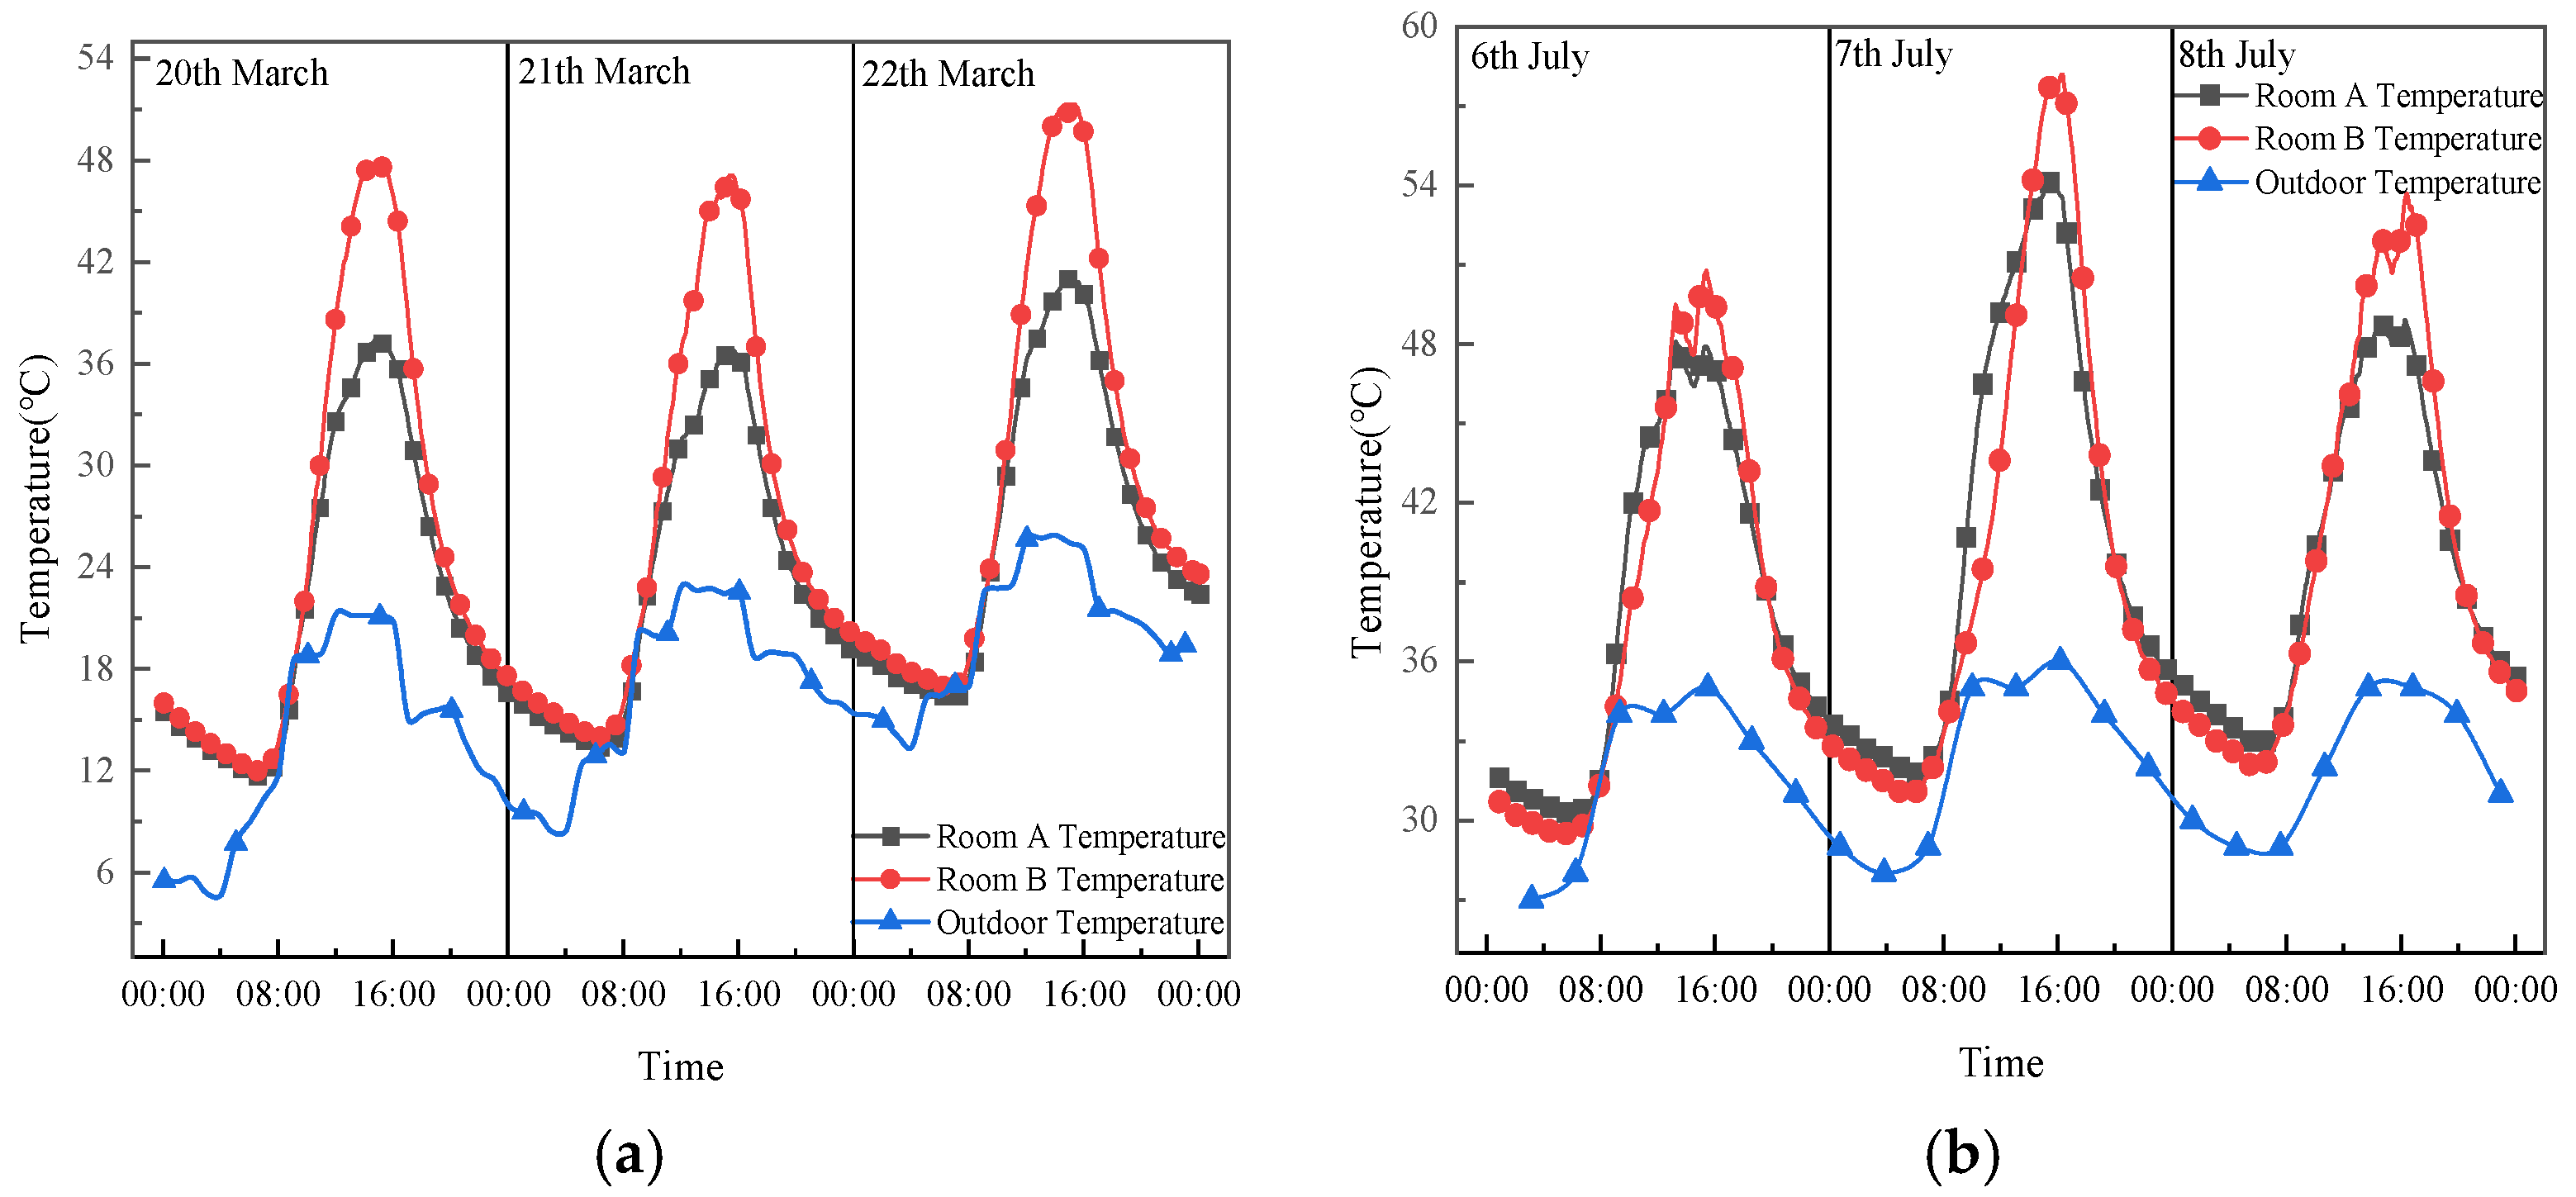
Figure 6 shows indoor temperatures of the two sunrooms with different glazings compared to the outdoor temperature.
As discussed earlier, the spectral components of solar radiation transmitted through glass are visible light and short-wave infrared. Long-wave infrared accounts for only a small proportion of solar radiation; it is reflected and absorbed by glass, and similarly glass blocks long-wave radiation emitted from indoors to outdoors, creating a greenhouse effect. As shown in Figure 6, on clear days, both sunrooms have higher indoor temperatures than outdoor temperatures, with peak temperatures in Room B exceeding those in Room A, and temperature fluctuations in Room A being smaller. As shown in Figure 6, during the transitional season, the indoor maximum temperature in Room A is lower than that in Room B; the minimum nighttime temperatures in the two sunrooms are similar, but they lag the outdoor minimum by 2–3 h. On March 20, the maximum temperature in Room A was about 17 °C higher than outdoors, and Room B about 28 °C higher than outdoors. As shown in Figure 6, in July without window ventilation, on July 8 the maximum temperature in Room A was about 15 °C higher than outdoors, while Room B was about 21 °C higher than outdoors; the nighttime temperature in Room B decreased faster than in Room A. This indicates that the indoor environment of Room A is better than that of Room B, and the heat-insulation effect of Low-e glazing is significantly better than that of ordinary glass.

3.2.2. Comparative Analysis of Indoor Thermal Radiation

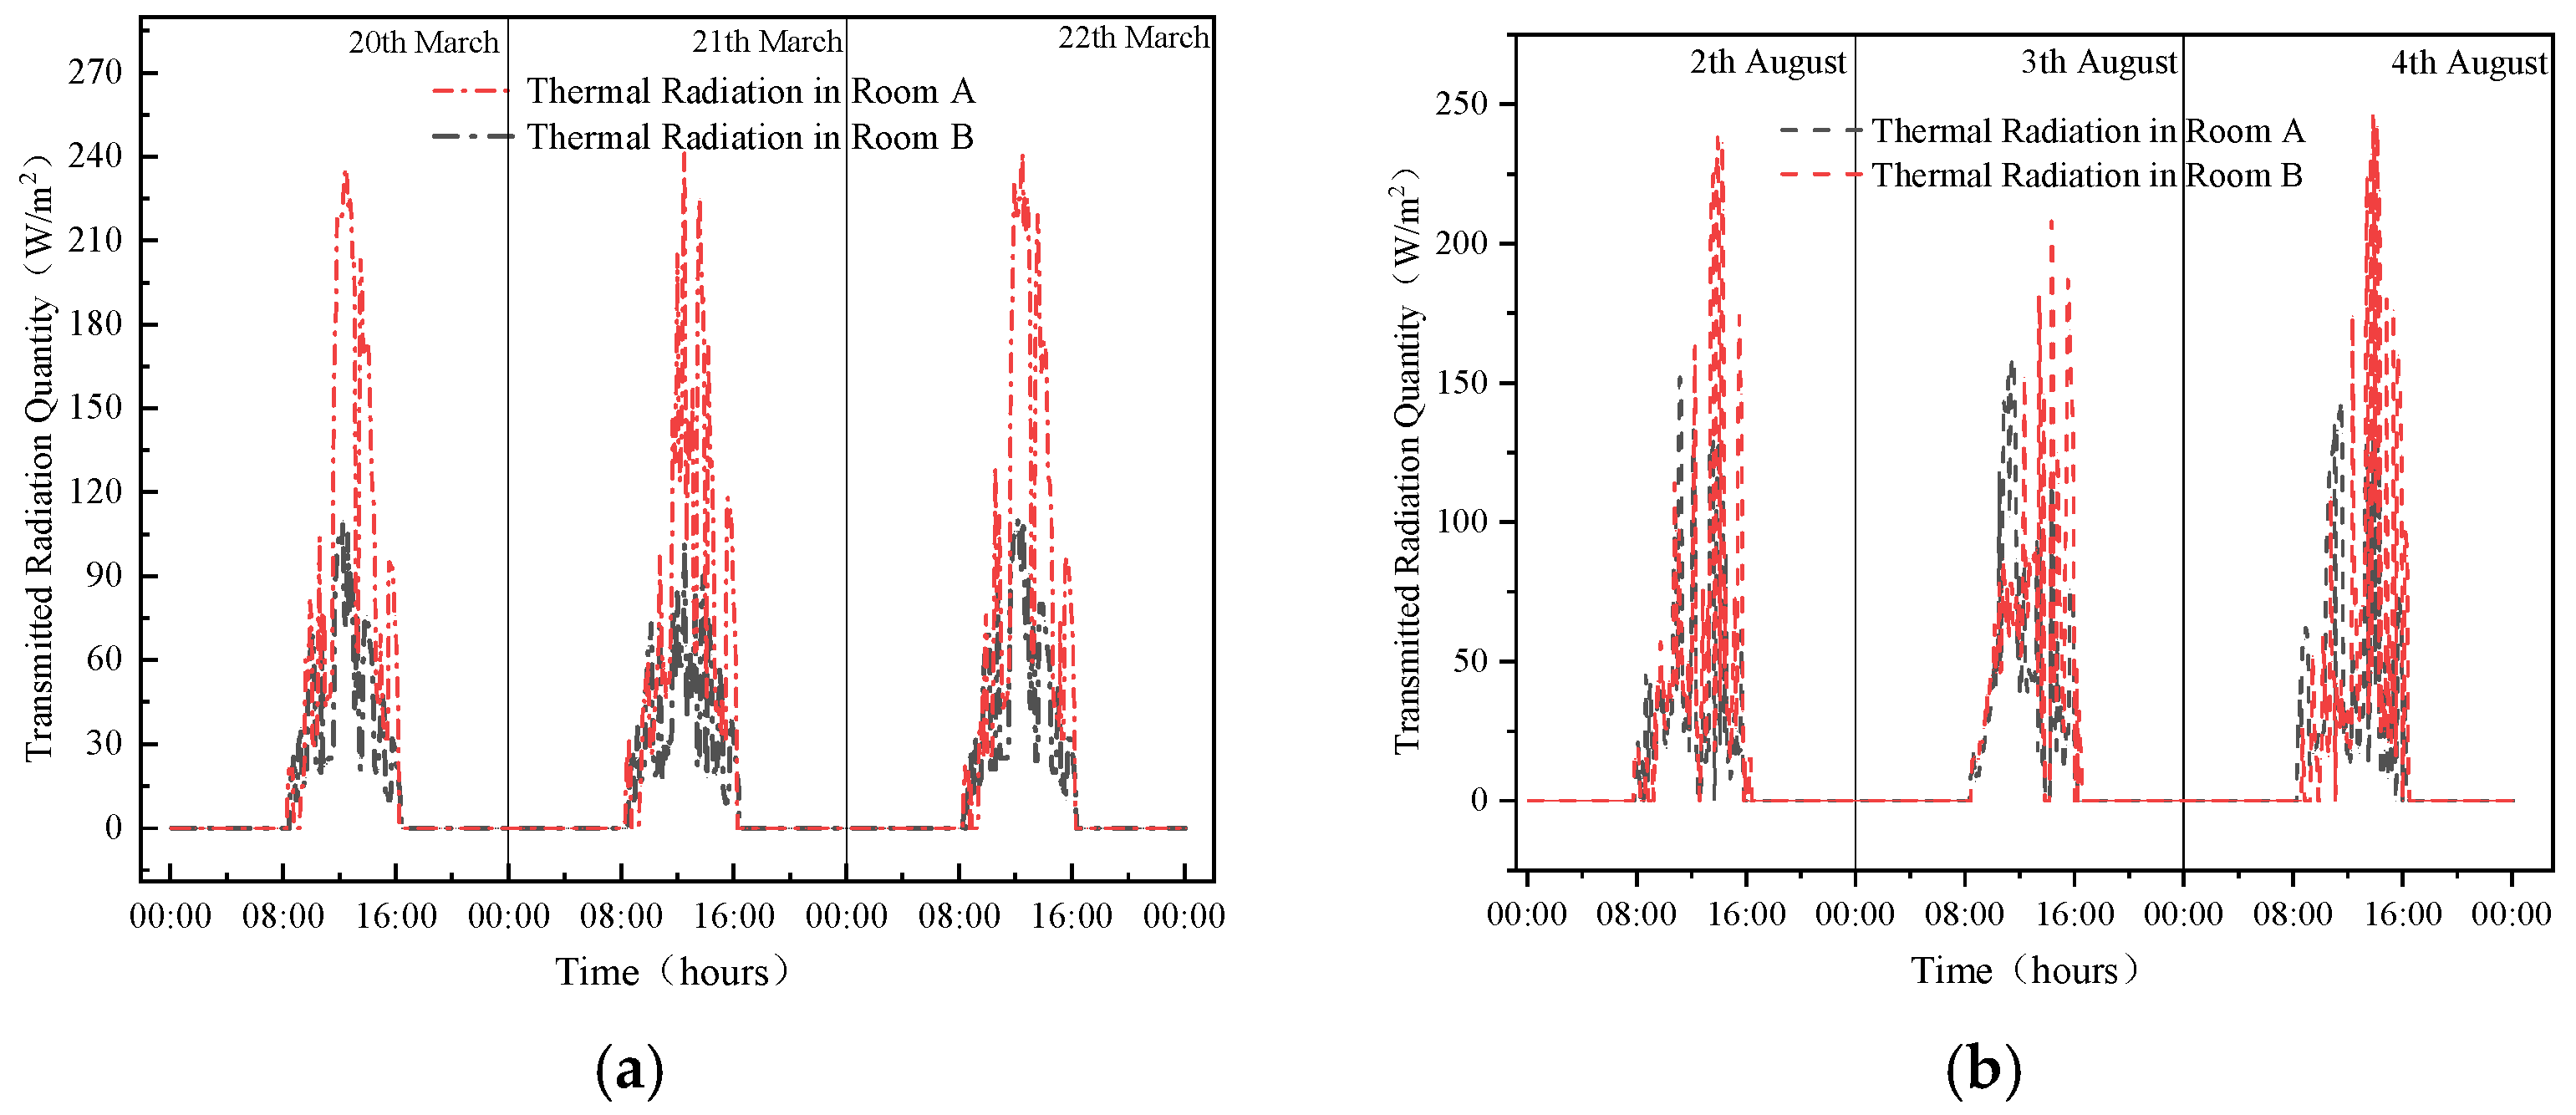
Figure 7 shows the transmitted radiation for sunrooms with different glazings across different seasons. It can be seen that the radiation transmitted through Room B’s glazing is significantly higher than that of Room A. In both transitional seasons and summer, the maximum transmitted radiation in Room B exceeds 240 W/m2. For example, on 20 March, the peak in Room A was 108 W/m2 and in Room B 239 W/m2; Room A was 131 W/m2 lower, and the peak of Room A was 45.19% that of Room B. The total daily radiation in Room A on the 20th was 4130 W/m2, compared to 9115 W/m2 in Room B; Room A was 45.31% of Room B. On August 4, the maximum in Room A was 144 W/m2 and in Room B 246 W/m2; Room A was 102 W/m2 lower and its peak was 58.54% that of Room B. The total daily radiation in Room A was 4783 W/m2 and in Room B 6243 W/m2; Room A was 76.6% of Room B. Seasonal differences in transmission arise partly from glass performance and also from solar altitude. Therefore, for solar radiation transmittance, Low-e glass significantly outperforms ordinary tempered glass. In transitional seasons, the transmitted radiation in Room A is less than half of that in Room B.

4. Simulation Study of Glass Performance in the High-Performance Sunroom Laboratory

4.1. Selection of Simulation Software

This paper uses the software Ecotect 2011 for daylighting and illuminance analysis. As an integrated building performance simulation tool, Ecotect combines an intuitive modeling interface with accurate light-thermal calculations, efficiently simulating comprehensive performance of different glazing types in terms of solar radiation, heat transfer, and daylighting. It is particularly suitable for dynamic energy evaluation and parameter optimization of transparent envelopes. The software includes basic meteorological data such as temperature, pressure, wind direction, and solar radiation. As essential environmental inputs, weather data are critical to simulation accuracy. Ecotect also offers multiple modules including CFD analyses of building environments, solar access and shading, and daylighting analysis.

4.2. Model Building and Parameter Settings

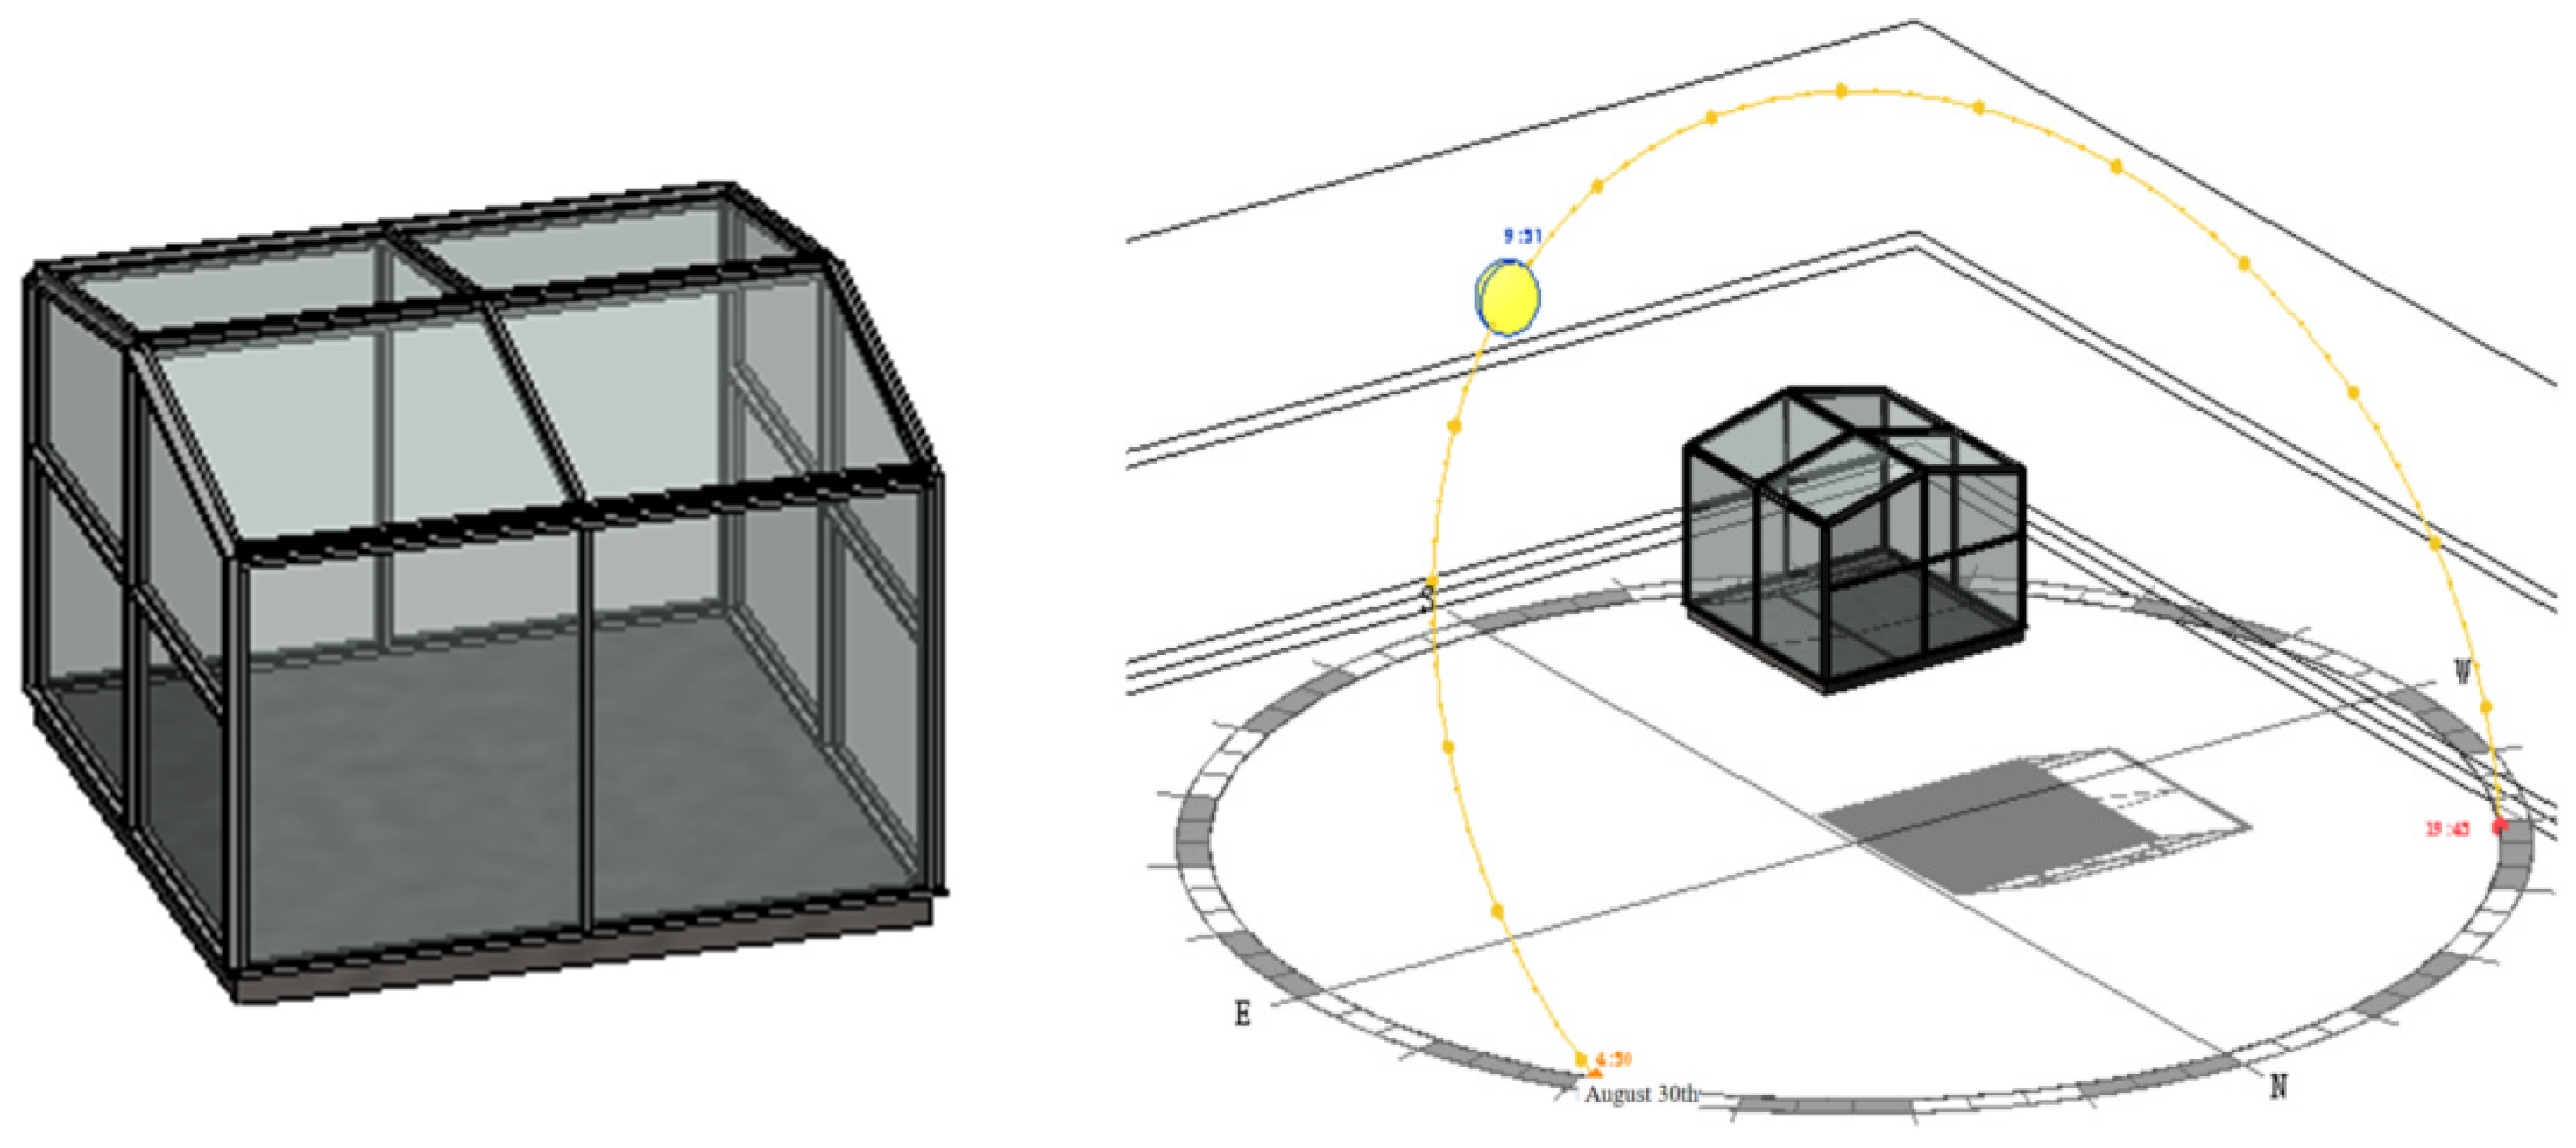
A sunroom model was established, as shown in Figure 8, with dimensions 5 × 5 × 3.5 m and a building area of 25 m2. A dual-slope roof with 20° pitch was adopted, with side windows and roof vents at the same positions. Parameters for equipment and occupancy in the sunroom (e.g., heating ventilation and air conditioning units, occupants, open hours) were kept consistent across scenarios. No heat recovery system was used. Indoor design conditions were as follows: clothing insulation 1.00 clo (clothing insulation unit). In the Ecotect simulation, the model was designed with dimensions of 5 × 5 × 3.5 m instead of the measured sunroom size of 6 × 1.2 × 3.5 m. This adjustment aimed to create a standardized, symmetrical, and computationally stable space, thereby reducing the geometric effects of elongated structures on daylight distribution and radiation patterns. The square model allowed for more reliable comparison of different glass types while maintaining the same height and physical characteristics as the experimental sunroom. Therefore, the simulation model and the measured model are conceptually consistent—the former serves for idealized parameter analysis, while the latter provides validation under real environmental conditions.
Meanwhile, there are certain differences between the glass samples used in the experiment and the simulation. In the experiment, Triple-Silver Low-e tempered glass (6 Low-e Triple-Silver + 12A + 6T) and ordinary double-glazed tempered glass (5T + 12A + 5T) were used. However, the Ecotect database does not contain identical parameter models for these materials. To ensure analytical consistency, Case XV (vacuum composite Triple-Silver Low-e glass) and Case III (6 + 12A + 6) were selected as corresponding substitutes in the simulation. Their thermal performance parameters—including thermal transmittance, transmittance, and shading coefficient—remained within comparable ranges, thus ensuring that the performance trends and conclusions of the study remain scientifically valid.
Because solar altitude varies, received illuminance also differs by location; hence daylight factor standards vary by region. Table 6 lists outdoor light climate [42] coefficients K for different zones.
In terms of regional selection, this study focuses primarily on Hefei and Huangshan. Both cities—Hefei (central Anhui) and Huangshan (southern Anhui)—are located in the hot-summer–cold-winter zone of central and southern Anhui and belong to the Type IV daylighting climate category. However, they exhibit key climatic differences: Huangshan lies at a lower latitude, experiencing stronger solar radiation in summer and milder winters. These two locations, respectively, represent sub-climates and sunroom application scenarios characterized by “balanced winter–summer thermal loads” (Hefei) and “summer insulation priority” (Huangshan). Moreover, both cities provide comprehensive meteorological datasets to support the analysis.
This regional contrast allows the study to quantify the thermal parameter requirements of glazing systems in both areas and to establish refined, differentiated design strategies. The findings directly contribute to the research objective of “regionalized transparent envelope design,” addressing the issue of poor regional adaptability in existing sunroom construction while providing empirical support for the practical implementation of near-zero energy building standards.

4.3. Daylighting and Illuminance Simulation

Based on Table 6, with outdoor solar illuminance set to 4500 lx, ECOTECT was used to simulate daylight factors for 12 different glazing types, as shown in Table 7. Among them, A–E are common glazings in existing buildings, and F–M are triple glazings with two cavities, commonly used in near-zero energy buildings. F–H are argon-filled IGUs; J–L are vacuum composite IGUs with different silver coatings; M is an argon-filled vacuum composite IGU.

4.3.1. Daylight Factor Analysis for Different Glazings

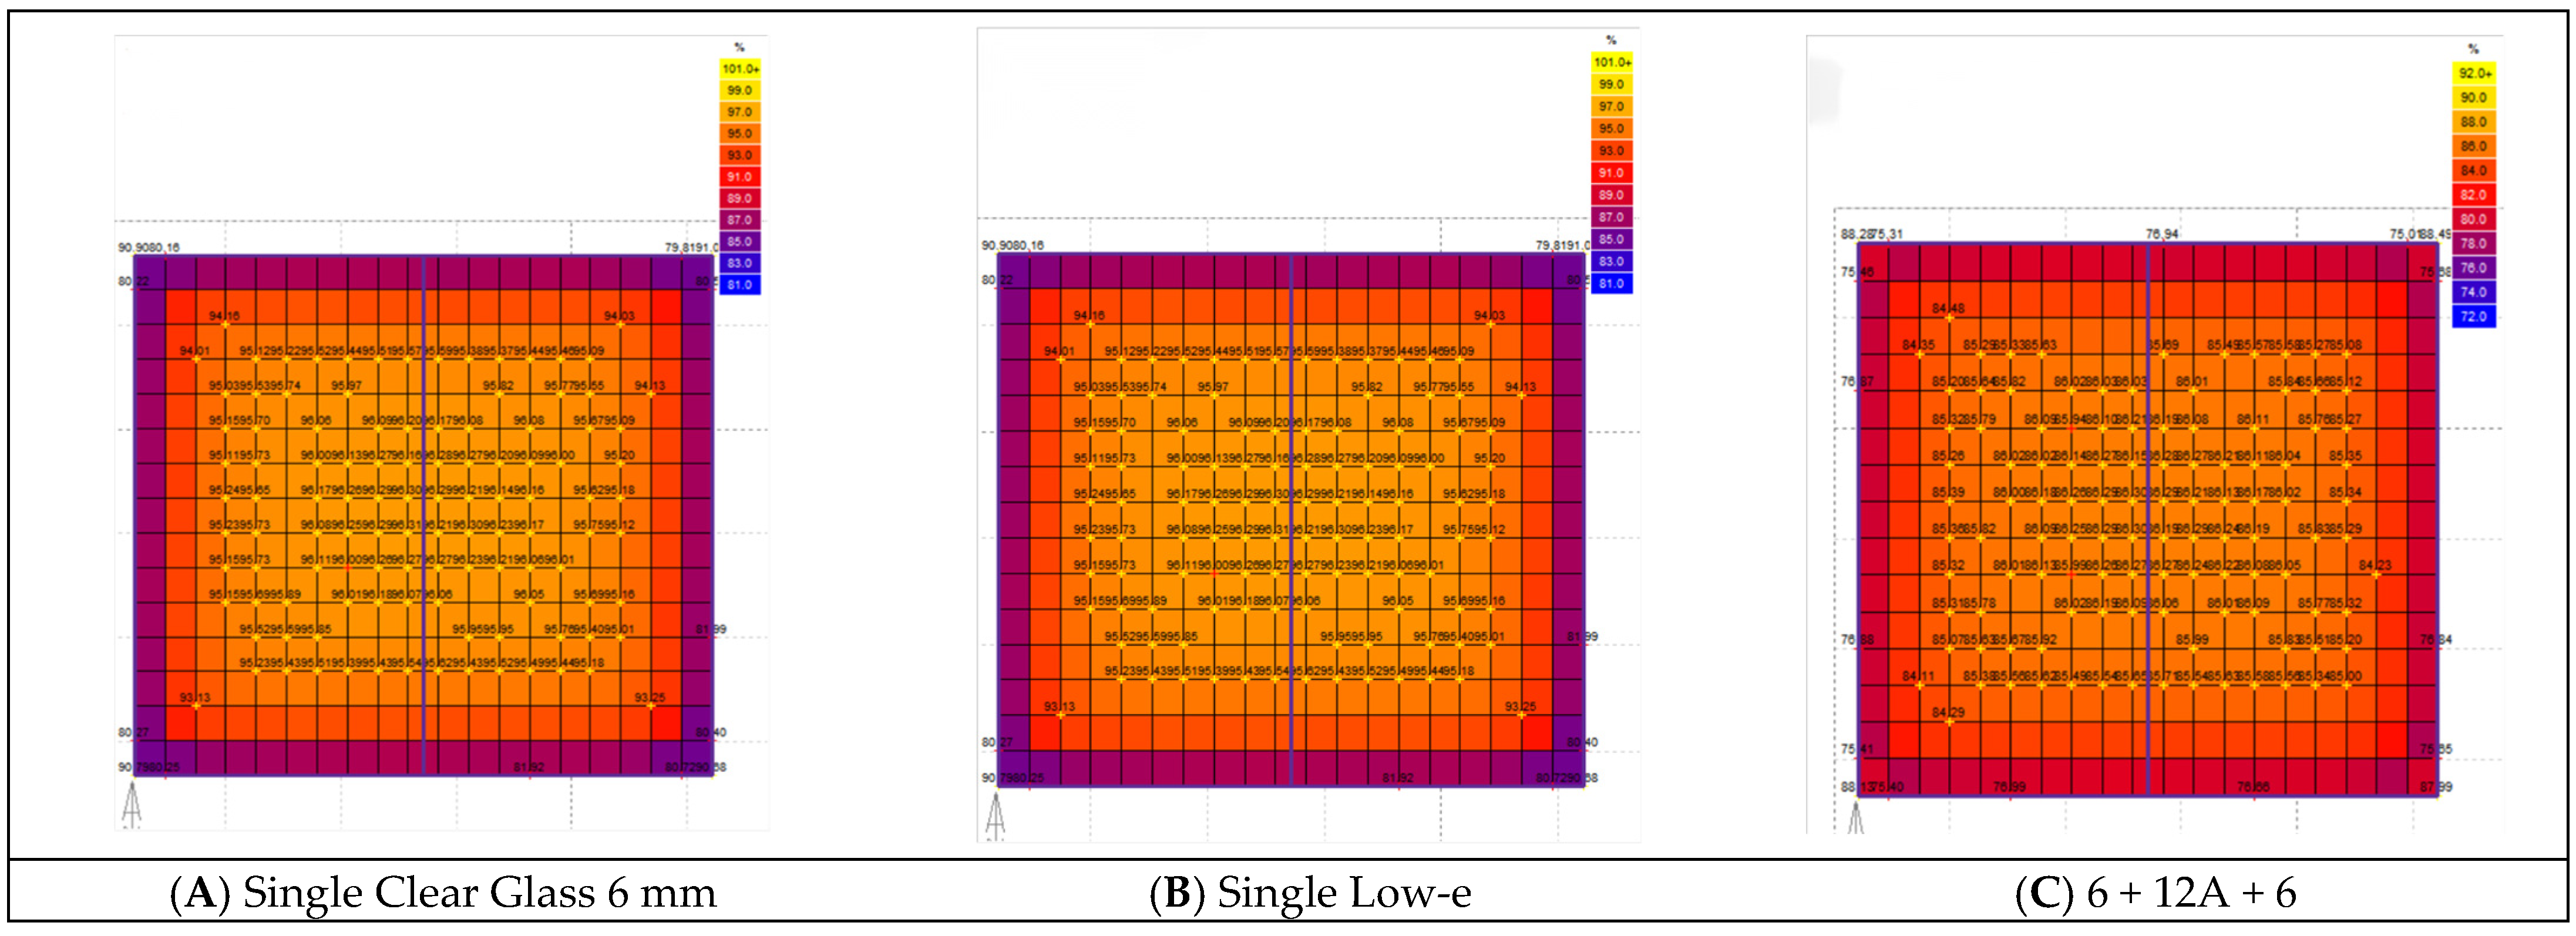
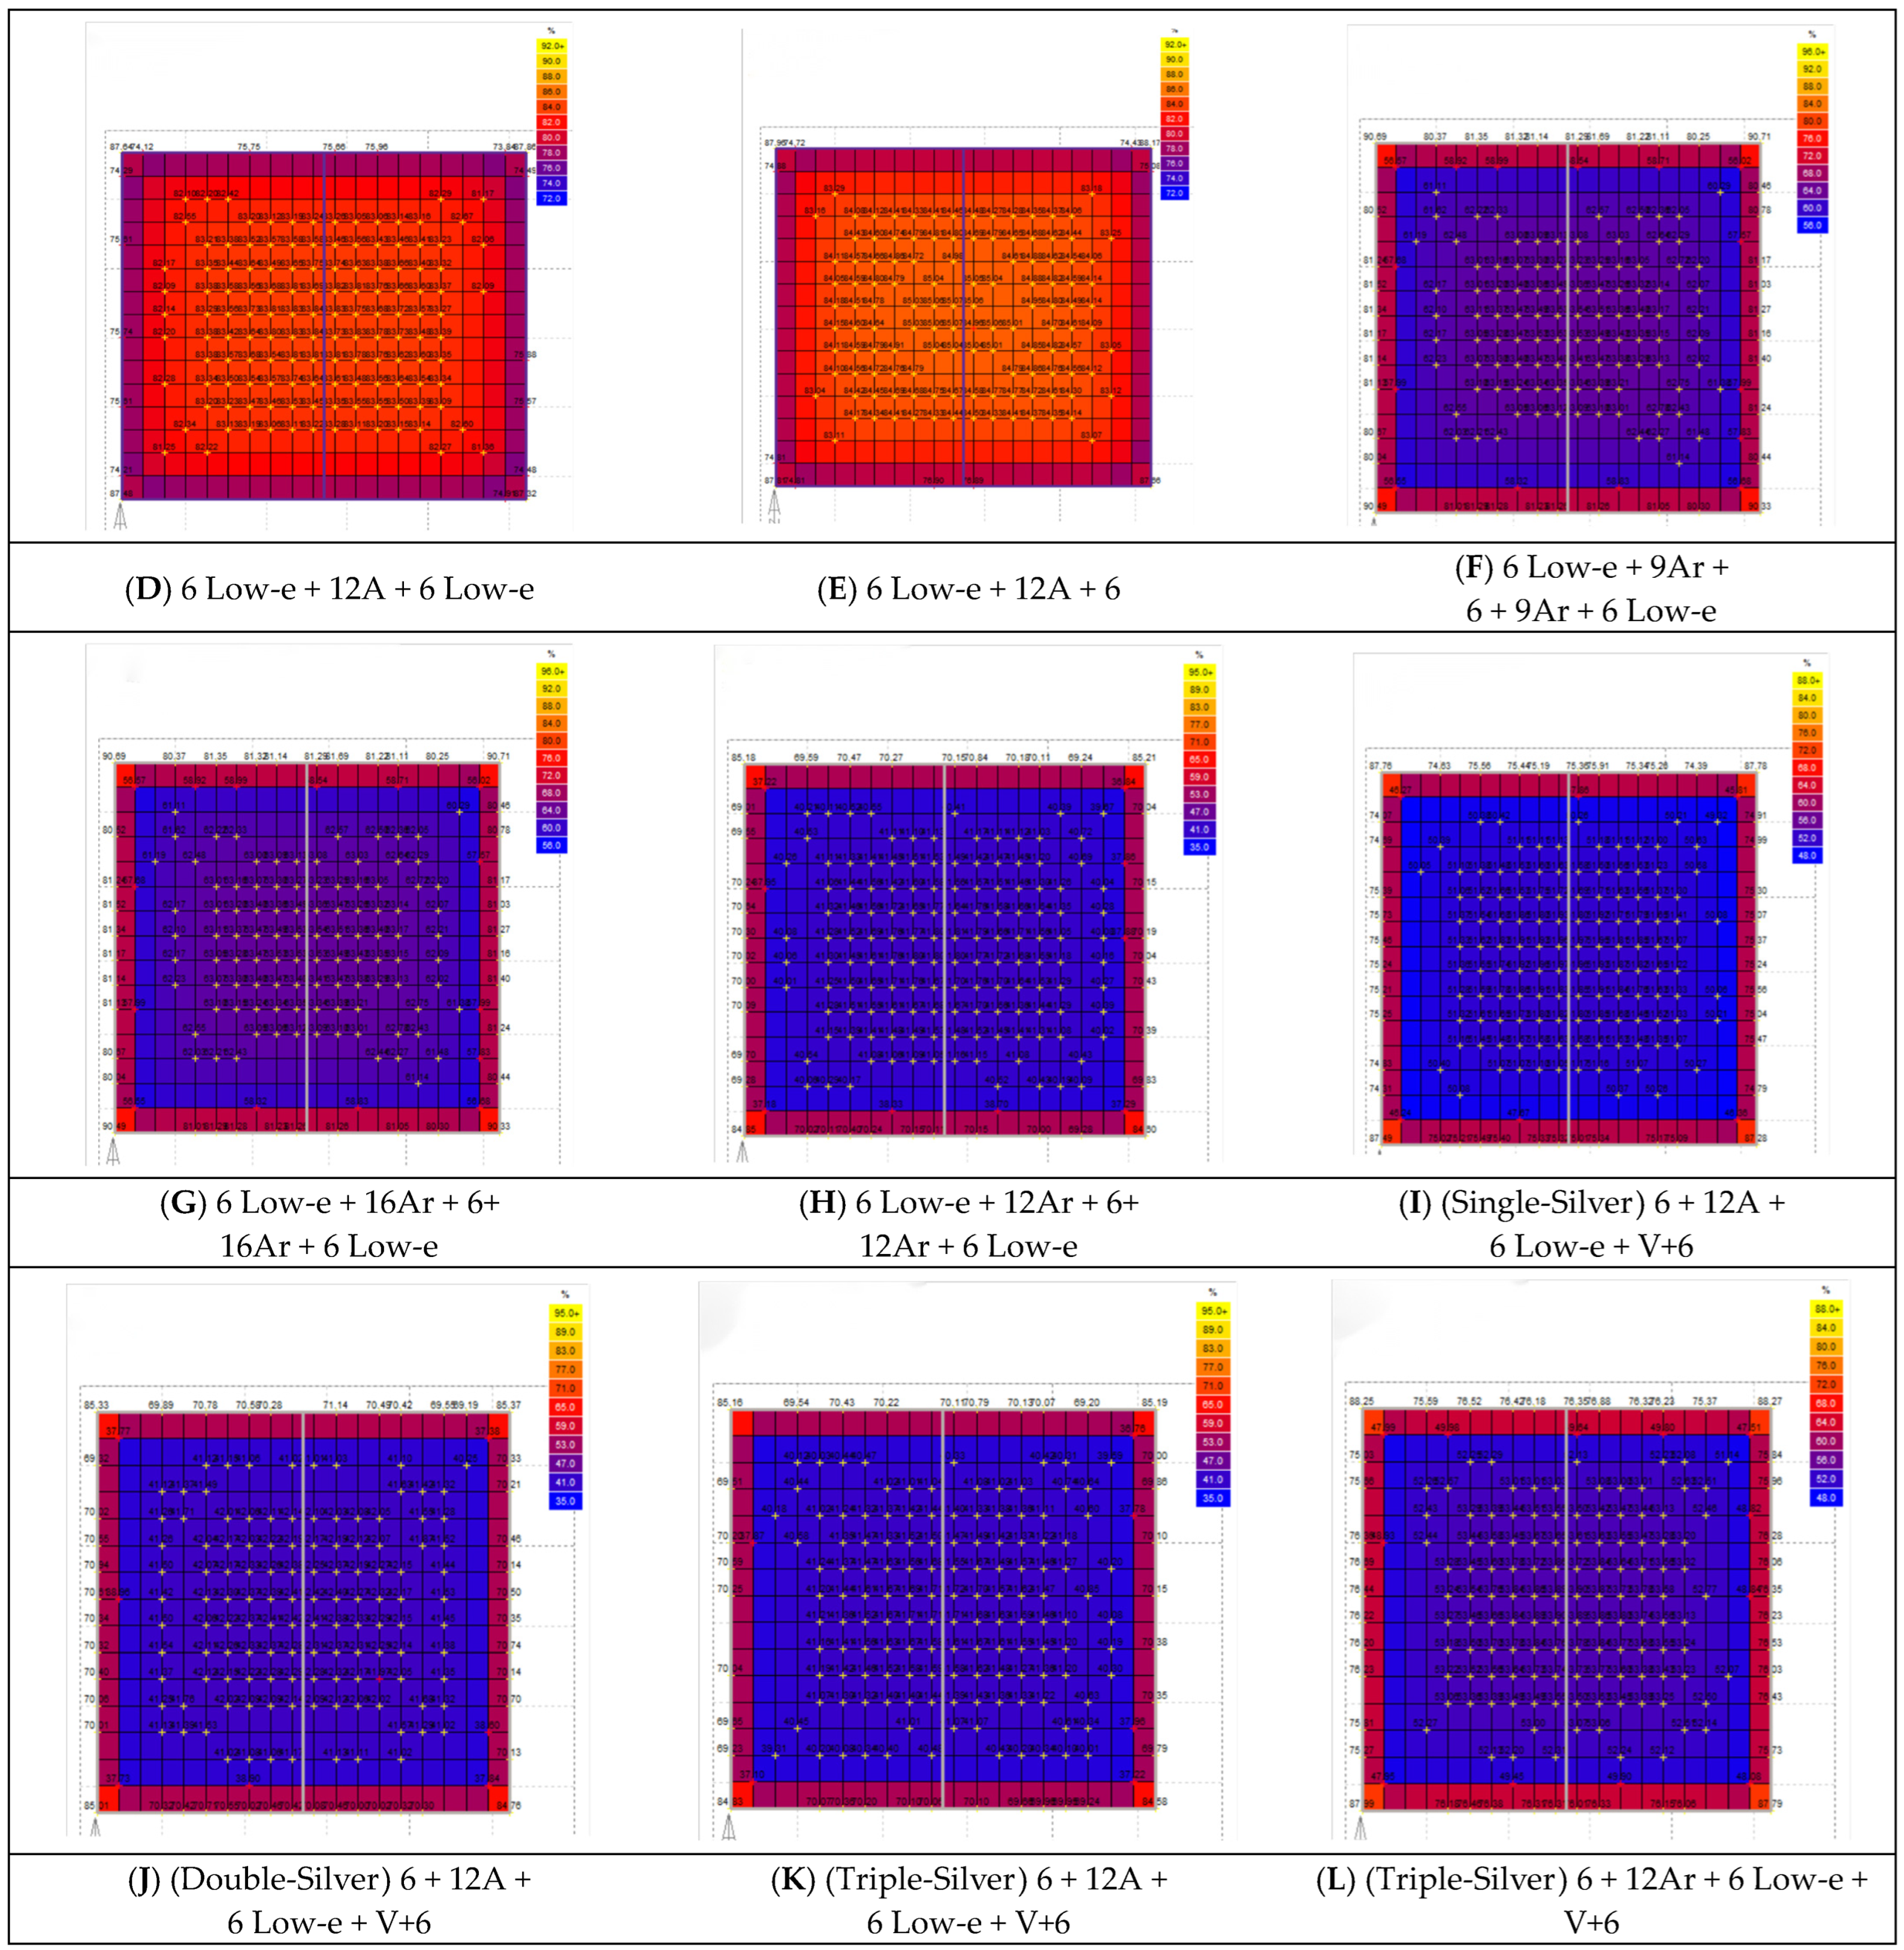
Figure 9 shows the daylight factor distribution on the horizontal plane for sunrooms with different glazings.
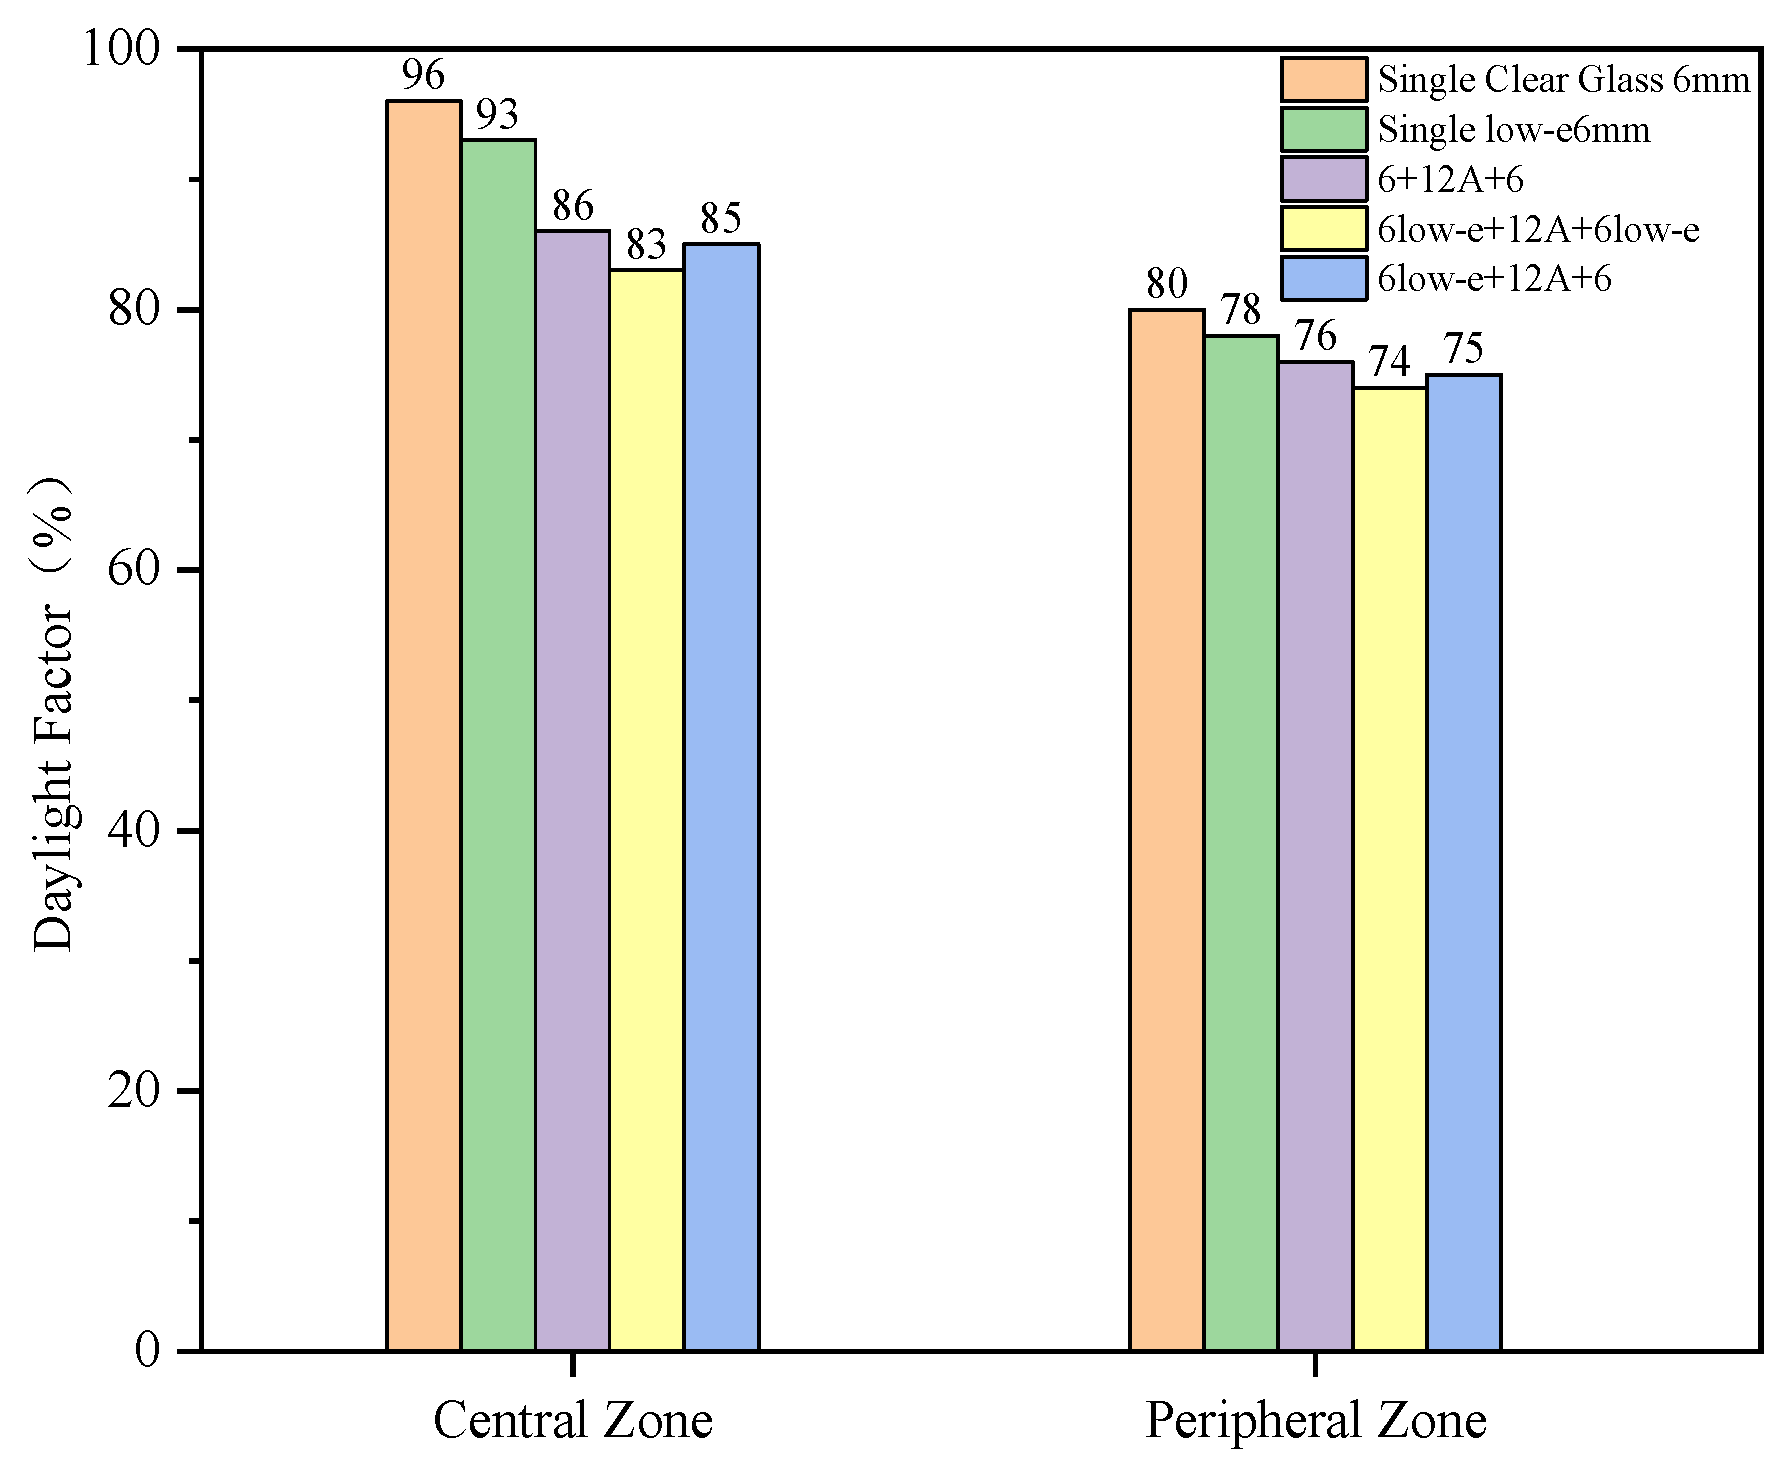
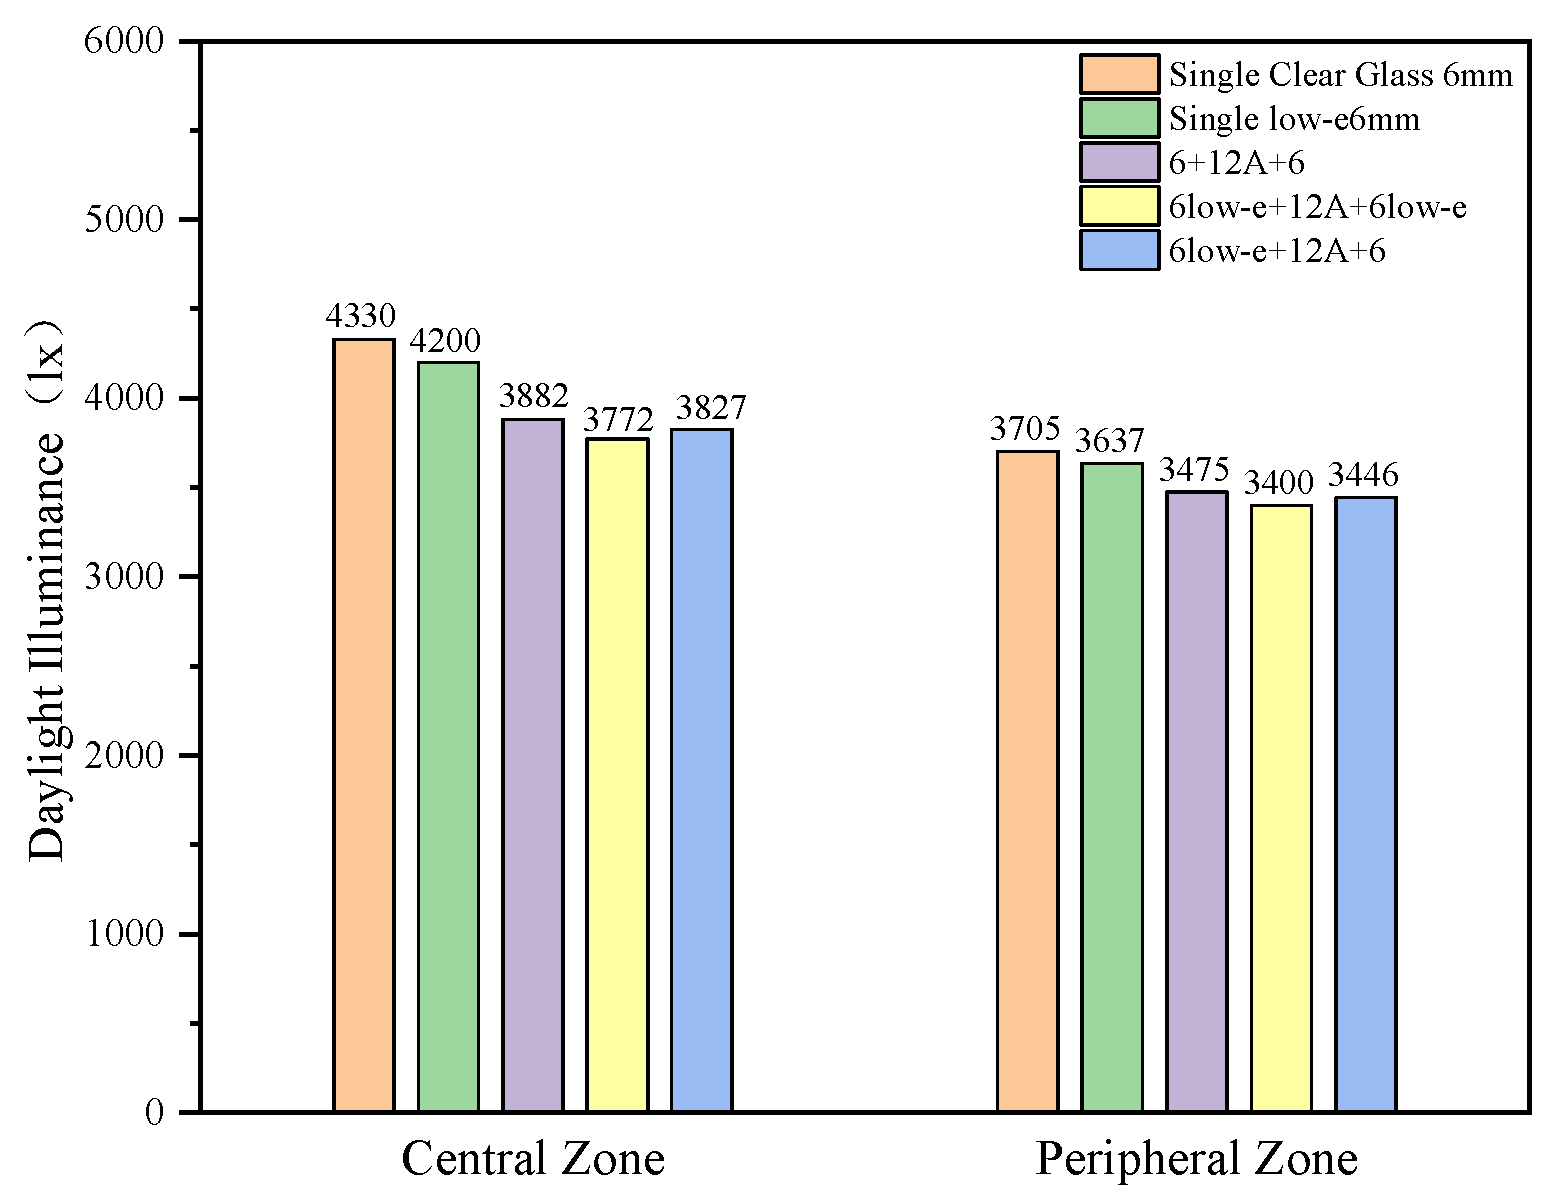
From Figure 10, under identical lighting conditions and weather, different glazings yield differences in daylight factor and natural daylight illuminance. Single clear glass provides the best daylighting; the center reaches 0.96 and the periphery 0.8. The single Low-e pane also shows good daylighting, with a center of 0.93 and periphery 0.78. Double Low-e glazing has the smallest daylight factor; center 0.83 and periphery 0.74. For 6 Low-e + 12A + 6, the center is 0.86 and periphery 0.76; double clear glazing slightly outperforms them with a center of 0.86 and periphery 0.76. Hence, single clear glass has the best daylighting, while daylighting among the three double-glazing types differs by within 3%. The difference between center and periphery is about 10% for different glazings; double Low-e has the smallest difference (9%), while single glazing varies the most (16%), indicating more uniform radiative daylighting with double Low-e.
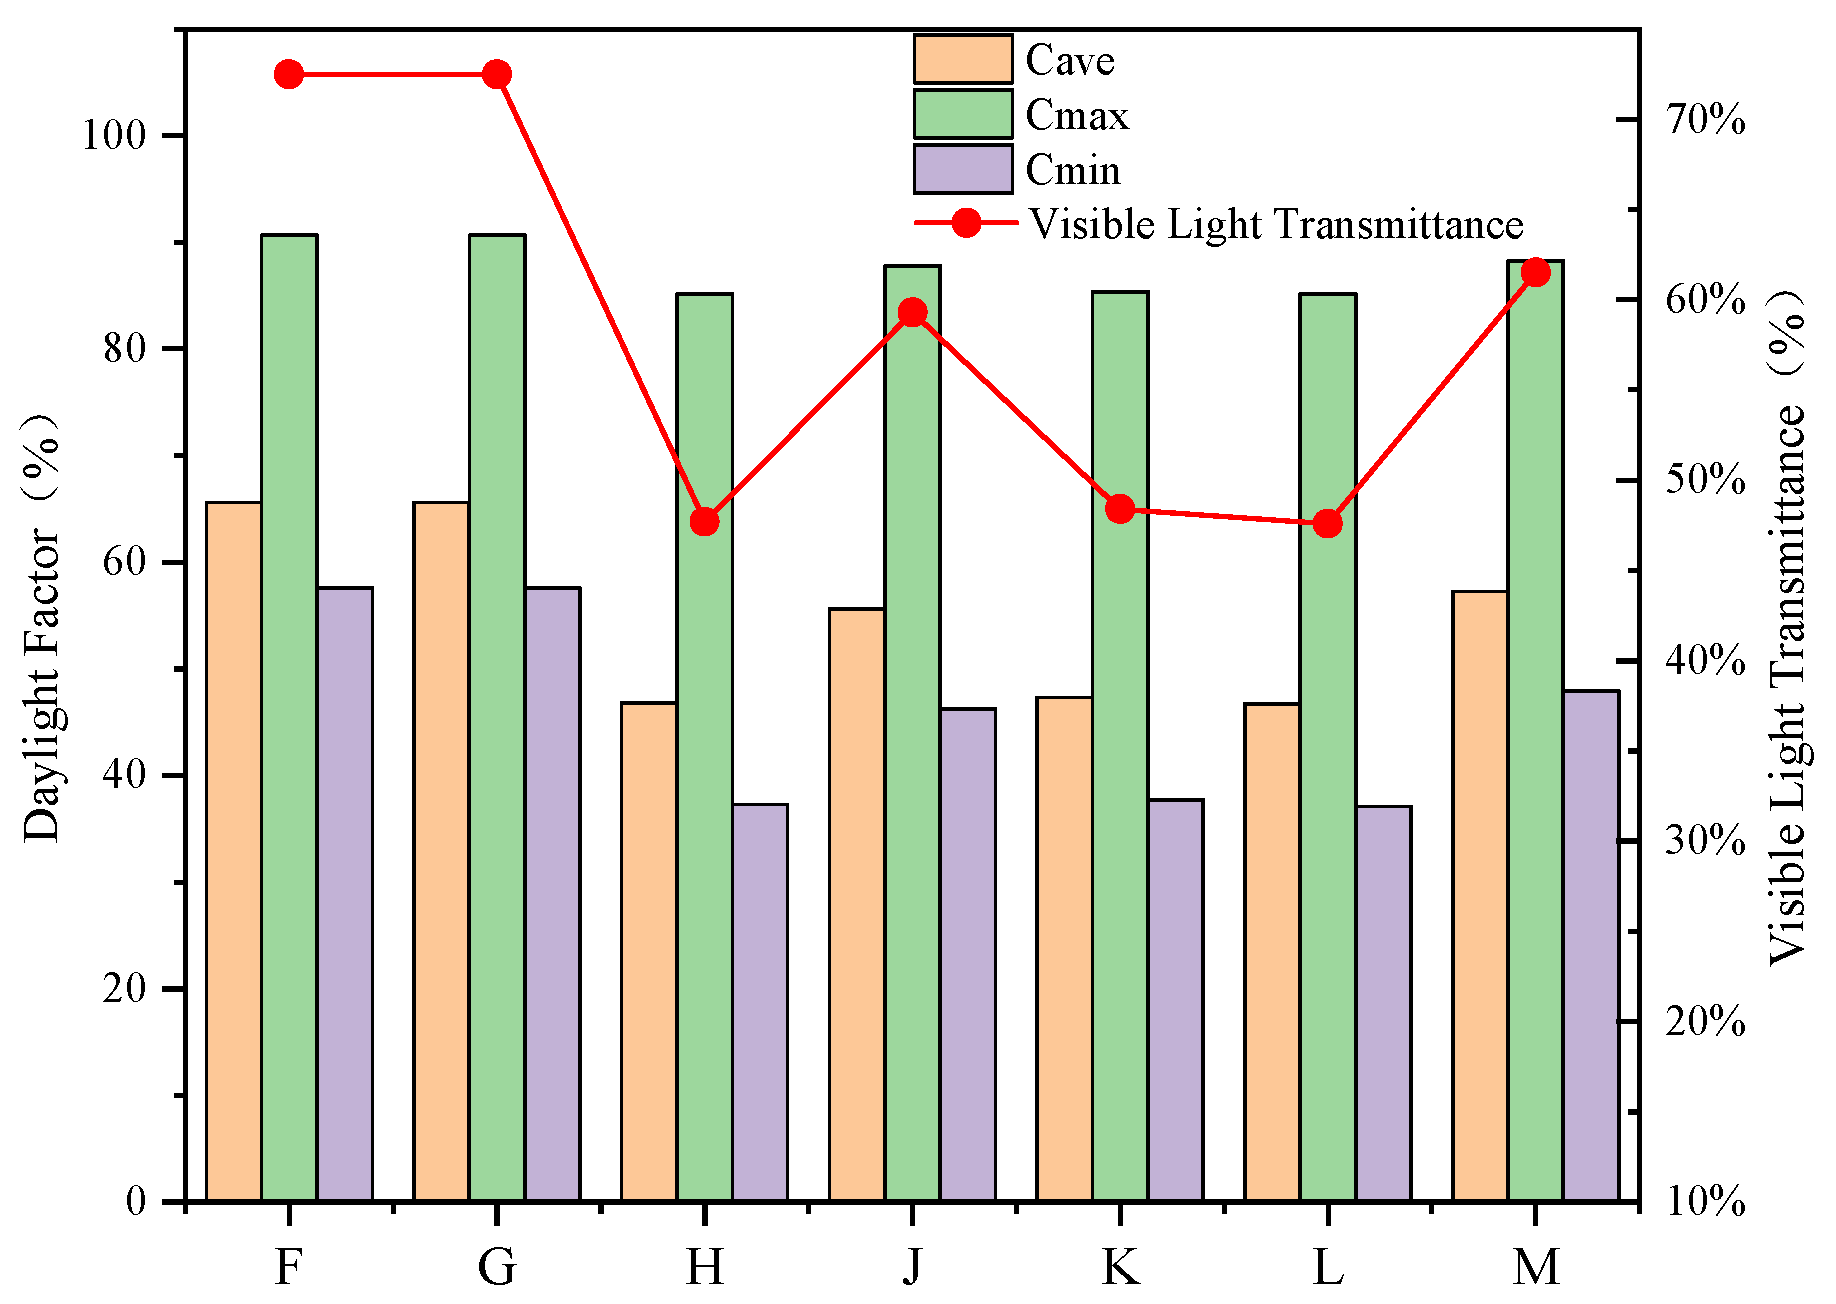
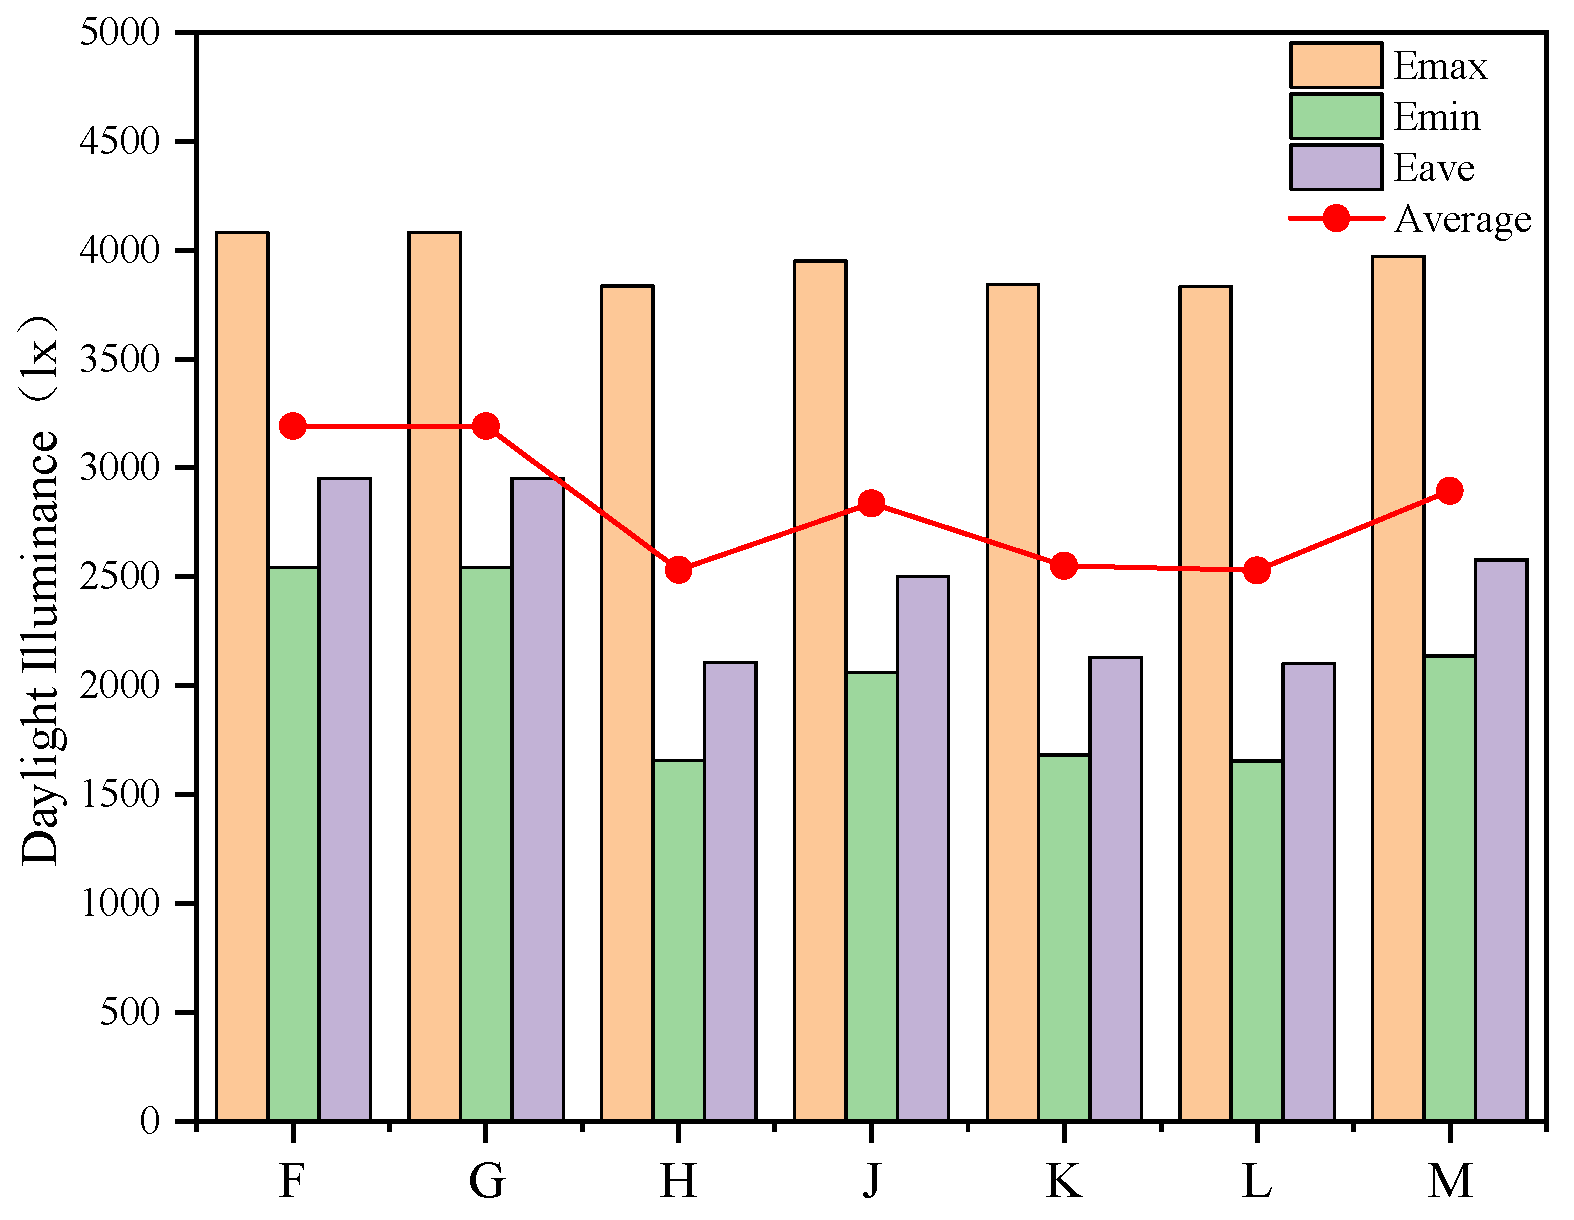
Cmax denotes maximum daylight factor; Cmin minimum; and Cave average daylight factor. As seen in Figure 11, daylight factor mainly depends on visible transmittance. F, G, and H are argon-filled IGUs with different argon layer thicknesses: F is 9 mm, H is 12 mm, and G is 16 mm; G uses high-transmittance glass, resulting in similar daylighting to F, while H is 71.33% of F. Vacuum composite silver-coated triple glazing has about 10% lower transmittance than the argon-filled triple glazing. J-M are silver-coated vacuum types with Single-, Double-, and Triple-Silver, respectively. Single-Silver has better daylighting; Double- and Triple-Silver are similar. Although M is Triple-Silver, with high-transmittance glass, its daylight factor is 10.55 percentage points higher than K.

4.3.2. Illuminance Analysis of Sunrooms with Different Glazings

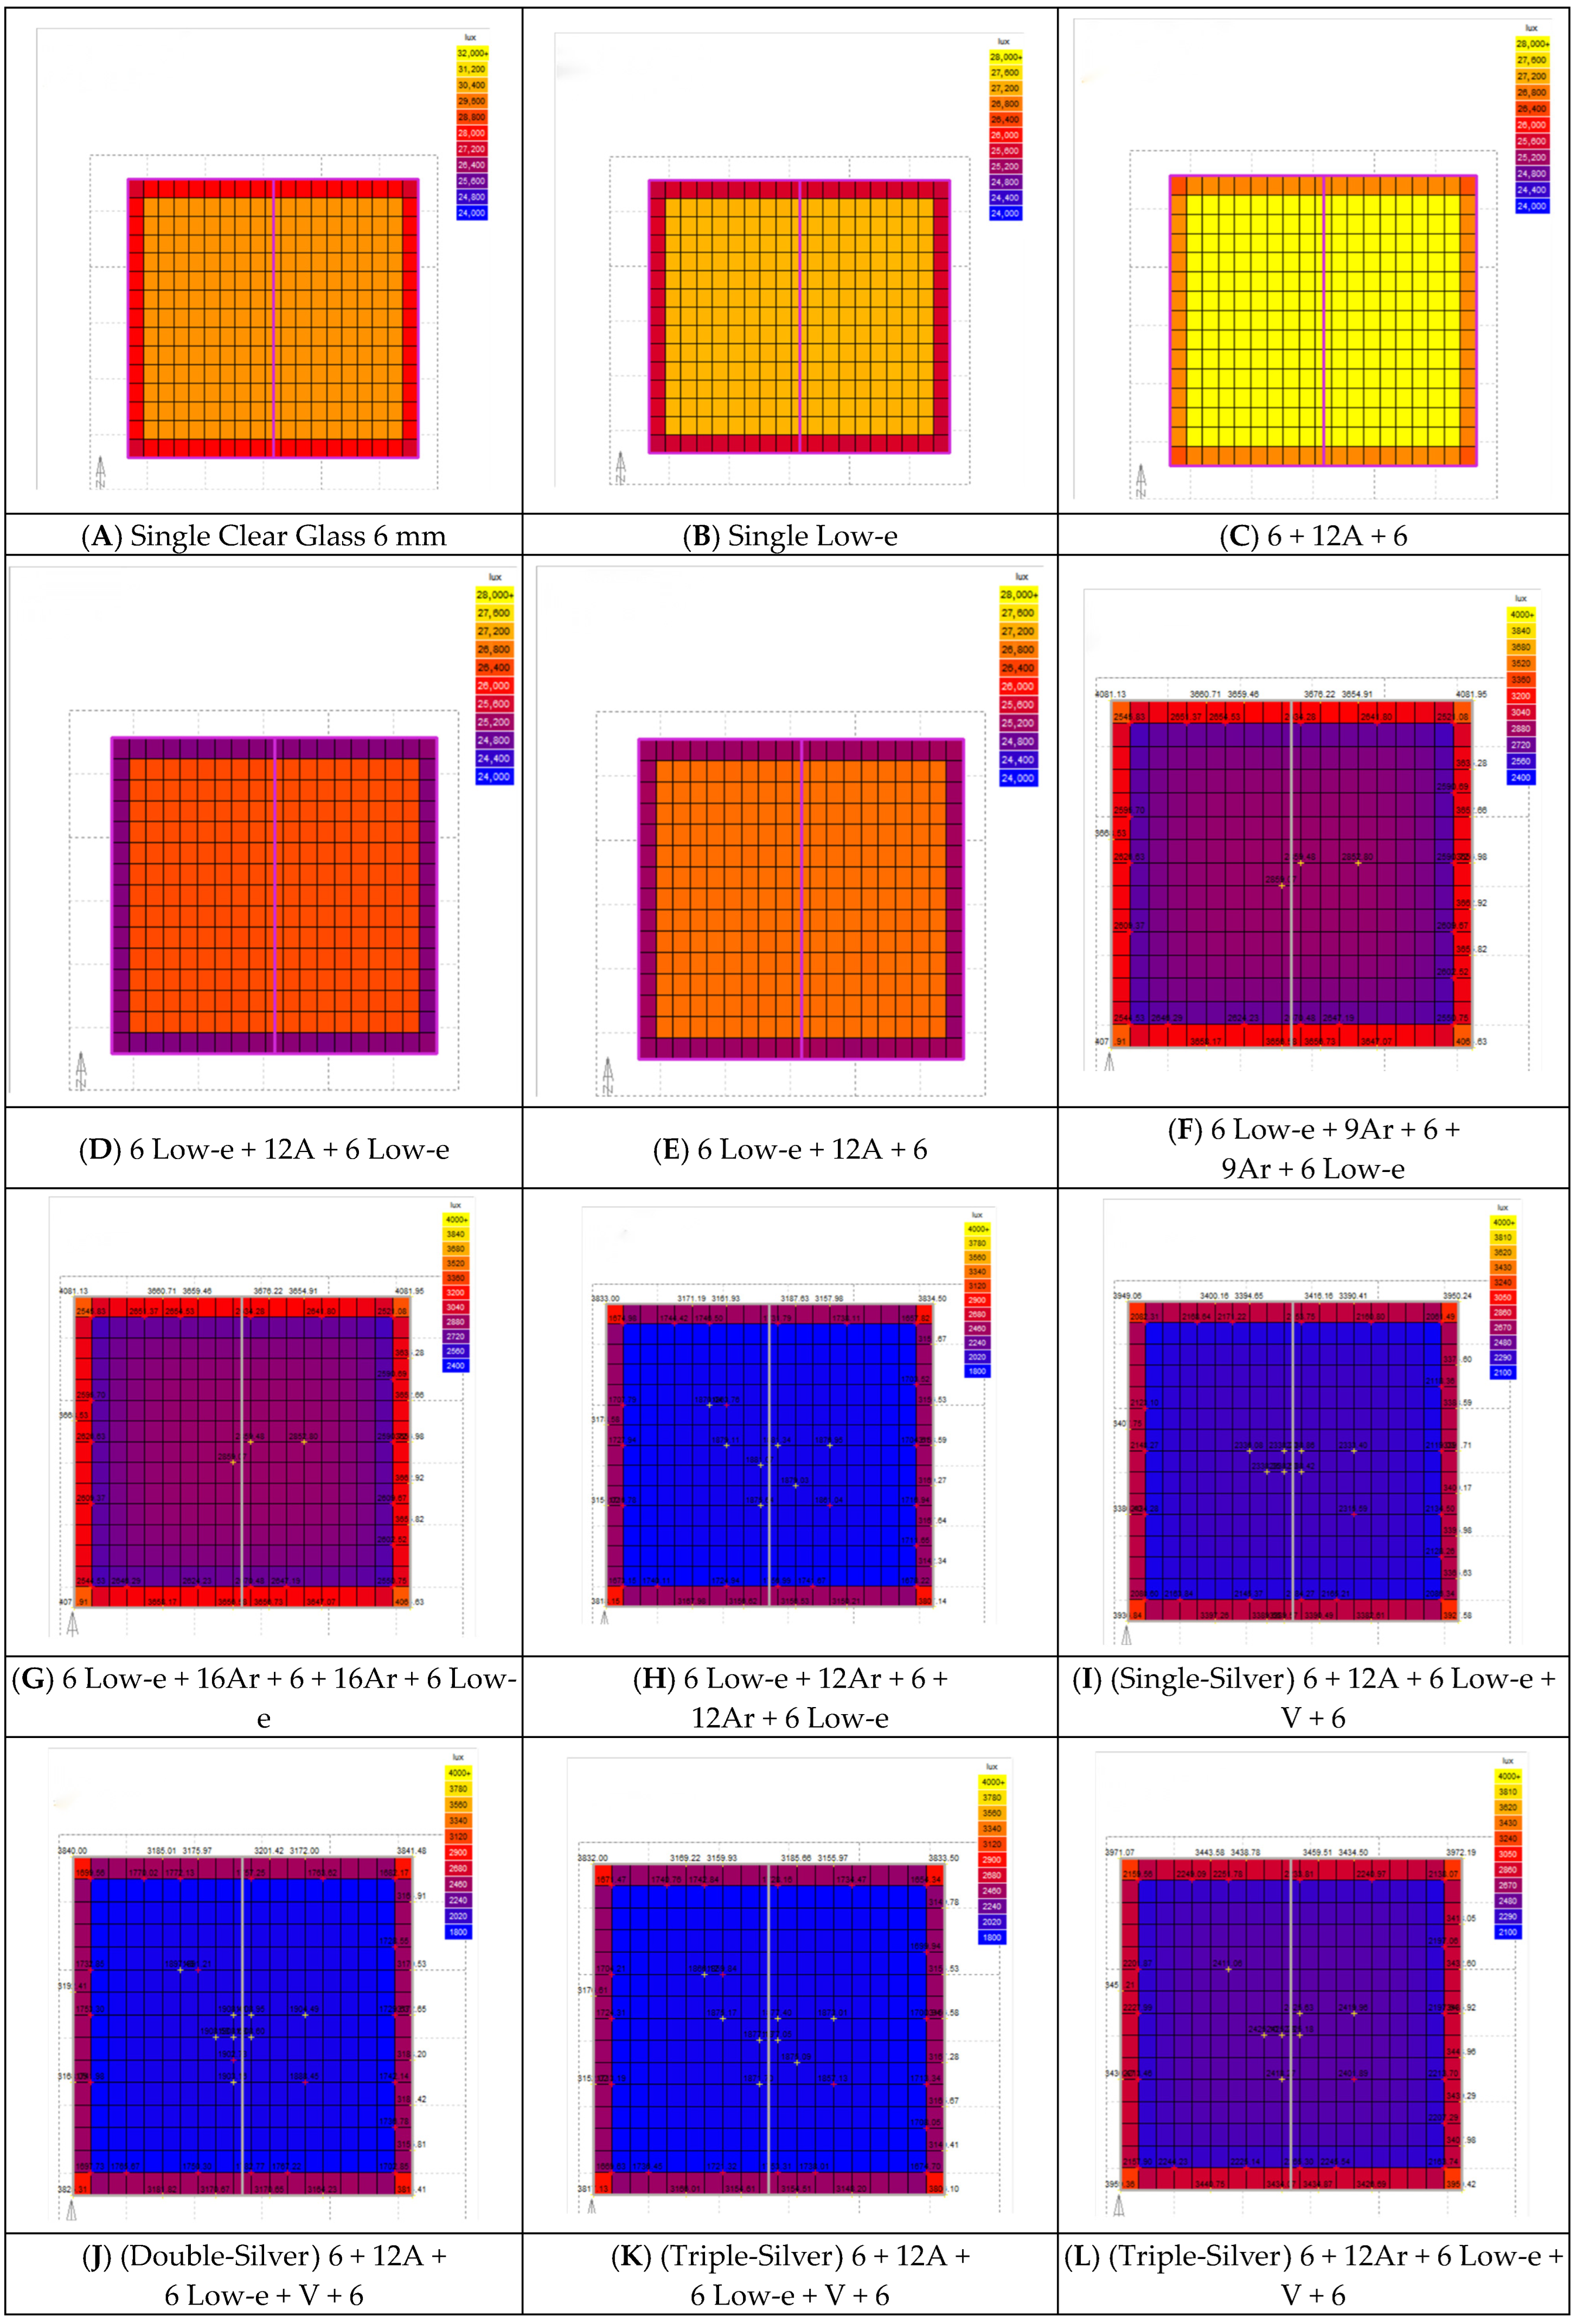
Figure 12 shows the distribution of natural daylight illuminance on the horizontal plane for sunrooms with different glazings.
From Figure 13, the center illuminance in the sunroom with 6 mm ordinary glass is 4330 lx and the periphery is 3705 lx, whereas the center illuminance in the sunroom with 6 mm Low-e glass is only 4200 lx and the periphery 3637 lx. Using single-pane illuminance as the baseline, the three double glazings yield 89.65%, 87.11%, and 88.38% of that value, respectively; the decay from center to periphery is 11.43%, 13.4%, 10.48%, 9.86%, and 9.96% in turn. Thus, double Low-e has the lowest decay.
Emax denotes maximum illuminance; Emin minimum; and Eave average. The indoor average illuminance across cases satisfies the descending order F, G, M, J, K, H, L. As shown in Figure 14, triple-glazed windows generally have lower indoor illuminance. Changes in average illuminance across different glazings are similar to the daylight factor and are proportional to the visible transmittance.

4.4. Simulation Analysis of Solar Radiation

Heat gain through a transparent envelope is mainly from transmitted solar radiation. By simulating transmitted solar radiation through different glazings, we can understand thermal performance. Table 8 lists 19 simulated cases: 13 for Hefei and 6 for Huangshan. Cases I–IX are common glazing types used in existing buildings; X–XIX are high-performance types commonly used in ultra-low energy and near-zero energy buildings.

4.4.1. Analysis of Solar Radiation for Common Glazing

(1)
Analysis of Transmitted Radiation by Orientation. We analyzed cases I-IX for transmitted radiation to compare orientations.
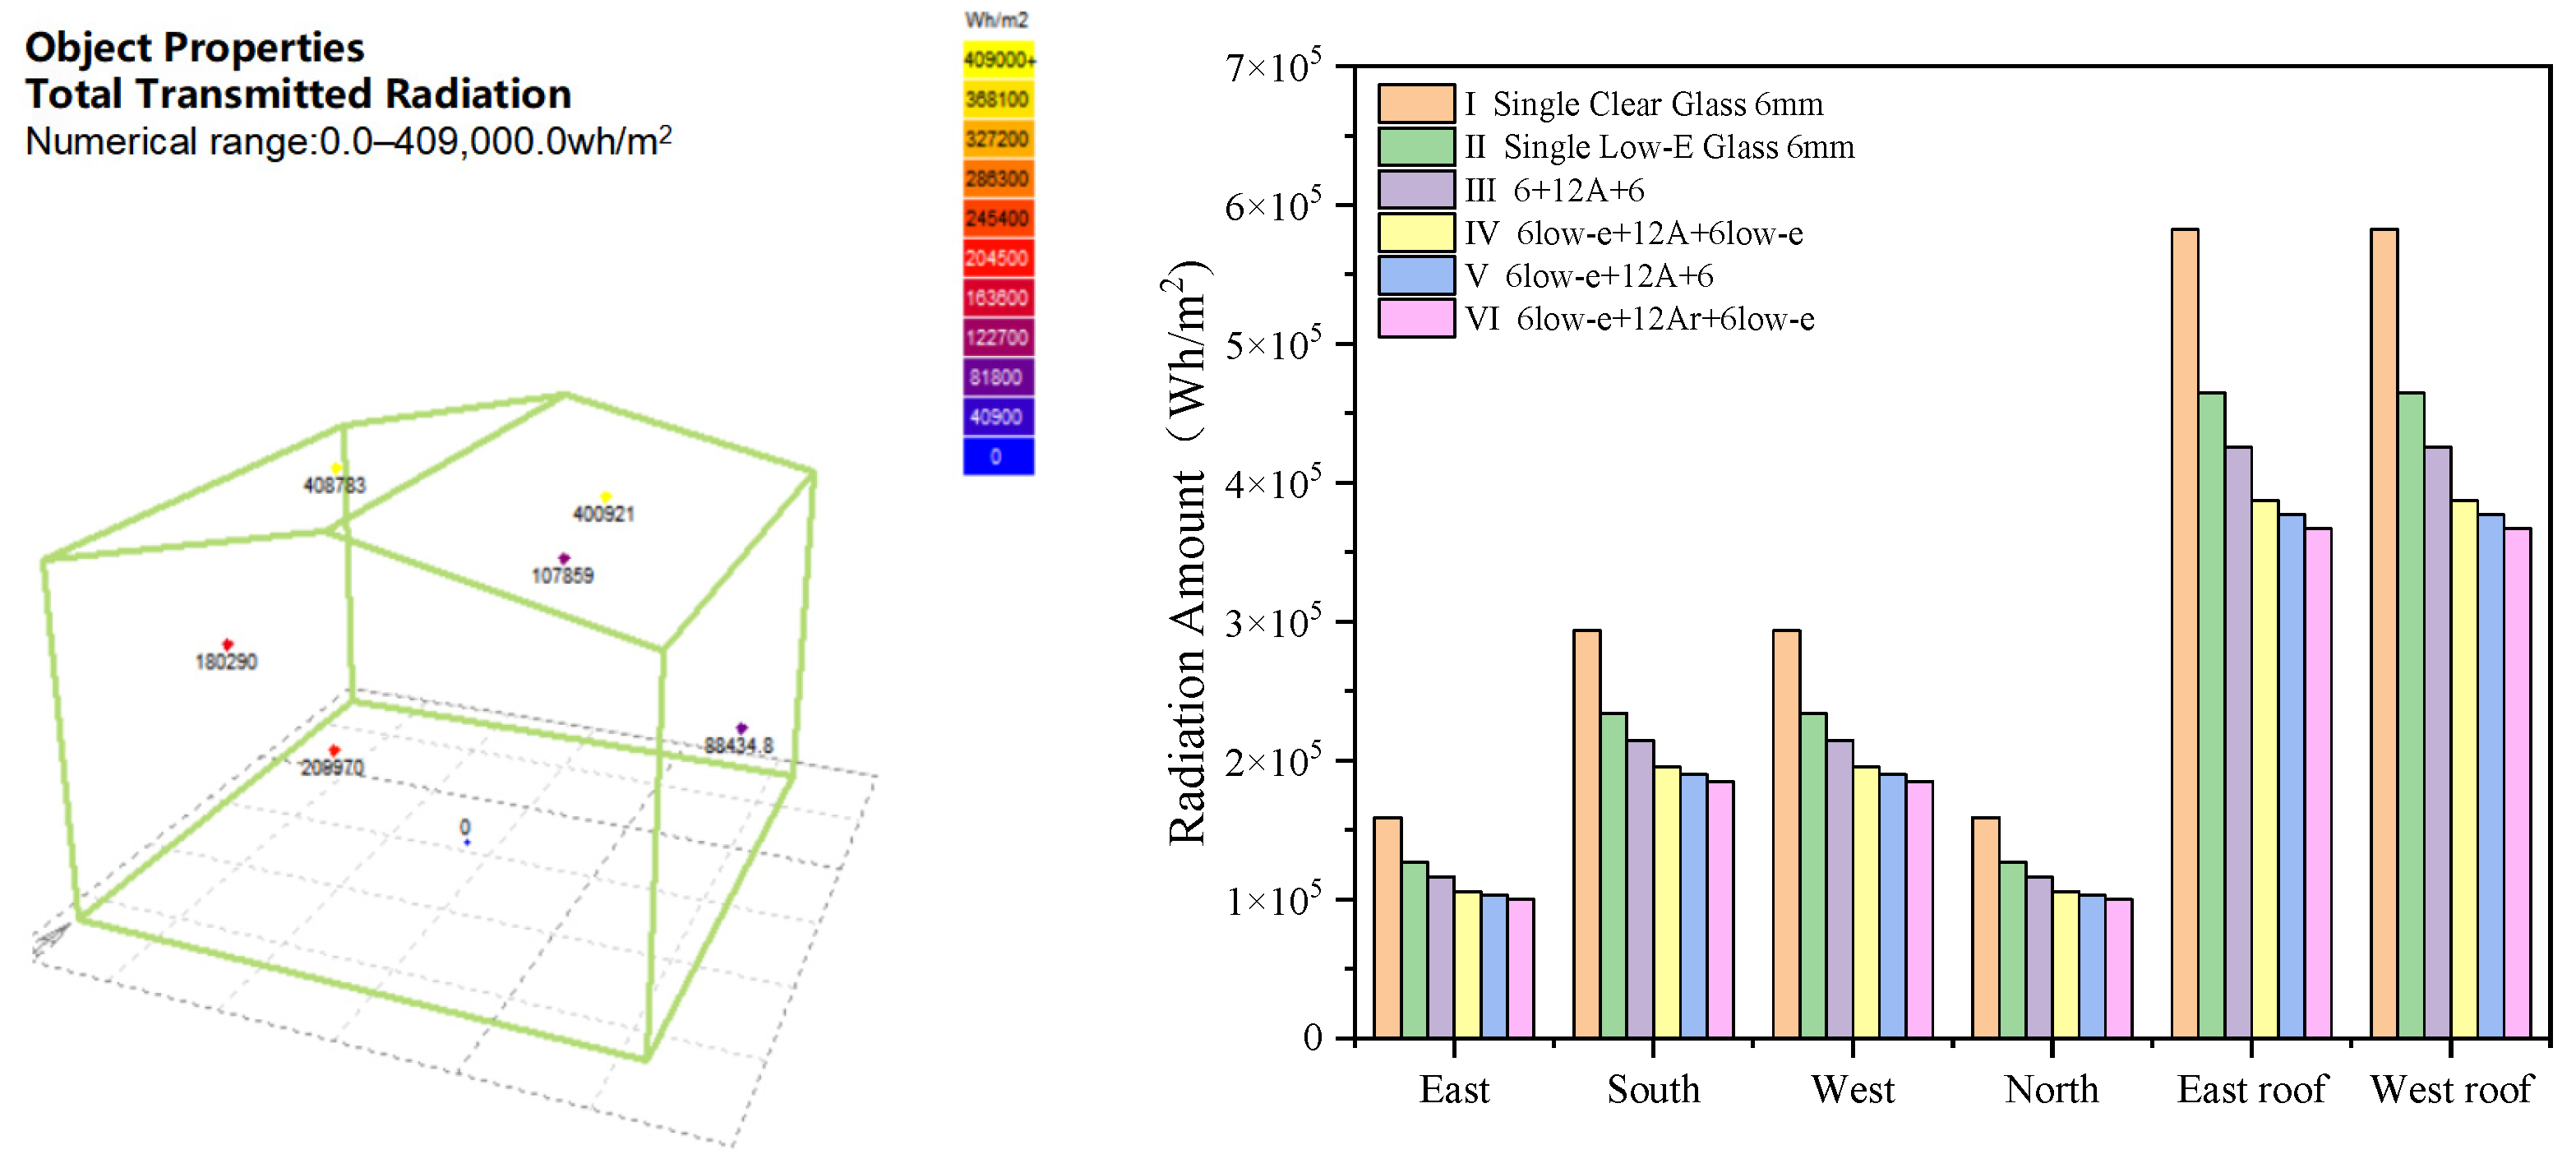
Since the glass types differ among cases, their properties (U-value, SHGC, SC, etc.) vary, leading to differences in visible light and radiation transmitted through glass and thus varying heat gains by orientation. As seen in Figure 15, the transmitted radiation in all orientations for a sunroom built of single clear 6 mm is much greater than those for the other five glazing types. For all orientations, heat gains follow the next descending order: East roof, West roof, South, West, East, North. Overall, the descending order is: I, II, III, V, IV, VI, indicating that argon-filled double Low-e has the lowest radiative heat. The total radiation for cases IV, V, and VI is similar. Taking single clear 6 mm as the baseline, the shares of these three cases are 68.56%, 66.87%, and 61.11%, respectively; V and VI differ from IV by 1.96% and 1.45%.
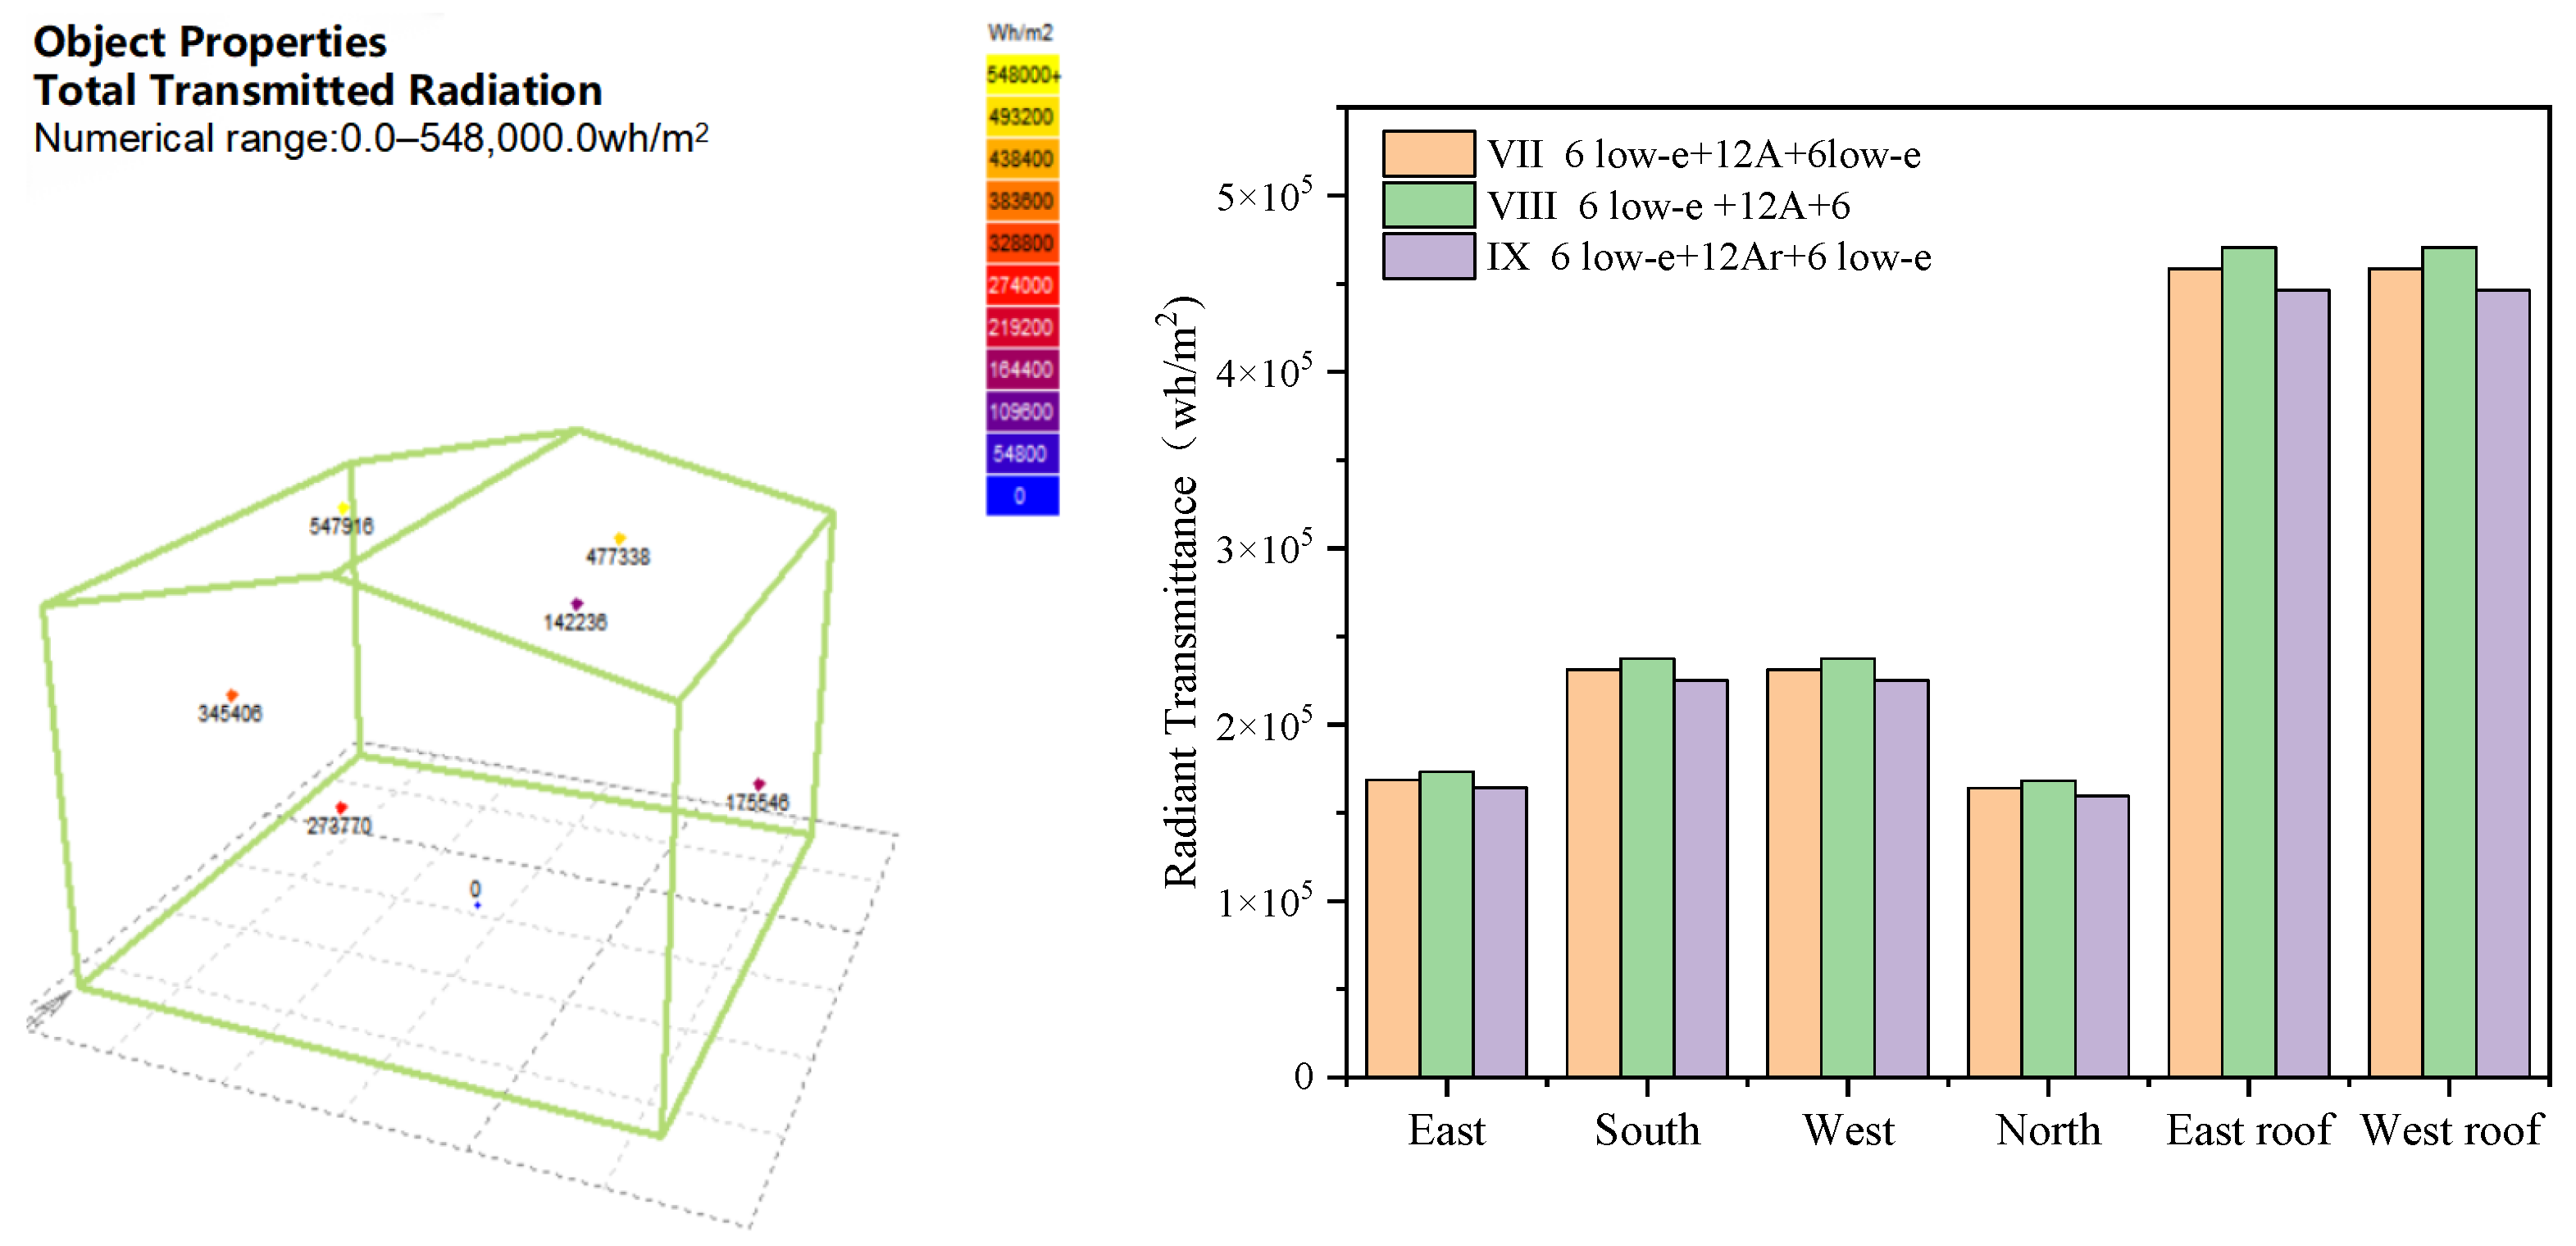
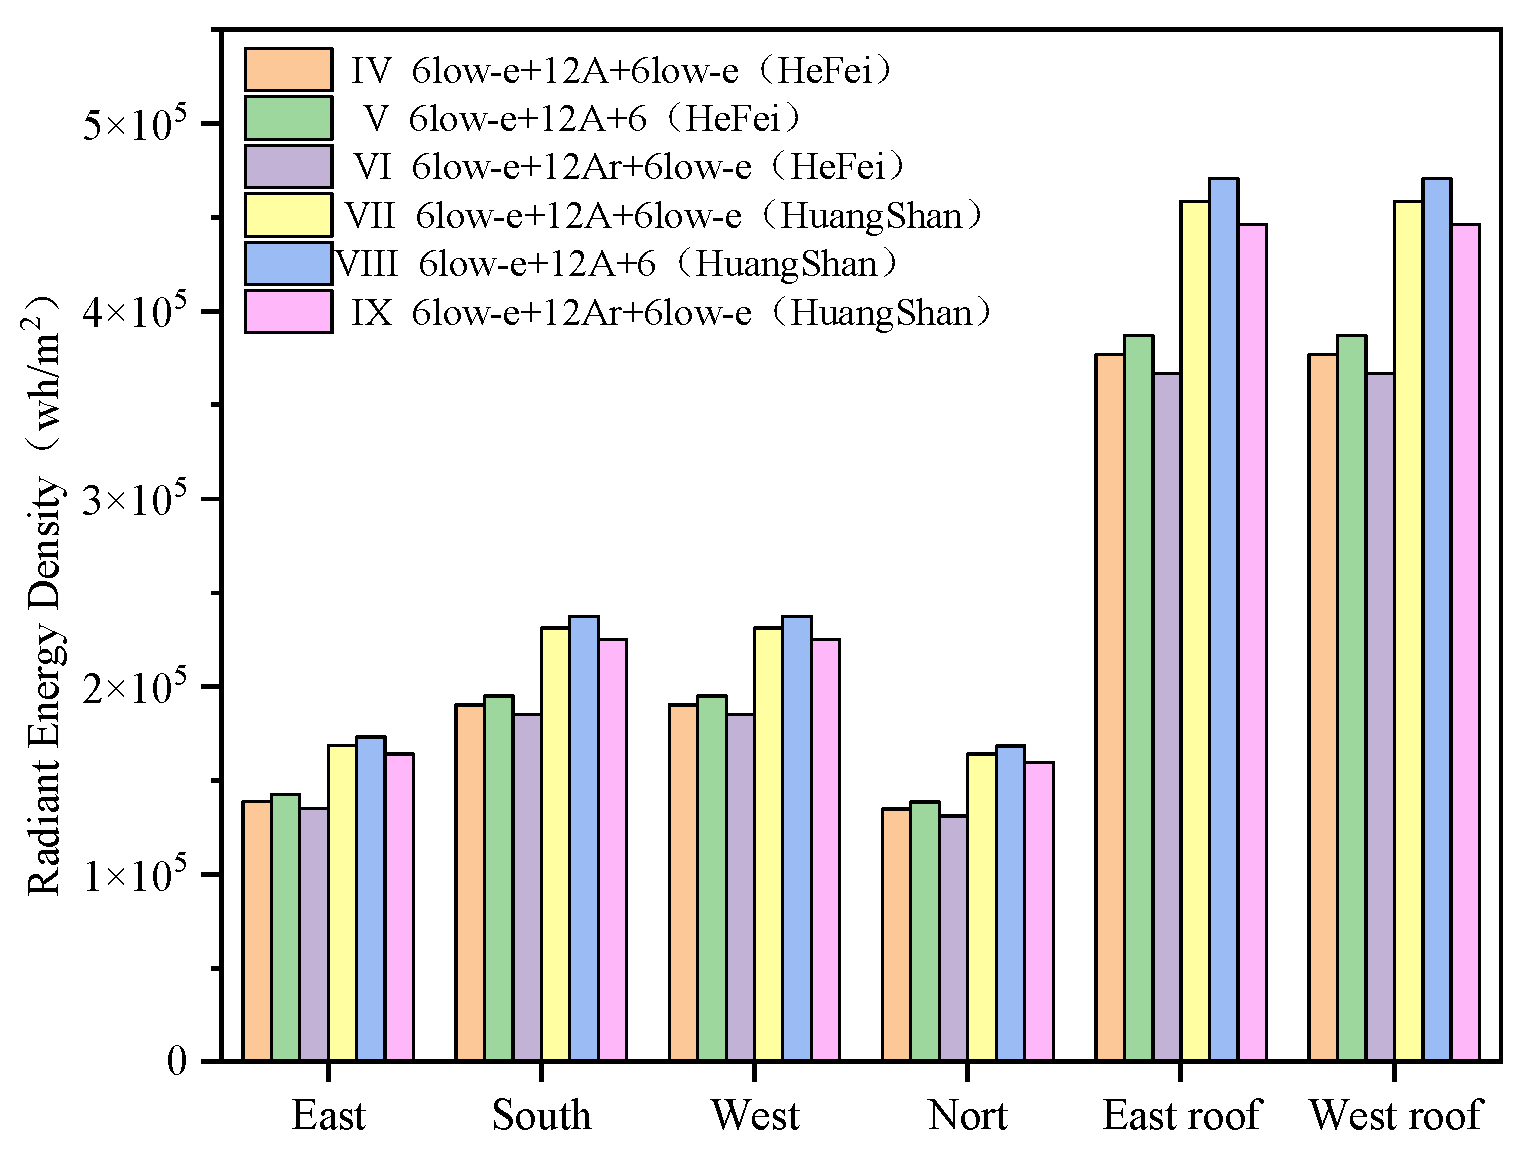
Figure 16 depicts transmitted radiation for different orientations in Huangshan. Similarly, the descending order is East roof, West roof, West-facing, South-facing, East-facing, and North-facing. Using case VIII, i.e., 6 Low-e + 12A + 6, as the baseline, cases VII and IX are 97.4% and 93.5% of it, respectively; the radiative heat decreased by 2.6 percentage points, and argon filling lowered it by 6.5 percentage points. Thus, argon filling reduces radiation compared with air, suitable for summer insulation and more applicable to southern Anhui.
(2)
Analysis of Annual Transmitted Radiation in Different Regions
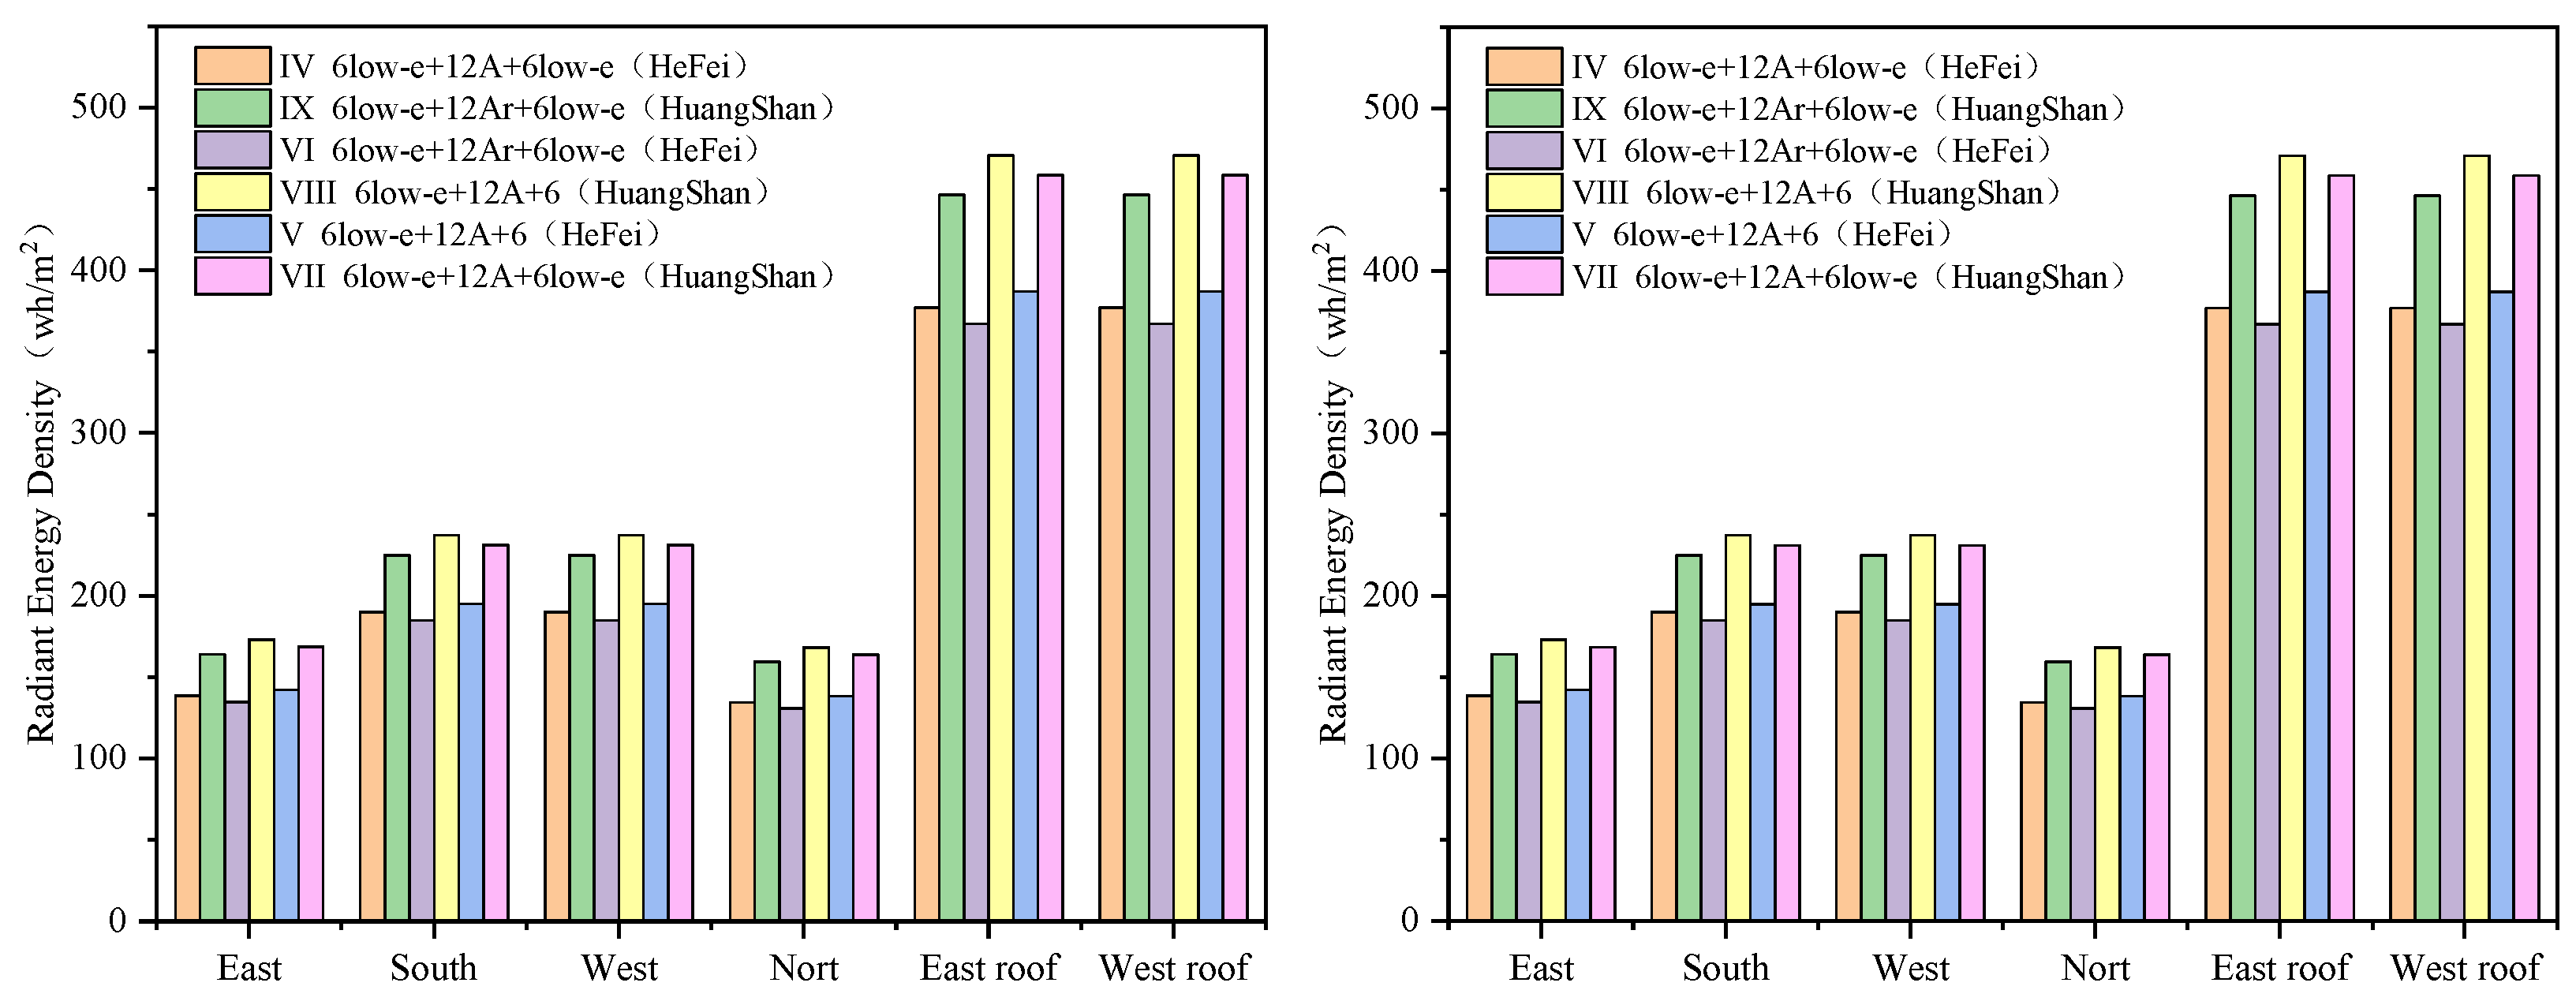
As shown in Figure 17, the annual transmitted radiation in Huangshan exceeds that in Hefei. Due to solar altitude, the annual west-facing transmitted radiation in Huangshan is significantly higher than south-facing, whereas in Hefei it is slightly lower than south-facing. Taking ordinary double glazing as the baseline among three double glazings, the shares are 68.56%, 66.78%, and 62.88% in Hefei, and 75%, 73.06%, and 70.13% in Huangshan.
(3)
Analysis of Transmitted Radiation on the Hottest and Coldest Days
As shown in Figure 18, typical meteorological data for the hottest and coldest days in Hefei and Huangshan were selected. In Hefei, the hottest day is 23 August and the coldest 9 January; in Huangshan, the hottest is 14 July and the coldest 21 January. For double glazings in Huangshan, taking ordinary double glazing as the baseline, the hottest day transmitted radiation is 90.36%, 88.02%, and 85.67% of it, and the coldest day 92.59%, 79.74%, and 75.6%. In Hefei, the hottest day values are 90.9%, 88.54%, and 86.18%, and the coldest day 91.11%, 88.54%, and 86.17%.

4.4.2. Analysis of Solar Radiation for High-Performance Glazing

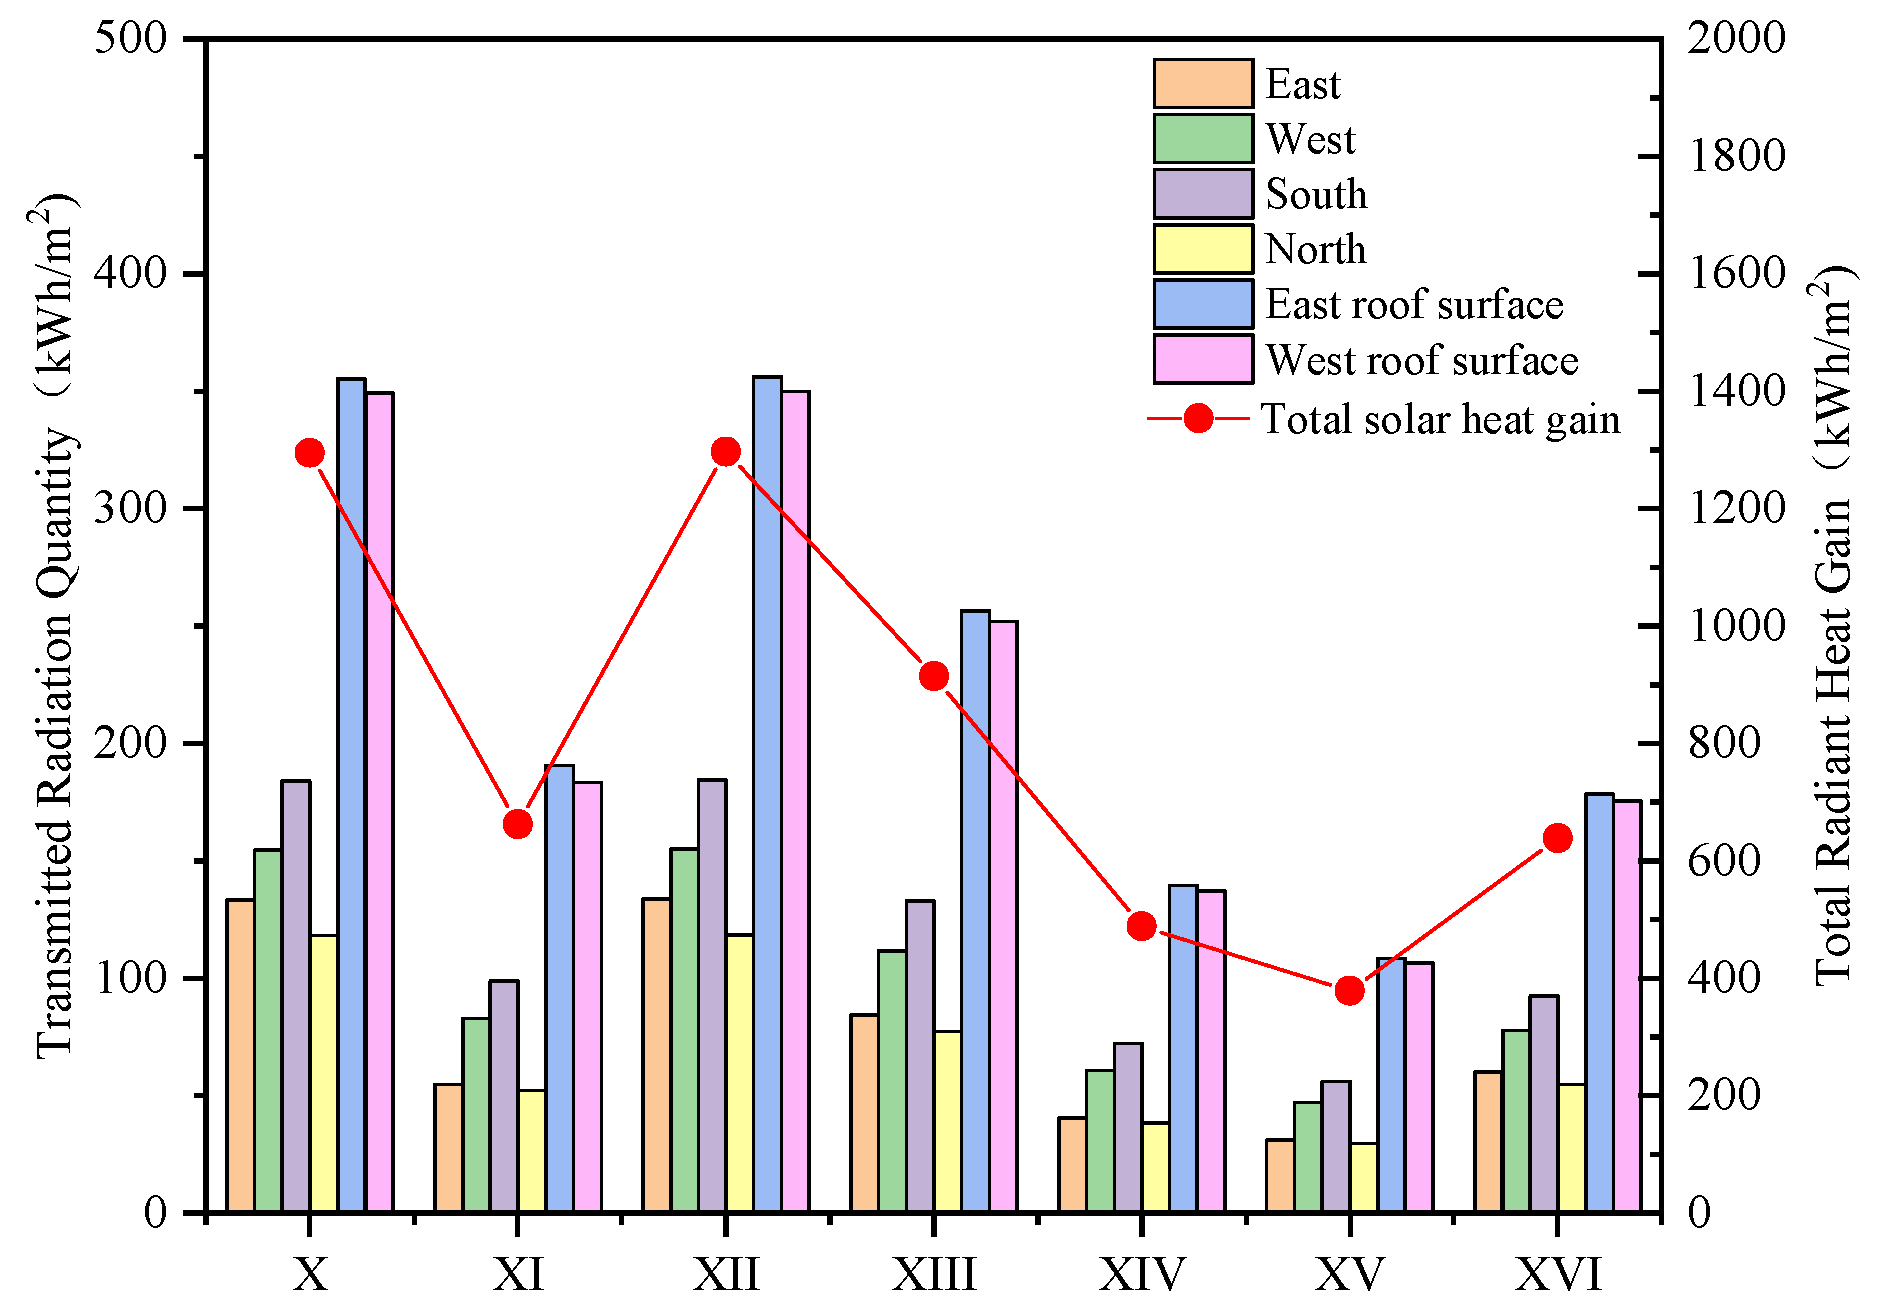
As shown in Figure 19 for Hefei, the transmitted radiation by orientation among high-performance glazings follows the next descending order XII, X, XI, XVI, XIV, XV, with XV having the smallest total load. Increasing the gas layer thickness reduces energy use; however, increasing visible transmittance increases radiation. More coating layers reduce transmitted radiation. Using case X (triple argon-filled Low-e IGU) as a reference, the others are 51.2%, 100.19%, 70.62%, 37.73%, 29.28%, and 49.33% of it. The last three cases reduce the load by more than half.

4.5. Energy Simulation Analysis of the Sunrooms

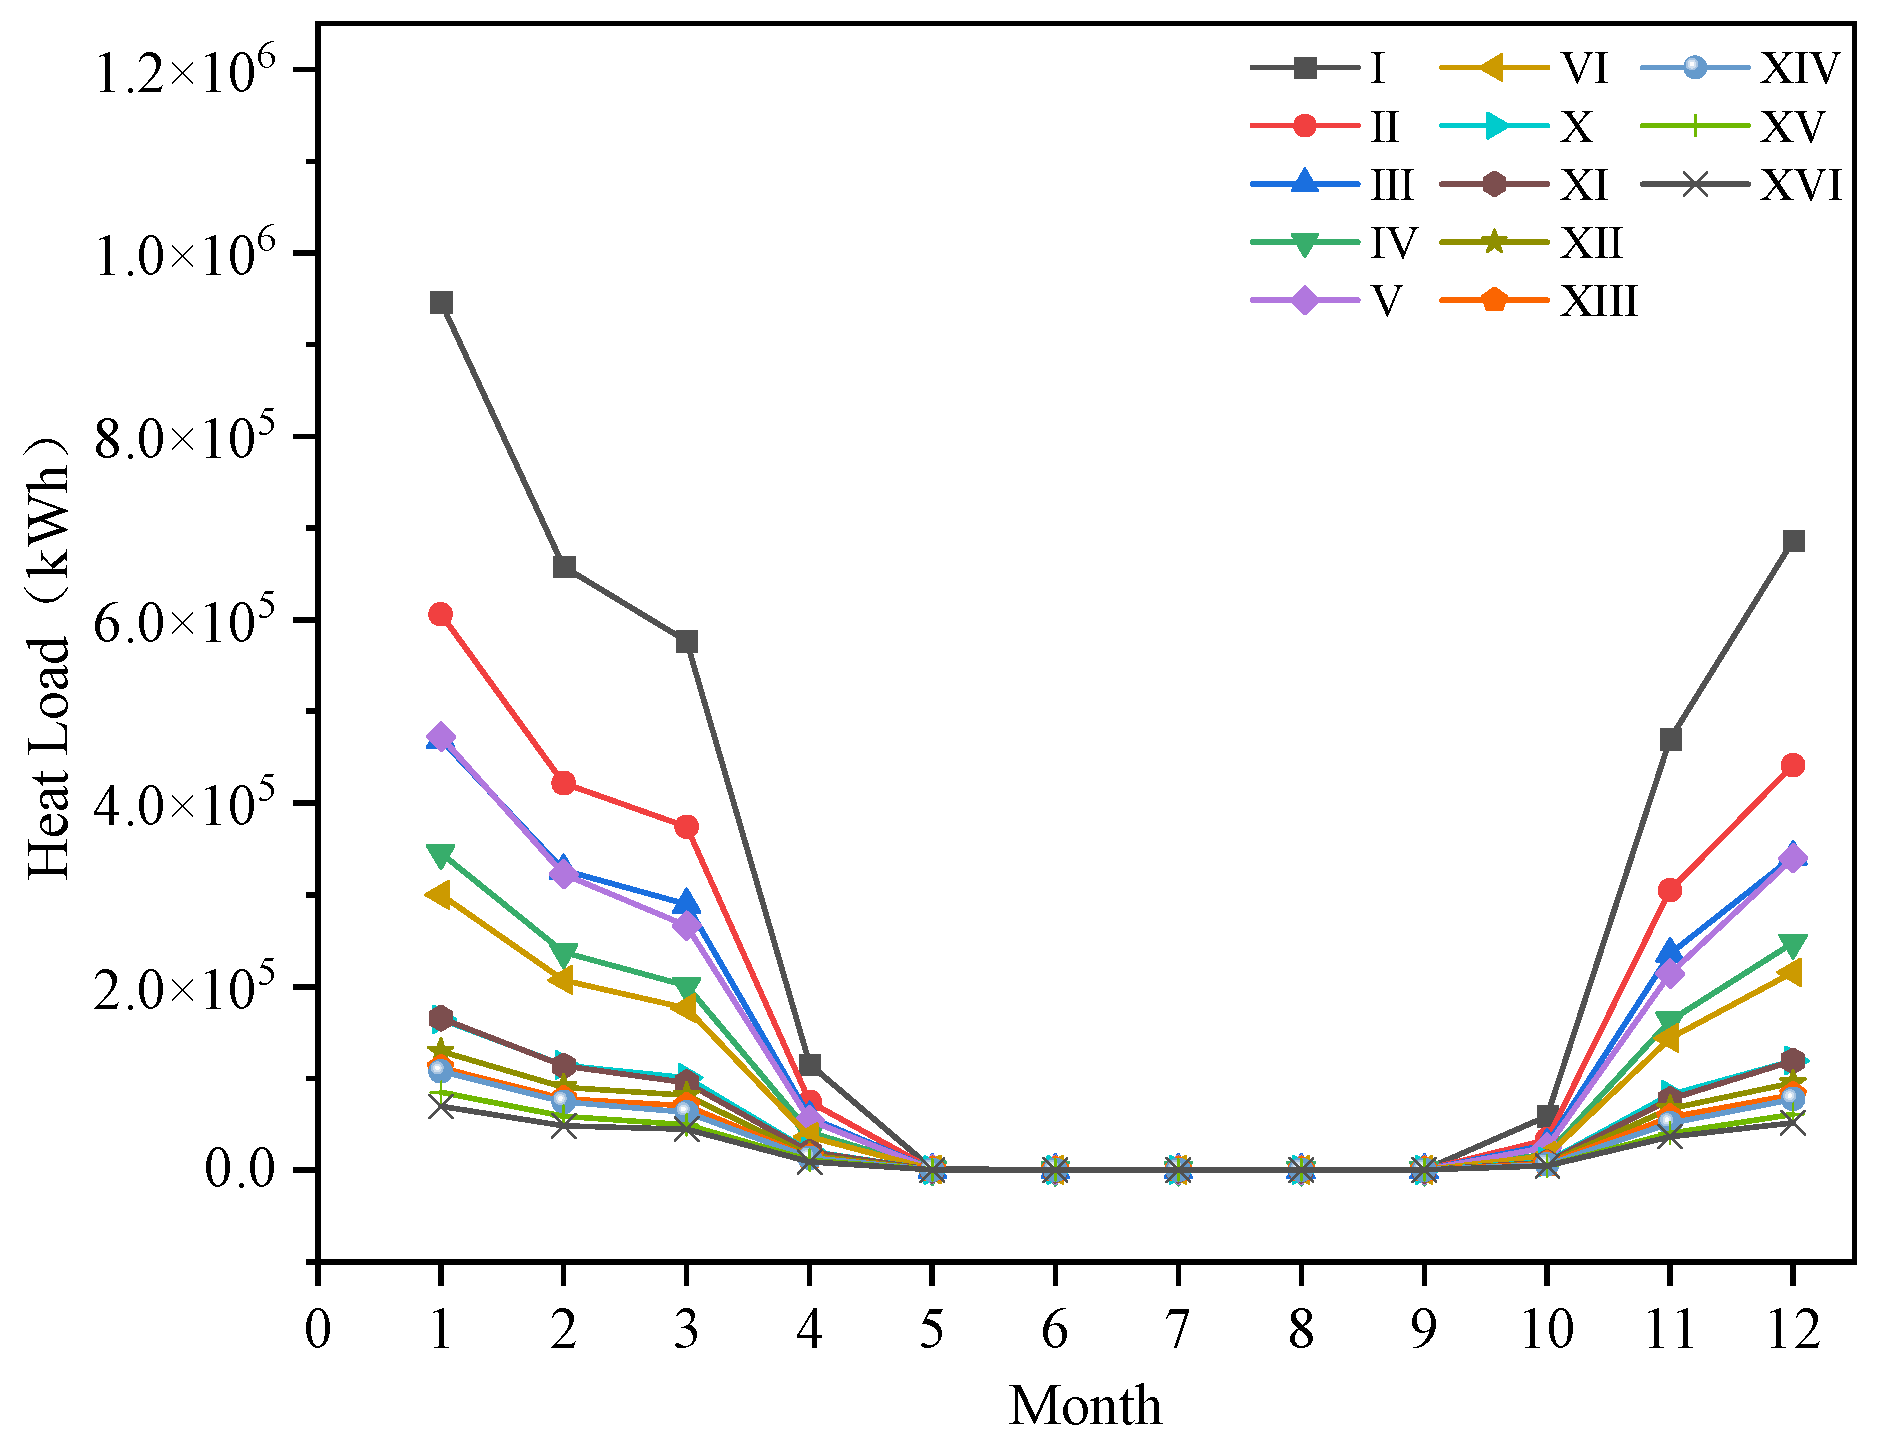
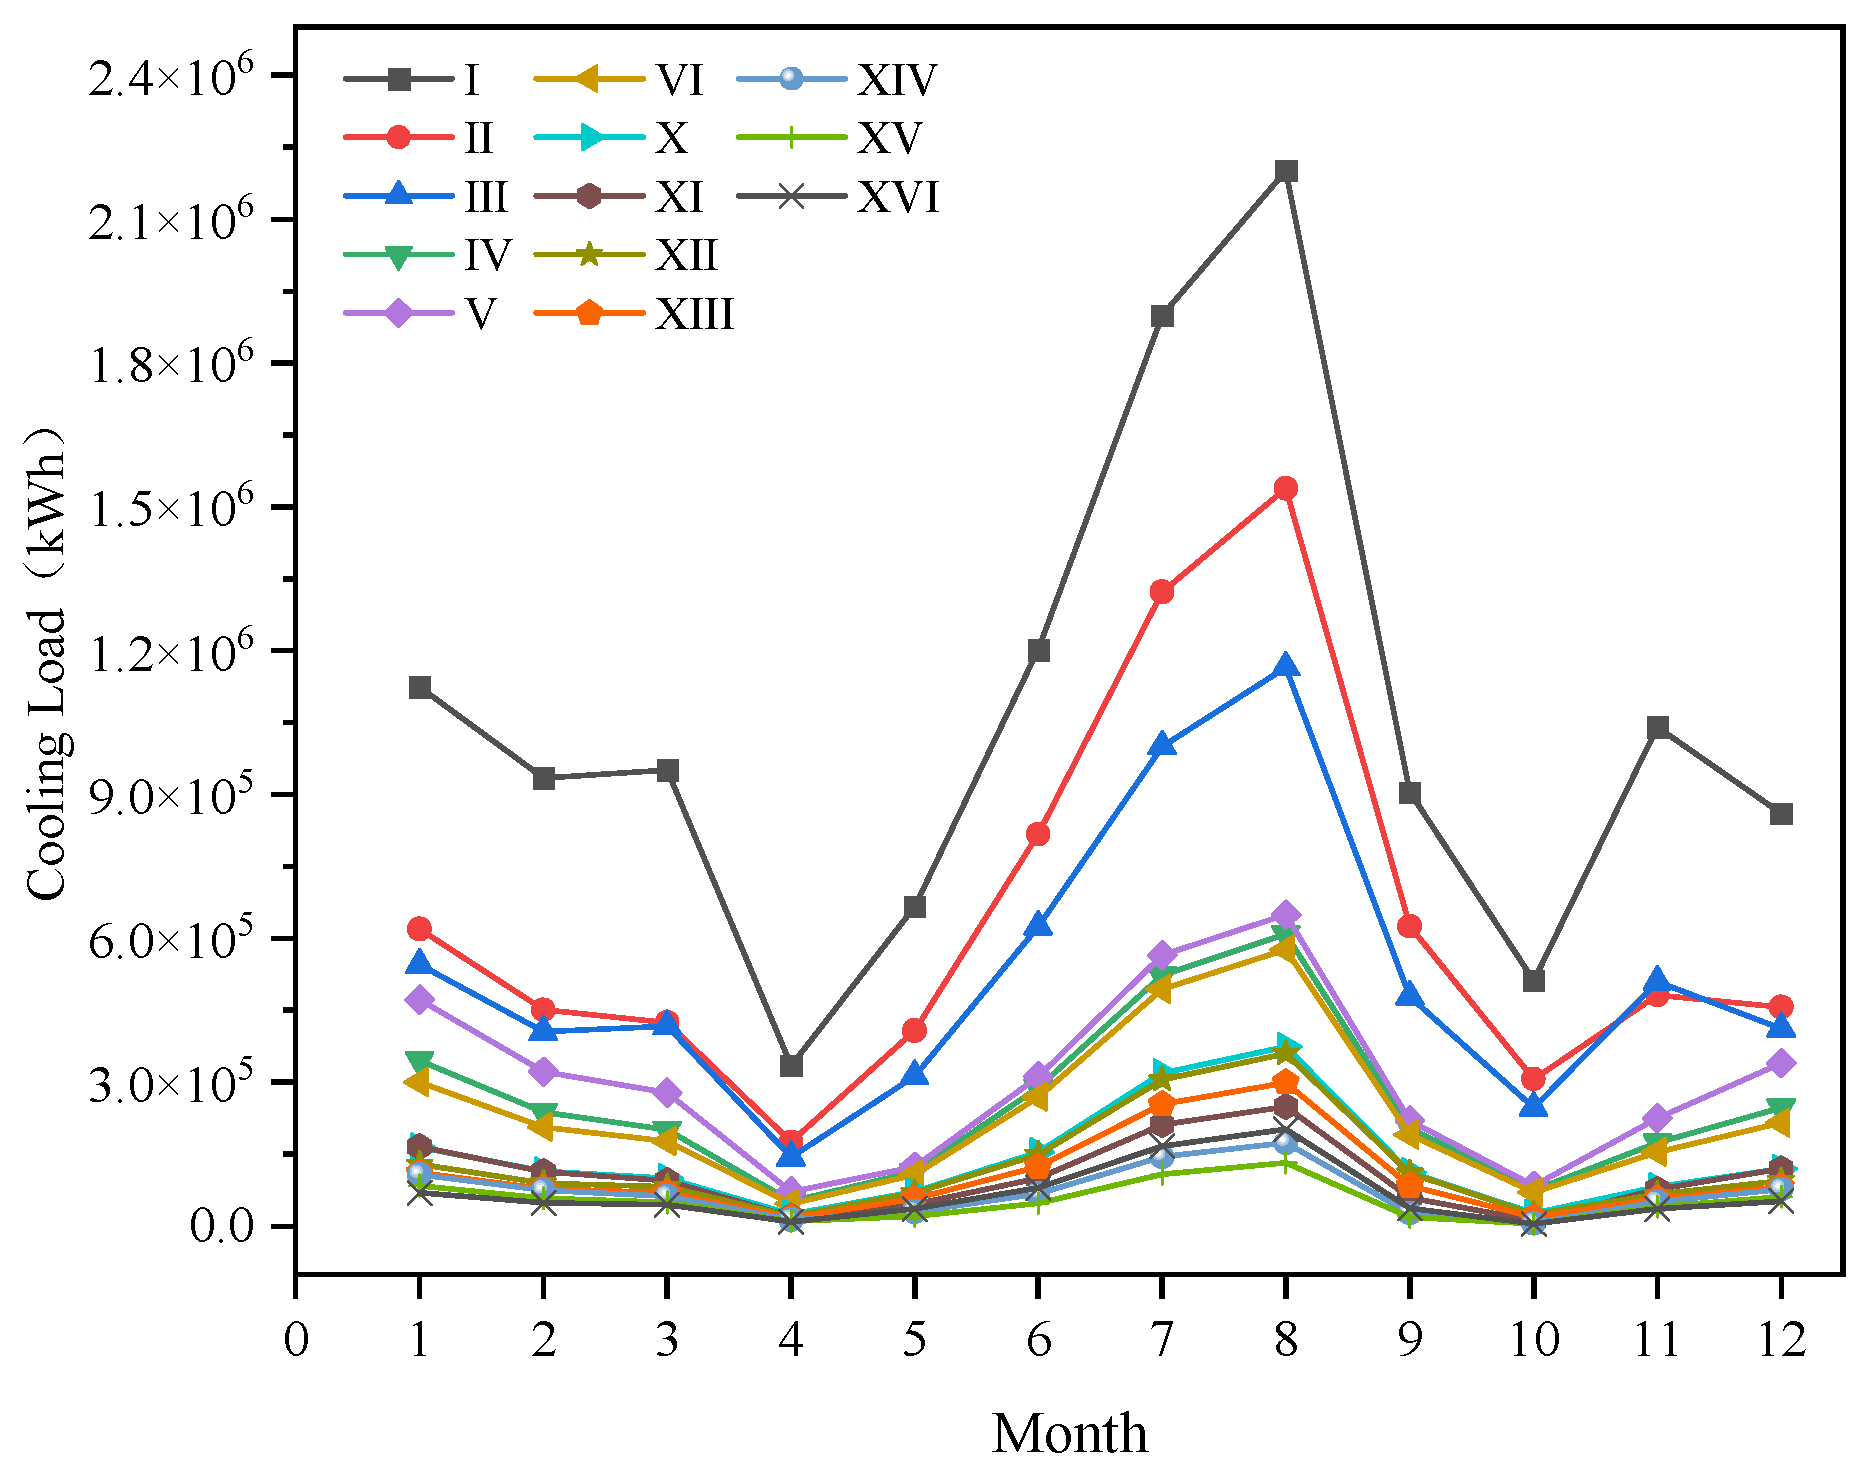
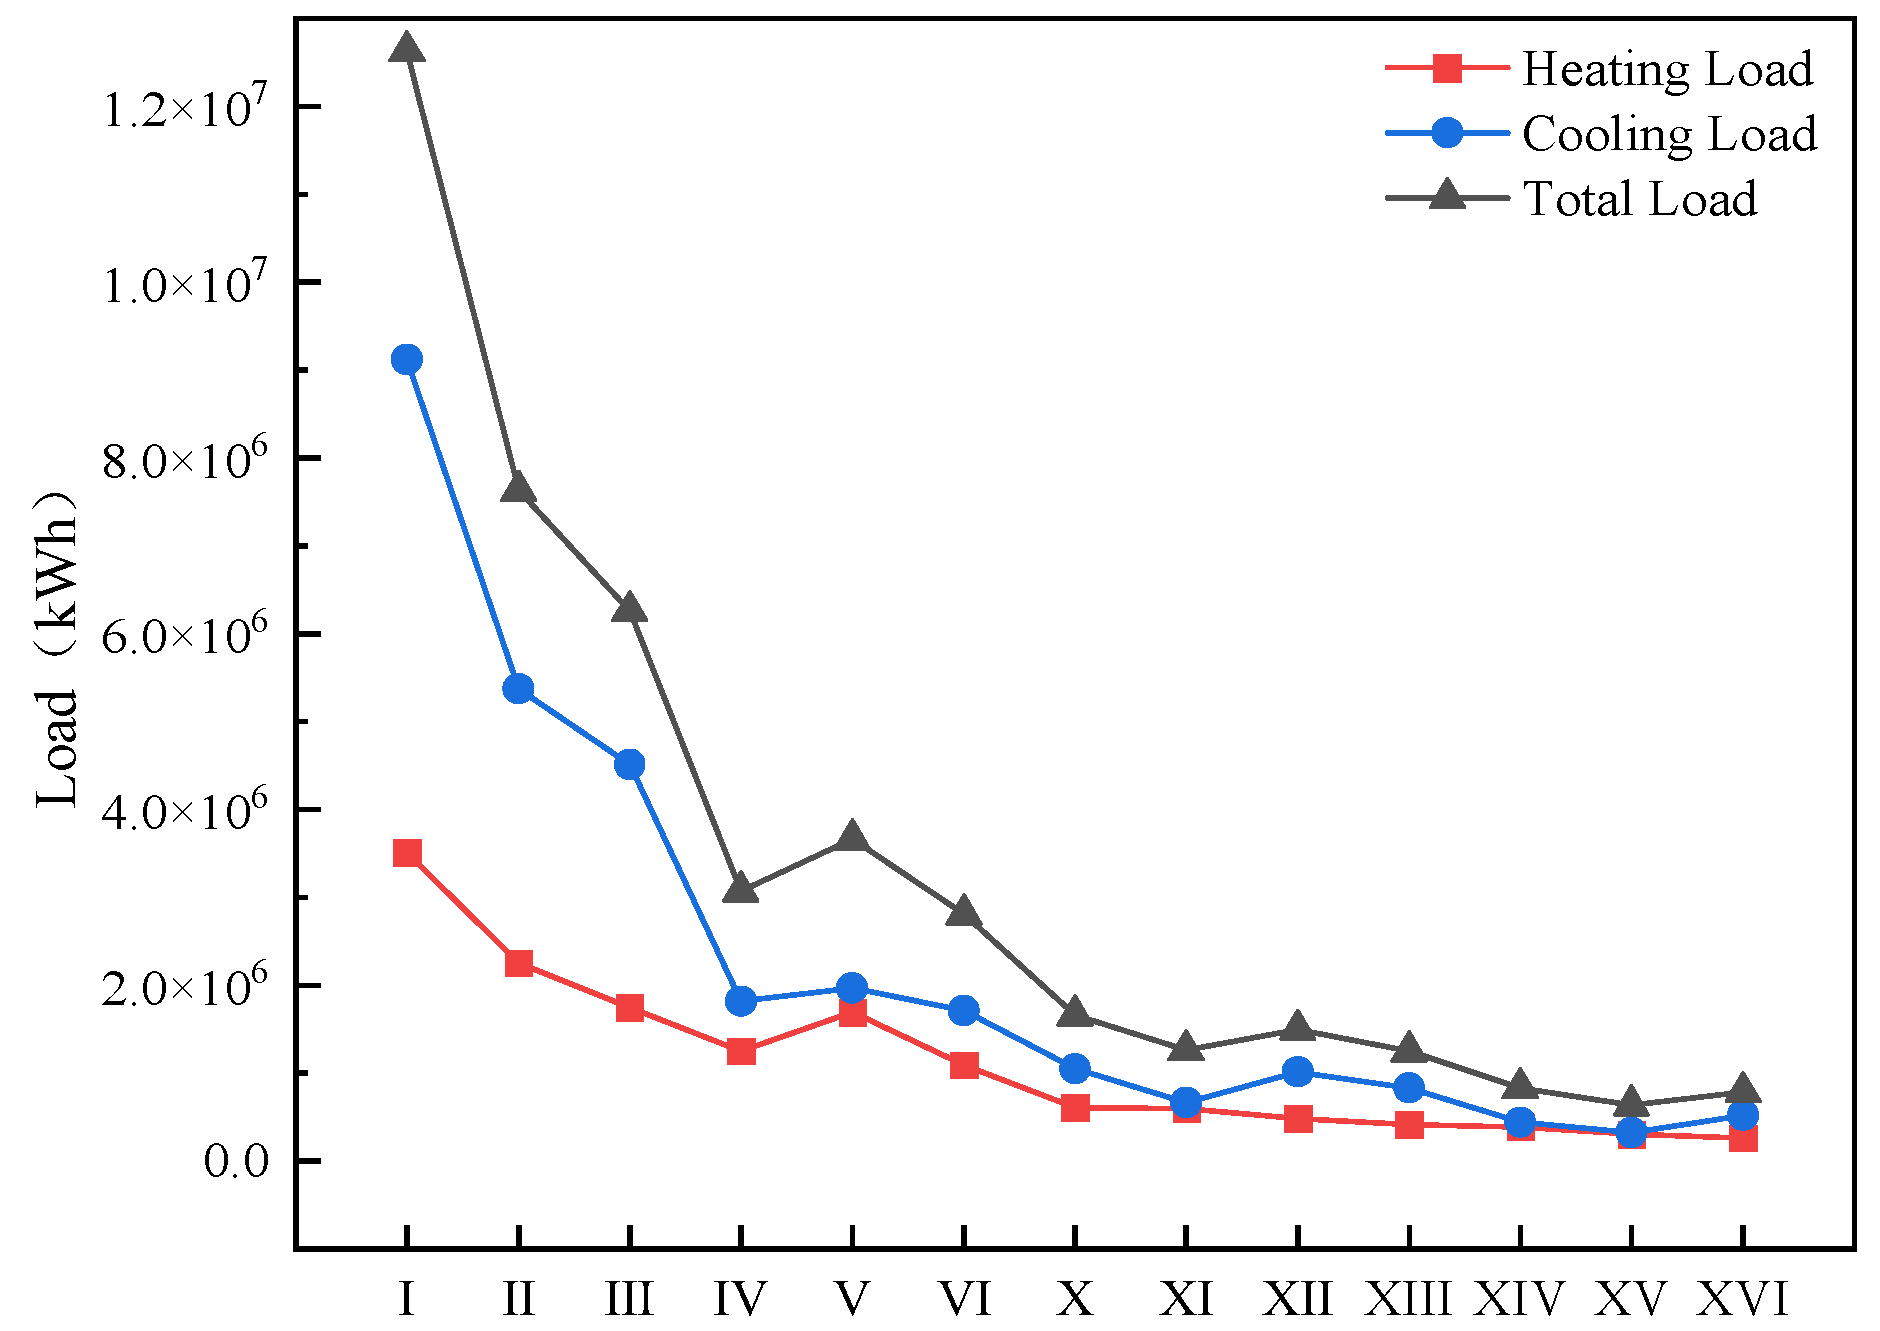
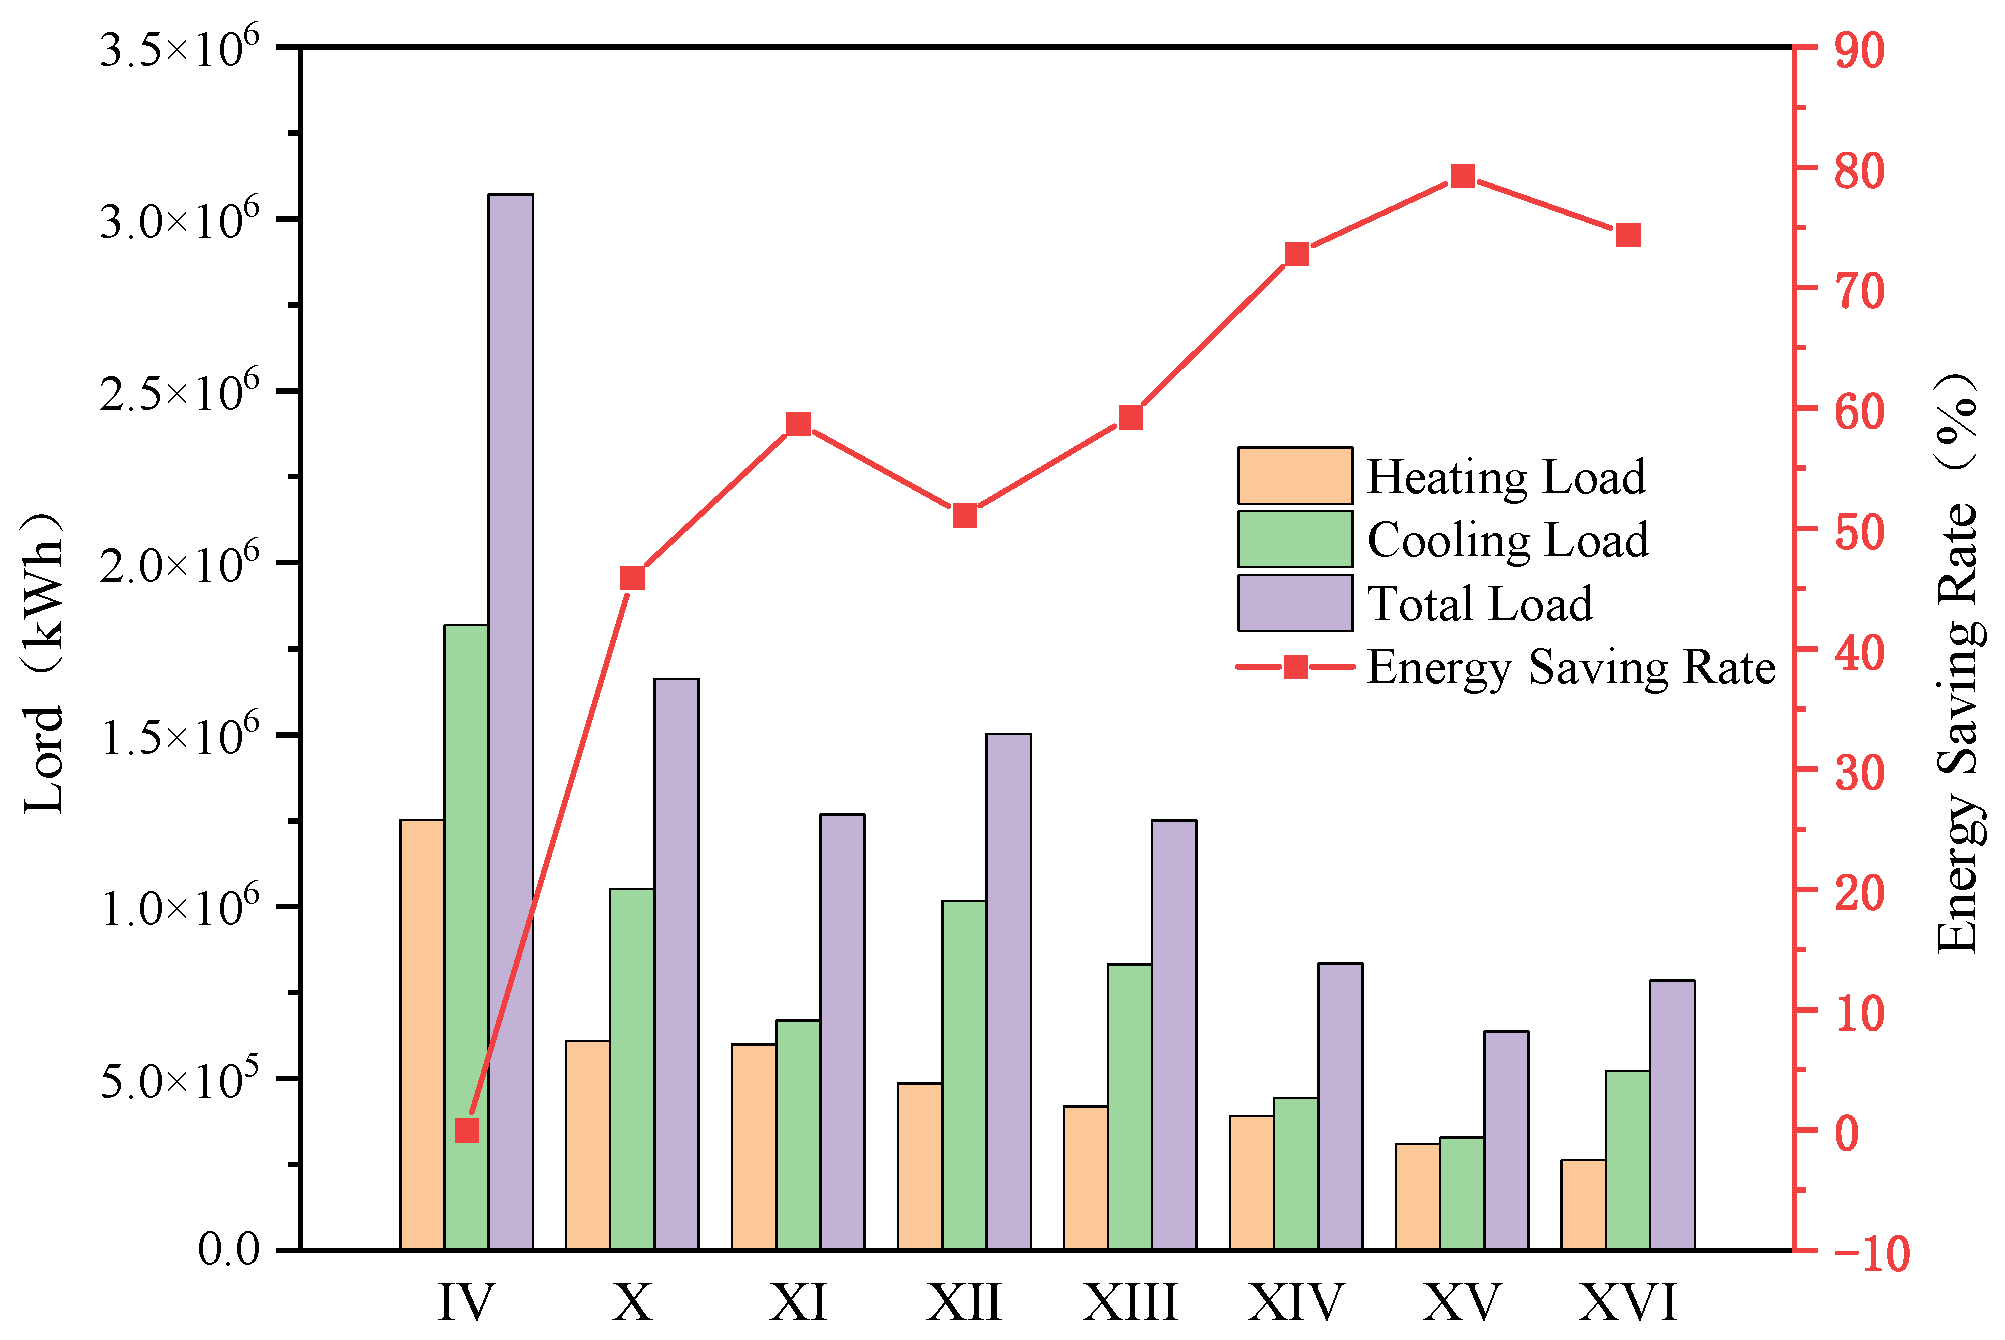
As shown in Figure 20 and Figure 21, the monthly heating and cooling loads in Hefei for different glazed sunrooms exhibit similar overall trends. Single glazing has relatively poor thermal performance; high-performance glazing results in lower monthly heating and cooling loads than common glazing, with differences relatively concentrated. Annual loads were plotted for all cases in Figure 22. Cases I–III have higher loads; high-performance glazing shows less pronounced differences, and cases XIV–XVI have similar load variations. Comparing the energy-saving rates of high-performance glazings to double Low-e IGUs yields Figure 23, with savings of 45.89%, 58.73%, 51.11%, 59.27%, 72.84%, 79.3%, and 71.44%. The descending order of energy-saving effectiveness is XV, XVI, XIV, XIII, XI, XII, X, indicating that vacuum Triple-Silver Low-e glazing offers the best savings.
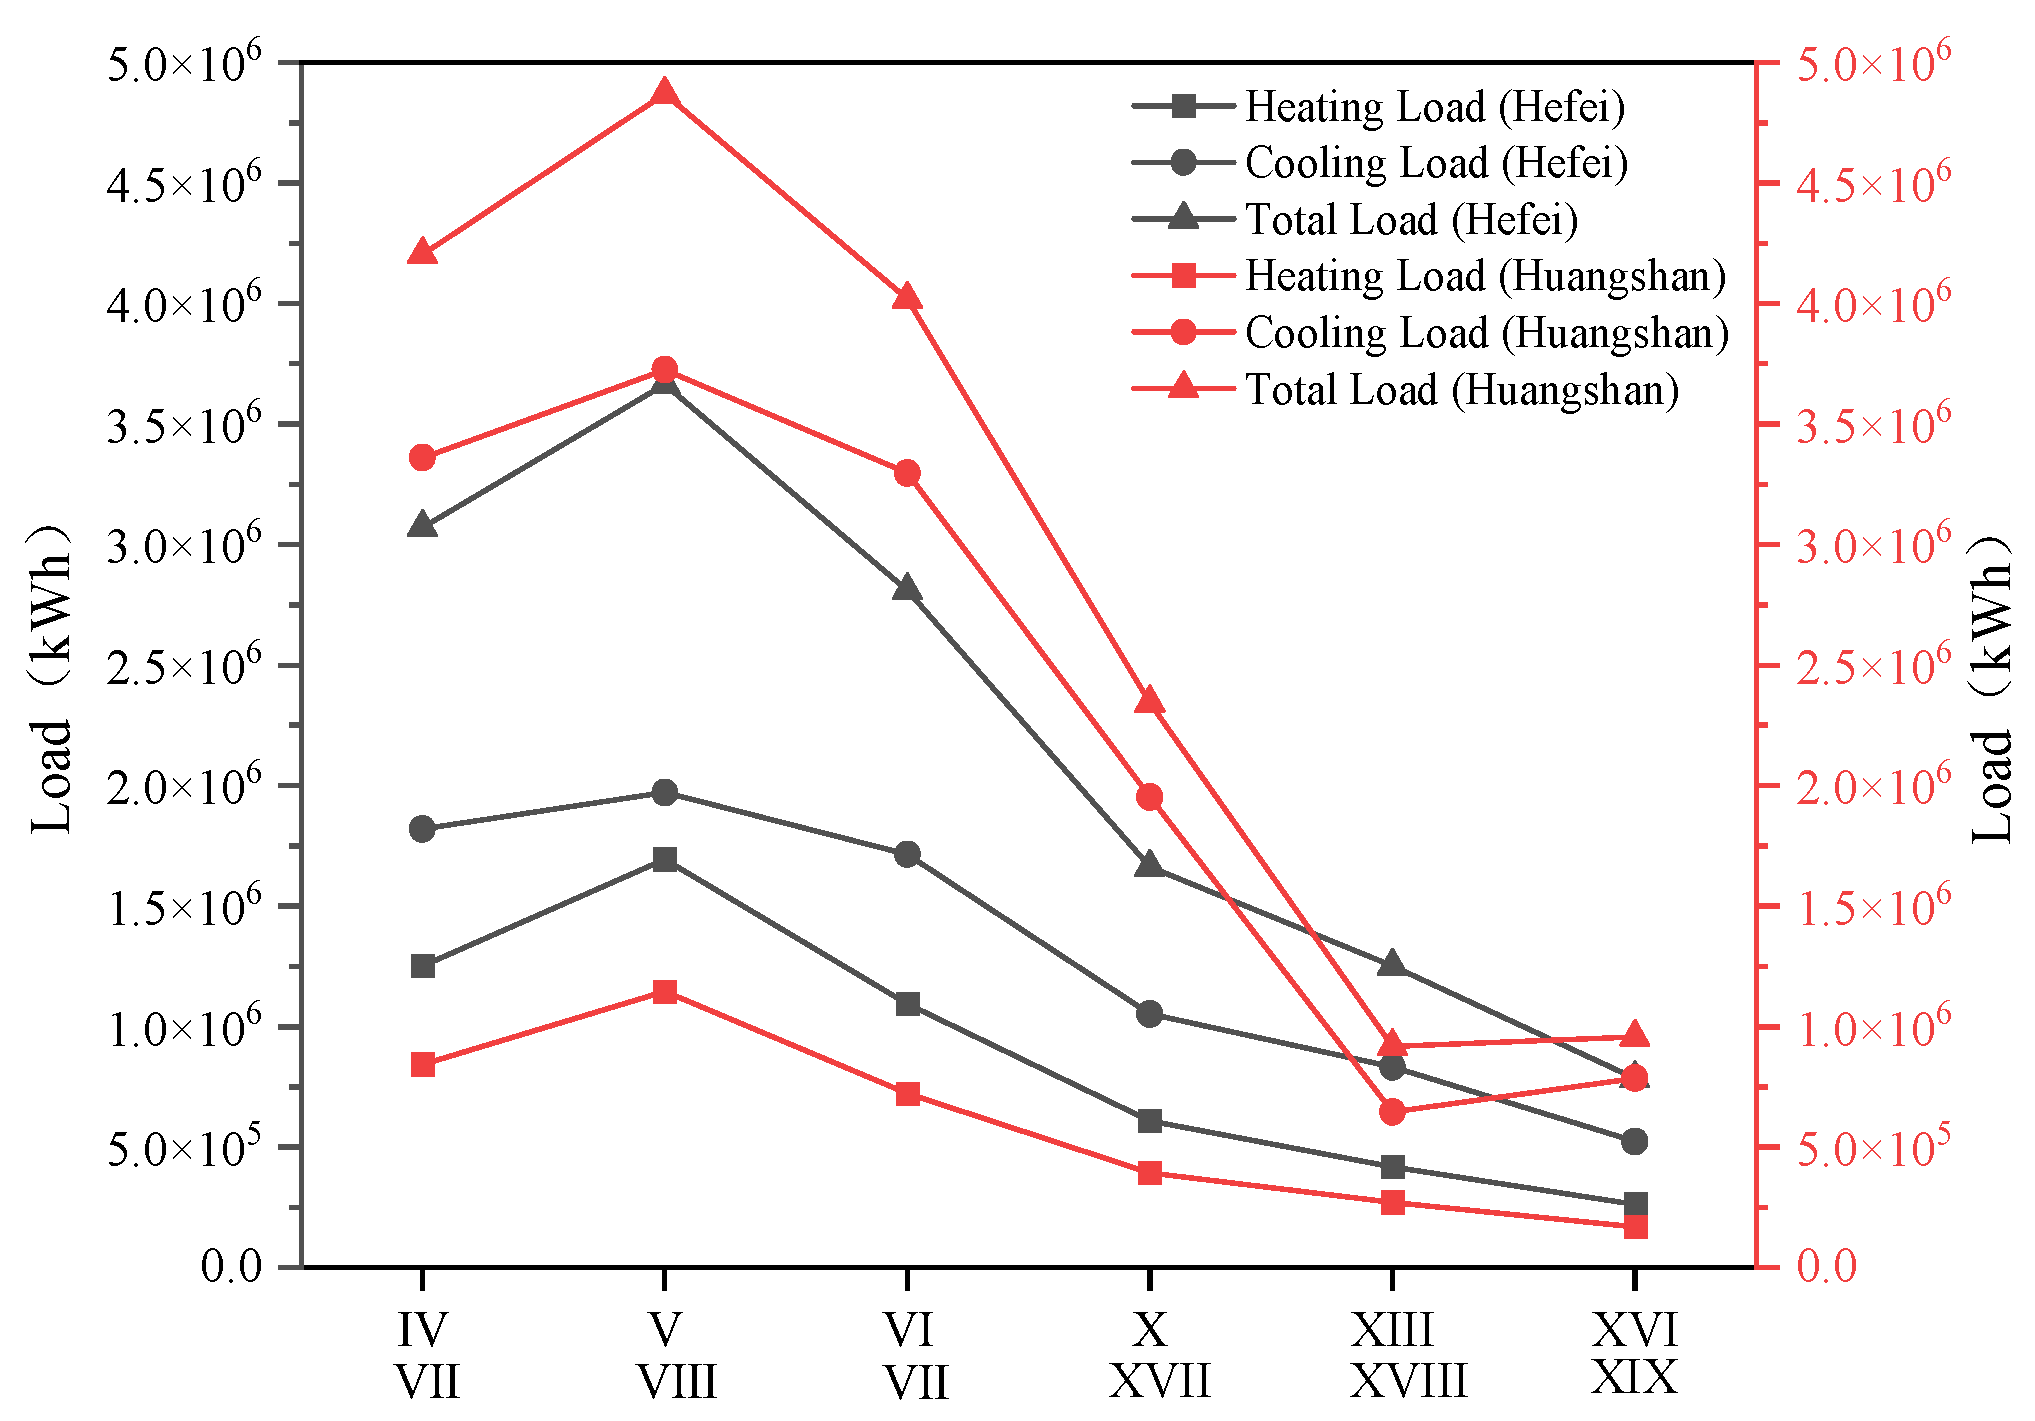
Three common double IGUs and three common high-performance glazings were selected, and climate parameters for Hefei and Huangshan were imported to compare loads. As shown in Figure 24, IV–VI are common double glazings, while X, XIII, and XVI are high-performance glazings. Huangshan, being at a lower latitude, shows overall heating loads lower than Hefei. High-performance glazing shows small differences; common glazing has small differences in heating load but large differences in cooling load. For the first four glazing types, cooling loads in Huangshan are nearly twice those in Hefei. The cooling loads for XIII and XIV are close to those in Hefei, and the shading coefficient, SHGC, and visible transmittance of glazing XIII are all lower than those of XIV. Thus, winter heating demands differ little between central and southern Anhui, whereas southern Anhui needs greater emphasis on summer shading.

4.6. Collaborative Validation and Complementarity Between Experiments and Simulations

In this study, measured experiments in the sunroom and Ecotect numerical simulations mutually validate and complement each other to support performance analysis and optimization conclusions for transparent envelopes in central-southern Anhui.
In the experiment, Sunroom A adopted Triple-Silver Low-e tempered glass (6 Low-e Triple-Silver + 12A + 6T), while in the simulation, Case XV (6 + 12A + 6 Low-e + V + 6) represented vacuum composite Triple-Silver Low-e glass. Although the two share similar optical and thermal properties, the latter exhibits superior thermal insulation performance. Likewise, Sunroom B, used ordinary double-glazed tempered glass (5T + 12A + 5T), corresponds to Case III (6 + 12A + 6) in the simulation. Although slightly different in thickness, the two have comparable thermal performances. The differences in key thermal parameters—such as thermal transmittance, transmittance, and shading coefficient—are minimal; hence, they can be regarded as equivalent models for trend validation.
From both experimental and simulation perspectives, the results show a high degree of consistency in thermal and optical performance. In the experiment, the solar radiation transmittance of Low-e glass was approximately 45.31% that of ordinary glass, and the indoor peak temperature was reduced by 6–7 °C. These findings align well with the simulation results, which indicate a significant reduction in cooling load and annual energy consumption. This consistency verifies the accuracy of the optical–thermal parameter settings in the model, particularly reflecting the lower SHGC and U-value characteristics of Low-e glass. Minor discrepancies between the measured and simulated values mainly stem from the idealized boundary conditions in the simulation, simplified assumptions regarding airflow and heat exchange, and geometric differences between the physical test chamber (6 × 1.2 × 3.5 m) and the symmetric simulation model (5 × 5 × 3.5 m). Overall, the observed temperature fluctuation patterns in the experiment correspond well to the simulated mechanism in which Low-e glass reduces long-wave radiation heat loss, indicating that the simulation effectively represents the actual heat transfer behavior.
From a complementary scope perspective, the experiment focuses on the practical performance of two representative glazing types, while simulations broaden the performance boundaries across many glazing types. Together they reveal the adaptation rules between glazing parameters and regional climate. The experiments confirm the energy-saving advantages of Low-e glazing over ordinary glass, but due to limited samples cannot cover more coating processes, gas fills, and pane counts. The simulations analyze the daylight factors of 12 glazing types and transmitted radiation under 19 conditions, refining how different parameter combinations meet the “summer insulation-winter heat preservation” needs of central-southern Anhui.
From a regional adaptability perspective, the experiments reflect the dual-performance needs of glazing under the climate of central-southern Anhui, which the regionally segmented simulations further quantify. The measured temperature data in transitional seasons and summer intuitively show the region’s need for dynamic regulation capability, while simulations further compare load differences between Hefei and Huangshan, finding that due to its lower latitude, Huangshan needs strengthened summer shading, whereas Hefei needs a winter–summer balance. This fully proves that regional climate impacts glazing selection.

5. Conclusions

Through experiments and simulations, this study conducted an in-depth analysis of the performance of different glazing types in transparent envelopes and their impacts on building energy use, yielding the following conclusions.
(1)
Based on the climatic characteristics of central-southern Anhui, measured comparisons between Low-e glazing and ordinary tempered glass sunrooms show that the solar radiation transmittance of Low-e glass is only 45.31% of that of ordinary tempered glass, with indoor temperature peaks reduced by about 6–7 °C and smaller nighttime temperature fluctuations, verifying the excellent thermal insulation performance and thermal stability of Low-e glazing.
(2)
Using Ecotect software to simulate the daylighting performance of 12 glazing types and transmitted radiation under 19 conditions shows that vacuum composite Triple-Silver glazing has about 10% lower transmittance than argon-filled triple glazing, but a significantly lower shading coefficient, making it suitable for summer shading. Single-silver-coated glass has the best daylighting performance, while Triple-Silver coatings combined with high-transmittance substrates can increase the daylight factor by 10.55%. East–west orientations have the highest annual transmitted radiation; argon-filled IGUs reduce radiation by 6.5% compared with ordinary IGUs, making them more suitable for the climate of central-southern Anhui. At the same time, the simulated values of temperature and radiation indicators matched well with the measured data points, verifying the reliability of the model and demonstrating the practical applicability of Ecotect in the optimization design of transparent building envelopes.
(3)
Experiments indicate that the climatic characteristics of hot, humid summers and cold, damp winters in central-southern Anhui require dynamic adaptation from glazing. The measured performance of Low-e glazing in transitional seasons and summer already meets basic energy-saving requirements. Simulations further quantify optimized strategies by region: Huangshan has lower heating loads and is better suited to vacuum Triple-Silver Low-e glazing that strengthens summer shading; Hefei needs to balance winter and summer, for which argon-filled triple glazing with two cavities can balance heating and cooling energy consumption. Together these show that optimization of transparent envelopes should be based on experimentally measured regional climate parameters and determined via iterative multi-scenario simulations of glazing thermal parameters.
(4)
This study has several limitations. It does not yet cover winter operating conditions or year-round dynamic control, reducing applicability under extreme low temperatures. Long-term degradation and contamination of glass and components were not considered, potentially underestimating future energy use and comfort risks. In addition, parameters such as window-to-wall ratio, shading, and ventilation were not jointly optimized, introducing possible bias in trade-offs. Future work will involve annual and extreme weather simulations, accelerated aging tests, and on-site calibration to enhance reliability. Further studies will focus on the dynamic adaptability and integrated optimization of transparent envelopes in central-southern Anhui, with pilot projects to validate the proposed strategies. The ultimate goal is to build a full-chain low-carbon design framework—from material selection to building operation—for transparent envelope innovation in near-zero energy buildings in hot-summer–cold-winter regions.

Author Contributions

H.H.: Writing—original draft, funding acquisition. Y.Z.: Writing—original draft, formal analysis, data curation. G.Z.: Writing—original draft, funding acquisition. M.C.: Methodology, funding acquisition. S.Z.: Writing—review and editing, Writing—original draft. J.X.: Writing—original draft, review, and editing, Methodology, Funding acquisition. All authors have read and agreed to the published version of the manuscript.

Funding

(1) National Natural Science Foundation of China (No. 52576051). (2) University Outstanding Youth Fund Project of Anhui Province (No. 2022AH020028). (3) Natural Science Foundation of Anhui Province (No. 2308085ME173). (4) Open Project Program of Engineering Research Center of Building Energy Efficiency Control and Evaluation, Ministry of Education (No. AHJZNX-2024-05). (5) Anhui Province Housing and Urban Rural Construction Science and Technology Project (No. 2023-YF046). (6) National key research and development program (No. 2023YFC3807705).

Institutional Review Board Statement

Not applicable.

Informed Consent Statement

Not applicable.

Data Availability Statement

The original contributions presented in this study are included in the article. Further inquiries can be directed to the corresponding author.

Conflicts of Interest

Author Mingzuo Cheng was employed by the company Anhui Jinsanhuan Metal Technology Co., Ltd. The remaining authors declare that the research was conducted in the absence of any commercial or financial relationships that could be construed as a potential conflict of interest.

References

  1. The Research Center for Building Energy Conservation of Tsinghua University. Annual Development Research Report on Building Energy Conservation in China 2022: Public Building Special Topic; China Architecture & Building Press: Beijing, China, 2022; Volume 146. (In Chinese) [Google Scholar]
  2. Lai, X. Innovation and Development of Green Building Technologies under the “Dual Carbon” Goal. Resour. Conserv. Environ. Prot. 2025, 5, 113–117. (In Chinese) [Google Scholar] [CrossRef]
  3. Yang, Q.; Wang, J.; Liu, X.; Fu, L.-M.; Duan, Z.-L.; Wu, C.-Y. Crisis Transformation of Coupling Effects in China’s Building Carbon Emission Reduction-Environmental Protection-Economic Development System. Environ. Sci. 2025, 46, 2035–2046. (In Chinese) [Google Scholar] [CrossRef]
  4. Wang, Z. Study on Improvement of Human Thermal Comfort Under High Indoor Solar Heat Gain. Ph.D. Thesis, Chang’an University, Xi’an, China, 2024. (In Chinese) [Google Scholar] [CrossRef]
  5. Song, Z. Analysis and Optimization of Indoor Temperature Fluctuations in Glass Curtain Wall (Office) Buildings in Cold Regions. Ph.D. Thesis, Shandong Jianzhu University, Jinan, China, 2024. (In Chinese) [Google Scholar] [CrossRef]
  6. Zhang, Y. Study on Building Energy Efficiency Evaluation in Hot-Summer-Cold-Winter Regions Under the Background of Dual Carbon. Ph.D. Thesis, Zhongyuan University of Technology, Zhengzhou, China, 2024. (In Chinese) [Google Scholar] [CrossRef]
  7. Du, F.; Meng, Q. Study on Indoor Light Pollution and Thermal Environment of Glass Curtain Wall Buildings. Build. Sci. 2011, 27, 61–65. (In Chinese) [Google Scholar] [CrossRef]
  8. Ren, J.; Yuan, J.; Sui, X.; Zhang, J. Impact of Secondary Heat Transfer of Shading-Transparent Envelope Composites on Human Thermal Comfort. Heating. Vent. Air Cond. 2022, 52, 395–401. (In Chinese) [Google Scholar]
  9. Zhao, K.; Gui, X.; Ge, J. Influence of Solar Radiation on Thermal Comfort in Large Spaces and Design of Indoor Parameters. Acta Energiae Solaris Sin. 2019, 40, 2655–2662. (In Chinese) [Google Scholar]
  10. Ascione, F. Energy conservation and renewable technologies for buildings to face the impact of the climate change and minimize the use of cooling. Sol. Energy 2017, 154, 34–100. [Google Scholar] [CrossRef]
  11. Ahn, H.; Rim, D.; Pavlak, G.S.; Freihaut, J.D. Uncertainty analysis of energy and economic performances of hybrid solar photovoltaic and combined cooling, heating, and power (CCHP + PV) systems using a Monte-Carlo method. Appl. Energy 2019, 255, 113753. [Google Scholar] [CrossRef]
  12. Sun, F.; Jiang, Q.; Qi, Z.; Ye, X.; Chen, D. Research and Application of Standards for Energy-Saving Evaluation Methods of Building Thermal Insulation Coatings. New Build. Mater. 2025, 52, 26–30+41. (In Chinese) [Google Scholar]
  13. Husin, S.N.S.; Harith, Z.Y.H. The performance of daylight through various windows for residential buildings. Asian J. Environ.-Behav. Stud. 2018, 6, 169–178. [Google Scholar] [CrossRef]
  14. Missoum, M.; Hamidat, A.; Loukarfi, L.; Abdeladim, K. Impact of rural housing energy performance improvement on the energy balance in the North-West of Algeria. Energy Build. 2014, 85, 374–388. [Google Scholar] [CrossRef]
  15. Xu, L.; Ojima, T. Field experiments on natural energy utilization in a residential house with a double skin façade system. Build. Environ. 2007, 42, 2014–2023. [Google Scholar] [CrossRef]
  16. Baldinelli, G. Double skin façades for warm climate regions: Analysis of a solution with an integrated movable shading system. Build. Environ. 2009, 44, 1107–1118. [Google Scholar] [CrossRef]
  17. Zaller, A.; Winter, E.R.F.; Viskanta, R. Experimental studies of combined heat transfer in turbulent mixed convection fluid flows in double-skin facades. Int. J. Heat Mass Transf. 2002, 45, 4401–4408. [Google Scholar] [CrossRef]
  18. Shaik, S.; Maduru, V.R.; Kontoleon, K.J.; Arıcı, M.; Gorantla, K.; Afzal, A. Building glass retrofitting strategies in hot and dry climates: Cost savings on cooling, diurnal lighting, color rendering, and payback timeframes. Energy 2022, 243, 123106. [Google Scholar] [CrossRef]
  19. Bokel, R.M.J. The Effect of Window Position and Window Size on the Energy Demand for Heating, Cooling and Electric Lighting. In Proceedings of the 10th International Building Performance Simulation Association Conference & Exhibition, Tsinghua University, Beijing, China, 3–6 September 2007; Jiang, Y., Zhu, Y., Yang, X., Li, X., Eds.; IBPSA/Tsinghua University: Beijing, China, 2007; pp. 117–121. [Google Scholar]
  20. Li, Q.; Zhang, L.; Wang, X.; Su, X. Daylighting and energy performance of window with transparent insulation slats combined with building shading in the hot-summer and cold-winter zone. Sustain. Cities Soc. 2024, 114, 105772. [Google Scholar] [CrossRef]
  21. Ning, Q.; Chen, Z. Study on Energy-Saving Optimization of Opaque Envelopes for Rural Residences in Cold Regions. Build. Technol. 2023, 54, 1711–1716. (In Chinese) [Google Scholar]
  22. Song, S.; Sun, H.; Long, J.; Tan, X.; Li, J. Light-thermal environment of vertical translucent enclosure structures under solar radiation and method of internal shading adjustment. Energy 2024, 289, 130036. [Google Scholar] [CrossRef]
  23. Saroglou, T.; Theodosiou, T.; Givoni, B.; Meir, I.A. Studies on the optimum double-skin curtain wall design for high-rise buildings in the Mediterranean climate. Energy Build. 2020, 208, 109641. [Google Scholar] [CrossRef]
  24. Chow, T.T.; Pei, G.; Chan, L.S.; Lin, Z.; Fong, K.F. A comparative study of PV glazing performance in warm climate. Indoor Built Environ. 2009, 18, 32–40. [Google Scholar] [CrossRef]
  25. Chan, A.L.S.; Chow, T.T.; Fong, K.F.; Lin, Z. Investigation on energy performance of double skin façade in Hong Kong. Energy Build. 2009, 41, 1135–1142. [Google Scholar] [CrossRef]
  26. Pérez-Grande, I.; Meseguer, J.; Alonso, G. Influence of glass properties on the performance of double-glazed facades. Appl. Therm. Eng. 2005, 25, 3163–3175. [Google Scholar] [CrossRef]
  27. Yu, J.; Liu, Y.; Xiong, C.; Huang, J.C. Study on daylighting and energy conservation design of transparent envelope for office building in hot summer and cold winter zone. Procedia Eng. 2015, 121, 1642–1649. [Google Scholar] [CrossRef]
  28. Liu, M.; Han, S.; Yang, W.; Li, R. Study on Building Energy Consumption of External Circulation DSF in Hot-Summer-Cold-Winter Regions. Power Gener. Air Cond. 2017, 38, 62–66. (In Chinese) [Google Scholar]
  29. Li, S.; Chen, S. Field monitoring and prediction on temperature distribution of glass curtain walls of a super high-rise building. Eng. Struct. 2022, 250, 113405. [Google Scholar] [CrossRef]
  30. Yuan, J. Study on Energy-Saving Characteristics of Double-Skin Glass Curtain Walls in Severe Cold Regions. Ph.D. Thesis, Shenyang Jianzhu University, Shenyang, China, 2012. (In Chinese). [Google Scholar]
  31. Van Moeseke, G.; Gratia, E.; Reiter, S.; De Herde, A. Wind pressure distribution influence on natural ventilation for different incidences and environment densities. Energy Build. 2005, 37, 878–889. [Google Scholar] [CrossRef]
  32. Yao, S.; Jiang, Z.; Yuan, J.; Wang, Z.; Huang, L. Multi-objective optimization of transparent building envelope of rural residences in cold climate zone, China. Case Stud. Therm. Eng. 2022, 34, 102052. [Google Scholar] [CrossRef]
  33. Koçlar Oral, G. Appropriate window type concerning energy consumption for heating. Energy Build. 2000, 32, 95–100. [Google Scholar] [CrossRef]
  34. Wu, H.; Zhang, T. Multi-objective optimization of energy, visual, and thermal performance for building envelopes in China’s hot summer and cold winter climate zone. J. Build. Eng. 2022, 59, 105034. [Google Scholar] [CrossRef]
  35. Schultz, J.M.; Svendsen, S. WinSim: A simple simulation program for evaluating the influence of windows on heating demand and risk of overheating. Sol. Energy 1998, 63, 251–258. [Google Scholar] [CrossRef]
  36. Misiopecki, C.; Grynning, S.; Gustavsen, A. Thermal improvements of box-window using shading attachments. Hot-Box measurements. Dev. Built Environ. 2023, 16, 100185. [Google Scholar] [CrossRef]
  37. Huang, J.; Liu, S.; Tang, X.; Peng, C.; Wang, L.; Zhang, X. Analysis of Thermal Performance and Energy-Saving Effects of External Windows in Office Buildings in Hot-Summer-Cold-Winter Regions. Build. Energy Conserv. 2019, 47, 88–92. (In Chinese) [Google Scholar]
  38. Hou, X. Comparative Study on Energy Consumption and Economy Between Existing Buildings and Near-Zero Energy Buildings. Ph.D. Thesis, North China University of Technology, Beijing, China, 2021. (In Chinese). [Google Scholar]
  39. Liu, S.; Qiang, W.; Zhang, Z.; Liu, C.; Sun, C.; Li, G. Economic Sensitivity Analysis of Opaque Envelopes in Near-Zero Energy Buildings in Severe Cold Regions. Build. Technol. 2020, 51, 1385–1388. (In Chinese) [Google Scholar]
  40. Zhang, Q. Study on Energy-Saving Adaptability of Low-E Glass in Chongqing Area. Ph.D. Thesis, Chongqing University, Chongqing, China, 2007. (In Chinese). [Google Scholar]
  41. Yu, Z. Study on Energy Consumption Simulation of Glass Film in Existing Office Buildings. Ph.D. Thesis, Hebei University of Technology, Tianjin, China, 2020. (In Chinese). [Google Scholar]
  42. Zhu, Y. Building Environment Science. Ph.D. Thesis, China Architecture & Building Press, Beijing, China, 2016. (In Chinese). [Google Scholar]
  43. Daylight Factor. In Wikipedia, The Free Encyclopedia. Available online: https://en.wikipedia.org/wiki/Daylight_factor (accessed on 29 October 2025).
  44. Carlos, J.S.; Corvacho, H. Evaluation of the performance indices of a ventilated double window through experimental and analytical procedures: SHGC-values. Energy Build. 2015, 86, 886–897. [Google Scholar] [CrossRef]
  45. Ochoa, C.E.; Capeluto, I.G. Evaluating visual comfort and performance of three natural lighting systems for deep office buildings in highly luminous climates. Build. Environ. 2006, 41, 1128–1135. [Google Scholar] [CrossRef]
  46. Bourgeois, D.; Reinhart, C.F.; Ward, G. Standard daylight coefficient model for dynamic daylighting simulations. Build. Res. Inf. 2008, 36, 68–82. [Google Scholar] [CrossRef]
  47. Lin, R.; Zhao, J. Analysis of Main Technical Features of the New Edition of “Code for Design of Building Daylighting”. China Illum. Eng. J. 2013, 24, 5–11. (In Chinese) [Google Scholar]
  48. ISO 9001; Quality Management Systems—Requirements. International Organization for Standardization (ISO): Geneva, Switzerland, 2015.
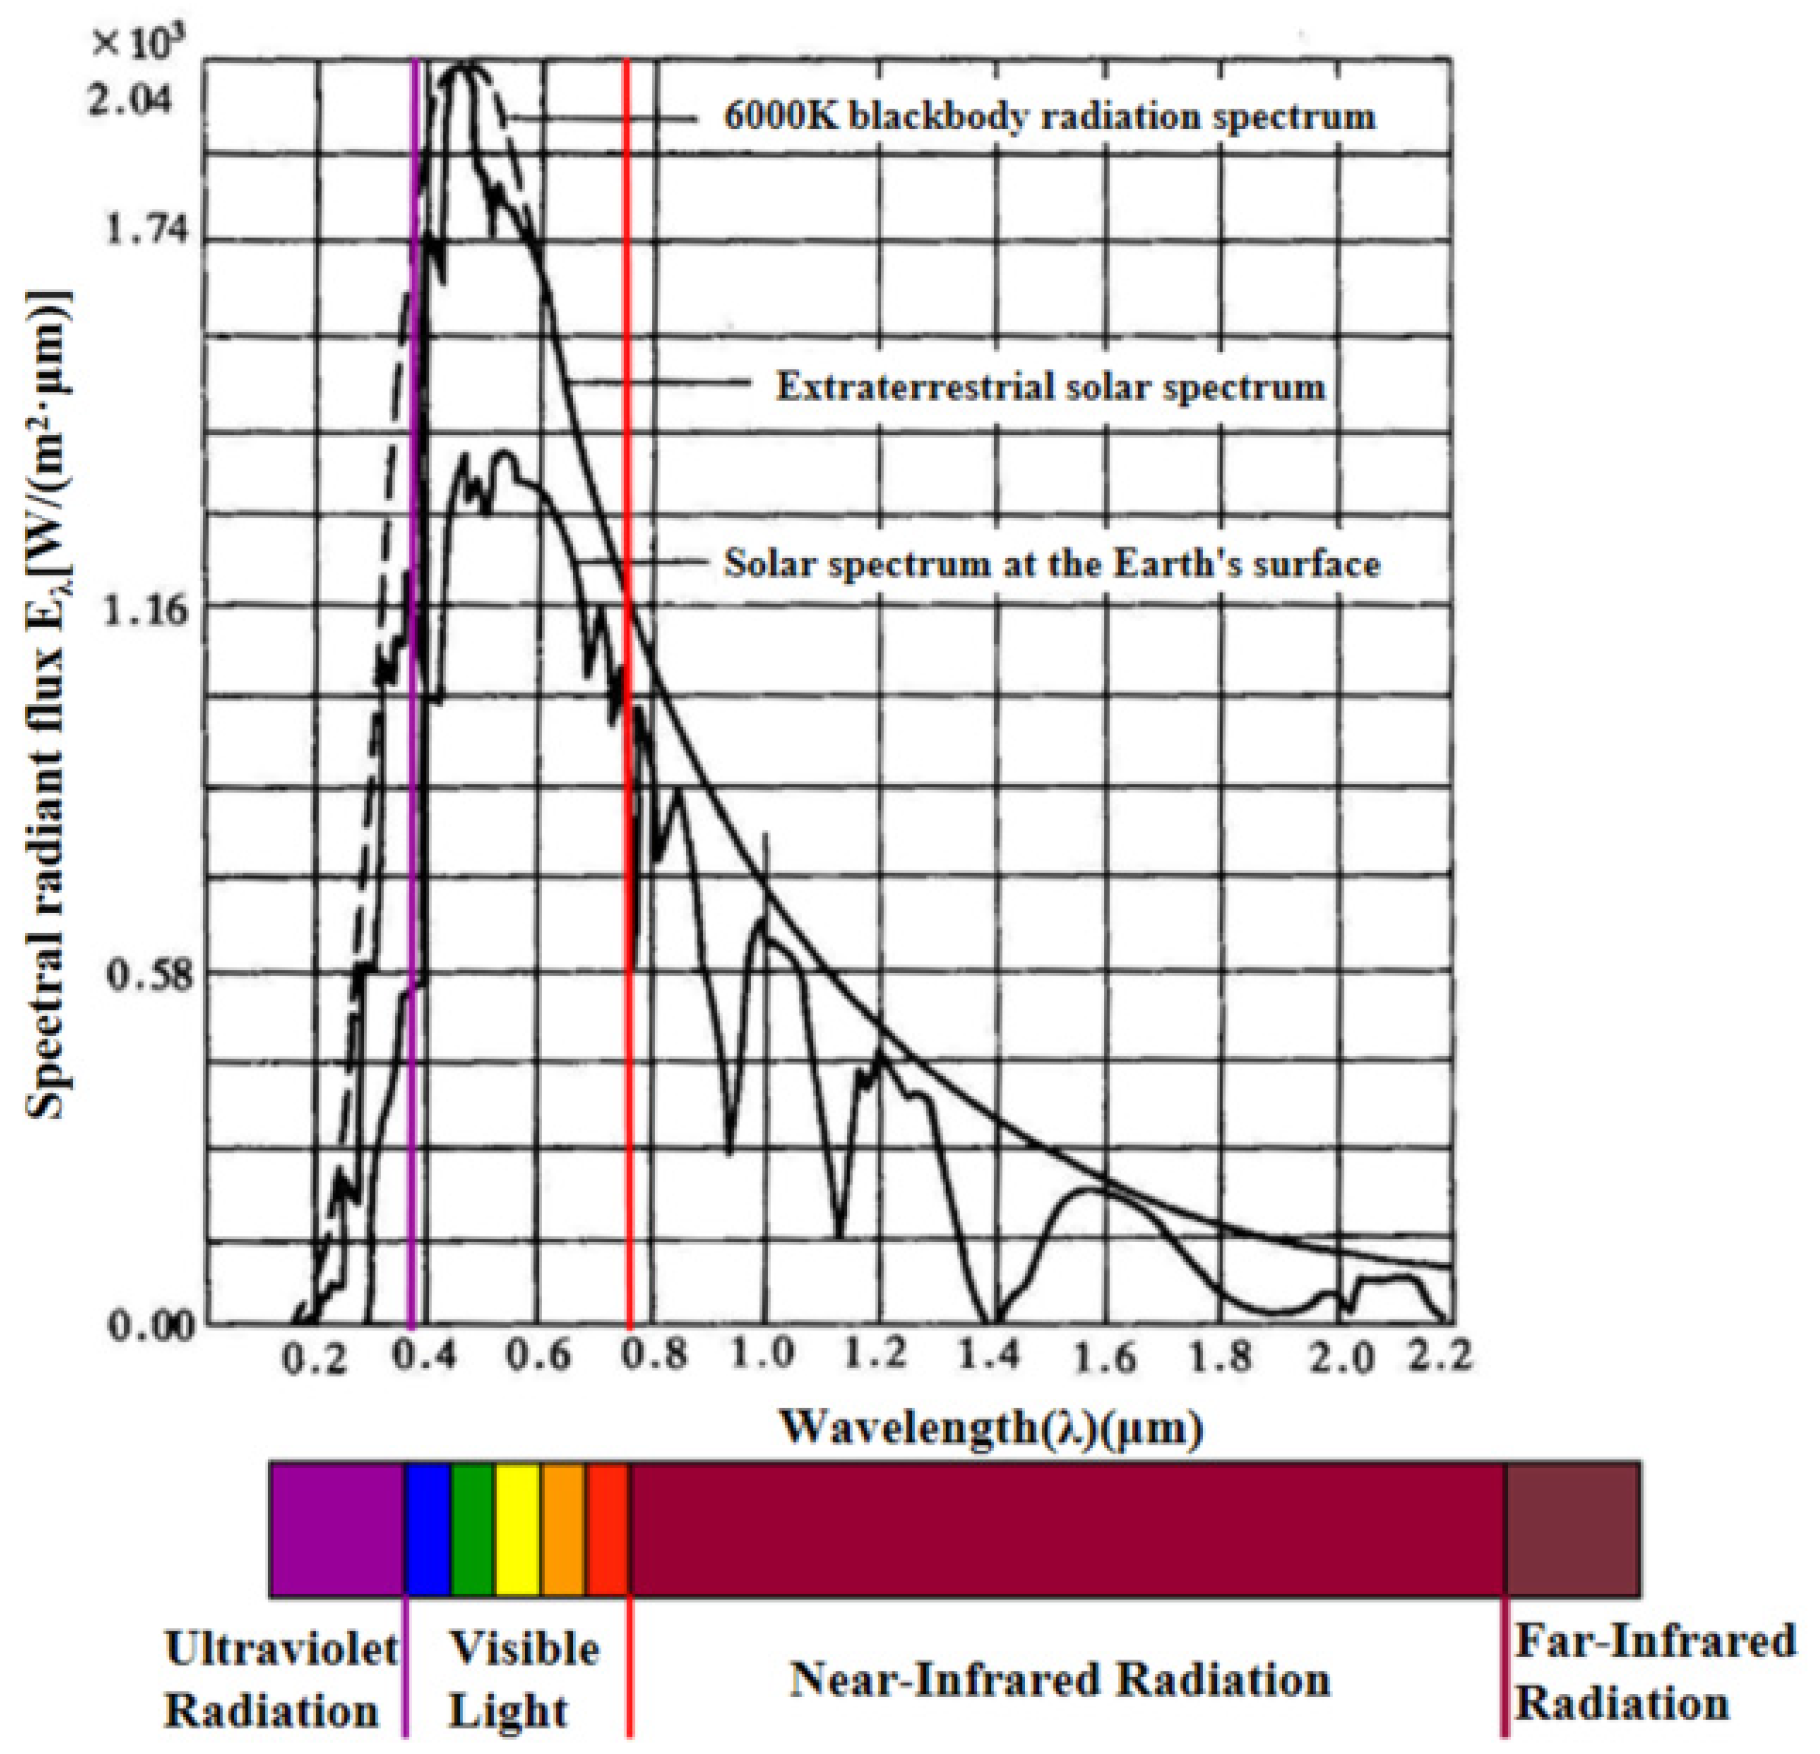
Figure 1. Spectral components of solar radiation.
Sustainability 17 10544 g001
Figure 2. Transmission of solar radiation in transparent envelopes.
Sustainability 17 10544 g002
Figure 3. Transmission of solar radiation through a single pane.
Sustainability 17 10544 g003
Figure 4. Measured photos of sunrooms with different glazings.
Sustainability 17 10544 g004
Figure 5. Schematic, site photos, and equipment diagrams for measurement points.
Sustainability 17 10544 g005
Figure 6. Indoor temperatures of sunrooms with different glazings and seasons under non-ventilated conditions. (a) Transitional season. (b) Summer.
Sustainability 17 10544 g006
Figure 7. Radiation transmittance of sunrooms with different glazings across seasons. (a) Transitional season. (b) Summer.
Sustainability 17 10544 g007
Figure 8. Sunroom building model.
Sustainability 17 10544 g008
Figure 9. Daylight factor maps on the horizontal plane for sunrooms with different glazings.
Sustainability 17 10544 g009aSustainability 17 10544 g009b
Figure 10. Daylight factor comparison of A–E glazing types.
Sustainability 17 10544 g010
Figure 11. Daylight factor comparison of F–M glazing types.
Sustainability 17 10544 g011
Figure 12. Natural daylight illuminance distribution on the horizontal plane for sunrooms with different glazings.
Sustainability 17 10544 g012
Figure 13. Illuminance for A–E glazing types.
Sustainability 17 10544 g013
Figure 14. Illuminance for F–M glazing types.
Sustainability 17 10544 g014
Figure 15. Comparison of annual transmitted radiation by orientation for sunrooms with different glazings in Hefei.
Sustainability 17 10544 g015
Figure 16. Comparison of annual transmitted radiation by orientation for different glazings in Huangshan.
Sustainability 17 10544 g016
Figure 17. Annual transmitted radiation in Hefei vs. Huangshan.
Sustainability 17 10544 g017
Figure 18. Transmitted radiation on the hottest and coldest days in Hefei and Huangshan.
Sustainability 17 10544 g018
Figure 19. Transmitted radiation by orientation for high-performance glazings (cases X–XVI).
Sustainability 17 10544 g019
Figure 20. Monthly heating load across the year for different glazings in Hefei.
Sustainability 17 10544 g020
Figure 21. Monthly cooling load across the year for different glazings in Hefei.
Sustainability 17 10544 g021
Figure 22. Annual building load for sunrooms with different glazings in Hefei.
Sustainability 17 10544 g022
Figure 23. Annual building load and energy-saving rates for high-performance glazings.
Sustainability 17 10544 g023
Figure 24. Load variations for sunrooms with different glazings in different regions.
Sustainability 17 10544 g024
Table 1. Daylight factor standard values on work planes in visual task areas and indoor natural illuminance standards [47].
Lighting ClassSide DaylightingTop Daylighting
Daylight Factor Standard (%)Indoor Natural Illuminance (lx)Daylight Factor Standard (%)Indoor Natural Illuminance (lx)
I57505750
II46004450
III34503300
IV23002150
V1150175
Table 2. Daylight factor standard values on work planes in visual task areas [47].
Daylighting GradeVisual Task CategorySide DaylightingTop Daylighting
Task PrecisionMinimum Identifiable Object Size
d (mm)
Indoor Critical Illuminance (l×)Minimum Daylight Factor Cmin (%)Indoor Critical Illuminance (l×)Average Daylight Factor Cmin (%)
IExtremely high precisiond ≤ 0.1525053507
IIHigh precision0.15 < d ≤ 0.315032251.5
IIIMedium precision0.3 < d ≤ 1.010021503
IVStandard precision1.0 < d ≤ 5.0501751.5
VLow precisiond > 5.0250.5350.7
Table 3. Glass parameters of the sunrooms.
Glass
Type
Glass
Model
K-ValueShading
Coefficient
Visible
Transmittance
Clear Tempered Glass5T + 12A + 5T2.720.870.8
Triple-Silver Low-e Tempered Glass6Low-e Triple-Silver + 12A + 6T1.50.30.48
Table 4. Arrangement of monitoring points in the sunrooms.
No.Monitoring ContentMeasurement Height (m)
1Temperature and Humidity Sensors0.5 m, 1 m, 1.5 m, 2 m
2CO2 Concentration Sensor1.5 m
3PM2.5 Concentration Sensor1.5 m
4Radiant Heat Flux Sensor1.5 m
Table 5. Experimental equipment information.
Equipment NameModelTechnical ParametersManufacturer
Industrial Wide-Temperature Range Temperature and Humidity TransmitterJWSK-6Humidity: ±2% RH (5% RH–95% RH, 25 °C); Temperature: ±0.5 °C (25 °C)Beijing Kunlun Coast Sensing Technology Co., Ltd. (Beijing, China)
Solar Radiation SensorRK200-03Total Solar Radiation Range: 0–2000 W/m2; Spectral Range: 300–3200 nm; Temperature Influence: ±2% (−10–40 °C)Hunan Ruikate Electronic Technology Co., Ltd. (Changsha, China)
Table 6. Outdoor natural critical illuminance values [18].
Light Climate ZoneIIIIIIIVV
K-value0.850.901.001.11.2
Outdoor natural critical illuminance E60005500500045004000
Table 7. Parameters of different glazing types.
CaseGlazing Type and ThicknessLow-e Emissivity εVisible
Reflectance
Visible
Transmittance
Solar Heat
Gain Coefficient
Value
W/m2·K
Shading
Coefficient Sc
ASingle Clear Glass 6 mm-0.0810.8970.945.3600.98
BSingle Low-e 6 mm0.180.0770.7870.753.4970.799
C6 + 12A + 6-0.1460.8110.812.7100.866
D6 Low-e + 12A +
6 Low-e
0.180.1270.7200.751.80.716
E6 Low-e + 12A + 60.180.1300.7300.772.30.650
F6 Low-e + 9Ar + 6 +
9Ar + 6 Low-e
0.0720.1580.7250.5100.920.587
G6 Low-e + 16Ar + 6 +
16Ar + 6 Low-e (High Transmission)
0.0720.1580.7250.5110.760.587
H6 Low-e + 12Ar + 6 +
12Ar
0.1030.1520.4770.4160.830.416
J6 + 12A + 6 Low-e +
V + 6 (Single-Silver)
0.1030.1930.5930.4500.650.517
K6 + 12A + 6 Low-e +
V + 6 (Double-Silver)
0.0650.1770.4840.3000.550.344
L6 + 12A + 6 Low-e +
V + 6 (Triple-Silver)
0.0240.1710.4760.2370.430.273
M6 + 12Ar + 6 Low-e +
V + 6 (Triple-Silver)
0.0210.1790.6150.3020.410.348
Table 8. Specific parameters of different glazings.
CaseGlazing Type and ThicknessLow-e Emissivity εVisible ReflectanceVisible TransmittanceSolar Heat Gain CoefficientU-Value
W/m2·K
(Thermal Transmittance)
Shading Coefficient (Sc)Climate Zone
ISingle Clear Glass 6 mm-0.0810.8970.945.3600.98Hefei
IISingle Low-e Glass 6 mm0.180.0770.7870.753.4970.799Hefei
III6 + 12A + 6-0.1460.8110.812.7100.866Hefei
IV6 Low-e + 12A +
6 Low-e
0.180.1270.7200.751.80.716Hefei
V6 Low-e + 12A + 60.180.1300.7300.772.30.650Hefei
VI6 Low-e + 12Ar + 6 Low-e0.130.1110.7200.751.600.648Hefei
VII6 Low-e + 12A +
6 Low-e
0.130.1110.7200.751.80.716Huangshan
VIII6 Low-e +
12A + 6
0.180.1300.7300.772.30.650Huangshan
IX6 Low-e + 12Ar +
6 Low-e
0.130.1110.7200.751.600.648Huangshan
X6 Low-e + 9Ar +
6 + 9Ar + 6 Low-e
0.0720.1580.7250.5100.920.587Hefei
XI6 Low-e + 12Ar +
6 + 12Ar
0.1030.1520.4770.4160.830.416Hefei
XII6 Low-e + 16Ar+
6 + 16Ar + 6 Low-e (High Transmission)
0.0720.1580.7250.5110.760.587Hefei
XIII6 + 12A +
6 Low-e + V + 6 (Single-Silver)
0.1030.1930.5930.4500.650.517Hefei
XIV6 + 12A + 6 Low-e + V + 6 (Double-Silver)0.0650.1770.4840.3000.550.344Hefei
XV6 + 12A + 6 Low-e + V + 6 (Triple-Silver)0.0240.1710.4760.2370.430.273Hefei
XVI6 + 12Ar + 6 Low-e + V + 6 (Triple-Silver)0.0210.1790.6150.3020.410.348Hefei
XVII6 Low-e + 9Ar + 6 + 9Ar + 6 Low-e0.0720.1580.7250.5100.920.587Huangshan
XVIII6 + 12A + 6 Low-e + V + 6 (Single-Silver)0.0650.1770.4840.3000.550.344Huangshan
XIX6 + 12Ar + 6 Low-e + V + 6 (Triple-Silver)0.0210.1790.6150.3020.410.348Huangshan
Disclaimer/Publisher’s Note: The statements, opinions and data contained in all publications are solely those of the individual author(s) and contributor(s) and not of MDPI and/or the editor(s). MDPI and/or the editor(s) disclaim responsibility for any injury to people or property resulting from any ideas, methods, instructions or products referred to in the content.