Article

Quantile Modelling of the Moderating Role of Renewable and Nuclear Energy in the Transportation and Environmental Sustainability Nexus

by
Hafiz Muhammad Asif
1,
Yunfeng Gao
1 and
Mian Gohar Rahman Zafar
2,*
1
College of Transport & Communications, Shanghai Maritime University, Shanghai 201306, China
2
School of Economics and Management, Shanghai Maritime University, Shanghai 201306, China
*
Author to whom correspondence should be addressed.
Sustainability 2025, 17(23), 10541; https://doi.org/10.3390/su172310541
Submission received: 11 October 2025 / Revised: 18 November 2025 / Accepted: 20 November 2025 / Published: 25 November 2025

Abstract

This study examines the moderating effects of renewable and nuclear energy on the relationship between transportation index (air and land) and environmental sustainability from 1995 to 2022 across the top 27 polluting countries. The study employed a series of pre-estimation tests, along with the novel Method of Moments Quantile Regression (MMQR), to estimate heterogeneous effects across the lower, middle, and upper quantiles of environmental sustainability. The MMQR results indicate that environmental sustainability is hampered by transportation, whereas renewable and nuclear energy promote it. The moderation effect model shows that both renewable and nuclear energy development mitigate the negative environmental externality from the transportation sector. The controlling factors, GDP and inflation, are found to be harmful for environmental sustainability, while trade openness is found to be favourable. The robustness findings using Driscoll and Kray standard errors (DKse) yielded similar results; nonetheless, the magnitude of the coefficient varies substantially. Thus, think tanks and policymakers are recommended to integrate renewable and nuclear energy into the transportation sector’s energy portfolio to mitigate its negative environmental impacts.

1. Introduction

The transportation sector is crucial to economic growth and development, contributing to international trade, tourism, and resource movement [1,2,3]. It is also essential for socio-economic development. However, the transportation sector’s carbon dioxide (CO2) emissions pose significant environmental risks, with an increase of over 25% in 2019 compared to 1990 [4]. These emissions contribute to global challenges such as environmental degradation, flooding, and a diminished ozone layer. Air pollution in India and China contributes to cardiovascular illnesses and is considered unsafe for human habitation [5]. The United Nations’ Sustainable Development Goal 13 (SDG 13) calls for global governing authorities and stakeholders to develop environmental risk mitigation strategies [6]. The current transportation system is unsustainable due to its reliance on traditional fossil fuels, particularly in private automobiles. This reliance raises concerns about CO2, volatile organic compounds, and fragile particulate matter [7]. Therefore, there is an urgent need for clean and emission-free energy sources in the transportation sector to maintain ecological sustainability.
The current transportation sector framework heavily relies on fossil fuel-based energy sources, and excessive reliance on them undermines environmental performance [8]. The various modes of transportation, such as inland shipping, road transportation, freight, aviation, and rail transportation, significantly increase environmental risk [9,10,11,12,13]. Nonetheless, the incorporation of sustainable energy sources into the transportation sector can help boost economic growth without compromising environmental sustainability [14]. Sustainable and clean energy sources, such as renewable and nuclear energy, can help alleviate environmental risks associated with the transportation sector. Nuclear and renewable energy sources are alternatives to fossil fuel-based energy, characterized by their ability to produce emission-free energy [15,16]. Renewable energy development is instrumental in lowering environmental contamination [17]. Besides that, the development of renewable and nuclear energy also helps achieve economic goals without compromising environmental standards [18]. In their research, Jaiswal, Chowdhury [19] further endorsed the significance of sustainable clean energy for improving environmental, social, and economic performance.
The critical role of renewable and nuclear energy extends beyond environmental and economic benefits in the industrial and manufacturing sectors. Past studies heightened the significance of renewable and nuclear energy for the transportation sector. Incorporating renewable and nuclear energy into the transportation sector’s energy portfolio could provide a viable solution for reducing transport-based emissions. For instance, Amin, Altinoz [20] recommended to increase the share of renewable energy in the transportation sector to reduce the amount of CO2 emissions from the environment. More precisely, from the transportation sector, several studies linked renewable energy consumption with the CO2 emission reduction [21,22]. Dai, Alvarado [23] stressed that the United States should increase the share of renewable energy in the transportation sector to shift towards a pollution-free environment. Furthermore, García-Olivares, Solé [24] enlightens the feasibility of replacing the traditional transportation sector’s energy structure with renewable energy to mitigate environmental risk. Nonetheless, the evidence above lays a thought-provoking theoretical foundation that underscores the significance of renewable energy in mitigating the transportation sector’s negative impact on environmental sustainability.
Furthermore, renewable energy may not replace fossil fuels solely due to their intermittent nature. Incorporating nuclear energy, which provides stable and carbon-free power, significantly reduces the need for renewable capacity and storage, enhancing the efficiency and reliability of fossil fuel substitution [25]. Nuclear energy can provide a viable, sustainable energy source for decarbonizing the transport sector [26]. Recent literature complements these arguments by examining maritime transportation from a different perspective. For instance, Wang, Zhang [27] argued that incorporating nuclear energy into maritime transportation could reduce environmental stress. Despite the critical importance of nuclear and renewable energy in the transportation sector, whether these can mitigate or alter the adverse effects of transportation on environmental sustainability is largely unexplored.
The above discussion helps conceptualize the significance of renewable and nuclear energy for decarbonizing the transport sector and ensuring environmental sustainability. Nonetheless, prior studies have mainly focused on the direct impacts of renewable and nuclear energy, and of transportation, on environmental sustainability [17,28,29,30,31,32,33]. The question of how, and whether, renewable and nuclear energy can moderate the strength or direction of the impact of transportation on environmental sustainability remains unanswered. Moreover, prior studies generalized the influence of investments in transportation infrastructure on environmental pollution, ignoring the role of various modes of transportation together. These gaps hinder a comprehensive understanding of how renewable and nuclear energy might mitigate or exacerbate the environmental impacts of the transportation sector, particularly in the top 27 polluting countries. Among these countries, the WorldBank [34] lists China, Russia, the USA, India, and Germany as top contributors to CO2 emissions. Furthermore, Russia, China, India, Brazil, and South Africa represent nearly 50% of the global population and account for 25% of global GDP [35].
Drawing on the above debate, the present research addresses the aforementioned literature gaps by contributing significantly to understanding the conditional impact of renewable and nuclear energy on the relationship between transportation and environmental sustainability. First, to the best of our knowledge, this study is the first to utilize the transportation index (air and land) to investigate its influence on environmental sustainability. Second, this study is the pioneer in examining the moderating role of renewable and nuclear energy in the relationship between transportation and environmental sustainability. Third, this study is among the few to use the novel method of moments quantile regression (MMQR) to examine this interactive relationship across the top 27 polluting countries. These countries hold critical importance in establishing sustainable development strategies. Fourth, the outcomes of this research provide prudential policy recommendations for think tanks, governing authorities, and policymakers under the umbrella of SDG 13.
The subsequent framework of this paper is as follows: Section 2 presents academic literature. Section 3 and Section 4 present methodology and empirical outcomes, respectively. Section 5 provides a conclusion, policy discussion, and future research directions.

2. Literature Review

2.1. Theoretical Framework

The theoretical framework of this research is based on the grounds of Stakeholder theory [36]. The advocates of stakeholder theory emphasized that heavily polluting businesses should prioritize and protect the interests of all stakeholders (publics, customers, employees, government, and shareholders) rather than focusing solely on shareholder profit maximization [37]. Transportation activities play a vital role in a country’s economic well-being [38,39,40]. Transportation facilities are equally helpful in enhancing business efficiency [41]. Transportation facilities also help the general public and increase their access to job opportunities [42,43]. Despite these favorable outcomes, the transportation sector is one of the biggest contributors to CO2 emissions, posing a severe environmental risk [6]. Acheampong, Dzator [44] argued that transportation infrastructure fosters economic growth at one end, but on the other end, it increases CO2 emissions. Several studies claimed a strong correlation between environmental risk and transportation activities [45,46]. This environmental crisis is a serious concern for human beings, and therefore, SDG 13 of the UN emphasizes the establishment of environmental risk mitigation strategies [47]. Incorporating clean energy sources, such as renewable and nuclear energy, into the transportation sector’s energy portfolio could be a revolutionary step toward environmental sustainability. Renewable and nuclear energy sources are well recognized for their CO2-emission-free capabilities [15,48]. Clean energy development can be a gateway to achieving environmental, social, and economic prosperity [19]. Nonetheless, integrating renewable and nuclear energy into the transport sector’s energy mix can provide a feasible approach to reducing transport-related emissions [20,26,27]. These practices align with the stakeholder theory, which emphasizes safeguarding economic, social, and environmental sustainability.

2.2. Transportation and Environmental Sustainability

Over the last three decades, transportation has been a leading sector contributing to environmental pollution, and several initiatives have been taken to mitigate these emissions [49]. The transportation sector accounts for nearly 26.5% of greenhouse gas emissions [50]. From Sweden, Larsson, Kamb [51] found that continuous international travel significantly increases CO2 emissions. In G7 countries, Jahanger, Ozturk [46] analyzed the dataset from 1994 to 2020 using MMQR and concluded that air transportation significantly increases CO2 emissions. They added that green innovation can mitigate the negative impact of air transportation on environmental sustainability. In the context of Pakistan, Danish, Baloch [52] utilized the vector error correction model (VECM) and the autoregressive distributed lag (ARDL) from 1990 to 2015 to conclude that transport energy consumption is responsible for environmental deterioration. Using Wavelet quantile regression from 1990 to 2020, Malik, Rehman [28] found that transportation infrastructure, financial development, urbanization, and economic growth exacerbate environmental pollution in Pakistan. Parallel to that, [53] employed NARDL from 19,971 to 2021 and found transportation infrastructure responsible for increasing environmental contamination. Gyamfi, Bekun [54] found that air transport reduces environmental quality; however, rail transport had a favorable impact. Similarly, Rosqvist and Hiselius [55] claimed that passenger transport is a primary source of CO2 emissions. Utilizing data from 2010 to 2019 in the 30 provinces of China, Jing, Liu [56] studied the link between public transportation and environmental contamination. They concluded that public transportation has a favorable impact on environmental sustainability by reducing CO2 emissions. Furthermore, from OECD countries, Churchill, Inekwe [57] claimed that transportation infrastructure substantially increases environmental risk. In the context of 3 Asian countries, Qian [45] investigated the linkage between transportation infrastructure, urbanization, industrialization, and environmental contamination from 1995 to 2020. The results of MG, AMG, and CCEMG estimation techniques found a positive link between urbanization, industrialization, transportation infrastructure, and environmental contamination. The above literature comprehensively establishes the relationship between the transportation sector and environmental sustainability. However, the majority of the existing literature used a single indicator of the transportation sector to examine environmental impact. Nonetheless, we add to the existing literature by developing a more comprehensive transportation index that combines air and land transportation. Motivated by the above, we have proposed the following hypothesis:
H1. 
Transportation significantly hampers environmental sustainability by increasing CO2 emissions.

2.3. Renewable Energy as a Moderator

In the recent literature, renewable energy has been neglected as a significant factor influencing the transportation and environmental sustainability nexus. Numerous earlier studies have recommended introducing renewable energy into the transportation sector to mitigate its environmental impact [20]. One of the pioneer studies examined the challenges linked with the 100% induction of renewable energy in the transportation sector [24]. They concluded that a 100% transition to renewable energy in the transportation sector is achievable. However, it is subject to several obstacles, including limited material resources, infrastructure constraints, technological barriers, resource availability, and economic and policy challenges. However, Ibrahim, Ajide [58] found a direct link between renewable energy and CO2 emissions, confirming that renewable energy can substantially reduce CO2 emissions. Similarly, Lee, Zhang [59] found that renewable energy development in 30 provinces of China substantially mitigates environmental risks. Dai, Alvarado [23] investigated the impact of transportation infrastructure, renewable energy, and economic growth on CO2 emissions from the transportation sector. They found a positive link between economic growth, transportation, and CO2 emissions, while renewable energy helps curb CO2 emissions. They further recommended increasing the share of renewable energy in the transportation sector to reduce transport-based CO2 emissions. Naseem, Kashif [31] employed NARDL from 1990 to 2018 and found that green energy and financial innovation mitigate CO2 emissions, while economic growth substantially increases CO2 emissions.
Furthermore, Rehman, Islam [60] and Alnour, Awan [17] argued that green transportation, investment in transportation infrastructure, and renewable energy are instrumental for lowering CO2 emissions. Similarly, Malik, Rehman [28] found that CO2 emissions substantially increase in Pakistan due to financial development, urbanization, and transportation infrastructure, while renewable energy is negatively linked with CO2 emissions. In the European transportation sector context, Kwilinski, Lyulyov [61] found a favorable impact of environmental technologies and renewable energy on ecological sustainability. They categorically suggested promoting technological innovation and renewable energy consumption to develop cleaner transportation strategies. Jahanger, Ozturk [46] argued that pro-environmental interventions, such as environmental taxes and green innovation, can substantially reduce the adverse environmental impacts of air transportation. Nonetheless, the majority of the standing literature demonstrates a direct link between renewable energy, transportation, and environmental sustainability. More explicitly, the literature heightened the need to incorporate renewable energy into the transportation energy mix for a low-carbon future. However, none of the studies examined the moderating effect of renewable energy on the transportation-environmental sustainability nexus. Drawing on the above discussion to address this gap, we have proposed the following hypothesis:
H2. 
Renewable energy can mitigate the adverse effects of transportation on environmental sustainability.

2.4. Nuclear Energy, Transportation, and Environmental Sustainability

A growing body of academic literature has examined the environmental impacts of transportation and nuclear energy. For instance, Ali, Jiang [62] studied the environmental outcomes of air transportation, nuclear energy, economic complexity, and industrial improvement using a Chinese dataset from 1983 to 2016. The main findings linked air transportation and economic complexity to environmental contamination, while nuclear energy and industrial development mitigate it. Similarly, Hassan, Khan [63] found that technological innovation and nuclear energy mitigate environmental contamination, while public service transportation exerts an adverse effect. Several studies also investigated nuclear energy’s direct impact on the transportation sector and environmental sustainability. Utilizing quantile-on-quantile regression from 1990 to 2019, Pan, Adebayo [64] found twofold environmental outcomes of nuclear energy consumption. Their empirical findings found that nuclear energy consumption improves environmental sustainability in the USA, Germany, Canada, Sweden, Ukraine, South Korea, Russia, and France. In Spain and China, environmental sustainability has significantly deteriorated due to nuclear energy use. However, Karakosta, Pappas [18] showed that nuclear and renewable energy are instrumental for promoting economic growth without contaminating the environment. Similarly, Addo, Kabo-bah [65] and Habib, Ali [66] claimed the favorable linkage between nuclear energy consumption and environmental outcomes.
Moreover, earlier evidence from Hori [67] heightened the significance of integrating nuclear energy into the transport sector to lower CO2 emissions. Similarly, Forsberg [26] argued that introducing nuclear energy in the transportation sector could be a viable solution for controlling transport-based CO2 emissions. Jimenez and Flores [68] highlighted the economic, health, and environmental benefits of nuclear energy-based zero-emission transport vehicles. From the maritime transport Wang, Zhang [27] found nuclear energy to be a crucial factor in lowering environmental risk in the Arctic region; however, it is attributed to governance and safety challenges. Furthermore, Michaelides and Michaelides [25] illustrated nuclear energy as a feasible solution for substituting fossil fuel-based energy. The above discussion sheds light on the direct relationship between nuclear energy, transportation, and environmental sustainability. This discussion also shows that incorporating nuclear energy into the transportation sector’s energy portfolio can help reduce transport-related environmental crises. Despite this, none of the prior studies examined the moderating role of nuclear energy in the transportation-environmental sustainability nexus. Therefore, we have formulated the following hypothesis to address that literature gap.
H3. 
Nuclear energy can mitigate the adverse effects of transportation on environmental sustainability.

3. Materials and Methods

3.1. Data

This research investigates the moderating role of renewable and nuclear energy in the relationship between transportation and environmental sustainability. The study dataset contains the top 27 polluting countries from 1995 to 2022. The countries’ selection criteria and time span are based on the data availability, especially concerning nuclear energy in the top 27 polluting countries. This dataset also ensures the reliability and consistency of the outcomes. Table 1 lists the selected countries. The study’s dependent variable is environmental sustainability, and its independent variable is transportation. The moderating variables include renewable and nuclear energy. Furthermore, the study incorporated dynamic macroeconomic variables, such as gross domestic product (GDP), inflation, and trade openness, to estimate the true relationship among the variables. Table 2 presents detailed definitions, operational codes, measurements, and data sources of the variables. For empirical estimation, we have utilized Stata 17 software. The study employed the mean-filling method to supplement any missing values before regression analysis and to ensure homogeneity; all variables were expressed in logarithmic form [69,70].

3.2. Econometric Model

Following the studies of Jahanger, Ozturk [46], following equations have been employed for empirical estimation.
Equation (1): Empirical estimation equation
E N S U S i , t = f   T I N D E X , R E D , N E D , G D P , I N F L , T O  
ENSUS, TINDEX, RED, NED, GDP, INFL, and TO represent environmental sustainability, renewable energy development, nuclear energy development, gross domestic product, inflation, and trade openness, respectively.
Equation (2): The Direct effect model is utilized to examine the direct impact of the transportation index on environmental sustainability.
E N S U S i , t = ω 0 + ω 1 T I N D E X i , t + ω 2 G D P i , t + ω 3 I N F L i , t + ω 4 T O i , t + ε i , t    
Equation (3): The combined-effect model is used to examine the combined impact of transportation and the development of renewable and nuclear energy.
E N S U S i , t = ω 0 + ω 1 T I N D E X i , t + ω 2 R E D i , t + ω 3 N E D i , t + ω 4 G D P i , t + ω 5 I N F L i , t + ω 6 T O i , t + ε i , t  
Equation (4): The Moderation effect model is utilized to investigate the moderating role of renewable and nuclear energy development in the relationship between transportation and environmental sustainability.
E N S U S i , t = ω 0 + ω 1 T I N D E X i , t + ω 2 R E D i , t + ω 3 N E D i , t + ω 4 T I N D E X R E D i , t + ω 5 T I N D E X N E D i , t + ω 6 G D P i , t + ω 7 I N F L i , t + ω 8 T O i , t + ε i , t
Here, “i” suggests cross-sections, while “t” means the time. The expression “ ε i , t ” characterizes the error term.

3.3. Empirical Strategy

This section outlines the econometric approach, comprising descriptive data, correlation analysis, pre-estimation, regression analysis, and robustness testing. Figure 1 offers a detailed illustration of the econometric strategy.

3.4. Cross-Sectional Dependence (CSD)

In panel studies, evaluating cross-sectional dependency is the first requisite step. Recently, economies have relied on one another due to economic integration and globalization, which predominantly accounts for cross-sectional dependence [76,77]. Additionally, social, environmental, and economic variables contribute to cross-sectional dependence between nations [78]. The projected outcomes without the CSD test are often skewed and questionable. Therefore, this study used the tests of Pesaran [79,80] to examine the CSD.
Equation (5), the CSD equation, is used to examine the cross-sectional dependence among the variables in the data series.
C S D = 2 T N N 1   i = 1 N 1   k = i + 1 N   β ^ i k   ~   N 0 ,   1 i ,   k    

3.5. Slope Homogeneity Test

The current investigation applied the Pesaran and Yamagata [81] test to handle the possible heterogeneity of slope variables produced from regression estimates across cross-sectional units owing to their differing social and economic particulars. This test generates “Delta and Adjusted Delta” estimates to test homogeneity under the null hypothesis. For that reason, this research applied the following equations:
Equations (6) and (7): The following equations, representing “Delta and Adjusted Delta,” have been used to determine slope homogeneity among the data series.
~ H P Y = N 1 2   2 K 1 2   1 N S ~ k
~ A S H = N 1 2 2 k T k 1 T + 1 1 2   1 N S ~ k

3.6. Panel Unit Root Test

To evaluate the unit root among the dataset, the current study prioritized the second-generation cross-sectional Im, Pesaran, and Shin unit root test (CIPS), originated by Pesaran [82], over conventional unit root tests. Because conventional unit root tests rely on the model’s assumed cross-sectional independence, they may yield biased results. Nonetheless, to yield reliable estimates, we have used the CIPS and CADF tests via the following equation.
Equation (8): CIPS equation
V i , t = ω i + ω i X i , t 1 + ω i V t 1 + I = 0 P ω i I V ¯ t 1 + I = o P ω i I V t 1        
Here, V ¯ t 1 validate cross-sectional averages. The CADF test also uses the CIPS equation to test for a unit root.
Equation (9): CADF equation
C I P S = 1 N   i = 1 N C A D F i        

3.7. Panel Cointegration Test

This study preferred second-generation panel cointegration tests, as they yield more reliable and efficient estimates than standard first-generation tests. We utilized the Westerlund [83] test, which is often considered more reliable than Pedroni [84] and Kao [85]. The Westerlund test yields more accurate results when accounting for slope homogeneity and cross-sectional dependence. Additionally, this test can accommodate various cross-sectional patterns and periods. Moreover, we have employed Westerlund and Edgerton [86] with a bootstrap to provide additional evidence of cointegration among the panel variables.
Equation (10): Westerlund (2007) [83] test is employed to analyze the long-run relationship between the dependent and the explanatory variables of the data series.
X i ,   t = ω i δ i + β i X i , t 1 θ i Y i , t 1 + j = 1 q β i , j X i , t j + j = 0 q φ i , j Y i , t j + ε i , t        

3.8. Estimation Technique MMQR

The prevalence of heterogeneity in panel research is persistent, making it vital to address. Since panel research is often subject to this heterogeneity, it raises doubts about the predicted results, whether they are based on actual connections or exaggerated by it. Nevertheless, most standard panel estimation techniques cannot cope with this heterogeneity, stressing the need for a more specialized approach. Therefore, this study adopted a quantile-based estimation approach, which is better suited to handling this heterogeneity [87]. Quantile-based approaches create quantile links to address heterogeneity in panel data. Although these methods are based on Ordinary Least Squares (OLS) principles, establishing a relationship with quantiles yields more reliable results. In addition, the quantile-based methods are capable of guarding against outliers. In contrast to standard average-based estimation approaches, quantile-based estimation methods provide more comprehensive findings by creating quantile links [88].
This study employed the most advanced “Method of Moments Quantile Regression” (MMQR), which is additionally capable of addressing fixed effects strikes on the outcomes [89]. For this study, the MMQR estimation approach is most suitable for the following reasons. First, it can address the distributional and heterogeneous changes in environmental sustainability and other factors across the top 27 polluting countries. Second, MMQR provides robust, reliable, and efficient estimates in nonlinear models.
Equation (11): The subsequent equation demonstrates the location-scale variant of conditional quantiles.
E N S U S i t   τ X i t = ω i t + ω 1 T I N D E X + ω 2 G D P i , t + ω 3 I N F L i , t + ω 4 T O i , t + ε i , t      
where the τ t h quantile function condition is signified by E N S U S i t   τ X i t , X i t demonstrations of the explanatory regressors as defined in Equation (2).
Equation (12): This equation presents scale and location functions as follows:
Q y E N S U S i t τ X i t = i + θ i q τ + X   i t β + Z i t y q τ                                        
Here, the scalar parameter showing the quantile fixed-effect is denoted by i + θ i q τ , the Z i   =   Z l ( X ) shows the k-vector of known differentiable components of X with I elements. Compared to least square fixed-effects, the explanatory variables in this method do not signify intercept shifts. These are time-explanatory variables whose heterogeneous effects are permitted to vary across the quantiles of the conditional distribution of the dependent variable.
Equation (13): The following equation presents the conditional distribution of quantiles.
m i n q i     × t     ρ τ ( A i t δ i + Z i t γ q        
Here, ρ τ A = τ 1 A I A 0 + T A I A > 0 shows the check function.

3.9. Robustness Check

By following Jahanger, Ozturk [46] we have employed Driscoll and Kraay’s standard error (DKse) estimation technique for the robustness analysis. Hoechle [90] states that the DKse can establish heteroskedasticity and autocorrelation consistency and manage common and temporal cross-sectional dependency. Additionally, outcomes are derived using models with fixed effects that account for continuous changes across countries to reduce the impact of heterogeneity bias [90,91].

4. Results and Discussion

4.1. Results

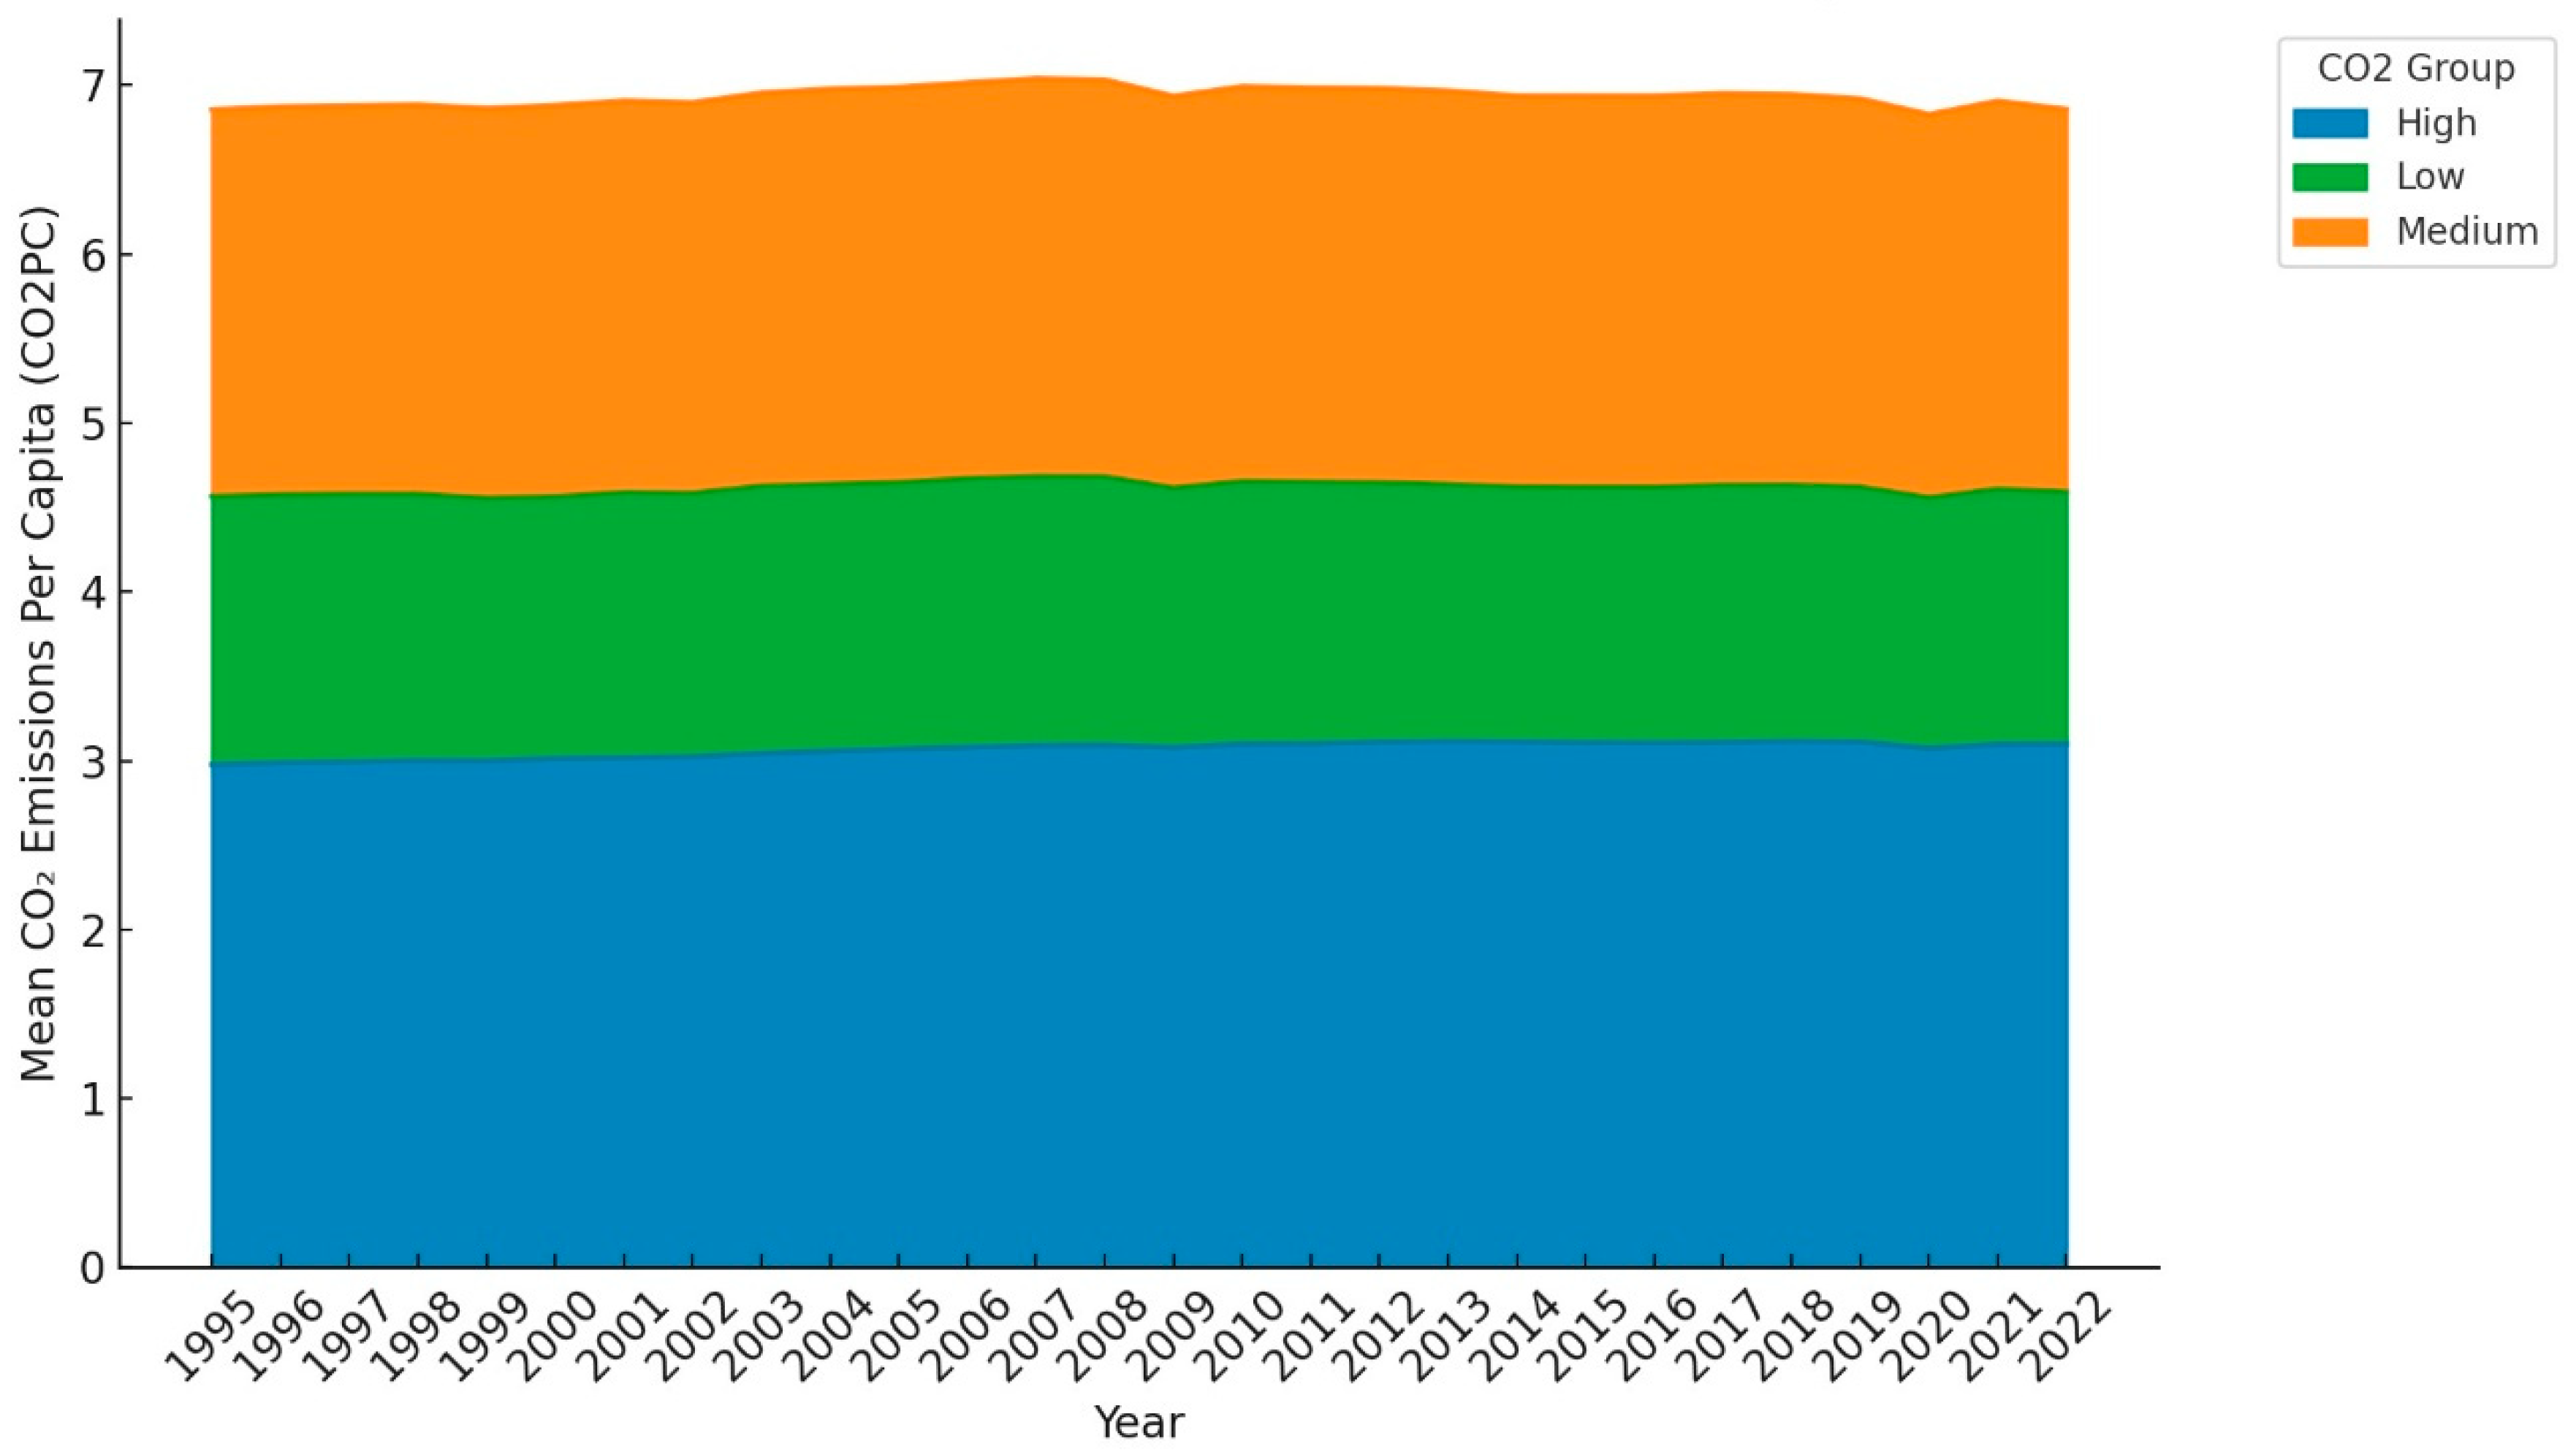
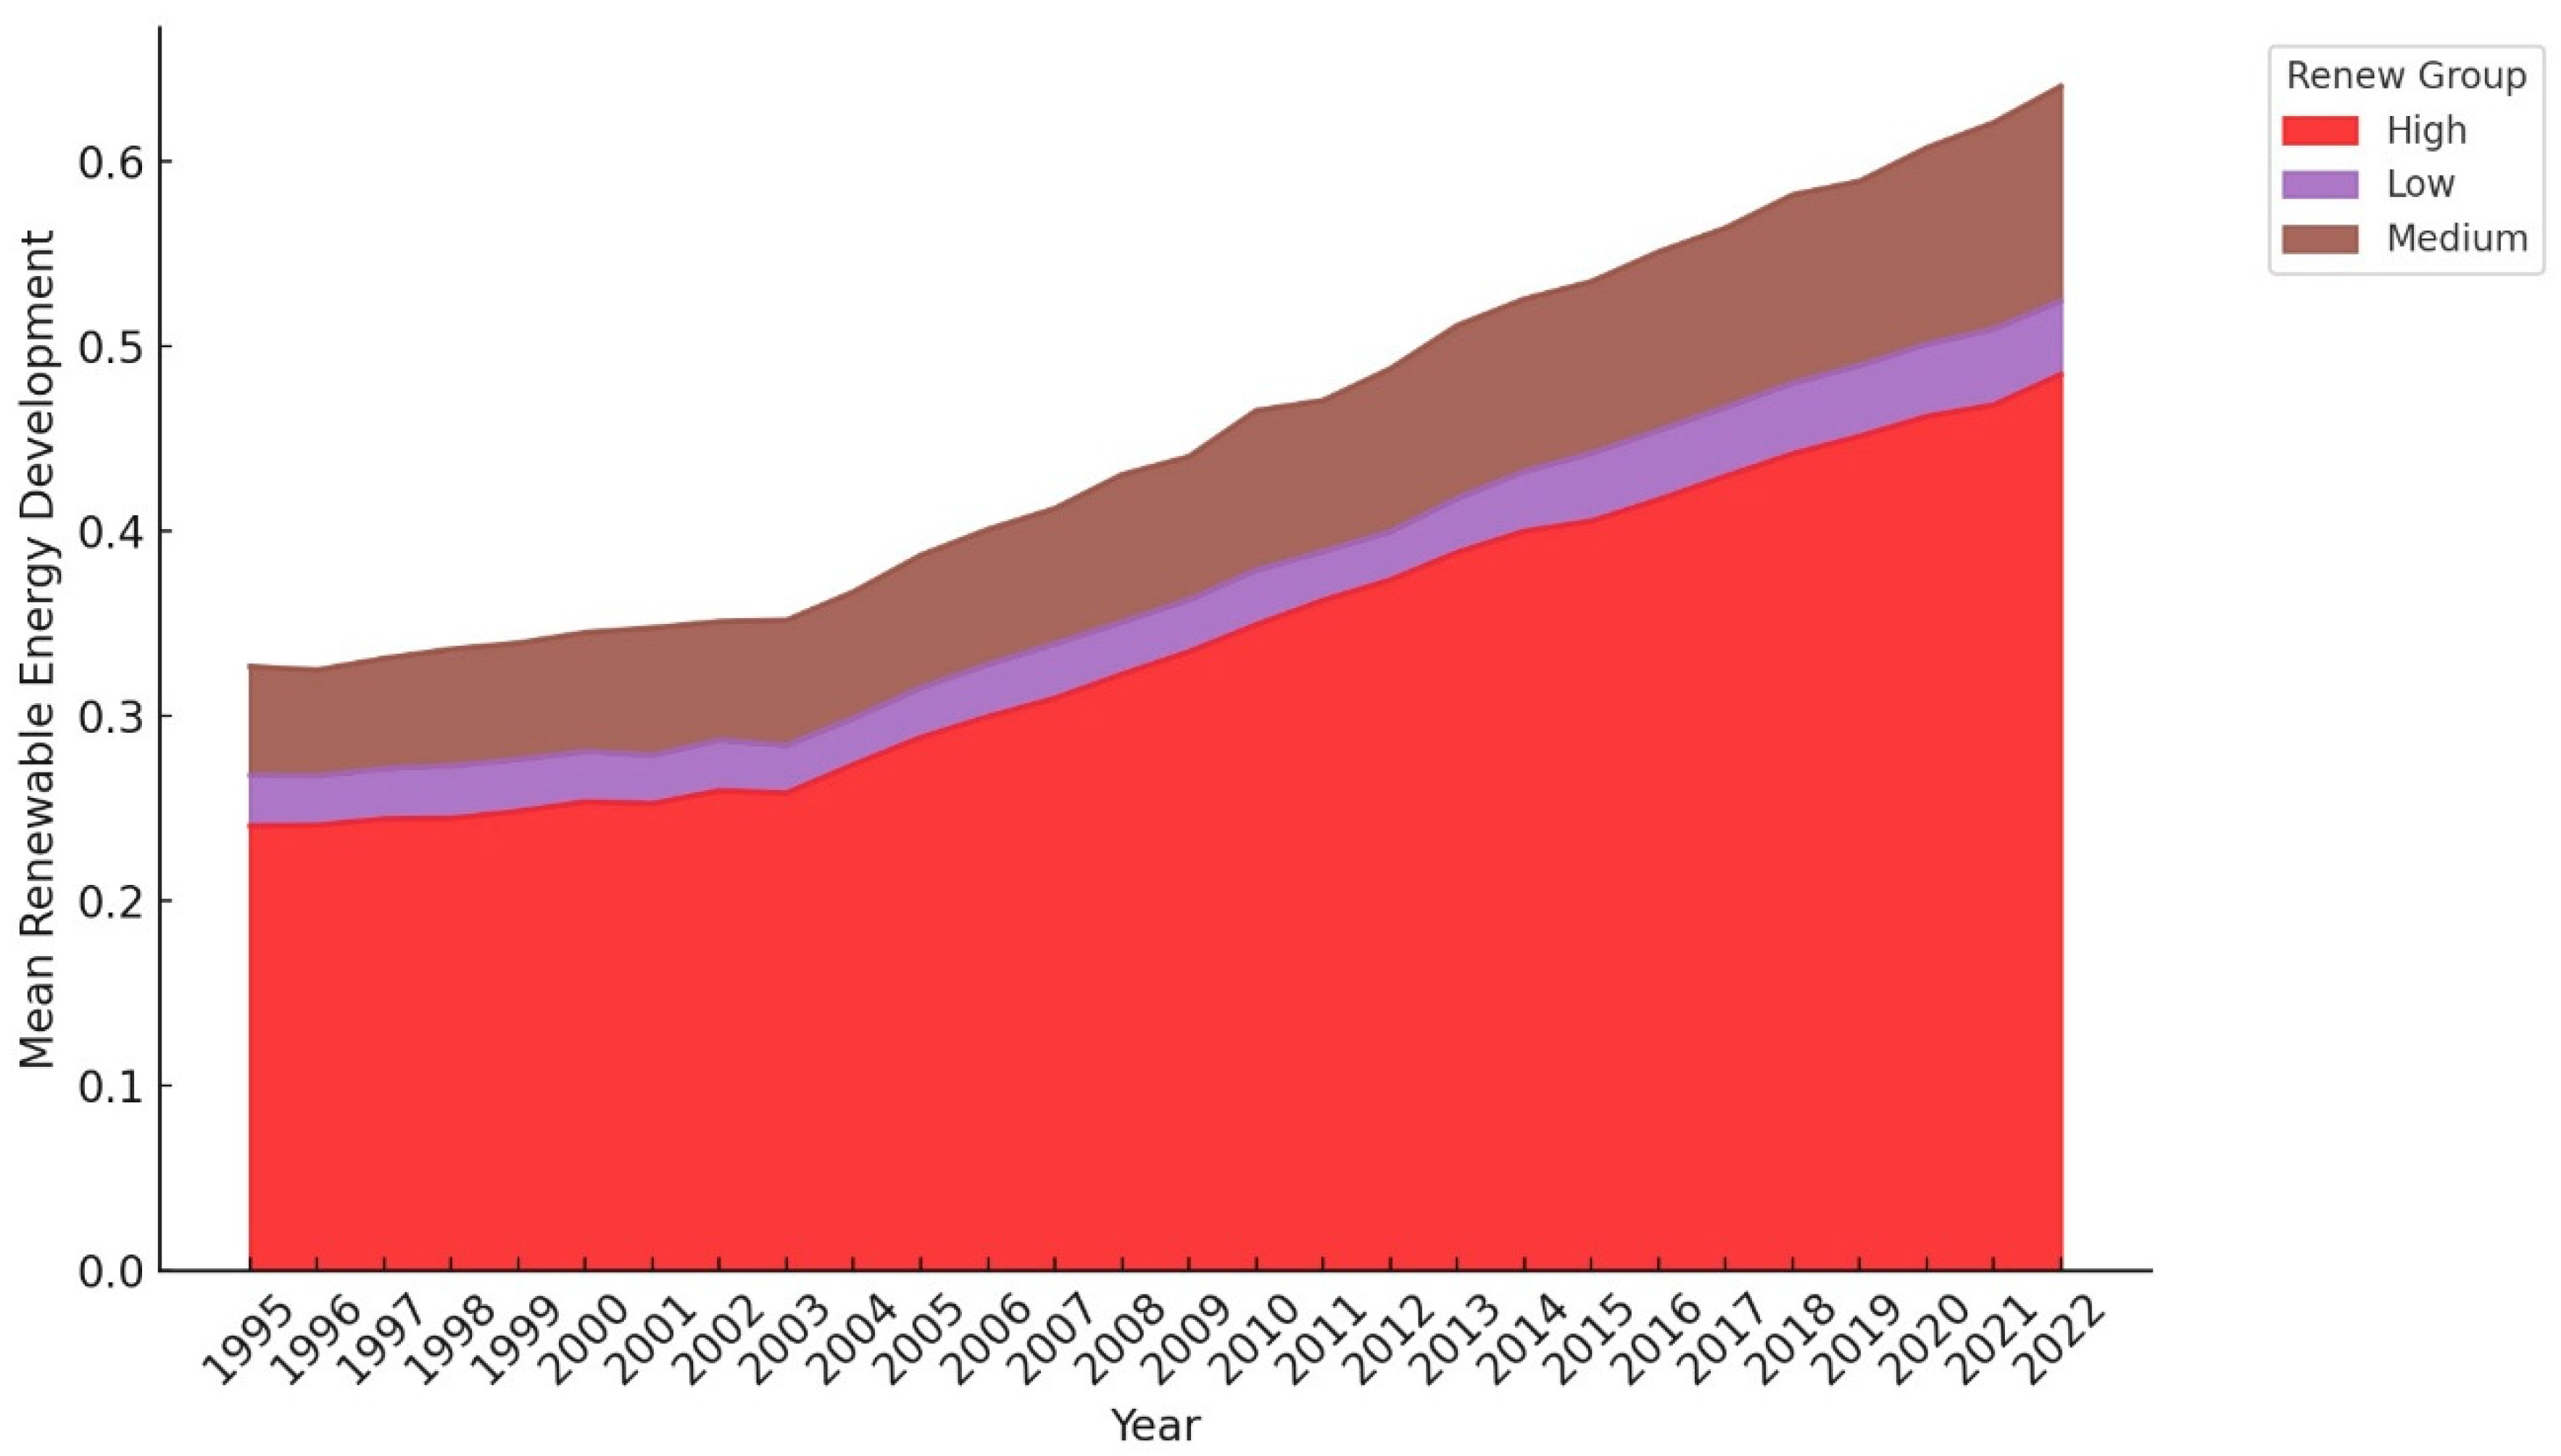
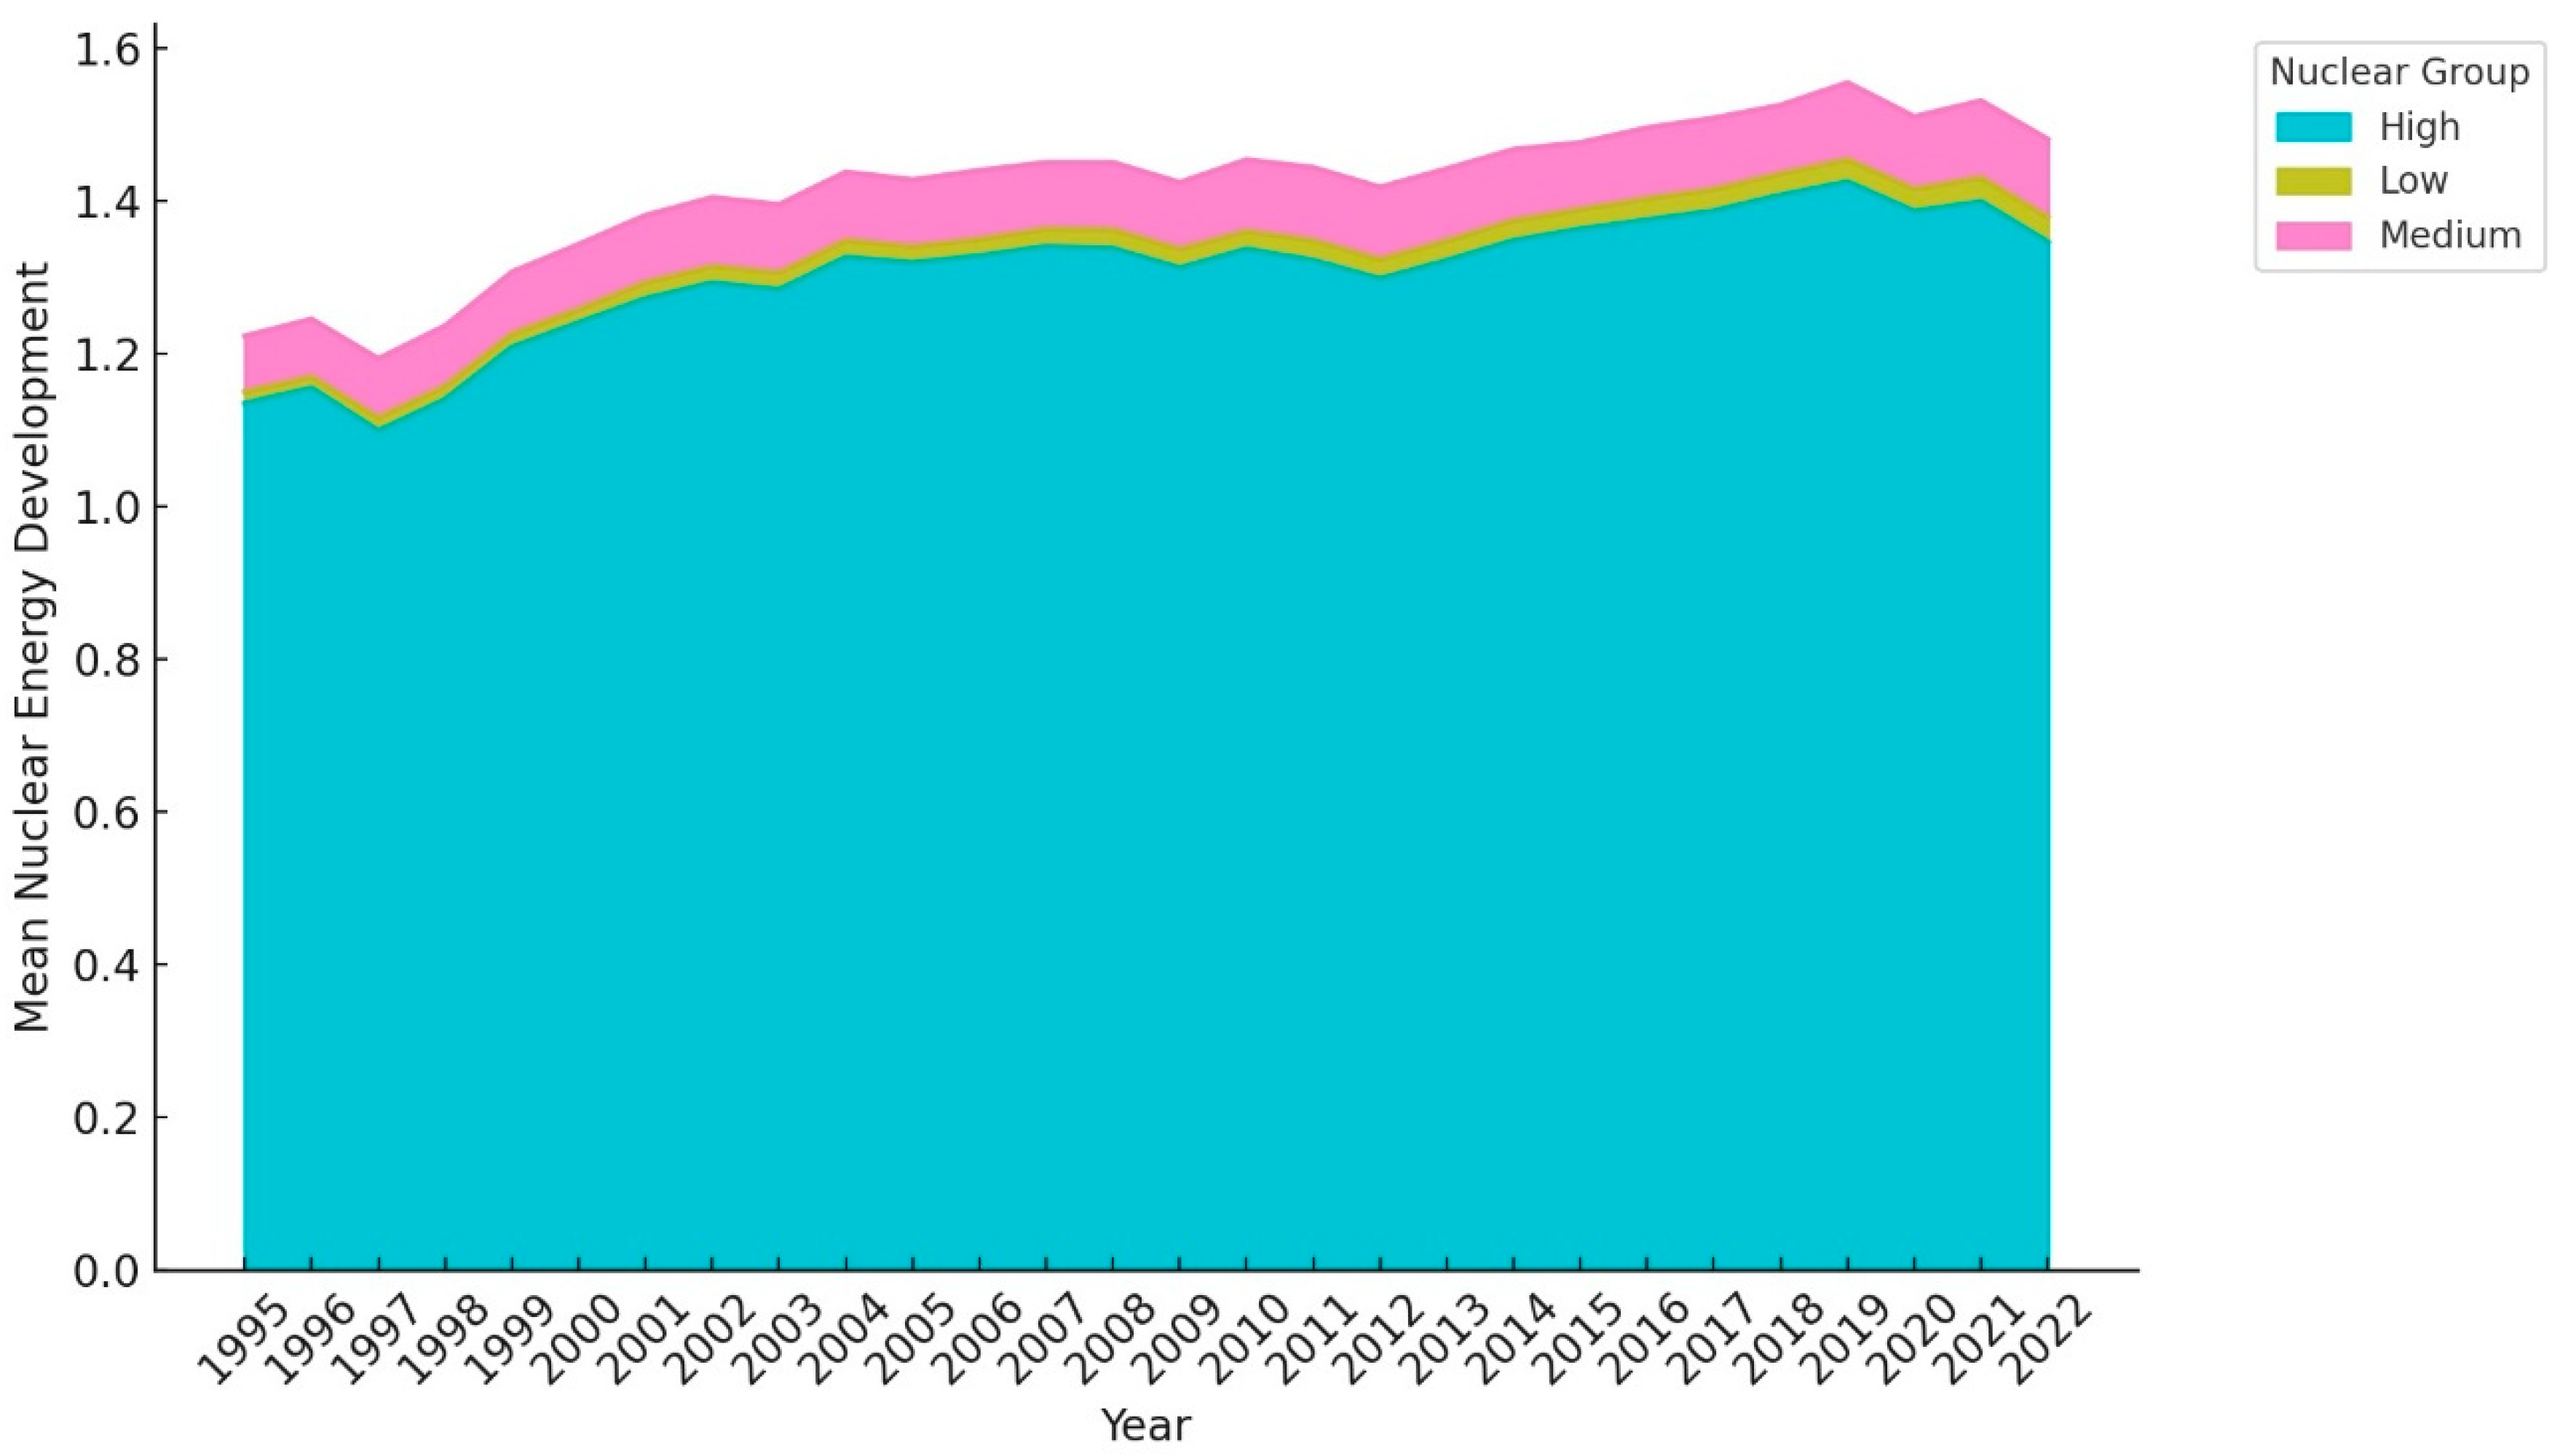
The analysis begins with descriptive statistics and the Jarque–Bera (JB) test in Table 3. The descriptive statistics include mean, maximum, minimum, and standard deviation. The mean value of environmental sustainability (CO2 emissions) is 2.300, followed by maximum, minimum and standard deviation of 4.101, 0.414, and 0.729. The transportation index’s mean, maximum, minimum and standard deviation are −4.43 × 10⁻⁹, 2.151. −2.366 and 1.000, respectively. Renewable energy development shows mean, maximum, minimum, and standard deviation of 0.140, 1.044, 0, and 1.189, respectively. The maximum and minimum values of nuclear energy development are 0.927 and −3.622, respectively, while the mean and standard deviation are −1.028 and 0.701. The mean, maximum, minimum and standard deviation of GDP are 11.588, 13.415, 9.167, and 0.769, respectively. The mean, maximum, minimum, and standard deviation of inflation are 0.877, 2.962, 0, and 0.311, respectively. Trade openness presents 1.846, 0.230, 1.296, and 2.309 as the mean, standard deviation, minimum, and maximum values, respectively. Table 3 presents JB statistics, making it legitimate to employ MMQR as a benchmark regression. Nonetheless, JB stats suggest rejecting the null hypothesis and confirm that the dataset follows a non-normal distribution. Figure 2, Figure 3 and Figure 4 present grouped mean plots showing the current status, trends, patterns, and relationships among the variables over the study period for environmental sustainability (Figure 2) and for renewable and nuclear energy development (Figure 3 and Figure 4), respectively. After that, we performed a correlation analysis. The stated outcomes in Table 4 indicate that there is no perfect correlation among the variables, allowing us to proceed with further analysis.
Table 4 also reports the VIF estimates, which indicate the potential multicollinearity among the variables. The transportation index shows the highest VIF score at 3.90, followed by GDP at 3.76, nuclear energy development at 2.90, renewable energy development at 2.67, trade openness at 1.70, and inflation at 1.56. Nonetheless, the mean VIF score of 2.68 is well below 10, indicating no multicollinearity in the dataset. The outcomes of the Pesaran and Friedman tests in Table 5 confirm that all the variables are cross-sectionally dependent. Table 5 also presents the values of Delta and Adjusted Delta of the slope homogeneity test. The reported outcomes indicated that the slope was homogeneous across all variables at the 1% significance level.
The outcomes of CIPS and CADF unit root tests are presented in Table 6. The CIPS estimates indicate that environmental sustainability and trade openness are stationary at the first difference, whereas all the other variables are stationary at the level. Secondly, the CADF results conclude that GDP and inflation are stationary at the level, while all the other variables are stationary at the first difference. These outcomes provide substantial evidence for the absence of a unit root across the entire dataset. Table 6 further demonstrates the long-run relationship between environmental sustainability and all the explanatory variables. Nonetheless, the outcomes of Westerlund (2007) [83] and Westerlund & Edgerton (2008) [86] tests provide substantial evidence of long-term cointegration among the concerned variables. The outcomes of all pre-estimation tests support the use of MMQR for the benchmark regression analysis.
Table 7 presents the benchmark regression results for all three models. Model 1 (direct effect model) examines the influence of transportation index (air and land) on environmental sustainability (CO2 emissions). The MMQR findings show a positive relationship between transportation and CO2 emissions across the 10th to 90th quantiles at the 1% significance level. The outcomes categorically show that with every 1% increase in transportation activities, CO2 emissions will increase by 0.410%, 0.400%, 0.392%, 0.386%, 0.381%, 0.376%, 0.396%, 0.362%, and 0.355% across the 10th to 90th quantiles, respectively. These findings depict the unfavorable impact of transportation activities on environmental sustainability in the top 27 polluting countries. Furthermore, across the 10th to 90th quantiles, the control variables GDP and inflation show positive coefficients, suggesting a positive relationship with CO2 emissions at the 1% significance level. The control variable trade openness shows a negative relationship with CO2 emissions across the 10th to 90th quantiles, indicating a favorable impact on environmental sustainability at a 1% statistical significance level.
Model 2 (the combined effect model) examines the influence of the transportation index, renewable energy, and nuclear energy development on environmental sustainability (CO2 emissions) in the top 27 polluting countries. The MMQR findings found an unfavorable influence of transportation on environmental sustainability. Across the 10th to 90th quantiles, for every 1% increase in transportation activities, CO2 emissions increase by 0.473%, 0.453%, 0.440%, 0.432%, 0.423%, 0.416%, 0.404%, 0.392%, and 0.375%, respectively. The empirical evidence revealed a negative influence of renewable energy development on the CO2 emissions, suggesting a favorable impact on environmental sustainability. At a 1% significance level, the coefficient values across the 10th to 60th quantiles are −0.286%, −0.246%, −0.220%, −0.203%, −0.186%, and −0.171%, respectively. The coefficient for the 70th quantile is −0.147 at the 5% significance level, while the coefficient for the 80th quantile is −0.123 at the 10% significance level. Nonetheless, the coefficient value at the 90th quantile is −0.089, which is statistically insignificant. Furthermore, the outcomes revealed a negative influence of nuclear energy development on CO2 emissions in the top 27 polluting countries across the 10th to 90th quantiles at the 1% significance level. This outcome found that nuclear energy development is a crucial driver of environmental sustainability. More precisely, with every 1% increase in nuclear energy, CO2 emissions would be reduced by 0.104%, 0.096%, 0.091%, 0.087%, 0.084%, 0.081%, 0.076%, 0.072%, and 0.065%, respectively. Moreover, the control variables, GDP and Inflation, negatively influence environmental sustainability, as they are positively associated with CO2 emissions across the 10th to 90th quantiles. The control variable trade openness was found to be favorable for environmental sustainability, owing to its negative linkage with CO2 emissions across the 10th to 90th quantiles.
Model 3 (moderation effect model) investigates the moderating role of renewable and nuclear energy development in the relationship between the transportation index and environmental sustainability (CO2 emissions). The empirical results confirmed that the development of renewable and nuclear energy significantly and negatively moderates the relationship between the transportation index and CO2 emissions. This outcome implies that the negative influence of transportation on environmental sustainability can be mitigated with the integration of renewable and nuclear energy in the transportation sector. The transportation coefficients are 0.251, 0.259, 0.263, 0.266, 0.270, 0.276, 0.280, 0.284, and 0.289 across the 10th to 90th quantiles, all significant at the 1% level. Renewable energy development substantially reduces CO2 emissions across the 10th to 90th quantiles at the 1% significance level. The outcomes revealed that for every 1% increase in renewable energy use, CO2 emissions would be reduced by 2.226%, 1.997%, 1.958%, 1.768%, 1.645%, 1.469%, 1.347%, 1.232%, and 1.074%, respectively. Moreover, developing nuclear energy could substantially reduce CO2 emissions across the 10th to 80th quantiles at the 1% significance level and at the 5% significance level in the 90th quantile. Precisely, with every 1% increase in nuclear energy, CO2 emissions will be reduced by 1.100%, 0.093%, 0.088%, 0.081%, 0.075%, 0.071%, 0.067%, and 0.062%. The coefficient values for the interaction term (transportation*renewable energy) are 1.249, 1.098, 1.007, 1.947, 0.866, 0.750, 0.670, 0.594, and 0.490, all significant at the 1% level across the 10th to 90th quantiles. The coefficient values for the interaction term (transportation*nuclear energy) are 0.108, 0.094, 0.085, 0.079, 0.071, 0.059, 0.051, 0.044, and 0.034, all significant at the 1% level across the 10th to 90th quantiles. Lastly, the control variables GDP and inflation negatively influence environmental sustainability due to their positive linkage with CO2 emissions across the 10th to 90th quantiles. The control variable trade openness was found to be favorable for environmental sustainability, owing to its negative linkage with CO2 emissions across the 10th to 90th quantiles.

4.2. Robustness Test

This research utilized DKse regression to examine the robustness of the benchmark findings. Table 8 presents the results of all 3 models. In model 1 (direct effect model), the empirical findings indicate an unfavorable impact of transportation on environmental sustainability, owing to its positive association with CO2 emissions in the top 27 polluting countries. The estimates of model 2 (the combined effect model) revealed that transportation significantly increases CO2 emissions, while renewable and nuclear energy mitigate CO2 emissions across 27 polluting countries. Following that model, Model 3 (the moderation effect model) revealed that both renewable and nuclear energy can significantly mitigate the unfavorable impact of transportation on environmental sustainability across 27 polluting countries. Finally, the robustness findings align with MMQR’s benchmark findings. Nonetheless, the magnitude of the coefficients varies substantially.

4.3. Discussion

The foremost objective of the study is to examine the impact of the transportation index on environmental sustainability in the top 27 polluting countries. The main findings linked transportation with environmental deterioration. The transportation sector plays a crucial part in economic growth and development. However, the lack of infrastructure development and the transition to clean energy limit the traditional transportation sector’s reliance on fossil fuels. Nonetheless, fossil fuel sources produce excessive pollution and are considered damaging to environmental sustainability. These findings align with our H1, which states that transportation significantly reduces environmental sustainability. These outcomes are also supported by several past studies [28,52,57]. From an economic standpoint, the outcomes highlight a trade-off between growth and the environment. The transportation sector contributes to economic growth; however, it comes at the cost of the environment.
Secondly, the findings demonstrate that the development of renewable and nuclear energy can substantially reduce CO2 emissions, thereby promoting environmental sustainability. Renewable and nuclear energy are crucial to the clean, low-carbon energy mix. Renewable and nuclear energy can provide a feasible solution to replace conventional fossil fuels with clean, emission-free energy. Our findings align with prior studies. Lee, Zhang [59] concluded that using renewable energy can substantially mitigate environmental pollution. Pan, Adebayo [64] found the favorable outcomes of nuclear energy consumption for environmental sustainability. The justification for these results implies that renewable and nuclear energy can produce pollution-free energy, thereby decoupling energy consumption from ecological degradation. The environmental ramifications of these outcomes are far-reaching: by increasing renewable and nuclear capabilities, countries can decouple economic prosperity from carbon crises and advance sustainable growth paths aligned with SDG 13. The economic benefit of these sustainable energy alternatives is that they drive investment in eco-innovation, green jobs, and energy-efficient technologies that can help transition to a low-carbon economy.
Thirdly, the empirical estimates revealed that the development of renewable and nuclear energy can significantly mitigate the adverse impact of transportation on environmental sustainability. These findings highlight the importance of integrating and replacing fossil fuels with clean energy in transportation. Renewable and nuclear energy sources are environmentally friendly and offer the highest efficiency for carbon-free energy production. Incorporating these into the energy portfolio of the transportation sector can facilitate the sustainable energy transition in the transportation sector. This would have multifield-fold advantages for all the stakeholders. On the one hand, it can fulfil the energy needs of the transportation sector, which is substantially essential for socio-economic development. On the other hand, this strategy would help to reduce ecological stress by reducing CO2 emissions. These findings are consistent with H2 and H3 of the study. Moreover, these outcomes are supported by Naseem, Kashif [31], who noted renewable energy as a crucial factor in reducing CO2 emissions in the transportation sector. Rehman, Islam [60] found that green transportation is vital for reducing environmental contamination. Karakosta, Pappas [18] expressed that renewable energy and nuclear energy development can promote economic growth without contaminating the environment. More precisely, from the transportation sector, Dai, Alvarado [23] stated that renewable energy consumption in the transportation sector could be a crucial gateway to reducing transport-based CO2 emissions. Hori [67] and Wang, Zhang [27] heightened the significance of incorporating nuclear energy in the transportation sector to mitigate environmental contamination risks. These conclusions have environmental implications: integrating renewable and nuclear energy into the transportation sector’s energy mix will drive a clean energy transition, helping mitigate environmental crises. From the economic standpoint, the clean energy transition in the transportation sector will help boost energy resilience and green innovation, thereby facilitating sustainable economic development.

5. Conclusions, Policy Implications, and Limitations

5.1. Conclusions

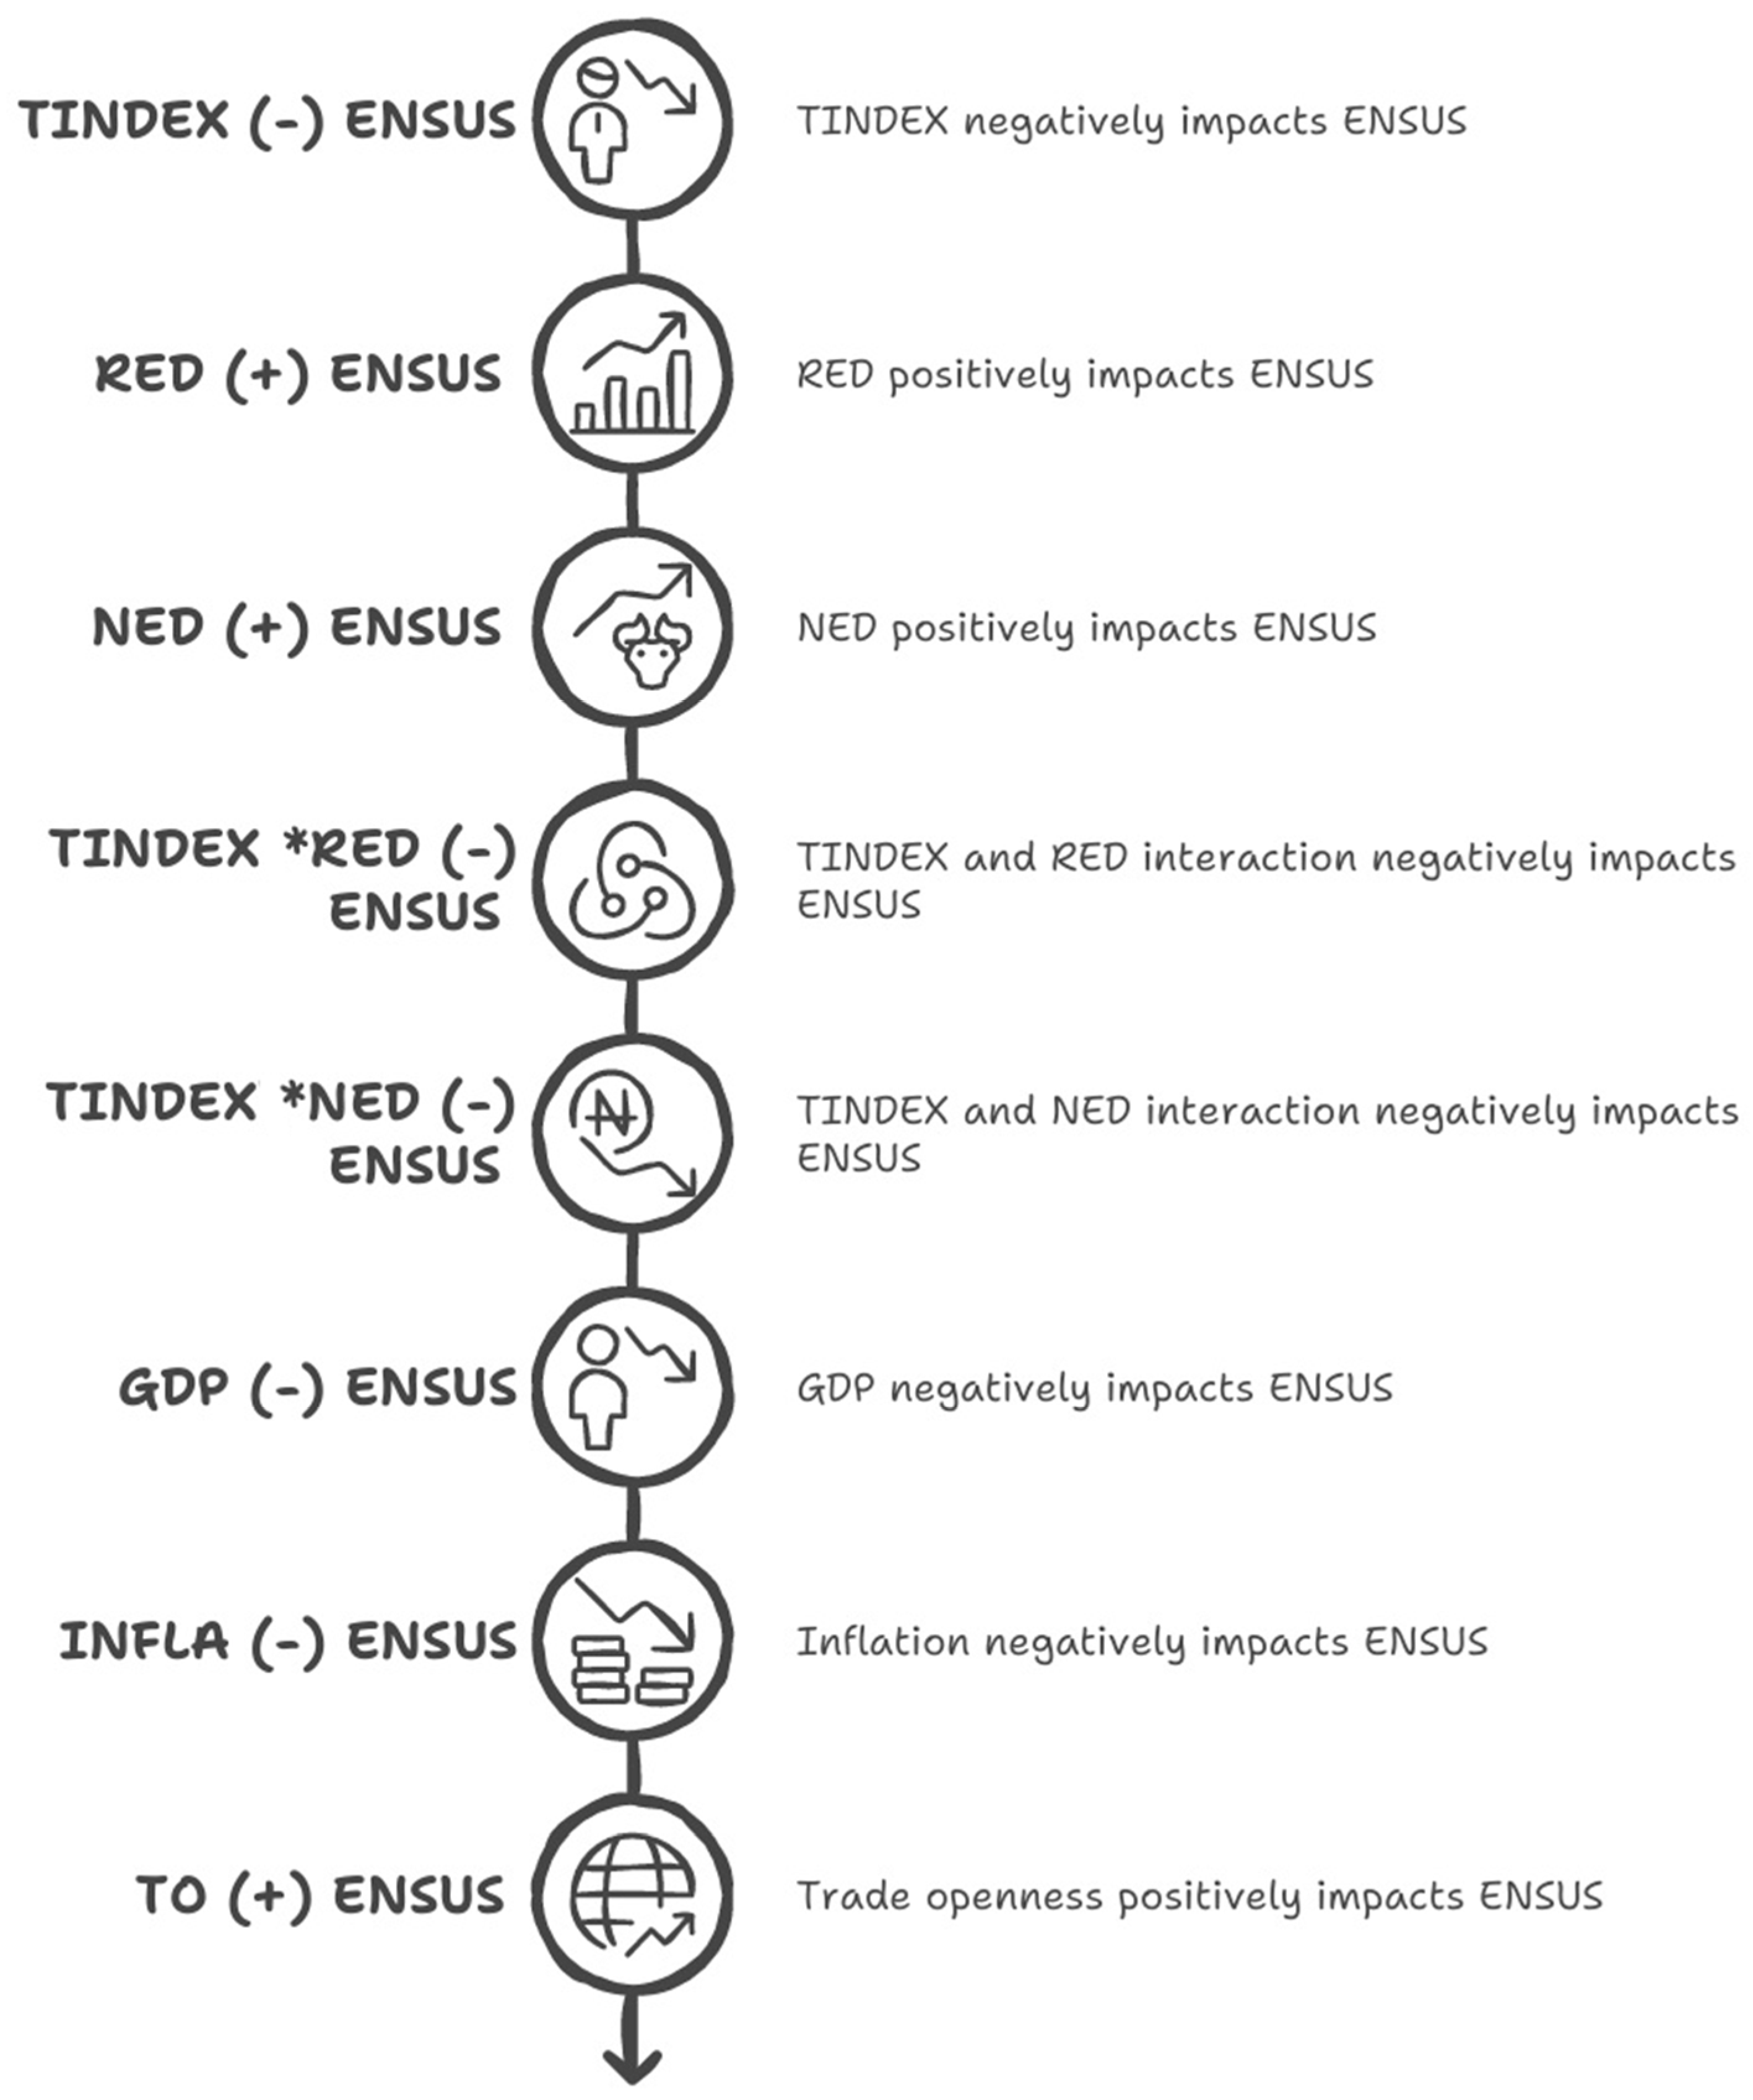
Global warming is a major worldwide problem, with growing environmental dangers placing pressure on individuals, institutions, and think tanks. The excessive production of environmental pollutants from fossil-fuel-dependent transportation sources has underscored the need for environmentally friendly, clean energy solutions, in line with the United Nations’ SDG 7. Renewable and nuclear energy development has attracted considerable attention in the transportation sector due to their ability to produce clean, carbon-free energy. Nonetheless, prior studies have extensively investigated the direct impacts of transportation, renewable, and nuclear energy on environmental sustainability. Despite the growing theoretical importance, prior studies failed to examine how renewable and nuclear energy influence the relationship between transportation and environmental sustainability. As a result, this study bridges the literature gap by investigating the moderating role of renewable and nuclear energy development in the link between transportation and environmental sustainability, focusing on the top 27 polluting countries from 1995 to 2022. The MMQR outcomes are threefold. First, the transportation sector exerts pressure on the environment by significantly increasing atmospheric CO2 concentrations. Second, the development of clean energy sources, such as renewable and nuclear energy, helps lower CO2 emissions and promotes environmental sustainability. Third, renewable and nuclear energy significantly and negatively moderate the relationship, mitigating the negative influence of transportation on environmental sustainability. These outcomes indicate that renewable and nuclear energy are a viable and crucial addition to the transportation sector’s energy mix for the transition towards a sustainable transportation system. Fourth, the control variables—GDP and inflation—are found to be detrimental to environmental sustainability, whereas trade openness enhances it. The robustness findings using DKse yielded complementary results. Nonetheless, the magnitude of the coefficients varies substantially. Figure 5 summarizes the key outcomes.

5.2. Prudential Policy Implications

Based on the above outcomes, this study provides vital policy recommendations to support the transportation sector’s sustainable transition and reduce environmental stress. First, the transportation sector is one of the major polluting sectors worldwide. The government authorities and think tanks should impose penalties and carbon taxes on heavy-polluting vehicles. In parallel, they should provide incentives and subsidies to encourage the adoption of emission-free energy sources, including renewable and nuclear, in the transportation sector. Second, develop national-level strategies to reduce CO2 emissions from the transportation sector. The government and think tanks can set quotas for the use of specific non-fossil fuel energy sources, such as renewable and nuclear, in the transportation sector. The government should also encourage public–private partnerships in the transportation sector to bridge the conventional transportation system with sustainable practices. Third, considering the moderating role of renewable and nuclear energy, the top polluting countries should encourage clean technology transition through joint investments and knowledge sharing. Regarding SDG 13, the top polluting countries can leverage SDG partnerships and COP climate submissions to highlight the commendable role of renewable and nuclear energy in decarbonizing the transportation sector.

5.3. Limitations and Future Research Directions

Despite pragmatic recommendations for promoting environmental sustainability, this study has multiple shortcomings that future empirical research could address. First, it is crucial to note that our findings are based on a sample of 27 countries, which may limit the extent to which the conclusions can be applied to scenarios in other countries. However, by splitting the sample into advanced and developing economies, future empirics might examine established linkages, including regional dynamics. Second, our analysis examined the moderating roles of renewable and nuclear energy in transportation and environmental sustainability, providing valuable insights. However, renewable and nuclear energy differ substantially in terms of cost, safety concerns, and public acceptance. Therefore, we recommend that future research conduct a comparative sustainability analysis of renewable and nuclear energy in the transport sector. Finally, the effect of the COVID-19 pandemic on the advancement of environmental sustainability has been overlooked in this study. This limitation can be considered as a potential avenue for further research.

Author Contributions

Conceptualization, H.M.A. and Y.G.; Methodology, H.M.A., Y.G. and M.G.R.Z.; Writing-original draft preparation, H.M.A., Y.G. and M.G.R.Z.; Writing-review and editing, H.M.A., Y.G. and M.G.R.Z.; Visualization, H.M.A. and Y.G.; Formal Analysis, H.M.A., Y.G. and M.G.R.Z.; Data curation, H.M.A.; Software, H.M.A., and M.G.R.Z. All authors have read and agreed to the published version of the manuscript.

Funding

This research received no external funding.

Institutional Review Board Statement

Not applicable.

Informed Consent Statement

Not applicable.

Data Availability Statement

The study used a publicly available dataset.

Conflicts of Interest

There is no conflict of interest between authors.

References

  1. Adedoyin, F.F.; Bekun, F.V.; Driha, O.M.; Balsalobre-Lorente, D. The effects of air transportation, energy, ICT and FDI on economic growth in the industry 4.0 era: Evidence from the United States. Technol. Forecast. Soc. Change 2020, 160, 120297. [Google Scholar] [CrossRef] [PubMed]
  2. Jiang, T.; Yu, Y.; Jahanger, A.; Balsalobre-Lorente, D. Structural emissions reduction of China’s power and heating industry under the goal of “double carbon”: A perspective from input-output analysis. Sustain. Prod. Consum. 2022, 31, 346–356. [Google Scholar] [CrossRef]
  3. Yang, X.; Li, N.; Mu, H.; Zhang, M.; Pang, J.; Ahmad, M. Study on the long-term and short-term effects of globalization and population aging on ecological footprint in OECD countries. Ecol. Complex. 2021, 47, 100946. [Google Scholar] [CrossRef]
  4. Ritchie, H.; Rosado, P.; Roser, M. Greenhouse Gas Emissions; Our World Data; Global Change Data Lab: Oxford, UK, 2020. [Google Scholar]
  5. Kumar, S.S.; Sasidharan, A.; Bagepally, B.S. Air pollution and cardiovascular disease burden: Changing patterns and implications for public health in India. Heart Lung Circ. 2023, 32, 90–94. [Google Scholar] [CrossRef] [PubMed]
  6. Kaewsaeng-on, R.; Mehmood, S. Quantile modeling for environmental risk: SAARC’s journey with green finance, policies, and regulations. J. Clean. Prod. 2024, 434, 140234. [Google Scholar] [CrossRef]
  7. Van Fan, Y.; Perry, S.; Klemeš, J.J.; Lee, C.T. A review on air emissions assessment: Transportation. J. Clean. Prod. 2018, 194, 673–684. [Google Scholar] [CrossRef]
  8. Gani, A. Fossil fuel energy and environmental performance in an extended STIRPAT model. J. Clean. Prod. 2021, 297, 126526. [Google Scholar] [CrossRef]
  9. Hoffrichter, A.; Miller, A.R.; Hillmansen, S.; Roberts, C. Well-to-wheel analysis for electric, diesel and hydrogen traction for railways. Transp. Res. Part D Transp. Environ. 2012, 17, 28–34. [Google Scholar] [CrossRef]
  10. Aggarwal, P.; Jain, S. Energy demand and CO2 emissions from urban on-road transport in Delhi: Current and future projections under various policy measures. J. Clean. Prod. 2016, 128, 48–61. [Google Scholar] [CrossRef]
  11. Šimenc, M. Overview and comparative analysis of emission calculators for inland shipping. Int. J. Sustain. Transp. 2016, 10, 627–637. [Google Scholar] [CrossRef]
  12. Zhou, W.; Wang, T.; Yu, Y.; Chen, D.; Zhu, B. Scenario analysis of CO2 emissions from China’s civil aviation industry through 2030. Appl. Energy 2016, 175, 100–108. [Google Scholar] [CrossRef]
  13. Kim, N.S.; Van Wee, B. Toward a better methodology for assessing CO2 emissions for intermodal and truck-only freight systems: A European case study. Int. J. Sustain. Transp. 2014, 8, 177–201. [Google Scholar] [CrossRef]
  14. Li, J.; Pan, S.-Y.; Kim, H.; Linn, J.H.; Chiang, P.-C. Building green supply chains in eco-industrial parks towards a green economy: Barriers and strategies. J. Environ. Manag. 2015, 162, 158–170. [Google Scholar] [CrossRef]
  15. Zhang, C.; Zafar, M.G.R.; Gaudreault, F.; Ben-Salha, O.; Alhebri, A. Stringent environmental policies: How they shape the future of nuclear energy generation. Nucl. Eng. Technol. 2025, 57, 103650. [Google Scholar] [CrossRef]
  16. Zheng, S.; Li, J.; Lu, W.; Hafeez, M.; Sohail, M.T.; Akbar, M.W.; Attar, R.W. How does the productivity of renewable energy respond to institutional pressures and higher education? Renew. Energy 2025, 238, 121934. [Google Scholar] [CrossRef]
  17. Alnour, M.; Awan, A.; Hossain, M.E. Towards a green transportation system in Mexico: The role of renewable energy and transport public-private partnership to curb emissions. J. Clean. Prod. 2024, 442, 140984. [Google Scholar] [CrossRef]
  18. Karakosta, C.; Pappas, C.; Marinakis, V.; Psarras, J. Renewable energy and nuclear power towards sustainable development: Characteristics and prospects. Renew. Sustain. Energy Rev. 2013, 22, 187–197. [Google Scholar] [CrossRef]
  19. Jaiswal, K.K.; Chowdhury, C.R.; Yadav, D.; Verma, R.; Dutta, S.; Jaiswal, K.S.; Karuppasamy, K.S.K. Renewable and sustainable clean energy development and impact on social, economic, and environmental health. Energy Nexus 2022, 7, 100118. [Google Scholar] [CrossRef]
  20. Amin, A.; Altinoz, B.; Dogan, E. Analyzing the determinants of carbon emissions from transportation in European countries: The role of renewable energy and urbanization. Clean Technol. Environ. Policy 2020, 22, 1725–1734. [Google Scholar] [CrossRef]
  21. Quirin, M.; Gärtner, S.O.; Pehnt, M.; Reinhardt, G.A. CO2 Mitigation Through Biofuels in the Transport Sector-Status and Perspectives. Main Report; Institute for Energy and Environmental Research: Heidelberg, Germany, 2004. [Google Scholar]
  22. Aßmann, D.; Sieber, N. Transport in developing countries: Renewable energy versus energy reduction? Transp. Rev. 2005, 25, 719–738. [Google Scholar] [CrossRef]
  23. Dai, J.; Alvarado, R.; Ali, S.; Ahmed, Z.; Meo, M.S. Transport infrastructure, economic growth, and transport CO2 emissions nexus: Does green energy consumption in the transport sector matter? Environ. Sci. Pollut. Res. 2023, 30, 40094–40106. [Google Scholar] [CrossRef]
  24. García-Olivares, A.; Solé, J.; Osychenko, O. Transportation in a 100% renewable energy system. Energy Convers. Manag. 2018, 158, 266–285. [Google Scholar] [CrossRef]
  25. Michaelides, E.E.; Michaelides, D.N. Impact of nuclear energy on fossil fuel substitution. Nucl. Eng. Des. 2020, 366, 110742. [Google Scholar] [CrossRef]
  26. Forsberg, C.W. Nuclear energy for a low-carbon-dioxide-emission transportation system with liquid fuels. Nucl. Technol. 2008, 164, 348–367. [Google Scholar] [CrossRef]
  27. Wang, Q.; Zhang, H.; Zhu, P.; Huang, J. Balancing energy security and marine pollution prevention: Legal challenges of utilizing nuclear power for decarbonizing maritime transportation in the Arctic region. Environ. Sci. Pollut. Res. 2024, 31, 40445–40461. [Google Scholar] [CrossRef]
  28. Malik, M.U.; Rehman, Z.U.; Sharif, A.; Anwar, A. Impact of transportation infrastructure and urbanization on environmental pollution: Evidence from novel wavelet quantile correlation approach. Environ. Sci. Pollut. Res. 2024, 31, 3014–3030. [Google Scholar] [CrossRef]
  29. Li, J.; Wang, P.; Ma, S. The impact of different transportation infrastructures on urban carbon emissions: Evidence from China. Energy 2024, 295, 131041. [Google Scholar] [CrossRef]
  30. Petruška, I.; Litavcová, E.; Chovancová, J. Impact of renewable energy sources and nuclear energy on CO2 emissions reductions—The case of the EU countries. Energies 2022, 15, 9563. [Google Scholar] [CrossRef]
  31. Naseem, S.; Kashif, U.; Rasool, Y.; Akhtar, M. The impact of financial innovation, green energy, and economic growth on transport-based CO2 emissions in India: Insights from QARDL approach. Environ. Dev. Sustain. 2024, 26, 28823–28842. [Google Scholar] [CrossRef]
  32. Ali, M.; Samour, A.; Soomro, S.A.; Khalid, W.; Tursoy, T. A step towards a sustainable environment in top-10 nuclear energy consumer countries: The role of financial globalization and nuclear energy. Nucl. Eng. Technol. 2025, 57, 103142. [Google Scholar] [CrossRef]
  33. Teng, W.; Islam, M.M.; Vasa, L.; Abbas, S.; Shahzad, U. Impacts of nuclear energy, greener energy, and economic progress on the load capacity factor: What we learn from the leading nuclear power economies? Geosci. Front. 2024, 15, 101739. [Google Scholar] [CrossRef]
  34. WorldBank. Available online: https://data.worldbank.org/indicator/EN.GHG.CO2.PC.CE.AR5 (accessed on 24 May 2025).
  35. Udeagha, M.C.; Ngepah, N. The drivers of environmental sustainability in BRICS economies: Do green finance and fintech matter? World Dev. Sustain. 2023, 3, 100096. [Google Scholar] [CrossRef]
  36. Clarkson, M.E. A stakeholder framework for analyzing and evaluating corporate social performance. Acad. Manag. Rev. 1995, 20, 92–117. [Google Scholar] [CrossRef]
  37. Qian, S.; Yu, W. Green finance and environmental, social, and governance performance. Int. Rev. Econ. Financ. 2024, 89, 1185–1202. [Google Scholar] [CrossRef]
  38. Pradhan, R.P.; Arvin, M.B.; Nair, M. Urbanization, transportation infrastructure, ICT, and economic growth: A temporal causal analysis. Cities 2021, 115, 103213. [Google Scholar] [CrossRef]
  39. Magazzino, C.; Mele, M. On the relationship between transportation infrastructure and economic development in China. Res. Transp. Econ. 2021, 88, 100947. [Google Scholar] [CrossRef]
  40. Fratila, A.; Gavril, I.A.; Nita, S.C.; Hrebenciuc, A. The importance of maritime transport for economic growth in the european union: A panel data analysis. Sustainability 2021, 13, 7961. [Google Scholar] [CrossRef]
  41. Lukinskiy, V.; Pletneva, N. Impact of solutions for goods transportation on business efficiency and traffic safety. Transp. Res. Procedia 2018, 36, 459–464. [Google Scholar] [CrossRef]
  42. Thakuriah, P.; Metaxatos, P. Effect of residential location and access to transportation on employment opportunities. Transp. Res. Rec. 2000, 1726, 24–32. [Google Scholar] [CrossRef]
  43. Tessier, A.; Clément, M.-A.; Gélinas, I.; Boucher, N.; Croteau, C.; Morin, D.; Turcotte, M.; Archambault, P.S. The impact of transportation on the employment of people with disabilities: A scoping review. Transp. Rev. 2024, 44, 85–111. [Google Scholar] [CrossRef]
  44. Acheampong, A.O.; Dzator, J.; Dzator, M.; Salim, R. Unveiling the effect of transport infrastructure and technological innovation on economic growth, energy consumption and CO2 emissions. Technol. Forecast. Soc. Change 2022, 182, 121843. [Google Scholar] [CrossRef]
  45. Qian, L.H. An empirical study on the relationship between urbanization, transportation infrastructure, industrialization and environmental degradation in China, India and Indonesia. Environ. Dev. Sustain. 2024, 1–27. [Google Scholar] [CrossRef]
  46. Jahanger, A.; Ozturk, I.; Onwe, J.C.; Ogwu, S.O.; Hossain, M.R.; Abdallah, A.A. Do pro-environmental interventions matter in restoring environmental sustainability? Unveiling the role of environmental tax, green innovation and air transport in G-7 nations. Gondwana Res. 2024, 127, 165–181. [Google Scholar] [CrossRef]
  47. Chen, Y.; Zhu, Z. Liability structure and carbon emissions abatement: Evidence from Chinese manufacturing enterprises. Environ. Resour. Econ. 2022, 83, 481–507. [Google Scholar] [CrossRef]
  48. Luan, D.; Yang, F.; Hafeez, M. Natural resources and nuclear energy development: Does political stability matter? Nucl. Eng. Technol. 2025, 57, 103328. [Google Scholar] [CrossRef]
  49. Zhao, C.; Wang, K.; Dong, X.; Dong, K. Is smart transportation associated with reduced carbon emissions? The case of China. Energy Econ. 2022, 105, 105715. [Google Scholar] [CrossRef]
  50. Ağbulut, Ü. Forecasting of transportation-related energy demand and CO2 emissions in Turkey with different machine learning algorithms. Sustain. Prod. Consum. 2022, 29, 141–157. [Google Scholar] [CrossRef]
  51. Larsson, J.; Kamb, A.; Nässén, J.; Åkerman, J. Measuring greenhouse gas emissions from international air travel of a country’s residents methodological development and application for Sweden. Environ. Impact Assess. Rev. 2018, 72, 137–144. [Google Scholar] [CrossRef]
  52. Danish; Baloch, M.A.; Suad, S. Modeling the impact of transport energy consumption on CO2 emission in Pakistan: Evidence from ARDL approach. Environ. Sci. Pollut. Res. 2018, 25, 9461–9473. [Google Scholar] [CrossRef]
  53. Avotra, A.A.R.N.; Nawaz, A. Asymmetric impact of transportation on carbon emissions influencing SDGs of climate change. Chemosphere 2023, 324, 138301. [Google Scholar] [CrossRef]
  54. Gyamfi, B.A.; Bekun, F.V.; Balsalobre-Lorente, D.; Onifade, S.T.; Ampomah, A.B. Beyond the environmental Kuznets curve: Do combined impacts of air transport and rail transport matter for environmental sustainability amidst energy use in E7 economies? Environ. Dev. Sustain. 2022, 24, 11852–11870. [Google Scholar] [CrossRef]
  55. Rosqvist, L.S.; Hiselius, L.W. Online shopping habits and the potential for reductions in carbon dioxide emissions from passenger transport. J. Clean. Prod. 2016, 131, 163–169. [Google Scholar] [CrossRef]
  56. Jing, Q.-L.; Liu, H.-Z.; Yu, W.-Q.; He, X. The impact of public transportation on carbon emissions—From the perspective of energy consumption. Sustainability 2022, 14, 6248. [Google Scholar] [CrossRef]
  57. Churchill, S.A.; Inekwe, J.; Ivanovski, K.; Smyth, R. Transport infrastructure and CO2 emissions in the OECD over the long run. Transp. Res. Part D Transp. Environ. 2021, 95, 102857. [Google Scholar] [CrossRef]
  58. Ibrahim, R.L.; Ajide, K.B.; Usman, M.; Kousar, R. Heterogeneous effects of renewable energy and structural change on environmental pollution in Africa: Do natural resources and environmental technologies reduce pressure on the environment? Renew. Energy 2022, 200, 244–256. [Google Scholar] [CrossRef]
  59. Lee, C.-C.; Zhang, J.; Hou, S. The impact of regional renewable energy development on environmental sustainability in China. Resour. Policy 2023, 80, 103245. [Google Scholar] [CrossRef]
  60. Rehman, F.U.; Islam, M.M.; Miao, Q. Environmental sustainability via green transportation: A case of the top 10 energy transition nations. Transp. Policy 2023, 137, 32–44. [Google Scholar] [CrossRef]
  61. Kwilinski, A.; Lyulyov, O.; Pimonenko, T. Reducing transport sector CO2 emissions patterns: Environmental technologies and renewable energy. J. Open Innov. Technol. Mark. Complex. 2024, 10, 100217. [Google Scholar] [CrossRef]
  62. Ali, S.; Jiang, J.; Hassan, S.T.; Shah, A.A. Revolution of nuclear energy efficiency, economic complexity, air transportation and industrial improvement on environmental footprint cost: A novel dynamic simulation approach. Nucl. Eng. Technol. 2022, 54, 3682–3694. [Google Scholar] [CrossRef]
  63. Hassan, S.T.; Khan, D.; Zhu, B.; Batool, B. Is public service transportation increase environmental contamination in China? The role of nuclear energy consumption and technological change. Energy 2022, 238, 121890. [Google Scholar] [CrossRef]
  64. Pan, B.; Adebayo, T.S.; Ibrahim, R.L.; Al-Faryan, M.A.S. Does nuclear energy consumption mitigate carbon emissions in leading countries by nuclear power consumption? Evidence from quantile causality approach. Energy Environ. 2023, 34, 2521–2543. [Google Scholar] [CrossRef]
  65. Addo, E.K.; Kabo-bah, A.T.; Diawuo, F.A.; Debrah, S.K. The role of nuclear energy in reducing greenhouse gas (GHG) emissions and energy security: A systematic review. Int. J. Energy Res. 2023, 2023, 8823507. [Google Scholar] [CrossRef]
  66. Habib, Y.; Ali, M.; Mehmood, U.; Abd Rahman, N.R. Decarbonizing Japan: The Role of Nuclear Energy and Environmental Taxation in Mitigating CO2 Emissions. Environ. Chall. 2025, 18, 101097. [Google Scholar] [CrossRef]
  67. Hori, M. Nuclear energy for transportation: Paths through electricity, hydrogen and liquid fuels. Prog. Nucl. Energy 2008, 50, 411–416. [Google Scholar] [CrossRef]
  68. Jimenez, G.; Flores, J.M. Reducing the CO2 emissions and the energy dependence of a large city area with zero-emission vehicles and nuclear energy. Prog. Nucl. Energy 2015, 78, 396–403. [Google Scholar] [CrossRef]
  69. Jiang, B. Does fintech promote the sustainable development of renewable energy enterprises? Environ. Sci. Pollut. Res. 2023, 30, 65141–65148. [Google Scholar] [CrossRef]
  70. Raihan, A.; Voumik, L.C.; Ridwan, M.; Ridzuan, A.R.; Jaaffar, A.H.; Yusoff, N.Y.M. From growth to green: Navigating the complexities of economic development, energy sources, health spending, and carbon emissions in Malaysia. Energy Rep. 2023, 10, 4318–4331. [Google Scholar] [CrossRef]
  71. Wei, H.; Yue, G.; Khan, N.U. Uncovering the impact of fintech, natural resources, green finance and green growth on environment sustainability in BRICS: An MMQR analysis. Resour. Policy 2024, 89, 104515. [Google Scholar] [CrossRef]
  72. Park, J.S.; Seo, Y.-J.; Ha, M.-H. The role of maritime, land, and air transportation in economic growth: Panel evidence from OECD and non-OECD countries. Res. Transp. Econ. 2019, 78, 100765. [Google Scholar] [CrossRef]
  73. Alvarado, R.; Toledo, E. Environmental degradation and economic growth: Evidence for a developing country. Environ. Dev. Sustain. 2017, 19, 1205–1218. [Google Scholar] [CrossRef]
  74. Hondroyiannis, G.; Papapetrou, E.; Tsalaporta, P. Environmental degradation and inflation in high-income countries. Econ. Change Restruct. 2025, 58, 3. [Google Scholar] [CrossRef]
  75. Akhayere, E.; Kartal, M.T.; Adebayo, T.S.; Kavaz, D. Role of energy consumption and trade openness towards environmental sustainability in Turkey. Environ. Sci. Pollut. Res. 2023, 30, 21156–21168. [Google Scholar] [CrossRef]
  76. Khalid, U.; Shafiullah, M. Financial development and governance: A panel data analysis incorporating cross-sectional dependence. Econ. Syst. 2021, 45, 100855. [Google Scholar] [CrossRef]
  77. Wang, L.; Hafeez, M.; Ullah, S.; Yonter, I.U. Cross-sectional dependence in financial openness and its influence on renewable energy consumption in Asia. Energy Environ. 2023, 36, 0958305X231219786. [Google Scholar] [CrossRef]
  78. Menegaki, A. Ways of treatment of cross-sectional dependence in the energy-growth nexus and the X-variable growth nexus. In A Guide to Econometrics Methods for the Energy-Growth Nexus; Elsevier: Amsterdam, The Netherlands, 2021; pp. 161–178. [Google Scholar]
  79. Pesaran, M.H. General diagnostic tests for cross section dependence in panels. Cambridge Working Papers. Economics 2004, 1240, 1. [Google Scholar]
  80. Friedman, M. The use of ranks to avoid the assumption of normality implicit in the analysis of variance. J. Am. Stat. Assoc. 1937, 32, 675–701. [Google Scholar] [CrossRef]
  81. Pesaran, M.H.; Yamagata, T. Testing slope homogeneity in large panels. J. Econom. 2008, 142, 50–93. [Google Scholar] [CrossRef]
  82. Pesaran, M.H. A simple panel unit root test in the presence of cross-section dependence. J. Appl. Econom. 2007, 22, 265–312. [Google Scholar] [CrossRef]
  83. Westerlund, J. Testing for error correction in panel data. Oxf. Bull. Econ. Stat. 2007, 69, 709–748. [Google Scholar] [CrossRef]
  84. Pedroni, P. Critical values for cointegration tests in heterogeneous panels with multiple regressors. Oxf. Bull. Econ. Stat. 1999, 61, 653–670. [Google Scholar] [CrossRef]
  85. Kao, C. Spurious regression and residual-based tests for cointegration in panel data. J. Econom. 1999, 90, 1–44. [Google Scholar] [CrossRef]
  86. Westerlund, J.; Edgerton, D.L. A simple test for cointegration in dependent panels with structural breaks. Oxf. Bull. Econ. Stat. 2008, 70, 665–704. [Google Scholar] [CrossRef]
  87. Koenker, R.; Bassett Jr, G. Regression quantiles. Econom. J. Econom. Soc. 1978, 46, 33–50. [Google Scholar] [CrossRef]
  88. Binder, M.; Coad, A. From Average Joe’s happiness to Miserable Jane and Cheerful John: Using quantile regressions to analyze the full subjective well-being distribution. J. Econ. Behav. Organ. 2011, 79, 275–290. [Google Scholar] [CrossRef]
  89. Machado, J.A.; Silva, J.S. Quantiles via moments. J. Econom. 2019, 213, 145–173. [Google Scholar] [CrossRef]
  90. Hoechle, D. Robust standard errors for panel regressions with cross-sectional dependence. Stata J. 2007, 7, 281–312. [Google Scholar] [CrossRef]
  91. Driscoll, J.C.; Kraay, A.C. Consistent covariance matrix estimation with spatially dependent panel data. Rev. Econ. Stat. 1998, 80, 549–560. [Google Scholar] [CrossRef]
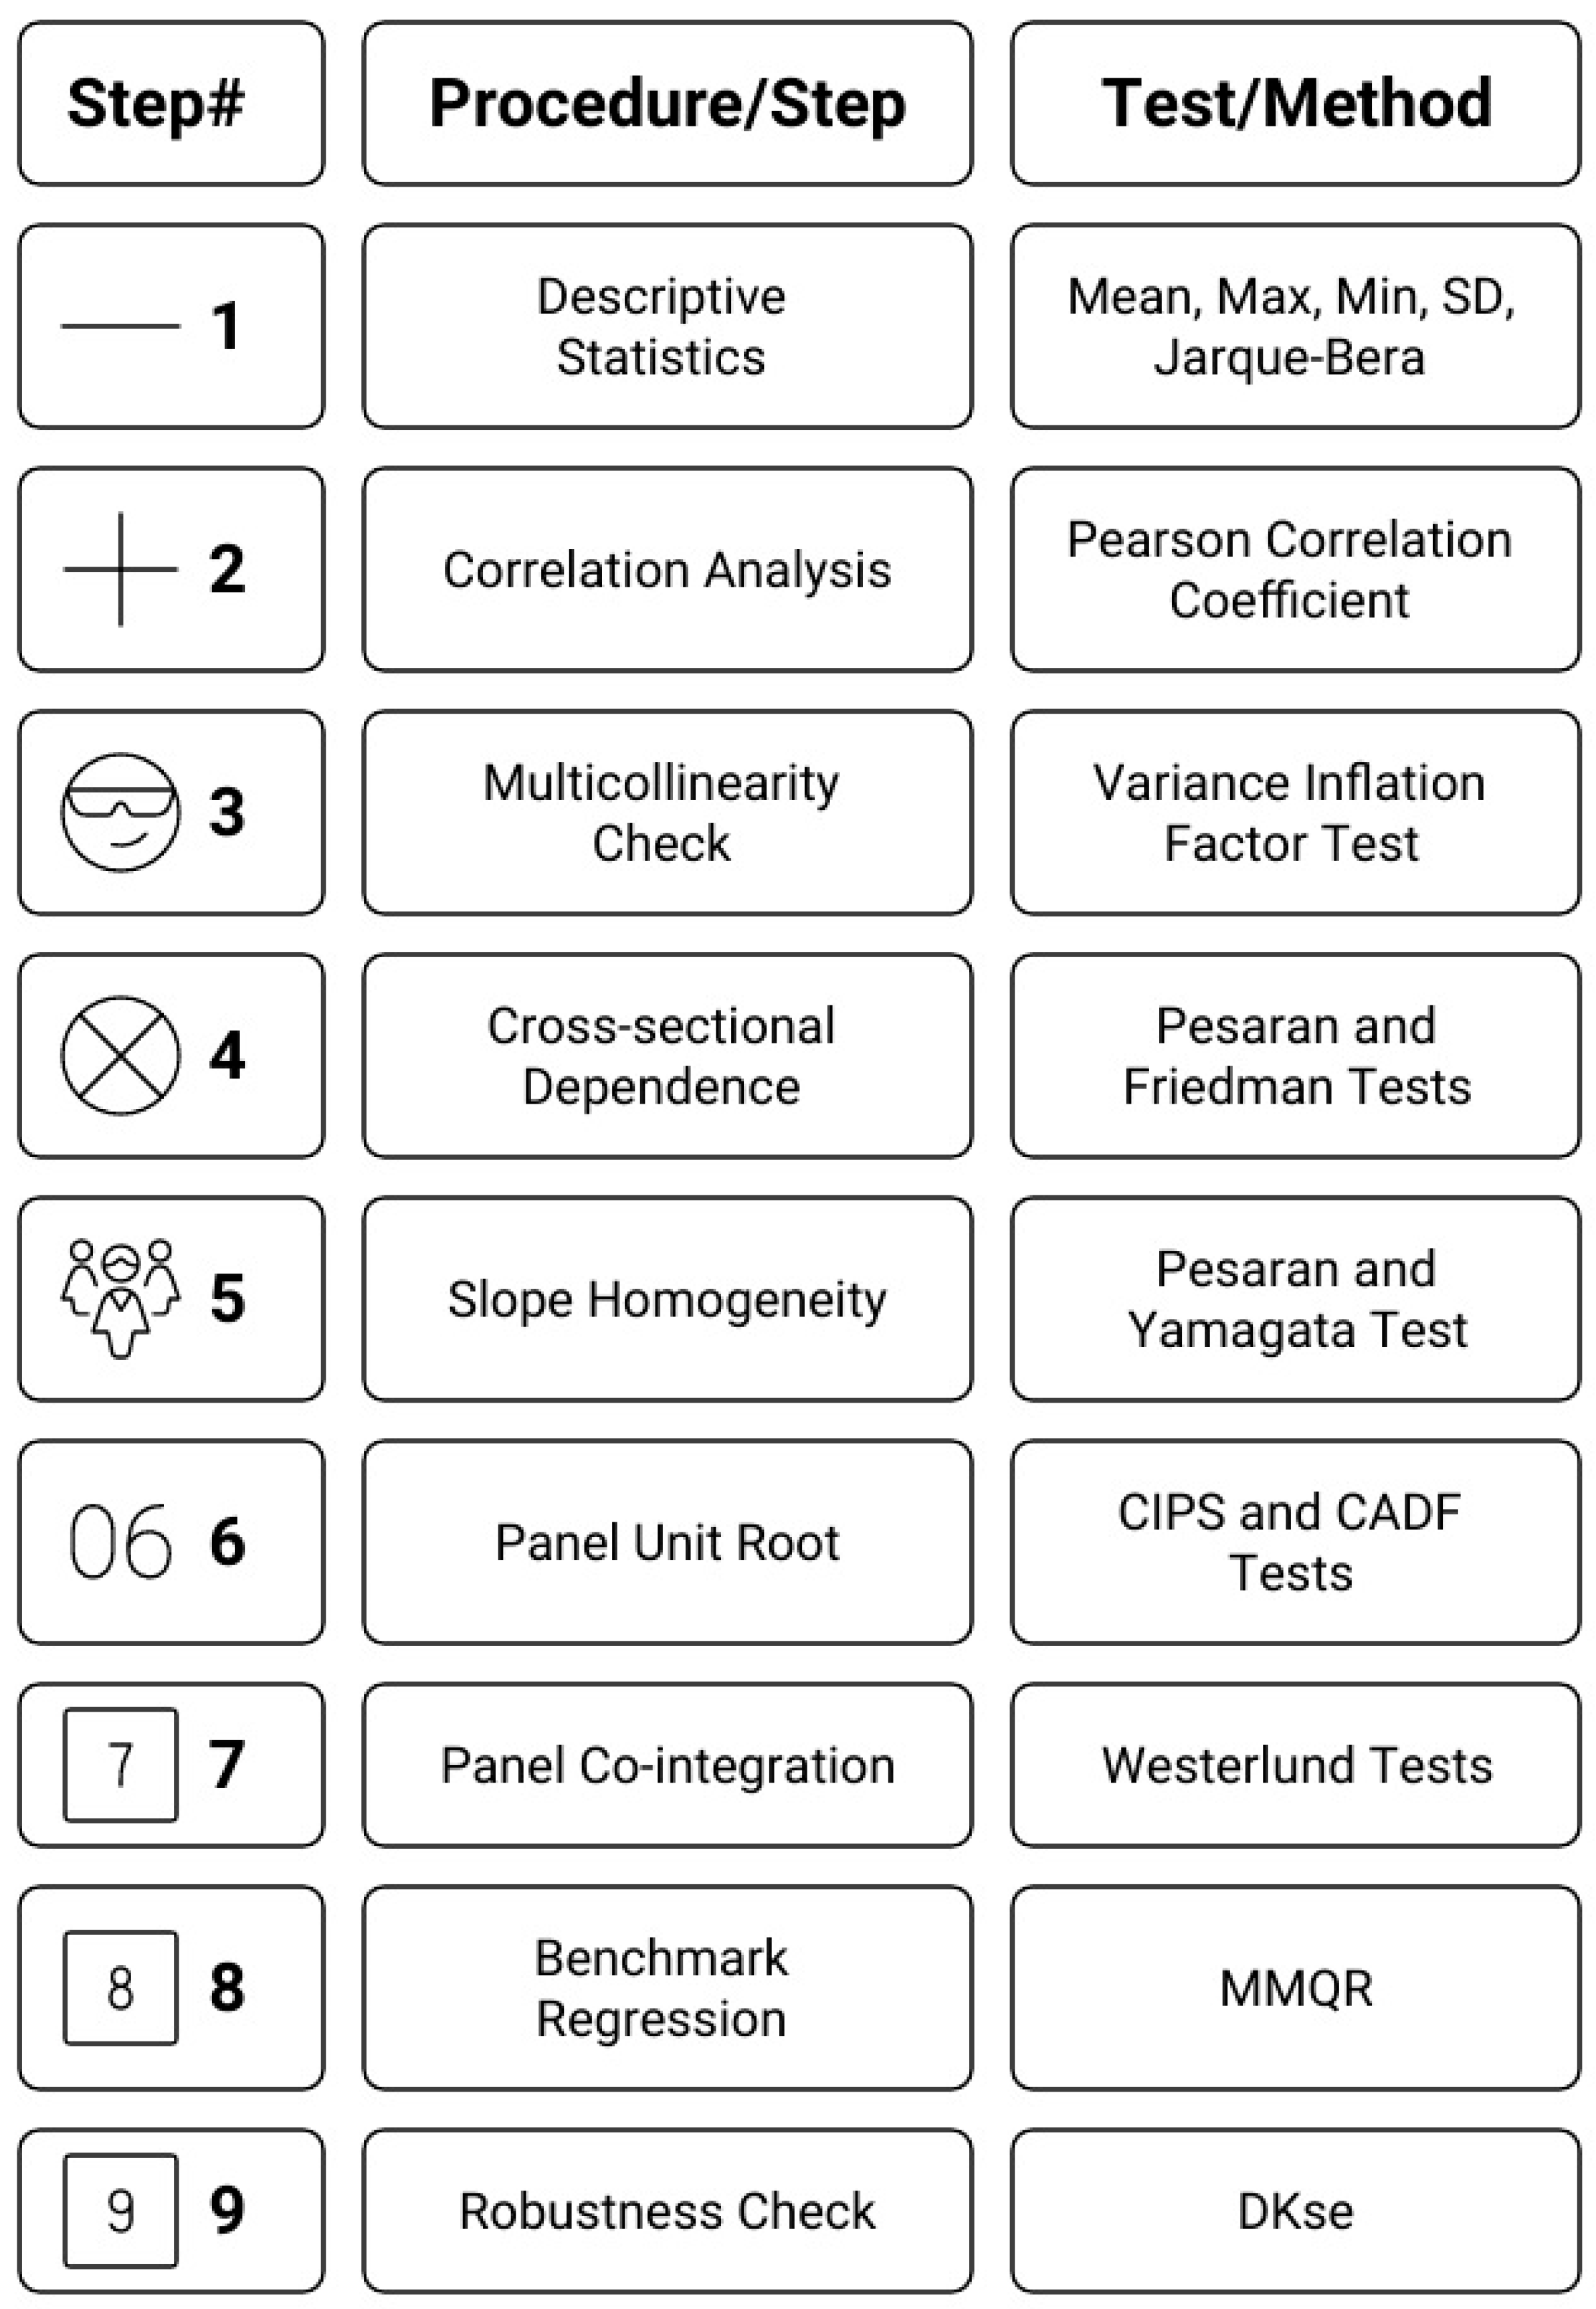
Figure 1. Econometric strategy.
Sustainability 17 10541 g001
Figure 2. Group mean CO2 emissions per capita from 1995 to 2022 (Author’s computation).
Sustainability 17 10541 g002
Figure 3. Group mean RED quad Btu from 1995 to 2022 (Author’s computation).
Sustainability 17 10541 g003
Figure 4. Group mean NED quad Btu from 1995 to 2022 (Author’s computation).
Sustainability 17 10541 g004
Figure 5. Summary of main findings.
Sustainability 17 10541 g005
Table 1. List of sample countries.
South AfricaRussiaUkraineNetherlandsUnited KingdomBelgium
PakistanMexicoRomaniaFranceSpainCzechia
ChinaBulgariaIndiaCanadaGermany
ArmeniaArgentinaBrazilHungarySweeden
SloveniaSwitzerlandUnited StatesFinlandSlovakia
Table 2. Description of variables.
VariablesCodesOperational DefinitionRef.Source
Environmental SustainabilityENSUSIt represents environmental sustainability measured through CO2 emissions per capita[71]WDI
Transportation IndexTINDEXIt demonstrates the transportation index calculated using two indicators: air and land transport. The index is calculated through PCA[72]WDI
Renewable Energy DevelopmentREDIt signifies renewable energy development measured by total energy production from nuclear sources in quad Btu.[16]EIA
Nuclear Energy DevelopmentNEDIt signifies nuclear energy development measured by total energy production from nuclear sources in quad Btu.[15]EIA
Transportation Index ×Renewable energy developmentTINDEX × REDInteraction term Author’s Calculation
Transportation Index × Nuclear energy developmentTINDEX × NEDInteraction term Author’s Calculation
Gross Domestic ProductGDPGross domestic product constant to 2015[73]WDI
InflationINFLIt represents the rate of inflation.[74]WDI
Trade opennessTOIt represents the trade as a percentage of GDP[75]WDI
Note: WDI shows “World Development Indicators”, and EIA demonstrates “Energy Information Administration”.
Table 3. Descriptive statistics.
VariableObsMeanStd. Dev.MinMaxJB-StatsProb.
ENSUS7282.3000.7290.4144.1013.3560.187
TINDEX 728−4.43 × 10−91.000−2.3662.15143.490.000
RED7280.1400.18901.04427190.000
NED728−1.0280.701−3.6220.92753.270.000
GDP72811.5880.7699.16713.4159.3690.000
INFL7280.8770.31102.96212660.000
TO7281.8460.2301.2962.30915.280.000
Table 4. Correlation analysis and VIF test.
Variables(1)(2)(3)(4)(5)(6)(7)VIF1/VIF
(1) ENSUS1.000
(2) TINDEX 0.8931.000 3.900.256
(3) RED0.6930.6951.000 2.670.375
(4) NED0.6420.6820.6581.000 2.900.344
(5) GDP0.8240.6840.6940.7081.000 3.760.266
(6) INFL0.0260.062−0.159−0.217−0.3041.000 1.560.641
(7) TO−0.578−0.444−0.468−0.238−0.415−0.1681.0001.700.587
Mean VIF2.68
Table 5. Cross-sectional dependence test and slope homogeneity test.
VariablesPesaranFriedman
CD-StatsProb.CD-StatsProb.
ENSUS11.685 ***0.00094.112 ***0.000
TINDEX11.935 ***0.000108.561 ***0.000
RED62.332 ***0.000459.259 ***0.000
NED9.419 ***0.00082.719 ***0.000
GDP88.464 ***0.000621.667 ***0.000
INFL24.779 ***0.000190.580 ***0.000
TO37.793 ***0.000288.294 ***0.000
Slope homogeneity test
StatisticsProb.
Delta19.873 ***0.000
Deltaadj23.515 ***0.000
Note: *** is for the significance level of 1%.
Table 6. Panel unit root and cointegration tests.
VariablesPanel Unit Root Test
CIPSCADFDecision
I(0)I(1)I(0)I(1)CIPSCADF
ENSUS−0.809−4.869 ***−0.573−2.642 ***I(1)I(1)
TINDEX −2.150 * −1.960−3.194 ***I(0)I(1)
RED−2.537 ** −1.925−2.891 ***I(0)I(1)
NED−2.452 ** −1.673−3.108 ***I(0)I(1)
GDP−2.699 *** −2.482 ** I(0)I(0)
INFL−3.304 *** −2.585 *** I(0)I(0)
TO−1.885−4.179 ***−1.990−2.293 **I(1)I(1)
Panel cointegration test, Westerlund (2007) [83]
StatisticsGtGaPtPaCointegration exist
Value−3.495 ***−17.178 ***−11.336−10.584 ***
Z-value−7.233−4.047−0.656−1.392
Prob.0.0000.0000.2560.000
Panel cointegration test, Westerlund & Edgerton (2008) [86]
StatisticsGtGaPtPaCointegration exist
Value−1.774−7.031 ***−7.290 ***−5.314 ***
Z-value3.7203.7343.9803.009
Prob.1.0000.0000.0000.009
Robust Prob.0.9400.0000.0000.000
Note: *, ** & *** is for the significance level of 10%, 5% and 1%.
Table 7. Benchmark regression.
Method of Movements Quantile Regression (MMQR)
VariablesLocationScaleQuantiles
10th20th30th40th50th60th70th80th90th
DV: ENSUSLower QuantilesMiddle QuantilesUpper Quantiles
Direct effect
model
TINDEX 0.381 ***−0.017 ***0.410 ***0.400 ***0.392 ***0.386 ***0.381 ***0.376 ***0.369 ***0.363 ***0.355 ***
GDP0.413 ***0.025 **0.372 ***0.386 ***0.397 ***0.406 ***0.413 ***0.421 ***0.430 ***0.439 ***0.451 ***
INFL0.238 ***−0.046 ***0.314 ***0.288 ***0.267 ***0.251 ***0.238 ***0.223 ***0.206 ***0.188 ***0.167 ***
TO−0.469 ***0.068 ***−0.581 ***−0.543 ***−0.511 ***−0.488 ***−0.468 ***−0.446 ***−0.422 ***−0.396 ***−0.365 ***
Combine effect
Model
TINDEX 0.423 ***−0.029 ***0.473 ***0.453 ***0.440 ***0.432 ***0.423 ***0.416 ***0.404 ***0.392 ***0.375 ***
RED−0.186 ***0.058−0.286 ***−0.246 ***−0.220 ***−0.203 ***−0.186 ***−0.171 ***−0.147 **−0.123 *−0.089
NED−0.084 ***0.012−0.104 ***−0.096 ***−0.091 ***−0.087 ***−0.084 ***−0.081 ***−0.076 ***−0.072 ***−0.065 ***
GDP0.458 ***0.0160.430 ***0.441 ***0.448 ***0.453 ***0.458 ***0.462 ***0.469 ***0.476 ***0.485 ***
INFL0.205 ***−0.0200.240 ***0.226 ***0.217 ***0.211 ***0.205 ***0.200 ***0.191 ***0.183 ***0.171 ***
TO−0.466 ***0.103 ***−0.643 ***−0.572 ***−0.526 ***−0.495 ***−0.466 ***−0.440 ***−0.397 ***−0.354 ***−0.294 ***
Moderation
effect model
TINDEX 0.271 ***0.0120.251 ***0.259 ***0.263 ***0.266 ***0.270 ***0.276 ***0.280 ***0.284 ***0.289 ***
RED−1.624 ***0.372 ***−2.226 ***−1.997 ***−1.958 ***−1.768 ***−1.645 ***−1.469 ***−1.347 ***−1.232 ***−1.074 ***
NED−0.080 ***0.012−1.100 ***−0.093 ***−0.088 ***−0.085 ***−0.081 ***−0.075 ***−0.071 ***−0.067 ***−0.062 **
TINDEX × RED−0.853 ***−0.245 ***−1.249 ***−1.098 ***−1.007 ***−0.947 ***−0.866 ***−0.750 ***−0.670 ***−0.594 ***−0.490 ***
TINDEX × NED−0.069 ***0.024 ***−0.108 ***−0.094 ***−0.085 ***−0.079 ***−0.071 ***−0.059 ***−0.051 ***−0.044 ***−0.034 ***
GDP0.515 ***0.0200.482 ***0.494 ***0.502 ***0.507 ***0.513 ***0.523 ***0.530 ***0.536 ***0.545 ***
INFL0.214 ***−0.0100.229 ***0.223 ***0.220 ***0.217 ***0.214 ***0.210 ***0.206 ***0.203 ***0.199 ***
TO−0.522 ***0.074 ***−0.641 ***−0.596 ***−0.568 ***−0.550 ***−0.526 ***−0.491 ***−0.467 ***−0.444 ***−0.413 ***
Note: *, ** & *** is for the significance level of 10%, 5% and 1%.
Table 8. Robustness test (DKse).
DV:
ENSUS
DKse
Direct Effect ModelCombine
Effect Model
Moderation Effect Model
VariablesCoef.
Std. Err.
Coef.
Std. Err.
Coef.
Std. Err.
TINDEX 0.381 ***
(0.016)
0.423 ***
(0.018)
0.271 ***
(0.043)
RED −0.186 *
(0.096)
−1.624 ***
(0.152)
NED −0.084 ***
(0.023)
−0.080 ***
(0.016)
TINDEX × RED −0.852 ***
(0.071)
TINDEX × NED −0.069 ***
(0.020)
GDP0.413 ***
(0.028)
0.458 ***
(0.029)
0.515 ***
(0.032)
INFL0.238 ***
(0.036)
0.205 ***
(0.035)
0.214 ***
(0.033)
TO−0.469 ***
(0.055)
−0.466 ***
(0.059)
−0.522 ***
(0.068)
_Cons−1.824 ***
(0.416)
−2.385 ***
(0.465)
−2.822 ***
(0.455)
No of Groups.728728728
No of Obs.262626
R20.91530.91950.9295
Note: *, & *** is for the significance level of 10%, and 1%.
Disclaimer/Publisher’s Note: The statements, opinions and data contained in all publications are solely those of the individual author(s) and contributor(s) and not of MDPI and/or the editor(s). MDPI and/or the editor(s) disclaim responsibility for any injury to people or property resulting from any ideas, methods, instructions or products referred to in the content.