Article

Assessing the Spatiotemporal Dynamics of Regional Ecosystem Health in Aydın Province, Türkiye

by
Birsen Kesgin Atak
1,* and
Ebru Ersoy Tonyaloğlu
2
1
Department of Landscape Architecture, Izmir Demokrasi University, 35140 Karabaglar, İzmir, Türkiye
2
Department of Landscape Architecture, Faculty of Agriculture, Aydın Adnan Menderes University, 09100 Aydın, Aydın, Türkiye
*
Author to whom correspondence should be addressed.
Sustainability 2025, 17(23), 10522; https://doi.org/10.3390/su172310522
Submission received: 12 October 2025 / Revised: 13 November 2025 / Accepted: 18 November 2025 / Published: 24 November 2025
(This article belongs to the Special Issue Sustainable Land Management: Urban Planning and Land Use)

Abstract

This study analyzes the spatial and temporal dynamics of Regional Ecosystem Health (REH) in the province of Aydın, located in western Türkiye, using the Vigor–Organization–Resilience (VOR) framework. Ecosystem conditions between 1995 and 2020 were assessed by integrating remote sensing-based vitality indicators, landscape metrics, and habitat quality modeling. Vigor (V) increased across most land use/land cover (LULC) types, whereas Resilience (R) remained generally stable but showed slight declines in natural and semi-natural areas affected by intensive human activities and climatic stressors. This divergence mainly reflects the combined effects of agricultural intensification and the expansion of urban green areas, both of which enhance vegetation vitality and productivity (V), while ongoing habitat fragmentation and land use pressure in natural and semi-natural landscapes reduce ecological resilience (R). Conversely, the weakening of the Organization (O) component in coastal and peri-urban areas is associated with increased fragmentation and low connectivity. This situation clearly suggests the pressure exerted on ecological integrity by tourism infrastructure, second home developments, and intensive agricultural activities. The study’s findings confirm, in line with the literature on the Mediterranean region, that topographic diversity, land use intensity, and socio-economic processes are key factors determining spatial differences in ecosystem health. Furthermore, it was observed that the low REH values concentrated in coastal areas in 1995 had shifted to hotspots in higher elevations by 2020; this spatial shift suggests that the continuity of natural cover in mountainous areas enhances ecological conditions. Consequently, this study, with its VOR-based integrated approach, provides an applicable, replicable, and policy-informative framework for the long-term monitoring of ecosystem health and sustainable land use planning in climate-sensitive and rapidly changing Mediterranean landscapes.

1. Introduction

Ecosystems involve the complex interrelations among people, the natural environment, and climate. They are crucial not only for their aesthetic and recreational value but also for the fundamental benefits they provide to the continuity of life [1,2]. Healthy ecosystems provide a variety of ecosystem services, such as air and water purification, nutrient cycles, agricultural pollination, climate regulation, and biological diversity conservation [3,4]. These services support environmental sustainability, human health and well-being, as well as economic activities [5,6]. Recent studies have highlighted that the cultural and aesthetic value provided by ecosystems also have a direct impact on human lives. Natural landscapes yield positive outcomes for recreation, inspiration, spiritual renewal, and mental health [7,8]. Numerous studies have demonstrated that time spent in nature supports both physical and mental health [9,10]. Furthermore, ecosystems provide a direct livelihood for many communities in the form of food, medicine, and raw materials [11,12]. However, due to rapid urbanization, agricultural intensification, and global tourism pressure, the structure, function, and dynamics of ecosystems are often not sufficiently considered in planning processes [13]. This situation leads to serious deterioration in ecosystem health.
Factors threatening ecosystem health can be both natural and human-induced. Natural disturbances (e.g., wildfires, storms and droughts) impede the regenerative capacity of ecosystems, whereas human-induced disturbances often have irreversible effects [14,15]. Amongst these impacts, the most significant is land use/land cover (LULC) change. Due to their direct effects on ecosystem functioning, productivity, and biodiversity, LULC changes have been identified as important indicators of ecosystem health [16,17]. Therefore, monitoring LULC changes has become crucial for identifying the most vulnerable areas to degradation and determining conservation and restoration priorities [18].
The concept of Regional Ecosystem Health (REH) provides a valuable instrument for the management of ecosystems and the promotion of their sustainability in the context of increasing environmental challenges [19,20]. The REH evaluation framework is generally grounded on the Vigor, Organization, and Resilience (VOR) framework. This methodological framework facilitates a holistic evaluation of ecosystem productivity, structural complexity, and resilience to disturbances [21,22]. VOR-based REH assessments support evidence-based decision-making by illuminating the multifaceted relationships between natural systems and human activities [23].
The United Nations Sustainable Development Goals (specifically SDGs 14 and 15), together with IPBES assessments and the Paris Climate Agreement, have prioritized the conservation of biodiversity, ecosystem integrity, and the protection of ecosystem services within their policy framework. This framework strengthens efforts to monitor the state/condition of ecosystems and ecosystem services in [24,25,26]. The European Green Deal and the EU Biodiversity Strategy, while promoting nature-based solutions and landscape-scale restoration, particularly in Mediterranean countries, are paving the way for the widespread adoption of standard approaches such as ecosystem condition/area (extent) calculations in the EU and its member states. Climate adaptation and biodiversity policies in Türkiye are also progressing in line with this global trend.
The Mediterranean basin, in particular, is one of the focal points of these global debates due to its high sensitivity to climate change, biological diversity, and intense human pressure. Studies conducted in Spain, Italy, and Greece reveal that tourism, agricultural intensity, and urbanization have negative impacts on ecosystems [27,28,29], and it is clear that similar processes are becoming increasingly visible in Türkiye. The province of Aydın, located in western Türkiye, as a typical Mediterranean landscape, possesses both high ecological value and intense socio-economic pressures. Agriculture, tourism, and urban expansion are the most significant factors transforming the region’s natural ecosystems [30,31]. However, the application of VOR-based REH assessments in Türkiye is still limited, and studies conducted at a regional scale, particularly for areas reflecting typical Mediterranean conditions such as Aydın, are rare. In this respect, Aydın Province not only represents a typical Mediterranean ecosystem but also constitutes a unique research area due to increasing urbanization, agricultural intensity, and tourism pressures.
This study examines the spatial and temporal changes in ecosystem health in the province of Aydın between 1995 and 2020 within the framework of VOR. The contribution of this study will be significant not only at the application level but also at the methodological level. This approach, which integrates remote sensing data, landscape metrics, and habitat quality models, evaluates ecosystem health from a multidimensional perspective and offers an innovative contribution to REH studies, of which there are only a limited number of examples in Türkiye. Furthermore, the findings have the potential to develop a comparative framework for similar socio-ecological systems in the Mediterranean basin. Thus, this study will directly contribute to both scientific knowledge production and sustainable land use and landscape planning processes

2. Materials and Methods

2.1. Study Area

Aydın Province is located in western Türkiye, on the coast of the Aegean Sea, at coordinates 37.8380° N and 27.8456° E. It has a total area of approximately 8000 km2 and a coastline stretching for 150 km. Administratively, it is divided into 27 districts, and its topography exhibits a distinct heterogeneity extending from the coast to the inland areas (Figure 1).
The province has a Mediterranean climate; summers are hot and dry, while winters are mild and rainy [32]. With its rich archeological heritage and ancient cities, Aydın Province has significant cultural value [33]. Topographical diversity (coastal strip, low-lying plains and uplands in the interior) also highlights the spatial patterns of ecosystem components and differences in land use. A strong agricultural economy is one of the key determinants in Aydın; in addition, its location on the Aegean coast facilitates tourism and trade, contributing to economic diversification through non-agricultural activities. Over time, the tourism and manufacturing sectors have also become more visible in the local economy [31].
Whilst the rapid population growth that has continued since the 1970s; unplanned urbanization, degradation of agricultural land, and landscape management issues have heightened environmental concerns [34,35]. Currently, Aydın Province, with a population of over 1 million, ranks 20th in Türkiye in terms of population density [36]. Approximately 54% of the land has been shaped by human influence; this pressure stems from settlement and industrial activities, primarily agricultural production. The main environmental issues in the province include energy production (especially geothermal), urban sprawl, the expansion of transport networks, and intensive agricultural use [37,38]. The geographical concentration of these pressures is more pronounced along the western coastline and in the low-lying plains. Around Kuşadası and Didim, tourism infrastructure, seasonal second homes, and urban sprawl are weakening ecosystem integrity; around Dilek Peninsula National Park (despite its protected status), hotel-road-real estate pressures are increasing ecological fragmentation [39]. The Söke Plain, in addition to intensive agricultural use, faces increased risks of land degradation and habitat loss due to open-pit mining and industrial facilities).

2.2. Material

This study used ESA land cover (LC) maps (1995 and 2020) and Landsat 5 TM and Landsat 8 OLI satellite images as primary data (Table 1). The ESA LC maps have a spatial resolution of 250 m, but they were resampled to 30 m using the nearest-neighbor interpolation method to ensure consistency with the Landsat imagery and to maintain spatial comparability among all datasets.
The 1995 and 2020 ESA LC maps were used to derive the Resilience (R) and Organization (O) components; the Landsat images were used to derive the Vigor (V) component of the VOR framework. All image and regional statistical processing was performed in ArcMap 10.5.1; landscape metrics were calculated using FRAGSTATS v4.2.1 [40,41]. Additionally, the literature was used to identify the parameters associated with habitat quality, which are calculated in the open access InVEST® 3.13.0 software as an indicator of resilience (R) [42].

2.3. Methodological Framework

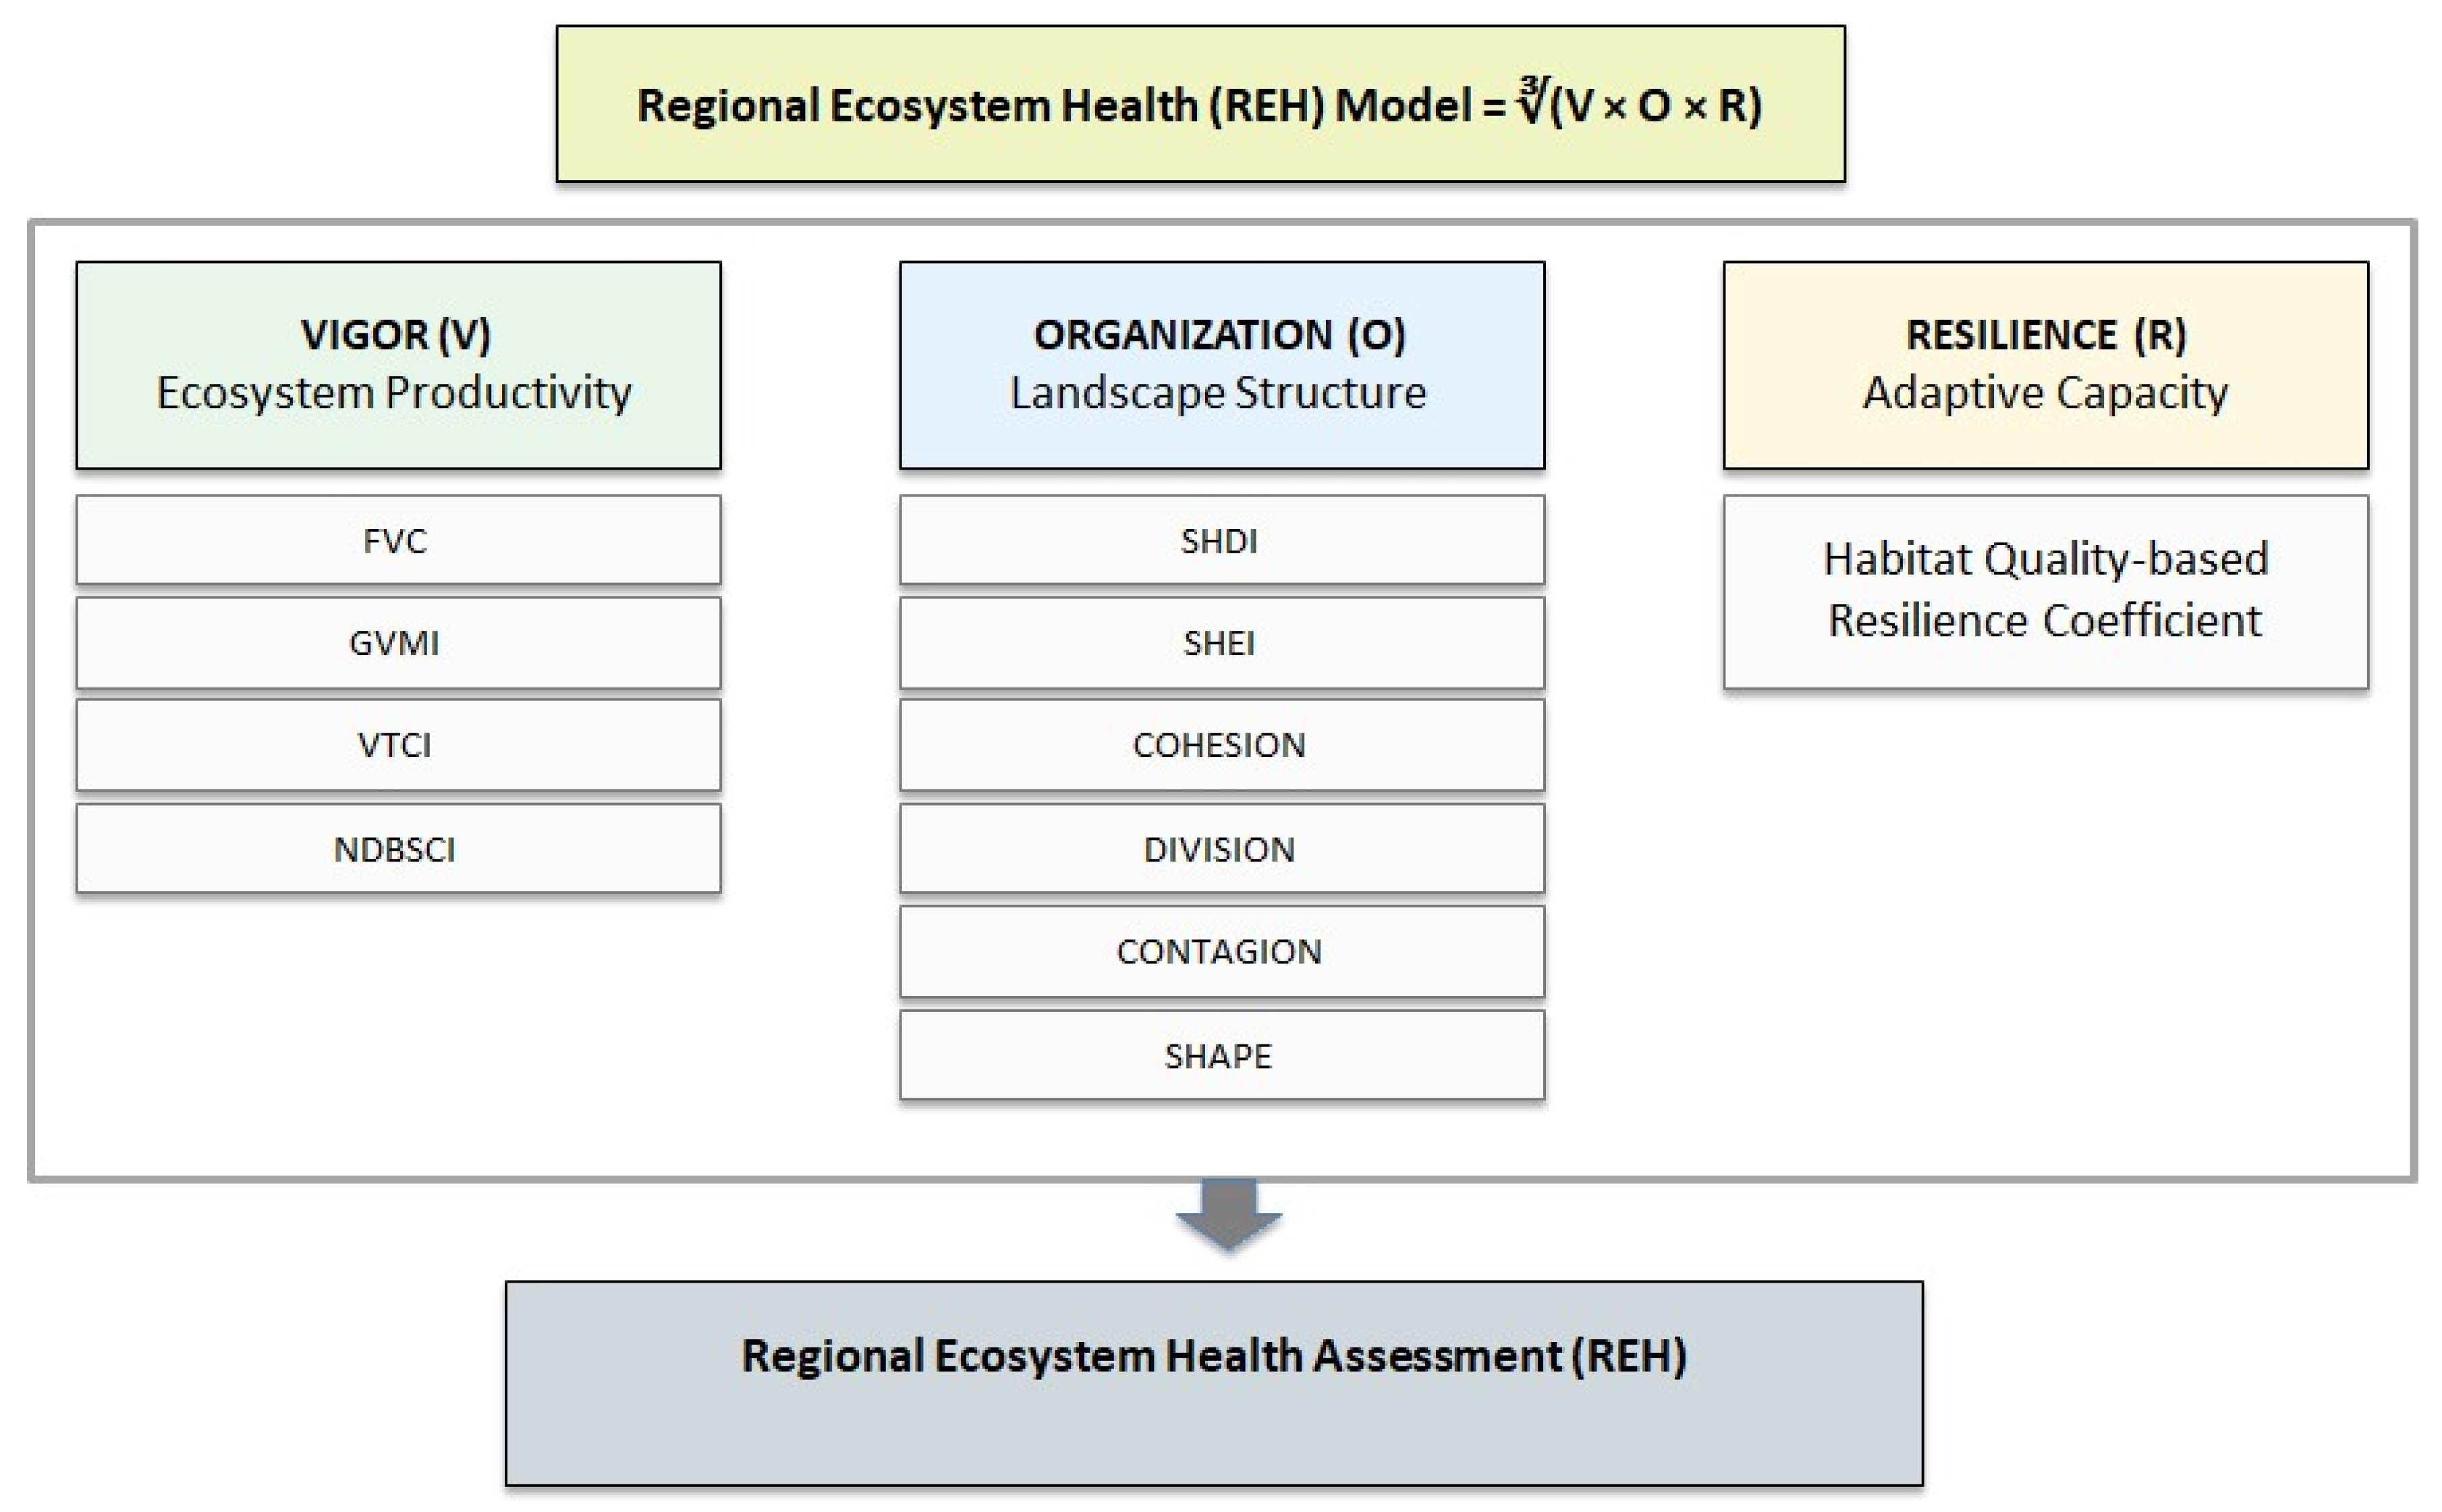
This study utilized a Regional Ecosystem Health (REH) model based on the VOR approach (REH = ∛(V × O × R)) (Figure 2). Here, V (Vigor) represents the ecosystem productivity, O (Organization) represents the structural and compositional characteristics of the landscape, and R (Resilience) represents the adaptation capacity of landscapes to disruptive impacts [21,43,44,45]. In this study, Vigor (V) is calculated using the CVI (comprehensive vigor index), as proposed by Bao et al. [23].
C V I V i g o r   = f ( F V C ,   G V M I ,   V T C I , N D B S C I )
CVI is composed of remote sensing indices that integrate vegetation cover ratio, moisture status, and land surface temperature conditions:
  • FVC (Fractional Vegetation Coverage)
  • GVMI (Global Vegetation Moisture Index)
  • VTCI (Vegetation Temperature Condition Index)
  • NDBSCI (Normalized Difference Build-up & Bare Soil Index)
The formulas provided in Table 2 were applied to Landsat 5 TM images for 1995 and Landsat 8 OLI images for 2020.
The Organization component was measured using FRAGSTATS v4.2.1 metrics to encompass the heterogeneity, connectivity, and shape dimensions of the ecosystem structure. The selection of landscape metrics was based on considering landscape heterogeneity, connectivity, and shape as the indicators of organizational complexity and stability [52,53,54].
  • Heterogeneity: Shannon’s Diversity Index (SHDI), Shannon’s Evenness Index (SHEI)
    SHDI: Measures the compositional diversity and spatial heterogeneity of LULC, where higher values indicate richer, more varied landscape structure and greater ecological stability in landscapes.
    SHEI: Assesses the evenness and structural balance of LULC distribution across the landscape, where values closer to 1 indicate a more uniform and well-balanced landscape mosaic.
  • Connectivity/Fragmentation: Patch Cohesion Index (COHESION), Landscape Division Index (DIVISION), Contagion (CONTAG)
    COHESION: Quantifies the physical and ecological connectedness of patches within each LULC class, where higher values indicate stronger habitat continuity supporting species and energy flow within landscapes.
    DIVISION: Measures the probability that two randomly selected pixels belong to different patches, where higher values indicate greater landscape fragmentation and spatial disruption.
    CONTAG: Evaluates the spatial aggregation of patch types, where higher contagion reflects dominance of large, contiguous patches and stronger landscape integrity.
  • Shape/Form: Area Weighted Mean Shape Index (SHAPE_AM)
    SHAPE_AM: Describes the geometric complexity of patches relative to a standard shape (e.g., square), where higher values indicate larger patches with more irregular boundaries, intensifying edge effects and habitat complexity. Here, the area-weighted version is preferred as it emphasizes the contribution of dominant LULC patches, providing a more ecologically realistic representation of the landscape structure.
Accordingly, a composite organization index was constructed using a weighted combination of the selected FRAGSTATS metrics. The weighting coefficients for landscape organization (0.4, 0.4, and 0.2 for landscape heterogeneity (LH), landscape connectivity (LC), and landscape shape (LS), respectively) were defined according to previous VOR-based ecosystem health studies [16,30,53,55,56], which emphasized the dominant role of landscape heterogeneity and connectivity in maintaining ecosystem structural stability. This weighting approach ensures consistency with prior applications of the VOR framework and enhances comparability across regional-scale assessments (see Equations (2) and (3)).
O = 0.4 × L H + 0.4 × L C + 0.2 × L S
O = 0.2 × S H D I + 0.2 × S H E I + 0.1 × C O H E S I O N + 0.15 × D I V I S I O N + 0.15 × C O N T A G + 0.2 × S H A P E
Finally, the R component was derived using the InVEST Habitat Quality (HQ) module. The HQ approach allows for comparative assessment of degradation and temporal change across habitat types at the regional scale. The HQ model, created using literature-based parameters, is normalized on a scale of 0 (low HQ) to 1 (high HQ). A linear decay function was used; maximum impact distances were assigned in the range of 2–8 km depending on the threat type. Habitat sensitivity values were defined for LULC classes; the half-saturation constant was set to 0.5 [23,35,57,58,59,60].
In the final stage, statistical outputs were used to summarize each sub-index and the Regional Ecosystem Health (REH) index at the LULC and district level, calculating the mean and standard deviation using the Zonal Statistics tool. The mean values represent the level of the normalized indices (CVI, O, R, and REH) within the 0–1 range, as well as the net change between years in the simplest form. Standard deviation (SD) was used to understand spatial heterogeneity within each zone (district/LULC class). Then, hotspot analysis (Getis–Ord Gi*) was employed to identify statistically significant spatial clusters of high and low REH values in 1995 and 2020 [40]. In addition, Global Moran’s I analysis was conducted to test whether the spatial distribution of REH exhibits statistically significant spatial autocorrelation at the global scale, thereby validating the clustering patterns revealed by means of Getis–Ord Gi* analysis. These analyses allow us to identify and evaluate spatial and temporal changes in REH in Aydın Province between 1995 and 2020, as well as degraded areas and conservation and rehabilitation priorities. These procedures were completed in ArcMap 10.5.1 software.

3. Results

3.1. LULC Change

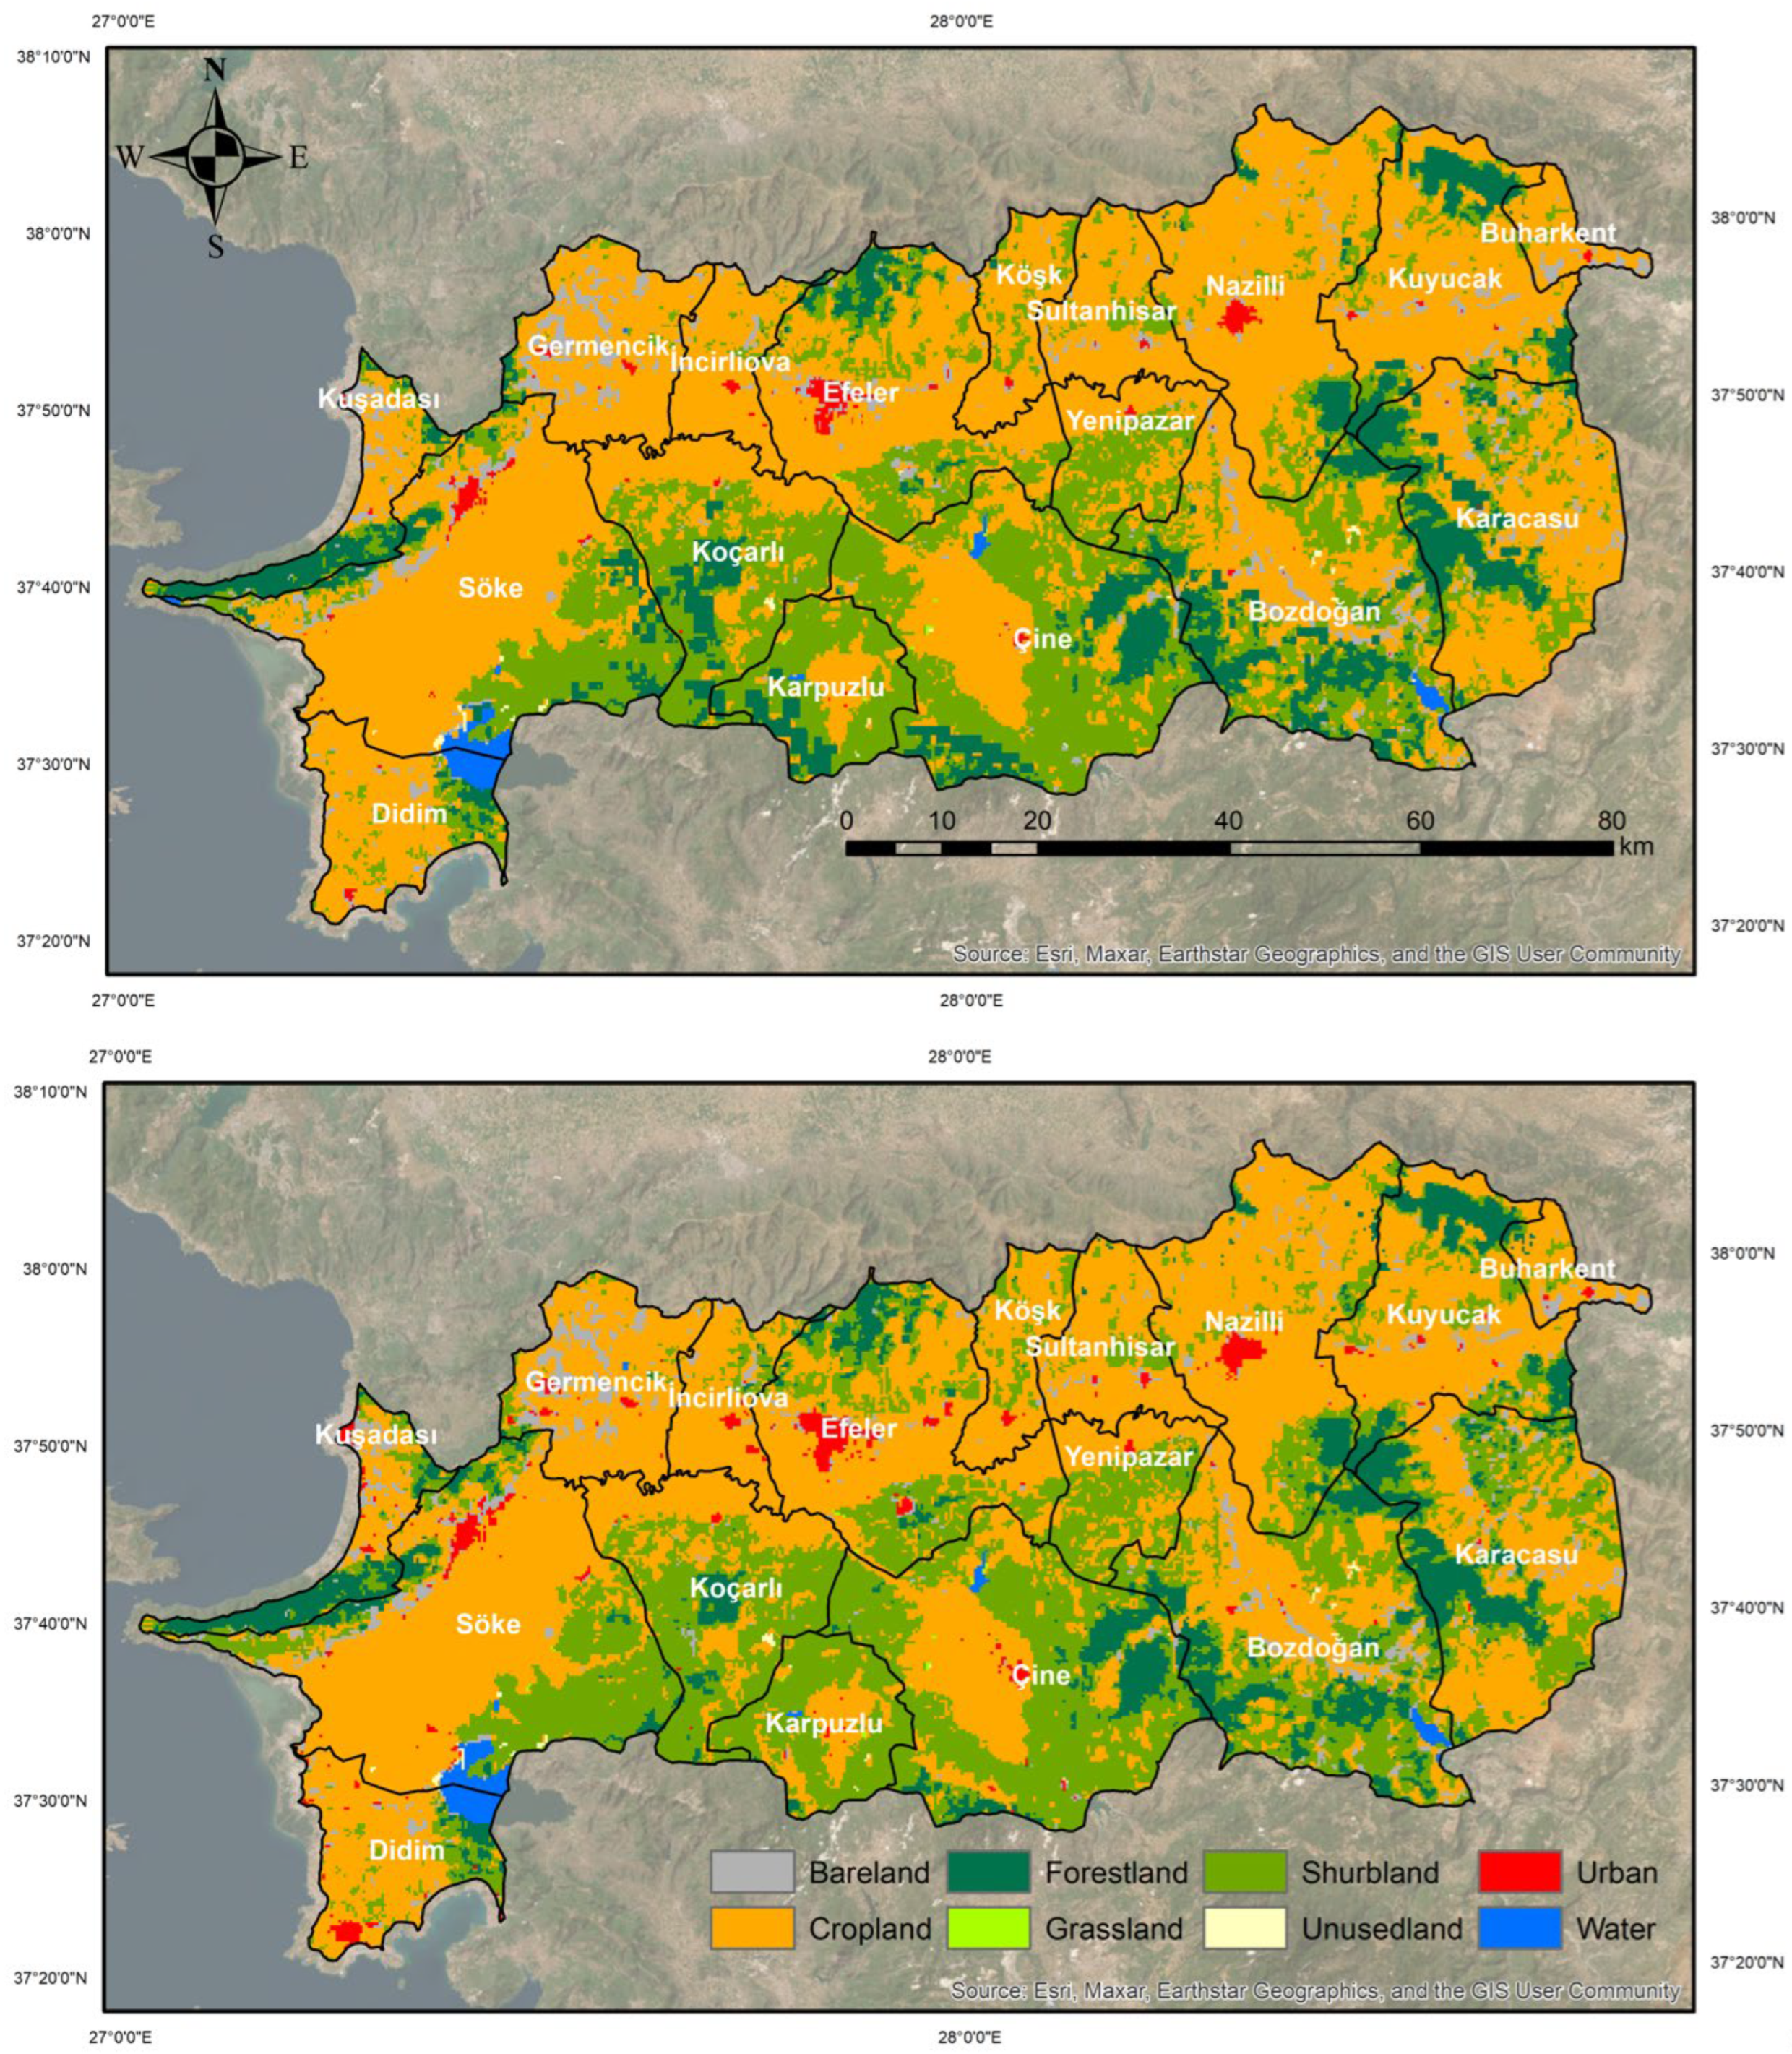
Figure 3 illustrates the LULC patterns for 1995 (top) and 2020 (bottom), while Table 3 summarizes the inter-class transformations (transition matrix) and the area-based gains/losses and net changes for each class over the same period across Aydın. In Table 3, rows represent 2020 classes, columns represent 1995 classes, and bold and shaded cells indicate unchanged areas.
The dominant classes in both years are Cropland and Shrubland; Cropland is concentrated in the north and center of the region, while Shrubland is concentrated in the northeast and south. Shrubland increased by approximately 30,979 ha to reach 223,870 ha; this increase was mainly due to conversions from Cropland (38,693.88 ha) and Forestland (15,225.57 ha). At the same time, around 16,461 ha of Shrubland was transformed back into Cropland, indicating a two-way change mechanism between these LULC categories.
Cropland decreased by a net 22,372 ha (from 419,089 to 396,717 ha), while Urban areas approximately doubled from 5118 to 10,263 ha. The 15.61% decrease in forest areas mainly shifted to Shrubland (6690.42 ha) and Cropland (4860.36 ha) classes; this finding suggests that Forestland was replaced by semi-natural and agricultural systems.
Although the total area of Bareland remained relatively stable during the same period, gains in the Cropland (5508 ha) and Shrubland (1151 ha) classes indicate land degradation/abandonment processes. However, transitions between Grassland and Unused LULC classes remained more limited and had a secondary impact on the overall landscape pattern.

3.2. Ecosystem Health Indices

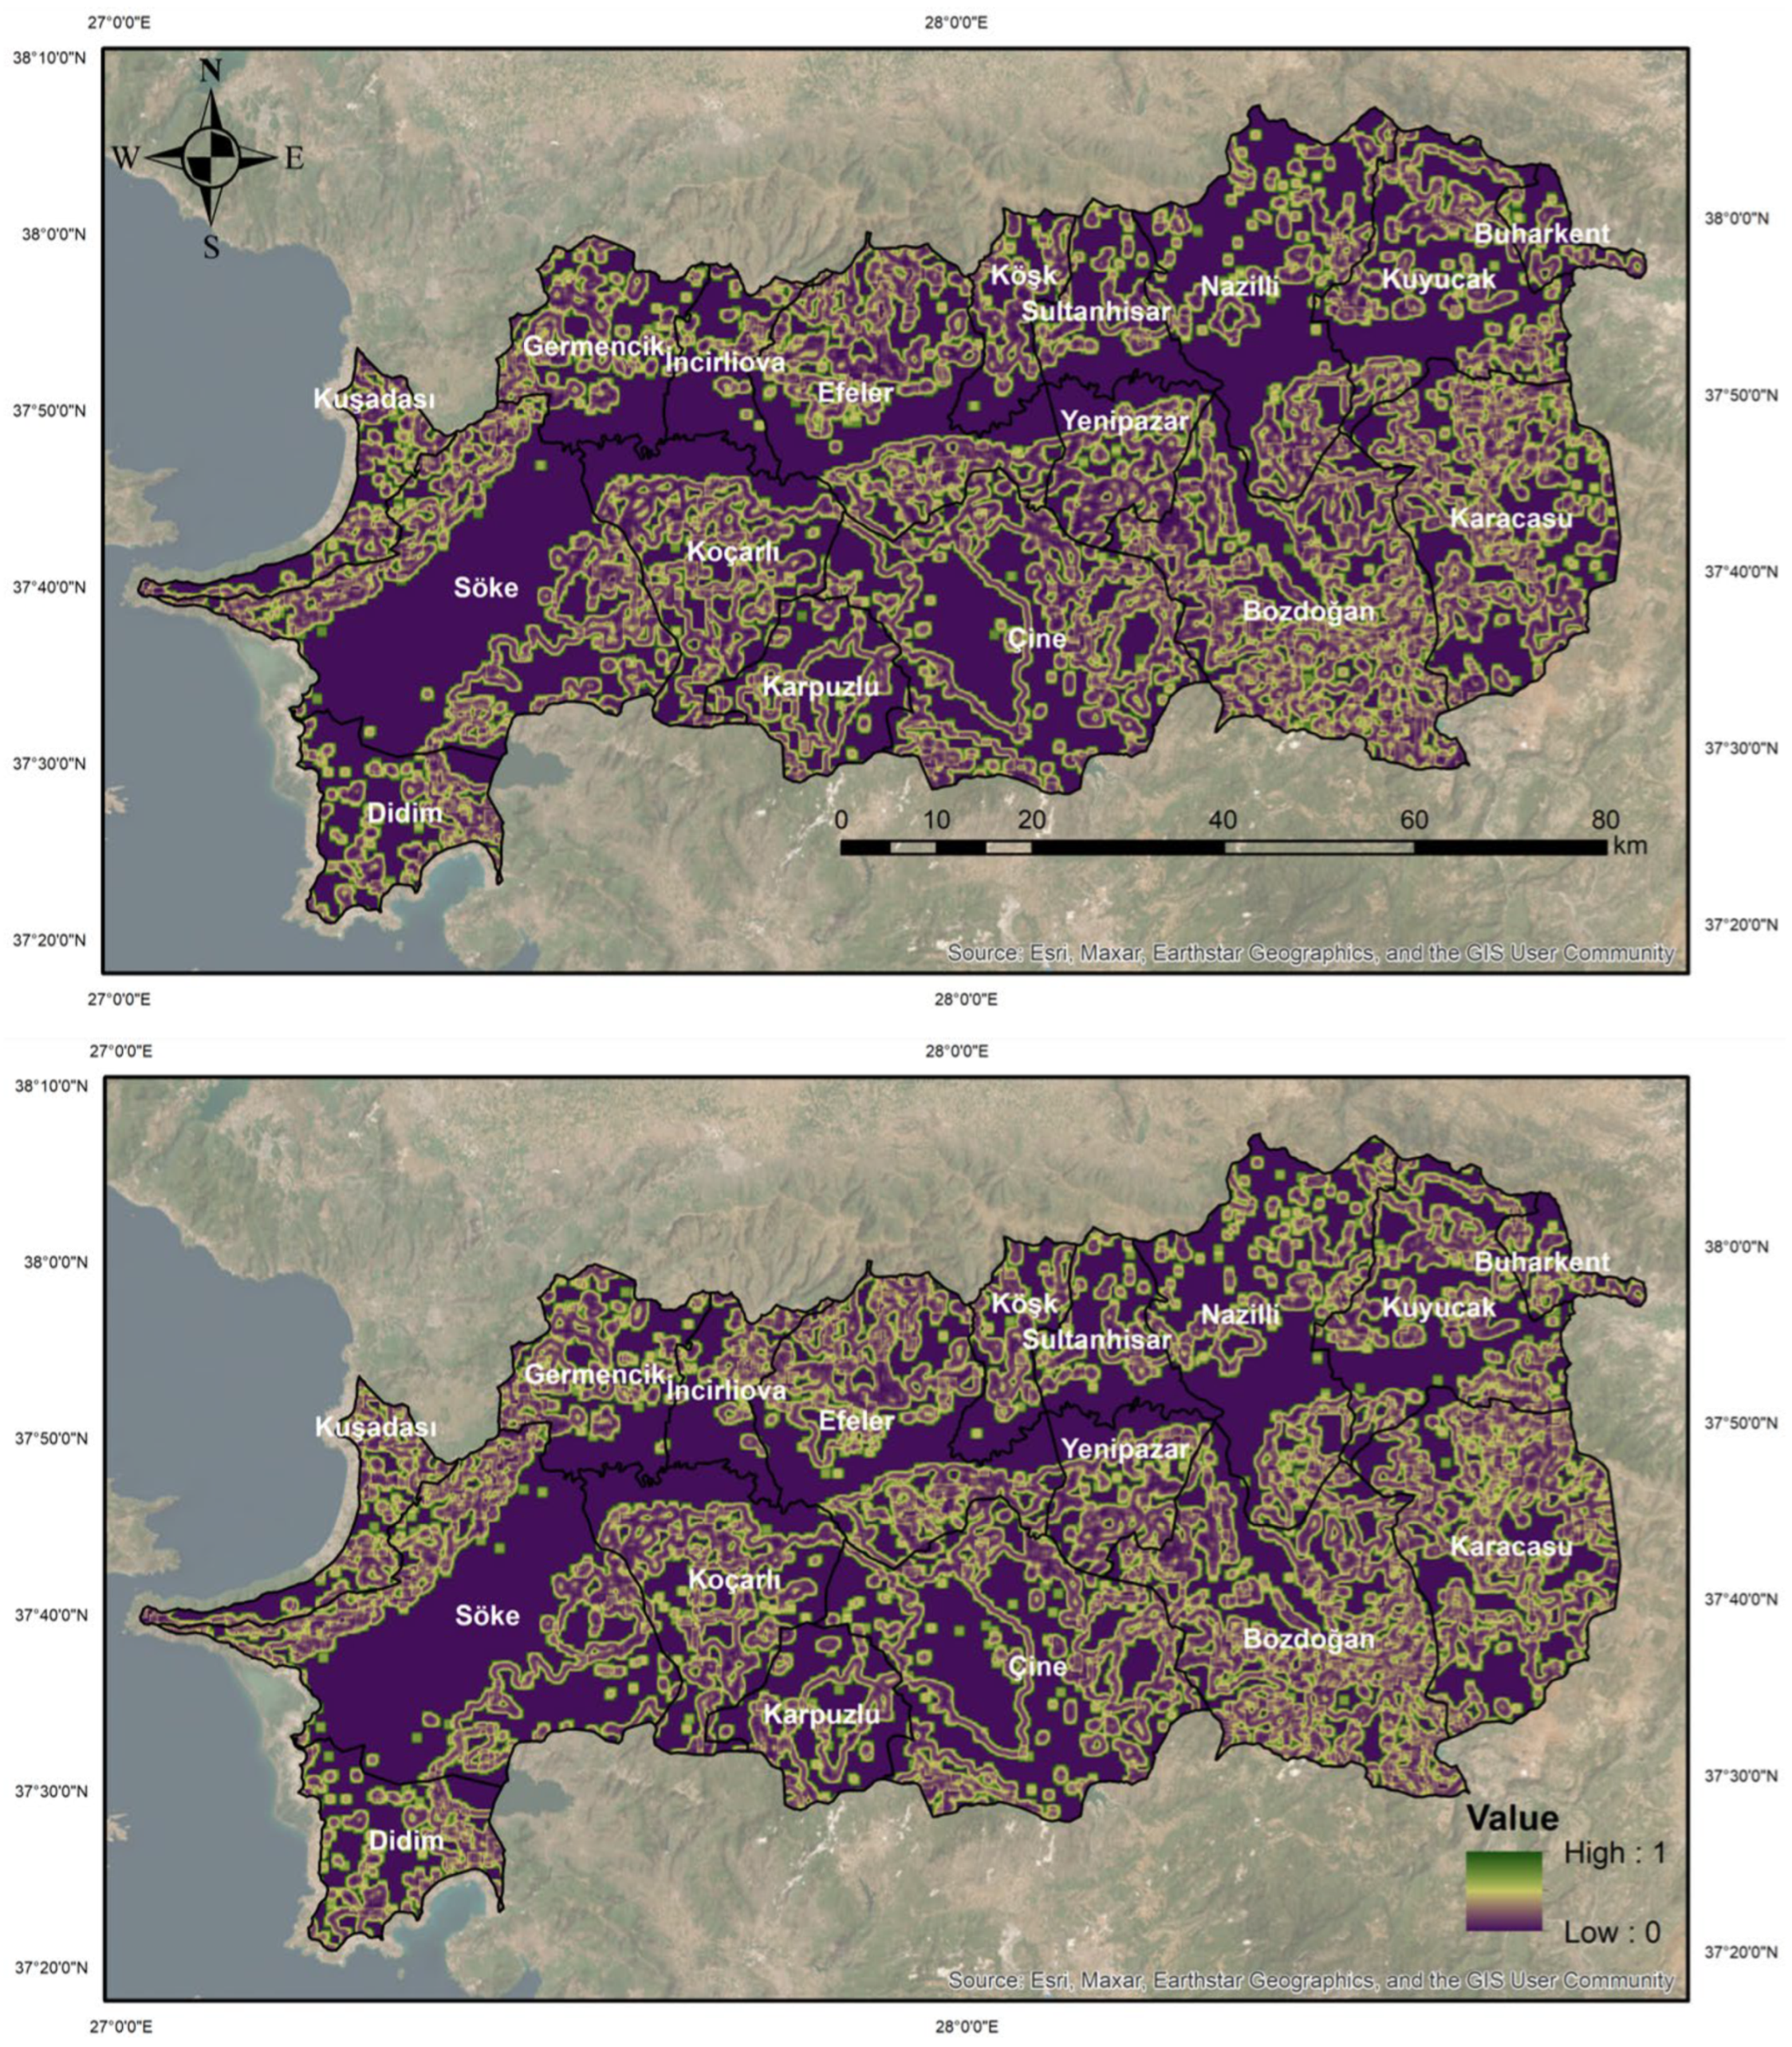
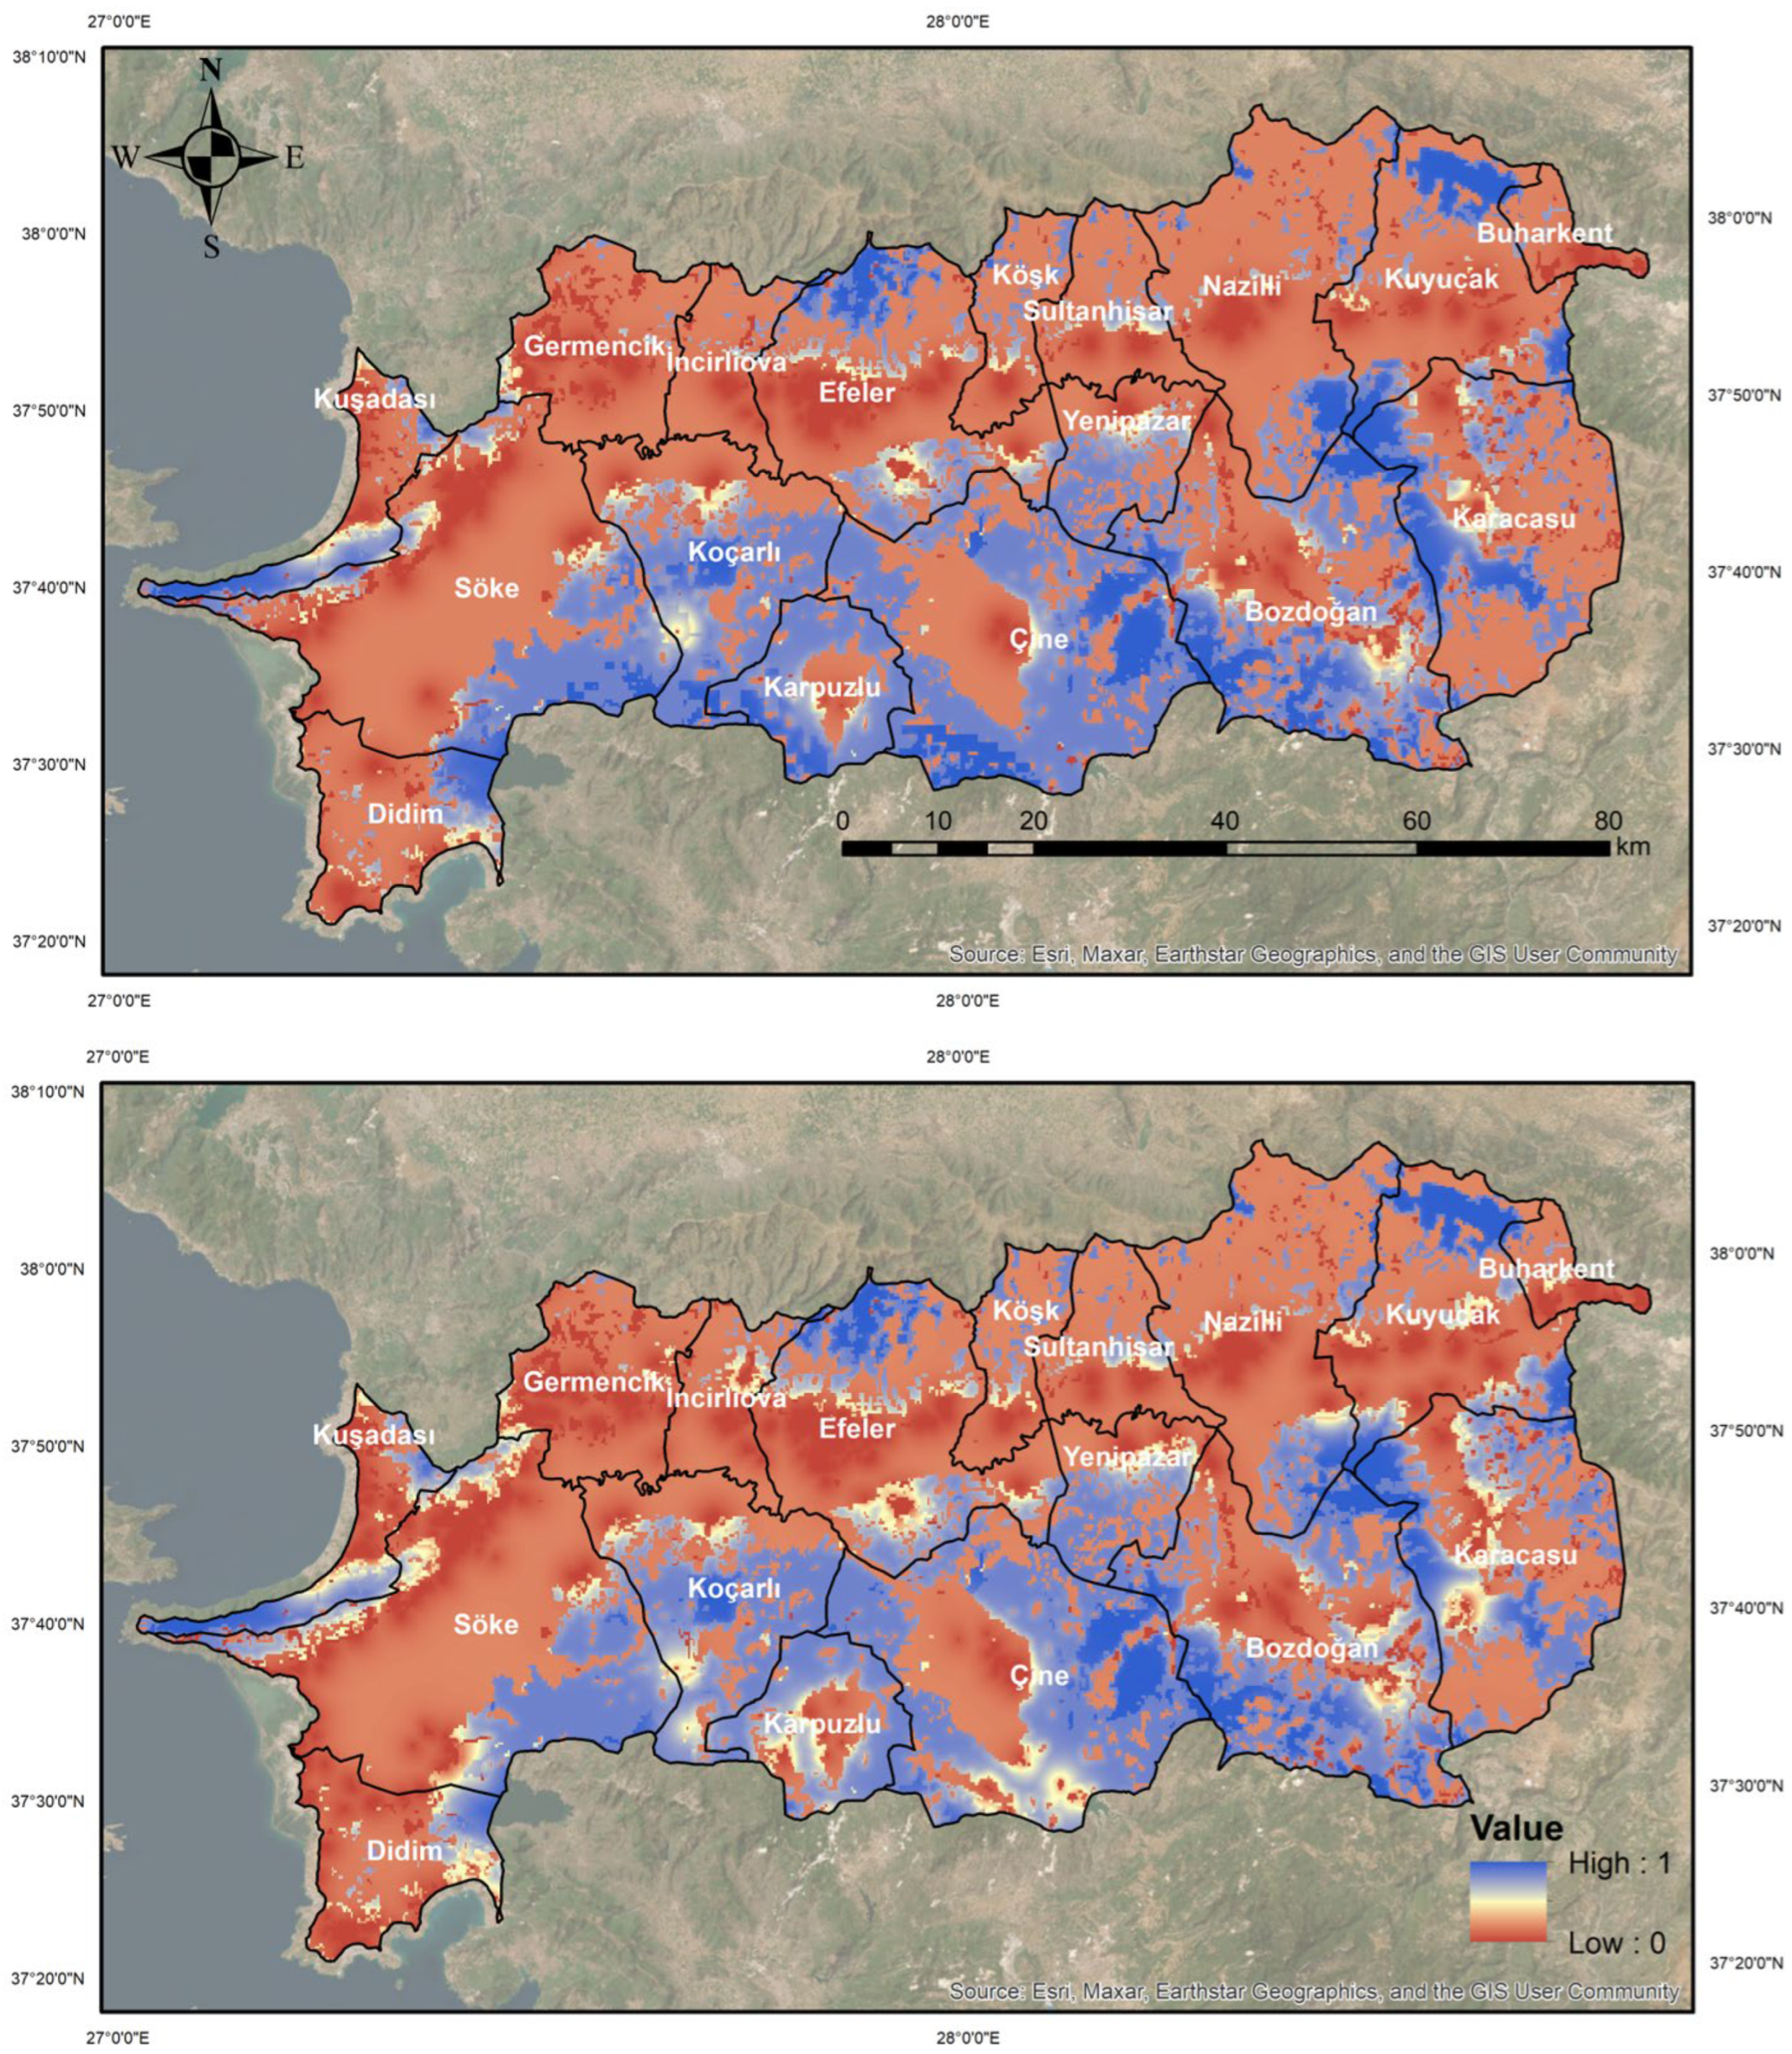
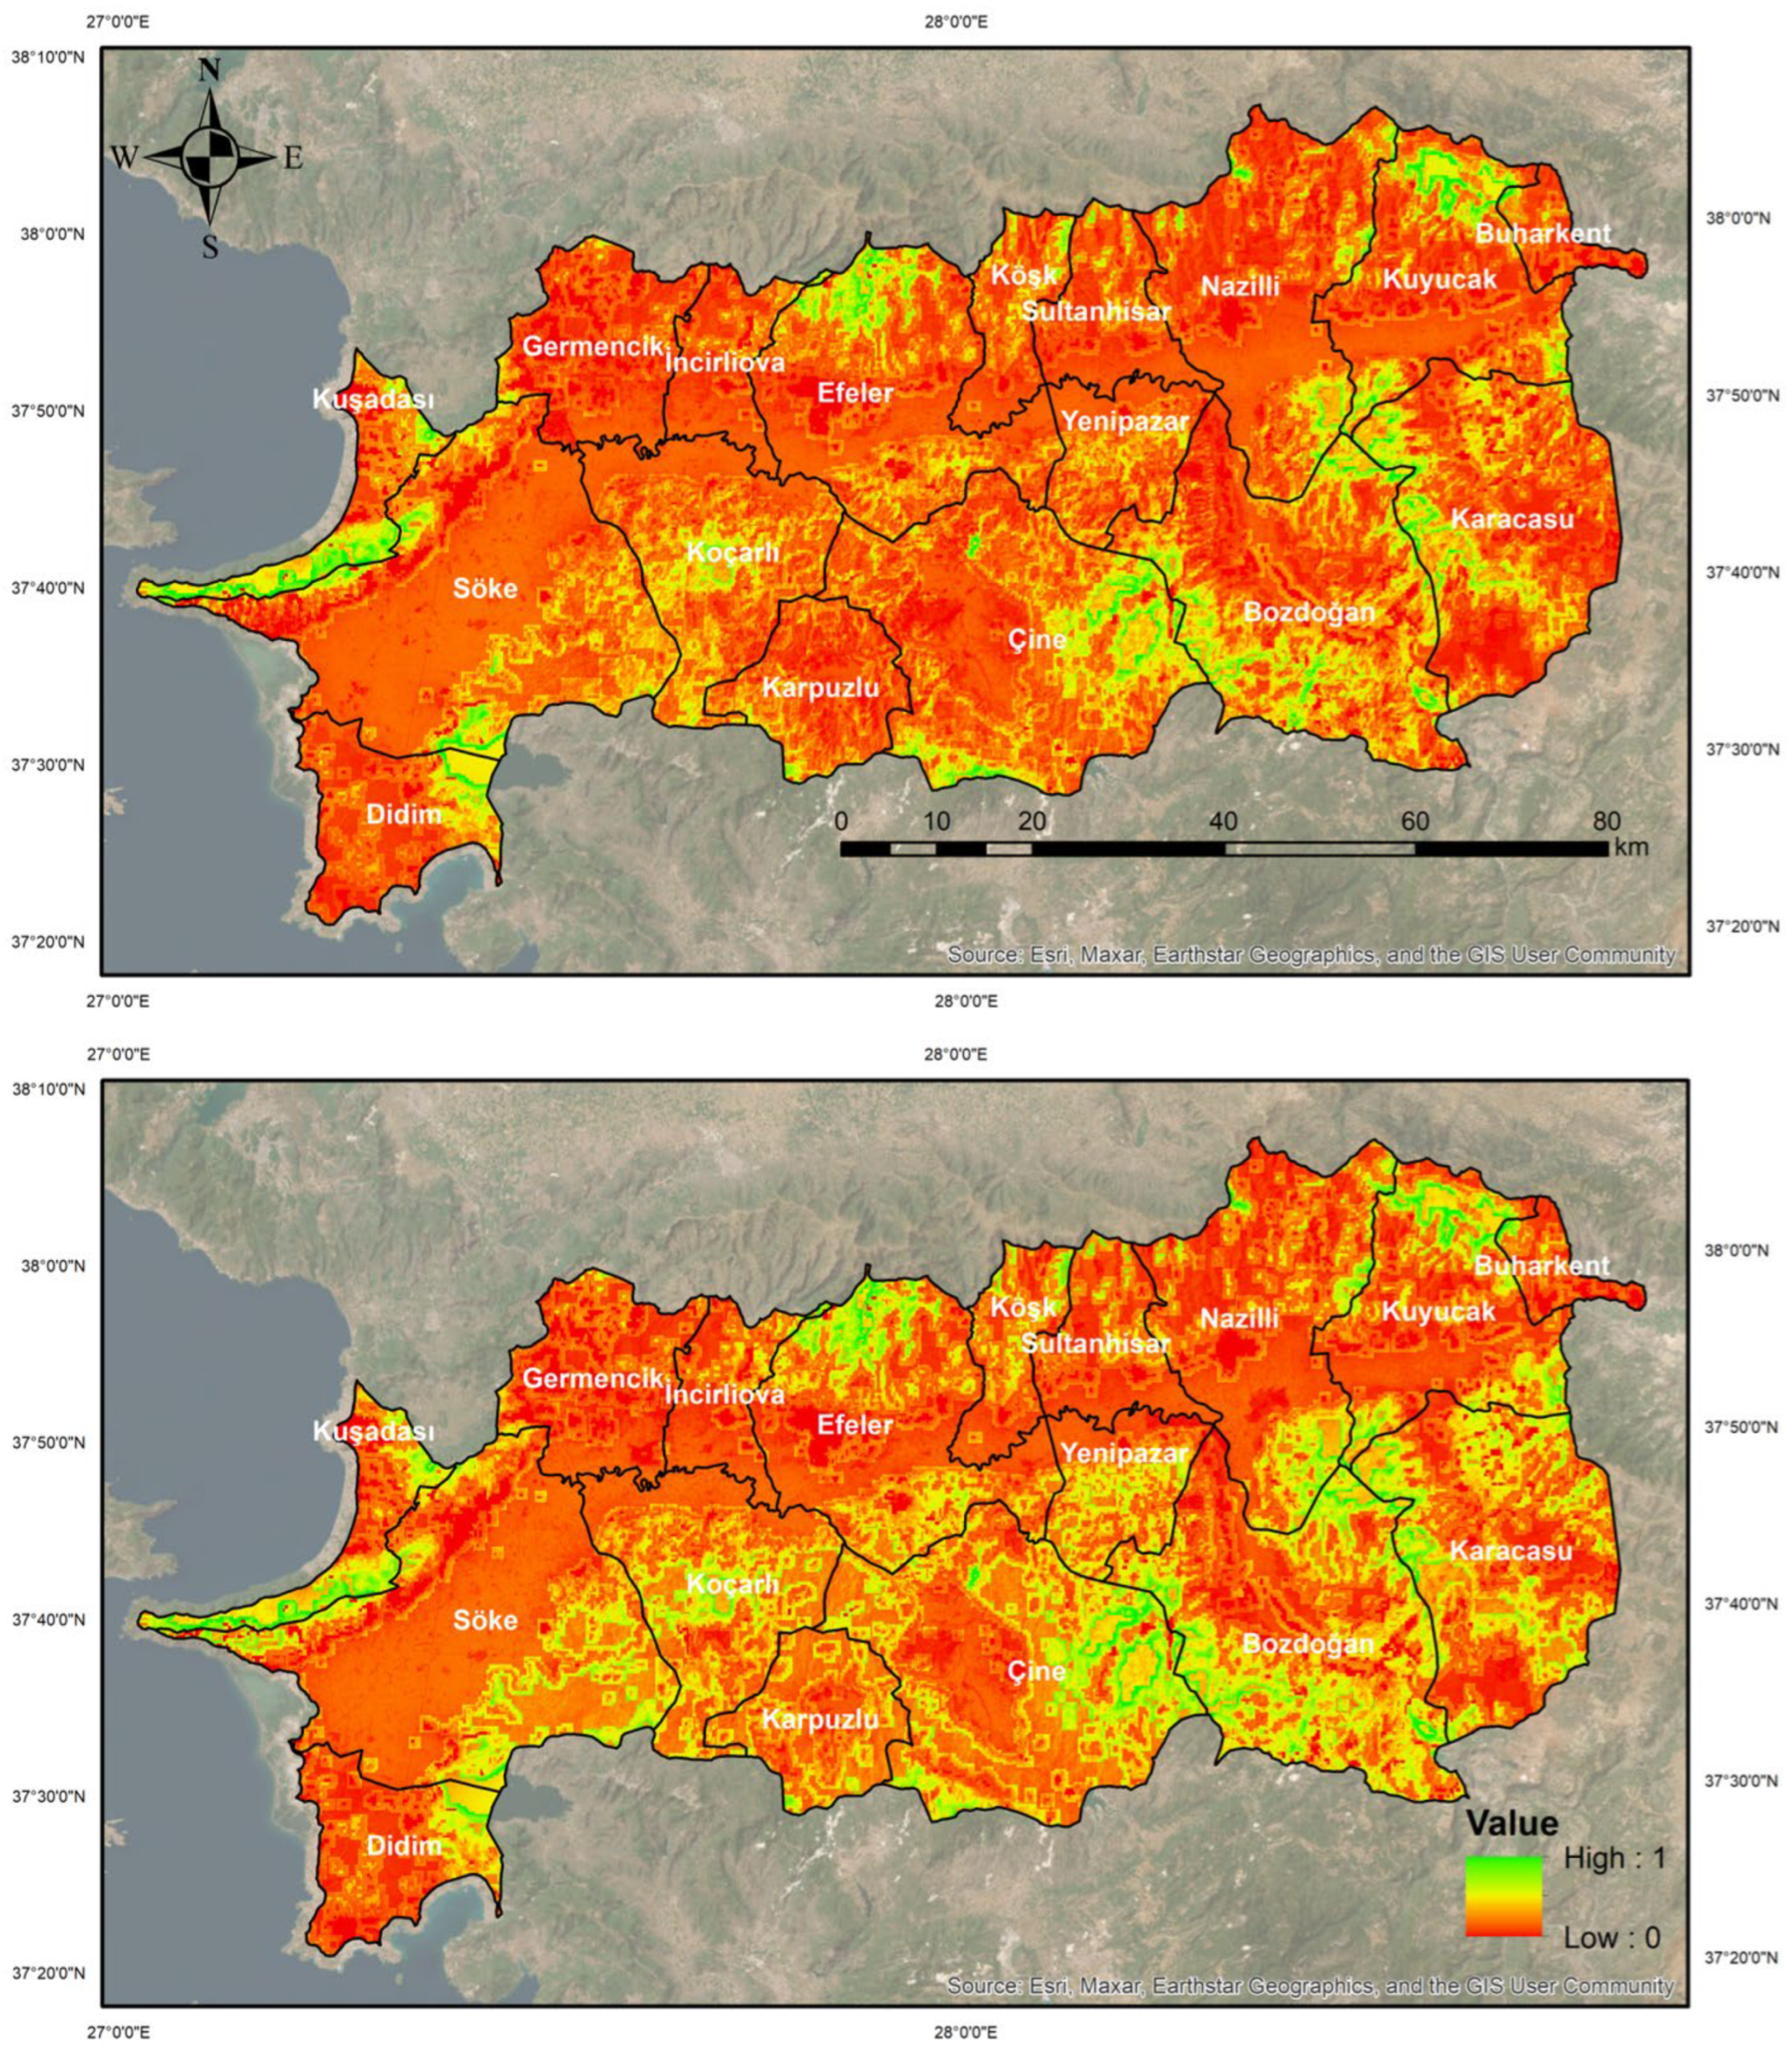
Below are the findings for regional ecosystem health indicators (Vigor (CVI), Organization (O), Resilience (R)) normalized in the 0–1 range and composite regional ecosystem health (REH) index. These findings are presented in the form of index maps produced for 1995 and 2020 (Figure 4, Figure 5, Figure 6 and Figure 7) and Zonal Statistics (mean-std) results at the LULC class and district scale (Table 4 and Table 5). Compared to 1995, CVI increased across the province in 2020.
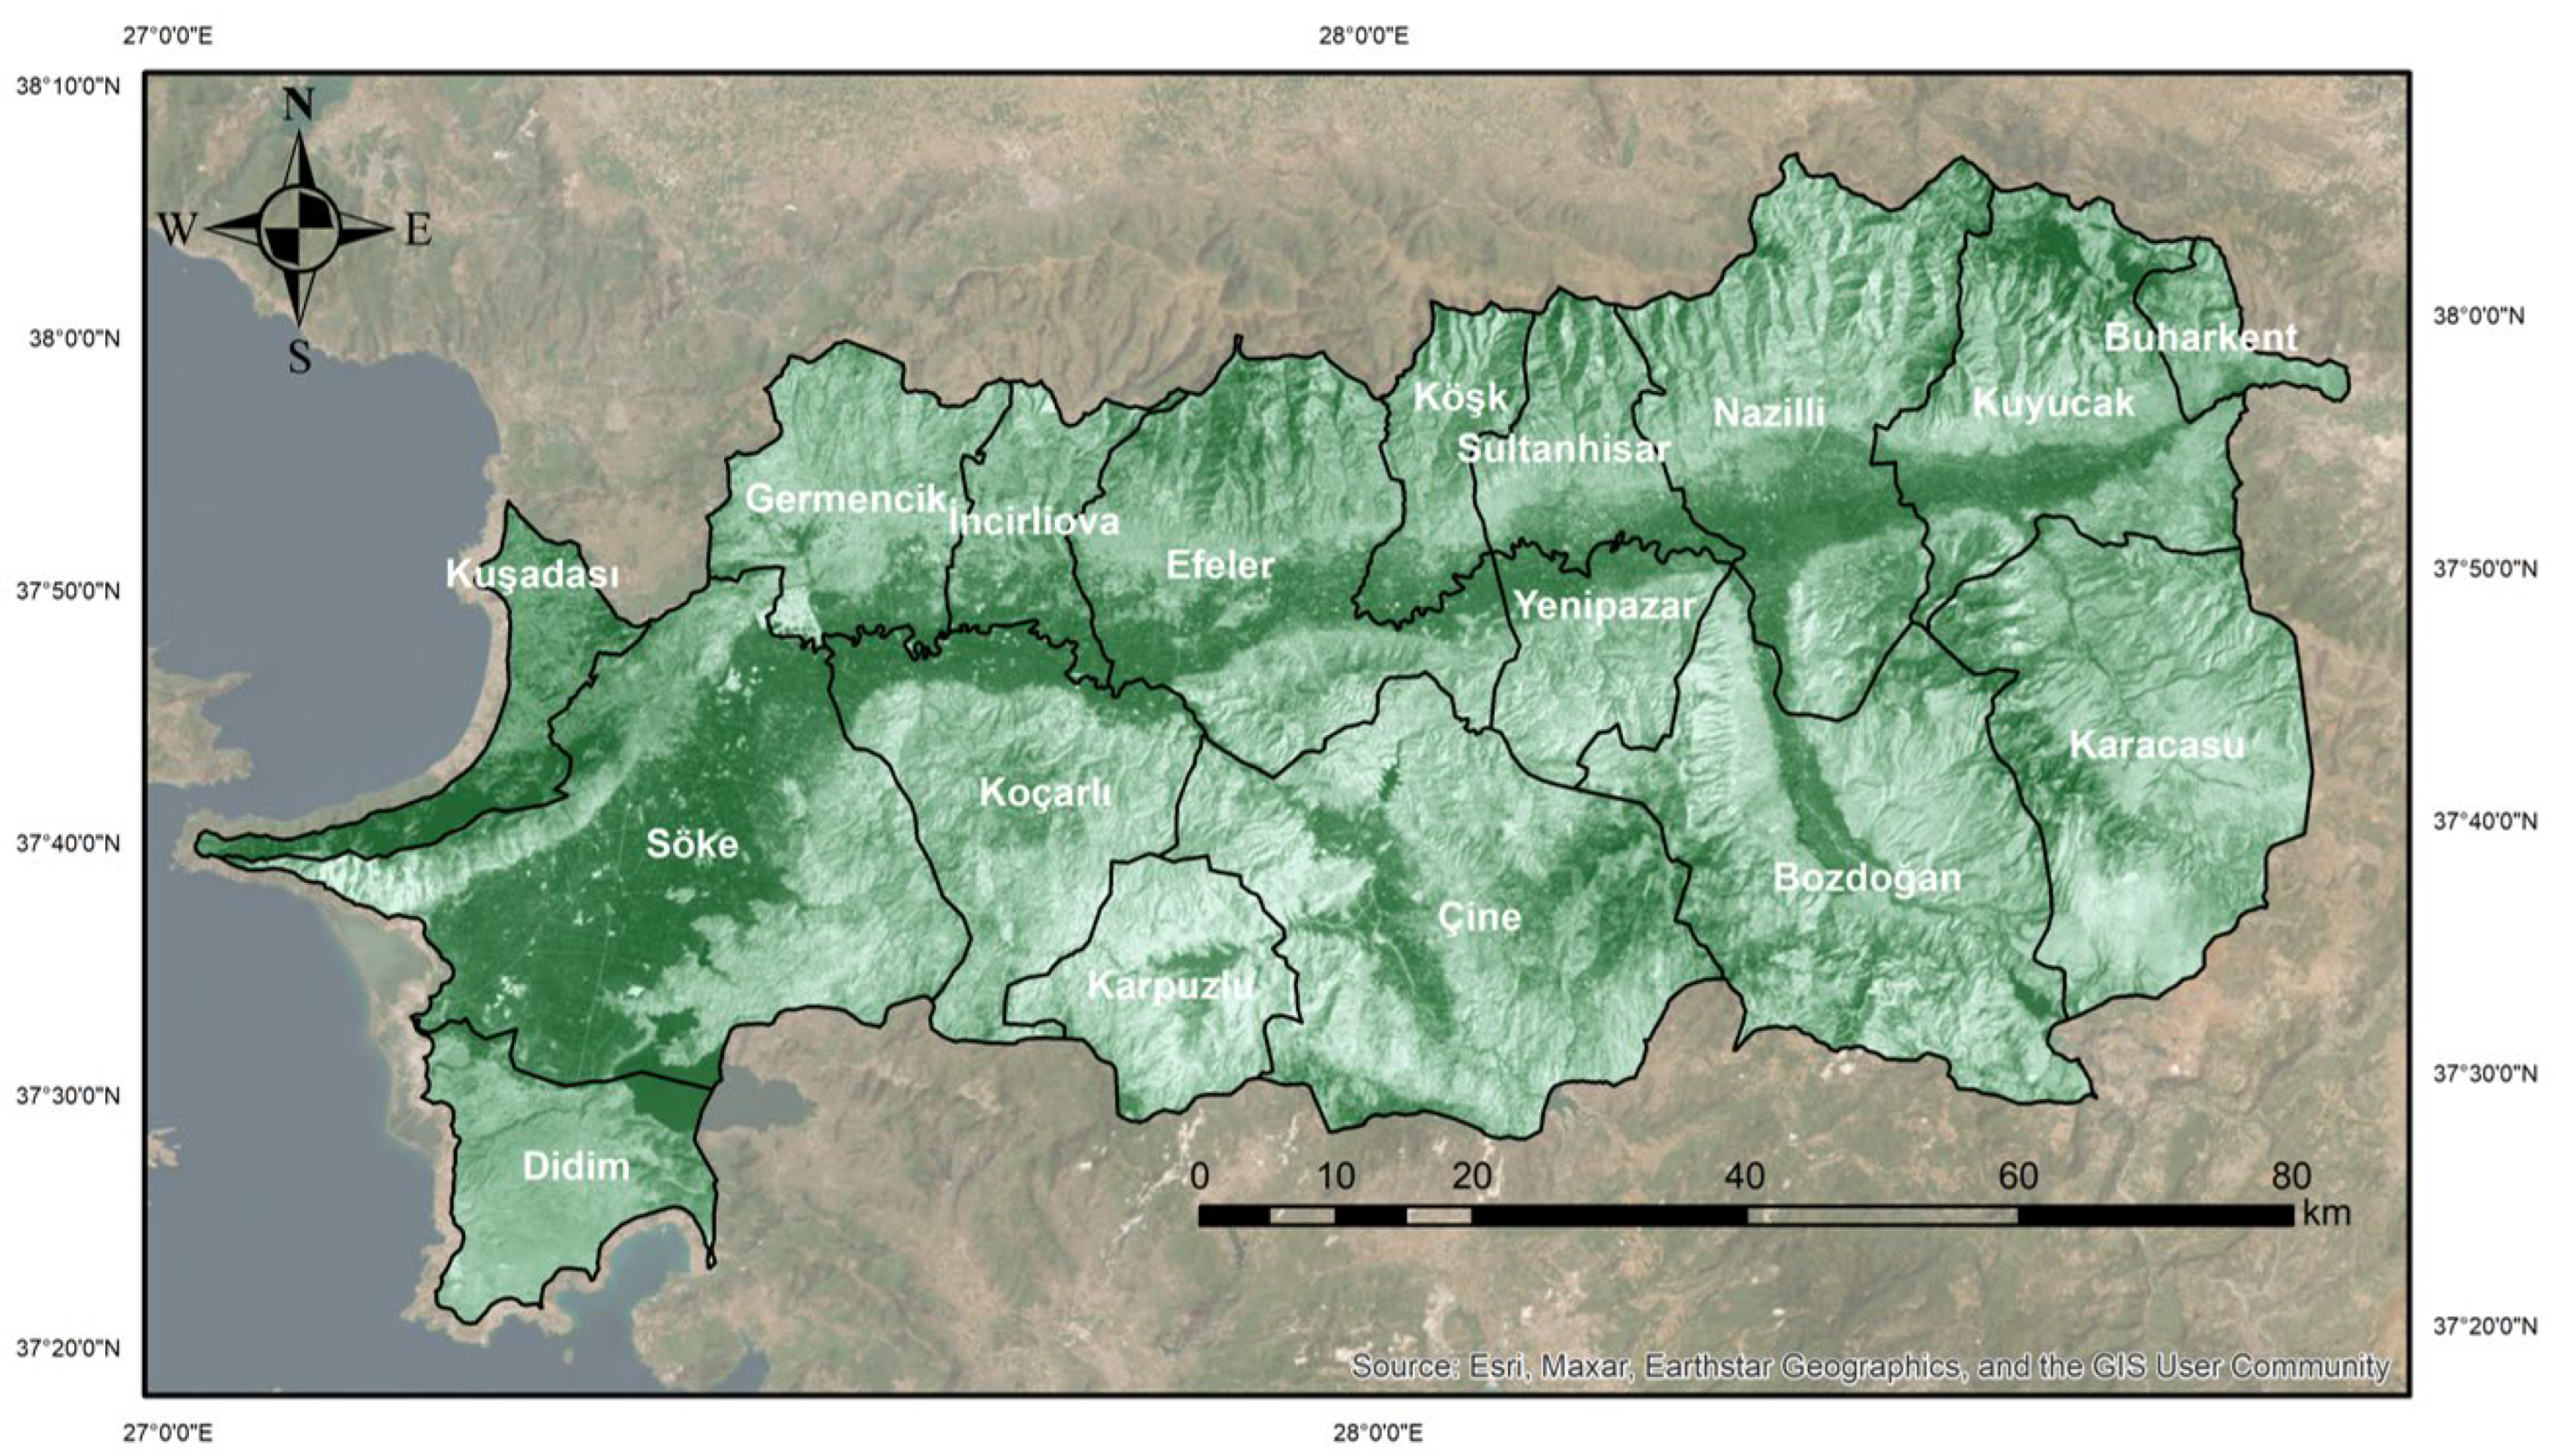
Figure 4 suggests that the increases were particularly consistent and widespread in the inland/east-southeast section (along the Çine–Bozdoğan–Karacasu line), while they remained more localized in the coastal–plain belt (along the Söke–Kuşadası–Didim line). When examining the distribution in 2020, it is observed that, compared to 1995, CVI has increased continuously and over large areas in the study area, particularly in the inner eastern and south-eastern elevation belt (Çine–Bozdoğan–Karacasu axis and Kuyucak–Koçarlı line), while increases in the coastal–plain belt (Söke–Kuşadası–Didim) remain more limited and localized. This spatial pattern suggests increases at the LULC level: mean values are rising across all classes (e.g., Forestland from 0.545 to 0.591, Shrubland from 0.367 to 0.470, Cropland from 0.466 to 0.552, Grassland from 0.340 to 0.445, Urban from 0.432 to 0.551). The decrease in the std value in natural/semi-natural classes (e.g., Forestland from 0.189 to 0.105; Shrubland from 0.141 to 0.090) indicates that vitality is concentrated within a more balanced range in these classes. The slight increase in std for the Urban LULC class (from 0.079 to 0.083) suggests that variations persist in this LULC class due to the impervious surface–green space ratio.
At the district level, the mean increased in most districts; for example, that in Karpuzlu increased from 0.26 to 0.43 (+0.17), that in Çine increased from 0.38 to 0.49 (+0.11), that in Bozdoğan increased from 0.39 to 0.49 (+0.10), that in Germencik increased from 0.41 to 0.51 (+0.10) and that in Söke increased from 0.56 to 0.65 (+0.09). A limited decrease from 0.66 to 0.63 is observed in Kuşadası. The decrease in std in many districts indicates that the increase in CVI has evolved into a more balanced spatial distribution. The increase in CVI along the forest gradient in high areas, together with local increases along the coastal–plain areas, indicates that productivity/vegetative vitality has strengthened more steadily in the interior and eastern regions.
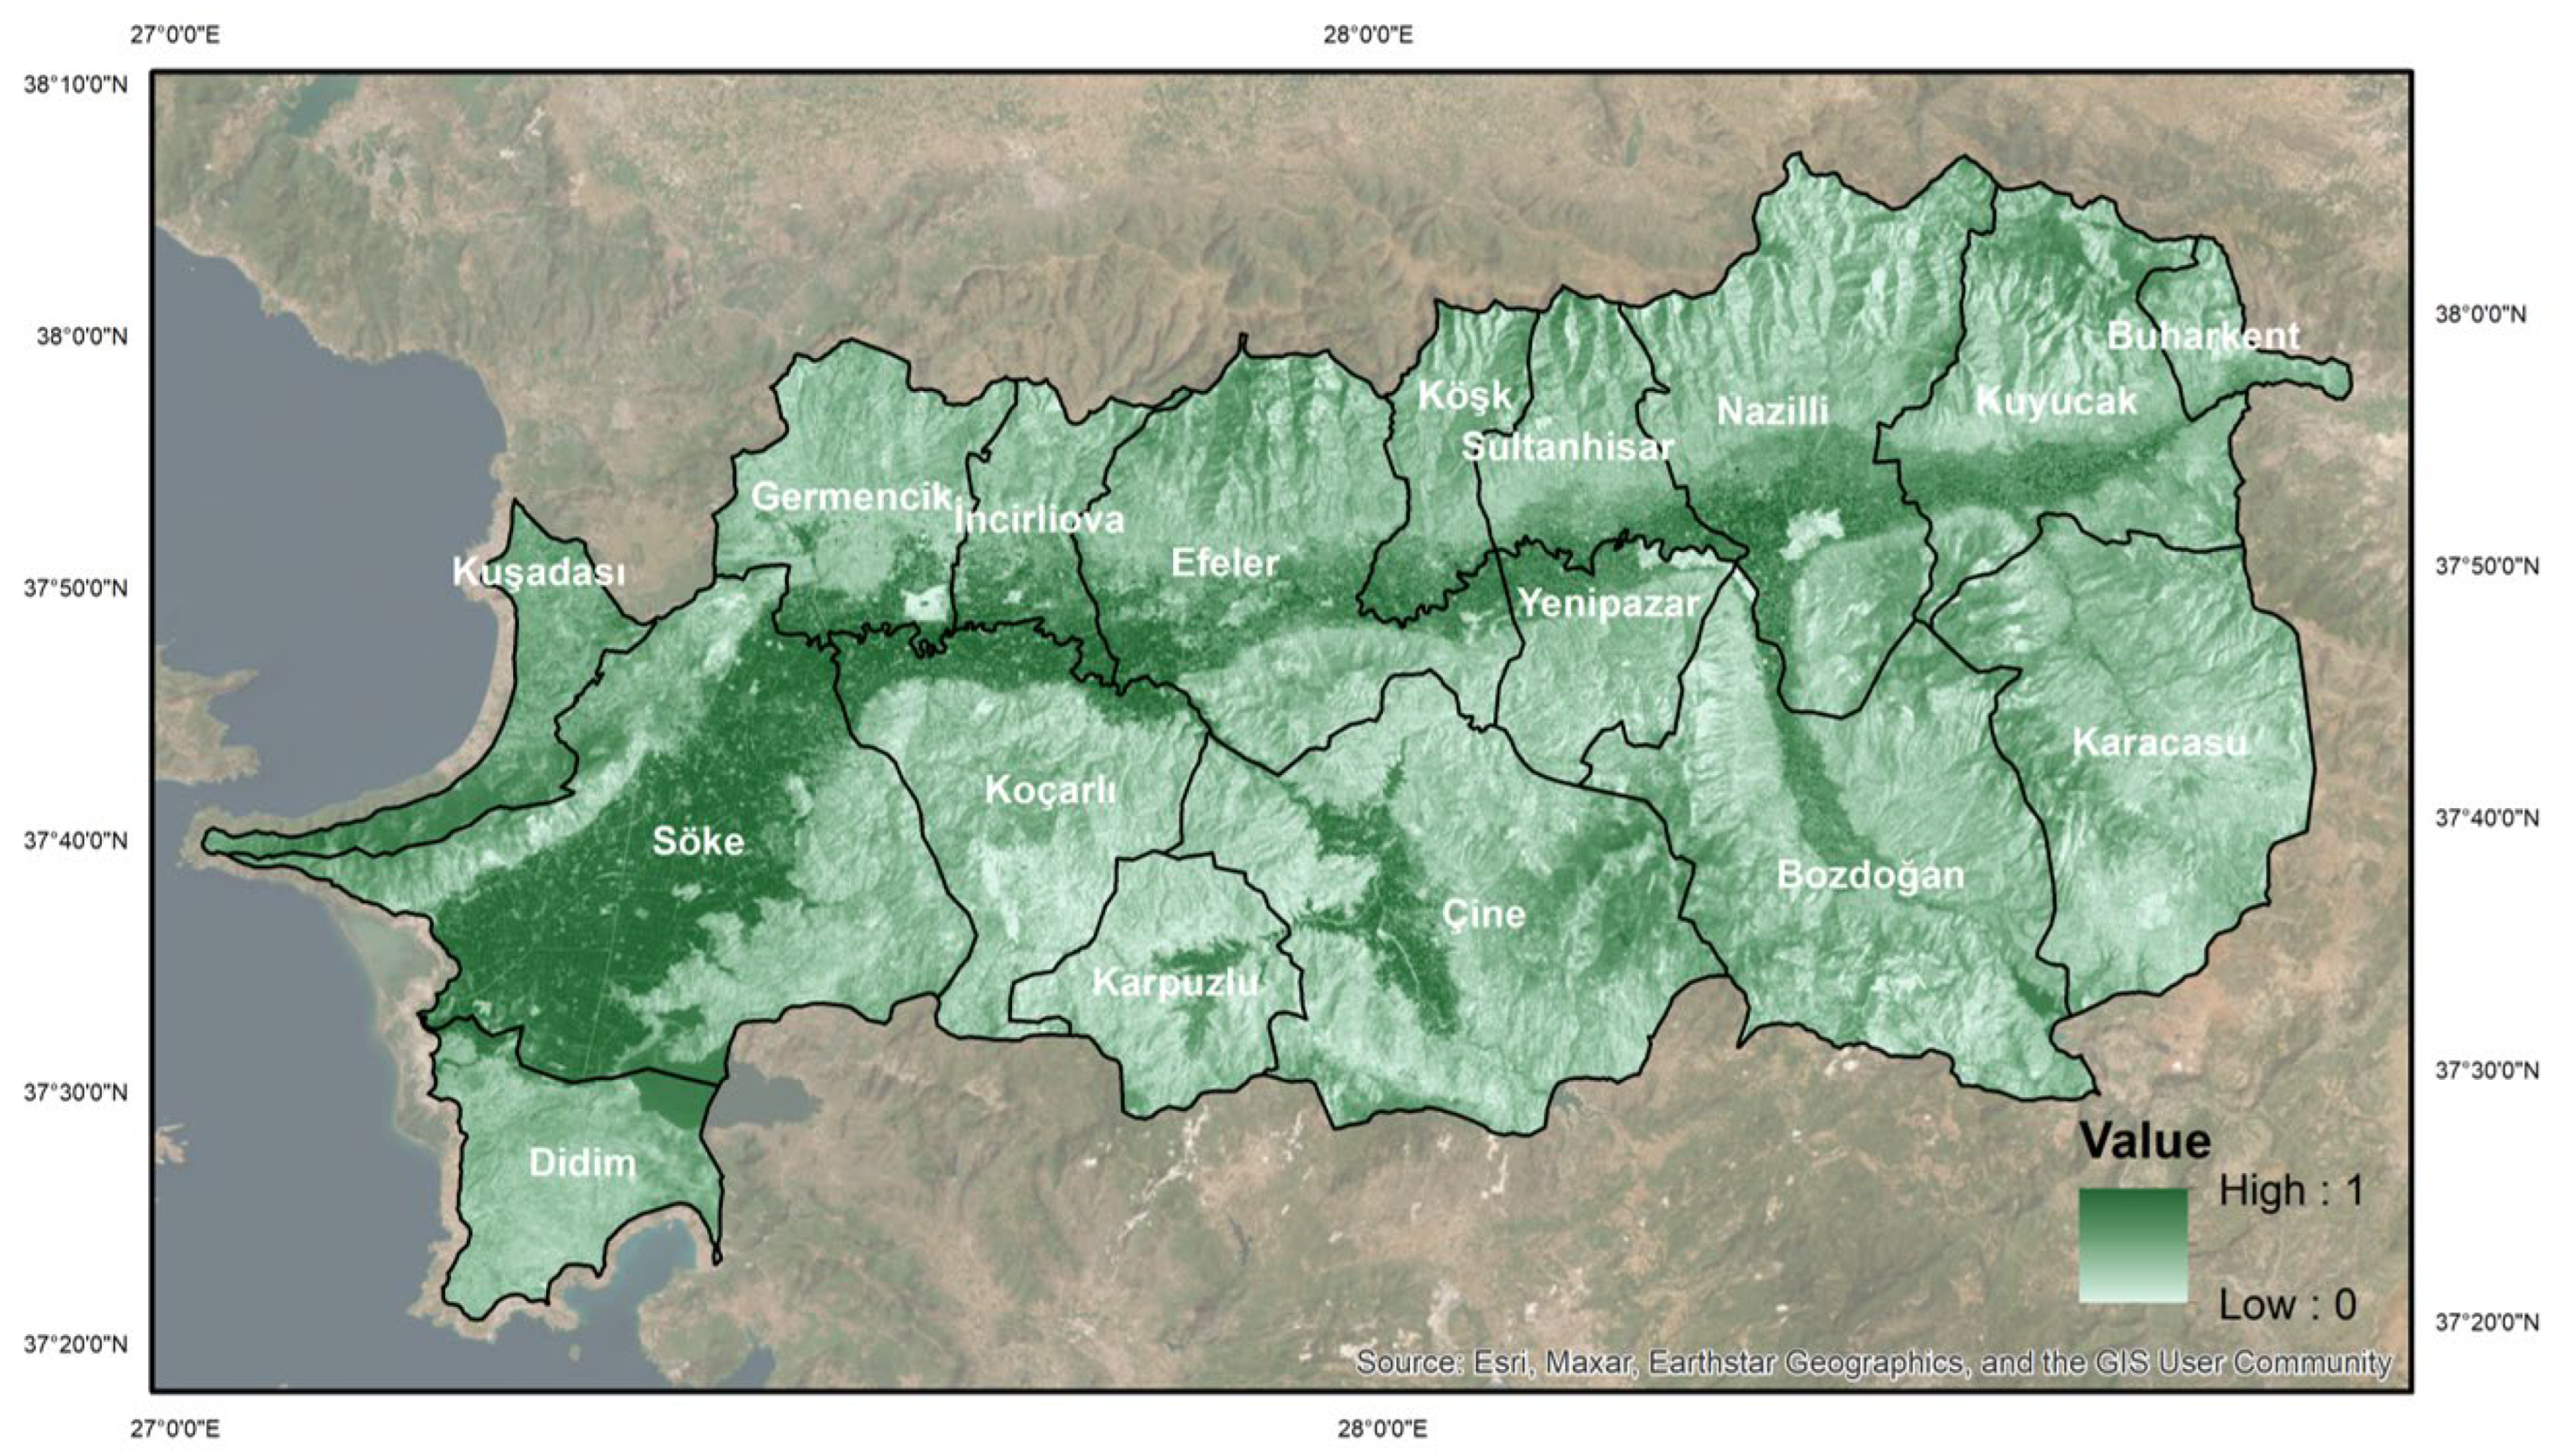
The organization represents the structural integrity, diversity, and connectivity of the landscape, capturing fragmentation/integration dynamics and providing clues about the ecosystem’s self-regulation capacity [61,62]. In 2020, it was observed that the Organization (O) was more stable in the central and eastern regions, while it showed a tendency to weaken in places in the coastal and plain areas (Figure 5). Changes in mean values at the LULC level are within small ranges and suggest sensitivity to LULC classes: Forestland demonstrates a slight decrease from 0.482 to 0.464, Shrubland displays a decrease from 0.470 to 0.462, the value for Grassland decreased from 0.532 to 0.523, and that for Urban areas decreased from 0.529 to 0.502. Meanwhile, the value for Bareland increased slightly from 0.512 to 0.514 and that for Water increased from 0.364 to 0.366. Std values experienced a slight decrease in most LULC classes. At the district level, the value for Buharkent increased moderately from 0.42 to 0.47, and that for İncirliova increased from 0.28 to 0.31. Kuşadası largely maintained the same level, rising from 0.49 to 0.50, and Söke and Bozdoğan experienced a slight decrease from 0.29 to 0.28 and from 0.51 to 0.50, respectively. This situation indicates that connectivity in the districts located in the coastal and plain areas of the study area is more fragile under pressure (urbanization and construction), while it exhibits a relatively stable structure in the inner and eastern regions. These limited and spatially sensitive changes in the Organization index indicate that fragmentation and loss of connectivity continue in the coastal and plain areas of the study area.
Resilience refers to a habitat’s capacity to resist/recover from the stresses it is exposed to [44,63]. When examining the distribution of resilience across the province, it suggests that the increase in resilience is particularly concentrated in the inner/east and south section (e.g., Karacasu, Nazilli, Kuyucak; partially Çine). In these areas, the low value bands have narrowed while the medium-high value zones have expanded (Figure 6). The mean R value for the 2020 distribution suggests that low resilience values have expanded in some regions and that there is a tendency towards weakening compared to 1995. At the LULC level, the value for Forestland decreased from 0.913 to 0.880, the value for Shrubland decreased from 0.821 to 0.778, that for Grassland decreased from 0.622 to 0.604, that for Unused land decreased from 0.637 to 0.588, and that for Water decreased from 0.925 to 0.788. Meanwhile, the value for Urban areas increased from 0.017 to 0.053, while that for Bareland increased from 0.082 to 0.147.
Here, the increase in the average R in the Urban LULC class during the 1995–2020 period indicates increases in the amount and density of green areas within the existing urban fabric in 2020. However, the increase in the std value also suggests that this improvement is spatially heterogeneous and that high and low R values coexist within the urban fabric. Furthermore, the rise in the std R values in many LULC classes (e.g., Shrubland from 0.138 to 0.172, Grassland from 0.133 to 0.188) indicates that the resilience distribution has become heterogeneous and is highly sensitive to local pressures (urbanization density). At the district level, the Resilience pattern shows a heterogeneous structure. Declines are more apparent in coastal and plain districts. These results are similar to the CVI index, suggesting that while Resilience in the study area is relatively stable in high-elevation forest areas, it weakens in coastal and plain regions.
When visually examined, REH levels in 2020 were significantly higher than in 1995 in the east-southeast region (particularly Karacasu, Bozdoğan, Kuyucak, and partially Çine), relatively low levels are observed in the coastal–plain regions (Kuşadası, Didim, Söke), while moderate increases are seen in the central districts (Efeler, İncirliova) (Figure 7).
However, the increase in REH is not spatially evenly distributed. While the increase in REH is widespread and continuous in the eastern and south-eastern districts, it exhibits a fragmented pattern in the coastal–plain belt. At the LULC level, the mean REH value displays an increase in most classes (e.g., Shrubland from 0.215 to 0.291, Grassland from 0.160 to 0.230, Forestland from 0.354 to 0.412, Cropland from 0.107 to 0.144, Unused from 0.194 to 0.248, Bareland from 0.022 to 0.058, Urban from 0.006 to 0.025), whereas the Water LULC class showed a slight decrease in REH. The decrease in REH std values in many LULC classes indicates that the improvement in REH has led to a more balanced distribution. At the district level, the mean REH value generally increased. For example, the mean REH values increased from 0.126 to 0.203 (+0.077) in Karpuzlu, from 0.151 to 0.224 (+0.073) in Yenipazar, from 0.182 to 0.251 (+0.069) in Çine, Bozdoğan from 0.191 to 0.257 (+0.066), Karacasu from 0.166 to 0.229 (+0.062), and Koçarlı from 0.172 to 0.227 (+0.055). The moderate decreases in the standard values of REH in 2020 indicate that high REH values have become spatially homogeneous.

3.3. Spatial Autocorrelation and Hotspot Analysis of REH

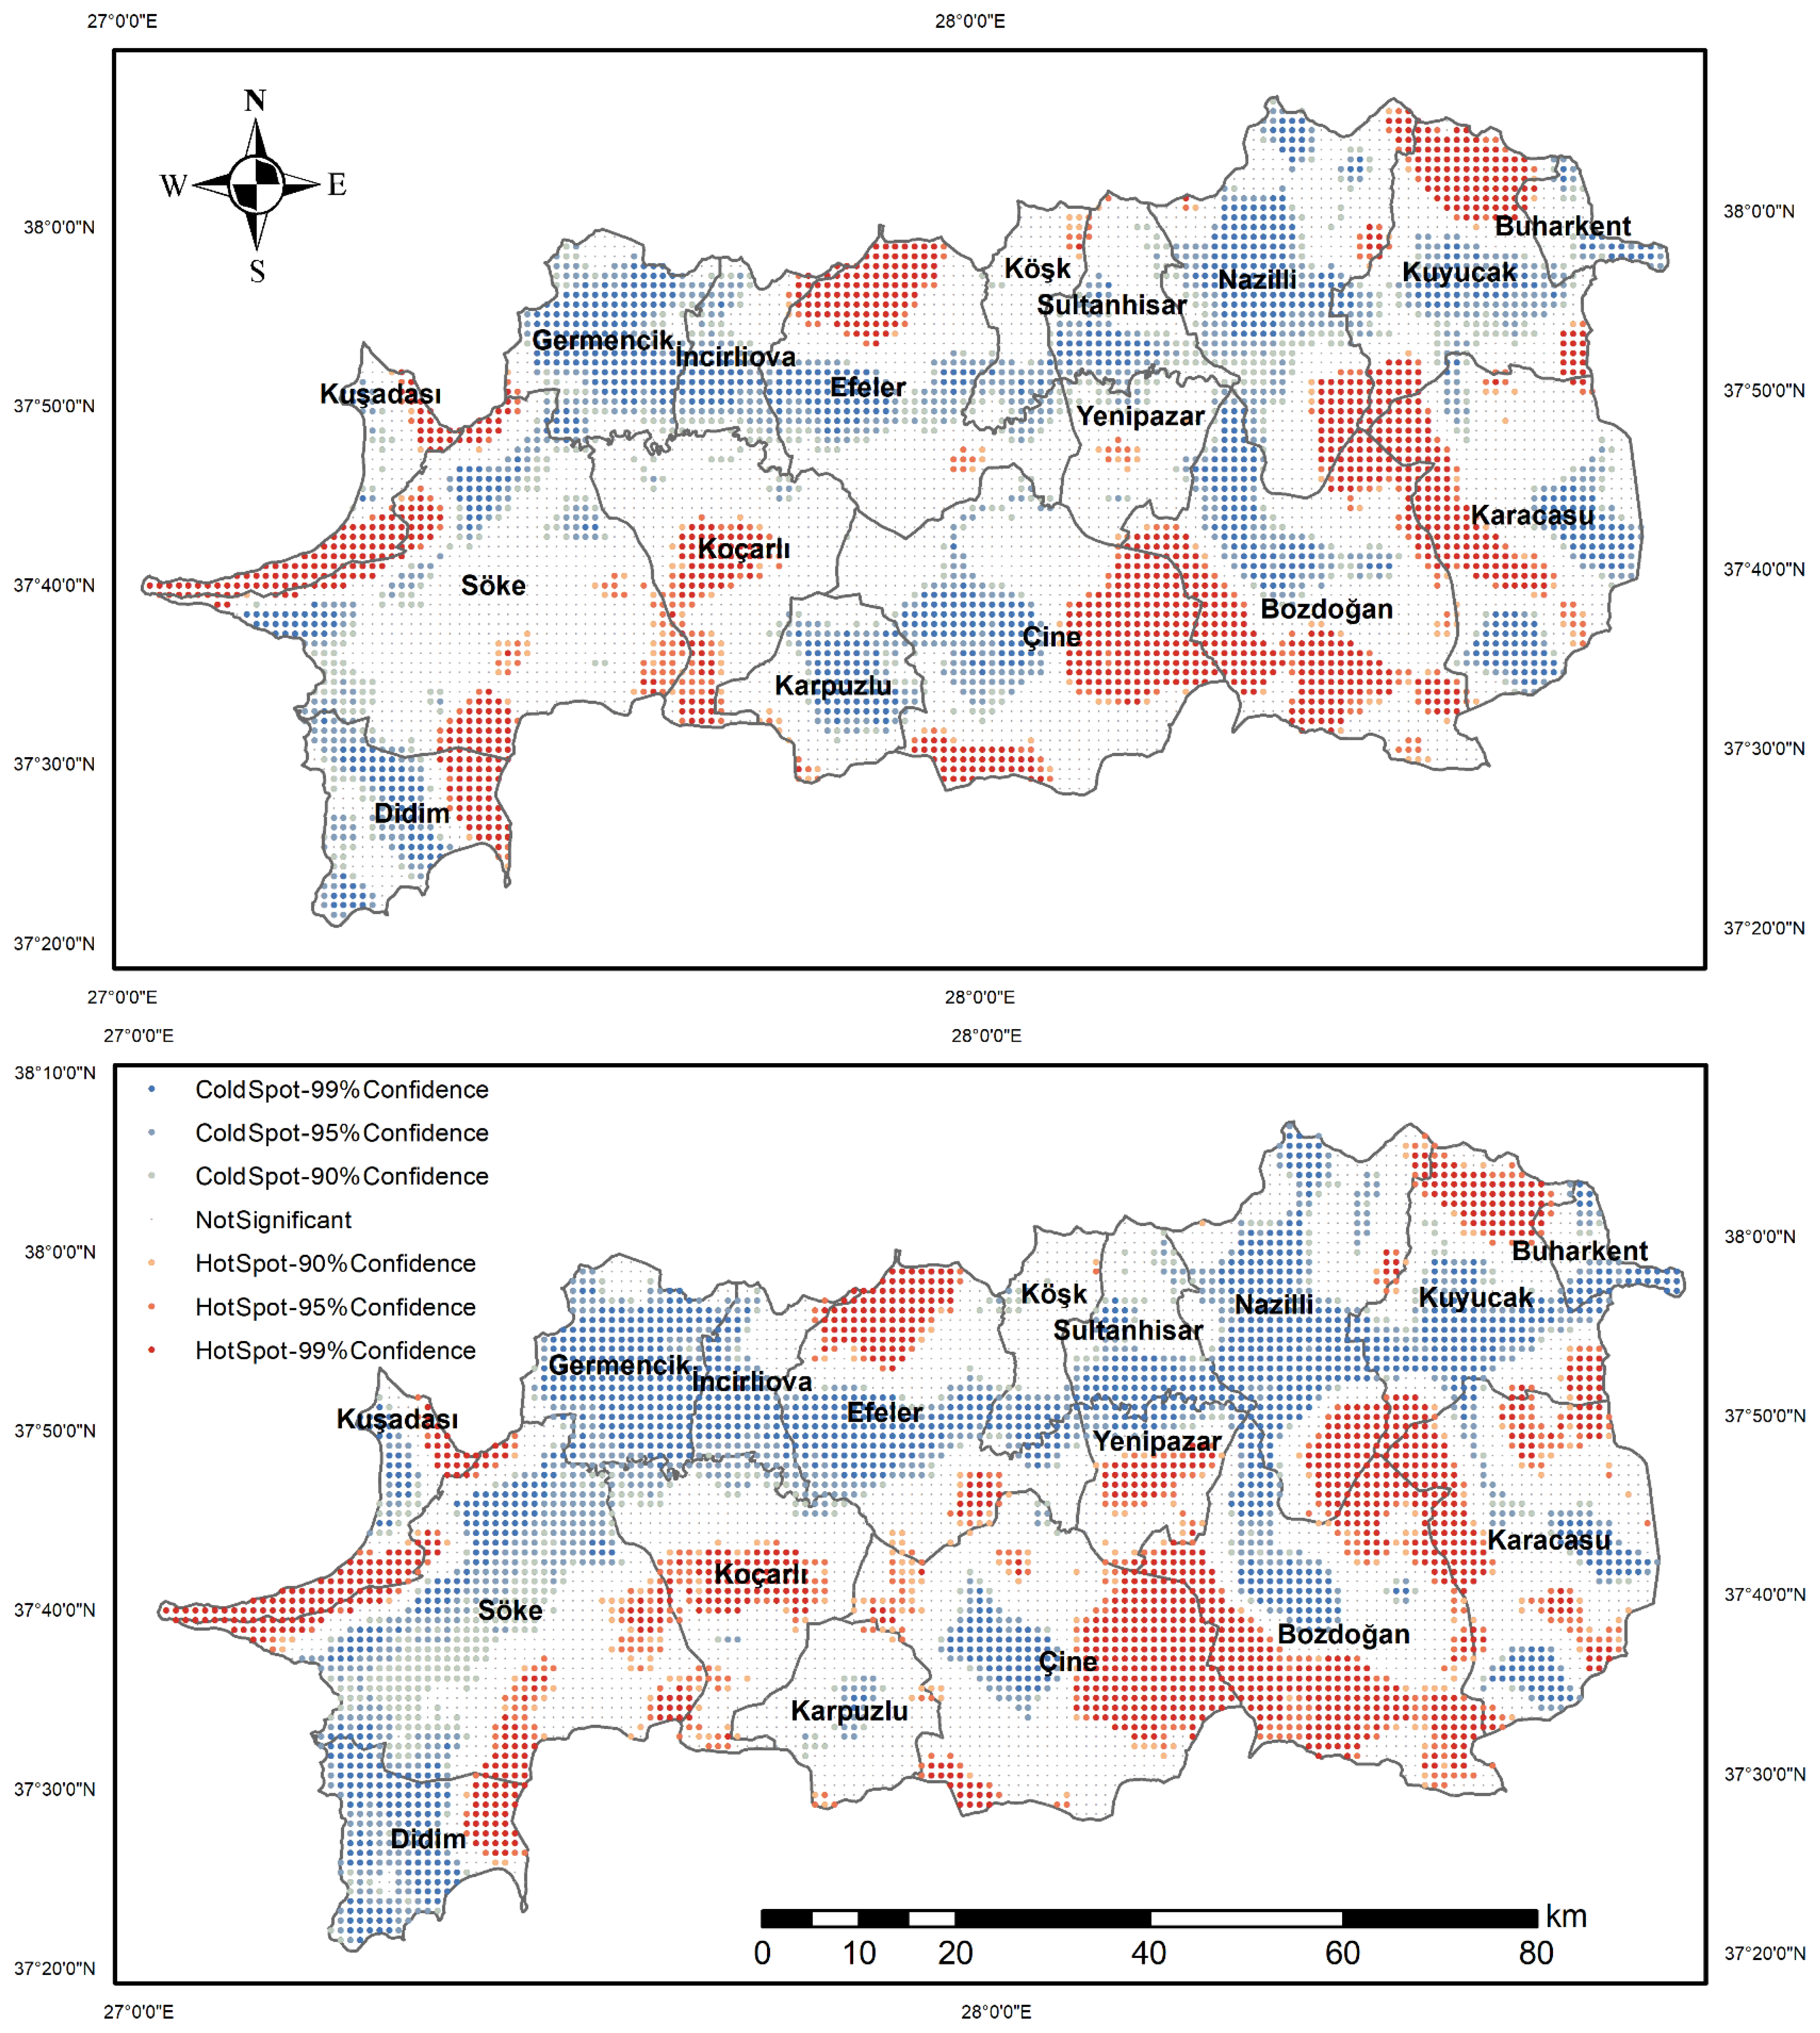
The Optimized Hotspot Analysis (Getis–Ord Gi*) maps for 1995 and 2020 depict blue tones as cold spots (low REH) and red tones as hot spots (high REH) at confidence levels of 90%, 95%, and 99% (Figure 8). In general, examining the Optimized Hotspot Analysis results alongside the Regional Ecosystem Health (REH) distributions for 1995 and 2020 reveals that ecological conditions have spatially reorganized across Aydın Province. Global Moran’s I confirmed that REH values exhibit a strongly clustered spatial pattern in both years (Moran’s I > 0.40, p < 0.001), demonstrating that the observed hotspots and coldspots are statistically meaningful and not the result of random spatial variation.
In 1995 (Figure 8, above), the REH level was low to medium across the province; however, large clusters of cold spots with high confidence levels were evident in the western coastal plains and central districts (Kuşadası, Söke, Didim, Efeler, İncirliova). These clusters show a pattern consistent with the pressures faced by these areas, such as tourism infrastructure and second home development, urban sprawl and transport network expansion, and intensive agriculture and industrial/mining activities. Despite its protected status, the accommodation–transport–real estate pressures developing around Dilek Peninsula National Park are increasing fragmentation in surrounding areas; in the Söke Plain, agricultural intensity and some mining-industrial facilities can be associated with habitat loss and Organization (O) weakness. These findings clearly reveal the ecological fragility of the western parts of the study area.
In 2020 (Figure 8, below), improvement is observed at the REH level across the province; hotspot clusters are expanding in the east-southeast. Karacasu, Bozdoğan, Kuyucak, and partially Çine and Koçarlı districts stand out as hotspot foci with a confidence level of 95–99%. These areas are characterized by higher elevation, more forest/shrub cover, and lower population density; the increase in CVI and the continuity of natural vegetation suggest the consistency of the rise in REH. While some districts in the west continue to be cold spots, the area and density of clusters are decreasing. For example, the more scattered coldspot pattern observed in Kuşadası and Germencik compared to 1995 indicates the possibility of a partial recovery. However, coldspot cores are preserved around Didim and southern Kuşadası, reflecting the ongoing effects of the increase in second homes, tourism-driven land conversion, and infrastructure expansion.
When comparing the years 1995–2020, the REH hotspot–coldspot pattern has been reorganized from coldspot dominance in low-altitude agricultural areas and peri-urban zones to hotspot continuity in the interior/eastern sections, where elevation and forest cover are more decisive. Although a numerical increase in REH was detected in many central districts, this increase did not always exceed the statistical clustering threshold, suggesting that the improvement remained patchy and sensitive to local LULC dynamics. When all these are evaluated together with the REH components, the increase in CVI supports hotspots in the eastern part; while the declines in the Resilience (R) and Organization (O) components contribute to coldspot continuity, especially in coastal–plain districts. Transformations from natural/semi-natural LULC classes to LULC classes with intense human impact in the study area (conversions from forest and shrub cover to agricultural land, increases in urban areas) explain this spatial differentiation.

4. Discussion

4.1. Comparison with Similar Studies

This study presents a comprehensive spatial assessment of Regional Ecosystem Health (REH) in the case of Aydın Province, located within the complex Mediterranean landscape shaped by agricultural expansion, tourism and urbanization. Based on the Vigor–Organization–Resilience (VOR) framework and supported by remote sensing vegetation vigor (NDVI) indicators, landscape metrics, and habitat quality modeling, the temporal and spatial patterns of ecological conditions were examined over the period 1995–2020 in Aydın Province. In general, our findings revealed improvements in ecosystem Vigor (V), while Resilience (R) remained generally stable but exhibited slight declines in natural and semi-natural areas exposed to intensive human and climatic pressures. This pattern indicates that vegetation vitality and productivity increased across Aydın Province, particularly in agricultural zones such as the Söke and Koçarlı plains, as well as in expanding urban green spaces in districts like Efeler and Nazilli, mainly due to irrigation-supported farming systems and the development of enhanced green infrastructure. However, in natural and semi-natural landscapes, including the forested highlands of Bozdoğan and Karacasu and the shrub-dominated areas of Çine and Yenipazar, Resilience declined as a result of habitat fragmentation and land use conversion. Despite relatively high REH values in coastal and peri-urban districts such as Kuşadası, Didim, and Söke, fragmentation and reduced resilience were noted due to tourism-driven construction and second-home developments. These contrasting spatial dynamics underline a divergence between ecological Vigor and Resilience; while managed landscapes demonstrate enhanced vegetation performance, the adaptive capacity of natural ecosystems continues to weaken under combined anthropogenic and climatic stressors.
The spatial patterns found in Aydın Province align with recent studies conducted in the Mediterranean region. Prior studies in the Mediterranean region highlight that land use pressures and topographical variations are the principal factors influencing ecological stress [64,65]. For example, it has been reported that urbanization density and the development of new settlement areas in the Mediterranean basins of Italy increase the risk of desertification, and in Spain, topographical diversity and drought dynamics shape forest sensitivity. In this regard, whilst Appiagyei et al. [66] claimed that urbanization and agricultural abandonment adversely impact forest ecosystem services, Ruiz & Sanz-Sánchez [67] indicated that even minor land alterations in LULC can induce long-term ecological responses in the landscape. The findings suggest that the alterations in REH in Aydın Province correspond with both local and extensive structural dynamics across the Mediterranean.

4.2. Methodological Interpretation and Ecological Insights

The impact of land use changes on ecosystem health is one of the most striking aspects of this study. Despite high agricultural productivity, particularly in the Söke–Aydın plain, a gradual decline in ecological resilience has been observed due to the combined effects of monoculture farming, land use conversion, and mining activities. This situation corresponds to the general trend observed in the flat and low-altitude areas of the Mediterranean, where excessive human activity in coastal areas increases ecosystem fragmentation, and in high-altitude regions, the continuity of natural cover provides higher resilience [30]. Similarly, the topographical buffering effect of high-altitude forested areas in Aydın Province, together with low land use intensity, has resulted in stable ecological conditions. These findings confirm that while agricultural intensification and the development of managed landscapes contribute to higher vegetation vigor and productivity, they do not necessarily enhance the system’s long-term resilience. Instead, natural and semi-natural ecosystems have become increasingly vulnerable to structural degradation under continuous anthropogenic and climatic pressures.
Interestingly, the results revealed a divergence between the Vigor (V) and Resilience (R) components in forested and semi-natural landscapes. In forest ecosystems, V increased from 0.545 to 0.591, whereas R declined from 0.913 to 0.880 between 1995 and 2020. This “high output–low resilience” pattern suggests that while vegetation vitality and productivity strengthened, the structural stability of forest ecosystems weakened. The Vigor (V) indicator in this study was derived from a Composite Vigor Index (CVI) based on Landsat derived indicators (FVC, GVMI, VTCI, and NDBSCI), integrating vegetation cover, moisture status, surface temperature, and soil conditions to provide a holistic measure of ecosystem vitality. Therefore, the observed increase in V primarily reflects enhanced photosynthetic activity and biophysical vitality-likely influenced by vegetation densification, favorable climatic conditions, and moderate regrowth processes.
In contrast, the decline in Resilience (R), estimated using the InVEST Habitat Quality (HQ) model, indicates that although forest areas maintained biological productivity, they experienced increased habitat fragmentation, edge expansion, and human disturbance-factors that reduce landscape connectivity and recovery potential. This imbalance reflects a typical “high productivity–low stability” trade-off, wherein short-term ecosystem vigor improves under favorable biophysical conditions, but long-term resilience declines due to structural degradation. Quantitatively, this pattern is particularly visible in Forest and Shrubland ecosystems, where vigor (V) increased from 0.545 to 0.591 in Forests and from 0.367 to 0.470 in Shrublands, while Resilience (R) concurrently declined from 0.913 to 0.880 and from 0.821 to 0.778, respectively (Table 4). These numerical shifts illustrate that productivity gains were achieved at the cost of structural stability. Although enhanced vegetation greenness boosted the V component, the simultaneous decline in R suggests that these gains occurred alongside increasing fragmentation and reduced landscape connectivity. This quantitative divergence substantiates the emergence of a ‘high output–low stability’ ecological state, where productivity masks underlying fragility. Consequently, these ecosystems become highly sensitive to single extreme events such as drought or heat stress under ongoing climate change. Such patterns emphasize that anthropogenic and climatic pressures can enhance vegetation vitality while simultaneously eroding the adaptive capacity of natural systems.
In terms of the components of REH, the increase in the Vigor (V) indicator reflects an overall enhancement in vegetation vitality and productivity, driven not only by agricultural expansion but also by the establishment of new urban green spaces and irrigated cropland systems. This upward trend in Vigor, however, coincides with stagnation or decline in the Organization (O) and Resilience (R) components displayed a generally stable but slightly declining trend, particularly in natural and semi-natural areas where habitat fragmentation, forest degradation, and drought stress are prominent. This divergence suggests that while productivity and vegetation greenness improved through human management, the structural integrity and adaptive capacity of natural ecosystems have been compromised. This pattern emphasizes that higher Vigor does not necessarily translate into stronger ecological Resilience, highlighting the importance of maintaining ecosystem Organization for long-term stability. This situation highlights that increased productivity does not always strengthen ecological resilience. In their study conducted in Fuzhou, Bao et al. [23] found that higher REH values were associated with more stable forest patches and lower fragmentation rates. This comparison explains why the findings in Aydın suggest particularly low resilience in coastal and peri-urban areas as high fragmentation in these areas leads to a decrease in REH. Therefore, the patterns observed in this study represent an inverse manifestation of the “ecological integrity–resilience” relationship reported in the literature: the Aydın example illustrates how ecosystem health deteriorates in disconnected and intensively pressured landscapes. Consequently, REH assessments must simultaneously consider not only productivity indicators but also spatial connectivity and ecological organization indicators [68].
Hotspot analysis clearly revealed the spatial restructuring of ecosystem health. The spatial clustering detected by Moran’s I is strongly aligned with underlying land use dynamics, where hotspot formation is primarily driven by natural cover continuity in high-elevation forest-shrub mosaics, while coldspots are associated with intensive urbanization, tourism development and agricultural expansion across coastal plains, clearly indicating that REH spatial patterns emerge as a direct interaction of topographic resilience and human-induced fragmentation. Coldspots concentrated in coastal areas in 1995 had transformed into hotspots at higher altitudes by 2020. This situation suggests that, despite ongoing pressures in coastal areas, ecosystem resilience has strengthened in mountainous areas. Furthermore, studies conducted in the Mediterranean context have found that pressures, particularly in coastal areas, reduce ecological performance, while ecological values remain relatively stable in inland and upland areas. For example, Martínez-Sastre et al. [27] indicated that coastal areas under intense agricultural and tourism pressure in Mediterranean landscapes in Spain are characterized with a decline in ecosystem service production, while inland areas showed improvements with higher vegetation continuity. In addition to this, Kesgin Atak & Ersoy Tonyaloğlu [30] found that while high-altitude forest areas support ecological stability, coastal plains suffer from increasing fragmentation with decreasing ecological stability in Izmir, Türkiye.
In line with these findings, Kesgin and Nurlu (2009) [69] identified pronounced land cover transformations along the coastal zone of Çandarlı Bay, northern İzmir/Türkiye where semi-natural and agricultural lands were rapidly converted to urban and olive plantation areas between 1990 and 2005. This regional pattern further supports the observed coastal–inland divergence in Aydın, indicating that urban expansion and agricultural intensification across Aegean coastal plains have consistently reduced ecosystem stability over the past three decades. Together, these studies indicate that the spatial shift observed in Aydın is not only local but part of a broader ecological restructuring trend characteristic of Mediterranean landscapes.
Comparable spatial patterns were also reported by [70] in the Gediz Mainstream Sub-Basin, another Mediterranean landscape in western Türkiye. Their analysis of Landscape Ecological Risk (LER) between 1992 and 2022 revealed that high-risk (HH) clusters expanded markedly due to forest and grassland fragmentation, while low-risk (LL) zones contracted in agricultural plains. These results corroborate the present study’s findings, demonstrating that increasing landscape heterogeneity and patch fragmentation are common drivers of rising ecological risk and declining resilience across Aegean basins. The quantitative divergence between V and R indicates that increasing ecosystem vigor does not necessarily translate into improved ecosystem health. Rather, the growing spatial variability of resilience (R std increased from 0.133 to 0.152 in Forests, 0.138 to 0.172 in Shrublands, and 0.133 to 0.188 in Grasslands) and the high output/low stability trade-off together expose a critical ecological risk-the substitution of short-term vitality for long-term stability. Therefore, these results suggest that measures to reduce the vulnerability of coastal areas should be prioritized in future ecological planning.
Additionally, the 15.61% decrease observed in forest areas constitutes one of the most substantial land cover changes during the study period. The conversion of approximately 6690 ha of Forest to Shrubland and 4860 ha to Cropland indicates a combination of natural degradation processes (e.g., fire, erosion, and grazing) and direct anthropogenic pressures such as agricultural expansion [25,71]. These transformations have fragmented forest structure and reduced landscape connectivity, which is reflected in the slight decline in the Organization (O) and Resilience (R) components (Table 4). The rise in the amount of secondary Shrubland in former Forest zones suggests partial vegetation recovery; however, it also signals a shift toward more heterogeneous and less stable ecosystems, where short-term vigor increases while long-term stability weakens. Consequently, ecosystem health in these areas depends increasingly on management intensity and land-use regulation rather than natural self-regulation.
Our findings suggest that differences in REH conditions do not only stem not from LULC changes and topography but also from socio-economic dynamics. Human-induced factors like tourism-driven land transformations, speculative housing developments, and unequal access to ecosystem services are significant for limiting ecological resilience in Aydın Province. Similar trends have been observed in other regions of the Mediterranean, where urban sprawl and intensive agriculture weaken landscape integrity and increase vulnerability [66,67]. In this context, it is necessary to develop spatial planning strategies that preserve ecological sensitivity and balance local development pressures. These socio-ecological differences suggest that one-dimensional approaches are insufficient for assessing ecosystem health. As land use pressures, topographical diversity and socio-economic processes progress in an interconnected manner, REH must be addressed holistically. At this point, methodological approaches that combine the components of ecological vigor, structural integrity, and system resilience within the same framework enable more accurate representation of complex human-nature interactions. In this regard, one of the strongest aspects of this research is its evaluation of REH from a multidimensional perspective by integrating the VOR framework with remote sensing data, landscape metrics, and habitat quality modeling. This integrated approach presents a feasible, flexible, and cost-effective method, particularly in data-constrained Mediterranean regions [30].

4.3. Research Limitations and Future Directions

Beyond these ecological insights, several methodological and practical limitations should also be acknowledged to contextualize the scope and future directions of this research. It should be noted that while the use of 30 m remote sensing and landscape metrics offers strong feasibility for regional-scale ecological decision support, future research could benefit from high-resolution data, participatory socio-ecological indicators, and scenario-based policy simulations to enhance the planning relevance and predictive capacity of REH assessments [72].
While the InVEST Habitat Quality (HQ) model has proven valuable for assessing resilience spatially, it primarily represents the biophysical dimension of resilience, that is, the capacity of ecosystems to maintain structural integrity under anthropogenic and climatic pressures. This conceptual link has been supported in previous studies [16,23,60,73], where HQ was interpreted as a spatial proxy for resilience because it integrates land use intensity, threat proximity, and the sensitivity of ecosystems to disturbance. In this study, HQ reflects how fragmentation, degradation, and habitat loss reduce an ecosystem’s ability to resist and recover from stress, aligning with the ecological definition of resilience as the maintenance of structure and function under pressure.
However, HQ does not fully encompass the socio-ecological and adaptive dimensions of resilience such as feedback mechanisms, adaptive management, or community level adaptation. Therefore, the interpretation of resilience here should be understood as a structural functional approximation, rather than a complete expression of ecological adaptability. Future research could integrate HQ-based resilience metrics with socio-ecological indicators or dynamic modeling approaches to capture the broader, adaptive nature of resilience at both local and regional scales.
Future research should further advance this framework by directly integrating explicit socioeconomic drivers into the assessment. While land use/land cover (LULC) transitions inherently reflect human-induced pressures such as tourism-driven urban expansion, agricultural intensification, and speculative land development, future studies could incorporate spatially explicit models such as Geographically Weighted Regression (GWR) to quantitatively disentangle how these drivers differentially influence REH across space. This would provide a more precise attribution of ecosystem health variations to socio-economic trajectories.
In addition, increasing the temporal frequency of assessment by incorporating intermediate years (e.g., 2005, 2015) would allow the detection of short-term ecological fluctuations that may be linked to rapid policy changes, infrastructural expansion, or climatic anomalies. Such higher temporal granularity would strengthen the explanatory depth of REH trend interpretation and enhance the early-warning capacity of ecosystem health monitoring systems.

5. Conclusions

By revealing the spatial and temporal dynamics of ecosystem health in Aydın Province between 1995 and 2020, this study confirmed the characteristic Mediterranean contrast between coastal and mountainous landscapes. Our results showed that while ecosystem Vigor (V) and Resilience (R) indicators improved in high-altitude forest areas, the Organization (O) component weakened across coastal and peri-urban zones. This divergence reflects a pattern of high productivity yet declining stability, indicating that human-induced vegetation enhancement does not necessarily support ecological resilience.
Methodologically, this research advances regional ecosystem health (REH) as assessment by integrating the Vigor–Organization–Resilience (VOR) framework with remote sensing metrics and the InVEST Habitat Quality (HQ) model. The HQ-based estimation of resilience provides a robust biophysical proxy that captures structural degradation and recovery potential under anthropogenic and climatic pressures, while its conceptual boundaries—mainly the omission of adaptive socio-ecological dimensions—are explicitly acknowledged. This multidimensional integration enhances the interpretability of REH across Mediterranean landscapes characterized by high environmental heterogeneity and data limitations.
Practically, the results emphasize the need for differentiated strategies across landscape types:
  • In coastal areas, where fragmentation and ecological sensitivity are high, planning should focus on strengthening green infrastructure, habitat connectivity, and ecological zoning to mitigate vulnerability.
  • In mountainous and forested regions, conservation of landscape integrity and ecosystem continuity is essential to sustain long-term resilience and ecosystem service stability.
The REH-based spatial evidence developed in this study offers a decision-support tool for landscape-scale planning, climate adaptation, and ecological restoration, aligning with the priorities of the EU Biodiversity Strategy [74] and IPBES [25] reports. Hotspot and coldspot identification provides actionable guidance for prioritizing restoration in degraded lowland areas and conserving high-value ecological corridors in upland zones.
Future work should further refine this framework by incorporating higher temporal resolution data, socio-economic indicators, and spatially explicit modeling (e.g., GWR or CA-Markov-InVEST hybrids) to capture short-term ecological fluctuations and feedback mechanisms. In doing so, REH assessments can evolve from diagnostic tools into dynamic systems capable of guiding adaptive landscape governance. Hence, the Aydın case provides not only a regional analysis but also a transferable methodological model for climate-sensitive Mediterranean ecosystems.

Author Contributions

Conceptualization, B.K.A. and E.E.T.; methodology, B.K.A. and E.E.T.; software, E.E.T.; validation, B.K.A. and E.E.T.; formal analysis, E.E.T.; investigation, B.K.A. and E.E.T.; data curation, E.E.T. and B.K.A.; writing—original draft preparation, B.K.A. and E.E.T.; writing—review and editing, B.K.A. and E.E.T.; visualization, E.E.T. and B.K.A. All authors have read and agreed to the published version of the manuscript.

Funding

This research received no external funding.

Institutional Review Board Statement

Not applicable.

Informed Consent Statement

Not applicable.

Data Availability Statement

The data presented in this study are available upon request from the corresponding authors.

Conflicts of Interest

The author declares no conflicts of interest.

Abbreviations

The following abbreviations are used in this manuscript:
REHRegional Ecosystem Health
VORVigor–Organization–Resilience
CVIComprehensive Vigor Index
FVCFractional Vegetation Coverage
GVMIGlobal Vegetation Moisture Index
VTCIVegetation Temperature Condition Index
NDBSCINormalized Difference Build-up & Bare Soil Index
LCLand Cover
ESAEuropean Space Agency
InVESTIntegrated Valuation of Ecosystem Services.

References

  1. Lu, X.; Jiang, H.; Zhang, X.; Jin, J. Relationship between nitrogen deposition and LUCC and its impact on terrestrial ecosystem carbon budgets in China. Sci. China Earth Sci. 2016, 59, 2285–2294. [Google Scholar] [CrossRef]
  2. Hernández-Blanco, M.; Costanza, R.; Chen, H.; De Groot, D.; Jarvis, D.; Kubiszewski, I.; Montoya, J.; Sangha, K.; Stoeckl, N.; Turner, K.; et al. Ecosystem health, ecosystem services, and the well-being of humans and the rest of nature. Glob. Change Biol. 2022, 28, 5027–5040. [Google Scholar] [CrossRef]
  3. Millennium Ecosystem Assessment (MEA). Ecosystems and Human Well-Being: Synthesis; Island Press: Washington, DC, USA, 2005. [Google Scholar]
  4. Wu, J. Landscape sustainability science: Ecosystem services and human well-being in changing landscapes. Landsc. Ecol. 2013, 28, 999–1023. [Google Scholar] [CrossRef]
  5. World Health Organization (WHO). Connecting Global Priorities: Biodiversity and Human Health—A State of Knowledge Review; WHO: Geneva, Switzerland, 2015; Available online: https://apps.who.int/iris/bitstream/handle/10665/174012/9789241508537_eng.pdf (accessed on 15 February 2025).
  6. Corvalan, C.; Hales, S.; McMichael, A.J. Ecosystems and Human Well-being: Health Synthesis; World Health Organization: Geneva, Switzerland, 2005. [Google Scholar]
  7. Abraham, A.; Sommerhalder, K.; Abel, T. Landscape and well-being: A scoping study on the health-promoting impact of outdoor environments. Int. J. Public Health 2010, 55, 59–69. [Google Scholar] [CrossRef] [PubMed]
  8. Thompson, C.W. Linking landscape and health: The recurring theme. Landsc. Urban Plan. 2011, 99, 187–195. [Google Scholar] [CrossRef]
  9. Hansmann, R.; Hug, S.M.; Seeland, K. Restoration and stress relief through physical activities in forests and parks. Urban For. Urban Green. 2007, 6, 213–225. [Google Scholar] [CrossRef]
  10. Ward Thompson, C.; Aspinall, P.A. Natural environments and their impact on activity, health, and quality of life. Appl. Psychol. Health Well-Being 2011, 3, 230–260. [Google Scholar] [CrossRef]
  11. De Groot, R.S.; Wilson, M.A.; Boumans, R.M. A typology for the classification, description and valuation of ecosystem functions, goods and services. Ecol. Econ. 2002, 41, 393–408. [Google Scholar] [CrossRef]
  12. Nesbitt, L.; Hotte, N.; Barron, S.; Cowan, J.; Sheppard, S.R. The social and economic value of cultural ecosystem services provided by urban forests in North America. Urban For. Urban Green. 2017, 25, 103–111. [Google Scholar] [CrossRef]
  13. Haaland, C.; van den Bosch, C.K. Challenges and strategies for urban green-space planning in cities undergoing densification: A review. Urban For. Urban Green. 2015, 14, 760–771. [Google Scholar] [CrossRef]
  14. Alberti, M.; Marzluff, J.M. Ecological resilience in urban ecosystems: Linking urban patterns to human and ecological functions. Urban Ecosyst. 2004, 7, 241–265. [Google Scholar] [CrossRef]
  15. Goudie, A.S.; Viles, H.A. The Earth Transformed: An Introduction to Human Impacts on the Environment; John Wiley & Sons: Hoboken, NJ, USA, 2013. [Google Scholar]
  16. Peng, J.; Liu, Y.; Li, T.; Wu, J. Regional ecosystem health response to rural land use change: A case study in Lijiang City, China. Ecol. Indic. 2017, 72, 399–410. [Google Scholar] [CrossRef]
  17. Fang, Z.; Ding, T.; Chen, J.; Xue, S.; Zhou, Q.; Wang, Y.; Wang, Y.; Huang, Z.; Yang, S. Impacts of land use/land cover changes on ecosystem services in ecologically fragile regions. Sci. Total Environ. 2022, 831, 154967. [Google Scholar] [CrossRef] [PubMed]
  18. He, J.; Pan, Z.; Liu, D.; Guo, X. Exploring the regional differences of ecosystem health and its driving factors in China. Sci. Total Environ. 2019, 673, 553–564. [Google Scholar] [CrossRef] [PubMed]
  19. Lu, Y.; Wang, R.; Zhang, Y.; Su, H.; Wang, P.; Jenkins, A.; Ferrier, R.C.; Bailey, M.; Squire, G. Ecosystem health towards sustainability. Ecosyst. Health Sustain. 2015, 1, 1–15. [Google Scholar] [CrossRef]
  20. Das, M.; Das, A.; Pereira, P.; Mandal, A. Exploring the spatio-temporal dynamics of ecosystem health: A study on a rapidly urbanizing metropolitan area of Lower Gangetic Plain, India. Ecol. Indic. 2021, 125, 107584. [Google Scholar] [CrossRef]
  21. Costanza, R. Toward an operational definition of ecosystem health. In Frontiers in Ecological Economics; Edward Elgar: Cheltenham, UK, 1997; pp. 75–92. [Google Scholar]
  22. Peng, J.; Liu, Y.; Wu, J.; Lv, H.; Hu, X. Linking ecosystem services and landscape patterns to assess urban ecosystem health: A case study in Shenzhen City, China. Landsc. Urban Plan. 2015, 143, 56–68. [Google Scholar] [CrossRef]
  23. Bao, Z.; Shifaw, E.; Deng, C.; Sha, J.; Li, X.; Hanchiso, T.; Yang, W. Remote sensing-based assessment of ecosystem health by optimizing VOR model: A case study in Fuzhou City, China. Ecol. Inform. 2022, 72, 101889. [Google Scholar] [CrossRef]
  24. United Nations. Transforming Our World: The 2030 Agenda for Sustainable Development; United Nations: New York, NY, USA, 2015. [Google Scholar]
  25. IPBES (Intergovernmental Science-Policy Platform on Biodiversity and Ecosystem Services). Global Assessment Report on Biodiversity and Ecosystem Services; Díaz, S., Settele, J., Brondízio, E., Ngo, H.T., Eds.; IPBES Secretariat: Bonn, Germany, 2019. [Google Scholar]
  26. UNFCCC. Paris Agreement; United Nations: Paris, France, 2015; Available online: https://unfccc.int/sites/default/files/english_paris_agreement.pdf (accessed on 5 February 2024).
  27. Martínez-Sastre, R.; Ravera, F.; González, J.A.; Santiago, C.L.; Bidegain, I.; Munda, G. Mediterranean landscapes under change: Combining social multicriteria evaluation and the ecosystem services framework for land use planning. Land Use Policy 2017, 67, 472–486. [Google Scholar] [CrossRef]
  28. Nickayin, S.S.; Coluzzi, R.; Marucci, A.; Bianchini, L.; Salvati, L.; Cudlin, P.; Imbrenda, V. Desertification risk fuels spatial polarization in ‘affected’ and ‘unaffected’ landscapes in Italy. Sci. Rep. 2022, 12, 747. [Google Scholar] [CrossRef]
  29. Vatitsi, K.; Ioannidou, N.; Mirli, A.; Siachalou, S.; Kagalou, I.; Latinopoulos, D.; Mallinis, G. LULC change effects on environmental quality and ecosystem services using EO data in two rural river basins in Thrace, Greece. Land 2023, 12, 1140. [Google Scholar] [CrossRef]
  30. Kesgin Atak, B.; Ersoy Tonyaloğlu, E. Monitoring the spatiotemporal changes in regional ecosystem health: A case study in İzmir, Turkey. Environ. Monit. Assess. 2020, 192, 385. [Google Scholar] [CrossRef]
  31. Çobanoğlu, F.; Tunalıoğlu, R.; Tok, N. Aydın’da arkeoloji ve tarımın turizm potansiyeline katkısı. Uluslararası Kırsal Tur. Ve Kalkınma Derg. (IRTAD) 2021, 5, 2602–4462. [Google Scholar]
  32. Turkish State Meteorological Service (TSMS). Official Statistics. Available online: https://www.mgm.gov.tr/veridegerlendirme/il-ve-ilceler-istatistik.aspx?m=AYDIN (accessed on 15 February 2024).
  33. Esbah, H. Land use trends during rapid urbanization of the city of Aydın, Turkey. Environ. Manag. 2007, 39, 443–459. [Google Scholar] [CrossRef]
  34. Deniz, B. Kentsel Alan Kullanımlarındaki Dönüşümlerin Peyzaj Strüktür İndeksleriyle İrdelenmesi: Aydın Kenti Örneği. Ph.D. Thesis, Ege University, İzmir, Turkey, 2005. [Google Scholar]
  35. Tonyaloğlu, E.E.; Atak, B.K. Estimation of spatiotemporal variation in potential ecosystem services: A case study of Aydın, Turkey. In Creating Resilient Landscapes in an Era of Climate Change; Routledge: London, UK, 2022; pp. 217–230. [Google Scholar]
  36. Data Portal for Statistics (DPFS). Available online: https://data.tuik.gov.tr/Kategori/GetKategori?p=Nufus-ve-Demografi-109 (accessed on 5 October 2024).
  37. Umaç, B. Aydın İl Merkezinde Seçili Bölgelerde Biyofiziksel Ölçümlerin Karşılaştırılması. Master’s Thesis, Aydın Adnan Menderes University, Aydın, Turkey, 2019. [Google Scholar]
  38. THHP (Temiz Hava Hakkı Platformu). Kara Rapor 2020: Hava Kirliliği ve Sağlık Etkileri; Temiz Hava Hakkı Platformu: İstanbul, Turkey, 2020. [Google Scholar]
  39. Esbah, H.; Deniz, B.; Kara, B.; Atatanir, L. Monitoring urban development near a protected area. In Proceedings of the 2007 Urban Remote Sensing Joint Event, Paris, France, 11–13 April 2007; IEEE: Piscataway, NJ, USA; pp. 1–6. [Google Scholar]
  40. Environmental Systems Research Institute (ESRI). ArcGIS Desktop: Release 10.5.1; ESRI: Redlands, CA, USA, 2015. [Google Scholar]
  41. McGarigal, K.; Cushman, S.A.; Ene, E. FRAGSTATS v4: Spatial Pattern Analysis Program for Categorical Maps; University of Massachusetts: Amherst, MA, USA, 2023; Available online: https://www.fragstats.org (accessed on 10 February 2023).
  42. Natural Capital Project (InVEST). Integrated Valuation of Ecosystem Services (InVEST); Stanford University: Stanford, CA, USA, 2024; Available online: https://naturalcapitalproject.stanford.edu/software/invest (accessed on 8 October 2024).
  43. Costanza, R. Ecosystem health and ecological engineering. Ecol. Eng. 2012, 45, 24–29. [Google Scholar] [CrossRef]
  44. Whitford, W.G.; Rapport, D.J.; DeSoyza, A.G. Using resistance and resilience measurements for “fitness” tests in ecosystem health. J. Environ. Manag. 1999, 57, 21–29. [Google Scholar] [CrossRef]
  45. O’Brien, A.; Townsend, K.; Hale, R.; Sharley, D.; Pettigrove, V. How is ecosystem health defined and measured? A critical review of freshwater and estuarine studies. Ecol. Indic. 2016, 69, 722–729. [Google Scholar] [CrossRef]
  46. Carlson, T.N.; Ripley, D.A. On the relation between NDVI, fractional vegetation cover, and leaf area index. Remote Sens. Environ. 1997, 62, 241–252. [Google Scholar] [CrossRef]
  47. Ceccato, P.; Flasse, S.; Gregoire, J.M. Designing a spectral index to estimate vegetation water content from remote sensing data: Part 2. Validation and applications. Remote Sens. Environ. 2002, 82, 198–207. [Google Scholar] [CrossRef]
  48. Wan, Z.; Wang, P.; Li, X. Using MODIS land surface temperature and normalized difference vegetation index products for monitoring drought in the southern Great Plains, USA. Int. J. Remote Sens. 2004, 25, 61–72. [Google Scholar] [CrossRef]
  49. Xu, H. A new index for delineating built-up land features in satellite imagery. Int. J. Remote Sens. 2008, 29, 4269–4276. [Google Scholar] [CrossRef]
  50. Xu, H.; Zhang, T.; Huang, S. Quantitative comparison of Landsat 7 and ASTER multispectral measurements for the NDBI and IBI. Geogr. Res. 2013, 32, 1336–1344. [Google Scholar]
  51. Rikimaru, A.; Roy, P.S.; Miyatake, S. Tropical forest cover density mapping. Trop. Ecol. 2002, 43, 39–47. [Google Scholar]
  52. Yang, J.; Xin, Z.; Li, X.; Liang, X. Vigor–Organization–Resilience Framework for Assessing Ecosystem Health in the Qinghai–Xizang Plateau. Ecosyst. Health Sustain. 2024, 10, 260. [Google Scholar] [CrossRef]
  53. Chen, W.; Wang, G.; Zeng, J. Impact of Urbanization on Ecosystem Health in Chinese Urban Agglomerations. Environ. Impact Assess. Rev. 2023, 98, 106964. [Google Scholar] [CrossRef]
  54. Lei, D.; Zhang, Y.; Ran, Y.; Gao, L.; Li, J.; Li, Z.; Mo, J.; Liu, X. Assessment of ecosystem health based on landscape pattern in ecologically fragile regions at different spatial scales: A case study of Dianchi Lake Basin, China. Front. Environ. Sci. 2023, 11, 1076344. [Google Scholar] [CrossRef]
  55. Xu, W.; He, M.; Meng, W.; Zhang, Y.; Yun, H.; Lu, Y.; Huang, Z.; Mo, X.; Hu, B.; Liu, B.; et al. Temporal–spatial change of China’s coastal ecosystem health and driving factors analysis. Sci. Total Environ. 2022, 845, 157319. [Google Scholar] [CrossRef]
  56. Das, M.; Das, A.; Mandal, A. Research note: Ecosystem health (EH) assessment of a rapidly urbanizing metropolitan city region of eastern India—A study on Kolkata Metropolitan Area. Landsc. Urban Plan. 2020, 204, 103938. [Google Scholar] [CrossRef]
  57. Niquisse, S.; Cabral, P.; Rodrigues, Â.; Augusto, G. Ecosystem services and biodiversity trends in Mozambique as a consequence of land cover change. Int. J. Biodivers. Sci. Ecosyst. Serv. Manag. 2017, 13, 297–311. [Google Scholar] [CrossRef]
  58. Chu, L.; Sun, T.; Wang, T.; Li, Z.; Cai, C. Evolution and prediction of landscape pattern and habitat quality based on CA-Markov and InVEST model in Hubei section of Three Gorges Reservoir Area. Sustainability 2018, 10, 3854. [Google Scholar] [CrossRef]
  59. Wu, L.; Sun, C.; Fan, F. Estimating the characteristic spatiotemporal variation in habitat quality using the InVEST model—A case study from Guangdong–Hong Kong–Macao Greater Bay Area. Remote Sens. 2021, 13, 1008. [Google Scholar] [CrossRef]
  60. Natural Capital Project. InVEST 3.17.1; Stanford University; University of Minnesota; Chinese Academy of Sciences; The Nature Conservancy; World Wildlife Fund; Stockholm Resilience Centre; Royal Swedish Academy of Sciences. 2025. Available online: http://releases.naturalcapitalproject.org/invest-userguide/latest/en/index.html (accessed on 10 July 2025).
  61. Shi, Y.; Wang, N.; Li, T.; Wang, H.; Kang, H.; Shi, X. Evaluation of landscape ecological integrity in the Yulin region, China. Sustainability 2018, 10, 4300. [Google Scholar] [CrossRef]
  62. Zhao, J.; Yu, Q.; Xu, C.; Ma, J.; Liu, W.; Sun, W.; Miao, Y.; Nawaz, T. Integrated approach for ecological restoration and ecological spatial network optimization with multiple ecosystem functions in mining areas. Ecol. Indic. 2023, 156, 111141. [Google Scholar] [CrossRef]
  63. Folke, C.; Carpenter, S.; Walker, B.; Scheffer, M.; Elmqvist, T.; Gunderson, L.; Holling, C.S. Regime shifts, resilience, and biodiversity in ecosystem management. Annu. Rev. Ecol. Evol. Syst. 2004, 35, 557–581. [Google Scholar] [CrossRef]
  64. Peñuelas, J.; Sardans, J. Global change and forest disturbances in the Mediterranean Basin: Breakthroughs, knowledge gaps, and recommendations. Forests 2021, 12, 603. [Google Scholar] [CrossRef]
  65. Egidi, G.; Cividino, S.; Paris, E.; Palma, A.; Salvati, L.; Cudlín, P. Assessing the impact of multiple drivers of land sensitivity to desertification in a Mediterranean country. Environ. Impact Assess. Rev. 2021, 89, 106594. [Google Scholar] [CrossRef]
  66. Appiagyei, B.D.; Belhoucine-Guezouli, L.; Bessah, E.; Morsli, B. The changing land use and land cover in the Mediterranean Basin: Implications on forest ecosystem services. Folia Oecologica 2023, 50, 60–71. [Google Scholar] [CrossRef]
  67. Ruiz, I.; Sanz-Sánchez, M.J. Effects of historical land-use change in the Mediterranean environment. Sci. Total Environ. 2020, 732, 139315. [Google Scholar] [CrossRef]
  68. Li, Y.; Qin, L.; Wang, Y.; Liu, H.; Zhang, M.; Hao, H. Ecosystem health assessment of the largest lake wetland in the Yellow River Basin using an improved vigor-organization-resilience-services model. Ecol. Indic. 2024, 166, 112539. [Google Scholar] [CrossRef]
  69. Kesgin, B.; Nurlu, E. Land cover changes on the coastal zone of Çandarlı Bay, Türkiye using remotely sensed data. Environ. Monit. Assess. 2009, 157, 89–96. [Google Scholar] [CrossRef]
  70. Şenay, D.; Nurlu, E. Spatio-temporal assessment of landscape ecological risk using spatial statistical analysis in a basin of Türkiye. Environ. Monit. Assess. 2024, 196, 899. [Google Scholar] [CrossRef] [PubMed]
  71. FAO (Food and Agriculture Organization of the United Nations). The State of Food Security and Nutrition in the World 2020; FAO: Rome, Italy, 2020. [Google Scholar]
  72. Ersoy Tonyaloğlu, E. Future land use/land cover and its impacts on ecosystem services: Case of Aydın, Turkey. Int. J. Environ. Sci. Technol. 2025, 22, 4601–4617. [Google Scholar] [CrossRef]
  73. Rapport, D.J.; Costanza, R.; McMichael, A.J. Assessing ecosystem health. Trends Ecol. Evol. 1998, 13, 397–402. [Google Scholar] [CrossRef] [PubMed]
  74. European Commission. EU Biodiversity Strategy for 2030: Bringing Nature Back into Our Lives; Publications Office of the European Union: Luxembourg, 2020; Available online: https://environment.ec.europa.eu/strategy/biodiversity-strategy-2030_en (accessed on 15 May 2024).
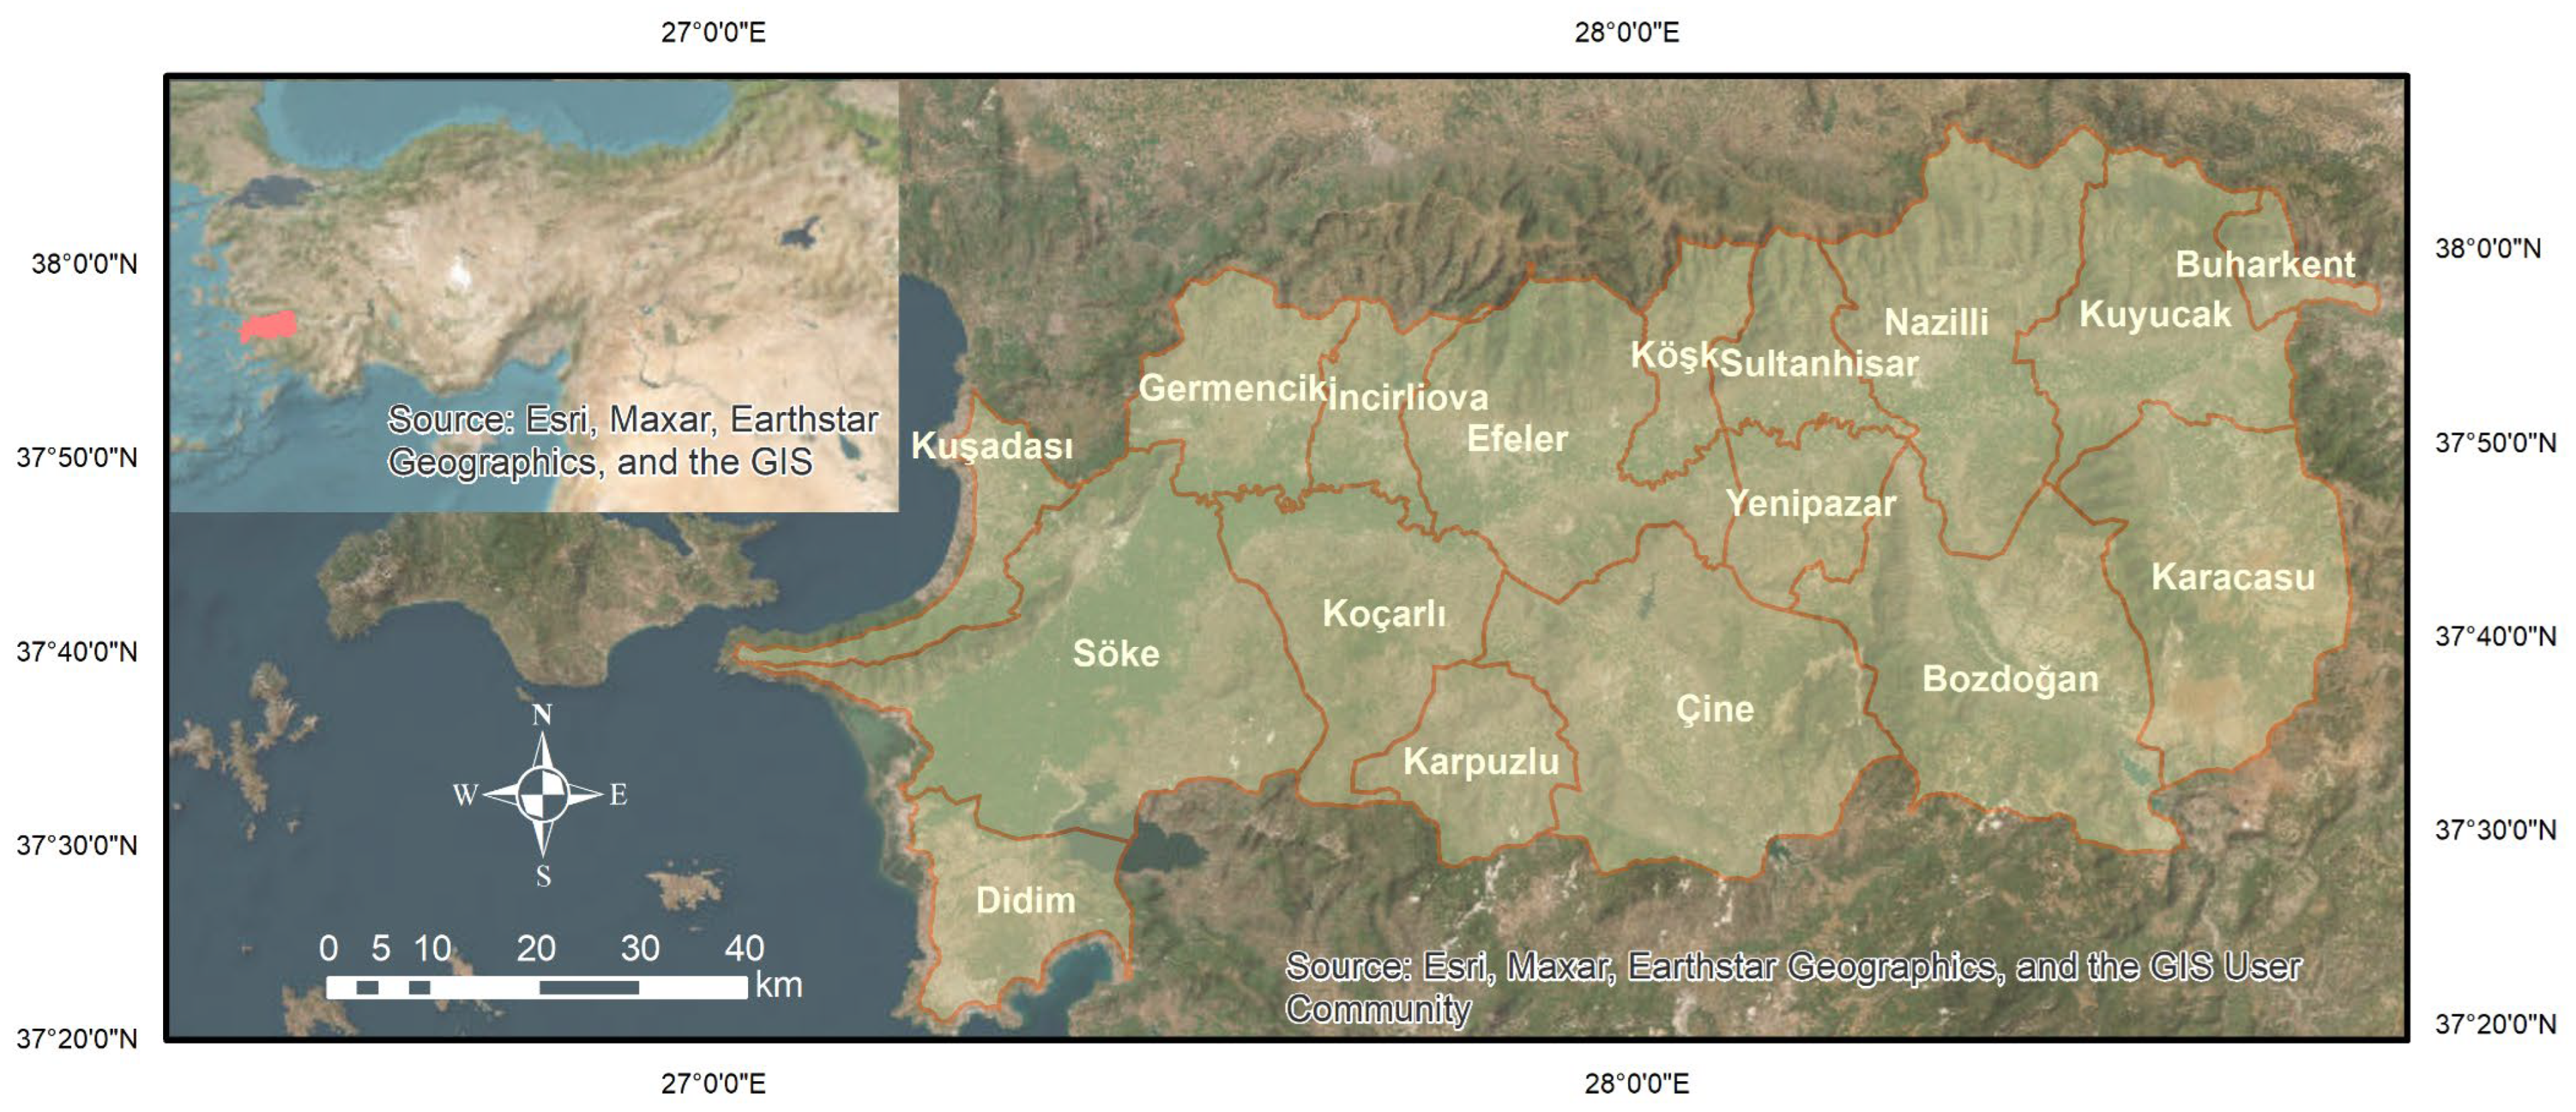
Figure 1. Location of the study area.
Sustainability 17 10522 g001
Figure 2. The methodological framework of this study.
Sustainability 17 10522 g002
Figure 3. LULC pattern in 1995 (above) and 2020 (below).
Sustainability 17 10522 g003
Figure 4. Distribution of CVI index in 1995 (above) and 2020 (below).
Sustainability 17 10522 g004aSustainability 17 10522 g004b
Figure 5. Distribution of Organization index in 1995 (above) and 2020 (below).
Sustainability 17 10522 g005
Figure 6. Distribution of Resilience index in 1995 (above) and 2020 (below).
Sustainability 17 10522 g006
Figure 7. Distribution of REH index in 1995 (above) and 2020 (below).
Sustainability 17 10522 g007
Figure 8. The hotspots and coldspots of REH in 1995 (above) and 2020 (below).
Sustainability 17 10522 g008
Table 1. Remote sensing dataset used in the study.
SensorAcquisition Date
Landsat 5TM20 May 1995
11 June 1995
29 July 1995
14 August 1995
15 September 1995
Landsat 8 OLI14 May 2020
17 July 2020
02 August 2020
18 August 2020
03 September 2020
Table 2. Indexes used in the calculation of CVI index as the indicator of Vigor (V).
IndexFormulaSource
Fractional Vegetation Coverage (FVC)(NDVI − NDVImin)/(NDVImax − NDVImin)
(NDVI = (NIR − R)/(NIR + R))
Carlson, et al., 1997 [46]
Global Vegetation Moisture Index (GVMI)(NIR + 0.1) − (SWIR + 0.02)/(NIR + 0.1) + (SWIR + 0.02)Ceccato et al., 2002 [47]
Vegetation Temperature Condition Index (VTCI)(LSTNDVImaxi − LSTNDVIi)/(LSTNDVImaxi − LSTNDVIi)Wan et al., 2004 [48]
Normalized Differential Build-Up and Bare Soil Index (NDBSCI)(IBI + SI)/2Xu 2008 [49]
The Index-based Built-up Index (IBI)(2MIR/(MIR + NIR) − (NIR/(NIR + Red) + Green (Green + MIR))/2MIR/(MIR +NIR) + (NIR/(NIR + Red) + Green ((Green + MIR))Xu 2013 [50]
The Soil Index (SI)((MIR + Red) − (NIR + Blue))/((MIR + Red) + (NIR + Blue))Rikimaru et al., 2002 [51]
Table 3. LULC conversions between 1995 and 2020.
1995 (ha)
CFSGULUBWClass Total
2020 (ha)C366,307.027354.4416,461.09145.62151.02448.385681.52167.85396,716.94
F4860.3651,706.986690.42000138.4270.8363,467.01
S38,693.8815,225.57168,082.6525.47118.267.381523.61193.5223,870.32
G62.1038.79126.096.930018.45252.36
UL119.250140.490489.42025,816.7722.14788.4
U3335.13115.56138.51039.424481.822152.89010,263.33
B5507.73611.551151.1015.75180.1816,255.0868.2223,789.61
W203.31189.54188.373.5124.21048.154222.984880.07
Change (%)−5.34−15.6116.06−16.07−6.70100.54−7.852.44
Class Total419,088.7875,203.64192,891.42300.69845.015117.7625,816.774763.97
C: Cropland, F: Forestland, S: Shrubland, G: Grassland, UL: Unusedland, U: Urban, B: Bareland, W: Water.
Table 4. Mean and standard deviation values for CVI, O, R, and REH according to LULC classes.
Vigor (V-CVI)Resilience (R)Organization (O)Regional Ecosystem
Health (REH)
MeanStdMeanStdMeanStdMeanStd
Cropland19950.4660.1830.3850.0930.3370.3440.1070.051
20200.5520.1640.3840.1230.3400.3410.1440.067
Forestland19950.5450.1890.9130.1330.4820.2880.3540.161
20200.5910.1050.8800.1520.4640.2920.4120.149
Shrubland19950.3670.1410.8210.1380.4700.2730.2150.107
20200.4700.0900.7780.1720.4620.2870.2910.118
Grassland19950.3400.1660.6220.1330.5320.0620.1600.088
20200.4450.1280.6040.1880.5230.0700.2300.105
Unusedland19950.3960.1970.6370.1910.5190.0750.1940.129
20200.5130.1170.5880.2190.5170.0700.2480.105
Urban19950.4320.0790.0170.0660.5290.2190.0060.024
20200.5510.0830.0530.1140.5020.2370.0250.055
Bareland19950.3710.1140.0820.1860.5120.0960.0220.054
20200.4760.0930.1470.2310.5140.0930.0580.093
Water19950.7290.1580.9250.1050.3640.3340.4270.165
20200.7340.0980.7880.1760.3660.3390.4110.160
Table 5. Mean and standard deviation values for CVI, O, R, and REH at district level.
Vigor (V-CVI)Resilience (R)Organization (O)Regional Ecosystem
Health (REH)
MeanStdMeanStdMeanStdMeanStd
Buharkent19950.460.120.360.20.420.330.120.11
20200.50.10.370.220.470.290.150.12
Sultanhisar19950.470.150.410.160.320.340.120.08
20200.540.130.410.160.320.340.150.09
Köşk19950.480.150.460.190.390.320.150.1
20200.560.120.460.190.390.320.190.12
Kuyucak19950.490.180.50.260.40.330.170.15
20200.530.120.520.270.410.320.210.15
Germencik19950.410.140.330.160.390.330.090.07
20200.510.130.310.160.40.320.120.08
Kuşadası19950.660.150.560.310.490.280.280.2
20200.630.090.560.310.50.270.290.19
İncirliova19950.50.150.390.150.280.340.110.08
20200.580.140.390.170.310.330.150.09
Nazilli19950.460.170.450.210.330.340.130.11
20200.520.130.460.220.360.340.180.13
Efeler19950.480.160.490.260.430.310.160.13
20200.540.130.490.260.420.310.20.14
Yenipazar19950.410.170.60.240.410.30.150.08
20200.50.130.60.250.420.30.220.12
Karacasu19950.390.140.560.270.470.290.170.13
20200.470.10.590.260.470.280.230.14
Koçarlı19950.420.180.660.250.40.310.170.1
20200.510.160.640.240.3820.3210.2270.115
Söke19950.560.20.50.250.2880.3250.1520.102
20200.650.180.490.250.2780.3250.1960.114
Bozdoğan19950.390.160.630.290.5110.2450.1910.14
20200.490.110.630.290.5010.2540.2570.156
Karpuzlu19950.2610.1280.7560.2260.3920.3360.1260.084
20200.4290.1040.680.2270.3730.3380.2030.094
Çine19950.3790.1660.7190.2590.3940.3280.1820.132
20200.4920.1310.6940.2520.3870.3330.2510.145
Didim19950.4390.1360.4690.2360.4070.3350.1470.119
20200.5150.1090.4220.2220.4350.3260.1710.119
Disclaimer/Publisher’s Note: The statements, opinions and data contained in all publications are solely those of the individual author(s) and contributor(s) and not of MDPI and/or the editor(s). MDPI and/or the editor(s) disclaim responsibility for any injury to people or property resulting from any ideas, methods, instructions or products referred to in the content.