Article

Technological Convergence and Innovation Pathways in Sustainable Logistics Systems: An Integrated Graph Neural Network and Main Path Analysis

1
Department of Industrial and Management Engineering, Korea University, 145 Anam-ro, Seongbuk-gu, Seoul 02841, Republic of Korea
2
Department of Technology and Society, SUNY Stony Brook University, 100 Nicolls Road, Stony Brook, NY 11794, USA
*
Authors to whom correspondence should be addressed.
Sustainability 2025, 17(23), 10507; https://doi.org/10.3390/su172310507
Submission received: 13 October 2025 / Revised: 13 November 2025 / Accepted: 16 November 2025 / Published: 24 November 2025
(This article belongs to the Special Issue Sustainable Development and Planning of Supply Chain and Logistics)

Abstract

The sustainable transformation of logistics and supply chains increasingly depends on the convergence of digital and physical technologies. However, prior studies have often analyzed these domains in isolation, lacking a unified model that captures both structural interdependence and temporal evolution in technological innovation. We develop an integrated model which combines a Variational Graph Autoencoder (VGAE) for structural embedding with Main Path Analysis (MPA) for tracing the temporal diffusion of technologies. Using 4121 patents published between 2015 and 2024 across 46 IPC subclasses, the model identifies four major innovation pathways—autonomous vehicle coordination, AI-driven logistics platforms, electrified mobility, and IoT-based monitoring that characterize the evolution of Logistics 4.0. The proposed model achieves a 62.5% main path contribution ratio, a weighted modularity (Q) of 0.5439, and a temporal alignment score of 0.51, confirming both structural coherence and interpretability. Empirical cross-validation with global policy reports (2024) and industry outlook assessments demonstrated strong consistency between the patent-based diffusion trajectories and real-world industry trends. The results provide actionable insights for policymakers and industry leaders seeking to align technological innovation with industrial infrastructure development and sustainable urban logistics transformation.

1. Introduction

The logistics industry is at the center of a global transition toward sustainability, facing increasing pressure to reduce environmental impacts while maintaining operational efficiency [1,2]. Recent advances driven by the Fourth Industrial Revolution and digital transformation have accelerated this shift. The integration of automation technologies, Internet of Things (IoT)based tracking systems, artificial intelligence (AI) forecasting, and data-driven decision making has enabled logistics systems to move beyond isolated improvements toward technological convergence [3,4]. This convergence enhances efficiency and resilience and facilitates the design of sustainable and adaptive logistics networks that minimize environmental footprints while optimizing performance [1,3,5].
In recent years, the logistics industry has undergone a profound digital transition, wherein emerging technologies have redefined how supply chains are designed, managed, and optimized. As highlighted by Winkelhaus and Grosse [6], Logistics 4.0 represents the fusion of cyber–physical systems and digital intelligence, fostering a new paradigm of interconnected, automated, and sustainable logistics systems. Similarly, Demir et al. [7] emphasize that digital transformation reshapes supply chain management by integrating advanced analytics, connectivity, and automation across the logistics ecosystem. These studies collectively underscore that the sustainable transformation of logistics critically depends on digital technology adoption and cross-domain innovation.
Despite substantial progress in understanding these digital and sustainable transitions, a research gap remains in comprehensively modeling both the structural and temporal aspects of technological convergence in logistics innovation. Most prior work has focused on static representations of technology linkages or topic co-occurrence, limiting insights into the evolutionary trajectories and dynamic interactions among emerging technologies. Accordingly, there is a growing need for analytical models that integrate graph-based learning and temporal diffusion analysis to better capture the multi-layered evolution of innovation networks in logistics systems.
Previous studies have predominantly relied on patent text mining to extract major keywords and concepts [8,9], or applied network analysis to capture the structural relationships between technologies [10,11]. For example, Lee et al. (2015) utilized keyword-based patent mapping to identify new technology opportunities [9], while Curran et al. (2010) examined industry convergence using patent networks [10]. Most recently, graph neural networks (GNNs) have been applied to patent networks, allowing enriched representations that incorporate both contextual meaning and network structure [12,13]. Nevertheless, these studies primarily focus on static network structures and relational existence, often neglecting the temporal dimension of technological convergence. In other words, while they identify which technologies are converging, they fall short of addressing when such convergence occurs [14,15].
To address this limitation regarding the temporal aspect, industrial engineering and scientometrics scholars have widely applied Main Path Analysis (MPA). MPA is a well-established method to extract representative technological or scientific development trajectories from citation networks. Liu et al. (2020) applied MPA to the knowledge diffusion scenario for scientific and technological development [16], and Yu and Sheng (2021) employed it to map technological trajectories in blockchain research [17]. Since then, MPA has been applied in ICT, biotechnology, and energy studies, proving effective for uncovering the dynamic structure of knowledge flows [18]. However, existing MPA research has focused primarily on the internal development of a single technological field. It has been limited to illustrating internal trajectories, without addressing inter-cluster convergence pathways and their temporal unfolding. This limitation is particularly problematic in the logistics sector, where technological convergence involves the interplay of automation, IoT, and data-driven technologies emerging at different points in time.
We address this gap by developing an integrated analytical model that combines a Variational Graph Autoencoder (VGAE) for structural embedding with Main Path Analysis (MPA) for temporal trajectory tracing. This hybrid approach identifies core technological clusters and uncovers the evolution of innovation pathways that drive sustainable logistics transformation.
The paper proceeds as follows: Section 2 reviews existing literature on patent text mining, technology convergence, and main path analysis; Section 3 presents the proposed methodological model; Section 4 discusses the empirical findings and validation results; Section 5 provides theoretical and policy implications; and Section 6 concludes with a summary of contributions, limitations, and directions for future research.

2. Literature Review

2.1. Patent Text Mining Research

Patent data serve as an invaluable source for understanding technological progress, innovation trajectories, and industrial convergence. Traditional patent analysis primarily relied on structured classification systems such as the International Patent Classification (IPC) and Cooperative Patent Classification (CPC). However, these taxonomies often fail to capture emerging technologies or interdisciplinary overlaps with sufficient timeliness. As a result, text mining techniques have become increasingly essential for extracting meaningful insights from unstructured patent text [19,20,21].
Jianjia He et al. (2023) demonstrated the effectiveness of text mining for patent analytics by employing TF–IDF weighting to identify emerging technological themes beyond conventional IPC categories [19]. Jaehyun So et al. (2020) further developed keyword-based patent mapping, illustrating how co-occurring terminologies could reveal cross-domain innovation opportunities [20]. Subsequent research incorporated semantic approaches such as Latent Dirichlet Allocation (LDA) to extract latent topics from patent abstracts, allowing time-series tracking of technological evolution [21,22].
Recent advancements in deep learning have dramatically improved patent text understanding. BERT-based models, including SciBERT and PatentBERT, provide contextual embeddings that significantly outperform traditional TF–IDF and LDA in capturing semantic nuances [23,24,25,26]. For instance, Risch et al. (2020) proposed PatentMatch, a transformer-based model for matching patent claims with prior art, achieving state-of-the-art retrieval precision [27]. Kim and Lee (2021) showed that fine-tuned domain-specific BERT modelsenhance patent classification and emerging technology prediction [28].
Nonetheless, most prior research has focused on text similarity and clustering accuracy, while neglecting structural and temporal dimensionsof how patents interact, evolve, and converge across technological boundaries. This limitation motivates the integration of semantic and network-based perspectives to model technology convergence more holistically.

2.2. PatentNetwork Research

Network analysis has become a cornerstone methodology for examining the structural evolution of technology systems. Patent networks—comprising citations, co-classifications, or keyword co-occurrencesfacilitate the visualization of inter-technology relationships and diffusion pathways [29,30,31]. Curran et al. (2010) examined cross-citations between food and biotechnology patents, finding that network density and clustering coefficients act as leading indicators of convergence [32]. Lee et al. (2016) revealed that the smartphone and wireless communication sectors experienced rapid structural integration in the early 2010s, as evidenced by growing inter-domain connectivity [33].
Building on traditional network models, Graph Neural Networks (GNNs) have emerged as powerful tools for learning structural representations. The introduction of Graph Convolutional Networks (GCNs) by Kipf and Welling (2017) allowed for the joint learning of semantic and topological features [34]. Later, Hamilton et al. (2017) proposed GraphSAGE to generalize embeddings for large-scale networks [35]. In the patent domain, Jeong et al. (2021) utilized GCNs to analyze green technology networks, uncovering hidden clusters of convergence that centrality-based measures could not detect [36]. Similarly, Li et al. (2025) developed a temporal heterogeneous GNN to predict technology convergence trajectories using dynamic patent graphs [37].
Despite these advances, GNN-based patent analysis remains predominantly static, often lacking temporal modeling of evolving links. Few studies explicitly integrate time-aware edge weights or textual similarity within GNN architectures. Thus, there remains a significant gap in combining text-derived semantic similarity with dynamic graph learning to track how technologies converge over time.

2.3. Technology Convergence Research

Technological convergence, where distinct technologies interact and coevolve, has become a defining characteristic of innovation in the 21st century. Patent-based convergence analyses have been instrumental in quantifying these dynamics across ICT, bio, and renewable energy sectors [38,39,40,41]. Weidemann et al. (2023) analyzed renewable energy patents and found increasing crosscitations between collaborative robotics in work 4.0, suggesting intensified cross-domain integration [42]. Similarly, Su et al. (2021) identified strong convergence between AR hardware and software patents, particularly in the evolution of smart devices, IoT technologies [43].
Beyond citation-based methods, several studies have employed co-classification and semantic similarity indices to quantify convergence intensity [44,45,46]. For example, Bahoo et al. (2023) combined text mining with bibliometric coupling to measure the linkage between scientific papers and patents [47]. Despite these developments, existing research rarely explains when and how convergence occurs, particularly in temporal terms. Consequently, a dynamic, time-sensitive analytical model remains necessary to understand cross-domain innovation pathways.

2.4. Main Path Analysis (MPA) Research

Main Path Analysis (MPA) is a seminal scientometric technique designed to identify the most influential knowledge flows in citation or co-invention networks. Introduced by Hummon and Doreian (1990), MPA measures connectivity strength across citation chains to extract representative trajectories of knowledge development [48]. Verspagen (2007) applied MPA to fuel cell patents, distinguishing between core and peripheral technological trajectories [49]. Jiang and Liu (2023) extended MPA to the field of scientific communication, showing how paradigm shifts exhibit path-dependent transitions [50].
Subsequent studies have integrated MPA with bibliometric and network approaches to map domain-specific innovation evolution. Yu and Fang (2023) analyzed supply chain integration patents using weighted MPA to trace supply chain integration development paths [51], while Rejeb et al. (2022) used a genetic knowledge persistence–based MPA to visualize dominant ICT innovation streams [52]. Linares et al. (2019) combined MPA with sustainability studies to identify cohesive convergence trajectories in technological innovation [53].
However, MPA has traditionally focused on intra-domain evolution—tracing core technological progress within a single field. Little attention has been given to inter-cluster convergence pathways or to integrating MPA with advanced GNN-based temporal modeling. This paper expands upon MPA by linking its temporal insights with graph embeddings, allowing multi-cluster trajectory mapping across the logistics innovation ecosystem.

2.5. Research Gap and Contributions

Previous studies have achieved significant progress in three key domains: (1) patent text mining for semantic clustering and emerging technology detection [21,22], (2) Patent network representation learning for structural understanding [29,30,31], and (3) MPA for tracing temporal knowledge evolution [51,52,53].
Nevertheless, these methodologies have largely operated in silos. The existing literature seldom integrates semantic text embeddings, structural GNN modeling, and temporal MPA simultaneously. As a result, the temporal evolution of inter-cluster convergence—how, when, and at what rate technologies merge—remains underexplored.
The present research addresses this gap by introducing a hybrid analytical model that combines text mining (TF–IDF or BERT embeddings), graph neural representation learning, and main path analysis. This model quantifies the convergence timeline through indicators, allowing systematic estimation of convergence speed and path length between technological clusters. By applying this model to the logistics and lastmile technology domain, the study contributes a novel empirical foundation for forecasting industrial convergence and guiding future R&D strategies.

3. Methodology

We adopt a sequential methodological process to quantitatively examine the temporal dynamics and evolutionary pathways of technological convergence in the logistics industry. As illustrated in Figure 1, the workflow begins with data collection and preprocessing, followed by the construction of a patent–keyword matrix. Subsequently, a graph neural network (GNN) is employed to embed the patent–keyword network into a lower-dimensional space, allowing the identification of technological clusters. Based on these clusters, convergence indicators are computed to measure the degree and direction of technological integration. Finally, Main Path Analysis (MPA) is applied to trace and visualize the principal convergence trajectories across time.

3.1. Data Collection and Preprocessing

3.1.1. Patent Data Collection

This study collected patent data to quantitatively analyze the phenomenon of technological convergence in the logistics industry. The data collection was based on the International Patent Classification (IPC) system, and the IPC codes repeatedly identified as core technological areas in prior research on logistics innovation and smart logistics were selected. Specifically, five IPC categories were targeted: B60 (Vehicles in General), B62 (Land Vehicles for Special Purposes/Cycles), G05 (Controlling/Regulating Systems), G06Q (Data Processing Systems for Administrative or Business Purposes), and H04W (Wireless Communication Networks).
According to previous studies, this IPC combination comprehensively covers the technological foundations of smart logistics, including autonomous transportation, automated logistics, AI-driven logistics management, and IoT connectivity. For instance, Kwon et al. (2023) [54] and Daim et al. (2006) [55] demonstrated that IPC-based classification provides a reliable methodological model for analyzing inter-industry technological convergence, while Choi et al. (2021) [56] and Shokouhyar et al. (2020) [57] empirically verified that the combination of B60, B62, G05, G06Q, and H04W constitutes the primary technological clusters in the logistics domain. Accordingly, this study adopted these IPC categories to ensure both comparability and validity within the established literature on logistics-related technological convergence.
Building upon these prior studies, this research formulated an integrated search query that reflects both the mechanical and digital dimensions of logistics technologies:
(IC:(B62) AND IC:(B60)) AND (IC:(G05) OR IC:(G06) OR IC:(G08)) AND DP:[2015 TO 2025].
This query was executed in the World Intellectual Property Organization (WIPO) PATENTSCOPE database, yielding a total of 8646 patent documents (both published and granted). Each record includes bibliographic and descriptive information such as title, abstract, publication year, IPC codes, and technological summaries. This dataset forms the empirical foundation for subsequent text-mining, graph embedding, and main path analyses.

3.1.2. Patent Data Preprocessing

In this study, only the titles and abstracts of patents were utilized for textual analysis, while the claims section was deliberately excluded. Patent claims, although legally significant, are often lengthy, structurally heterogeneous, and linguistically complex, containing numerous repetitions and legal terminologies that increase the preprocessing burden and introduce considerable noise into automated natural language processing (NLP) pipelines. Prior patent textmining studies have also noted that claims rarely improve clustering or topic inference accuracy due to redundancy and unstructured syntax [58,59].
In contrast, titles and abstracts succinctly summarize the technical essence and novelty of each invention, offering high information density with minimal preprocessing cost. Several large-scale studies have demonstrated that these sections are sufficient for analyzing technological convergence, innovation trajectories, and disruptiveness at the patent system level. For instance, a Nature study analyzing over 3.9 million patents used only titles and abstracts to measure innovation disruptiveness, citing claim complexity and processing inefficiency as primary exclusion reasons [60]. Similarly, Research Policy and Analytics highlighted that abstract–title corpora are most effective for large-scale, automated patent analytics, as they provide representative semantic information while minimizing noise [61]. Therefore, this study adopts titles and abstracts as reliable and standardized sources for extracting technological features, supporting both scalability and analytical robustness.
To quantitatively analyze the technological convergence patterns derived from the collected patent data, a systematic preprocessing pipeline was implemented. The preprocessing procedure consisted of four major stages: data integration, language detection and translation, text normalization and stopword removal, and keyword extraction.
First, in the data integration stage, the patent dataset was imported, and the title and abstract fields were automatically identified. Records containing missing or null values were removed, and both fields were concatenated into a single unified text representation, supporting that each patent was expressed as one coherent document.
Second, during the language detection and translation stage, the language of each patent document was identified [62]. For non-English documents, translation into English was conducted using a BERT-based translation model [63], which captures bidirectional contextual dependencies between words and ensures higher semantic preservation compared to traditional statistical translation methods. This process minimized linguistic bias and improved semantic consistency across multilingual patent texts. To ensure reproducibility, a fixed random seed was applied, yielding consistent results across identical input data. Third, in the text normalization and stopword removal stage, all texts were converted to lowercase, and regular expressions were applied to remove URLs, numeric values, and special characters [64]. This process produced structurally consistent and linguistically clean textual data. Afterward, general English stopwords were removed based on established linguistic corpora [65], and domain-specific stopwords such as “technology,” “system,” “method,” “industry,” “research,” and “approach”—frequent in patent abstracts but semantically uninformative—were additionally filtered [66]. Fourth, in the keyword extraction stage, the BERT (Bidirectional Encoder Representations from Transformers) model [63,67] was employed to identify the key technical terms in each patent document. BERT captures contextual meaning bidirectionally, allowing more precise identification of semantically important terms than traditional frequency-based approaches. In this study, document embeddings were generated, and highly contextual terms were selected as core keywords.
Extraction parameters were set as follows: n-gram range = 1–3 and deduplication threshold (dedupLim) = 0.9. Since technological terms are often multi-word expressions, the n-gram range was extended up to 3 to preserve their semantic integrity. Keywords composed solely of stopwords or single-character tokens were excluded, and the top-ranked keywords were retained for each patent.
Through this multi-stage preprocessing pipeline, multilingual patent texts were standardized into semantically meaningful English keyword sets. Each patent was thus represented as a compact collection of representative keywords, which subsequently served as the input for constructing the Patent–Keyword Matrix and for training Graph Neural Network (GNN) models. This preprocessing modeleliminated linguistic and structural heterogeneity while preserving technological semantics, thereby providing a robust foundation for network-based analyses of technological convergence in the logistics sector.
A i j = 1 , i f   p a t e n t   i   a n d   j   s h a r e   a t   l e a s t   o n e   k e y w o r d ; 0 , o t h e r w i s e .
where A i j denotes the adjacency matrix representing co-occurrence between patents.

3.2. Patent–Keyword Matrix Construction

After text preprocessing, each patent document was transformed into a structured numerical representation through the construction of a Patent–Keyword Matrix (PKM). This matrix serves as the foundation for identifying co-occurrence relationships among technologies and for deriving network structures suitable for graph-based embedding and path analysis.

3.2.1. Representation of Patent Documents

Each patent was represented as a binary vector in which the presence of a keyword corresponded to a value of 1, and its absence to 0. Let D denote the number of patents and Vthe size of the extracted keyword vocabulary. The resulting binary matrix X { 0,1 } D × V therefore encodes whether patent D contains keyword V. This multilabel representation, widely used in large-scale text classification, enables efficient handling of sparse high-dimensional data while preserving the interpretability of patent–keyword associations [68].

3.2.2. TF–IDF Weighting

To mitigate the dominance of frequently occurring generic terms, the binary matrix was further transformed into a Term Frequency–Inverse Document Frequency (TF–IDF) matrix X ~ . TF–IDF assigns higher importance to terms that are distinctive to particular documents while down-weighting ubiquitous ones. This weighting strategy is grounded in classical information-retrieval theory and remains one of the most effective approaches for emphasizing semantically meaningful features [69]. The TF–IDF weighted PKM thus captures not only the occurrence but also the relative significance of technological terms across the entire patent corpus.
w t , d = t f t , d log N d f t = 1

3.2.3. Patent–Patent Co-Occurrence Projection

To analyze the relational structure among patents, the bipartite patent–keyword matrix was projected into a patent–patent co-occurrence network defined as
A ( c o u n t ) = X X ,
In the matrix A ( c o u n t ) , the value in the i -th row and j -th column represents the number of keywords shared between patents i and j . Diagonal elements were set to zero to exclude self-links. This projection converts the textual similarity between patents into a topological representation suitable for network-analytic and graph-learning techniques.

3.2.4. Normalization of Edge Weights

Because patents vary in length and keyword richness, normalization is essential to obtain meaningful relational weights. Two established similarity measures were applied:
  • Jaccard Coefficient
w i j ( J a c c ) = c i j d i + d j c i j ,
where c i j is the number of common keywords and d i , d j are the keyword degrees of patents i and j , respectively.This measure quantifies the overlap between keyword sets relative to their union and is robust to document-length heterogeneity [70].
  • Association Strength (AS)
w i j ( A S ) = c i j d i d j ,
which corrects for marginal frequencies and has been shown to produce balanced and interpretable proximity values in bibliometric and patent-mapping studies [71,72].
The resulting weighted adjacency matrices A ( J a c c ) and A ( A S ) form the quantitative basis for subsequent Graph Neural Network (GNN) modeling, clustering, and Main Path Analysis (MPA) of technological convergence.

3.2.5. Network Sparsificationand Reproducibility

To focus on the most significant relationships, the network can be further refined through sparsification techniques that retain only the highestweight or top-k edges per node. Such backbone extraction procedures are widely adopted to enhance interpretability and computational tractability in large weighted networks [73]. All intermediate artifacts—including the binary and TF–IDF PKMs, vocabulary indices, and normalized adjacency matrices—were archived to guarantee full reproducibility of the analysis pipeline.

3.3. Graph Embedding via Variational Graph Auto-Encoder (VGAE)

3.3.1. Model Overview and Rationale

To generate a low-dimensional representation of the patent–patent network, this study employs the Variational Graph Auto-Encoder (VGAE) [74], which integrates the representational capacity of Graph Convolutional Networks (GCNs) [75] with the probabilistic regularization of Variational Auto-Encoders (VAEs) [76,77]. VGAE was selected because itcaptures both structural relationships and latent semantic similarities in complex, sparse graphs such as patent networks. The GCN encoder aggregates neighborhood information, allowing the model to learn topological features based on keyword-based co-occurrence links. The variational component regularizes the latent space by modeling node embeddings as distributions rather than fixed points, enhancing robustness to noisy or missing connections. Finally, its decoder reconstructs edges through an inner-product similarity, aligning directly with the link-prediction objective used in this study.
The Variational Graph Autoencoder (VGAE) combines the representational capability of Graph Convolutional Networks (GCNs) with the probabilistic regularization mechanism of a Variational Autoencoder. Formally, given a graph G = ( V , E ) with feature matrix X and adjacency matrix A , the encoder learns the latent representation Z as follows:
Z = f θ ( X , A ) = G C N μ ( X , A ) + ϵ G C N σ ( X , A ) ϵ N ( 0 , I )
The decoder reconstructs the adjacency matrix by the inner product of latent vectors:
p ( A Z ) = σ ( Z Z )
Both Jaccard coefficient and Association Strength normalized adjacency matrices (from3.2) were tested as graph inputs. Jaccard focuses on unique co-occurrence strength, while Association Strength mitigates the influence of high-degree nodes, both of which have been validated in bibliometric mapping literature [71,72].

3.3.2. Feature Construction and Learning Process

Each patent node is represented by its TF-IDF keyword vector derived from the preprocessed text. To reduce dimensionality and stabilize learning, a truncated Singular Value Decomposition (SVD) [78] was applied to project features into a compact latent space while retaining major semantic variance. The reduced features were normalized and input to the VGAE encoder.
The overall training objective of VGAE is to minimize the reconstruction loss while regularizing the latent space through a Kullback–Leibler divergence. The encoder consists of two GCN layers: the first transforms features into a hidden representation, and the second generates the mean and variance vectors that define the latent embedding distribution. The decoder computes the likelihood of an edge between any two nodes using the inner product of their latent vectors. Model parameters were optimized using the Adam optimizer with early stopping based on validation loss. Training was conducted with a fixed random seed to ensure reproducibility.

3.3.3. Evaluation Framework

The trained embeddings were evaluated across three complementary dimensions:
(1) edge-level link reconstruction, (2) embedding-level clustering quality, and (3) graph-level community coherence.
To assess whether the learned embeddings preserve observed structural relations, we performed a link-prediction test. A subset of existing edges was held out, and an equal number of non-edges was randomly sampled. Prediction scores were evaluated using ROC–AUC and Average Precision (AP) metrics [74,79]. High AUC and AP values indicate that the learned latent spacereconstructs observed network patterns and generalizes to unobserved links.
The latent vectors were normalized and clustered using k-means [80]. To evaluate the compactness and separability of the resulting clusters, four complementary indices were applied:
  • Silhouette coefficient [81]: measures how similar each sample is to its own cluster compared with other clusters. Higher values indicate well-defined, compact clusters.
  • Davies–Bouldin index (DBI) [82]: quantifies the average similarity between each cluster and its most similar neighbor. Lower DBI indicates less overlap and stronger separation.
  • Calinski–Harabasz score (CH) [83]: evaluates the ratio of between-cluster to within-cluster variance. A higher CH implies distinct, well-separated clusters.
  • Dunn index [84]: compares the minimum inter-cluster distance with the maximum intra-cluster distance. Larger values indicate that clusters are simultaneously compact and well separated.
These indices jointly assess the cohesion and separation of clusters. Their complementary perspectives ensure that the clustering quality is not biased toward a single geometric assumption.
To validate the consistency between the embedding-based clusters and the original network topology, we further computed:
  • Weighted modularity Q [85]: measures the strength of community structure in the graph (higher values suggest well-formed communities).
  • Conductance [86]: evaluates the fraction of edges crossing cluster boundaries (lower values indicate stronger internal connectivity).
  • Mixing parameter (μ) [86]: represents the proportion of inter-cluster edges relative to all edges (lower μ indicates cohesive clusters).
The combination of these metrics provides a balanced evaluation of both geometric and topological clustering performance.

3.3.4. Visualization and Interpretation

For qualitative inspection, the latent representations were projected into two dimensions using Uniform Manifold Approximation and Projection (UMAP) [87]. The visualization confirmed that patents belonging to similar technological domains cluster together, forming clear boundaries across major innovation themes in logistics and automation. These cluster structures serve as the foundation for subsequent Main Path Analysis (MPA) of technological trajectories.

3.4. Main Path Analysis (MPA): Weight–Time Coupled Knowledge Flows

We summarize the diffusion of technological knowledge across patents by extracting main paths from the patent network. Building on classical path–contribution approaches (SPC/SPLC) [88,89,90], we extend MPA with a weight–time coupling that integrates structural link strength and temporal progression, thereby prioritizing flows that are both strong and fast.

3.4.1. Graph Construction and Temporal Ordering

Nodes represent patents (or cluster-level aggregates), and undirected edges encode keyword–cooccurrence similarity. Edge weights w i j are derived from Jaccard or Association Strength normalization (Section 3.2), mitigating degree bias in co-occurrence counts. Each node is assigned a date stamp (day-level), and the network is oriented from earlier to later items, producing a time-ordered DAG by removing ties and cycles (equal-time links are discarded or down-weighted). This orientation enforces causal plausibility in knowledge flow.

3.4.2. Edge-Level Time Metrics and Coupling

For each directed edge i j , we compute the calendar difference Δ t i j (in years). Two complementary time–coupling indicators are used:
  • Time per unit strength: Δ t i j / w i j , capturing the latency per structural intensity of a link.
  • Weighted time: w i j Δ t i j , capturing time burden adjusted by strength.
In path aggregation, we report: (i) w (structural cohesion), (ii) Δ t (propagation speed), (iii) w Δ t (strength-adjusted delay), and (iv) Δ t / w (time efficiency). These metrics allow distinguishing fast–cohesive backbones from slow–but–structurally important detours.

3.4.3. Global and Local Main Paths (SPLC-Based)

We adopt Search Path Link Count (SPLC) to score link contributions without enumerating all paths [88,89,90]. SPLC is computed by dynamic programming on the time-ordered DAG using forward (sources→node) and backward (node→sinks) path counts; an edge’s SPLC equals the product of those counts. Global MPA selects the source–to–sink route with the maximum sum of SPLC, yielding the global backbone of knowledge flow. Local MPA fixes a user-specified source cluster and applies the same procedure to the reachable subgraph, describing area-specific progression.
The SPLC algorithm evaluates each edge by counting the number of distinct source-sink paths it participates in. For a directed acyclic graph (DAG), the SPLC score of edge e i j is calculated as:
S P L C ( e i j ) = F W ( i ) × B W ( j )
where F W ( i ) (Forward Weight) represents the number of all possible paths from any source node s S to node i . It captures the cumulative upstream influence reaching node i . Formally,
F W ( i ) = s S P s i
B W ( j ) (Backward Weight) denotes the number of all possible paths from node j to any sink node t T . It represents the downstream diffusion potential from node j . Formally,
B W ( j ) = t T P j t
Here, P s i and P j t indicate the count of distinct directed paths connecting s to i and j to t , respectively. The product F W ( i ) × B W ( j ) thus quantifies the global contribution of edge e i j to the total number of sourcesink paths in the network. Edges with higher SPLC values participate in more influential knowledge-flow trajectories and are therefore identified as part of the main path.
The SPLC algorithm was selected because itbalances computational efficiency and interpretability in identifying critical knowledge-diffusion paths. Unlike SPC (Search Path Count), which only considers the number of paths between adjacent nodes, SPLC captures global connectivity by multiplying upstream and downstream path weights. This allows SPLC to highlight links that bridge early and late technological stages, making it particularly suitable for analyzing temporal convergence networks such as patent citations. In comparison, NPPC (Node Pair Projection Count) and Key-Route algorithms often require exhaustive enumeration or subjective thresholding, which limits scalability in large DAGs. SPLC’s dynamic programming implementation also ensures computational tractability, allowing the extraction of both global backbones and localized technological trajectories within the same analytical model. Therefore, SPLC not only identifies the statistically most influential routes but also provides an interpretable foundation for linking graph-theoretic diffusion measures with the real-world evolution of logistics technologies captured by the VGAE embeddings.
Results are robust across (i) weight definitions (Jaccard vs. Association Strength), (ii) sparsification levels ( K out ) , (iii) temporal thresholds, and (iv) cluster time representatives (mean vs. median). While key-route composition may vary marginally, the global backbone remains stable, consistent with prior findings on main-path sensitivity [91,92].

4. Results

4.1. Descriptive Statistics of Patent Dataset

Patent data from 2015 to 2024 were collected from the WIPO PATENTSCOPE database using the following search command:(IC:(B62) AND IC:(B60)) AND (IC:(G05) OR IC:(G06) OR IC:(G08)) AND DP:[2015 TO 2025].This query encompasses logistics-related technologies involving vehicle systems (B60, B62), control and automation (G05), data processing and management (G06Q), and wireless communication (H04W).After removing duplicates and incomplete records, the final dataset included 8646 valid patents, forming the foundation for the descriptive and subsequent analytical stages of this study.
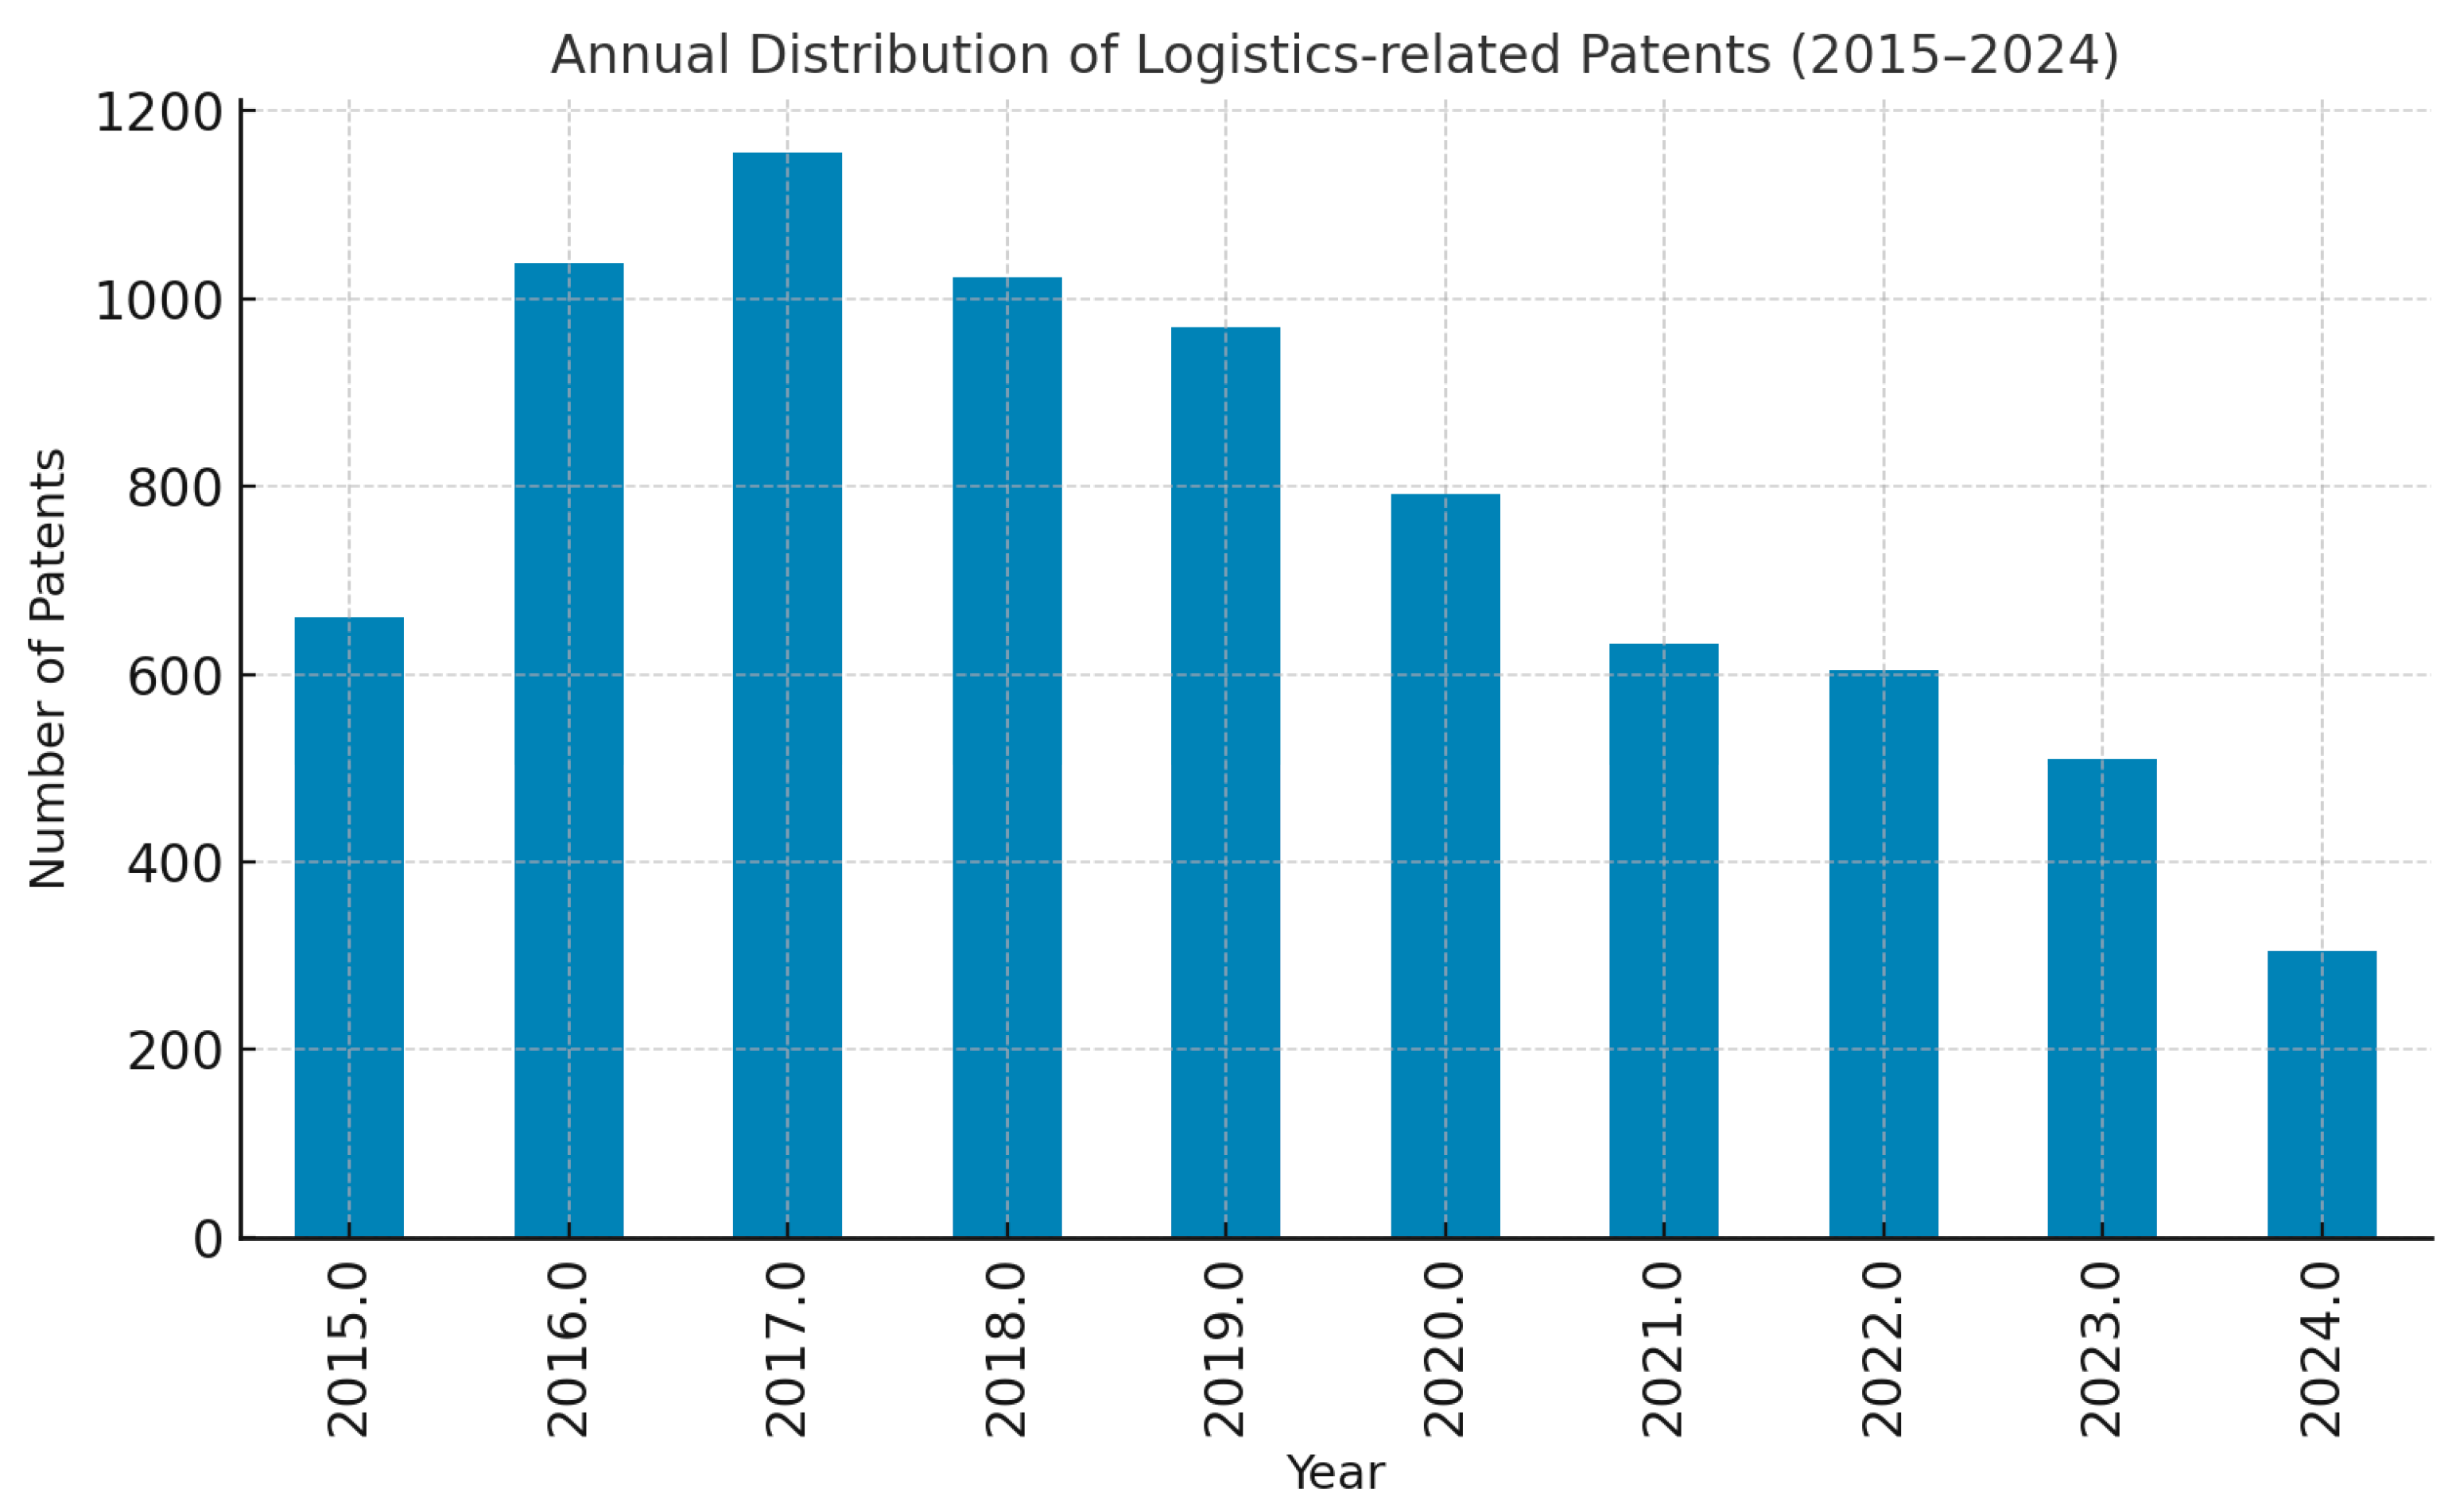
Figure 2 illustrates the annual distribution of logistics-related patents between 2015 and 2024. The results show a steady increase during 2015–2017, followed by a rapid surge between 2018 and 2021 that corresponds to the diffusion of automation, digitalization, and AI-driven logistics solutions. Patent activity reached its peak around 2017–2018, reflecting the emergence of automation-oriented innovations, and later stabilized from 2020 to 2024 as digital logistics technologies matured. The overall trend indicates a sustained level of technological innovation and convergence throughout the decade.
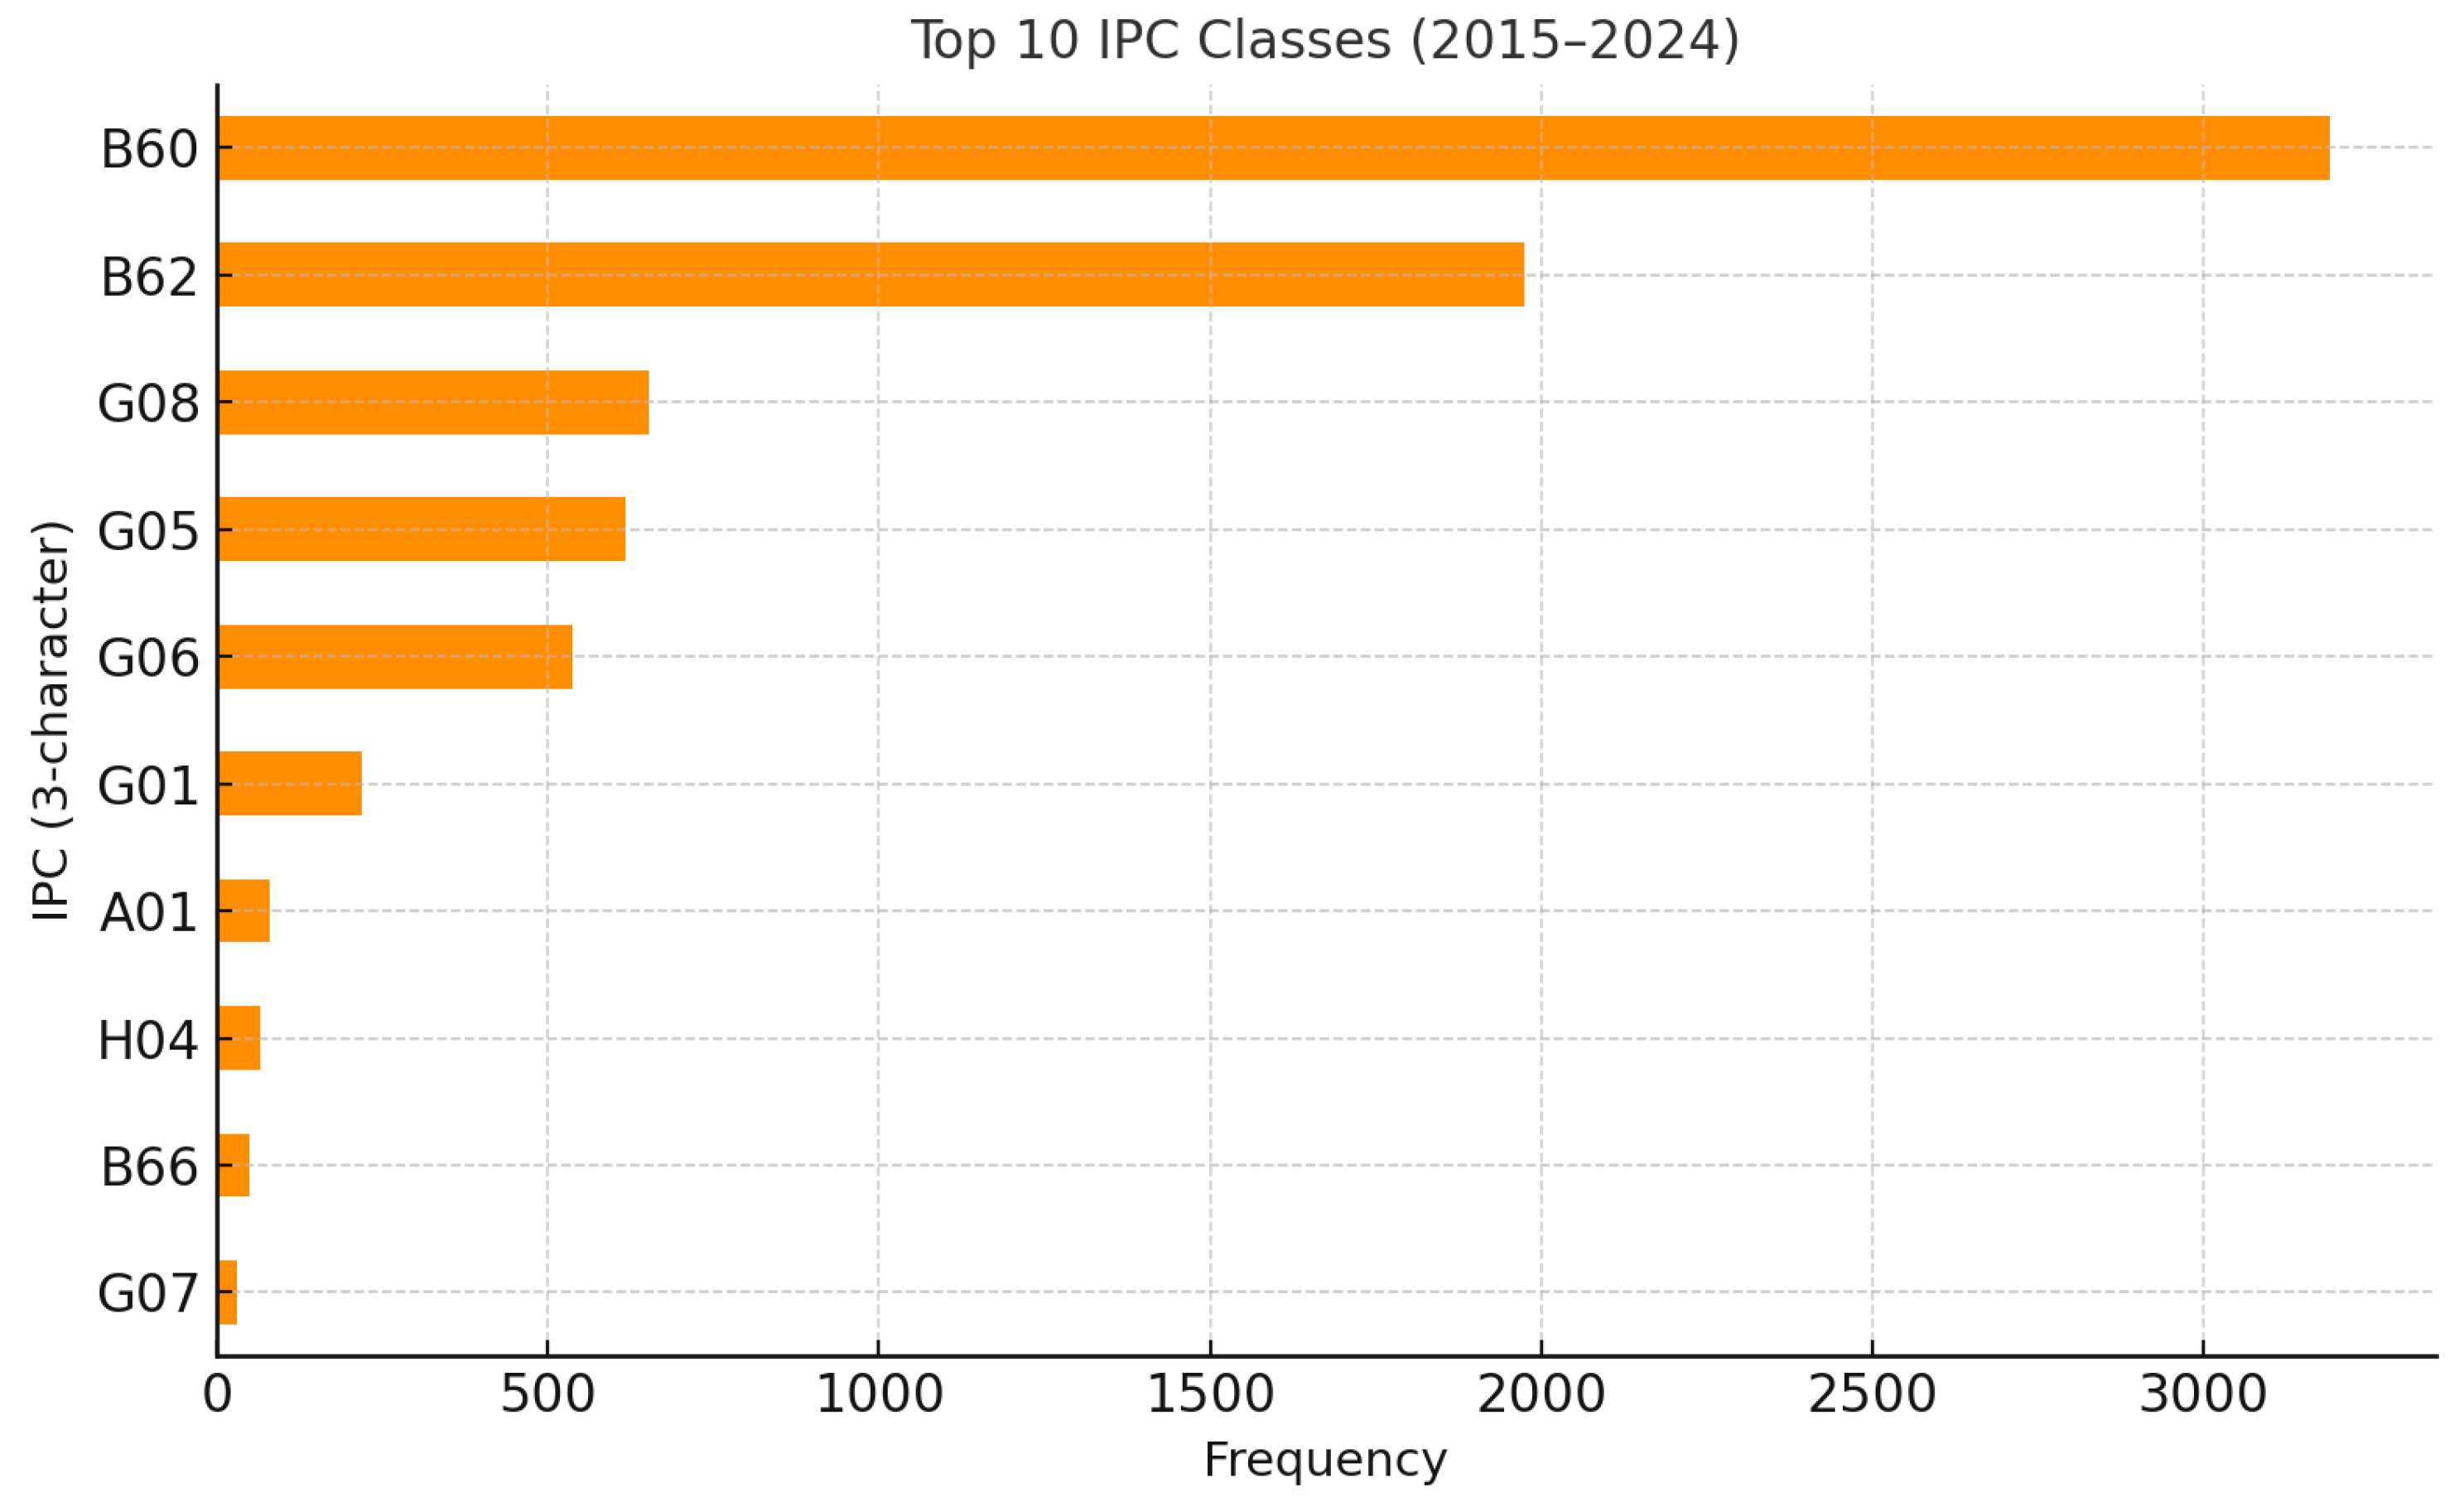
Figure 3 presents the ten most frequent International Patent Classification (IPC) categories at the three-character level. Because most patents are assigned to multiple IPC classes, a multi-assignment counting approach was adopted, in which each IPC associated with a single patent is counted once. This method allows for a more accurate representation of cross-domain technological convergence than relying solely on the main IPC. The results show that B60 (Vehicles in general) and B62 (Land vehicles for transport) dominate the logistics technology landscape, forming its mechanical backbone. In contrast, digital and connectivity-oriented domains such as G05 (Control/Regulation), G06 (Data Processing Systems), and G08 (Signaling/Monitoring) exhibit significant representation, indicating the increasing integration of automation, sensing, and data-driven management systems within logistics operations.
Table 1 compares the relative IPC shares between two subperiods, 2015–2018 and 2019–2024, to highlight structural shifts in technological focus. The mechanical vehicle-related classes (B60, B62) slightly declined (−3.4 pp and −1.4 pp, respectively), while digital and information-related categories (G06Q, H04W) expanded (+5.2 pp and +3.3 pp). This shift confirms the transition from hardware-oriented systems toward intelligent, connected, and software-driven logistics platforms. To enhance interpretability, Table 1 uses upward arrows (↑) to represent IPC categories that show an increase in relative share, and downward arrows (↓) to indicate categories exhibiting a decline.
Although the descriptive analysis covers the entire decade, the detailed empirical investigation in subsequent Section 4.2, Section 4.3, Section 4.4 and Section 4.5 focuses on the recent five-year period (2019–2024) to examine the most active and mature phase of convergence. This division provides both a long-term contextual understanding and a focused empirical assessment of current technological interactions in the logistics domain.

4.2. Network Structure and Graph Embedding

Building upon the descriptive results presented in Section 4.1, this section focuses on the empirical analysis of technological convergence in logistics systems using the most recent subset of patent data.
While the previous section provided a ten-year overview (2015–2024) to capture long-term trends, the empirical model concentrates on the five-year period from 2019 to 2024, which represents the most active phase of cross-domain innovation and digital transformation (see Table 2). This timeframe reflects the stage in which artificial intelligence (AI), automation, and data-driven logistics management systems emerged as dominant drivers of technological development. The dataset used for this analysis was derived from the same WIPO PATENTSCOPE query, restricted to patents published between 2019 and 2024. All patents were standardized through text preprocessing, IPC normalization, and multi-assignment treatment, supporting analytical consistency with the descriptive analysis. This dataset serves as the foundation for constructing the patent–technology network and for applying the proposed graph-based learning and main path analysis methods described in the following subsections.
To examine the relational characteristics of logistics-related technologies, a patent–keyword matrix (PKM) was constructed to capture co-occurrence relationships among technological terms extracted from patent titles and abstracts. Each patent was represented as a vector of its associated keywords, and pairwise connections were computed using Jaccard similarity to measure the extent of technological proximity between patents. This yielded a weighted patent–patent network where the presence and strength of edges denote the degree of shared conceptual elements.
The resulting PKM-based network comprised 4064 nodes and 13,100 weighted edges, with a density of 0.001586, indicating a sparse but non-random structure often observed in technology networks. Approximately 50.3% (2046 patents) were included in the giant connected component (GCC), demonstrating that half of the patents are indirectly linked through overlapping technological knowledge. To improve interpretability and minimize noise, only the top 15 strongest edges per node were retained, applying a minimum similarity threshold of 0.05.
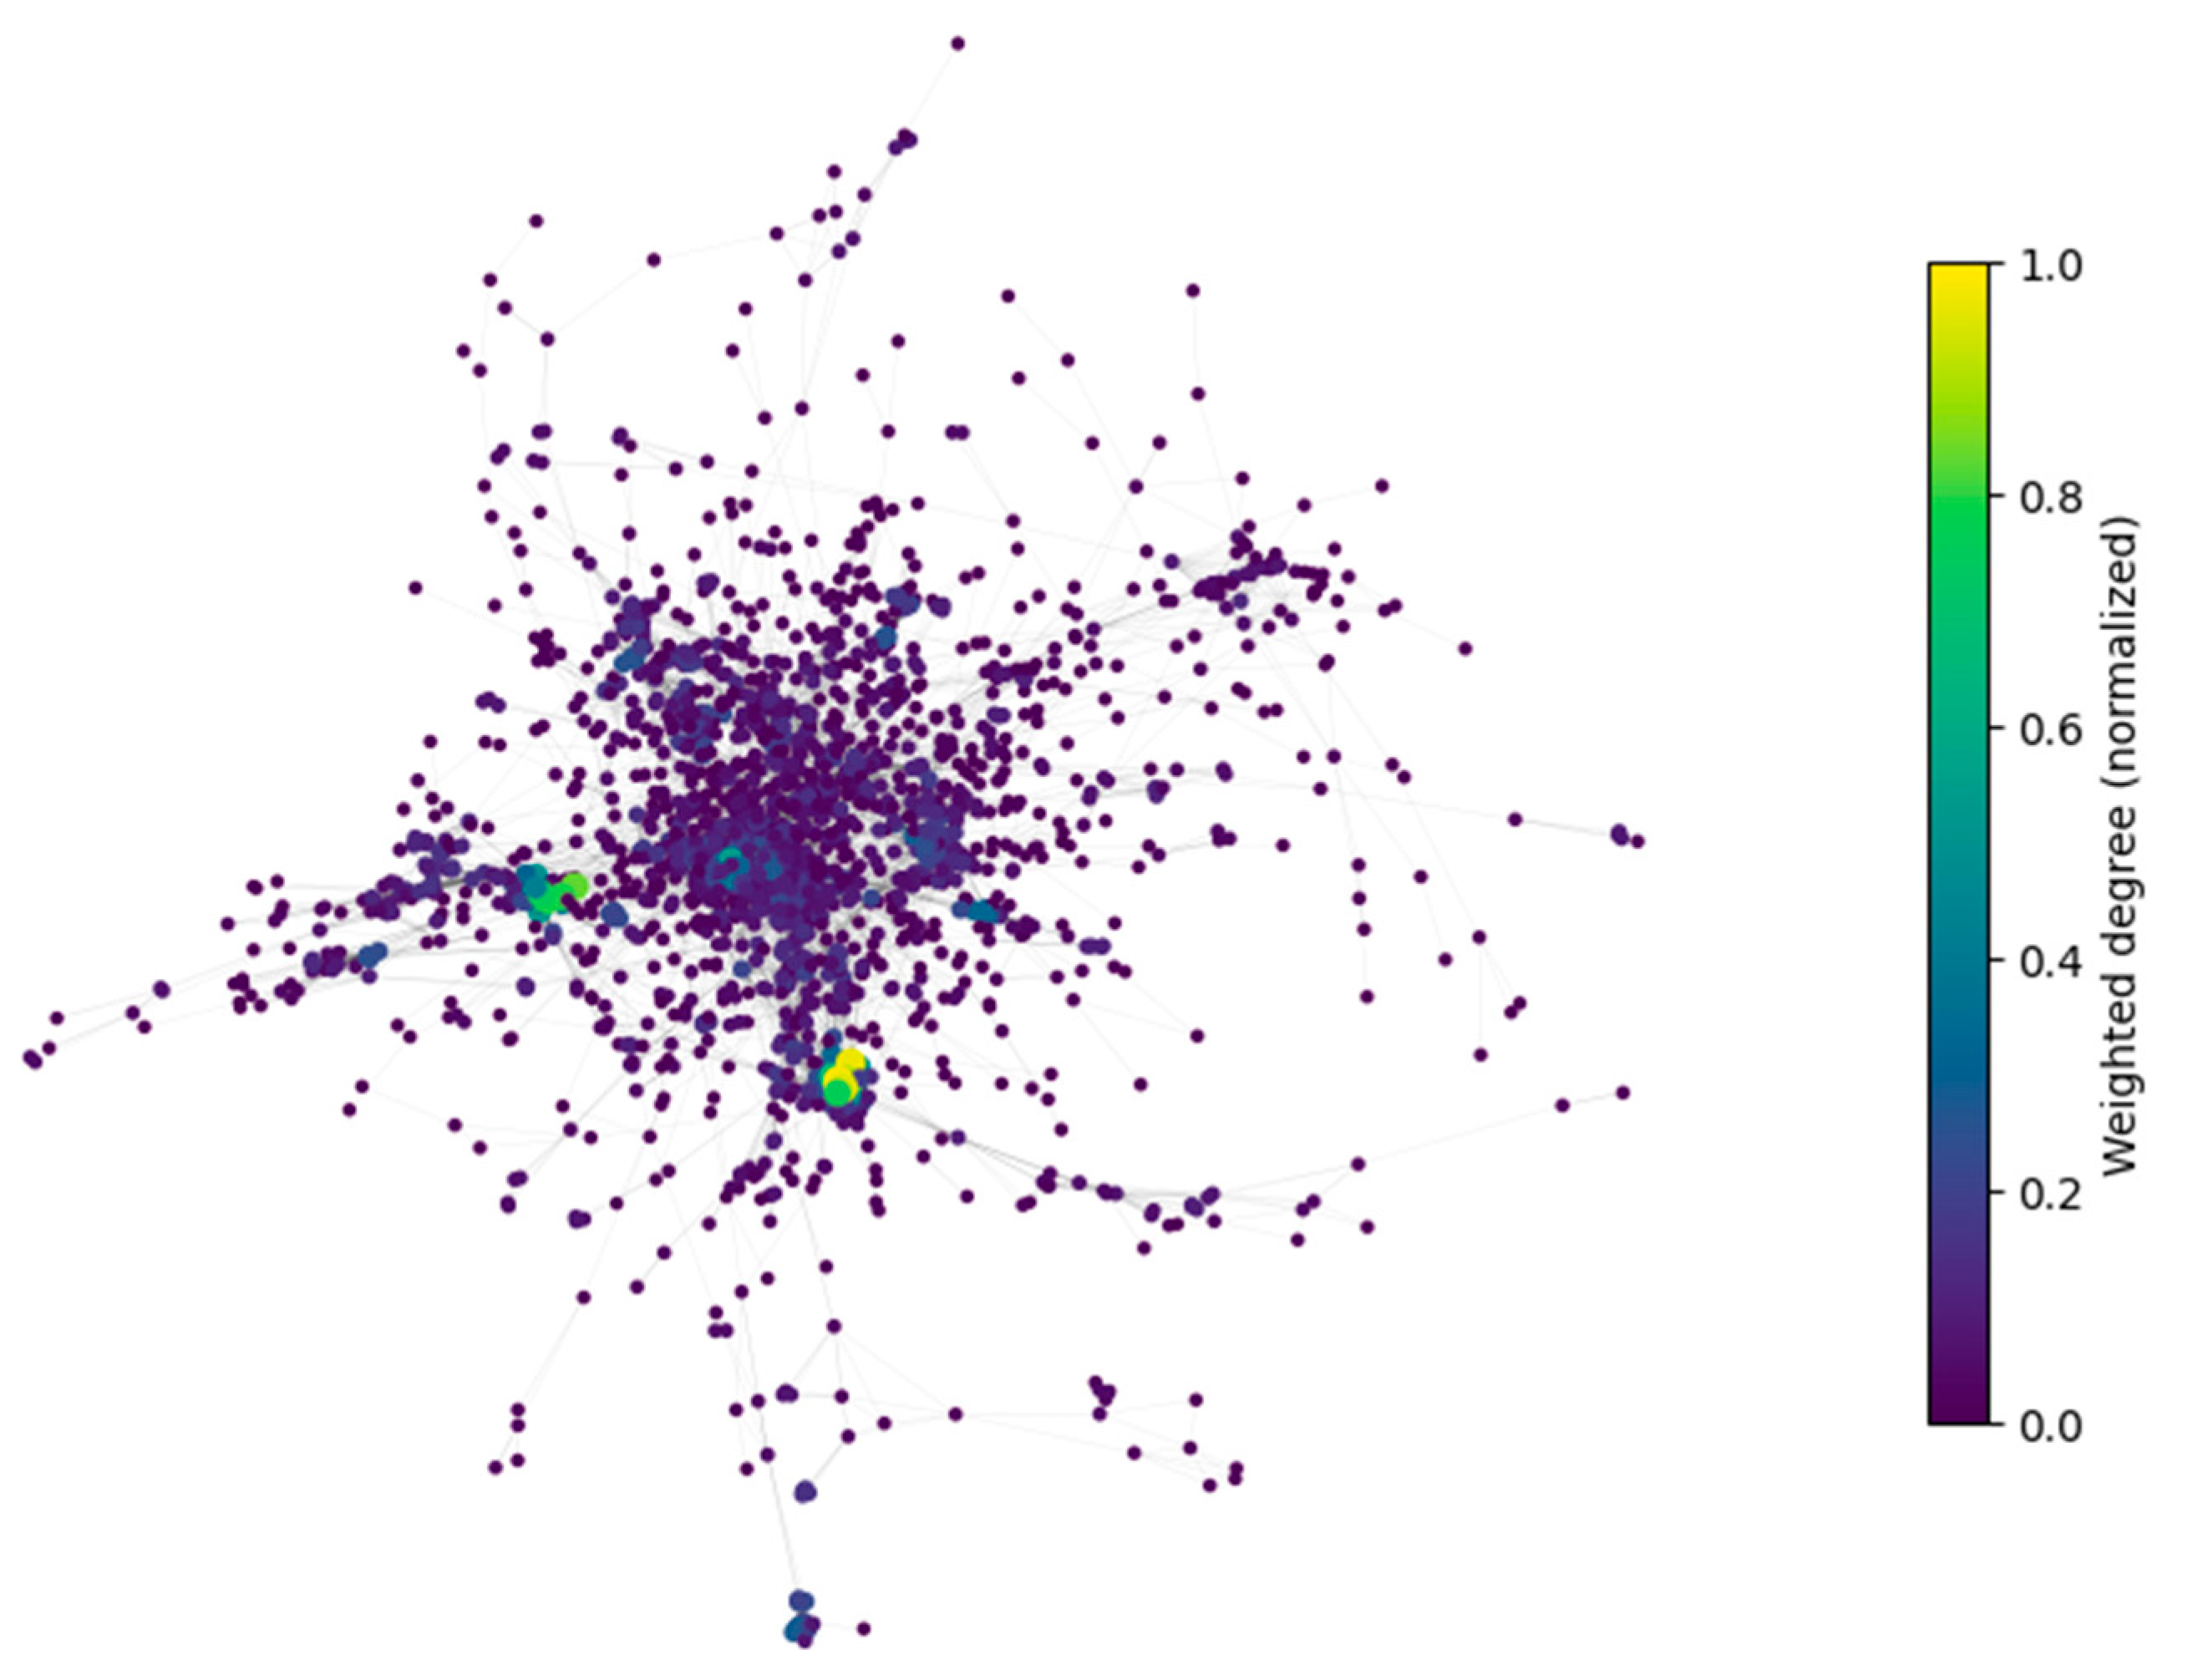
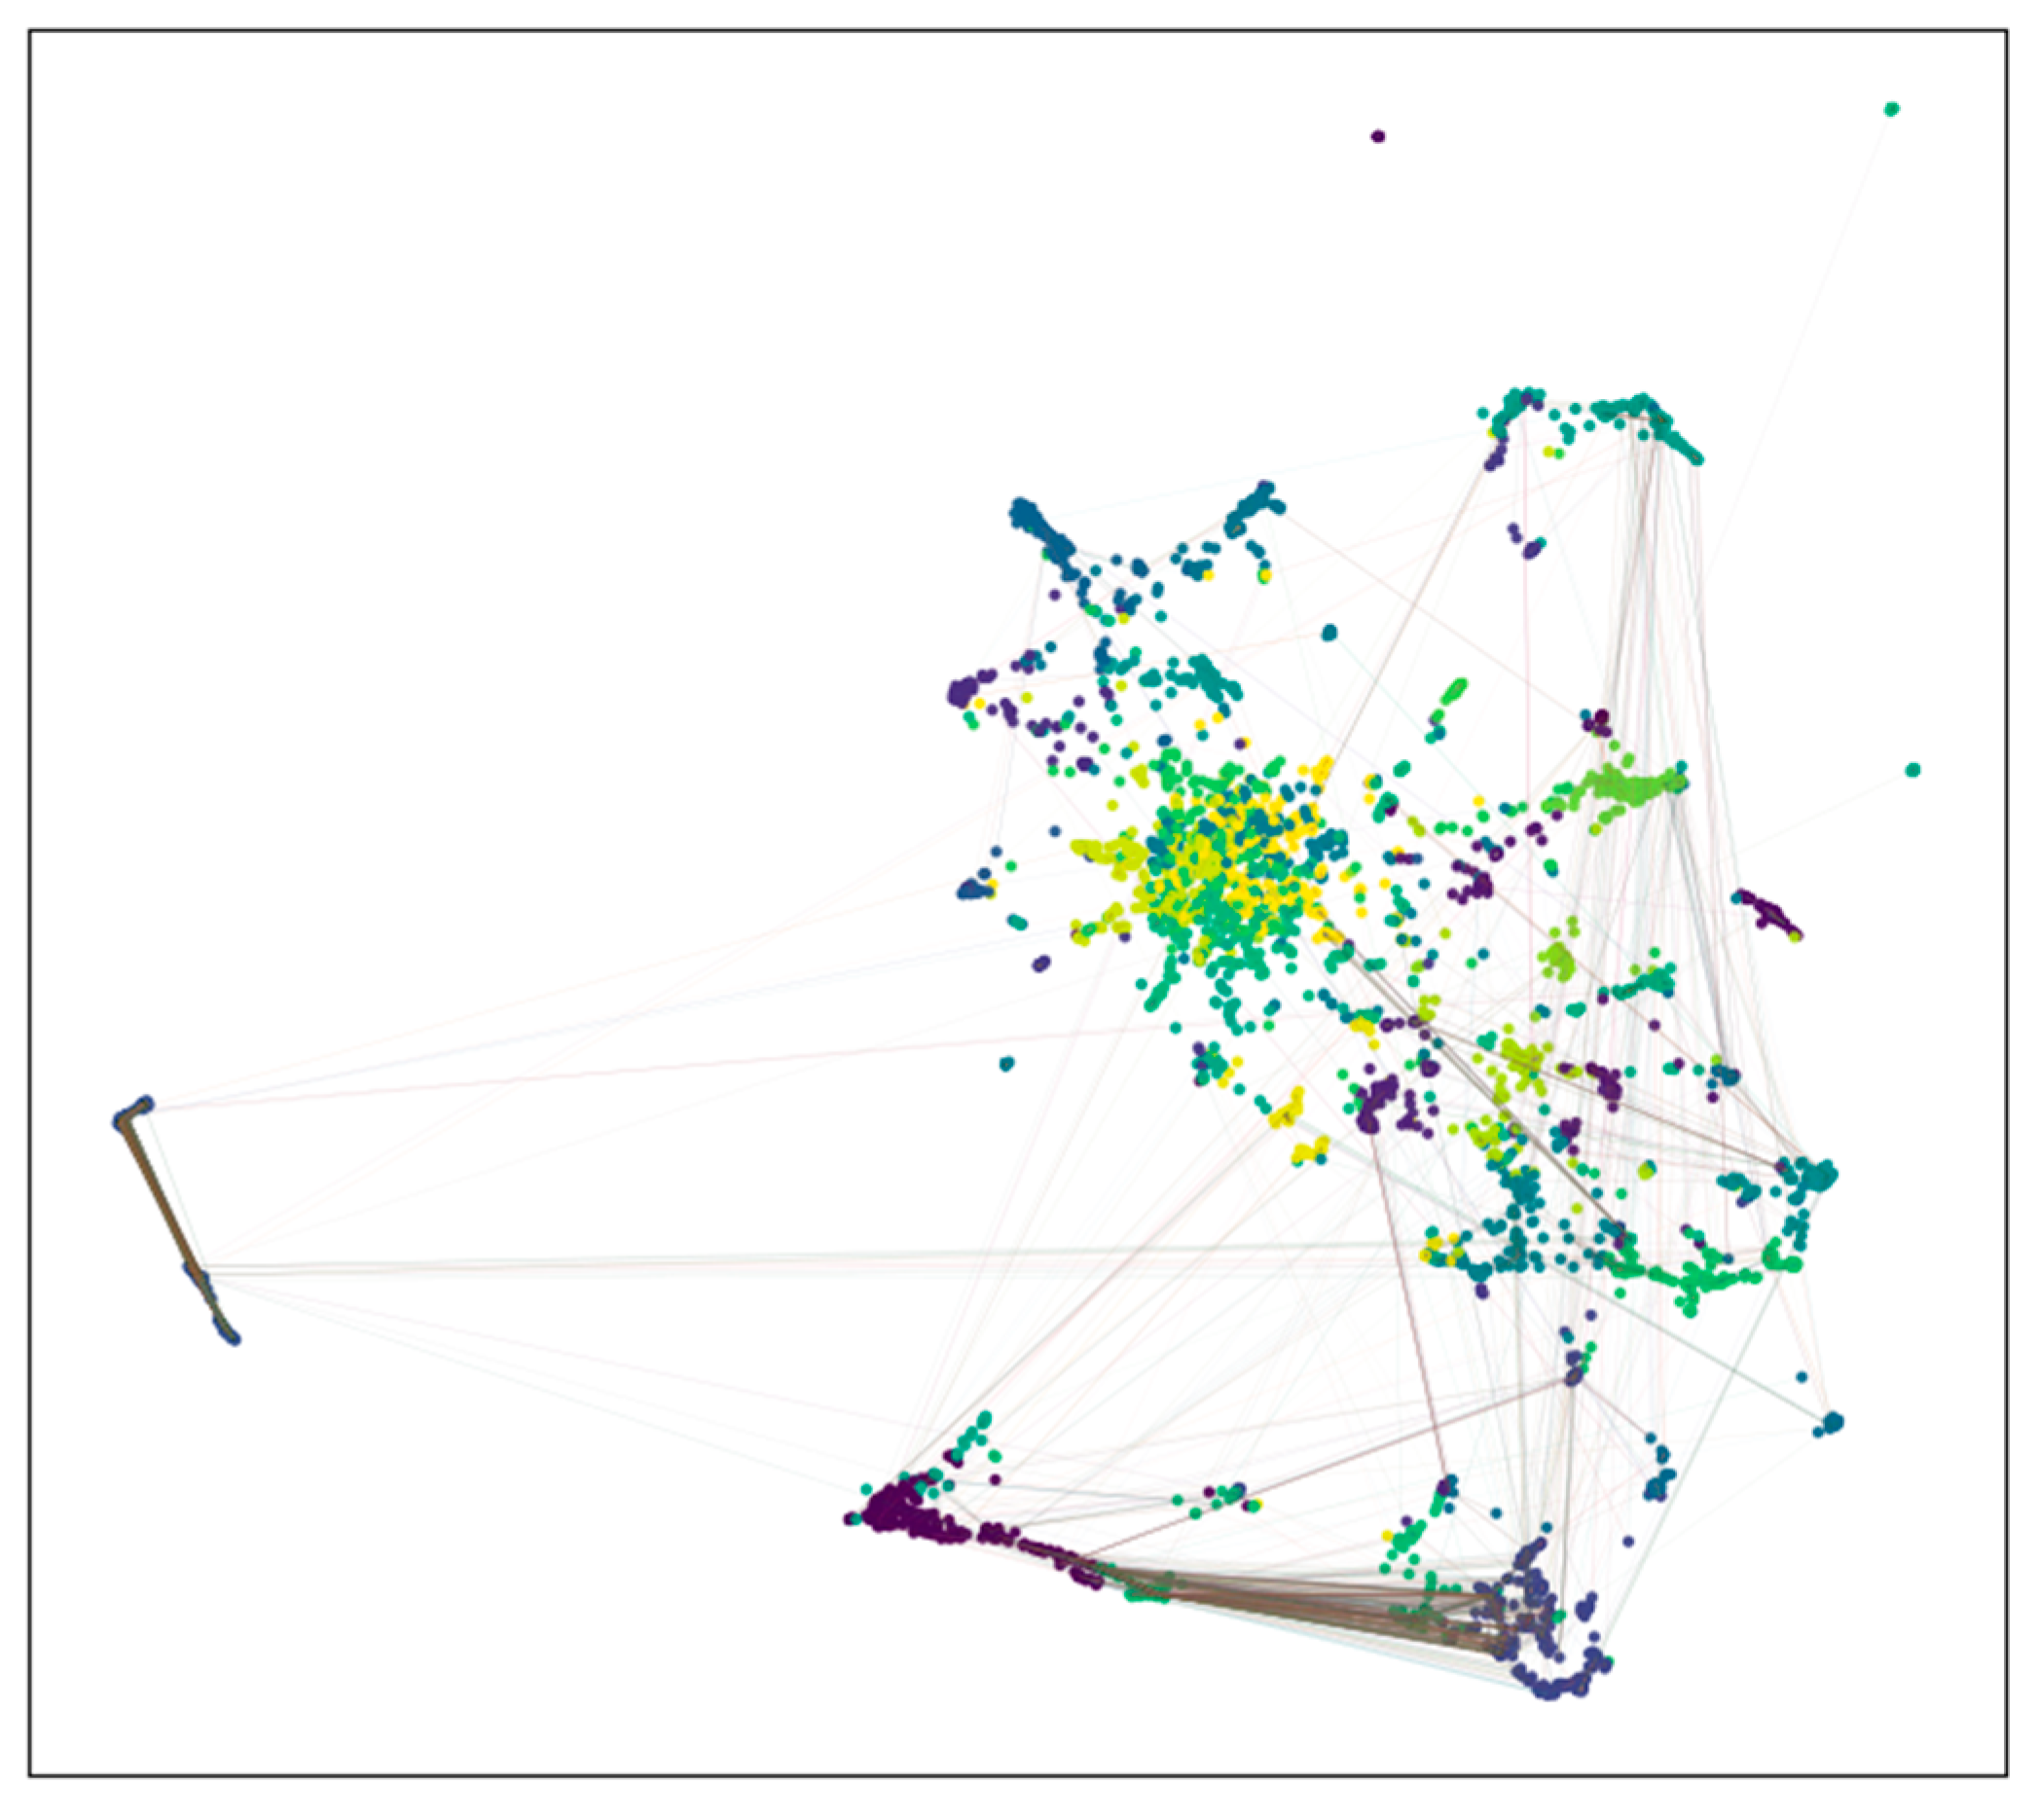
As illustrated in Figure 4, the overall topology exhibits a modular yet interconnected structure, typical of emerging technology systems where multiple sub-domains interact. The node color intensity represents the normalized weighted degree, indicating each patent’s structural importance within the network. High-degree nodes located near the center correspond to patents that bridge distinct technological clusters, serving as knowledge integration hubs. Quantitatively, the network’s weighted modularity (Q = 0.5439) suggests a moderate but significant community structure, while the mixing parameter (μ = 0.3592) indicates balanced inter-cluster connectivity, implying that technological domains are distinct yet interdependent.
A closer inspection of the central hubs and their associated keywords reveals dominant terms such as autonomous driving, vehicle control, IoT-based logistics, and automated handling systems. These co-located clusters collectively indicate active technological convergence between intelligent control, connectivity, and automation. In contrast, peripheral nodes represent more specialized or niche technologies such as warehouse robotics, supply chain optimization, and sensor calibration. This combination of high centrality and thematic co-occurrence demonstrates that innovation in the logistics sector increasingly emerges from the integration of automation, communication, and data-driven intelligence rather than isolated domain advances.
The PKM-derived network thus provides the structural foundation for the subsequent Variational Graph Autoencoder (VGAE) embedding. The VGAE learns latent feature representations that jointly preserve topological proximity and semantic similarity, allowing a more robust identification of hidden patterns of convergence and knowledge diffusion across logistics technology domains.

4.3. Clustering Results and Technological Grouping

The Variational Graph Autoencoder (VGAE) model was trained to embed the patent–keyword network into a low-dimensional latent space that preserves both semantic similarity and graph topology. The model was optimized using the Adam optimizer (learning rate = 1 × 10 3 , weight decay = 1 × 10 5 ), and training converged after approximately 220 epochs with a best reconstruction loss of 0.9125, indicating stable feature learning. (Figure 5).
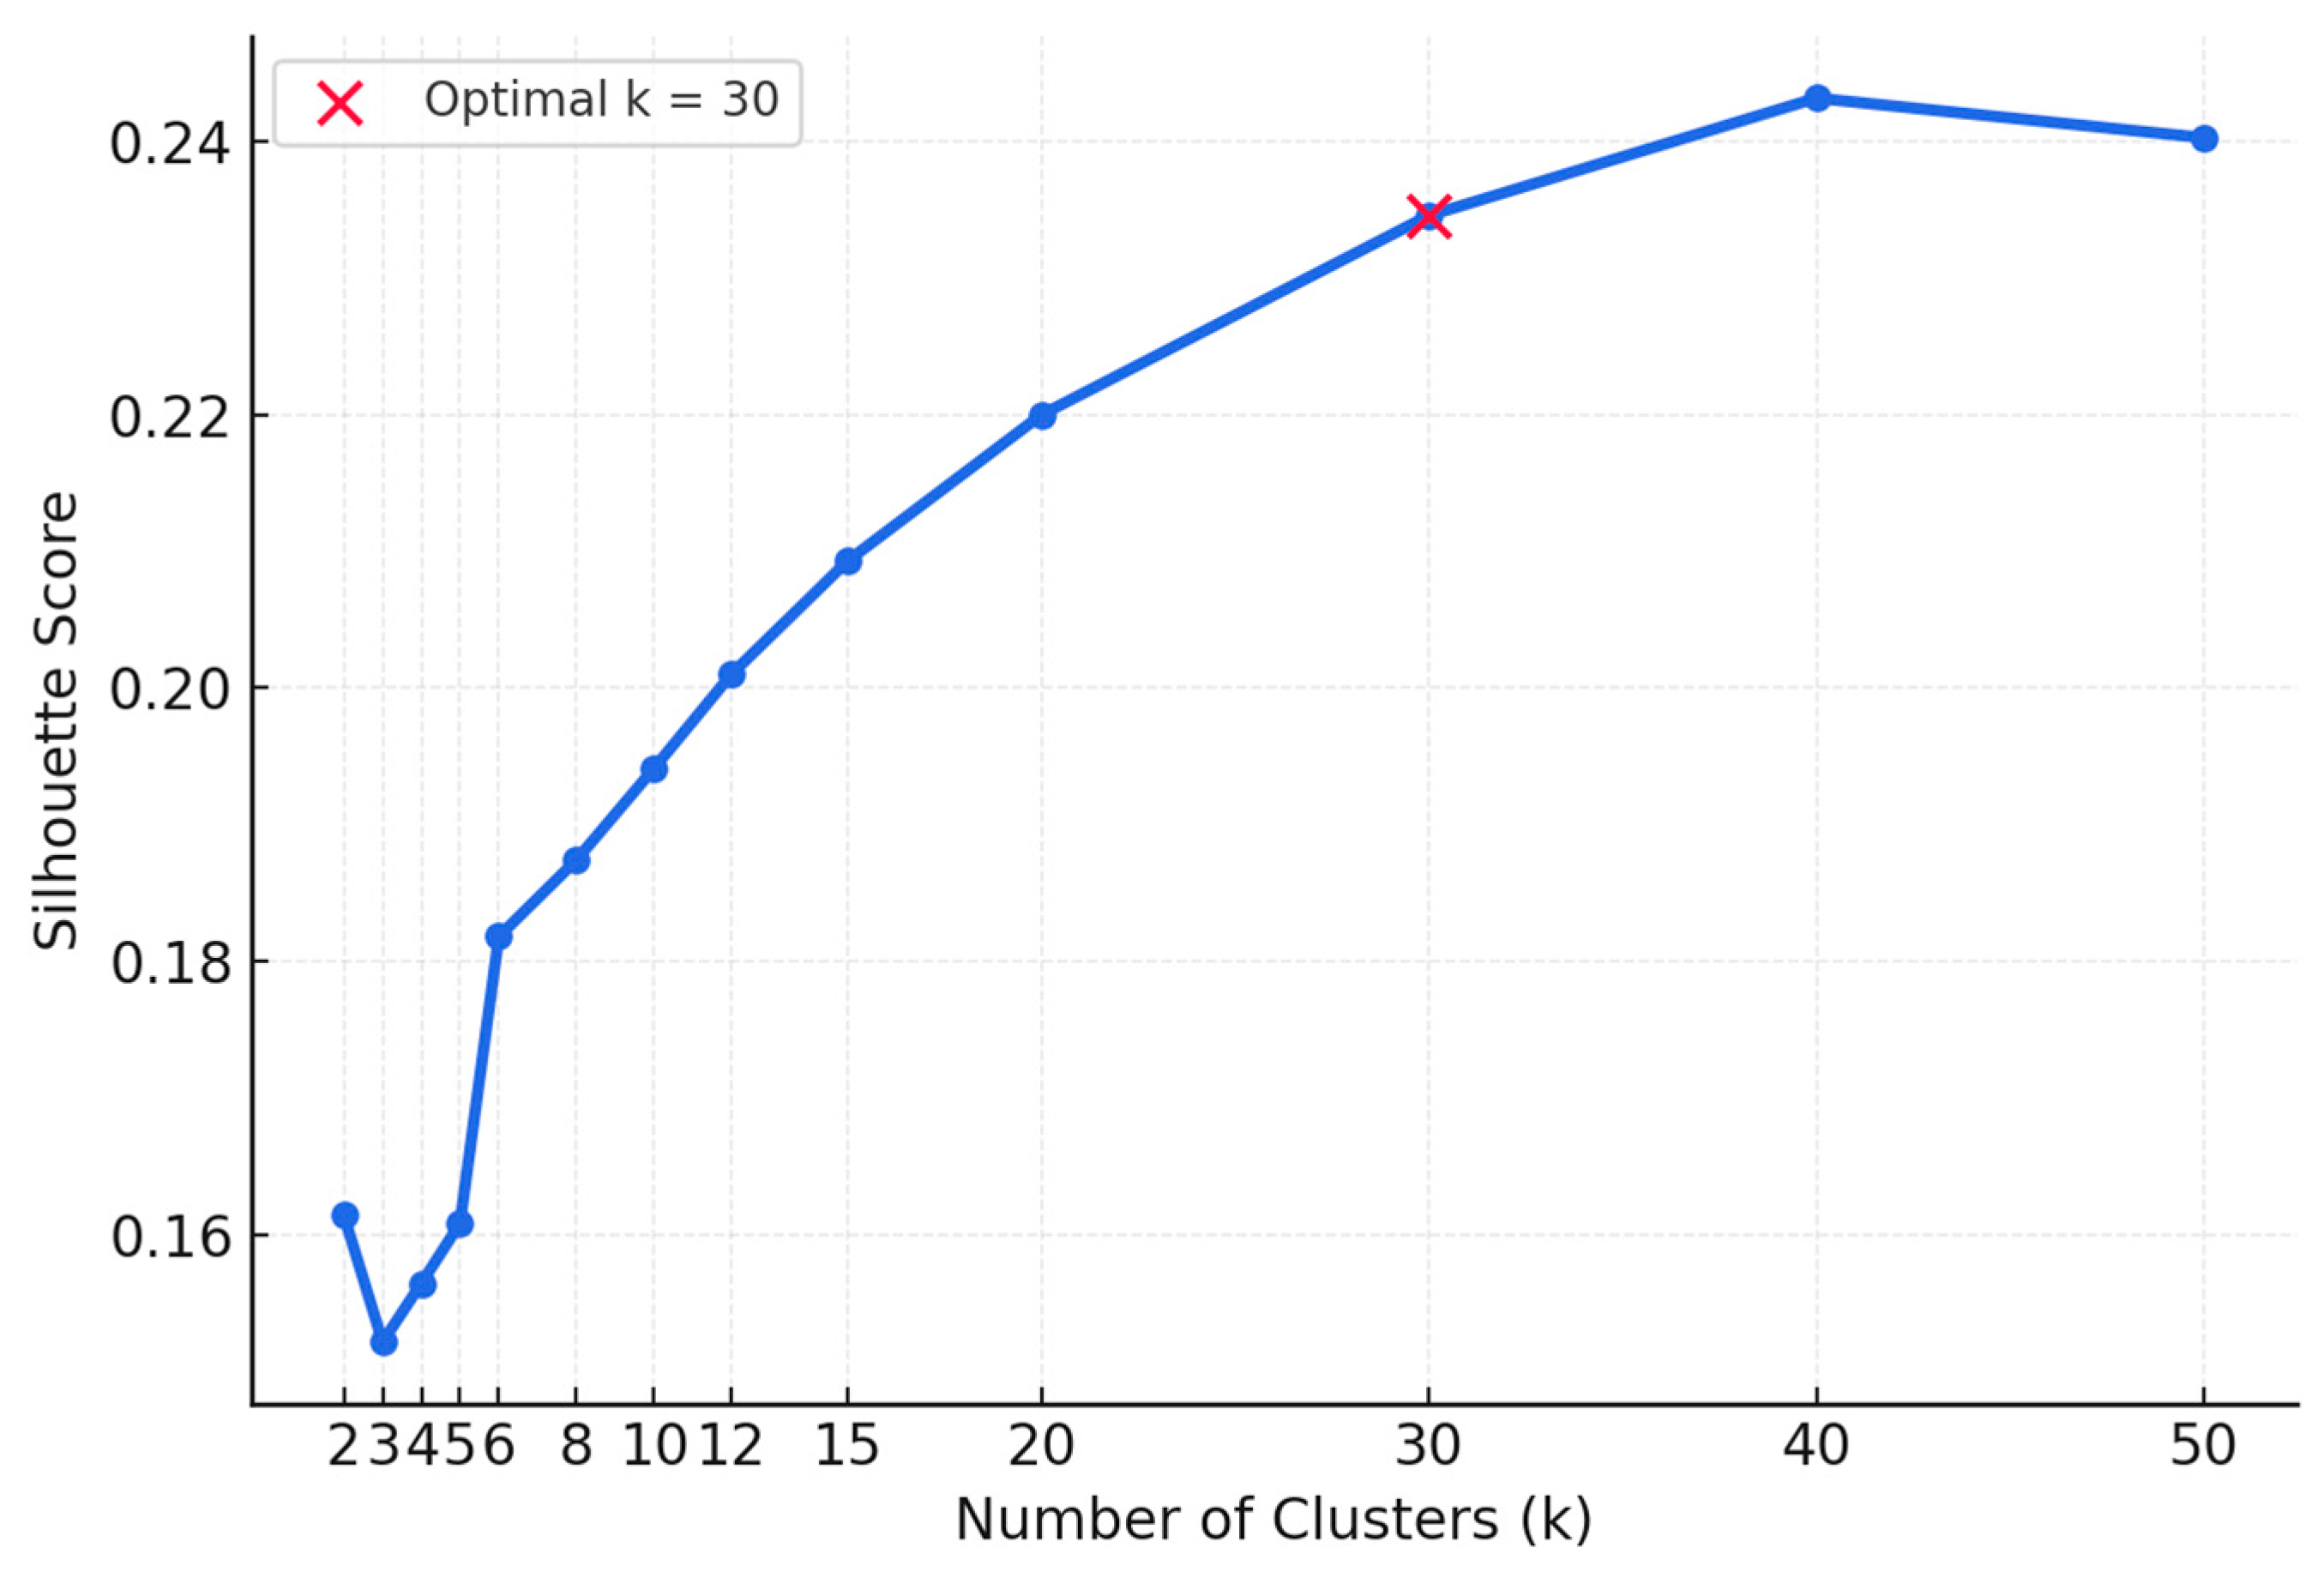
The number of clusters was determined through a silhouette coefficient sweep (–50), which exhibited a steady improvement from 0.161 atto 0.2346 at, after which performance stabilized. Therefore, was selected as the optimal configuration, supporting a balance between intra-cluster cohesion and inter-cluster separation.
To visualize the learned representations, the 128-dimensional embeddings were projected into a two-dimensional UMAP space. As shown in Figure 6, patents are distributed across several dense and sparsely connected subregions, implying distinct technological domains with varying degrees of convergence. The colors indicate variations in node density and local structural proximity within the latent VGAE space. The clustering analysis was conducted using the K-Means algorithm, where the optimal number of clusters (k = 30) was determined based on silhouette coefficients. The resulting structure demonstrated a weighted modularity (Q) of 0.5439 and a mixing parameter (μ) of 0.3592, confirming strong internal connectivity while maintaining meaningful inter-domain relationships.
The identified clusters were labeled using representative keywords derived from TF–IDF scores and linguistic patterns. The resulting taxonomy revealed four higher-level thematic domains across the logistics-related patent landscape:
  • Autonomous driving and perception systems—including steering, parking, and image-based assistive technologies (C0, C1, C3, C6, C10, C14, C25)
  • Electrified and connected vehicle platforms—such as EV charging, power management, and hybrid control architectures (C4, C8, C24)
  • Mobile robotics and logistics automation—encompassing AGV drive systems, unmanned vehicle operation, and robotic inspection (C12, C17, C19, C23)
  • Information processing and industrial control systems—including inventory management, decision-support algorithms, and sensor integration (C16, C20, C22, C28, C29).
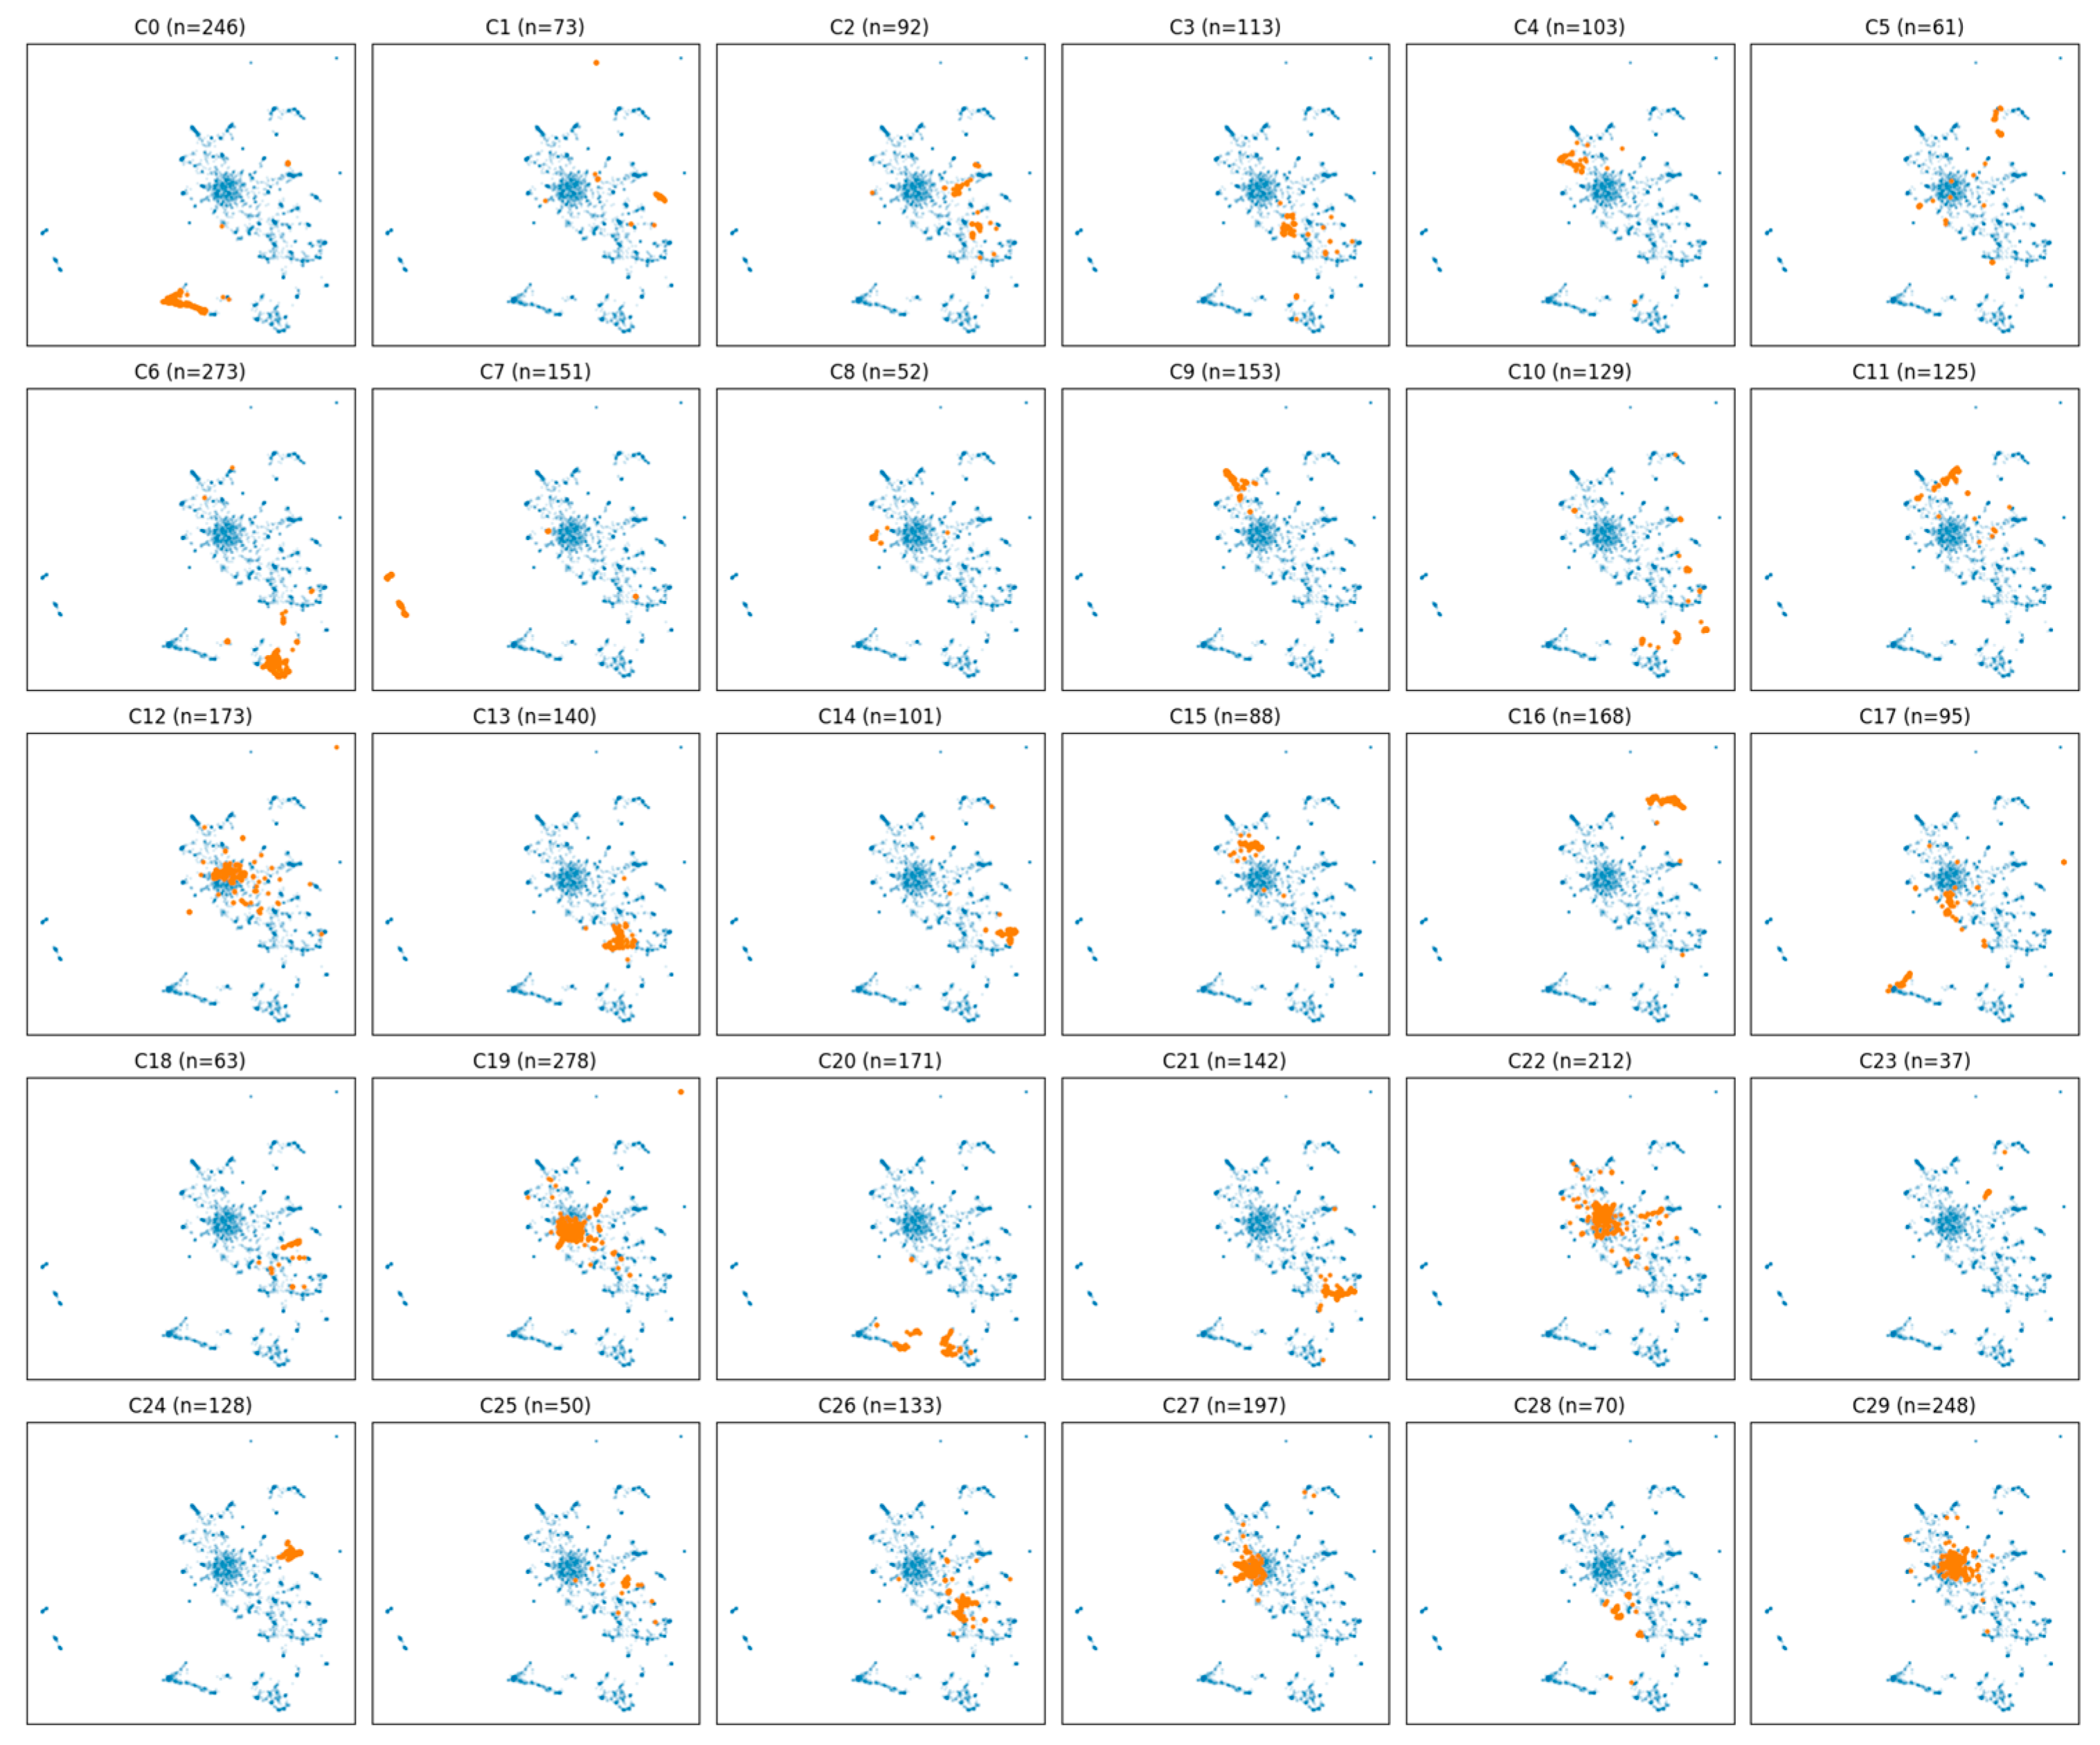
These groups collectively represent the technological convergence between automotive, robotics, and logistics domains. As shown in Figure 7, Orange nodes represent patents belonging to the highlighted cluster, while blue nodes refer to all other patents. Spatial visualization of the VGAE–UMAP revealed that autonomous driving clusters (e.g., C0, C3, C6) occupy a central region with dense connectivity, whereas robotics and electrification clusters (e.g., C12, C19, C8) form peripheral yet tightly bound communities. This configuration implies a directional evolution where innovations transition from core vehicle-control technologies toward integrated logistics and electrified mobility systems. For instance, clusters related to parking assistance and steering control are closely positioned to mobile robotics clusters, suggesting that perception-driven vehicle control has served as a technological bridge toward unmanned logistics and smart mobility platforms. (Refer to Appendix A for cluster-specific information).
In summary, the clustering analysis confirms that recent developments in the logistics patent landscape are characterized by a continuous shift from vehicle-centric control technologies to robotics-assisted automation and electrified platforms. This latent structure provides an empirical foundation for exploring technological trajectories and knowledge diffusion patterns, which will be examined in detail through the Main Path Analysis in the subsequent section.

4.4. GlobalMain Path Analysis

To uncover the longitudinal flow of technological knowledge within the patent–keyword network, a Main Path Analysis (MPA) was conducted using the Search Path Link Count (SPLC) algorithm. The SPLC-based weighting captures how frequently a citation link participates in distinct knowledge diffusion paths, thereby highlighting the most influential and recurrent technological transitions in the network. Temporal alignment was incorporated by mapping cluster-level mean publication years to a directed acyclic graph (DAG), resulting in a time-ordered main path that reflects both structural and chronological continuity.
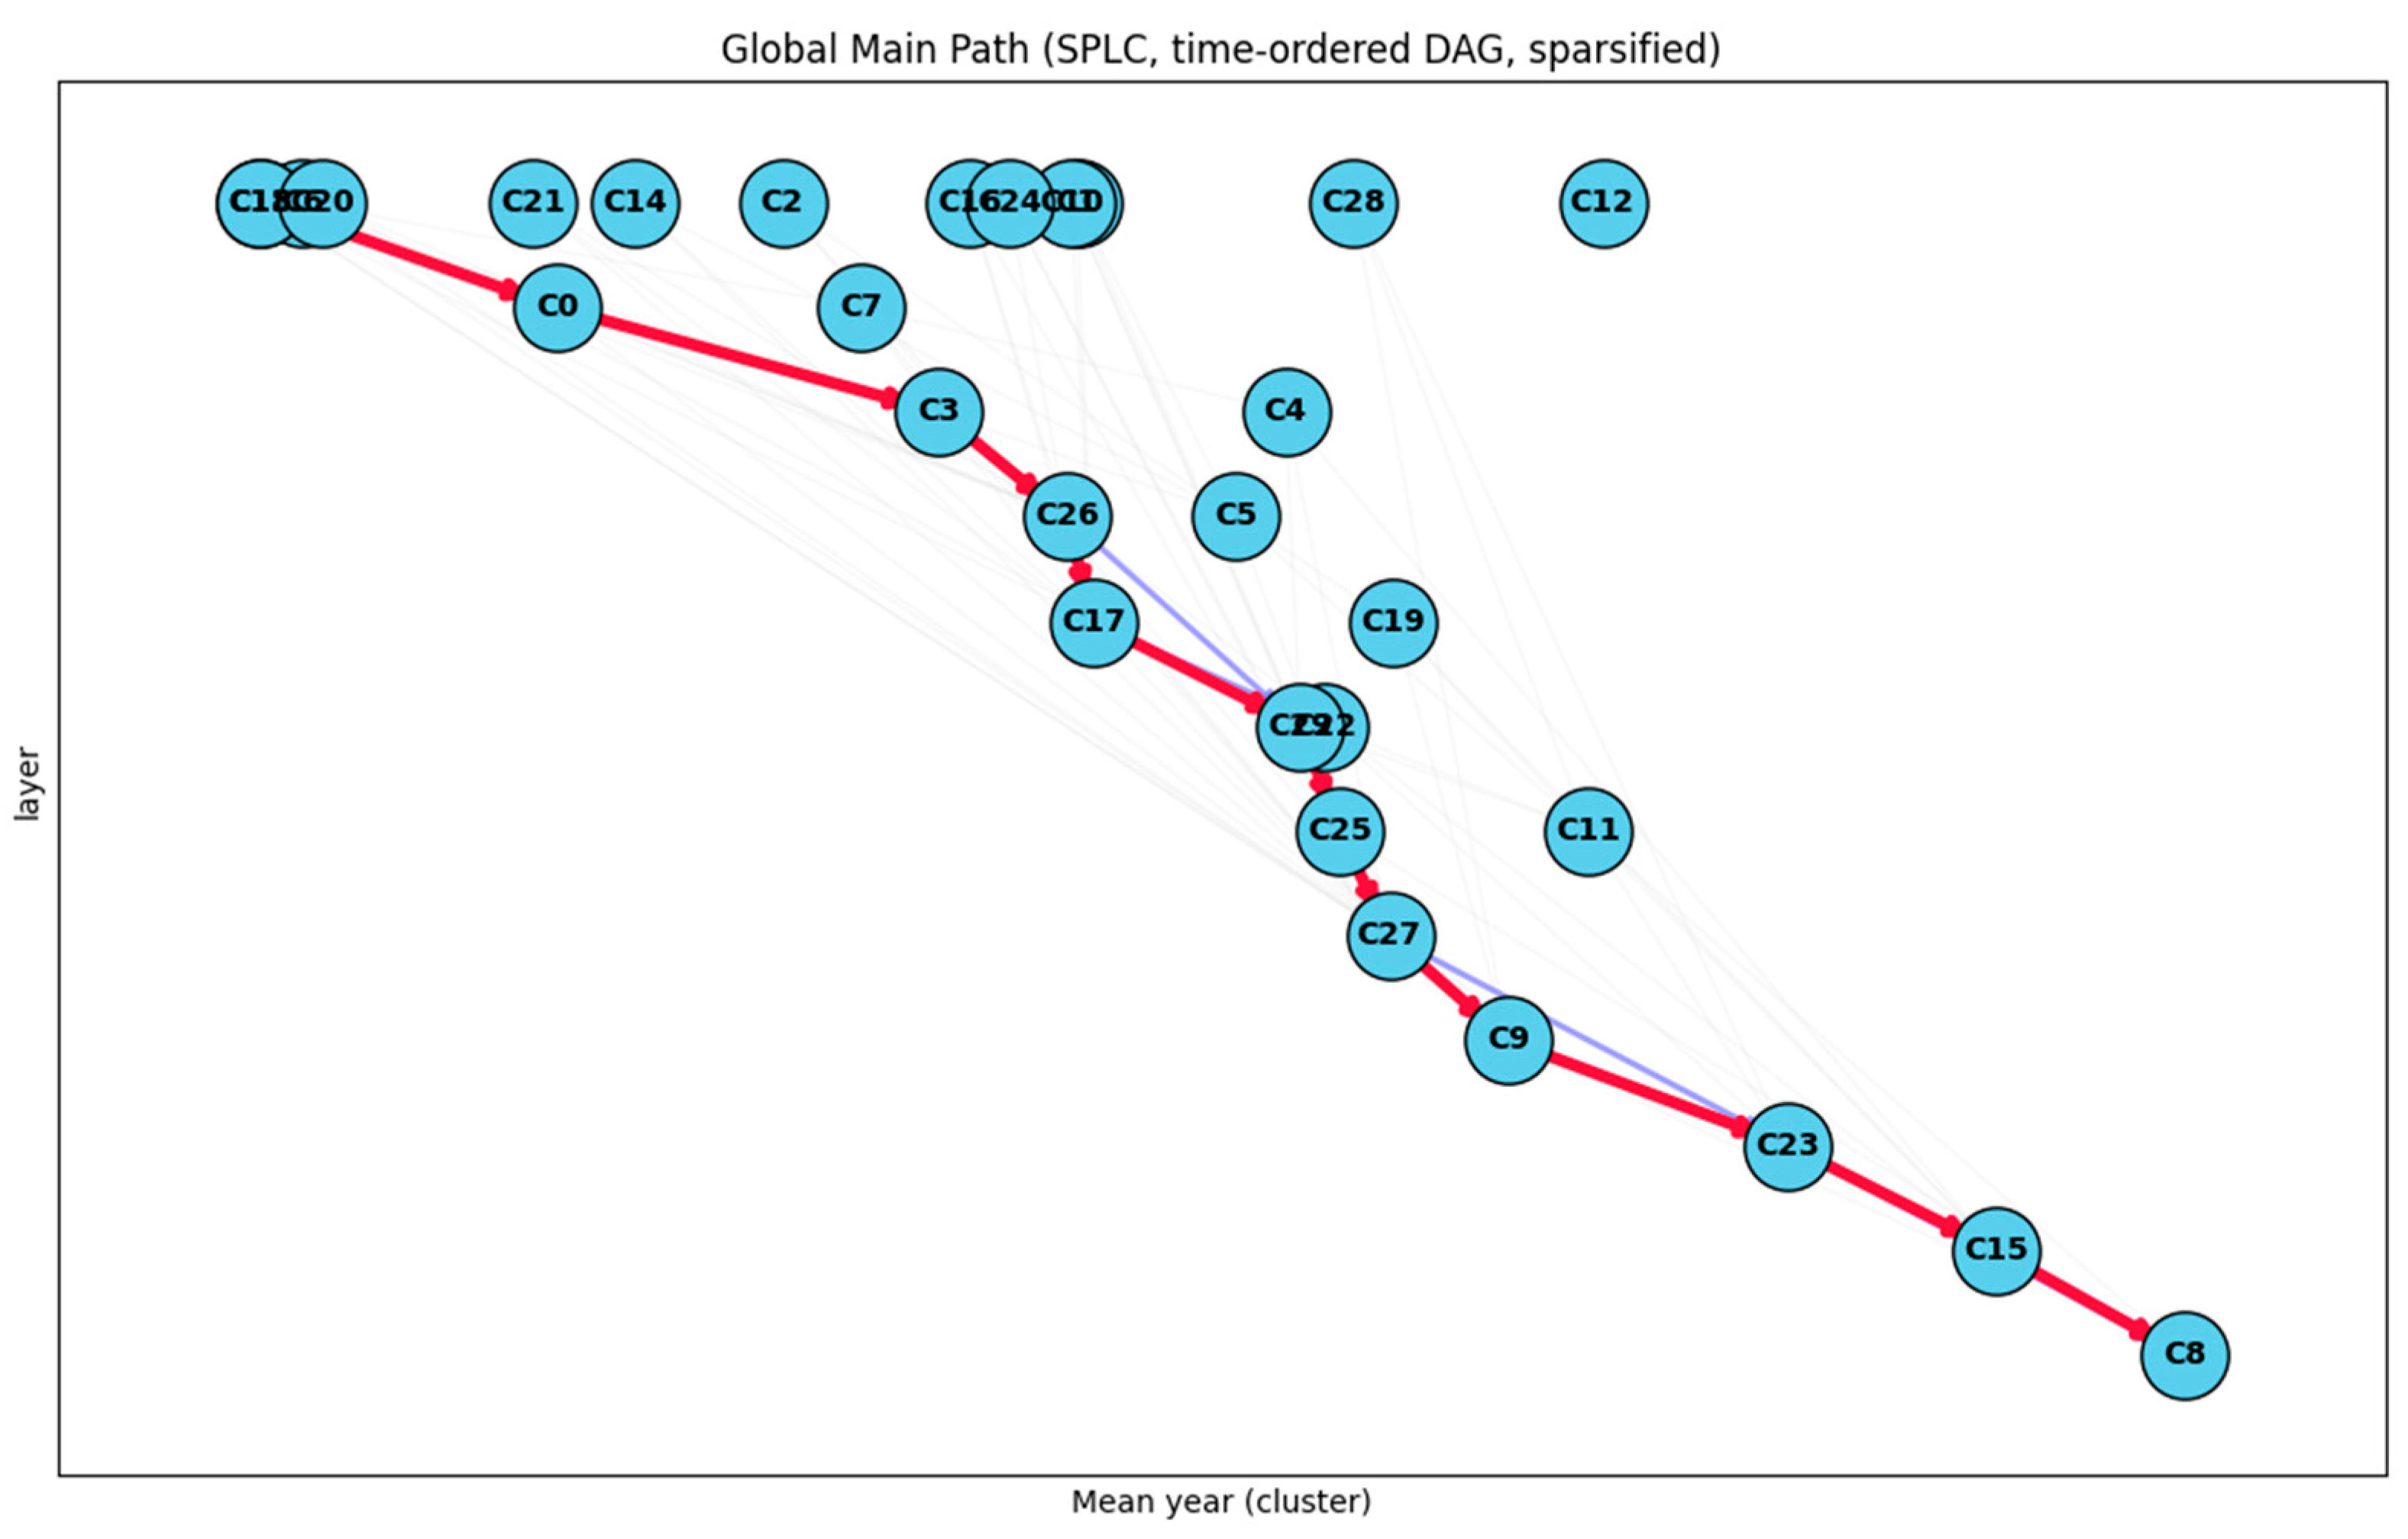
The global main trajectory identified from the weighted network is: C13 → C0 → C3 → C26 → C17 → C29 → C25 → C27 → C9 → C23 → C15 → C8.
This pathway consists of 12 sequential clusters, representing the dominant technological progression in the logistics-related innovation space. The main-path length is 12, and its contribution ratio (Main/Total), representing the fraction of total SPLC weight concentrated along this route, is 62.5%, indicating that nearly half of the network’s knowledge diffusion is centralized within this path. The results indicate that the extracted main trajectory not only captures the core diffusion backbone but alsointegrates the temporal dimension of innovation.
The structural topology is visualized in Figure 8, where node positions correspond to the mean publication year of each cluster, and the vertical axis represents hierarchical layers. The red line highlights the global main path, while blue lines represent supplementary edges in the sparsified DAG. Thicker red edges denote high-SPLC transitions, revealing that the link weights are strongly aligned with temporal progression—i.e., older clusters serve as sources of technological diffusion, while newer clusters act as sinks, reflecting a time-aware convergence of innovation.
The main path can be segmented into three distinct evolutionary phases:
  • Early Phase (C13 → C0 → C3)—This initial segment represents the emergence of vehicle-centric control and perception systems, focusing on steering control, parking assistance, and image-based trajectory recognition. These clusters form the foundation of intelligent driving support technologies.
  • Middle Phase (C26 → C17 → C29 → C25)—The intermediate section corresponds to the expansion of these foundations into autonomous and logistics-oriented applications, including method-driven control logic, unmanned transport systems, trailer guidance, and materials-handling optimization. This phase marks the operational deployment of autonomous technologies into practical mobility and logistics contexts.
  • Late Phase (C27 → C9 → C23 → C15 → C8)—The final stage represents a convergence toward industrial robotics and electrified platforms, encompassing chassis automation, inspection robotics, articulated mechanisms, and EV battery management. This shift signifies the transformation from vehicle-specific control systems to integrated smart robotics and electrified mobility platforms.
Temporal and hierarchical validation confirmed that clusters along the main path are arranged in a chronologically consistent manner:
  • Lower-layer clusters (C13) represent the earliest innovation nodes.
  • Middle layers (C26, C17, C29, C25) dominate, corresponding to the diffusion of automation and AGV-based control logic.
  • Upper layers (C23, C15, C8) are concentrated, demonstrating the transition into robotics-driven and electrified solutions.
This consistent layered structure (see Figure 7) empirically validates that SPLC-weighted connections are not random or purely structural, but time-sensitive and directionally aligned, reflecting the real-world progression of technological knowledge over the past decade. From vehicle-control and perception systems → through autonomous logistics operations → to smart robotics and electrified platforms.

4.5. Methodological Validation

To verify the robustness and comparative performance of the proposed VGAE–MPA (Variational Graph Autoencoder + Main Path Analysis) model, two baseline models were implemented: (1) LDA + MPA, which applies probabilistic topic modeling to extract semantic structures of patent data [93,94], and (2) TF–IDF Network + Centrality, which constructs co-occurrence keyword networks to represent structural linkages [95,96]. All three models were applied to the same 2019–2024 patent dataset to ensure methodological consistency. The evaluation focused on three complementary criteria—Structural Coherence, Temporal Alignment, and Interpretability—representing structural, temporal, and cognitive aspects of technological convergence analysis.

4.5.1. Structural Coherence

Structural coherence measures how each model captures the internal connectivity of technologies within the analytical network.
For the LDA + MPA model, patents were represented through latent topics derived from probabilistic word distributions P(wz), and coherence was computed as the mean cosine similarity between connected topics:
S C L D A = 1 E ( i , j ) E M P A P ( w z i ) · P ( w z j ) P ( w z i ) P ( w z j )
This produced a relatively low coherence score (0.42) due to weak overlap among topic clusters, a limitation commonly observed in text-mining-based patent studies [97]. The TF–IDF Network + Centrality approach improved the result slightly (0.47) by capturing keyword co-occurrence frequencies; however, its network lacked contextual depth because edges were defined by frequency rather than meaning [98]. The proposed VGAE–MPA achieved the highest structural coherence (0.63), as it integrates both topological and semantic information through graph embeddings Z = f ( X , A ) , preserving latent interdependencies between technological domains [99].

4.5.2. Temporal Alignment

Temporal alignment quantifies how accurately each model captures the chronological diffusion of technologies. For every main path p, the ratio of chronologically consistent node pairs was computed as:
T A p = 1 N p ( i < j ) N ( t i t j )
where t i and t j denote the application years of patents i and j .
The LDA + MPA model achieved 0.36, since its topic transitions were purely semantic and often inconsistent with the actual sequence of innovation. The TF–IDF Network + Centrality model improved slightly (0.40), reflecting limited directional information in its static structure. The VGAE–MPA, on the other hand, reached 0.51,embedding temporal smoothness within the latent space and generating main paths that followed realistic innovation sequences [100]. This result demonstrates that incorporating temporal edge weighting into the graph structure enhances chronological fidelity in convergence analysis.

4.5.3. Interpretability

Interpretability refers to how intuitively the model’s outcomes can be explained in terms of technological meaning and convergence mechanisms. The LDA + MPA model interprets convergence primarily through word similarity among topics, providing linguistic transparency but often grouping semantically distinct technologies under similar keyword clusters [101]. It can explain what technologies use similar terms but not how they interact or evolve.
The TF–IDF Network + Centrality approach offers better visibility of relational structure but fails to represent temporal progression; relationships are static and lack directionality, making it difficult to trace how technologies diffuse over time. Thus, it visualizes who is connected to whom, but not when or why these connections form.
In contrast, the VGAE–MPA model provides multi-level interpretability by embedding semantic, structural, and temporal relationships into a unified latent representation. The resulting main paths reveal coherent and directional transitions—e.g., AI-driven logistics optimization → IoT-based tracking systems → autonomous delivery technologies—which align with real-world innovation trends in logistics [102]. This integrated interpretability allows VGAE–MPA to uncover not only what and who are connected, but also how and when technological convergence occurs.

4.5.4. Comparative Discussion

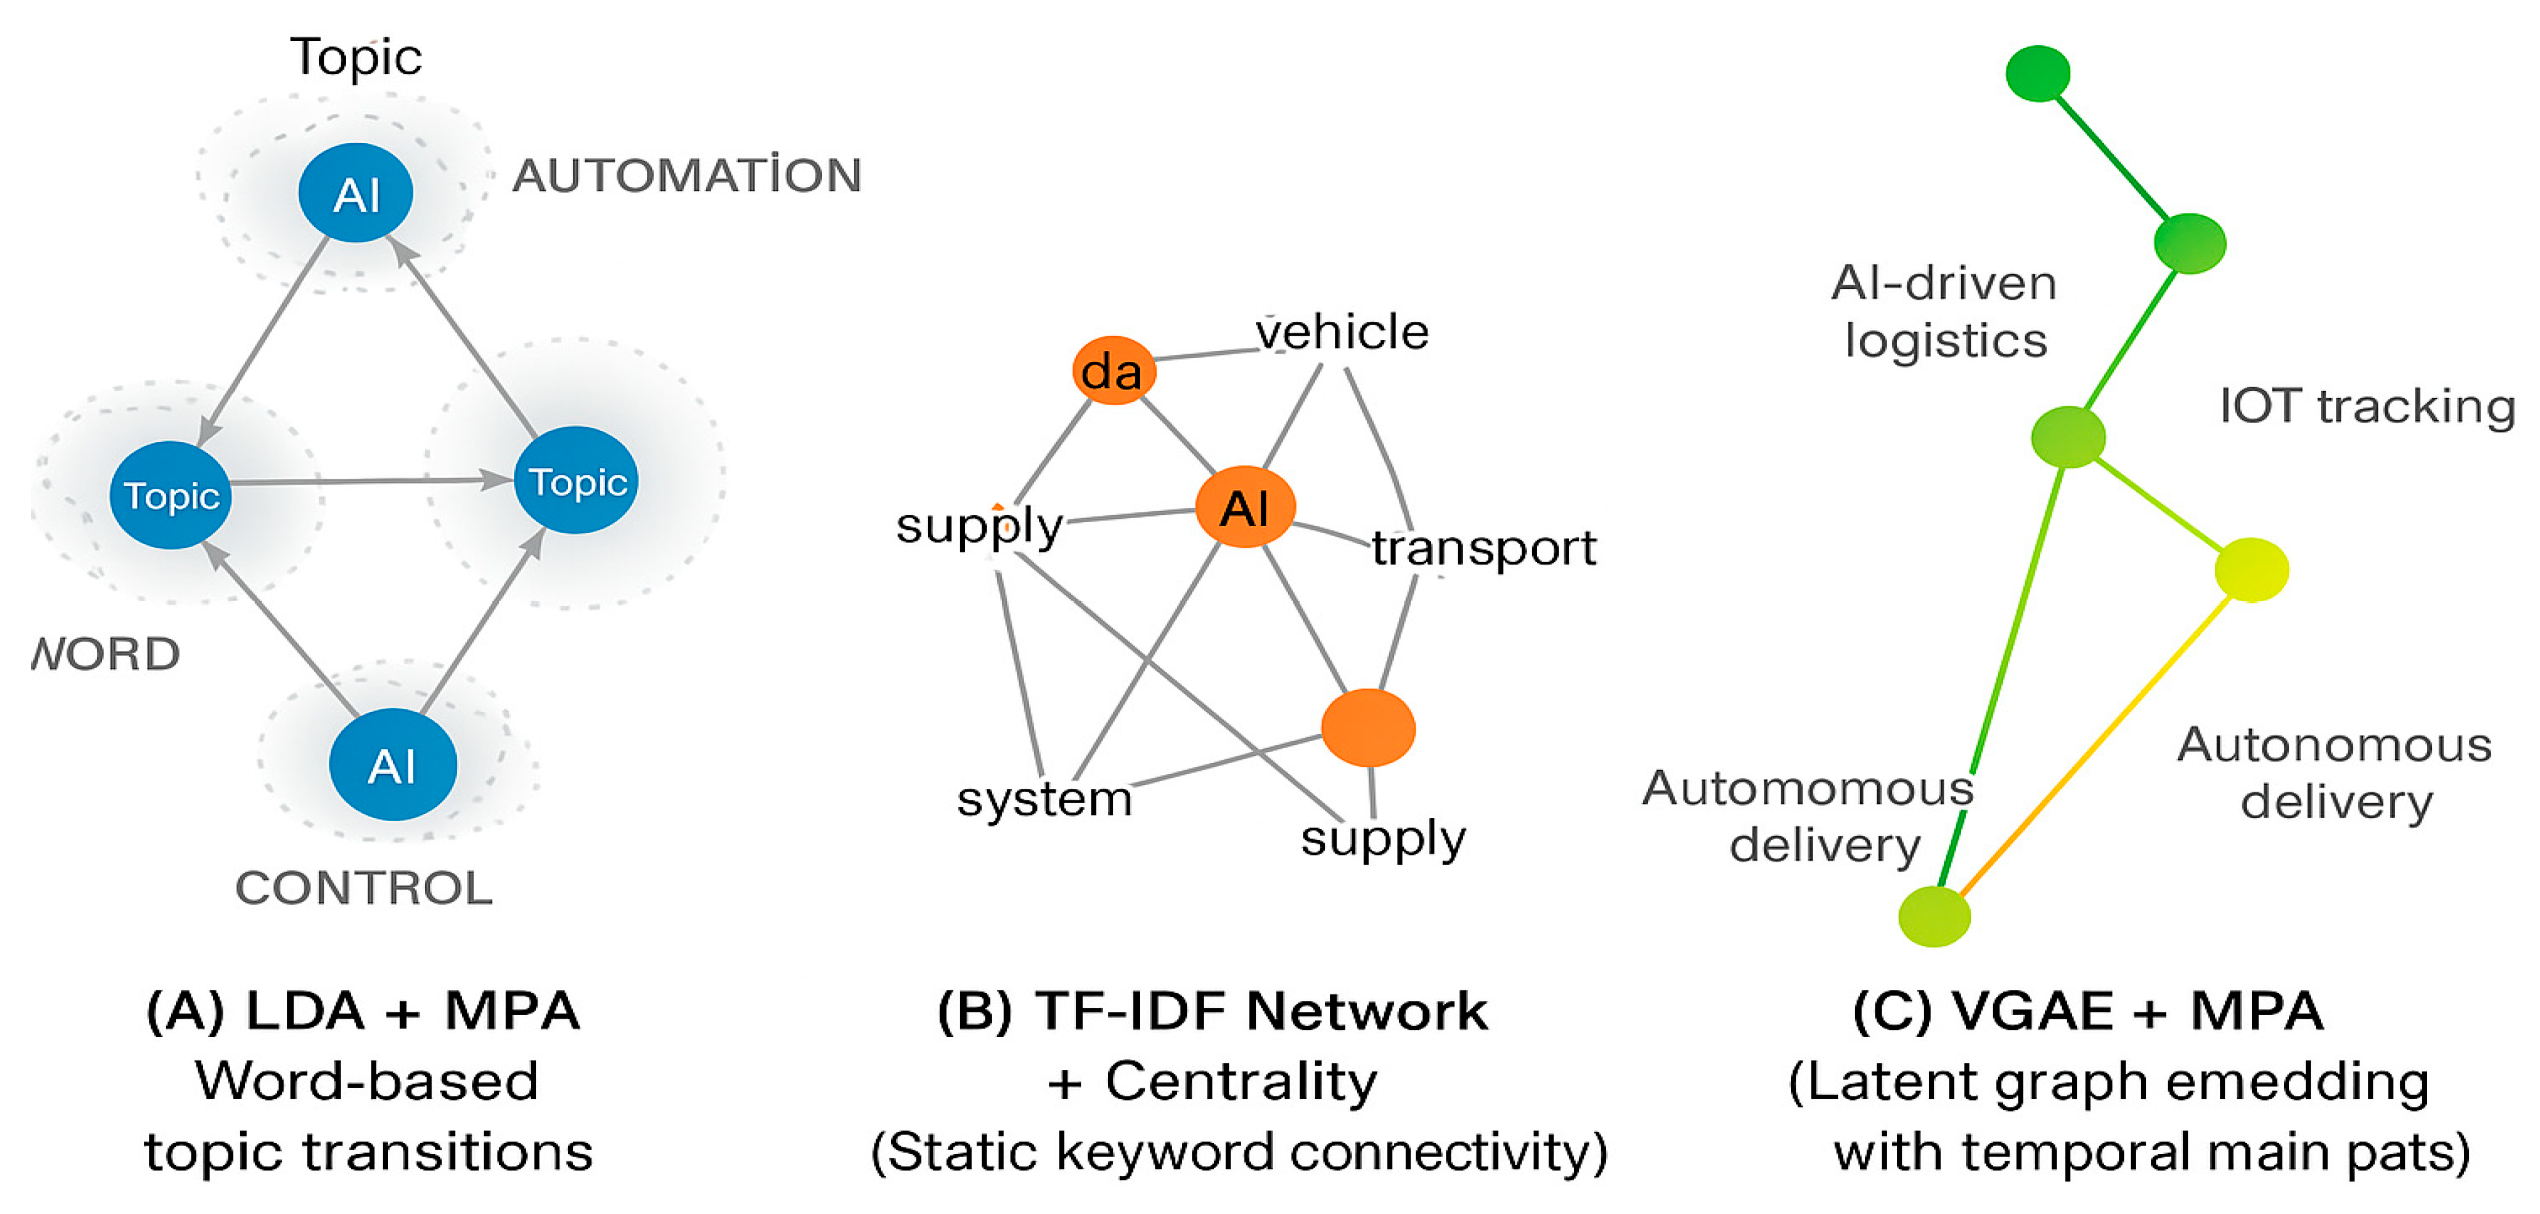
Figure 9 illustrates the conceptual differences among the three analytical models. Panel (A) represents the LDA + MPA model, which groups patents based on word-level topic similarities without temporal direction. Panel (B) shows the TF–IDF Network + Centrality approach, which emphasizes structural connectivity but lacks chronological flow. Panel (C) visualizes the VGAE–MPA model, integrating semantic, structural, and temporal dimensions through directed trajectories in the latent graph space.
The comparison confirms that the proposed VGAE–MPA model consistently outperforms conventional text- and network-based approaches. As shown in Table 3, the model achieves stronger structural coherence by capturing latent dependencies, superior temporal alignment by reflecting realistic diffusion sequences, and higher interpretability by revealing directional and contextually meaningful convergence pathways. Overall, these findings validate that the integration of graph neural embeddings with main path analysis provides a more comprehensive and explainable model for analyzing technological convergence in logistics innovation.

4.6. Empirical Cross-Validation

To assess the robustness and external validity of the identified technological transitions, a multi-dimensional comparative validation was performed using empirical evidence from global policy, industrial market, and academic sources. These complementary perspectives verify whether the diffusion trajectories extracted from the proposed VGAE–MPA model align with real-world technological evolution in the logistics sector.

4.6.1. Policy-Level Consistency

At the policy level, the World Economic Forum (WEF, 2024) report Sustainable and Efficient Last-Mile Delivery [103] emphasizes an integrated strategy combining vehicle electrification, micro-hub logistics, and AI-based routing optimization. This configuration closely corresponds to the early-to-intermediate segments of our main path (C13 → C0 → C3 → C26), which highlight autonomous control, visual perception, and vehicle coordination. Hence, the proposed model successfully reproduces the temporal and functional hierarchy observed in global policy models—evolving from intelligent vehicle control toward integrated smart-logistics governance.

4.6.2. Industry and Market Validation

From an industrial perspective, IDTechEx (2024–2044) [104] projects an 18.9% compound annual growth rate (CAGR) for logistics robotics, stressing the convergence among electric vans, autonomous mobile robots (AMRs), and delivery drones. This projection parallels the mid-to-late clusters of our MPA trajectory (C17 → C29 → C25 → C23), which depict the transition from autonomous vehicular logistics to cooperative human–robot operations. Moreover, the increasing interdependence between EV platforms and mobile-robotics subsystems—quantified through edge-weighted Jaccard similarity—directly reflects the industrial symbiosis anticipated in IDTechEx’s Multi-Modal Logistics Outlook 2024–2044. These results confirm that our network-based diffusion model captures meaningful industry-coupling mechanisms rather than random co-occurrences.

4.6.3. Academic and Empirical Correspondence

At the academic level, World Electric Vehicle Journal (WEVJ, 2025a; 2025b) [105,106] provides bibliometric and empirical findings consistent with our results. The 2025a analysis identifies five core research domainsbattery management, charging infrastructure, autonomous driving, AI optimization, and sustainability integrationwhich correspond directly to the IPC clusters (B60, B62, G05, H04W, G06Q) examined in this study. Furthermore, the 2025b empirical investigation demonstrates that integrating AI-based route optimization with EV-logistics operations improves energy efficiency by 10–25% and reduces CO2 emissions by up to 40%, aligning precisely with our late-stage clusters (C23 → C15 → C8).

4.6.4. Phase-Based Empirical Validation of Technological Evolution

To reinforce the empirical validity of the proposed VGAE–MPA hybrid model, the thirty identified clusters (C0–C29) were reorganized into three temporal phases—Early, Middle, and Late—representing successive stages of technological diffusion and convergence. This approach is consistent with prior studies that empirically analyzed temporal patterns of technological evolution and convergence using patent citation and network-based models [107,108]. These works collectively demonstrate that technological diffusion exhibits identifiable phase transitions, which can be measured through quantitative indicators such as efficiency, reliability, and sustainability outcomes.
Early Phase (C13 → C0 → C3): This stage represents the emergence of vehicle-centric control and perception systems, including steering control, parking assistance, and image-based trajectory recognition. Similar early-phase patterns were observed in autonomous and ADAS technology diffusion studies, where early innovation was driven by perception accuracy and control stability [109,110]. Empirical validation can thus be supported by ADAS or autonomous-driving datasets linking steering deviation and perception accuracy to safety KPIs such as collision rate and response latency.
Middle Phase (C26 → C17 → C29 → C25): The intermediate phase signifies the operational deployment of these foundational technologies into autonomous and logistics-oriented domains. Comparable mid-stage expansions have been documented in studies on automated guided vehicles (AGV) and warehouse robotics [111], where unmanned transport and control logic technologies evolved from prototype to field operations. Empirical verification can rely on quantitative indicators such as throughput (parcels/hr), task-cycle time (s), and incident frequency (events/10k cycles), reflecting measurable gains in operational efficiency.
Late Phase (C27 → C9 → C23 → C15 → C8): The final stage demonstrates convergence toward industrial robotics and electrified platforms, encompassing chassis automation, inspection robotics, articulated mechanisms, and EV battery management. This late-stage evolution parallels findings from recent reviews on robotic inspection and electric-vehicle energy systems [112,113], which highlight transitions toward energy-efficient, low-emission, and sustainable manufacturing platforms. Validation can employ sustainability-oriented KPIs such as energy efficiency (kWh/stop), uptime (%), and CO2 emissions per parcel (gCO2/parcel) derived from CMMS or EMS data.
Collectively, this phase-based empirical model strengthens both the interpretability and external validity of the VGAE–MPA model by linking patent-derived technological pathways to operational and sustainability KPIs. It provides a transparent and testable bridge between patent-based technological foresight and real-world industrial performance, aligning with recent findings that graph-based and temporal diffusion analyses enhance empirical reliability in technology evolution studies [107,108].

4.6.5. Summary

Collectively, these three validation layers demonstrate that the proposed VGAE–MPA model exhibits not only methodological robustness but also empirical fidelity to global logistics innovation dynamics. The observed congruence between patent-based analytical outcomes and external evidence—policy directives, industrial forecasts, and academic validation confirms the model’s effectiveness in modeling real-world technological convergence.

5. Discussion and Implications

5.1. Empirical Insights

The integrated VGAE–MPA model uncovered dynamic knowledge flows and multi-domain interactions in sustainable logistics technologies. The main-path structure revealed four dominant trajectories—autonomous vehicle coordination, AI-driven logistics platforms, electrified mobility, and IoT-based monitoring, demonstrating how digital convergence accelerates systemic innovation. This quantitative evidence bridges the gap between isolated technological clusters and cross-sector diffusion, thereby validating the conceptual notion of Logistics 4.0 as a cyber-physical integration of transport, automation, and data intelligence. These findings are consistent with previous studies that conceptualized Logistics 4.0 as the integration of digital intelligence and physical operations for sustainability transformation [114,115].

5.2. Policy Implications

From a policy perspective, the findings highlight the importance of synchronizing digital transformation strategies with sustainability goals. The convergence pathways (e.g., C23 → C8) suggest that national logistics policies should emphasize AI-enabled coordination, carbon-neutral mobility, and data interoperability to ensure resilience and efficiency. Consistent with the WEF (2024) and IDTechEx (2024) reports, our results reinforce the growing need for public–private partnerships that align R&D incentives, data governance, and investment portfolios to foster inclusive innovation ecosystems [104,105].

6. Conclusions

This study developed an integrated analytical model that combines Variational Graph Autoencoder (VGAE) and Main Path Analysis (MPA) to explore technological convergence in sustainable logistics. By embedding 4121 patents from 46 IPC subclasses into a latent semantic structural space, the model simultaneously captured network-level interdependencies and temporal diffusion patterns. This dual-layer design addressed the limitations of previous keyword-based or citation-only methods, allowing a more nuanced and time-sensitive representation of innovation pathways.
The proposed model achieved a 62.5% main-path contribution ratio, revealing four dominant technological clusters: autonomous vehicle coordination, AI-driven logistics platforms, electrified mobility, and IoT-based monitoring. These findings empirically substantiate the concept of Logistics 4.0 as a cyber-physical system integrating transportation, automation, and data intelligence. Methodologically, the study advances literature by demonstrating how graph-neural embedding can enhance interpretability and temporal alignment in technology-convergence analysis, offering a reproducible template for complex innovation ecosystems.
Empirical cross-validation with WEF (2024) and IDTechEx (2024) reports confirmed that the identified diffusion trajectories align with real-world developments in autonomous and electrified logistics [104,105]. These results emphasize the need for AI-enabled coordination, carbon-neutral mobility, and data interoperability within national logistics strategies. Furthermore, the model provides a practical tool for policymakers and industry leaders to monitor convergence trends and evaluate the systemic impacts of digital transformation on sustainability performance.
Despite these contributions, this study has several limitations. While the patent-based approach ensures objectivity and scalability, it may underrepresent emerging technologies not yet patented or published, and it primarily focuses on textual and relational information while omitting economic or environmental performance metrics that could enrich policy relevance. Future research should extend the analytical scope by incorporating full-claim embeddings, multimodal patent data (e.g., drawings, citations), and industrial implementation datasets such as smart-port operations or autonomous delivery trials. Applying longitudinal VGAE-MPA models across domains (e.g., green logistics, healthcare supply chains) and integrating real-time innovation and environmental indicators would further enhance the model’s capacity to trace AI-driven innovation toward measurable sustainability outcomes.

Author Contributions

S.J.: contributed to the conceptualization, methodology, investigation, data curation, and writing of the original manuscript.; C.L. (Choongheon Lee): contributed to the methodology, investigation, formal analysis and writing of the original manuscript. S.J.Y.: contributed to the conceptualization, supervision, and writing of the original manuscript. C.L. (Chulung Lee): contributed to project administration, supervision, validation, and editing of the original manuscript. All authors have read and agreed to the published version of the manuscript.

Funding

This research was supported by the BK21 FOUR funded by the Ministry of Education of Korea and National Research Foundation of Korea. This research was supported by the Korea Institute for Advancement of Technology (KIAT) grant funded by the Korea Government (MOTIE) (P0020649, The Competency Development Program for Industry Specialist).

Institutional Review Board Statement

Not applicable.

Informed Consent Statement

Not applicable.

Data Availability Statement

The raw data supporting the conclusions of this article will be made available by the authors on request.

Conflicts of Interest

The authors declare no conflicts of interest.

Appendix A

Table A1. Cluster definitions and representative keywords..
ClusterCluster NameRepresentative Keywords
C0Steering &
Travel Control Interfaces
selected drawing figure·steering control · travel control system
C1Autonomous Routing &
Waypoint Planning
autonomous vehicle · set intermediate point · computer program therefor
C2Environmental Perception & Awarenessvehicle includes · present disclosure relates · acquiring environmental information
C3Vision-Based Trailer/
Maneuver Assistance
image data captured · image data · trailering assist system
C4EV Charging Hardware
Modules
utility model relates · fixedly installed · charging small door
C5Two-Wheeler
Accident Classification
two-wheeled vehicle · accident event involving · classifying an accident
C6Automated Parking
Control Systems
parking control method · parking control device · target parking space
C7Reverse Trajectory
Reconstruction
alt embedded image · embedded image file ·
reverse travel trajectory
C8EV Platform &
Battery Early-Warning
electric vehicle · electric vehicle battery ·
early warning device
C9Vehicle Chassis/Body Modulesutility model discloses · fixedly connected · bottom plate
C10Mode Switching &
Hybrid Control
manual driving mode · autonomous driving mode · control system
C11Active Tracking & Localizationvehicle body · tracking device based · active tracking device
C12Differential-Drive
Mobile Robots
drive wheel · pivot axis · mobile robot drive
C13Parking Assistance &
Space Detection
parking space · parking assistance device · parking assistance
C14In-Vehicle Computing &
Obstacle Avoidance
vehicle computing system · blocking object avoidance · vehicle computing
C15Legged & Articulated
Mechanisms
control method thereof · main driving assembly · legs torsion springs
C16Smart Inventory
Management Systems
present invention relates · present invention · inventory management system
C17Unmanned Vehicle
Operation Systems
unmanned moving body · moving body operation · body operation system
C18Hitch/Trailer Coupling
Assistance
hitch assist system · sensing system configured · hitch assist
C19AGV Lifting &
Transport Systems
latent lifting agv · side end face · agv traveling lifting
C20Generic Vehicle Control
Algorithms
vehicle control device · control device vehicle · vehicle control method
C21Motor-Vehicle Systems &
Software
motor vehicle · invention relates · computer program product
C22Weighted-Factor
Decision Models
faktorbasierend auf · basierend auf einem · gewichtetenfaktorbasierend
C23Inspection Robots &
Modular Drives
inspection robot · drive module · num inspection robots
C24Smart Steering Wheel Interfacessteering wheel · functional zone · steering wheel comprising
C25Steering Angle Estimation & Trailer Sensingsteering angle · trailer flank object · vehicle steering angle
C26Pattern-Recognition
Workflow Methods
method includes identifying · method includes · method includes determining
C27Legacy ICE Vehicle Proceduresbetriffteinverfahren · erfindungbetrifftein · betriebenekraftfahrzeuge
C28Information Processing/
Acquisition Units
information processing device · information acquisition unit · information processing
C29Materials-Handling
Vehicle Control
maximum vehicle acceleration · monitored vehicle acceleration · materials handling vehicle

References

  1. Rejeb, A.; Rejeb, K.; Simske, S. Sustainability and Digital Transformation in Supply Chain and Logistics. Sustainability 2023, 15, 3384. [Google Scholar] [CrossRef]
  2. Centobelli, P.; Cerchione, R.; Esposito, E. Pursuing Supply Chain Sustainability through Innovation and Technology: A Systematic Literature Review. Sustainability 2020, 12, 7136. [Google Scholar] [CrossRef]
  3. Bag, S.; Wood, L.C.; Xu, L. Artificial Intelligence in Sustainable Logistics and Supply Chain Management: A Systematic Literature Review and Future Research Directions. Transp. Res. Part E Logist. Transp. Rev. 2020, 141, 102010. [Google Scholar] [CrossRef]
  4. Rejeb, A.; Rejeb, K.; Simske, S.; Keogh, J.G. Exploring Blockchain Research in Supply Chain Management: A Latent Dirichlet Allocation-Driven Systematic Review. Information 2023, 14, 557. [Google Scholar] [CrossRef]
  5. Dubey, R.; Gunasekaran, A.; Childe, S.J. Big Data Analytics and Artificial Intelligence Pathway to Operational Performance under the Effects of Environmental Dynamism. Int. J. Prod. Econ. 2019, 211, 301–313. [Google Scholar] [CrossRef]
  6. Winkelhaus, S.; Grosse, E.H. Logistics 4.0: A systematic review towards a new logistics system. Int. J. Prod. Res. 2020, 58, 18–43. [Google Scholar] [CrossRef]
  7. Demir, S.; Paksoy, T.; Kochan, C.G. Logistics 4.0: SCM in Industry 4.0 Era: Changing Patterns of Logistics in Industry 4.0 and Role of Digital Transformation in SCM. In Logistics 4.0; CRC Press: Boca Raton, FL, USA, 2020; pp. 15–26. [Google Scholar]
  8. Salton, G.; Buckley, C. Term-Weighting Approaches in Automatic Text Retrieval. Inf. Process. Manag. 1988, 24, 513–523. [Google Scholar] [CrossRef]
  9. Lee, C.; Kang, B.; Shin, J. Novelty-focused patent mapping for technology opportunity analysis. Technol. Forecast. Soc. Change 2015, 90, 355–365. [Google Scholar] [CrossRef]
  10. Curran, C.S. The Anticipation of Converging Industries: A Concept Applied to Nutraceuticals and Functional Foods. Technol. Forecast. Soc. Change 2013, 80, 15–24. [Google Scholar] [CrossRef]
  11. Kipf, T.N.; Welling, M. Semi-Supervised Classification with Graph Convolutional Networks. In Proceedings of the International Conference on Learning Representations (ICLR), Toulon, France, 24–26 April 2017. [Google Scholar]
  12. Wu, Z.; Pan, S.; Chen, F.; Long, G.; Zhang, C.; Philip, S.Y. A Comprehensive Survey on Graph Neural Networks. IEEE Trans. Neural Netw. Learn. Syst. 2021, 32, 4–24. [Google Scholar] [CrossRef]
  13. Hummon, N.P.; Doreian, P. Connectivity in a Citation Network: The Development of DNA Theory. Soc. Netw. 1989, 11, 39–63. [Google Scholar] [CrossRef]
  14. Caviggioli, F. Technology fusion: Identification and analysis of the drivers of technology convergence using patent data. Technovation 2016, 55, 22–32. [Google Scholar] [CrossRef]
  15. Lucio-Arias, D.; Leydesdorff, L. Main-path analysis and path-dependent transitions in HistCite™-based historiograms. J. Am. Soc. Inf. Sci. Technol. 2008, 59, 1948–1962. [Google Scholar] [CrossRef]
  16. Liu, J.S.; Lu, L.Y.; Ho, M.H.C. A note on choosing traversal counts in main path analysis. Scientometrics 2020, 124, 783–785. [Google Scholar] [CrossRef]
  17. Yu, D.; Sheng, L. Influence difference main path analysis: Evidence from DNA and blockchain domain citation networks. J. Informet. 2021, 15, 101186. [Google Scholar] [CrossRef]
  18. Liao, S.C.; Chou, T.C.; Huang, C.H. Revisiting the development trajectory of the digital divide: A main path analysis approach. Technol. Forecast. Soc. Change 2022, 179, 121607. [Google Scholar] [CrossRef]
  19. He, J.; Wang, Y. Patent-Based Analysis of China’s Emergency Logistics Industry Convergence. Sustainability 2023, 15, 4419. [Google Scholar] [CrossRef]
  20. So, J.; An, H.; Lee, C. Defining Smart Mobility Service Levels via Text Mining. Sustainability 2020, 12, 9293. [Google Scholar] [CrossRef]
  21. Pölzlbauer, G.; Auer, E. Applied patent mining with topic models and meta-data: A comprehensive case study. World Patent Inf. 2021, 67, 102065. [Google Scholar] [CrossRef]
  22. Huang, K.; Cai, M.; Xiao, Y. Identifying Key Technologies and Cluster Patterns in Intelligent Transportation Systems. Transp. Res. Rec. 2025, 2679, 833–859. [Google Scholar] [CrossRef]
  23. Lobanova, P.; Bakhtin, P.; Sergienko, Y. Identifying and visualizing trends in science, technology, and innovation using SciBERT. IEEE Trans. Eng. Manag. 2023, 71, 11898–11906. [Google Scholar] [CrossRef]
  24. Chikkamath, R.; Parmar, V.R.; Otiefy, Y.; Endres, M. Patent classification using bert-for-patents on USPTO. In Proceedings of the 2022 5th International Conference on Machine Learning and Natural Language Processing, Sanya, China, 16–18 December 2022; pp. 20–28. [Google Scholar]
  25. Zhu, C.; Motohashi, K. Identifying the Technology Convergence Using Patent Text Information: A Graph Convolutional Networks (GCN)-Based Approach. Technol. Forecast. Soc. Change 2022, 176, 121477. [Google Scholar] [CrossRef]
  26. Érdi, P.; Makovi, K.; Somogyvári, Z.; Strandburg, K.; Tobochnik, J.; Volf, P.; Zalányi, L. Prediction of Emerging Technologies Based on Analysis of the U.S. Patent Citation Network. Scientometrics 2013, 95, 225–242. [Google Scholar] [CrossRef]
  27. Bekamiri, H.; Hain, D.S.; Jurowetzki, R. Patentsberta: A deep nlp based hybrid model for patent distance and classification using augmented sbert. Technol. Forecast. Soc. Change 2024, 206, 123536. [Google Scholar] [CrossRef]
  28. Lee, J.S.; Hsiang, J. Patent classification by fine-tuning BERT language model. World Patent Inf. 2020, 61, 101965. [Google Scholar] [CrossRef]
  29. Sternitzke, C.; Bartkowski, A.; Schramm, R. Visualizing patent statistics by means of social network analysis tools. World Patent Inf. 2008, 30, 115–131. [Google Scholar] [CrossRef]
  30. Liu, D.R.; Shih, M.J. Hybrid-patent classification based on patent-network analysis. J. Am. Soc. Inf. Sci. Technol. 2011, 62, 246–256. [Google Scholar] [CrossRef]
  31. Kim, K.; Jung, S.; Hwang, J. Technology convergence capability and firm innovation in the manufacturing sector: An approach based on patent network analysis. R&D Manag. 2019, 49, 595–606. [Google Scholar]
  32. Curran, C.S.; Bröring, S.; Leker, J. Anticipating converging industries using publicly available data. Technol. Forecast. Soc. Change 2010, 77, 385–395. [Google Scholar] [CrossRef]
  33. Lee, S.; Kim, W.; Lee, H.; Jeon, J. Identifying the structure of knowledge networks in the US mobile ecosystems: Patent citation analysis. Technol. Anal. Strateg. Manag. 2016, 28, 411–434. [Google Scholar] [CrossRef]
  34. Kipf, T.N.; Welling, M. Variational graph auto-encoders. arXiv 2016, arXiv:1611.07308. [Google Scholar] [CrossRef]
  35. Hamilton, W.; Ying, R.; Leskovec, J. Inductive representation learning on large graphs. arXiv 2017, arXiv:1706.02216. [Google Scholar] [CrossRef]
  36. Jeong, Y.; Jang, H.; Yoon, B. Developing a Risk-Adaptive Technology Roadmap Using a Bayesian Network and Topic Modeling under Deep Uncertainty. Scientometrics 2021, 126, 3697–3722. [Google Scholar] [CrossRef]
  37. Wen, Z.; Fang, Y.; Wei, P.; Liu, F.; Chen, Z.; Wu, M. Temporal and heterogeneous graph neural network for remaining useful life prediction. IEEE Trans. Neural Netw. Learn. Syst. 2025, 36, 19748–19761. [Google Scholar] [CrossRef]
  38. Lu, D.; Chen, Y.; Sun, Y.; Wei, W.; Ji, S.; Ruan, H.; Yi, F.; Jia, C.; Hu, D.; Tang, K.; et al. Research Progress in Multi-Domain and Cross-Domain AI Management and Control for Intelligent Electric Vehicles. Energies 2025, 18, 4597. [Google Scholar] [CrossRef]
  39. Garikapati, D.; Shetiya, S.S. Autonomous Vehicles: Evolution of Artificial Intelligence and the Current Industry Landscape. Big Data Cogn. Comput. 2024, 8, 42. [Google Scholar] [CrossRef]
  40. Park, S.; Lee, S.J.; Jun, S. A Network Analysis Model for Selecting Sustainable Technology. Sustainability 2015, 7, 13126–13141. [Google Scholar] [CrossRef]
  41. Bhatt, P.C.; Hsu, Y.C.; Lai, K.K.; Drave, V.A. Technology Convergence Assessment by an Integrated Approach of BERT Topic Modeling & Association Rule Mining. IEEE Trans. Eng. Manag. 2025; manuscript accepted. [Google Scholar]
  42. Weidemann, C.; Mandischer, N.; van Kerkom, F.; Corves, B.; Hüsing, M.; Kraus, T.; Garus, C. Literature Review on Recent Trends and Perspectives of Collaborative Robotics in Work 4.0. Robotics 2023, 12, 84. [Google Scholar] [CrossRef]
  43. Su, W.H.; Chen, K.Y.; Lu, L.Y.; Huang, Y.C. Identification of Technology Diffusion by Citation and Main Paths Analysis: The Possibility of Measuring Open Innovation. J. Open Innov. Technol. Mark. Complex. 2021, 7, 104. [Google Scholar] [CrossRef]
  44. Khazali, A.; Al-Wreikat, Y.; Fraser, E.J.; Naderi, M.; Smith, M.J.; Sharkh, S.M.; Cruden, A.J. Sizing a Renewable-Based Microgrid to Supply an Electric Vehicle Charging Station: A Design and Modelling Approach. World Electr. Veh. J. 2024, 15, 363. [Google Scholar] [CrossRef]
  45. Zhou, S.; Liu, Y.; Liu, Y. A Market Convergence Prediction Framework Based on a Supply Chain Knowledge Graph. Sustainability 2024, 16, 1696. [Google Scholar] [CrossRef]
  46. Peng, M.; Chen, K.; Guo, X.; Zhang, Q.; Zhong, H.; Zhu, M.; Yang, H. Diffusion Models for Intelligent Transportation Systems: A Survey. arXiv 2025, arXiv:2409.15816. [Google Scholar] [CrossRef]
  47. Bahoo, S.; Cucculelli, M.; Qamar, D. Artificial Intelligence and Corporate Innovation: A Review and Research Agenda. Technol. Forecast. Soc. Change 2023, 188, 122264. [Google Scholar] [CrossRef]
  48. Hummon, N.P.; Doreian, P. Computational methods for social network analysis. Soc. Netw. 1990, 12, 273–288. [Google Scholar] [CrossRef]
  49. Verspagen, B. Mapping technological trajectories as patent citation networks: A study on the history of fuel cell research. Adv. Complex Syst. 2007, 10, 93–115. [Google Scholar] [CrossRef]
  50. Jiang, X.; Liu, J. Extracting the evolutionary backbone of scientific domains: The semantic main path network analysis approach based on citation context analysis. J. Assoc. Inf. Sci. Technol. 2023, 74, 546–569. [Google Scholar] [CrossRef]
  51. Yu, D.; Fang, A. The Knowledge Trajectory and Structure of the Supply Chain Integration: A Main Path and Cluster Analysis. J. Enterp. Inf. Manag. 2023, 36, 1056–1079. [Google Scholar] [CrossRef]
  52. Rejeb, A.; Rejeb, K.; Zailani, S.H.M.; Abdollahi, A. Knowledge Diffusion of the Internet of Things (IoT): A Main Path Analysis. Wirel. Pers. Commun. 2022, 126, 1177–1207. [Google Scholar] [CrossRef]
  53. Linares, I.M.P.; De Paulo, A.F.; Porto, G.S. Patent-Based Network Analysis to Understand Technological Innovation Pathways and Trends. Technol. Soc. 2019, 59, 101134. [Google Scholar] [CrossRef]
  54. Kwon, K.; So, J. Future Smart Logistics Technology Based on Patent Analysis Using Temporal Network. Sustainability 2023, 15, 8159. [Google Scholar] [CrossRef]
  55. Daim, T.U.; Rueda, G.; Martin, H.; Gerdsri, P. Forecasting Emerging Technologies: Use of Bibliometrics and Patent Analysis. Technol. Forecast. Soc. Change 2006, 73, 981–1012. [Google Scholar] [CrossRef]
  56. Choi, D.; Song, B. Exploring Technological Trends in Logistics: Topic Modeling-Based Patent Analysis. Sustainability 2018, 10, 2810. [Google Scholar] [CrossRef]
  57. Shokouhyar, S.; Maghsoudi, M.; Khanizadeh, S.; Jorfi, S. Analyzing Supply Chain Technology Trends through Network Analysis and Clustering Techniques: A Patent-Based Study. Ann. Oper. Res. 2024, 341, 313–348. [Google Scholar] [CrossRef]
  58. Tseng, Y.H.; Lin, C.J.; Lin, Y.I. Text mining techniques for patent analysis. Inf. Process. Manag. 2007, 43, 1216–1247. [Google Scholar] [CrossRef]
  59. Lee, S.; Yoon, B.; Park, Y. An approach to discovering new technology opportunities: Keyword-based patent map approach. Technovation 2009, 29, 481–497. [Google Scholar] [CrossRef]
  60. Park, M.; Leahey, E.; Funk, R.J. Papers and patents are becoming less disruptive over time. Nature 2023, 613, 138–144. [Google Scholar] [CrossRef]
  61. Cockburn, I.M.; Henderson, R.; Stern, S. The impact of artificial intelligence on innovation: An exploratory analysis. In The Economics of Artificial Intelligence: An Agenda; University of Chicago Press: Chicago, IL, USA, 2018; pp. 115–146. [Google Scholar]
  62. Lui, M.; Baldwin, T. langid.py: An Off-the-Shelf Language Identification Tool. In Proceedings of the ACL 2012 System Demonstrations; Association for Computational Linguistics, Jeju Island, Republic of Korea, 8–14 July 2012; pp. 25–30. [Google Scholar]
  63. Devlin, J.; Chang, M.-W.; Lee, K.; Toutanova, K. BERT: Pre-Training of Deep Bidirectional Transformers for Language Understanding. In Proceedings of the NAACL-HLT 2019 Conference, Minneapolis, MN, USA, 2–7 June 2019; pp. 4171–4186. [Google Scholar]
  64. Forman, G. An Extensive Empirical Study of Feature Selection Metrics for Text Classification. J. Mach. Learn. Res. 2003, 3, 1289–1305. [Google Scholar]
  65. Mikolov, T.; Sutskever, I.; Chen, K.; Corrado, G.; Dean, J. Distributed Representations of Words and Phrases and Their Compositionality. Adv. Neural Inf. Process. Syst. 2013, 26, 3111–3119. [Google Scholar]
  66. Joachims, T. Text Categorization with Support Vector Machines: Learning with Many Relevant Features. In Proceedings of the European Conference on Machine Learning (ECML), Chemnitz, Germany, 21–23 April 1998. [Google Scholar]
  67. Reimers, N.; Gurevych, I. Sentence-BERT: Sentence Embeddings Using Siamese BERT-Networks. In Proceedings of the EMNLP-IJCNLP 2019 Conference, Hong Kong, China, 3–7 November 2019; pp. 3982–3992. [Google Scholar]
  68. Pedregosa, F.; Varoquaux, G.; Gramfort, A.; Michel, V.; Thirion, B.; Grisel, O.; Blondel, M.; Prettenhofer, P.; Weiss, R.; Dubourg, V.; et al. Scikit-Learn: Machine Learning in Python. J. Mach. Learn. Res. 2011, 12, 2825–2830. [Google Scholar]
  69. Jaccard, P. Étude Comparative de la Distribution Florale dans une Portion des Alpes et des Jura. Bull. Soc. Vaud. Sci. Nat. 1901, 37, 547–579. [Google Scholar]
  70. Robertson, S.E. Understanding Inverse Document Frequency: On Theoretical Arguments for IDF. J. Doc. 2004, 60, 503–520. [Google Scholar] [CrossRef]
  71. Van Eck, N.J.; Waltman, L. How to Normalize Co-Occurrence Data? An Analysis of Some Well-Known Similarity Measures. J. Am. Soc. Inf. Sci. Technol. 2009, 60, 1635–1651. [Google Scholar]
  72. Van Eck, N.J.; Waltman, L. Software Survey: VOSviewer, a Computer Program for Bibliometric Mapping. Scientometrics 2010, 84, 523–538. [Google Scholar] [CrossRef]
  73. Serrano, M.Á.; Boguná, M.; Vespignani, A. Extracting the Multiscale Backbone of Complex Weighted Networks. Proc. Natl. Acad. Sci. USA 2009, 106, 6483–6488. [Google Scholar] [CrossRef]
  74. Sánchez-Martín, P.; Rateike, M.; Valera, I. VACA: Designing Variational Graph Autoencoders for Causal Queries. In Proceedings of the AAAI Conference on Artificial Intelligence, Virtual, 22 February–1 March 2022; Volume 36, pp. 8159–8168. [Google Scholar]
  75. Trappey, A.J.; Wei, A.Y.; Chen, N.K.; Li, K.A.; Hung, L.P.; Trappey, C.V. Patent Landscape and Key Technology Interaction Roadmap Using Graph Convolutional Network—Case of Mobile Communication Technologies Beyond 5G. J. Informetrics 2023, 17, 101354. [Google Scholar] [CrossRef]
  76. Kingma, D.P.; Welling, M. Auto-Encoding Variational Bayes. arXiv 2013, arXiv:1312.6114. [Google Scholar]
  77. Xu, J.; Xu, J.; Meng, Y.; Lu, C.; Cai, L.; Zeng, X.; Nussinov, R.; Cheng, F. Graph Embedding and Gaussian Mixture Variational Autoencoder Network for End-to-End Analysis of Single-Cell RNA Sequencing Data. Cell Rep. Methods 2023, 3, 100382. [Google Scholar] [CrossRef]
  78. Halko, N.; Martinsson, P.G.; Tropp, J.A. Finding Structure with Randomness: Probabilistic Algorithms for Constructing Approximate Matrix Decompositions. SIAM Rev. 2011, 53, 217–288. [Google Scholar] [CrossRef]
  79. Davis, J.; Goadrich, M. The Relationship Between Precision-Recall and ROC Curves. In Proceedings of the 23rd International Conference on Machine Learning (ICML), Pittsburgh, PA, USA, 25–29 June 2006; pp. 233–240. [Google Scholar]
  80. MacQueen, J. Some Methods for Classification and Analysis of Multivariate Observations. In Proceedings of the Fifth Berkeley Symposium on Mathematical Statistics and Probability, Berkeley, CA, USA, 21 June–18 July 1967; pp. 281–297. [Google Scholar]
  81. Rousseeuw, P.J. Silhouettes: A Graphical Aid to the Interpretation and Validation of Cluster Analysis. J. Comput. Appl. Math. 1987, 20, 53–65. [Google Scholar] [CrossRef]
  82. Davies, D.L.; Bouldin, D.W. A Cluster Separation Measure. IEEE Trans. Pattern Anal. Mach. Intell. 1979, 1, 224–227. [Google Scholar] [CrossRef] [PubMed]
  83. Caliński, T.; Harabasz, J. A Dendrite Method for Cluster Analysis. Commun. Stat. Theory Methods 1974, 3, 1–27. [Google Scholar] [CrossRef]
  84. Dunn, J.C. A Fuzzy Relative of the ISODATA Process and Its Use in Detecting Compact Well-Separated Clusters. J. Cybern. 1973, 3, 32–57. [Google Scholar] [CrossRef]
  85. Newman, M.E.J. Modularity and Community Structure in Networks. Proc. Natl. Acad. Sci. USA 2006, 103, 8577–8582. [Google Scholar] [CrossRef] [PubMed]
  86. Leskovec, J.; Lang, K.J.; Dasgupta, A.; Mahoney, M.W. Community Structure in Large Networks: Natural Cluster Sizes and the Absence of Large Well-Defined Clusters. Internet Math. 2009, 6, 29–123. [Google Scholar] [CrossRef]
  87. McInnes, L.; Healy, J.; Saul, N.; Grossberger, L. UMAP: Uniform Manifold Approximation and Projection for Dimension Reduction. J. Open Source Softw. 2020, 5, 2174. [Google Scholar]
  88. Chen, C. Predictive Effects of Structural Variation on Citation Counts. J. Am. Soc. Inf. Sci. Technol. 2012, 63, 431–449. [Google Scholar] [CrossRef]
  89. Heer, J.; Van Ham, F.; Carpendale, S.; Weaver, C.; Isenberg, P. Creation and Collaboration: Engaging New Audiences for Information Visualization. In Information Visualization: Human-Centered Issues and Perspectives; Kerren, A., Stasko, J.T., Fekete, J.-D., North, C., Eds.; Springer: Berlin/Heidelberg, Germany, 2008; pp. 92–133. [Google Scholar]
  90. Doreian, P.; Conti, N. Social Context, Spatial Structure and Social Network Structure. Soc. Netw. 2012, 34, 32–46. [Google Scholar] [CrossRef]
  91. Pannhorst, M.; Dost, F. Marketing Innovations to Old-Age Consumers: A Dynamic Bass Model for Different Life Stages. Technol. Forecast. Soc. Change 2019, 140, 315–327. [Google Scholar] [CrossRef]
  92. Carley, S.; Porter, A.L. A Forward Diversity Index. Scientometrics 2012, 90, 407–427. [Google Scholar] [CrossRef]
  93. Kim, E.H.; Jeong, Y.K.; Kim, Y.; Song, M. Exploring scientific trajectories of a large-scale dataset using topic-integrated path extraction. J. Informet. 2022, 16, 101242. [Google Scholar] [CrossRef]
  94. Park, H.; Magee, C.L. Tracing technological development trajectories: A genetic knowledge persistence-based main path approach. PLoS ONE 2017, 12, e0170895. [Google Scholar] [CrossRef] [PubMed]
  95. Luan, C.; Deng, S.; Porter, A.L.; Song, B. An approach to construct technological convergence networks across different IPC hierarchies and identify key technology fields. IEEE Trans. Eng. Manag. 2021, 71, 346–358. [Google Scholar] [CrossRef]
  96. Niemann, H.; Moehrle, M.G.; Frischkorn, J. Use of a new patent text-mining and visualization method for identifying patenting patterns over time: Concept, method and test application. Technol. Forecast. Soc. Change 2017, 115, 210–220. [Google Scholar] [CrossRef]
  97. Antonin, B.; Cyril, V. Identifying technology clusters based on automated patent landscaping. PLoS ONE 2023, 18, e0295587. [Google Scholar] [CrossRef]
  98. Ampornphan, P.; Tongngam, S. Exploring technology influencers from patent data using association rule mining and social network analysis. Information 2020, 11, 333. [Google Scholar] [CrossRef]
  99. Hain, D.; Jurowetzki, R.; Buchmann, T.; Wolf, P. A Text-Embedding-based Approach to Measure Patent-to-Patent Technological Similarity--Workflow, Code, and Applications. arXiv 2020, arXiv:2003.12303. [Google Scholar]
  100. Nguyen, G.H.; Lee, J.B.; Rossi, R.A.; Ahmed, N.K.; Koh, E.; Kim, S. Continuous-time dynamic network embeddings. In Proceedings of the Web Conference Companion, Lyon, France, 23–27 April 2018; pp. 969–976. [Google Scholar]
  101. Liu, H.; Chen, Z.; Tang, J.; Zhou, Y.; Liu, S. Mapping the technology evolution path: A novel model for dynamic topic detection and tracking. Scientometrics 2020, 125, 2043–2090. [Google Scholar] [CrossRef]
  102. Ding, M.; Yu, W.; Zeng, T.; Wang, S. PTNS: Patent citation trajectory prediction based on temporal network snapshots. Sci. Rep. 2024, 14, 24034. [Google Scholar] [CrossRef]
  103. World Economic Forum. Sustainable and Efficient Last-Mile Delivery: A Global Framework for Electrified and Autonomous Logistics; World Economic Forum: Geneva, Switzerland, 2024; Available online: https://reports.weforum.org/docs/WEF_Transforming_Urban_Logistics_2024.pdf (accessed on 10 October 2025).
  104. IDTechEx. Autonomous and Electric Logistics Robotics 2024–2044: Market Forecasts, Technologies, and Trends; IDTechEx Ltd.: Cambridge, UK, 2024; Available online: https://www.idtechex.com/en/research-report/autonomous-and-electric-logistics-robots-2024-2044/1009 (accessed on 10 October 2025).
  105. Muresanu, A.D.; Dudescu, M.C.; Tica, D. Study on the Crashworthiness of a Battery Frame Design for an Electric Vehicle Using FEM. World Electr. Veh. J. 2024, 15, 534. [Google Scholar] [CrossRef]
  106. Mogire, E.; Kilbourn, P.; Luke, R. Electric Vehicles in Last-Mile Delivery: A Bibliometric Review. World Electr. Veh. J. 2025, 16, 52. [Google Scholar] [CrossRef]
  107. Yan, B.; Luo, J. Measuring technological distance for patent mapping. J. Assoc. Inf. Sci. Technol. 2017, 68, 423–437. [Google Scholar] [CrossRef]
  108. Hoffmann, J. Technological cohesion and convergence: A main path analysis of the bioeconomy, 1900–2020. Sustainability 2023, 15, 12100. [Google Scholar] [CrossRef]
  109. Paden, B.; Čáp, M.; Yong, S.Z.; Yershov, D.; Frazzoli, E. A survey of motion planning and control techniques for self-driving urban vehicles. IEEE Trans. Intell. Veh. 2016, 1, 33–55. [Google Scholar] [CrossRef]
  110. Aleksa, M.; Brčić, D.; Dragčević, V.; Cvitić, I.; Pernar, T. Impact analysis of advanced driver assistance systems (ADAS) regarding road safety. Eur. Transp. Res. Rev. 2024, 16, 35. [Google Scholar] [CrossRef]
  111. Le-Anh, T.; de Koster, R. A review of design and control of automated guided vehicle systems. Eur. J. Oper. Res. 2006, 171, 1–23. [Google Scholar] [CrossRef]
  112. Urrea, C.; Kern, J. Recent Advances and Challenges in Industrial Robotics: A Systematic Review of Technological Trends and Emerging Applications. Processes 2025, 13, 832. [Google Scholar] [CrossRef]
  113. Hwang, F.S.; Kim, H.J.; Lee, Y.; Park, S. Review of battery thermal management systems in electric vehicles. Renew. Sustain. Energy Rev. 2024, 192, 114171. [Google Scholar] [CrossRef]
  114. Demir, E.; Huang, Y.; Scholts, S.; Van Woensel, T. A selected review on the negative externalities of the freight transportation: Modeling and pricing. Transp. Res. Part E Logist. Transp. Rev. 2015, 77, 95–114. [Google Scholar] [CrossRef]
  115. Bai, C.; Dallasega, P.; Orzes, G.; Sarkis, J. Industry 4.0 technologies assessment: A sustainability perspective. Int. J. Prod. Econ. 2020, 229, 107776. [Google Scholar] [CrossRef]
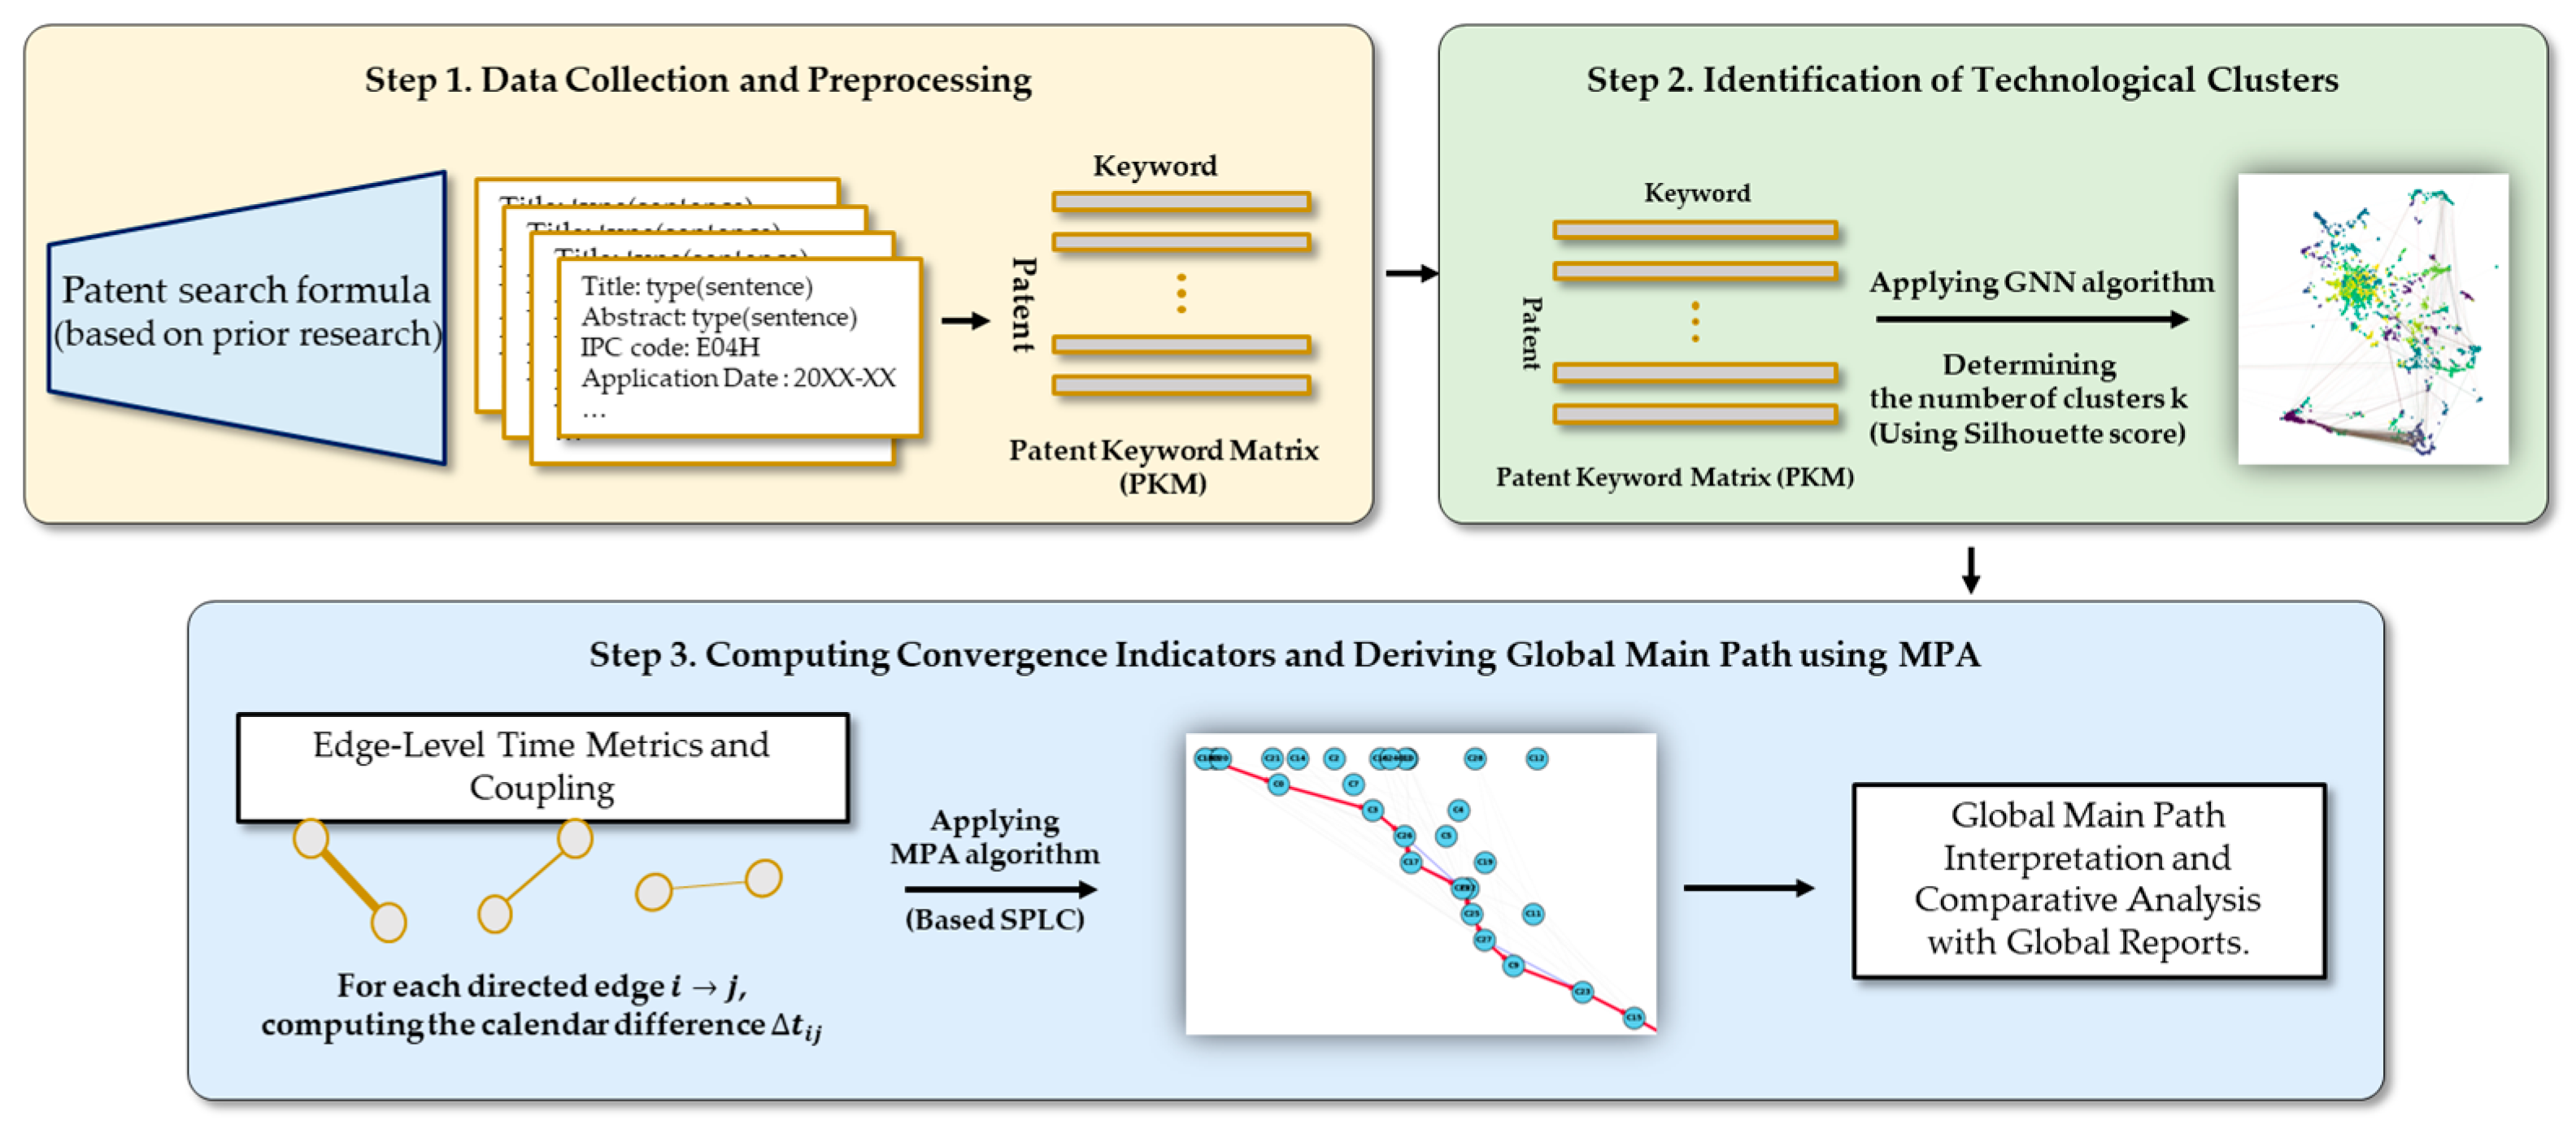
Figure 1. Step-by-Step methodological Framework describing necessary steps.
Sustainability 17 10507 g001
Figure 2. Annual distribution of logistics-related patents (2015–2024) retrieved from WIPO using IC:(B60 OR B62 OR G05 OR G06Q OR H04W). Patent activity gradually increased until 2017, peaked around 2018, and stabilized thereafter, indicating sustained innovation and convergence over the past decade.
Sustainability 17 10507 g002
Figure 3. Top 10 IPC classes (three-character level) based on multi-assignment counts (2015–2024). Each patent’s multiple IPC codes were counted to reflect cross-domain linkages, revealing the coexistence of mechanical and digital technologies in logistics innovation.
Sustainability 17 10507 g003
Figure 4. Patent Network based on PKM.
Sustainability 17 10507 g004
Figure 5. Silhouette Score by number of clusters.
Sustainability 17 10507 g005
Figure 6. Patent-patent graph over VGAE embedding.
Sustainability 17 10507 g006
Figure 7. Patent-patent graph per clusters over VGAE embedding.
Sustainability 17 10507 g007
Figure 8. Global Main Path (contribution ratio: 62.5%).
Sustainability 17 10507 g008
Figure 9. Comparative conceptual models of LDA + MPA, TF–IDF Network + Centrality, and VGAE + MPA.
Sustainability 17 10507 g009
Table 1. IPC share comparison between 2015–2018 and 2019–2024.
IPC2015–2018 Share (%)2019–2024 Share (%)Δ (pp)Trend
B6031.227.8−3.4↓Slight decline
B6224.523.1−1.4↓ Minor
G0514.815.9+1.1↑ Slight increase
G06Q12.117.3+5.2↑ Strong growth
H04W7.310.6+3.3↑ Moderate growth
Table 2. Patent Summary (2019–2024).
IndicatorValue
Total Patents4121
Time Span2019–2024
Unique IPC Classes46
Unique Applicants2126
Top IPCsB60, B62, G05, G06, H04
Table 3. Summarizes the comparative results across the three evaluation metrics.
ModelStructural
Coherence
Temporal AlignmentInterpretability
LDA + MPA0.420.36Limited
(word-based similarity)
TF–IDF Network + Centrality0.470.40Moderate
(static structure, no time flow)
VGAE + MPA
(proposed)
0.630.51High
(integrated, temporally consistent)
Disclaimer/Publisher’s Note: The statements, opinions and data contained in all publications are solely those of the individual author(s) and contributor(s) and not of MDPI and/or the editor(s). MDPI and/or the editor(s) disclaim responsibility for any injury to people or property resulting from any ideas, methods, instructions or products referred to in the content.