Article

Ecological Control Zoning and Improvement Strategy Based on Ecological Security Pattern in Changsha–Zhuzhou–Xiangtan Urban Agglomeration

1
School of Civil and Environment Engineering, Hunan University of Technology, 88 Taishan Road, Zhuzhou 412007, China
2
Hunan Key Laboratory of Water Safety Discharge in Urban and Its Resource Utilization, Hunan University of Technology, 88 Taishan Road, Zhuzhou 412007, China
3
School of Physics and Chemistry, Hunan First Normal University, 1015 Fenglin 3rd Road, Changsha 410205, China
*
Author to whom correspondence should be addressed.
Sustainability 2025, 17(23), 10444; https://doi.org/10.3390/su172310444
Submission received: 30 September 2025 / Revised: 5 November 2025 / Accepted: 15 November 2025 / Published: 21 November 2025

Abstract

The construction of urban ecological security patterns (ESPs) is an effective approach for managing ecological space and preventing the uncontrolled expansion of urban areas, thereby safeguarding the ecological security of urban agglomerations. This study focuses on the Changsha–Zhuzhou–Xiangtan Urban Agglomeration (CZTUA), utilizing an ESP framework based on ecosystem services, ecological sensitivity, landscape connectivity, and resistance surfaces (SSCR). The spatio-temporal evolution and driving forces of ESP were analyzed for 2010, 2015, and 2020. Based on this, the ecological control zones of the CZTUA were delineated according to ecosystem importance, and appropriate ecological improvement strategies were proposed. The findings revealed the following: (1) The number of ecological sources in the CZTUA decreased from 26 to 23, while their total area expanded from 1113.6 km2 to 3013.96 km2, indicating a “point-to-patch” development trend. Ecological corridors showed a “decrease–increase”trend in number, but their total length consistently contracted from 1025.69 km to 536.25 km, with greater emphasis on the efficiency and effectiveness of connecting habitats. Ecological nodes decreased from 14 to 5, while their aggregate area increased from 290.6 km2 to 1796.48 km2, mirroring changes in ecological sources. (2) Ecological sources, corridors, and nodes in the CZTUA are primarily located in the eastern mountainous and hilly regions, with a trend of expansion toward the western areas. The spatial distribution of corridors and nodes is shaped by these sources, with dense areas exhibiting short-distance networks and dispersal areas showing long-distance linear patterns. Node distribution shifts from entry/exit areas of ecological sources and corridors to the sources themselves. (3) The spatio-temporal evolution of the ESP in the CZTUA is driven by a dual-wheel mechanism of “natural foundation-policy regulation,” where precipitation and potential evapotranspiration serve as the primary natural drivers, manifested through water conservation. (4) The region is divided into three control levels: the core protected areas focus on ecological protection in the eastern mountainous and hilly regions; the ecological buffer areas emphasize ecological coordination in transitional landforms such as hills, medium-undulating mountains, and platforms; the intensive development areas, mostly located in platform, plain, and some hilly areas, prioritize ecological optimization. The three-tier control zones implement strategies of strict protection, buffering and coordination, and optimized development, respectively, providing a direct basis for the refined management of ecological spaces.

1. Introduction

With the rapid pace of global urbanization, ecological and environmental challenges such as soil erosion and desertification have become increasingly prevalent, significantly hindering the sustainable development of urban ecosystems [1,2]. As the main driver of new urbanization and regional development in China [3], urban agglomerations face a crucial challenge: maintaining ecological security and sustainable development amidst the pressures of environmental change, population concentration, and socioeconomic growth [4].
Urban ecological security patterns (ESPs) are pivotal to ensuring ecological security in urban areas and are recognized as one of the three strategic frameworks for spatial development and conservation [5,6]. Current ESP frameworks typically adopt a “source identification–resistance surface construction–corridor extraction”methodology [7,8], leveraging Geographic Information System (GIS) technologies and ecological theories to create quantitative models for urban development and ecological analysis. Ecological sources are areas with significant ecological functions [9], identified through direct selection or indirect recognition [10]. Recent research emphasizes integrating multidisciplinary approaches to develop comprehensive evaluation systems [11,12]. For instance, Li et al. [13] identified ecological sources by assessing ecosystem service importance, ecological sensitivity, and landscape connectivity. Similarly, Zhang et al. [14] used Morphological Spatial Pattern Analysis (MSPA) and landscape connectivity to pinpoint core ecological sources. The resistance surface, which models species migration difficulty [15], is generally constructed by weighting various landscape types [16]. To address internal heterogeneity and complex ecological processes, studies often incorporate natural and anthropogenic factors to enhance resistance surfaces [17,18]. Ecological corridors serve as low-resistance pathways facilitating the exchange of matter, energy, and information between ecological sources [19]. Their identification typically involves the Minimum Cumulative Resistance (MCR) Model, Circuit Theory, and the Gravity Model [20,21,22]. Circuit Theory, in particular, is widely used for its ability to simulate species migration through stochastic charge movement, closely aligning with actual biological dispersal behaviors [23]. Current research in ecological spatial planning spans multiple dimensions. For instance, Guo et al. [24] proposed an optimization pattern featuring “four belts, four zones, one axis, nine corridors, ten clusters, and multi-centers” for the Harbin–Changchun Urban Agglomeration. Similarly, Huang et al. [25] developed an ecological security assessment system using the pressure–state–response (PSR) framework to elucidate trends and driving mechanisms of the ecological security index in the Yangtze River Urban Agglomeration. Overall, while ESP research is concentrated in methods and applications, it lacks studies considering the diverse and dynamic characteristics of ecosystem elements, particularly those that construct ESP from a spatio-temporal dynamic perspective and analyzing its spatio-temporal evolution.
The ecological space control zone is crucial for implementing hierarchical protection, restoration, and the high-quality development of ecological spaces in urban agglomerations [26]. Its delineation involves both quantitative and qualitative zoning methods [27,28,29]. For example, Lei et al. [30] divided the Shenzhen River and Xinzhou River Estuarine Wetland into 6 ecological function units based on ecosystem services. Similarly, Wu et al. [31] delineated water ecology space control zones in the Chaohe River based on national spatial planning. A review of existing research reveals that studies applying the ESP framework to delineate regional ecological space control zoning have been rarely reported. How to effectively translate the elements of the ESP into operational zoning control strategies, thus preventing it from becoming merely a “map-on-the-wall” outcome, is the core challenge currently faced.
To address the aforementioned “translation” challenge, this study introduces the global green infrastructure (GI) planning concept. GI is not only an interconnected network of natural areas and open spaces but also a forward-looking management strategy that emphasizes ecosystem service provision and the enhancement of human well-being [32,33]. Functionally, GI, through its multi-functional network structure, can integrate the relatively isolated ecological sources and corridors of the ESP into an organic living system, thereby enhancing ecosystem stability and service capacity [34,35]. In terms of governance, GI, as a strategic tool, can provide systematic solutions for the specific measures of ecological control zoning [36], thereby effectively promoting the implementation of the complete chain from “pattern identification–-zoning control–-strategy implementation”.
As a key urban agglomeration in the middle reaches of the Yangtze River, a crucial national growth pole, and the first “Resource-saving and Environment-friendly Society” comprehensive reform pilot area [37], the CZTUA faces severe challenges amidst rapid urbanization, including the erosion of ecological space, the intensification of landscape fragmentation, and the degradation of ecosystem service functions [38]. Against this backdrop, how to achieve refined management and control of ecological space through scientific methods and reconcile the contradiction between ecological protection and urban development has become a critical issue, urgently needing resolution to promote sustainable development in this region. In response, this study aims to construct the ESP of the CZTUA for 2010–2020, systematically analyze its spatio-temporal evolution characteristics and driving mechanisms, and based on this, delineate ecological control zones and propose differentiated improvement strategies. This aims to provide a scientific basis for the refined management and high-quality sustainable development of the ecological space in this region. This research not only helps validate the applicability of the theoretical ESP framework from a spatio-temporal dynamic perspective, but its results can also provide direct decision-making support for resolving the pressing ecological development conflicts in the CZTUA and advancing the construction of the “Two-oriented Society”, holding significant theoretical value and practical importance.

2. Study Area and Materials

2.1. Study Area

Located in Hunan’s Xiangjiang River Basin, the CZTUA covers the triangular Changsha−Zhuzhou−Xiangtan region (Figure 1). Characterized by basins, hills, and forest-dominated ecosystems, it serves as central China’s key manufacturing, transportation, and service hub. With 2023 comprising 41.5% of Hunan’s total regional GDP, rapid urbanization now poses critical challenges to ecological–urban coordination.

2.2. Data Sources

The detailed information of the datasets used in this study is summarized in Table 1. Data preprocessing, including projection, mosaicking, and clipping, was conducted using ArcGIS 10.8 software(Environmental Systems Research Institute, Esri, Redlands, CA, USA).

3. Research Methodology

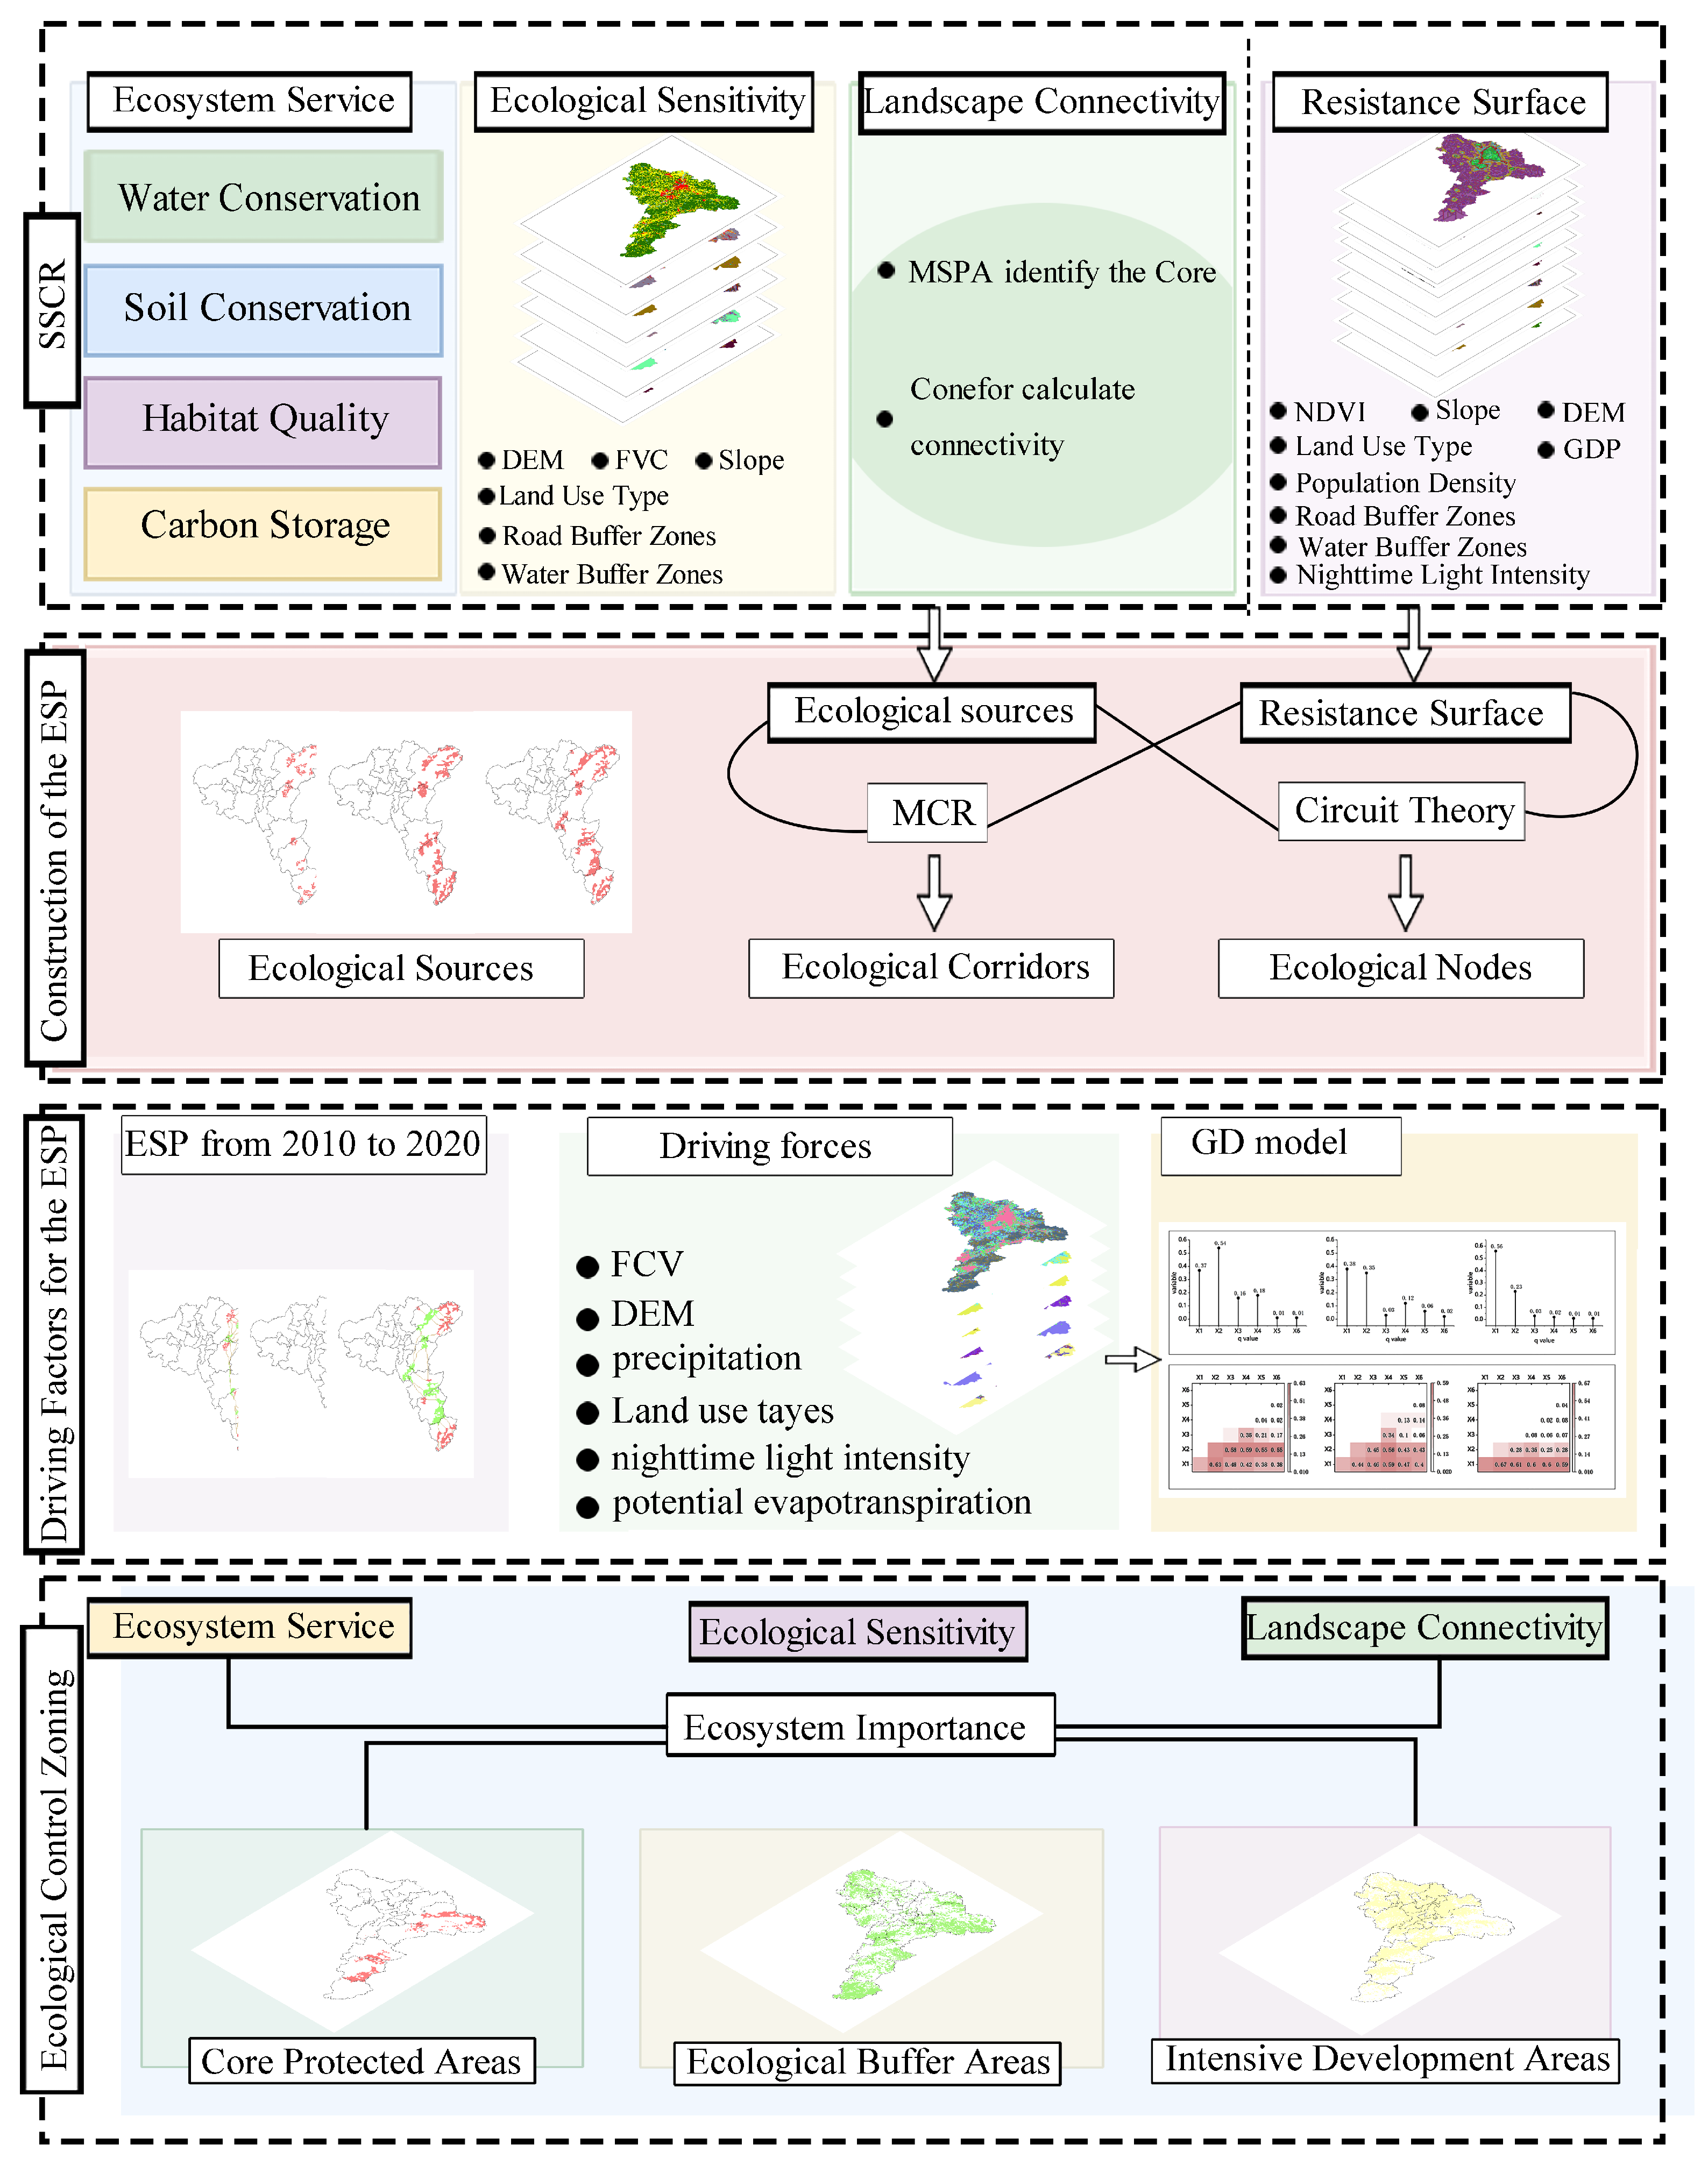
The technical framework of this study is illustrated in Figure 2. First, the SSCR research framework was adopted to construct the ESP of the CZTUA, and the spatio-temporal evolution characteristics as well as the driving forces of the ESP from 2010 to 2020 were explored. On this basis, the ecological control zones of the CZTUA were delineated according to ecosystem importance.

3.1. Construction of the ESP

This study adopted the SSCR framework to identify ecological sources in the CZTUA. Ecological corridors were extracted using the MCR model based on an ecological resistance surface, while ecological nodes were identified through circuit theory. Finally, the ESP of the CZTUA from 2010 to 2020 was constructed based on ecological sources, corridors, and nodes. The technical framework is illustrated in Figure 2.

3.1.1. Evaluation of Ecosystem Services

Ecosystem services represent the “functional outputs” of ecosystems, referring to the core benefits they provide for both humans and the natural environment. Considering the region’s land use characteristics and ecological conditions, and drawing on previous research [39], four ecosystem service indicators—water conservation (WC), soil conservation (SC), habitat quality (HQ), and carbon storage (CS)—were selected to assess the ecosystem services in the CZTUA (Table 2) [40,41]. These indicators correspond to four core ecological functions: hydrological regulation, soil stability, biodiversity maintenance, and carbon cycling. At the regional scale, they exhibit significant spatial synergy and functional complementarity, collectively forming a comprehensive ecosystem service evaluation framework. Each indicator was standardized using ArcGIS 10.8 to generate dimensionless data. Given the functional synergy and equal importance of these services, and in the absence of local evidence supporting the clear priority of any single service, equal weights were assigned to the four indicators [42]. A weighted overlay analysis was performed in ArcGIS 10.8 to derive the ecosystem service map for the CZTUA.

3.1.2. Evaluation of Ecological Sensitivity

Ecological sensitivity is the degree of response of ecosystems to anthropogenic disturbances and changes in the natural environment, indicating the potential risk and probability of occurrence of regional ecological problems [43]. Based on the current ecological conditions of the CZTUA, this study performed an evaluation from three aspects: topography, ecological environment, and socioeconomic factors. DEM, slope, Fraction of Vegetation Cover (FVC), water buffer zones, land use classification, and road buffer zones were selected as individual factors for the ecological sensitivity assessment [44]. The sensitivity levels for each factor were assigned values of 9, 7, 5, 3, and 1 by integrating the natural breaks method, ecological principles, and existing literature support [45,46], and their weights were determined using the coefficient of variation method(Table 3). The ecological sensitivity evaluation results for the Changsha–Zhuzhou–Xiangtan urban agglomeration were generated through overlay analysis in ArcGIS 10.8 and classified into five levels using the Natural Breaks Method.
V i = δ i x ¯ i
W i = V i i = 1 n V i
where W i is the weight of factor j; V i is the Coefficient of Variance of factor i; δ i is the Standard Deviation of factor j; x ¯ i is the average of factor i; i = 1 n V i is the sum of V i .

3.1.3. Evaluation of Landscape Connectivity

The strength of landscape connectivity is an important determinant for judging whether species in the region can successfully exchange information and migrate [47]. MSPA is a method that identifies seven key landscape types with connectivity significance at the pixel level [48]. This study set forests and grasslands in the three periods of land use types in the study area as the foreground, assigning them a value of 2, while designating other types as the background with a value of 1. Guidos Toolbox 3.2 was employed with an 8-neighborhood algorithm to conduct MSPA, yielding the distribution of seven landscape types. Core areas larger than 20 km2 were selected as ecological patches. Conefor 2.6 and Conefor Inputs for ArcGIS 10.8 were utilized to calculate the probability of connectivity (PC) and dPC for these patches.
P C = i = 1 n j = 1 n a i × a j × p i j A L 2
d P C = 100 × P C P C i - remove P C
where A L is the total area of the landscape; a i and a j are the areas of patches i and j, respectively; p i j is the maximum value of the final connectivity of all paths between patches i and j; P C i - remove is the possible connectivity index of the landscape after patch i is removed.

3.1.4. Identification of Ecological Sources

Considering that ecosystem service functions, ecological sensitivity, and landscape connectivity held equal importance for ecological security—collectively representing the functional supply, systemic vulnerability, and structural support of ecological processes, thereby forming an integrated “iron triangle” of the ecological security pattern—they were assigned equal weights. This approach helps avoid overemphasizing any single dimension and ensures a balanced identification of core ecological spaces, especially in regions like the CZTUA with significant east–west ecological gradients. At the same time, the ecosystem importance of the CZTUA was generated using the raster calculator in ArcGIS 10.8, and it was categorized into five levels: extremely unimportant, relatively unimportant, moderately important, relatively important, and extremely important. Ecological sources are regions with superior ecological function [49]. Based on the ecosystem importance evaluation results, relatively important and highly important patches were selected as candidate ecological sources for the CZTUA. It is noteworthy that numerous isolated and fragmented patches exist. Considering that only ecological sources of a certain scale can effectively buffer external disturbances to core areas and perform vital ecological functions, patches larger than 20 km2 were ultimately selected as ecological sources in accordance with the actual conditions of the CZTUA [50,51]. The 20 km2 threshold aligns with the spatial scale of the CZTUA and is consistent with the well-documented range applied in comparable regional studies for ecological source delineation. It effectively captures over 90% of the large natural forest patches in the eastern Luoxiao Mountains and southern Hengshan foothills, while excluding fragmented artificial woodlands, thus ensuring both ecological representativeness and spatial feasibility.

3.1.5. Extraction of Ecological Corridors

The construction of an ecological resistance surface serves as the foundation for extracting ecological corridors and is used to quantify the degree to which different areas in the landscape impede species movement, gene flow, or ecological processes [52]. A higher resistance value indicates a greater impediment to biological movement or ecological flow in that area, and vice versa. Various factors influence ecological resistance. This study considered both natural environmental factors and human disturbance factors, selecting nine indicators: DEM, slope, NDVI, population density, GDP, nighttime light intensity, land use types, road buffer zones, and water buffer zones (Table 4) [53,54]. The weights were determined using the coefficient of variation method, and an ecological resistance surface was generated for the CZTUA by overlay analysis in ArcGIS 10.8. Ecological corridors serve as pathways for species movement and dispersal, capable of effectively connecting isolated habitats and mitigating the effects of landscape fragmentation caused by human activities [55]. Based on ecological sources and resistance surface, the Linkage Mapper 2.0.0 Toolbox in ArcGIS 10.8 was employed to extract least-cost paths between ecological sources as optimal ecological corridors.

3.1.6. Identification of Ecological Nodes

Ecological nodes are areas characterized by high current density within ecological corridors, representing regions critical for maintaining network connectivity and functionality [56].Adopting circuit theory, Circuitscape software 4.0, and the Linkage Mapper 2.0.0 plugin were applied to calculate the current density between ecological sources. The results were classified into three levels using the natural breaks method and the regions with the highest current density were identified as ecological nodes.

3.2. Analysis of Driving Factors for the ESP in the CZTUA

Ecological sources serve as the basis for the construction of the ESP. Therefore, this study analyzed the driving forces of the ESP by focusing on the spatial heterogeneity of ecological sources. The GeoDetector (GD) model was applied to investigate the spatial heterogeneity of ecological sources in the study area and to evaluate the explanatory power of the influencing factors. Two modules of the model—factor detector and interaction detector—were utilized. Driving factors were selected from natural environmental and socioeconomic perspectives, including precipitation (X1), potential evapotranspiration (X2), FVC (X3), DEM (X4), land use types (X5), and nighttime light intensity (X6) [57,58]. A higher q-value indicates a greater explanatory capacity of the factor in the spatial differentiation of the dependent variable ref.

3.3. Delineation of Ecological Control Zones

In this study, the evaluation results of ecosystem importance, which integrated ecosystem services, ecological sensitivity, and landscape connectivity, were used as the fundamental basis for zoning. The results were classified into five importance levels using the natural breaks method. Based on the ecological functional importance of each level, they were mapped and consolidated into three control tiers: First, core protected areas corresponded to the “extremely important” areas in the ecosystem importance assessment. These areas serve as the core carriers of ecological functions and were subject to the strictest protection. Second, ecological buffer areas consisted of the merged “highly important” and “moderately important” areas. Located on the periphery of the core areas, these zones functioned as buffers and connectors, requiring a balance between conservation and development. Third, intensive development areas encompassed the “relatively unimportant” and “extremely unimportant” areas. As the primary zones of human activity, the strategic focus here was ecological optimization under the premise of sustainable development (Figure 2).

4. Result

4.1. Ecosystem Service

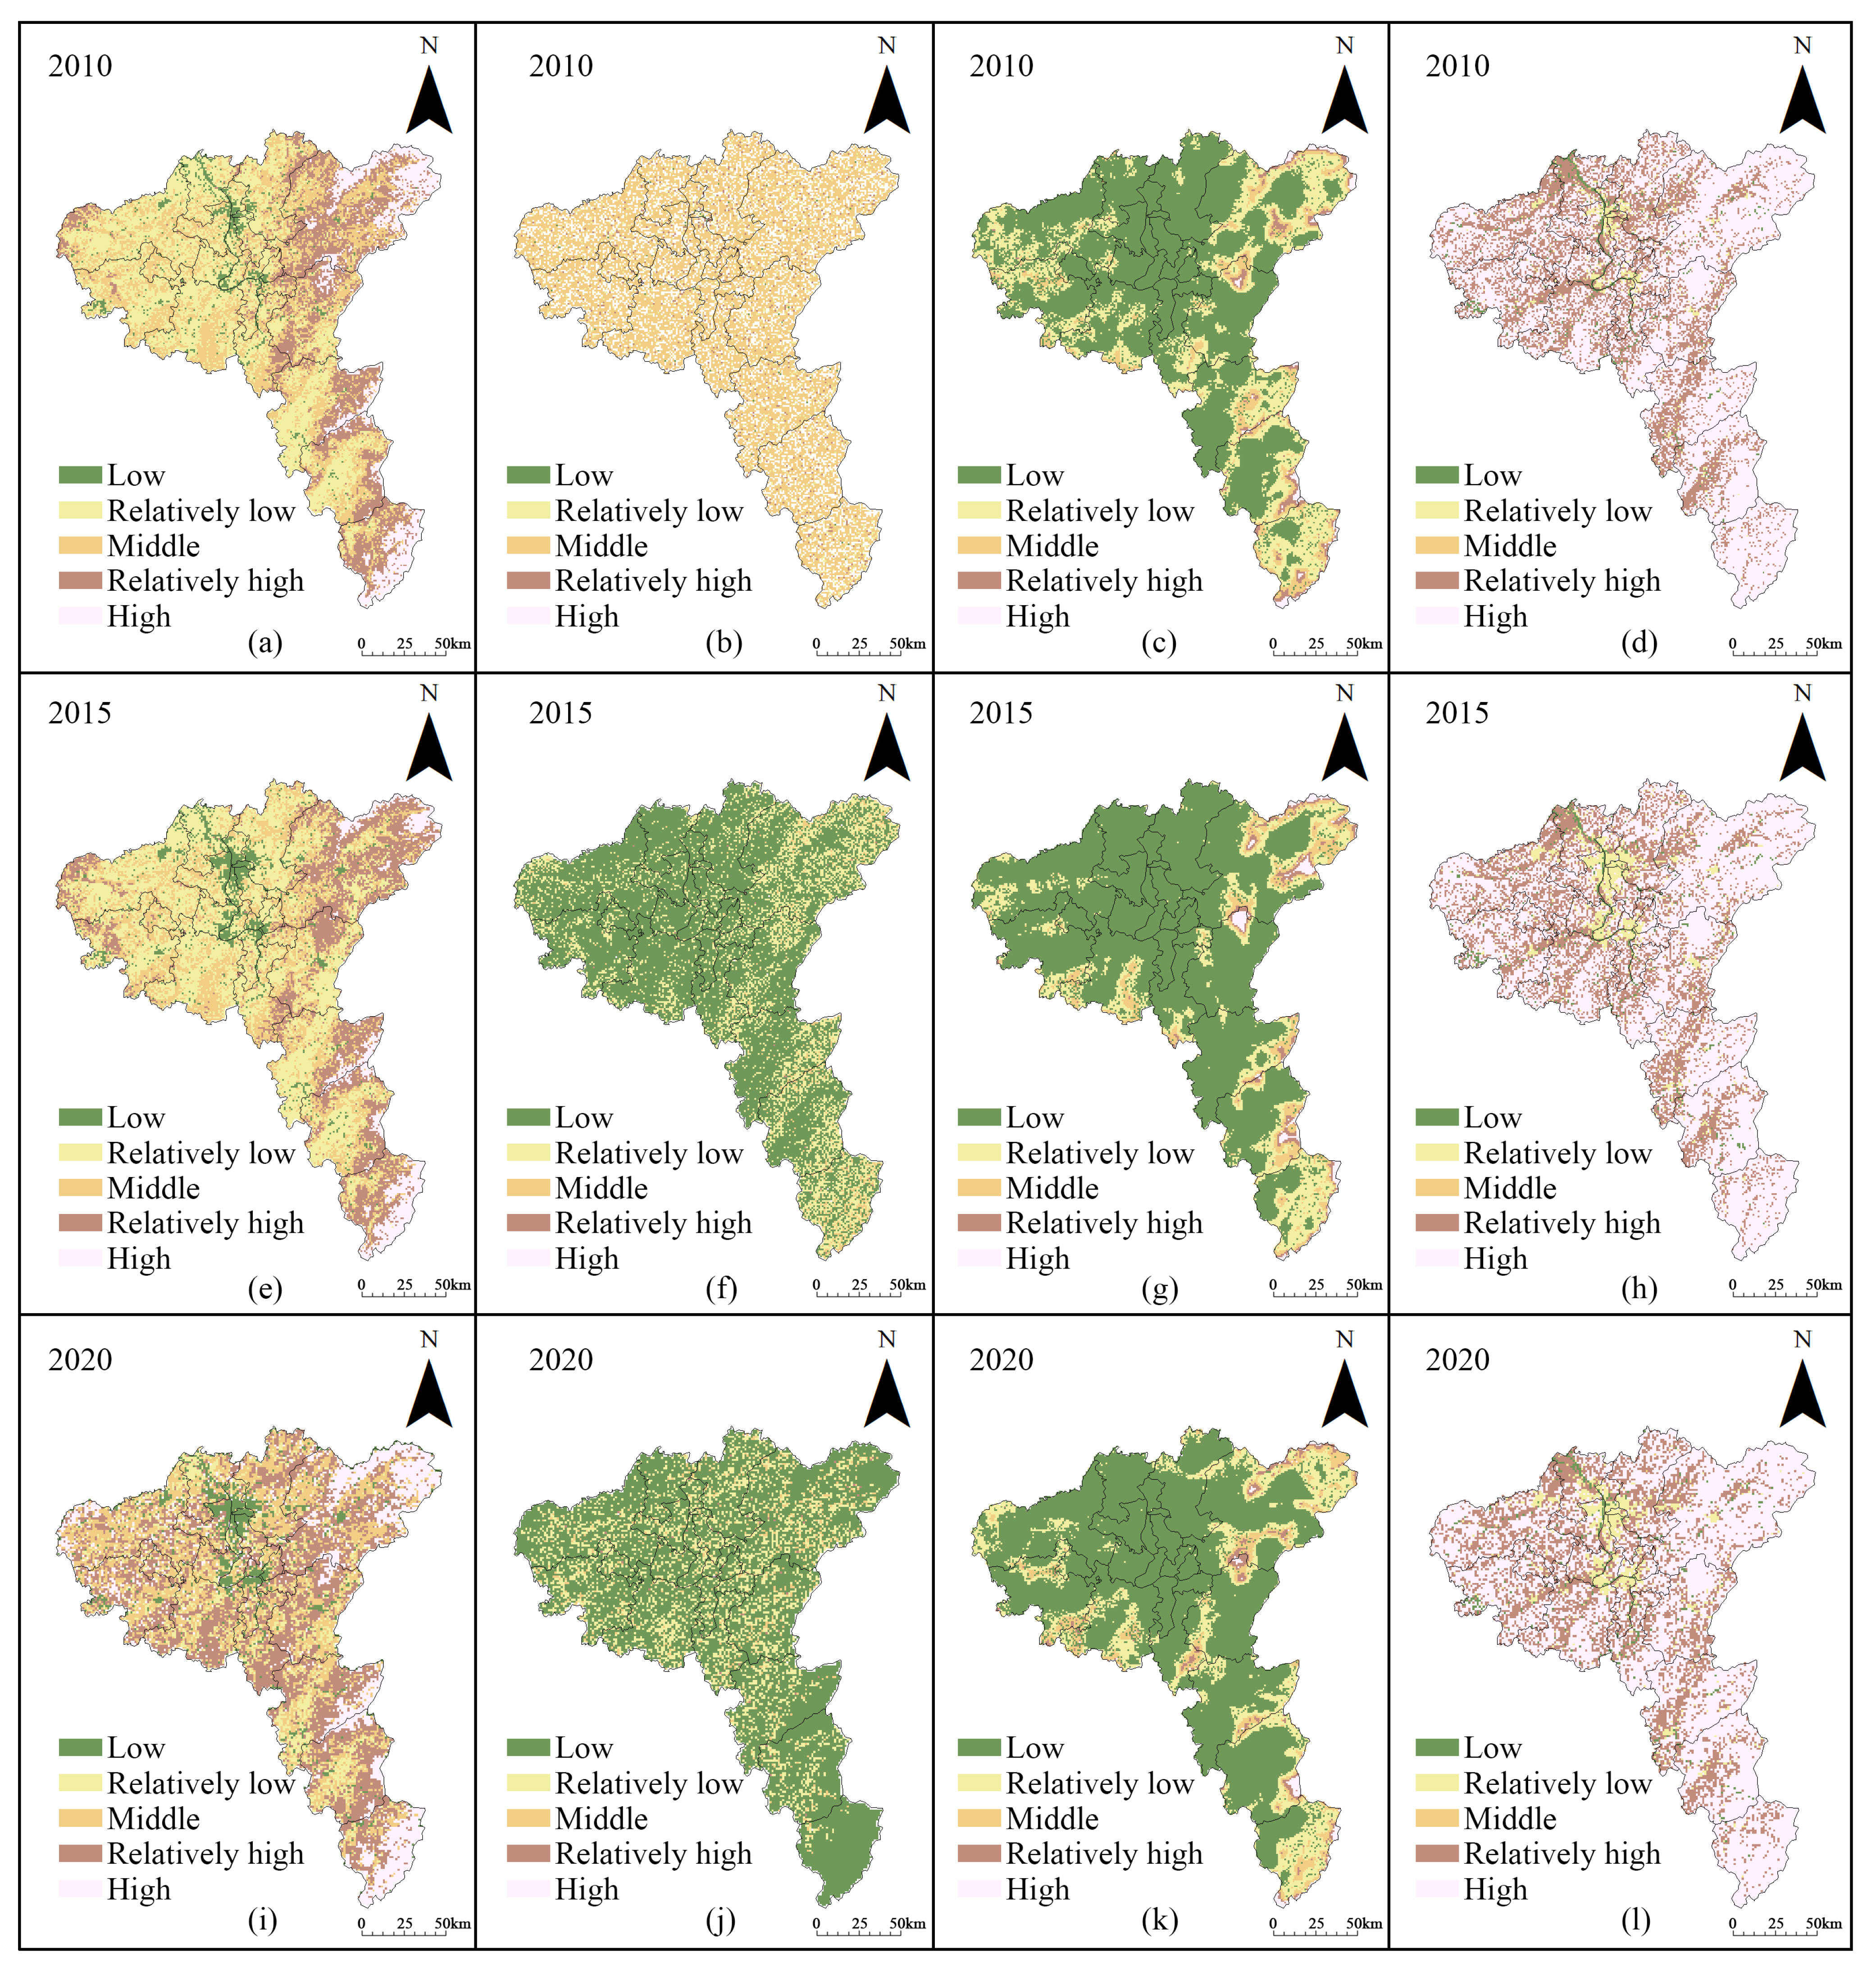
Figure 3 presents the ecosystem service results. From 2010 to 2020, the WC in the study area exhibited an overall upward trend. A spatial distribution analysis revealed that in 2010 and 2015, the eastern and southern regions had high values, whereas the central, western, and northern regions had low values. By 2020, the pattern shifted to low values in the center and high values on the periphery. The SC significantly decreased from 2010 to 2015 and then stabilized, displaying a uniform spatial distribution. The HQ remained generally low, with higher values in the east and lower values in the west. The CS was predominantly high, characterized by low values in the center and high values on the periphery.
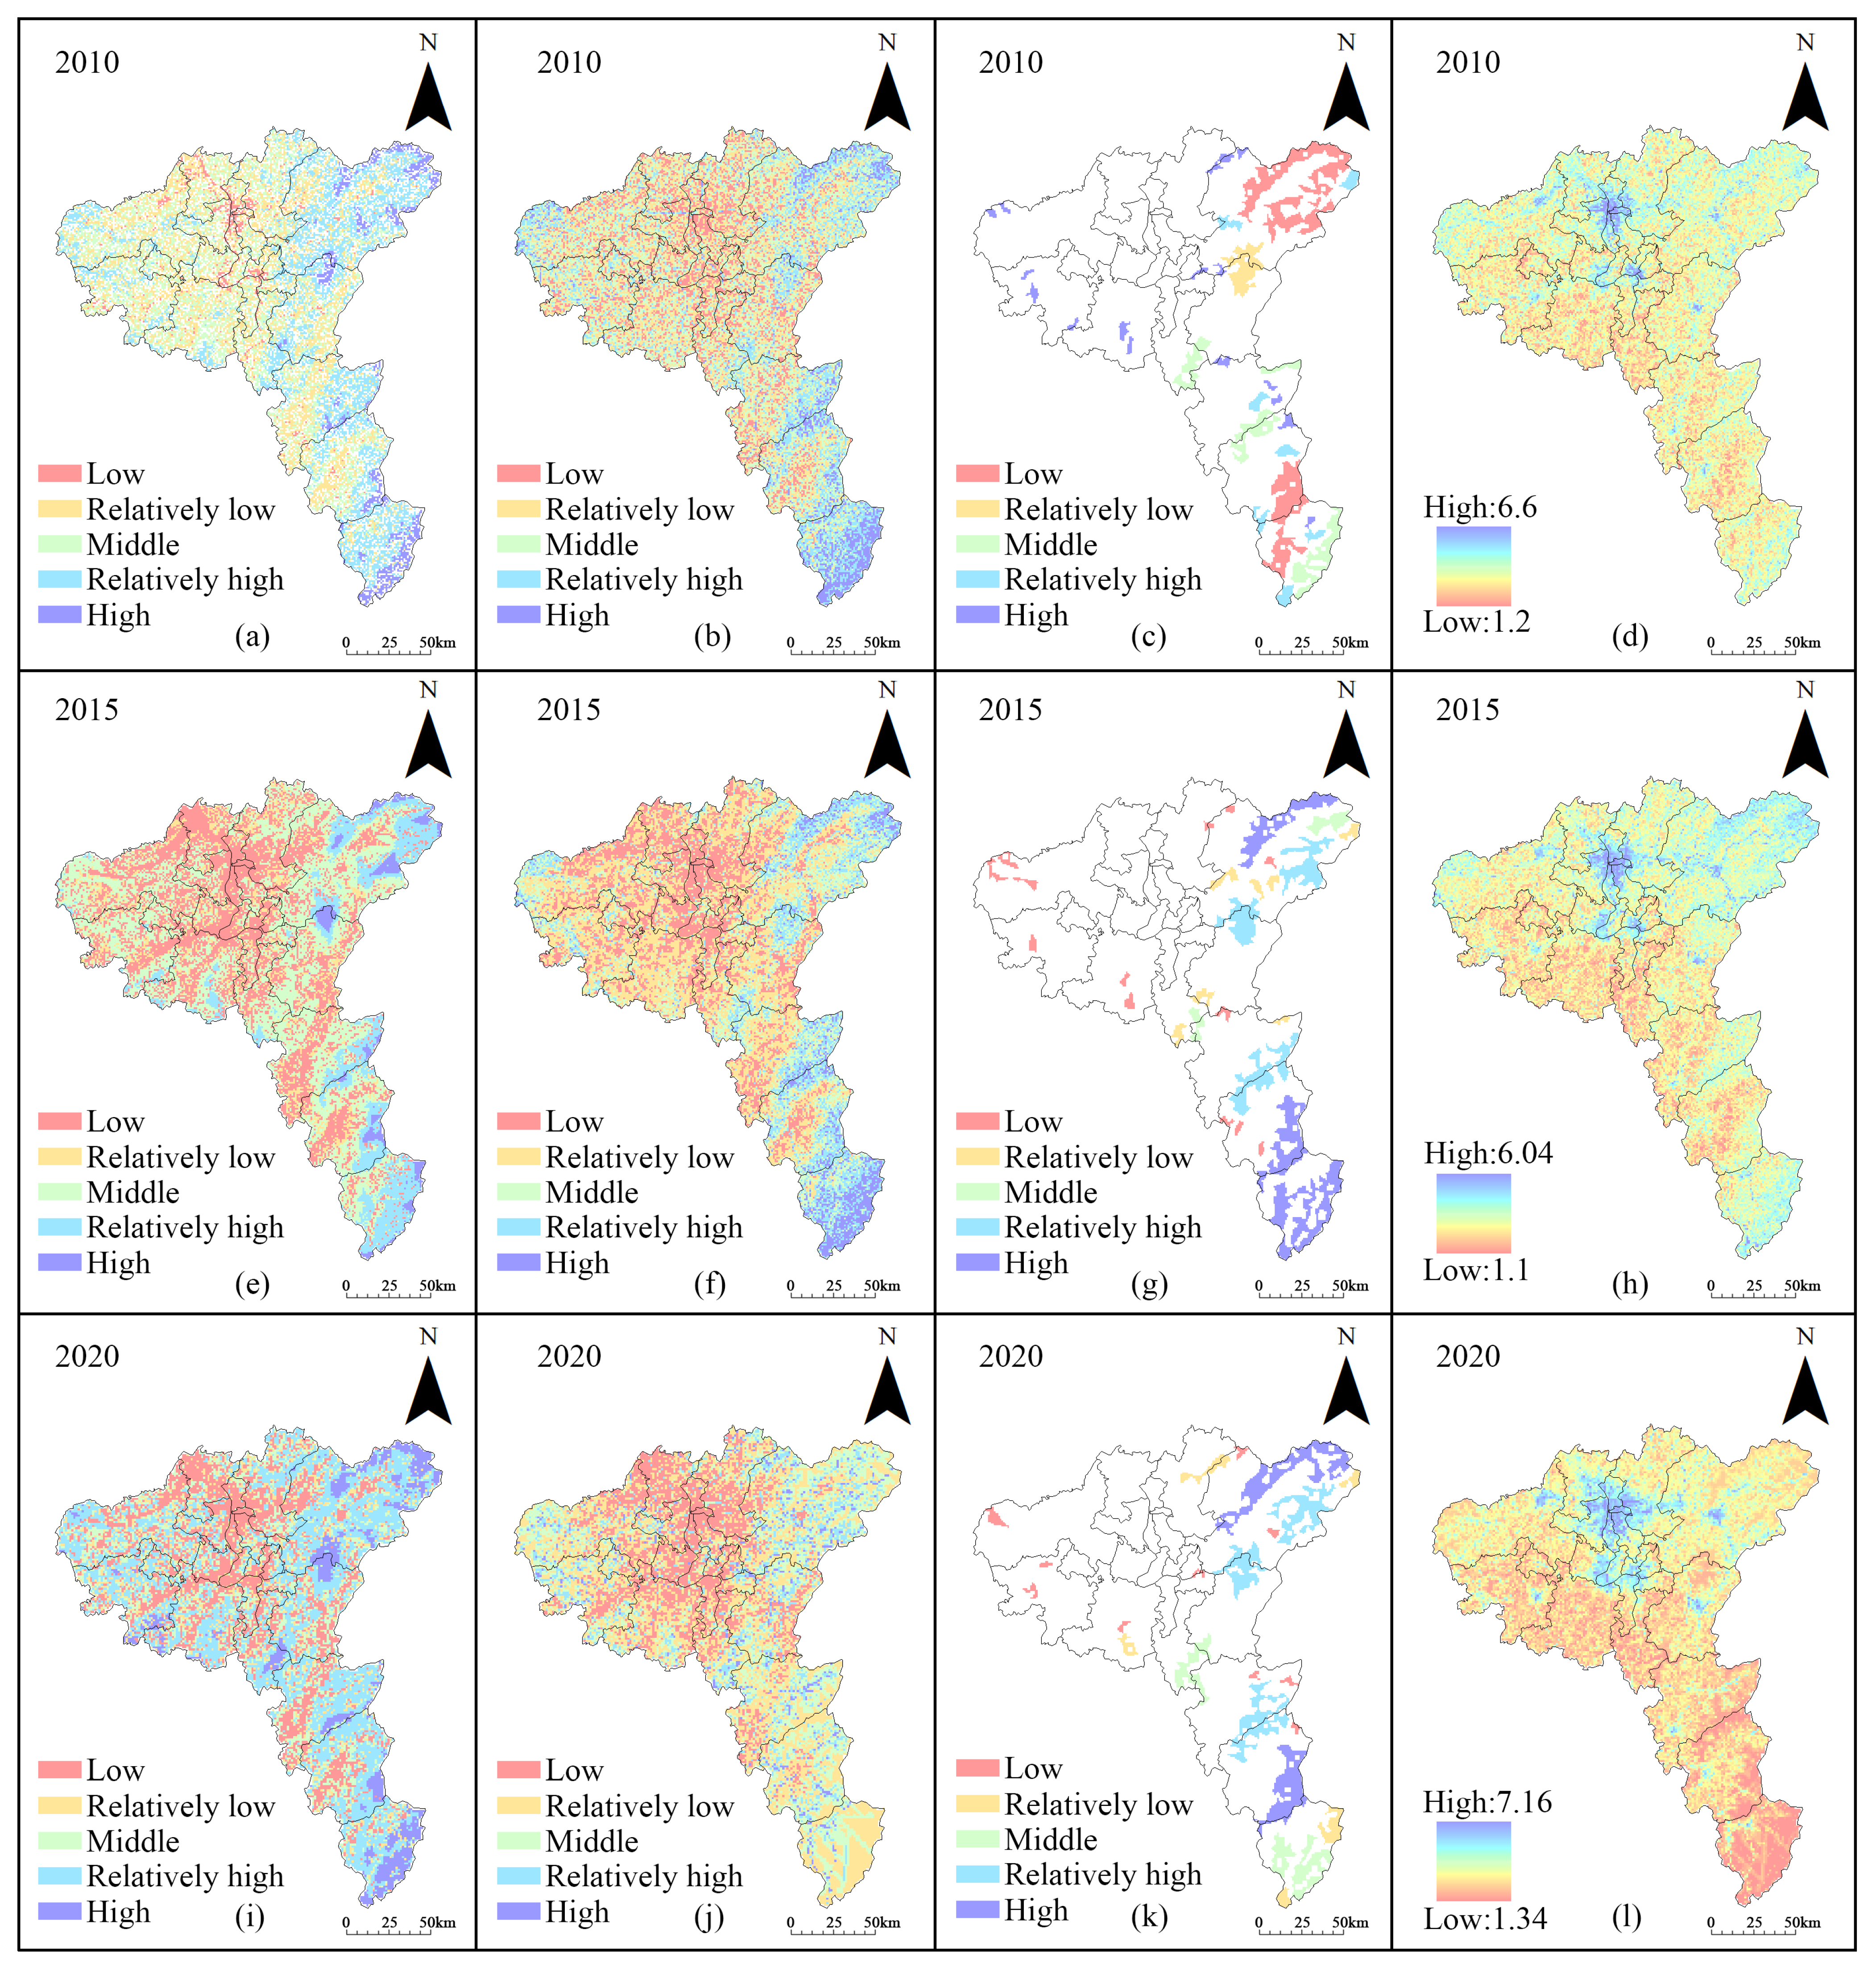
The results of the ecosystem service in the CZTUA are shown in Figure 4. From 2010 to 2020, the overall changes exhibited significant fluctuations, showing a “decline–rise”trend in area coverage. Between 2010 and 2015, the decline in ecosystem service was manifested primarily in low-importance areas, with their areas measuring 864.67 km2, 9976.71 km2, and 7466.05 km2, respectively. This change was mainly influenced by SC. From 2015 to 2020, the increase in ecosystem service was primarily reflected in relatively high-importance areas, which covered 5037.89 km2, 3222.04 km2, and 10285.96 km2 respectively. This growth was attributed to the implementation of numerous forest construction projects in the study area during this period, leading to improvements in both the WC and the HQ, thus resulting in significant expansion of relatively high-importance areas. Spatial distribution patterns revealed an east-high, west-low characteristic in both 2010 and 2015, with high-importance areas predominantly located in the eastern mountainous and hilly regions. By 2020, new high-importance zones emerged in western mountainous areas, forming a central-low, peripheral-high distribution pattern.

4.2. Ecological Sensitivity

The ecological sensitivity results of the CZTUA are shown in Figure 4. From 2010 to 2020, the overall sensitivity remained at a middle-to-low level, and the area continuously expanded. The areas of middle-to-low sensitivity accounted for 74.81%, 79.13%, and 85.34% of the total area, respectively. In contrast, the areas of relatively high and high sensitivity consistently decreased. Specifically, the areas of relatively high sensitivity were 5097 km2, 4103.32 km2, and 2959.19 km2, while the areas of high sensitivity were 1891 km2, 1689.47 km2, and 1090.72 km2, respectively. The spatial distribution exhibited a characteristic pattern of higher in the surrounding areas and lower in the central region. In 2010 and 2015, the relatively high and high sensitivity areas were predominantly located in the surrounding mountainous and hilly regions. By 2020, there was a noticeable transition of the overall high sensitivity areas towards relatively low sensitivity areas.

4.3. Landscape Connectivity

The results of the MSPA model analysis are presented in Table 5. From 2010 to 2020, the core areas of the CZTUA comprised 305, 291, and 282 patches, with respective landscape areas of 5303 km2, 5211.4 km2, and 5397 km2. Based on this, regions with an area greater than 20 km2 were selected as ecological patches. Ultimately, from 2010 to 2020, 38, 33, and 30 ecological patches were identified, respectively (Figure 4), with areas of 4387.71 km2, 4275.59 km2, and 4430.56 km2. The dpc values calculated using Conefor 2.6 software and Conefor Inputs for ArcGIS 10.8 demonstrate that higher values indicate stronger landscape connectivity of ecological patches. From 2010 to 2020, the landscape connectivity exhibited an overall medium-to-high connectivity with an expanding area. The regions of medium-to-high connectivity accounted for 75.98%, 79.11%, and 77.32% of the total ecological patch area, respectively. Specifically, the areas of middle connectivity were 1343.79 km2, 336.64 km2, and 1093.5 km2, the areas of relatively high connectivity were 741.15 km2, 1681.63 km2, and 1519.56 km2, and the areas of high connectivity were 1249.02 km2, 1363.99 km2, and 812.43 km2. The spatial distribution patterns exhibited an east-high–west-low characteristic. The ecological patches in the eastern part of Changsha and the southern part of Zhuzhou were distributed in patches, indicating strong connectivity, whereas the ecological patches in the western part of Xiangtan were fragmented, showing low connectivity.

4.4. Ecosystem Importance and Ecological Sources

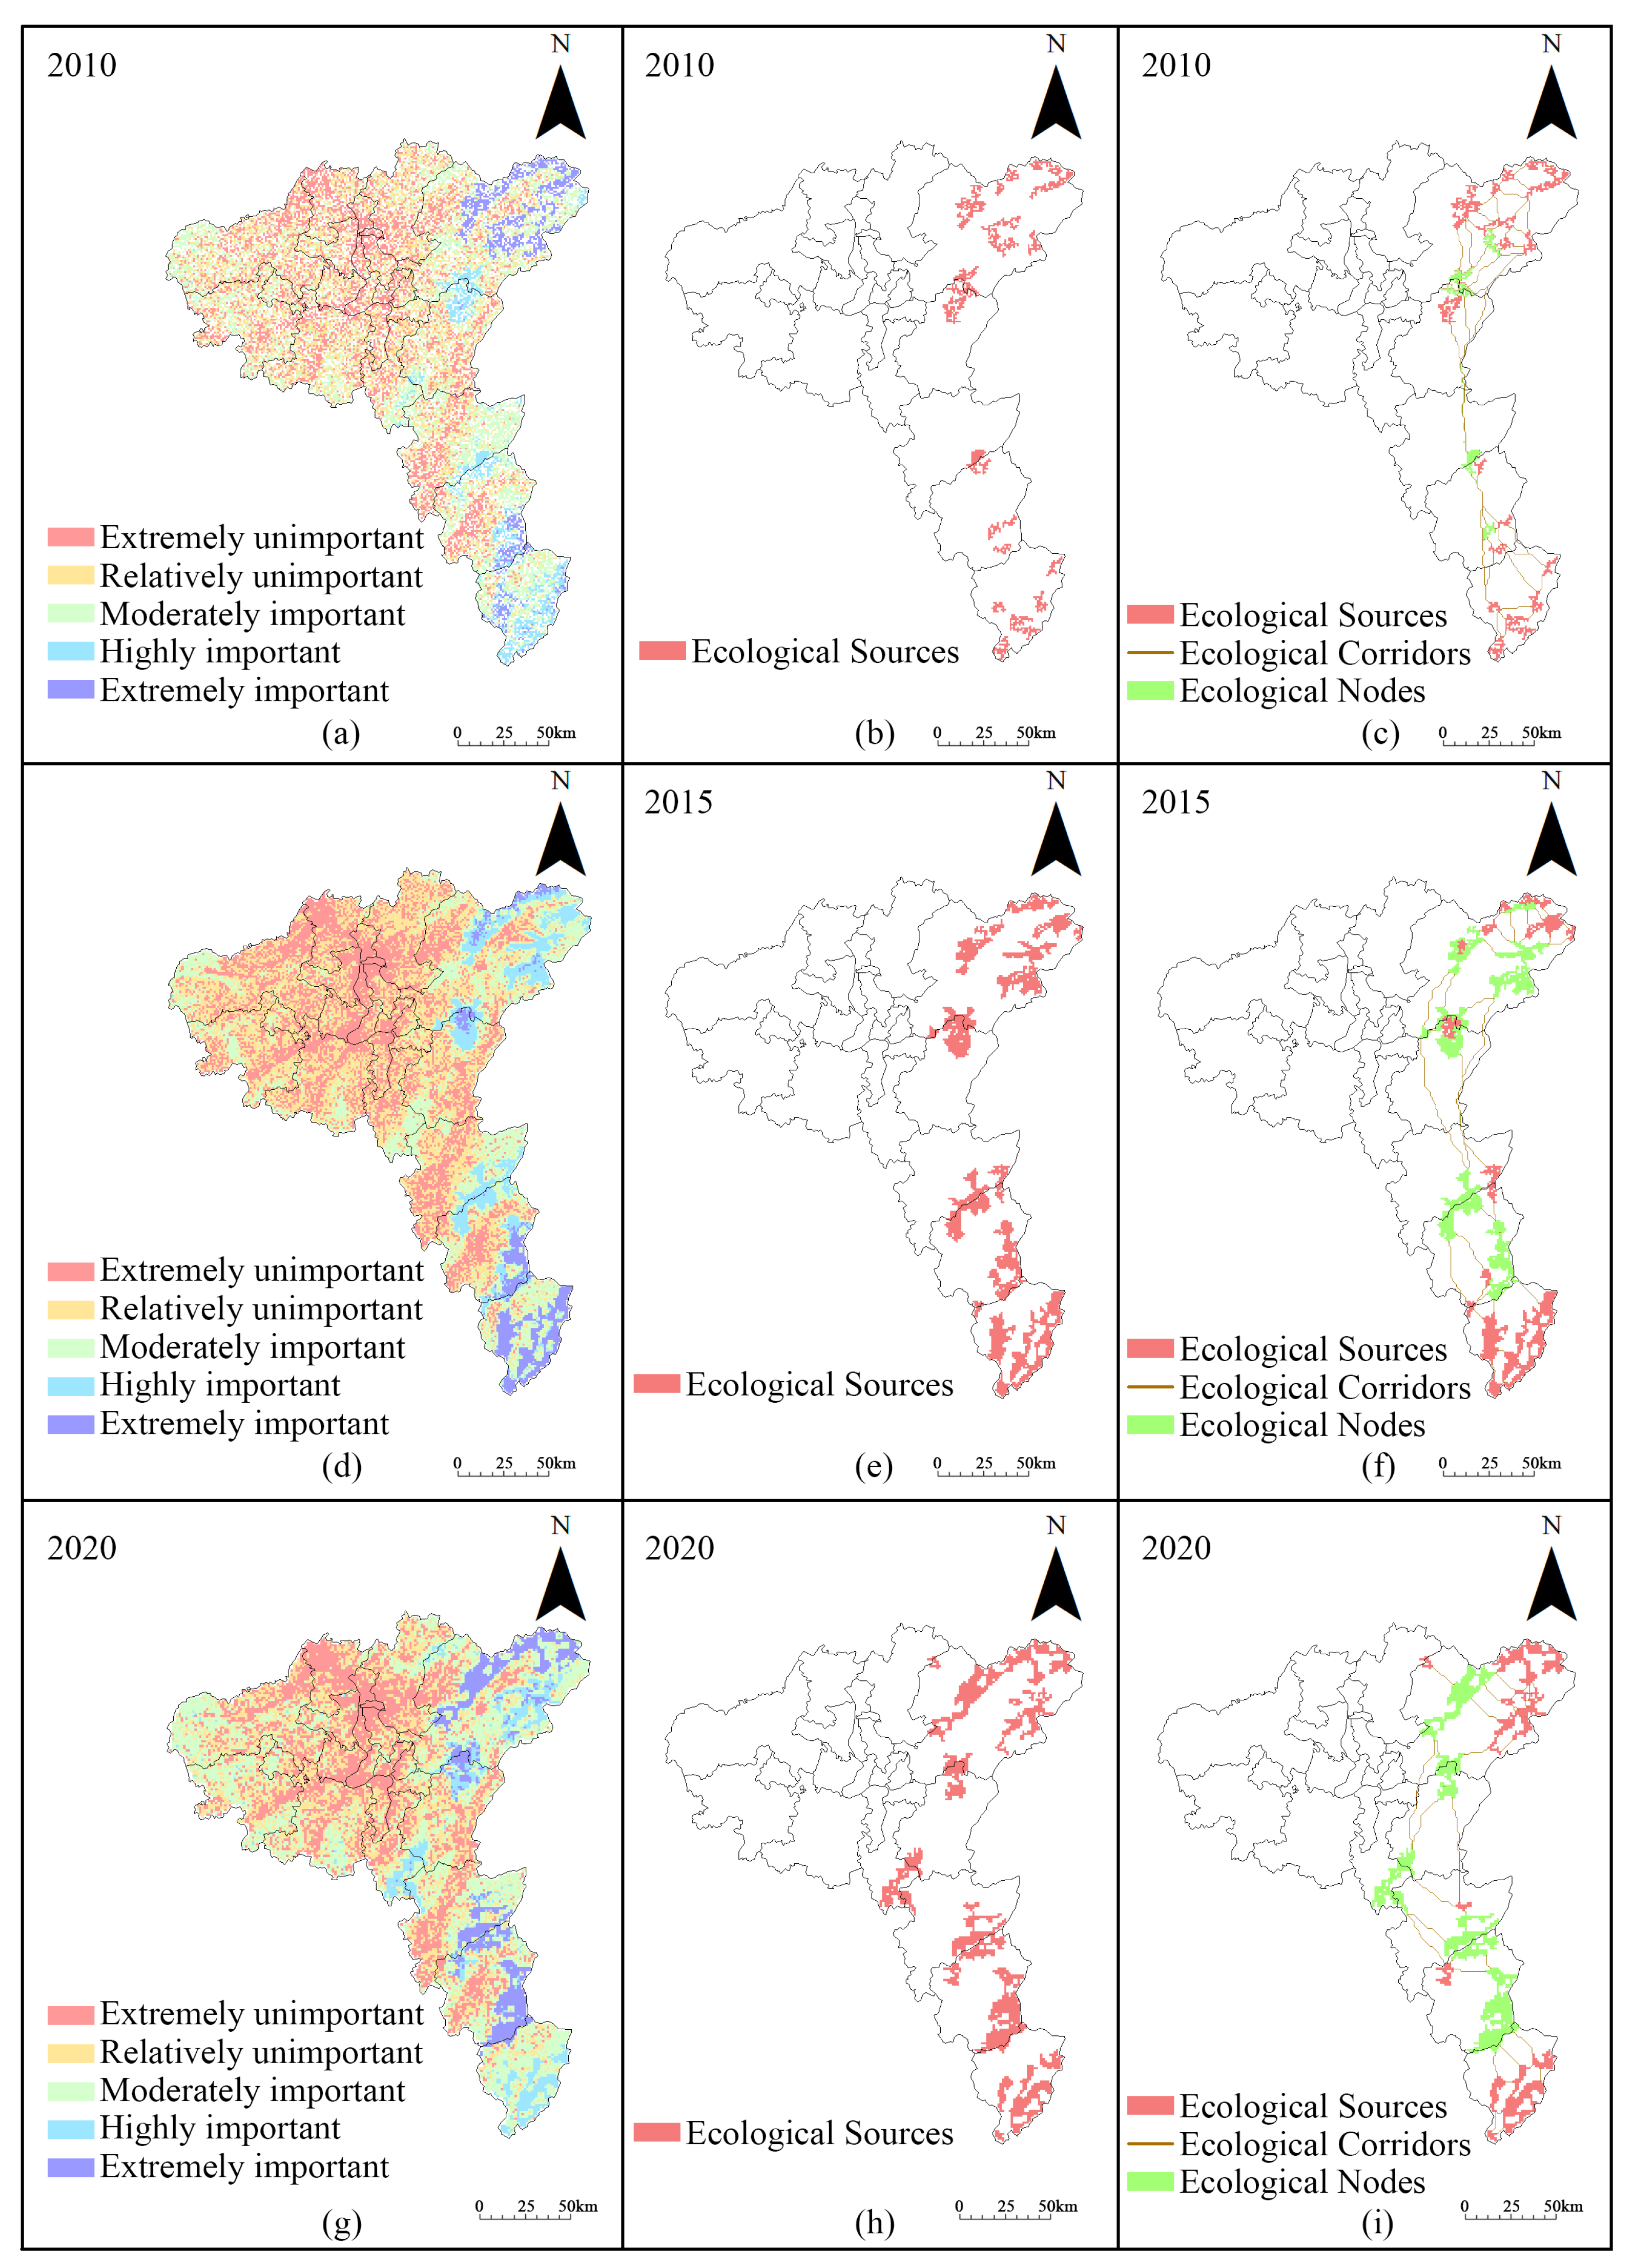
The evaluation results of ecosystem importance in the CZTUA are shown in Figure 5. From 2010 to 2020, the overall ecosystem importance exhibited a continuous upward trend. Specifically, the areas classified as highly important measured 1152.9 km2, 1928.06 km2, and 1741.71 km2, respectively, during this period, while the extremely important areas expanded from 1079.33 km2 to 1296.12 km2 and further to 2120.41 km2 in an east-high–west-low pattern, with high important areas predominantly concentrated in the eastern mountainous and hilly regions. In particular, western mountain areas showed a gradual transition to important ecological zones during the study period. The results of the ecological sources for the CZTUA are shown in Figure 5. During the period from 2010 to 2020, 26, 23, and 23 ecological sources were identified, respectively, with areas of 1113.6 km2, 2791.07 km2, and 3013.96 km2. These ecological sources exhibited an uneven spatial distribution, predominantly concentrated in the eastern mountainous and hilly regions of the study area. By 2020, there was a westward expansion, with an increase in ecological source areas in the mountainous and hilly regions of Lukou District and Liuyang City.

4.5. Comprehensive Resistance Surface and Ecological Corridors

The results of the comprehensive resistance surface for the CZTUA are shown in Figure 4. From 2010 to 2020, the overall resistance values exhibited an upward trend, with a spatial distribution characterized by high values in the central region and low values in the surrounding areas. The areas of high resistance value changed from a dispersed distribution to concentration in the center of the districts and counties. The largest scale was mainly distributed in the central urban area of the CZTUA, and the area was gradually expanding. The areas of low resistance value were distributed mainly around the study area, and the resistance values around the study area decreased significantly, facilitating connectivity between the ecological source sites.
The ecological corridors in the CZTUA are presented in Figure 5. From 2010 to 2020, the number of corridors was 52, 43, and 44, respectively, with total lengths of 1025.69 km, 684.4 km, and 536.25 km. The average lengths were approximately 19.72 km, 15.92 km, and 12.19 km, while the maximum lengths measured 130.76 km, 109.62 km, and 66.26 km, showing an overall declining trend in corridor length. The spatial distribution of ecological corridors exhibited significant variation across the study area. They were predominantly distributed in areas with dense ecological sources, forming network-like patterns of mostly short-distance corridors (e.g., in Liuyang City and Yanling County). In contrast, areas with dispersed ecological sources featured belt-shaped distributions dominated by long-distance corridors (e.g., in Liling City, You County, and Chaling County). By 2020, the articulation of the ecological source area in the Lukou District resulted in an increase in the number of pathways for species migration, energy flow, and other channels, which led to an increase in the number of ecological corridors and a shortening of the length, and the area should be protected more in the future.

4.6. Ecological Nodes

The ecological nodes are the areas with higher current density in the ecological corridors, which indicates that the possibility of flowing through this area in the process of biological migration is higher or the place where biological flow must pass through, and if the ecological nodes are damaged, it will have a greater impact on the connectivity and integrity of the ecological network [59]. The results of ecological nodes in the CZTUA are shown in Figure 5. From 2010 to 2020, the numbers of nodes were 14, 10, and 5, with areas of 290.6 km2, 1559 km2, and 1796.48 km2, respectively, showing a continuous decrease in the number and a continuous expansion in the scale. Spatially, ecological nodes shifted from locations at the entrances and exits of ecological sources and along ecological corridors toward the ecological sources. This indicated that the “bottlenecks” or key control points of the entire ecological network became more centralized and critical, which made conservation priorities more prominent and reflected enhanced maturation and stability of the ecological network’s structure.

4.7. Driving Factor of ESP in the CZTUA

The results of factor detection indicated that from 2010 to 2020, the explanatory power of the six driving factors for the spatial heterogeneity of ecological sources varied significantly, with the q-values of natural environmental factors generally being higher than those of socioeconomic factors (Figure 6). Specifically, the q-values of X1 and X2 remained at relatively high levels across all years, ranging from 0.37 to 0.56 and 0.23 to 0.54, respectively, demonstrating that they were the primary natural drivers shaping the spatial pattern of ecological sources. The results of interaction detection further revealed significant synergistic enhancement effects between factors (Figure 7). Particularly, the interaction between X1 and X2 reached 0.67 in 2020, which was significantly higher than the explanatory power of any single factor, reflecting the synergistic control of hydrological processes on the distribution of ecological sources. Although the direct explanatory power of X5 and X6 was weak, their interactive effects with natural factors were significant, indicating that human activities regulated the ecological pattern based on the natural background.

5. Discussion

5.1. Spatio-Temporal Evolution Characteristics of ESP in the CZTUA

Through spatio-temporal evolution analysis from 2010 to 2020, it was observed that the ESP of the CZTUA exhibited a significant optimization trend, characterized by a shift “from fragmentation to integration, from quantitative expansion to qualitative enhancement.” Specifically, ecological sources displayed a development pattern of “reduced quantity, expanded area, progression from points to patches, and westward expansion”. This transformation primarily resulted from ecological restoration projects and natural recovery, which enhanced ecological quality in the western regions and filled gaps between sources in the eastern areas, collectively promoting the integrated and large-scale development of ecological sources. From 2010 to 2020, the ecological sources within the urban agglomeration were mainly distributed in mountainous and hilly regions with favorable ecological conditions—key water recharge zones and headwater areas—where contiguous forest cover supported clustered ecological development. The evolution of ecological corridors showed an initial decrease in number followed by an increase, although the total length continued to shorten. Dense corridor areas formed short-distance networks, while sparse areas displayed long-distance linear distributions. Sustaining and expanding ecological sources are vital for increasing the number of ecological corridors [60]. Between 2010 and 2015, the reduction of ecological sources in Liuyang and Liling cities constrained species migration paths, reducing corridor numbers. By 2020, new ecological sources in Lukou District enhanced migration routes from Liling City to Chaling County, increasing corridor numbers. These corridors circumvented high-resistance areas rather than following direct paths. Yang et al. [61] highlight that the distribution of integrated resistance surfaces determines ecological corridor distribution, aligning with our findings. The spatio-temporal evolution of ecological nodes showed a decrease in number but an increase in scale, with distribution shifting from entry/exit points to sources. Ecological nodes, areas of high current density within corridors [62], were influenced by the integration of ecological sources, altering species migration paths and shifting high-flow areas. Overall, these changes indicated that the bottlenecks and critical control points across the ecological network had become more concentrated and central, which highlighted conservation priorities and reflected enhanced maturity and stability of the ecological network’s structure.

5.2. Driving Forces for Spatio-Temporal Evolution of ESP in the CZTUA

Analyzing the spatio-temporal evolution of the ESP in the CZTUA reveals that ecological corridors and nodes are shaped by ecological sources. Combined with the results of the GD, hydroclimatic elements were the dominant natural factors shaping the spatial differentiation pattern of ecological sources. The explanatory power of precipitation continuously increased, and although the explanatory power of potential evapotranspiration was relatively weak, its interaction with X1 consistently maintained the highest strength. This finding was highly consistent with existing research conclusions—studies on WC conducted by Li et al. [63] in the Yiluo River Basin and Zhao et al. [64] in the Yellow Basin both identified precipitation as a key driver, with Zhao et al. further highlighting the interaction between precipitation and potential evapotranspiration as the most influential factor on WC. This underscores the significant role of these interactions in WC. In this study, ecological sources in the CZTUA were mainly found in mountainous and hilly regions with higher elevations, forest-dominated land use, and dense vegetation. Across the study area, annual precipitation decreased from east to west, while potential evapotranspiration showed the opposite trend. From 2010 to 2020, western precipitation increased, while potential evapotranspiration remained stable, resulting in higher water yield in the west. Additionally, the area’s low and stable surface runoff enhances water conservation in the west. Consequently, ecological quality in the western mountainous and hilly areas significantly improved, prompting the westward expansion of ecological sources. Zhang et al. [65] investigated the spatio-temporal evolution and influencing factors of the ESP in the Loess Plateau, northern Shaanxi. They discovered that ecological sources were mainly located in the southern regions, characterized by forest-dominated land use and high habitat quality. Key factors such as vegetation coverage, landscape diversity, slope, and precipitation were positively correlated with the spatial heterogeneity of the ESP. These findings are consistent with the current study, which also highlights that ESP spatial distribution tends to favor ecologically high-quality areas, which further confirmed that WC was the core natural driver of the spatio-temporal evolution of the ESP in the CZTUA.
Building upon the natural conditions that established the ecological baseline, socio-political factors profoundly influenced the evolution of the ESP by regulating land use patterns and the intensity of human activities. Although the direct explanatory power of X5 and X6 was low, their interactive effects with natural factors were significant. For instance, the interaction between X1 and X5 reached 0.60 in 2020, reflecting the indirect shaping of the ecological pattern by human activities under policy guidance. Since the establishment of the “Two-oriented Society” pilot zone in 2008, the CZT region has implemented a series of ecological restoration and spatial control policies, such as the “Hunan Province Chang-Zhu-Tan Ecological Green Heart Protection Regulations” and the “Xiangjiang River Basin Comprehensive Management Three-Year Action Plan.” On one hand, by delineating ecological protection red lines, industrial development and urban construction in the eastern mountainous and hilly areas were strictly restricted. From 2010 to 2020, the proportion of construction land within the eastern ecological sources was consistently maintained below 1%, while the proportion of forest land area was maintained above 95%, thus effectively preserving the integrity of the ecological sources. On the other hand, the implementation of ecological projects such as “Grain for Green” and the “Xiangjiang River Basin Comprehensive Management” significantly increased the area of western mountainous and hilly regions, directly providing the material basis for the westward expansion of ecological sources. Meanwhile, urban expansion, as indicated by X6, was effectively controlled in ecologically sensitive areas. These policies, by guiding the optimization of land use structure and the spatial reorganization of economic activities, indirectly enhanced ecosystem connectivity and stability, which serving as a crucial driving force for transforming the ESP from “natural potential” to “practical optimization.”
In summary, the evolution of the ESP in the CZTUA followed a dual-wheel driving mechanism of “natural foundation–policy regulation.”Superior hydroclimatic conditions provided the baseline potential for ecological restoration, while the regional ecological policy system centered on the “Two-oriented Society” translated this natural potential into tangible optimization of the ecological pattern through scientific territorial spatial control and sustained investment in ecological construction. It should be noted that the selection of driving factors in this study focused more on revealing the natural basis of spatial differentiation; the analysis of the transmission pathways through which policy factors indirectly affect the ecological pattern via intermediate variables remains insufficient. Future research should further integrate quantitative policy indicators and construct a comprehensive analytical framework of “policy drive–behavioral response–pattern evolution” to decipher more fully the complex mechanisms underlying the evolution of the ecological security pattern.

5.3. Ecological Control Zoning and Improvement Strategies Based on ESP

5.3.1. Ecological Control Zoning

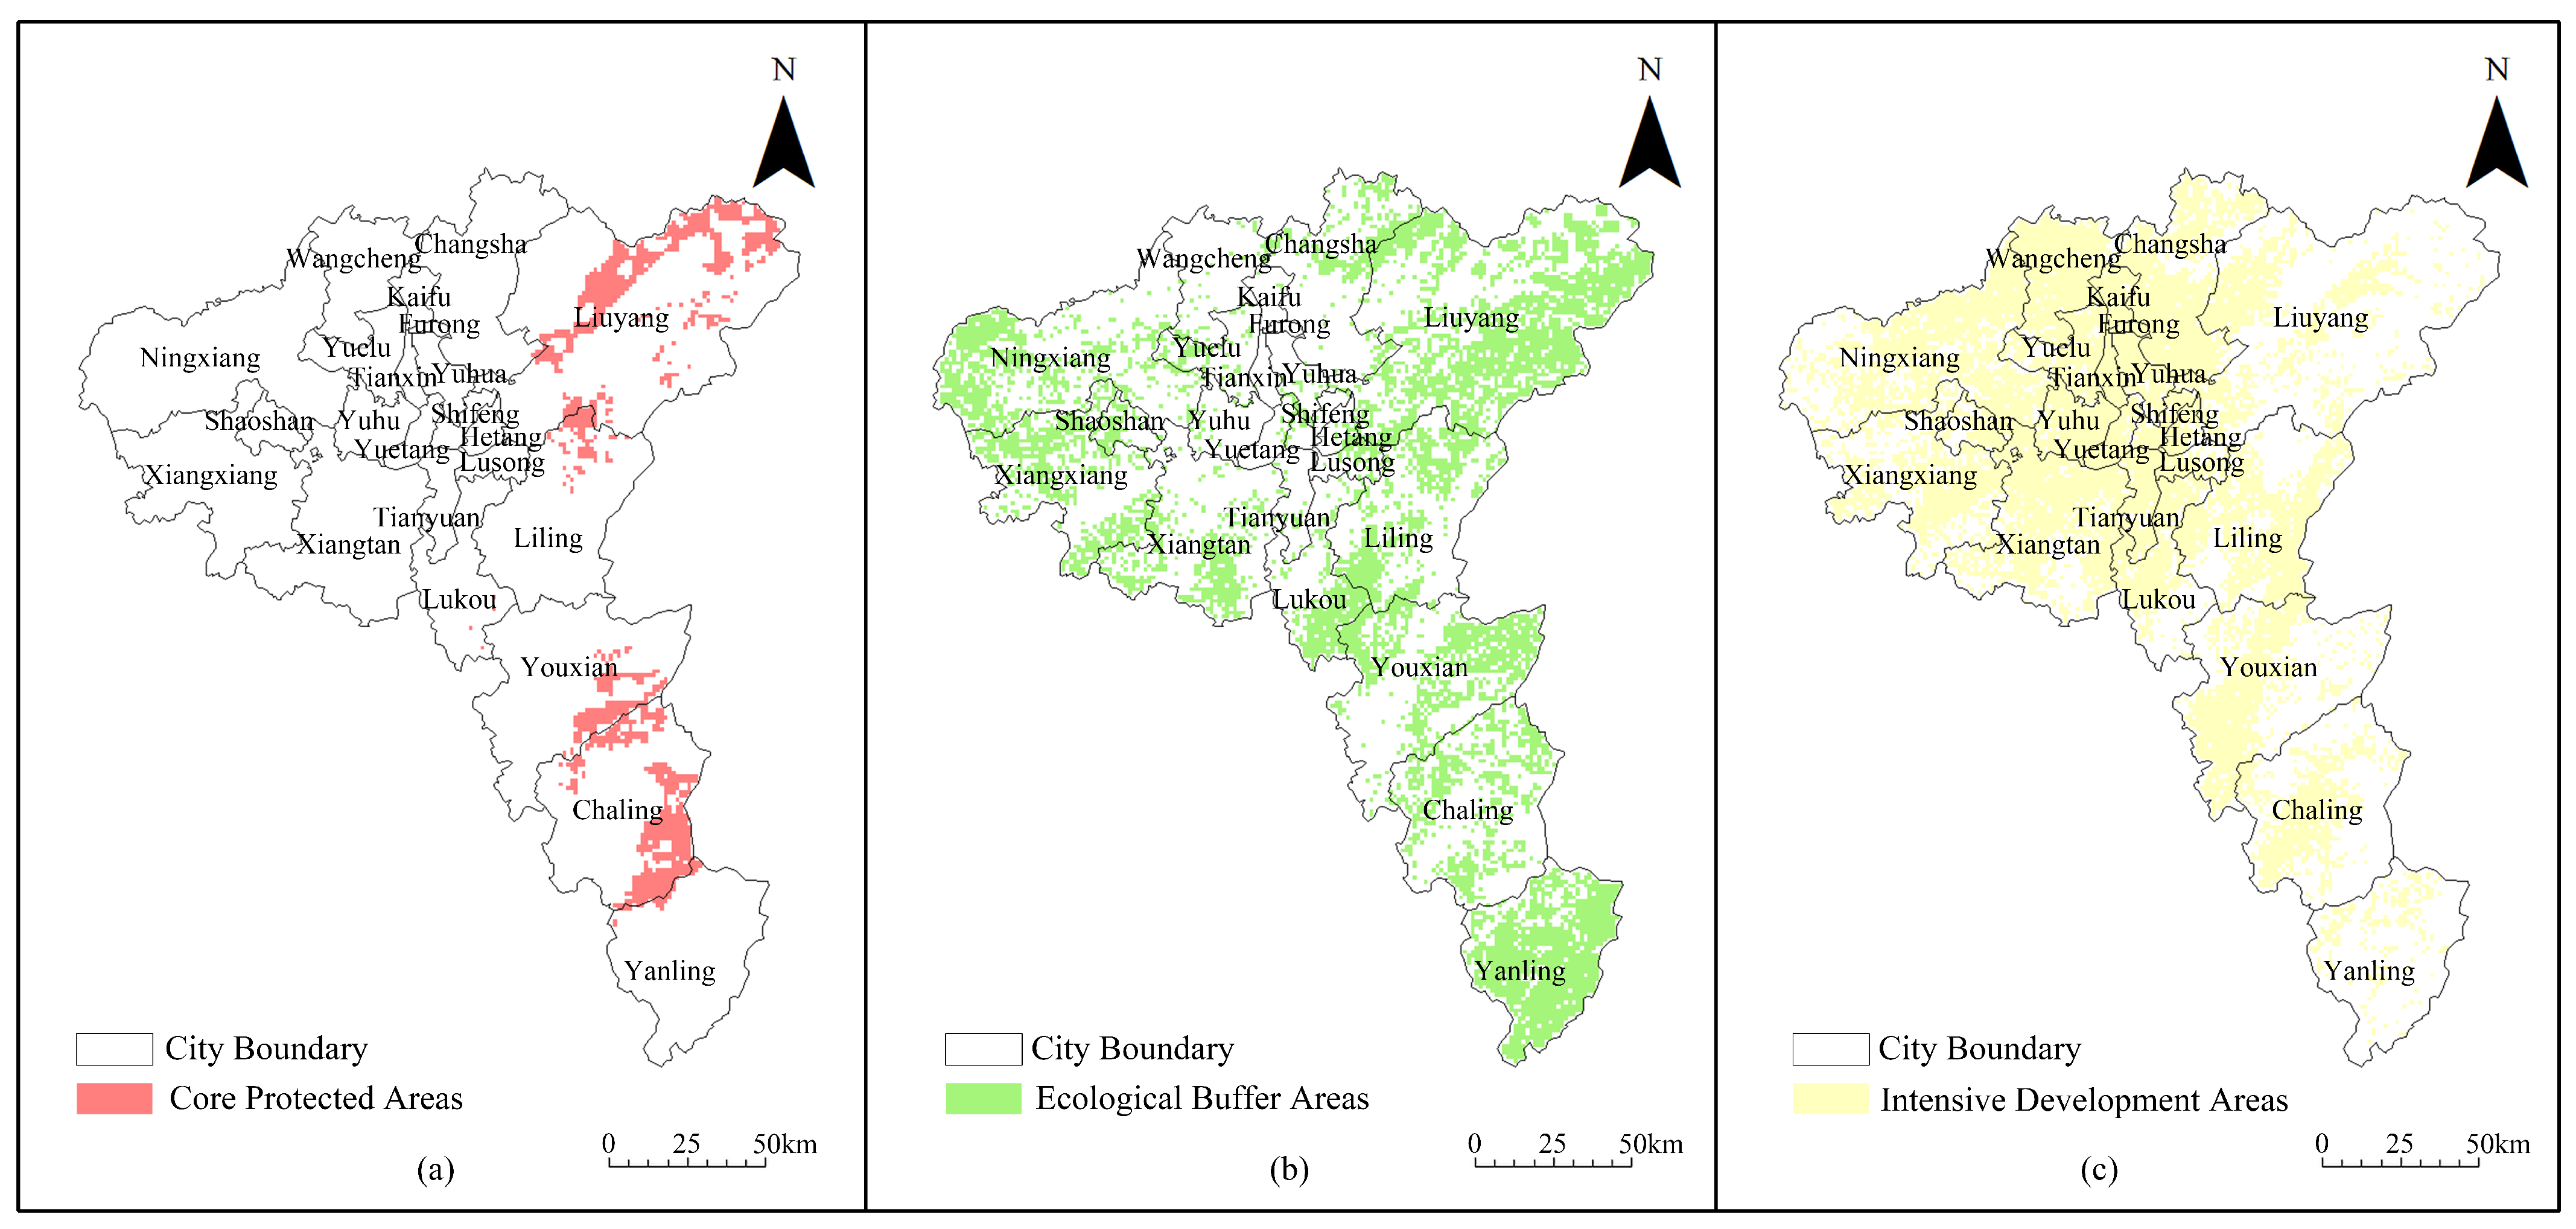
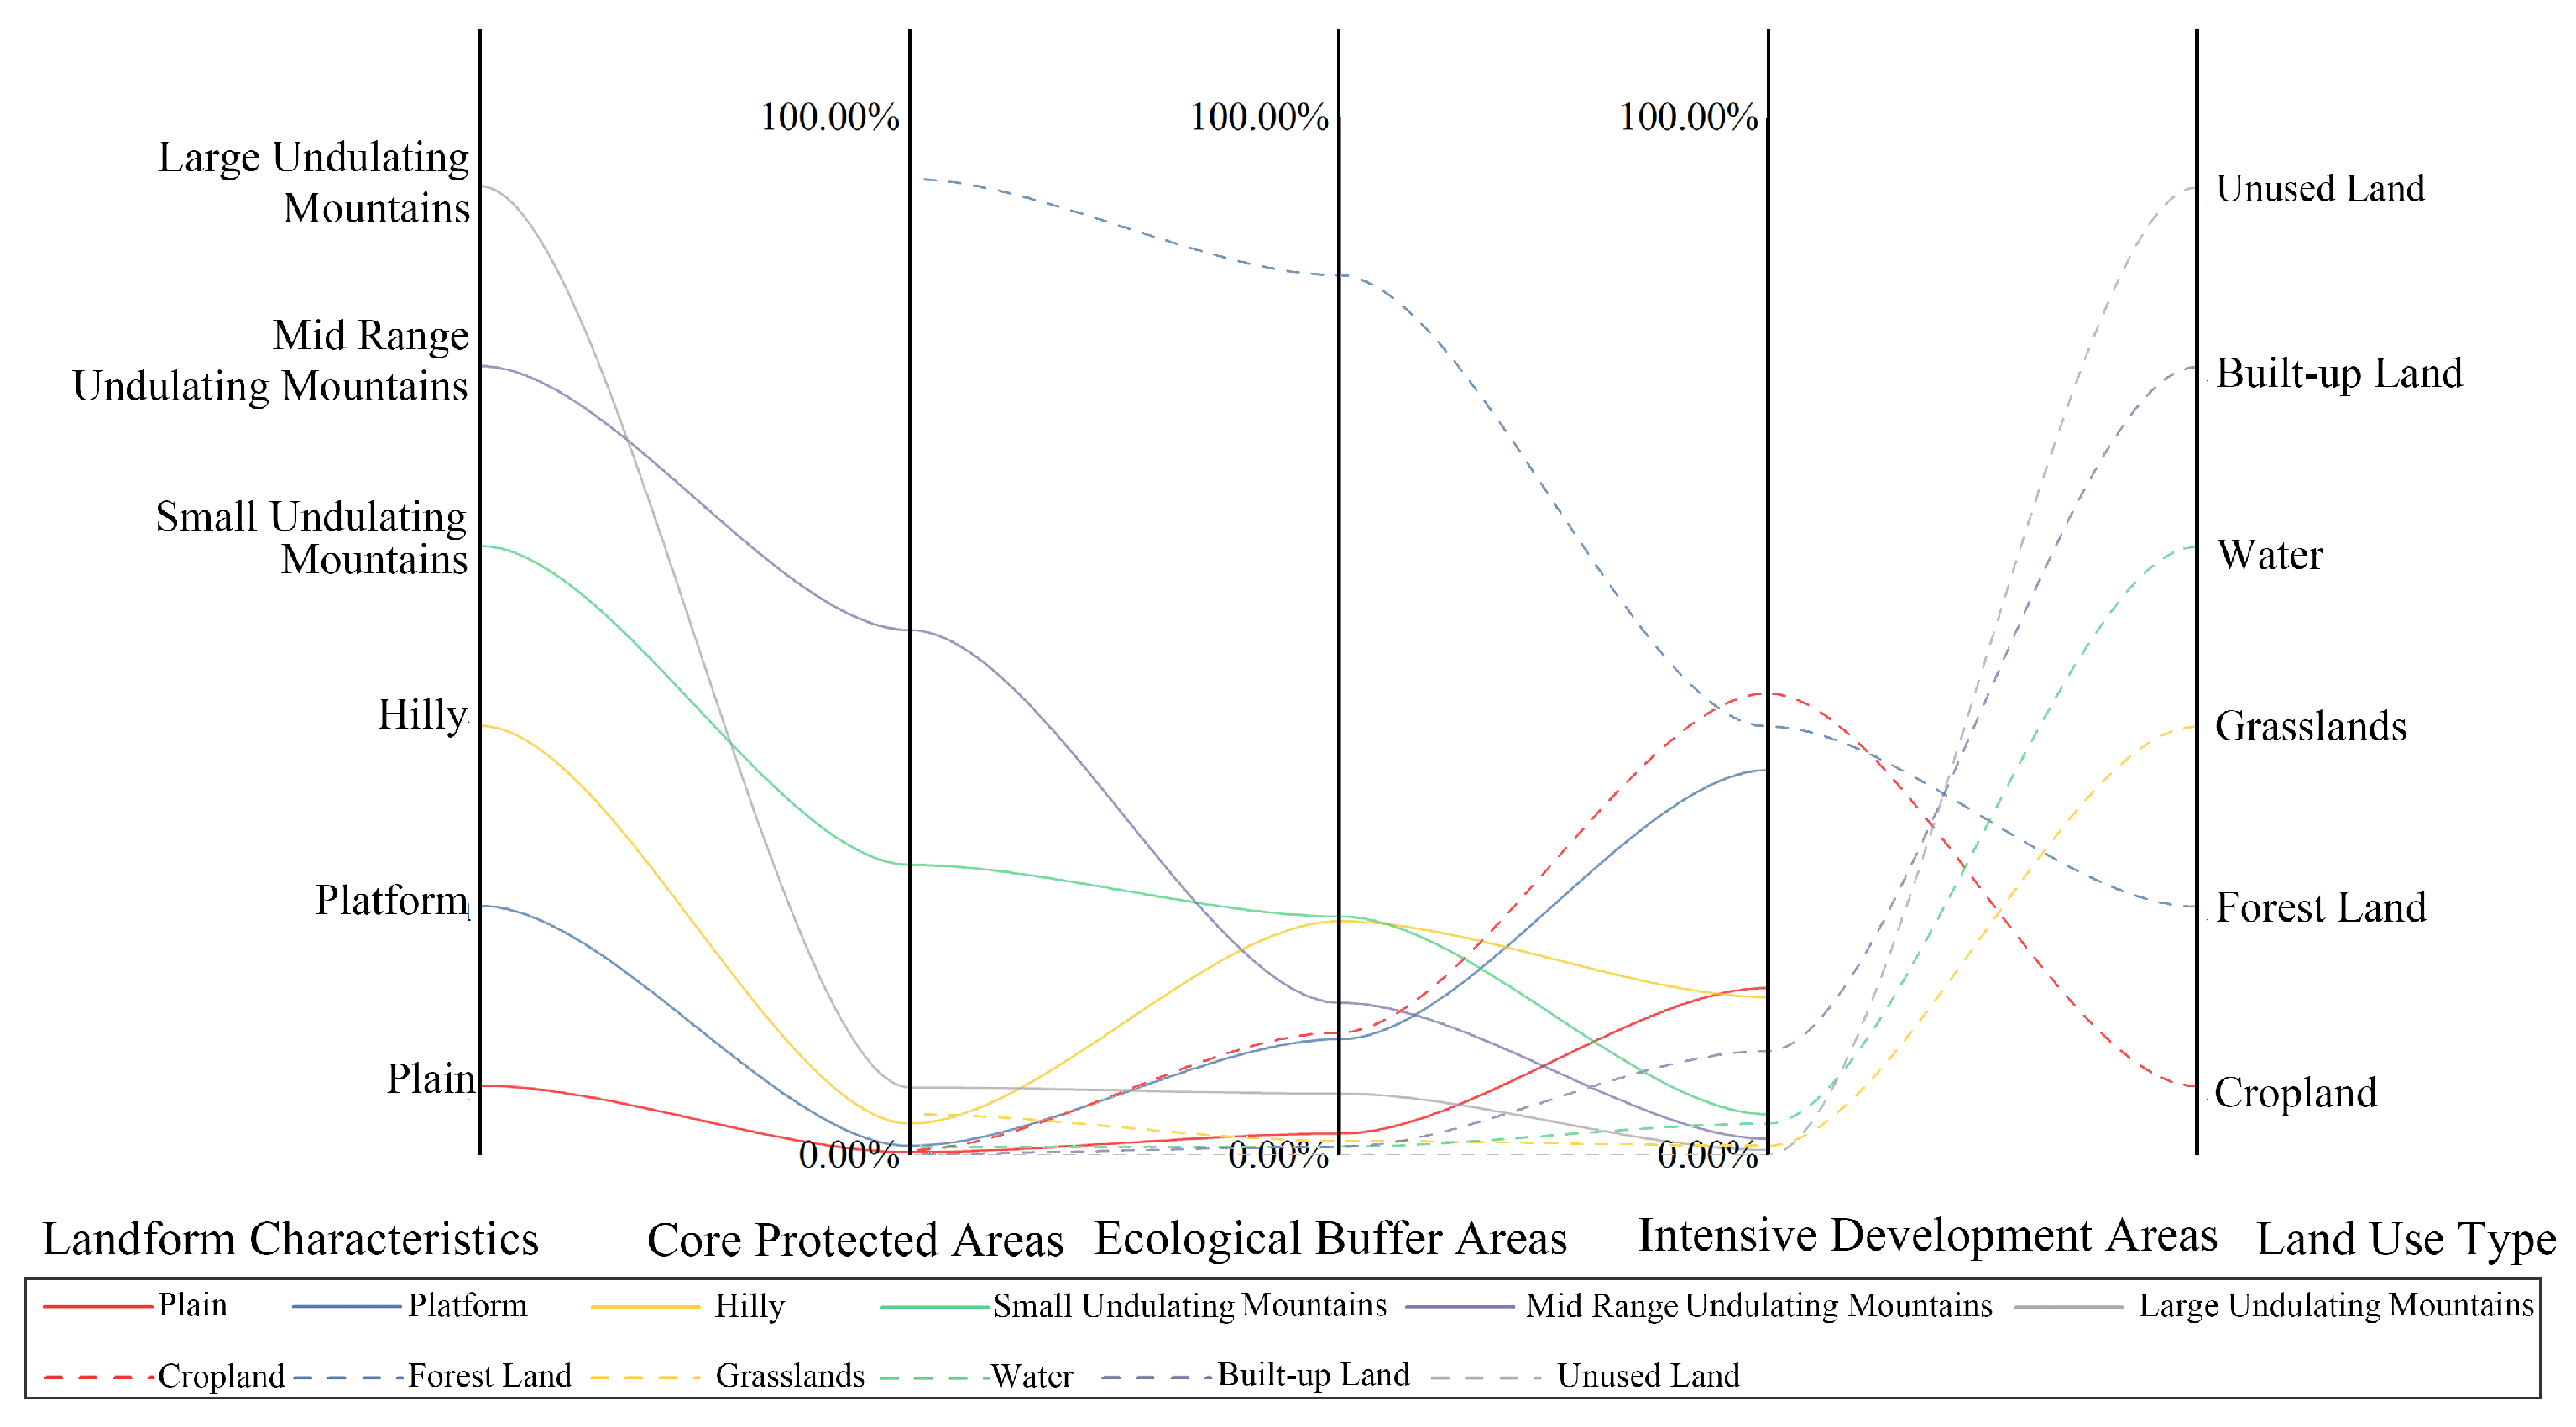
The ecological control zoning results of the study area demonstrate a high degree of synergy with the physical geographical context and land use structure, clearly revealing a spatial gradient pattern of “eastern mountainous ecological core–central hilly ecological buffer–western plateau–plain development zone” (Figure 8). Additionally, Figure 9 illustrates the proportional distribution across different geomorphological types and land use types.
The core protected areas have a total area of 1982.35 km2, accounting for 7.07% of the total area. They are concentrated in the medium- and small-fluctuation mountainous areas in the eastern and southern parts of the study area, constituting 78.52% of the core protected area. Forest land is the dominant land use types, covering 1866.72 km2 and comprising a high proportion of 94.12%, supplemented by small amounts of grassland and water bodies. This area is characterized by pristine, intact ecosystems with low human disturbance. Furthermore, the combination of steep, mountainous terrain and high forest coverage makes it a critical space for water conservation, biodiversity protection, and climate regulation, underscoring its extremely important ecological function.
The ecological buffer areas are altogether 10,212.43 km2, accounting for 36.40% of the total area. They are primarily distributed in transitional landforms such as hills, medium-fluctuation mountains, and platforms, encircling the core protected areas and extending outward. These zones effectively fill the ecological gaps between mountains and plains/platforms, forming large contiguous areas in counties like Chaling, Liuyang, and Ningxiang, and play a key buffering and connecting role. The land use pattern exhibits a “forest–farmland mosaic,”where although forest land remains dominant (84.90%), the proportion of cropland increases significantly (13.56%). The hilly topography provides ample space for ecological buffering, and the interwoven land use pattern reflects a balance between strict protection and sustainable use in this zone, making it crucial for reducing direct human impact on the core areas and maintaining landscape connectivity.
The intensive development areas cover a total area of 14,808.4 km2, representing 56.53% of the total area. Geomorphologically, they are dominated by gentle platforms, plains, and some hilly areas, together accounting for 63.84%. Geographically, central and western counties and districts show the highest proportions, making this zone the main carrier for regional development. Cropland and construction land are the dominant land use types, together accounting for 50.90%. Meanwhile, due to the inclusion of substantial peripheral forest land, forested areas also represent a significant proportion (38.56%). This zone serves as the core area for population aggregation, grain production, and economic development.

5.3.2. Improvement Strategies for Ecological Control Zoning

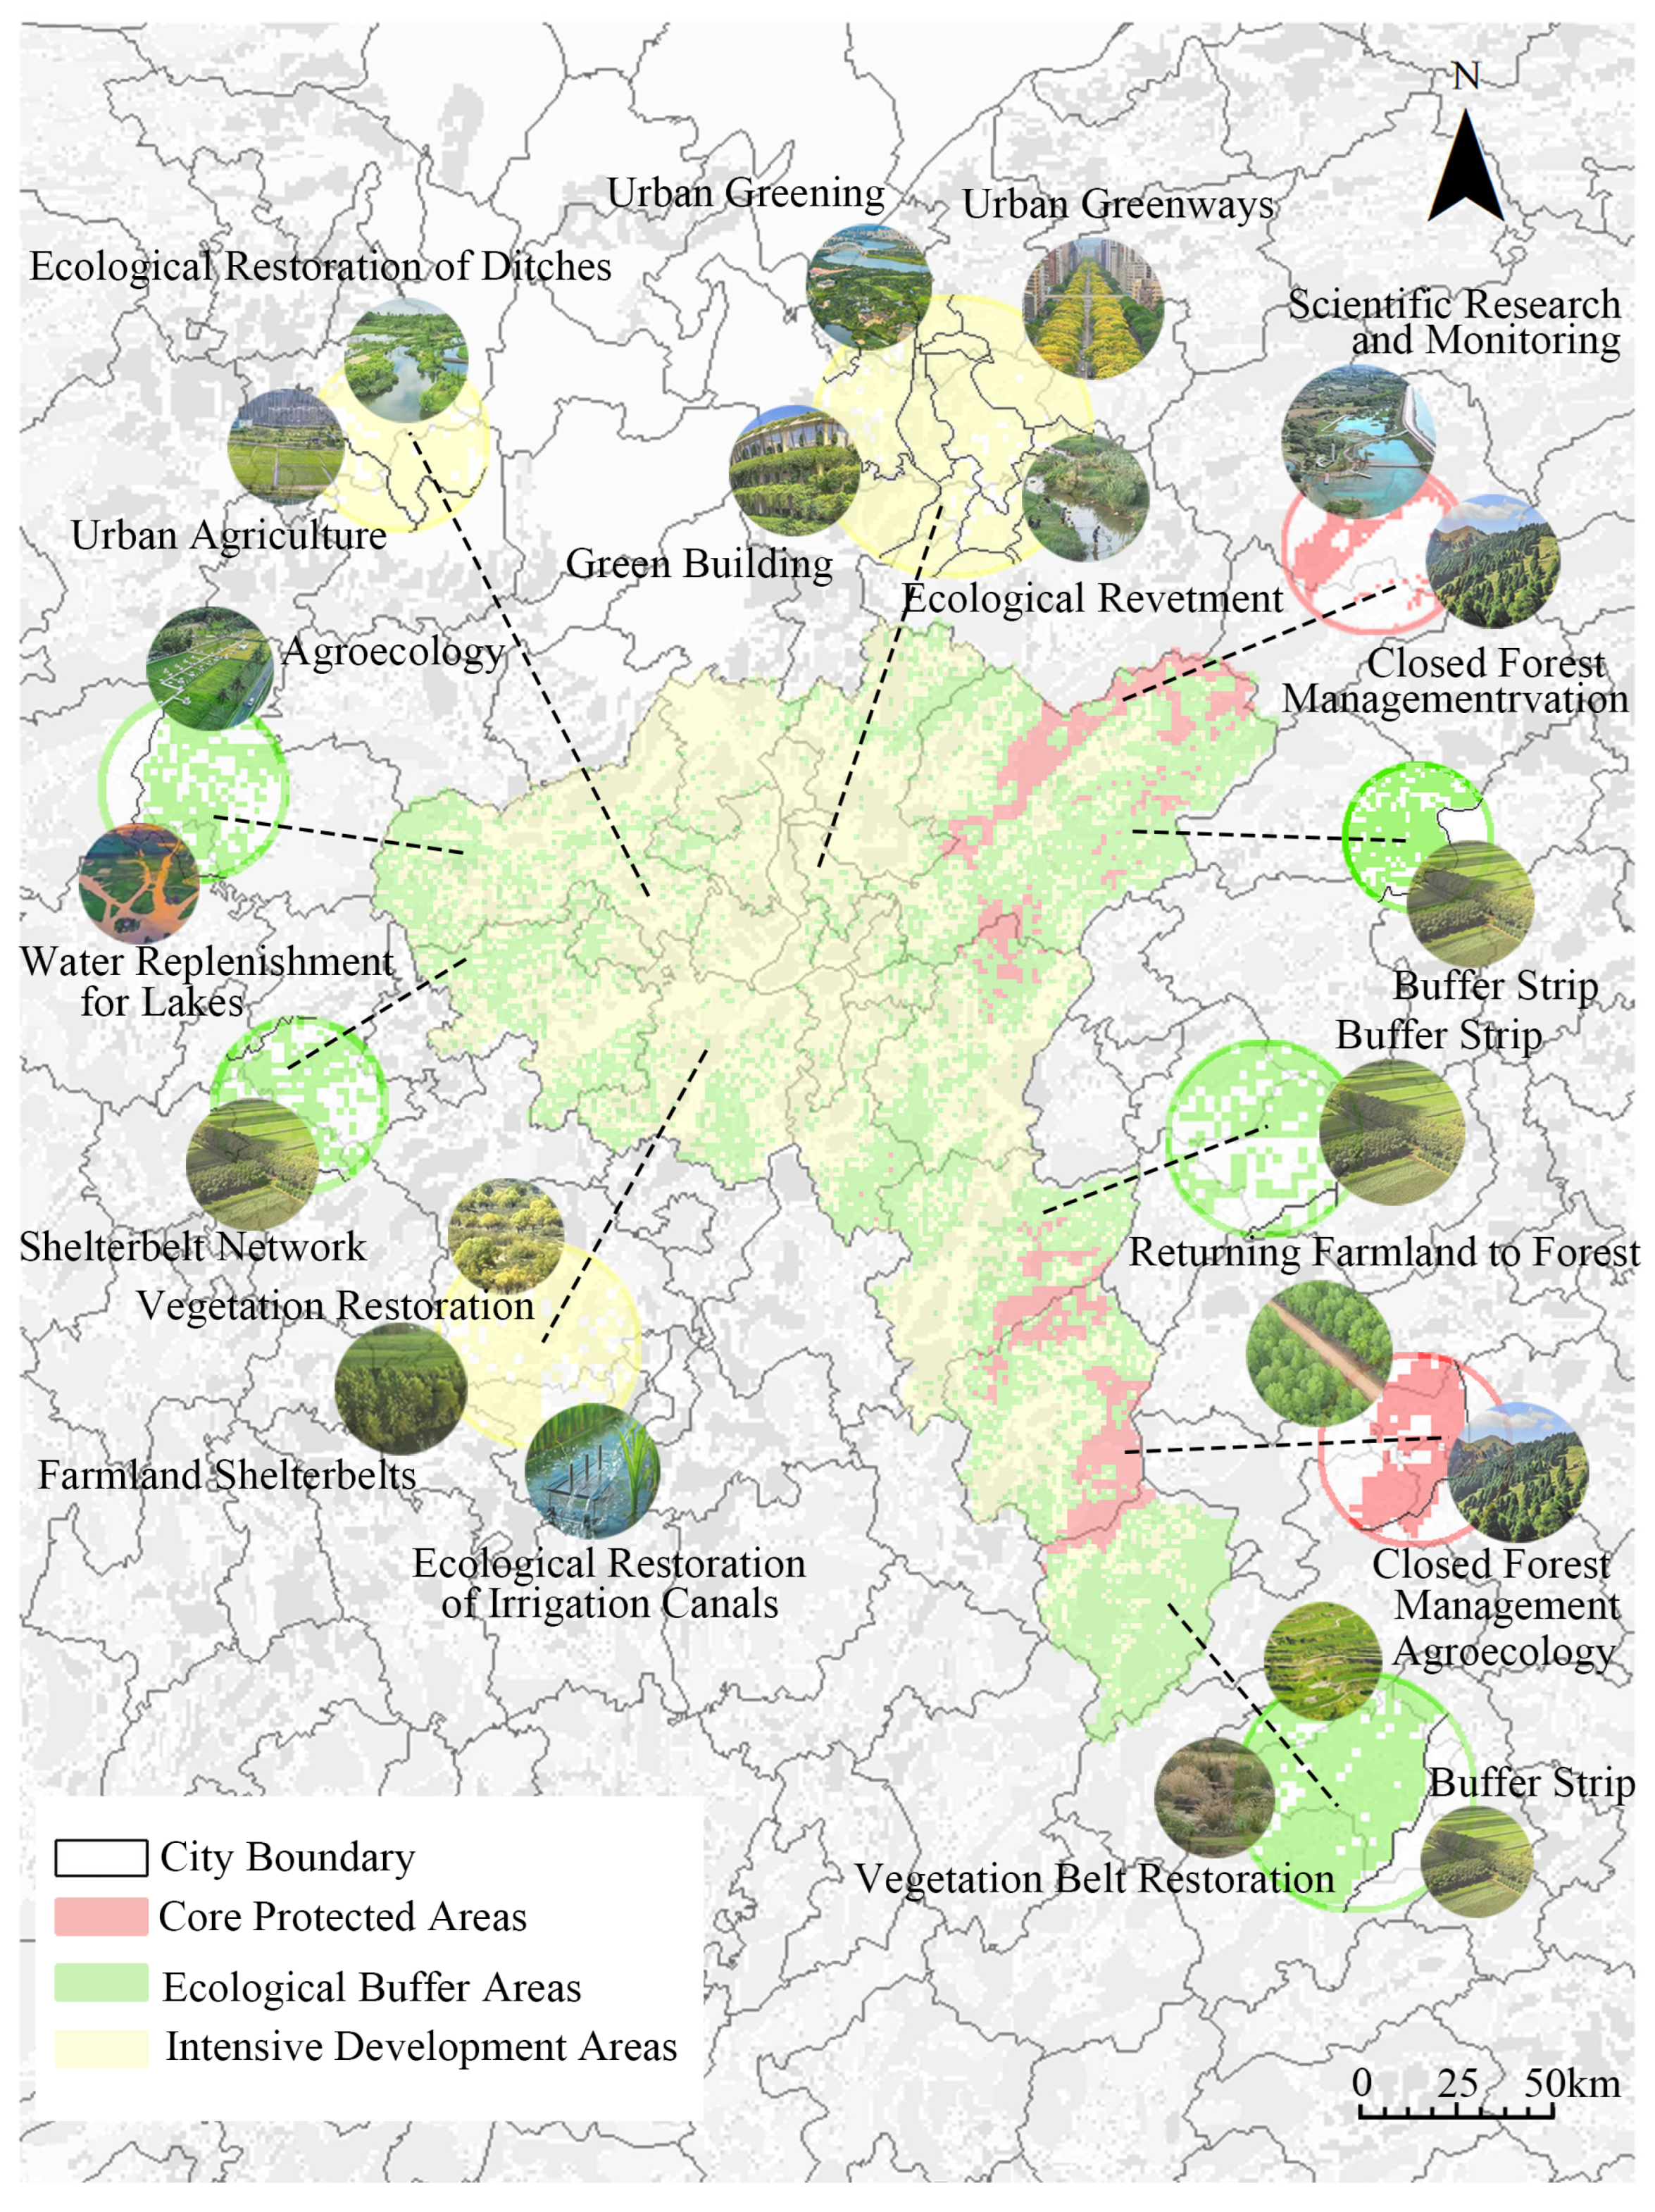
To achieve the effective translation of the ESP from theoretical construction to spatial governance and promote the deep integration of the “Two-oriented Society” construction goals of the CZTUA with the territorial spatial planning system, this study proposes the following differentiated and location-specific ecological space improvement strategies based on the spatial gradient pattern of “eastern mountainous ecological core–central hilly ecological buffer–western tableland plain development hinterland” formed by the ecological control zoning (Figure 10).
The Core Protected Areas aim at ecological conservation, primarily covering the Luoxiao Mountains–Mufu Mountains biodiversity conservation and water conservation ecological protection redline areas designated in the Hunan Provincial Territorial Spatial Plan (2021–2035), including the core zones of medium and small undulating mountains such as Dawei Mountain in eastern Liuyang City, Taoyuandong Nature Reserve in Yanling County, and Jiubu River Scenic Area in You County. Strategically, the control requirements of the Guiding Opinions on Coordinating the Delineation and Implementation of the Three Control Lines in Territorial Spatial Planning and the Interim Measures for Ecological Environment Supervision of Ecological Protection Red Lines must be strictly implemented to ensure “no degradation of ecological function, no reduction in area, and no change in nature.” Focusing on the planning deployment of the Luoxiao Mountains Integrated Protection and Restoration Project for Mountains, Waters, Forests, Farmlands, Lakes, Grasslands, and Sandy Areas, near-natural restoration-oriented projects such as forest tending and degraded forest restoration should be implemented for ecologically fragile patches like sparse forests and degraded grasslands within the area. This aims to construct complex and stable climax plant communities and significantly enhance the dominant ecological functions of the Luoxiao Mountains, such as water conservation and biodiversity maintenance. Regarding supervision, full integration into Hunan Province’s integrated “sky–ground network”ecological environment monitoring network is essential. Utilizing technologies like remote sensing and drones, regular dynamic patrols of the eastern mountainous area should be conducted, and illegal activities such as mining and logging must be strictly cracked down upon, thereby solidifying the ecological security barrier for the CZTUA.
The Ecological Buffer Zones, serving as a key transitional zone connecting the eastern ecological core with the western urban–rural development areas, encompass hilly and platform areas such as central Chaling County, central Liuyang City, and eastern Ningxiang City. This zone is crucial for implementing the Chang-Zhu-Tan Ecological Green Heart Protection Regulations and the Chang-Zhu-Tan Metropolitan Area Ecological Environment Co-protection and Co-governance Implementation Plan. In terms of control, the requirements of the “Three Control Lines and One List” ecological environment zoning control system must be strictly enforced, strictly prohibiting the access of high-pollution and high-energy consumption projects, and efforts should be made to enhance its ecological corridor and buffer functions. It is recommended to carry out the “Ecological Corridor Restoration and Construction Project” at key ecological nodes such as the Weishui River Basin in Ningxiang City and the connection zone between Xiaoxia Mountain and the Xiangjiang River in Xiangtan County. Through models like “Grain for Green” and “forest-farmland exchange,” the east-west ecological connections should be restored and strengthened, effectively mitigating landscape fragmentation. Simultaneously, ecological buffer belts surrounding the core areas should be planned and constructed in key regions such as the border area between Chaling County and Yanling County, as well as from Zhangfang Town to Dayao Town in Liuyang City. By protecting and restoring green infrastructure like wetlands and forests, the region’s capacity for soil and water conservation and non-point source pollution interception can be enhanced. Under the premise of complying with the control requirements for integrated development areas stipulated in the regulations, the development of green industries such as eco-agriculture, forestry, and understory economy can be appropriately guided. For instance, supporting Bojia Town in developing high-quality seedling eco-agriculture and guiding the development of characteristic industries like Ningxiang Weishan ecological tea and understory Chinese medicinal herbs in Xiangtan County can help achieve synergistic benefits between ecological protection and livelihood improvement.
The Intensive Development Zones aim at ecological optimization, primarily covering the main urban areas and key development platforms of Changsha, Zhuzhou, and Xiangtan cities. The core strategy is to implement the construction requirements for a “Beautiful and Clean Metropolitan Area” outlined in the Chang-Zhu-Tan Metropolitan Area Development Plan, deeply integrating ecological concepts into the urbanization and industrialization processes. Strategically, the rigid constraints of urban development boundaries and permanent basic farmland should be strengthened. In core sectors such as the urban stretches along both banks of the Xiangjiang River in Changsha, Tianyuan District in Zhuzhou, and Yuetang District in Xiangtan, stock optimization models focusing on the redevelopment of inefficient industrial land and urban renewal should be vigorously promoted. Drawing on the collaborative governance experience of the Chang-Zhu-Tan Environmental Collaborative Control Plan and the Wuhan Metropolitan Area Ecological Environment Co-protection and Co-governance Three-Year Action Plan, priority should be given to the comprehensive improvement of the water environment and the construction of ecological revetments along the urban sections of the main stream of the Xiangjiang River and the lower reaches of the Liuyang River, ensuring the water ecological security of the “One River and Two Banks”. The ”embedded restoration of ecological functions” should be actively promoted. Within the Intensive Development Areas, and in line with the requirements of the Opinions on Promoting Green Development in Urban and Rural Construction, a systematic effort should be made to construct interconnected urban greenway and blue network systems, embed green isolation belts around industrial parks, and promote green infrastructure technologies such as green roofs, vertical greening, and small wetlands at the community level, establishing community-level ecological nodes. These measures aim to comprehensively enhance the city’s ecosystem service functions like air purification and climate regulation, as well as the quality of the human settlement environment, ultimately achieving the organic unity of high-level protection and high-quality development.

6. Conclusions

  • Using the SSCR framework, the ESP of the CZTUA from 2010 to 2020 was constructed. The study identified 26, 23, and 23 ecological sources with areas of 1113.6 km2, 2791.07 km2, and 3013.96 km2, respectively. These sources showed a decrease in number but an increase in scale, following a “point-to-patch” developmental trend. Meanwhile, 52, 43, and 44 ecological corridors were identified, with total lengths of 1025.69 km, 684.40 km, and 536.25 km, respectively. This indicated a “decrease–increase”trend in quantity, though their total length consistently diminished. Additionally, 14, 10 and 5 ecological nodes were recognized, spanning areas of 290.6 km2, 1559 km2, and 1796.48 km2, respectively. Similar to ecological sources, nodes showed a reduction in number but an increase in scale over the study period.
  • The spatial distribution of the ecological sources in the study area showed notable heterogeneity, with concentrations mainly in the eastern mountainous and hilly regions, while the sources expanded westward. The spatial patterns of ecological corridors and nodes were shaped by ecological sources. The density of ecological corridors changed with ecological sources, forming network-like distributions in dense areas and linear patterns in sparse regions. Similarly, the spatial positioning of ecological nodes shifted with ecological sources, gradually extending towards the western mountainous and hilly areas. The spatial distribution transitioned from the entry/exit areas of the ecological source to ecological corridors.
  • The spatio-temporal evolution of the ESP in the CZTUA was significantly shaped by ecological sources, which was primarily driven by the dual-wheel mechanism of “natural foundation-policy regulation.” Among the natural environmental factors, the key drivers were precipitation and evapotranspiration, manifested through water conservation.
  • This study demonstrated that the ESP of the CZTUA was significantly improved between 2010 and 2020. This structural optimization was driven by the dual mechanism of “natural foundation-policy regulation,” and its experience can serve as a valuable reference for ensuring ecological security in other rapidly urbanizing regions.
  • The ecological control zoning results in the study area exhibit a spatial gradient pattern of “eastern mountainous ecological core–central hilly ecological buffer–western tableland plain development zone”. Differentiated spatial enhancement strategies were proposed accordingly: the core protection areas aim at ecological conservation, the buffer areas focus on ecological coordination, and the intensive development zones prioritize ecological optimization.

Author Contributions

Conceptualization, J.L. and H.J.; methodology, J.L. and H.J.; software, H.J.; validation, H.J. and Y.L.; formal analysis, J.L. and H.J.; investigation, J.L., H.J., Y.L., and W.L.; resources, H.J., Y.X., and S.C.; data curation, H.J.; writing—original draft preparation, H.J. and Y.L.; writing—review and editing, J.L. and H.J.; visualization, H.J.; supervision, H.J., J.L., S.C., and W.L.; project administration, J.L., H.J., H.P., and Y.X.; funding acquisition, J.L. and H.P. All authors have read and agreed to the published version of the manuscript.

Funding

This research was funded by the Research Foundation of Education Bureau of Hunan Province, China, Grant No. 22B0575, National Natural Science Foundation of China, Grant No. 52470034, and Undergraduate Innovation and Entrepreneurship Training Program of China, Grant No. S202411535008.

Institutional Review Board Statement

Not applicable.

Informed Consent Statement

Informed consent was obtained from all subjects involved in the study.

Data Availability Statement

The data supporting the findings of this study were obtained from publicly available datasets, and the websites providing access to these datasets are included in the article.

Conflicts of Interest

The authors declare no conflicts of interest.

References

  1. Nazari, B.; Keshavarz, M. Water population density: Global and regional analysis. Theor. Appl. Climatol. 2023, 153, 431–445. [Google Scholar] [CrossRef]
  2. Chen, X.; Yang, Z.; Wang, T.; Han, F. Landscape Ecological Risk and Ecological Security Pattern Construction in World Natural Heritage Sites: A Case Study of Bayinbuluke, Xinjiang, China. ISPRS Int. J. Geo-Inf. 2022, 11, 328. [Google Scholar] [CrossRef]
  3. Fang, C.; Yu, D. Urban agglomeration: An evolving concept of an emerging phenomenon. Landsc. Urban Plan. 2017, 162, 126–136. [Google Scholar] [CrossRef]
  4. Liu, Y.; Lu, Y.; Xu, D.; Zhou, H.; Zhang, S. Enhancing the MSPA Method to Incorporate Ecological Sensitivity: Construction of Ecological Security Patterns in Harbin City. Sustainability 2024, 16, 2875. [Google Scholar] [CrossRef]
  5. Cao, W.; Li, X.; Lyu, X.; Dang, D.; Wang, K.; Li, M.; Liu, S. To explore the effectiveness of various ecological security pattern construction methods in many growth situations in the future: A case study of the West Liaohe River Basin in Inner Mongolia. Sci. Total Environ. 2024, 948, 174607. [Google Scholar] [CrossRef] [PubMed]
  6. Cao, C.; Luo, Y.; Xu, L.; Xi, Y.; Zhou, Y.C. Construction of ecological security pattern based onInVEST-Conefor-MCRM: A case study of Xinjiang, China. Ecol. Indic. 2024, 159, 111647. [Google Scholar] [CrossRef]
  7. Chen, W.; Zhao, J.; Chen, G.; Lin, Y.; Yang, H.; Chen, Q. Ecological Network Optimization andSecurity Pattern Development for Kunming’s Main Urban Area Using the MSPA-MCR Mode. Sustainability 2025, 17, 3623. [Google Scholar] [CrossRef]
  8. Zhang, R.; Hu, M.; Sheng, A.; Deng, W.; Zhang, S.; Liu, J. Construction of Ecological Security Network in Mountainous Transitional Geospace Using Circuit Theory and Morphological Spatial Pattern Analysis: A Case Study of Taihang Mountain Area. Sustainability 2025, 17, 1743. [Google Scholar] [CrossRef]
  9. Yan, M.; Duan, J.; Li, Y.; Yu, Y.; Wang, Y.; Zhang, J.; Qiu, Y. Construction of the Ecological Security Pattern in Xishuangbanna Tropical Rainforest Based on Circuit Theory. Sustainability 2024, 16, 3290. [Google Scholar] [CrossRef]
  10. Jin, X.; Wei, L.; Wang, Y.; Lu, Y. Construction of ecological security pattern based on the importance of ecosystem service functions and ecological sensitivity assessment: A case study in Fengxian County of Jiangsu Province, China. Environ. Dev. Sustain. 2021, 23, 563–590. [Google Scholar] [CrossRef]
  11. Wang, X.; Tang, X.; Shi, J.; Du, P. Construction and Optimization of Urban and Rural Ecological Security Patterns Based on Ecological Service Importance in a Semi-Arid Region: A Case Study of Lanzhou City. Sustainability 2024, 16, 6177. [Google Scholar] [CrossRef]
  12. Zhang, W.; Fan, Y.; Wang, B. Ecological Network Construction Based on Ecosystem Services and Landscape Pattern Indices in the Tabu River Basin. Land 2024, 13, 2209. [Google Scholar] [CrossRef]
  13. Li, Z.; Liu, J.; Ma, R.; Xie, W.; Zhao, X.; Wang, Z.; Zhang, B.; Yin, L. Construction of Ecological Security Pattern Based on Ecosystem Services, Sensitivity, Connectivity, and Resistance—A Case Study in the Huang-Huai-Hai Plain. Land 2024, 13, 2243. [Google Scholar] [CrossRef]
  14. Zhang, Q.; Sun, Y.; Tang, D.; Cheng, H.; Tu, Y. Construction and Zoning of Ecological Security Patterns in Yichang City. Sustainability 2025, 17, 2354. [Google Scholar] [CrossRef]
  15. Xu, A.; Hu, M.; Shi, J.; Bai, Q.; Li, X. Construction and optimization of ecological network in inland river basin based on circuit theory, complex network and ecological sensitivity: A case study of Gansu section of Heihe River Basin. Ecol. Model. 2024, 488, 110578. [Google Scholar] [CrossRef]
  16. Wu, T.; Lu, S.; Ding, Y. Ecological Security Evaluation System Integrated with Circuit Theory for Regional Ecological Security Pattern Construction: A Coordinated Study of Chang-Zhu-Tan Metropolitan Area in China. Land 2025, 14, 257. [Google Scholar] [CrossRef]
  17. Jia, D.; Qiu, W.; Guo, R.; Wu, M.; Wang, Z.; Hu, X. Prioritizing Protection and Restoration Areas Based on Ecological Security Pattern with Different Resistance Assignments. Land 2024, 14, 349. [Google Scholar] [CrossRef]
  18. Li, X.; Tao, H.; Wang, J.; Zhang, B.; Liu, Z.; Liu, Z.; Li, J. Integrated Evaluation of the Ecological Security Pattern in Central Beijing Using InVEST, MSPA, and Multifactor Indices. Land 2025, 14, 205. [Google Scholar] [CrossRef]
  19. Jiang, H.; Peng, J.; Liu, M.; Dong, J.; Ma, C. Integrating patch stability and network connectivity to optimize ecological security pattern. Landsc. Ecol. 2024, 39, 54. [Google Scholar] [CrossRef]
  20. Zhao, X.; Yue, Q.; Pei, J.; Pu, J.; Huang, P.; Wang, Q. Ecological Security Pattern Construction in Karst Area Based on Ant Algorithm. Int. J. Environ. Res. Public Health 2021, 18, 6863. [Google Scholar] [CrossRef]
  21. Belote, R.T.; Dietz, M.S.; McRae, B.H.; Theobald, D.M.; McClure, M.L.; Irwin, G.H.; McKinley, P.S.; Gage, J.A.; Aplet, G.H. Identifying Corridors among Large Protected Areas in the United States. PLoS ONE 2016, 11, e0154223. [Google Scholar] [CrossRef]
  22. Dickson, B.G.; Albano, C.M.; Anantharaman, R.; Beier, P.; Fargione, J.; Graves, T.A.; Gray, M.E.; Hall, K.R.; Lawler, J.J.; Leonard, P.B.; et al. Circuit-theory applications to connectivity science and conservation. Conserv. Biol. 2019, 33, 239–249. [Google Scholar] [CrossRef]
  23. Wang, C.; Yu, C.; Chen, T.; Feng, Z.; Hu, Y.; Wu, K. Can the establishment of ecological security patterns improve ecological protection? An example of Nanchang, China. Sci. Total Environ. 2020, 740, 140051. [Google Scholar] [CrossRef] [PubMed]
  24. Guo, R.; Wu, T.; Liu, M.; Huang, M.; Stendardo, L.; Zhang, Y. The Construction and Optimization of Ecological Security Pattern in the Harbin-Changchun Urban Agglomeration, China. Int. J. Environ. Res. Public Health 2019, 16, 1190. [Google Scholar] [CrossRef]
  25. Huang, Q.; Peng, B.; Elahi, E.; Wan, A. Evolution and driving mechanism of ecological security pattern: A case study of Yangtze River urban agglomeration. Integr. Environ. Assess. Manag. 2020, 17, 573–583. [Google Scholar] [CrossRef] [PubMed]
  26. Li, J.; Hu, D.; Wang, Y.; Chu, J.; Yin, H.; Ma, M. Study of identification and simulation of ecological zoning through integration of landscape ecological risk and ecosystem service value. Sustain. Cities Soc. 2024, 107, 105442. [Google Scholar] [CrossRef]
  27. Hu, Y.; Gong, J.; Li, X.; Song, L.; Zhang, Z.; Zhang, S.; Zhang, W.; Dong, J.; Dong, X. Ecological security assessment and ecological management zoning based on ecosystem services in the West Liao River Basin. Ecol. Eng. 2023, 192, 106973. [Google Scholar] [CrossRef]
  28. Guo, Z.; Hu, Y.; Bai, Y. How to achieve ecological control zoning based on ecological security pattern (ESP)? A case study of China’s coastal areas. Environ. Earth Sci. 2024, 83, 57. [Google Scholar] [CrossRef]
  29. Gao, H.; Liu, T.; Zhang, Y.; Zhang, P.; Zhang, X. FunctionZones and Hierarchical Protection of Qingshan Lake Provincial Scenic and Historic Area in Baishan City Based on Territorial Spatial Planning. Jilin For. Sci. Technol. 2025, 54, 25–28. [Google Scholar]
  30. Lei, J.; Yin, W.; Zhu, D. Research on ecological function regionalization based on the ecological service function-take Shenzhen River and Xinzhou River Estuarine Wetland for example. Adv. Mater. Res. 2015, 1073, 1171–1177. [Google Scholar] [CrossRef]
  31. Wu, X.; Deng, W.; Gao, X.; Zhao, Y. Research of control strategies about water ecology space based on national spatial planning: A case study of Chaohe River. Water Resour. Dev. Res. 2023, 23, 14–20. [Google Scholar]
  32. Wang, X.; Wen, D.; Liu, P.; Wei, C.; Zhao, P.; Xu, N. Maintaining ecological connectivity in highly urbanized areas: Optimal strategy, key patches and protection policy. Ecol. Indic. 2024, 164, 112152. [Google Scholar] [CrossRef]
  33. Zhang, W.; Jiang, Z.; Dai, H.; Lin, G.; Liu, K.; Yan, R.; Zhu, Y. Modelling Multi-Scenario Ecological Network Patterns and Dynamic Spatial Conservation Priorities in Mining Areas. Land 2024, 13, 1065. [Google Scholar] [CrossRef]
  34. Zhao, H.; Gu, B.; Zhang, Q.; Chen, Y. How Can the Balance of Green Infrastructure Supply and Demand Build an Ecological Security Pattern. Ecosyst. Health Sustain. 2024, 10, 0179. [Google Scholar] [CrossRef]
  35. Lacher, I.; Akre, T.; Mcshea, W.; Fergus, C. Spatial and temporal patterns of public and private land protection within the Blue Ridge and Piedmont ecoregions of the eastern US. Landsc. Urban Plan. 2019, 186, 91–102. [Google Scholar] [CrossRef]
  36. An, L.; Liu, G.; Hou, M. The Application of Geographic Information System in Urban Forest Ecological Compensation and Sustainable Development Evaluation. Forests 2024, 15, 285. [Google Scholar] [CrossRef]
  37. He, Y.; Lin, Y.; Zhou, G.; Zhu, Y.; Tang, K. Spatial pattern and drivers of urbanization in China’s mid-level developing urban agglomeration: A case study of Chang-Zhu-Tan. Reg. Sustain. 2021, 2, 83–97. [Google Scholar] [CrossRef]
  38. Zhu, Z.; He, Q. Spatio-temporal evaluation of the urban agglomeration expansion in the middle reaches of the Yangtze River and its impact on ecological lands. Sci. Total Environ. 2021, 790, 148150. [Google Scholar]
  39. Fang, Z.; Ding, T.; Chen, J.; Xue, S.; Zhou, Q.; Wang, Y.; Wang, Y.; Huang, Z.; Yang, S. Impacts of land use/land cover changes on ecosystem services in ecologically fragile regions. Sci. Total Environ. 2022, 831, 154967. [Google Scholar] [CrossRef]
  40. Li, W.; Geng, J.; Bao, J.; Lin, W.; Wu, Z.; Fan, S. Analysis of Spatial and Temporal Variations in Ecosystem Service Functions and Drivers in Anxi County Based on the InVEST Model. Sustainability 2023, 15, 10153. [Google Scholar] [CrossRef]
  41. Cong, W.; Sun, X.; Guo, H.; Shan, R. Comparison of the SWAT and InVEST models to determine hydrological ecosystem service spatial patterns, priorities and trade-offs in a complex basin. Ecol. Indic. 2020, 112, 106089. [Google Scholar] [CrossRef]
  42. Li, Z.; Xu, J.; Yuan, Z.; Wang, L. Integrated Ecological Security Assessment: Coupling Risk, Health, and Ecosystem Services in Headwater Regions—A Case Study of the Yangtze and Yellow River Source. Water 2025, 17, 2834. [Google Scholar] [CrossRef]
  43. Yuan, Q.; Li, R. The negative impacts of human activities on the ecological corridor in the karst highly urbanized area are gradually diminishing: A case study from the karst mountain cities in Southwest China. Ecol. Indic. 2023, 157, 111257. [Google Scholar] [CrossRef]
  44. Liu, X.; Su, Y.; Li, Z.; Zhang, S. Constructing ecological security patterns based on ecosystem services trade-offs and ecological sensitivity: A case study of Shenzhen metropolitan area, China. Ecol. Indic. 2023, 154, 110626. [Google Scholar] [CrossRef]
  45. Gu, T.; Tong, Y.; Wang, S.; You, Z.; Li, D.; Jiang, Y.; Rafaqat, A.; Wang, C.; Zhang, Q. Identifying the priority areas for ecological protection considering ecological connectivity and ecosystem integrity: A case study of Xianyang City, China. Ecol. Indic. 2024, 163, 112102. [Google Scholar] [CrossRef]
  46. Li, H.; Zhang, T.; Cao, X.; Zhang, Q. Establishing and Optimizing the Ecological Security Pattern in Shaanxi Province (China) for Ecological Restoration of Land Space. Forests 2022, 13, 766. [Google Scholar] [CrossRef]
  47. Wang, F.; Yuan, X.; Zhou, L.; Zhang, M. Integrating ecosystem services and landscape connectivity to construct and optimize ecological security patterns: A case study in the central urban area Chongqing municipality, China. Environ. Sci. Pollut. Res. 2022, 29, 43138–43154. [Google Scholar] [CrossRef]
  48. Vogt, P.; Ferrari, J.R.; Lookingbill, T.R.; Gardner, R.H.; Riitters, K.H.; Ostapowicz, K. Mapping functional connectivity. Ecol. Indic. 2009, 9, 64–71. [Google Scholar] [CrossRef]
  49. Zhang, H.; Li, J.; Tian, P.; Pu, R.; Cao, L. Designing Ecological Security Patterns Based on the Framework of Ecological Quality and Ecologica. J. Geogr. Sci. 2022, 32, 663–681. [Google Scholar] [CrossRef]
  50. Haddad, N.M.; Brudvig, L.A.; Clobert, J.; Davies, K.F.; Gonzalez, A.; Holt, R.D.; Lovejoy, T.E.; Sexton, J.O.; Austin, M.P.; Collins, C.D.; et al. Habitat fragmentation and its lasting impact on Earth’s ecosystems. Int. J. Environ. Res. Public Health 2015, 1, e150052. [Google Scholar] [CrossRef] [PubMed]
  51. Collins Cathy, D.; Holt Robert, D.; Foster Bryan, L. Patch size effects on plant species decline in an experimentally fragmented landscape. Ecology 2009, 90, 2577–2588. [Google Scholar] [CrossRef]
  52. Huang, L.; Xiang, F.; Chen, R. Identification of key areas for ecological protection and restoration of county territorial space based on ecological security pattern: A case study in Yihuang County of Fuzhou City. J. Environ. Eng. Technol. 2023, 13, 1334–1344. [Google Scholar]
  53. Zhang, F.; Jia, Y.; Liu, X.; Li, T.; Gao, Q. Application of MSPA-MCR models to construct ecological security pattern in the basin: A case study of Dawen River basin. Ecol. Indic. 2024, 160, 111887. [Google Scholar] [CrossRef]
  54. Ye, Y.; Su, Y.; Zhang, H.o.; Liu, K.; Wu, Q. Construction of an ecological resistance surface model and its application in urban expansion simulations. J. Geogr. Sci. 2015, 25, 211–224. [Google Scholar] [CrossRef]
  55. Lin, J.; Yang, W.; Yu, K.; Geng, J.; Liu, J. Identification and Construction of Ecological Nodes in the Fuzhou Ecological Corridors. Forests 2022, 13, 1837. [Google Scholar] [CrossRef]
  56. Yu, H.; Gu, X.; Liu, G.; Fan, X.; Zhao, Q.; Zhang, Q. Construction of Regional Ecological Security Patterns Based on Multi-Criteria Decision Making and Circuit Theory. Remote Sens. 2022, 14, 527. [Google Scholar] [CrossRef]
  57. Tang, L.; Liang, G.; Gu, G.; Xu, J.; Duan, L.; Zhang, X.; Yang, X.; Lu, R. Study on the spatial-temporal evolution characteristics, patterns, and driving mechanisms of ecological environment of the Ecological Security Barriers on China’s Land Borders. Environ. Impact Assess. Rev. 2023, 103, 107267. [Google Scholar] [CrossRef]
  58. Huang, X.; Peng, S.Y.; Wang, Z.; Huang, B.M.; Liu, J. Spatial heterogeneity and driving factors of ecosystem water yield service in Yunnan Province, China based on Geodetector. J. Appl. Ecol. 2022, 33, 2813–2821. [Google Scholar]
  59. Xiao, S.; Wu, W.; Guo, J.; Ou, M.; Pueppke, S.G.; Ou, W.; Tao, Y. An evaluation framework for designing ecological security patterns and prioritizing ecological corridors: Application in Jiangsu Province, China. Landsc. Ecol. 2020, 35, 2517–2534. [Google Scholar] [CrossRef]
  60. Zhang, S.; Chen, Y.; Li, J.; Ye, Q.; Chen, W.; Wang, X.; Wei, H.; Jiang, Q.; Guo, L. A spatiotemporal analysis framework of the ecological security pattern based on the ecological “source–surface–corridor” and its implications. Front. Ecol. Evol. 2024, 12, 1480198. [Google Scholar] [CrossRef]
  61. Yang, Y.; Chen, J.; Huang, R.; Feng, Z.; Zhou, G.; You, H.; Han, X. Construction of Ecological Security Pattern Based on the Importance of Ecological Protection—A Case Study of Guangxi, a Karst Region in China. Int. J. Environ. Res. Public Health 2022, 19, 5699. [Google Scholar] [CrossRef]
  62. McRae, B.H.; Dickson, B.G.; Keitt, T.H.; Shah, V.B. Using circuit theory to model connectivity in ecology, evolution, and conservation. Ecology 2008, 89, 2712–2724. [Google Scholar] [CrossRef]
  63. Li, K.; Qian, H.; Li, S.; Cao, Z.; Tian, P.; Shi, X.; Chen, J.; Gao, Y. Quantifying the Driving Forces of Water Conservation Using Geodetector with Optimized Parameters: A Case Study of the Yiluo River Basin. Land 2025, 14, 274. [Google Scholar] [CrossRef]
  64. Zhao, G.; Tian, S.; Liang, S.; Jing, Y.; Chen, R.; Wang, W.; Han, B. Dynamic evolution trend and driving mechanisms of water conservation in the Yellow River Basin, China. Sci. Rep. 2024, 14, 26304. [Google Scholar] [CrossRef] [PubMed]
  65. Zhang, J.; Qu, J.; Chen, H.; Shi, J.; Ma, Y.; Liu, D. Spatial and temporal evolution and influencing factors of ecological security pattern based on circuit theory: A case of Loess Plateau in northern Shaanxi. Arid Land Geogr. 2025, 48, 494. [Google Scholar]
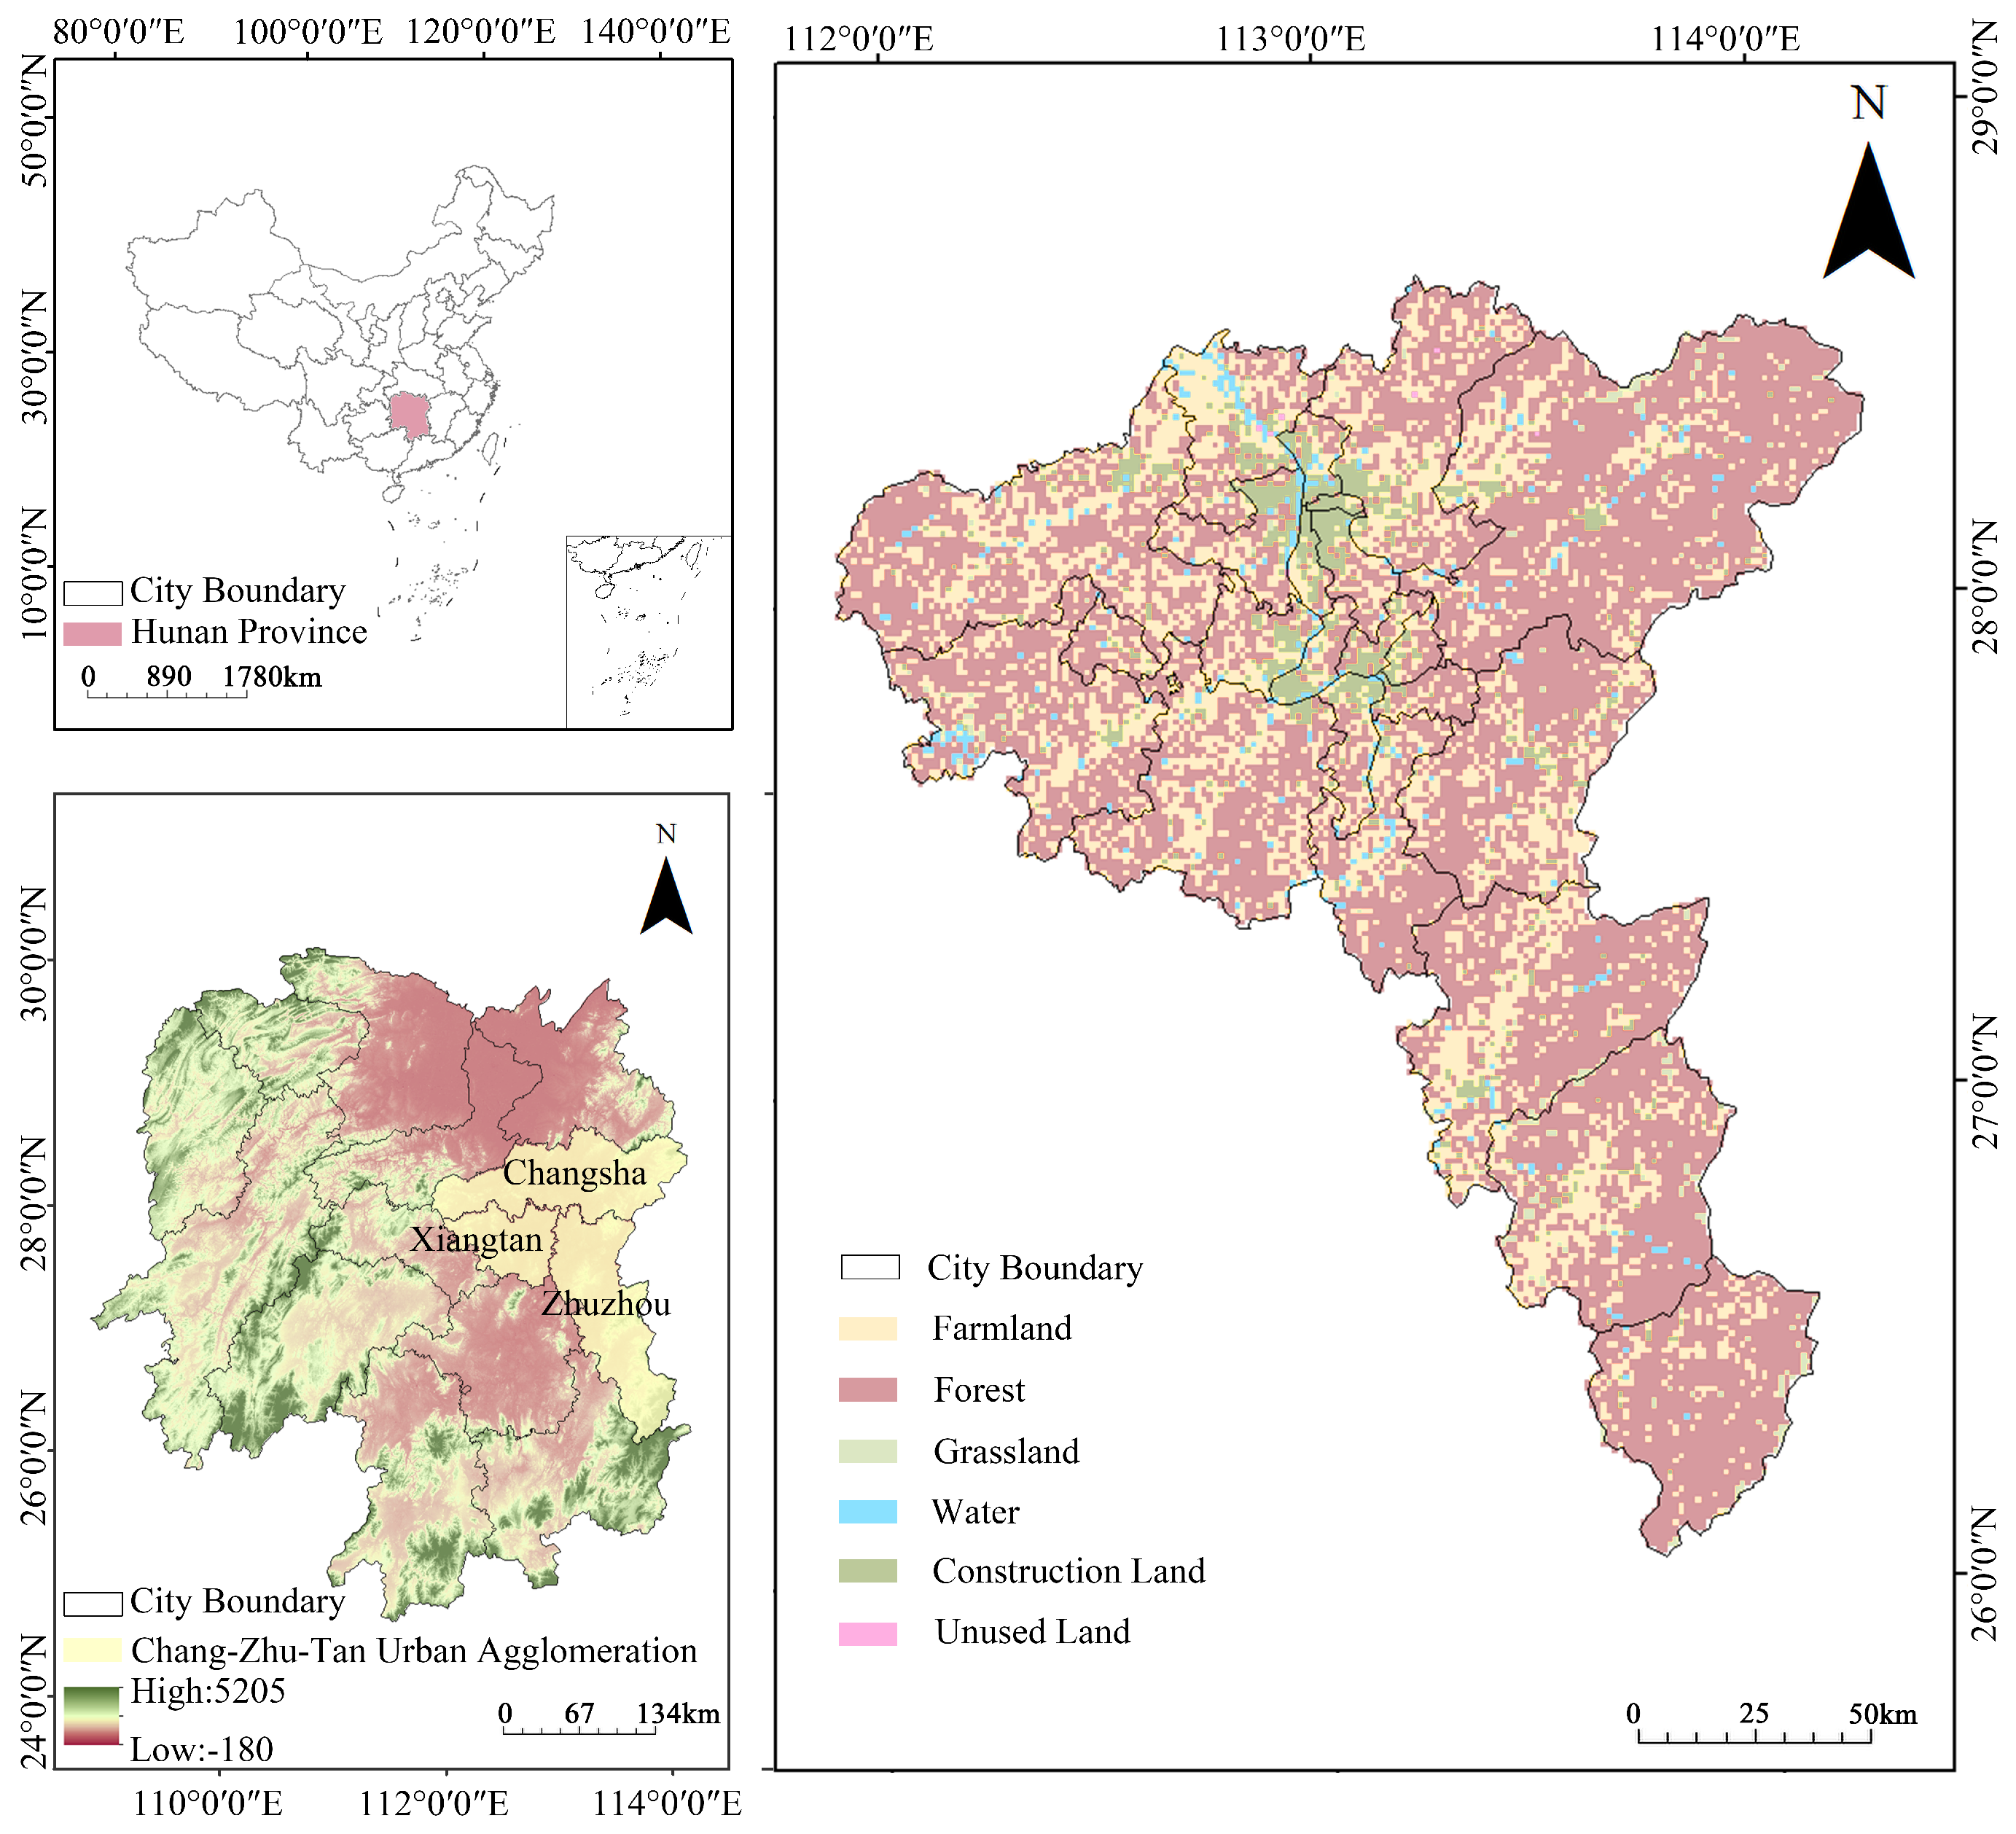
Figure 1. Geographic location and land use types of the study area.
Sustainability 17 10444 g001
Figure 2. Technical framework of the study. DEM: Digital Elevation Model, FVC: Fraction of Vegetation Cover, MSPA: Morphological Spatial Pattern Analysis, NDVI: Normalized Difference Vegetation Index, GDP: Gross Domestic Product, MCR: Minimum Cumulative Resistance, ESP: Ecological Security Patterns, GD: GeoDetector.
Sustainability 17 10444 g002
Figure 3. Ecosystem services classification. (a,e,i) Water Conservation. (b,f,j) Soil Conservation. (c,g,k) Habitat Quality. (d,h,l) Carbon Storage.
Sustainability 17 10444 g003
Figure 4. The evaluation of SSCR. (a,e,i) Ecosystem Importance. (b,f,j) Ecological Sensitivity. (c,g,k) Landscape Connectivity. (d,h,l) Resistance Surface.
Sustainability 17 10444 g004
Figure 5. Ecosystem importance, Ecological Sources, and ESP. (a,d,g) Ecosystem Importance. (b,e,h) Ecological Sources. (c,f,i) ESP.
Sustainability 17 10444 g005
Figure 6. Factor detector results for the GD model. (a) 2010. (b) 2015. (c) 2020.
Sustainability 17 10444 g006
Figure 7. Interaction detector results for the GD model. (a) 2010. (b) 2015. (c) 2020.
Sustainability 17 10444 g007
Figure 8. Ecological control zones of CZTUA. (a) Core Protected Areas. (b) Ecological Buffer Areas. (c) Intensive Development Areas.
Sustainability 17 10444 g008
Figure 9. The proportional distribution across different geomorphological types and land use types.
Sustainability 17 10444 g009
Figure 10. Improvement Strategies.
Sustainability 17 10444 g010
Table 1. Data information and sources.
Data TypeResolutionData SourcesAccess Time
Land use data1 kmResource and Environmental Science Data Platform (resdc.cn) https://www.resdc.cnAccessed on 15 July 2024
Annual precipitation data1 kmNational Earth System Science Data Center (geodata.cn) https://www.geodata.cnAccessed on 29 July 2024
Monthly potential evapotranspiration data1 kmNational Earth System Science Data Center (geodata.cn) https://www.geodata.cnAccessed on 28 July 2024
DEM30 mGeospatial Data Cloud (gscloud.cn) https://www.gscloud.cnAccessed on 22 July 2024
Population Density1 kmEarth Resources Data Cloud (gis5g.com) http://www.gis5g.com/data/rksj?id=1562Accessed on 27 July 2024
NDVI1 kmEarth Resources Data Cloud (gis5g.com)Accessed on 26 July 2024
Nighttime Light Intensity1 kmEarth Resources Data Cloud (gis5g.com) http://www.gis5g.com/data/dgsjAccessed on 26 July 2024
Spatial distribution of landform types across the country1 kmData Box (database-store.com) https://www.databox.store/DownLoad/Details/24Accessed on 3 January 2025
Table 2. Indicators of ecosystem services.
TypesFormula
Water Conservation (WC) W i = Y i R i , Y i = P i E T i , R i = min ( X i P i , Y i )
where W i is the WC of the grid j, Y i is the annual water yield, R i is the surface runoff, P i is the average annual precipitation, and E T i is the average annual potential evapotranspiration.
Soil Conservation (SC) S C = R K L S U A E = R × K × L S ( 1 C P )
where SC is the soil conservation, R is the rainfall erosivity factor, K is the soil erosion factor, L S is slope length and slope factor, C is the plant cover factor, and P is soil and water conservation factor.
Habitat Quality (HQ) C x j = C a + C b + C s + C d
where C x j is the annual CS capacity of the land grid x of type j, C a , C b , C s , and  C d are soil organic carbon, aboveground organic carbon, underground organic carbon, and dead organic carbon densities of type j land.
Carbon Storage (CS) Q x j = H j 1 D x j Z D x j + k
where Q x j is the HQ of j habitat types, D x j Z is the degree of habitat degradation of x habitat types, H j is the suitability of habitat type j, k is the semi-saturation coefficient, and Z is the normalization constant.
Table 3. Ecological sensitivity factor weights.
Factors201020152020
Road Buffer Zones0.260.270.31
Water Buffer Zones0.150.130.15
Land Use Types0.060.070.07
FVC0.100.080.09
Slope0.180.220.21
DEM0.250.230.17
Table 4. Ecological resistance surface indicators weights.
Indicators201020152020
DEM0.160.130.09
Slope0.100.130.12
NDVI0.050.050.09
Population Density0.090.090.08
GDP0.070.090.09
Nighttime Light Intensity0.140.130.15
Land Use Types0.140.140.13
Road Buffer Zones0.150.160.17
Water Buffer Zones0.100.080.08
Table 5. Area of landscape type.
Indicators201020152020
Core53035211.365397
Islet308395.5473
Perforation212179.48286
Edge27442886.722734
Bridge54824997.495262
Loop132145.09163
Branch17511853.91824
Disclaimer/Publisher’s Note: The statements, opinions and data contained in all publications are solely those of the individual author(s) and contributor(s) and not of MDPI and/or the editor(s). MDPI and/or the editor(s) disclaim responsibility for any injury to people or property resulting from any ideas, methods, instructions or products referred to in the content.