Article

Multi-Objective Optimization of Electric–Gas–Thermal Systems via the Hippo Optimization Algorithm: Low-Carbon and Cost-Effective Solutions

1
School of Information Science and Technology, Hangzhou Normal University, Hangzhou 311121, China
2
Mobile Health Management System Engineering Research Center of the Ministry of Education, Hangzhou 311121, China
3
Zhejiang-Cyprus Smart City and Mobile Health Joint Laboratory, Hangzhou 311121, China
*
Authors to whom correspondence should be addressed.
Sustainability 2025, 17(22), 9970; https://doi.org/10.3390/su17229970 (registering DOI)
Submission received: 2 October 2025 / Revised: 17 October 2025 / Accepted: 4 November 2025 / Published: 7 November 2025

Abstract

Integrated energy systems (IES) are central to sustainable energy transitions because sector coupling can raise renewable utilization and cut greenhouse gas emissions. Yet, traditional optimizers often become trapped in local optima and struggle with multi-objective trade-offs between economic and environmental goals. This study applies the hippopotamus optimization algorithm (HOA) to the sustainability-oriented, multi-objective operation of an electricity–gas–heat IES that incorporates power-to-gas (P2G), photovoltaic generation, and wind power. We jointly minimize operating cost and carbon emissions while improving renewable energy utilization. In comparative tests against pigeon-inspired optimization (PIO) and particle swarm optimization (PSO), HOA achieves superior Pareto performance, lowering operating costs by ~1.5%, increasing energy utilization by 16.3%, and reducing greenhouse gas emissions by 23%. These gains stem from HOA’s stronger exploration–exploitation balance and the flexibility introduced by P2G, which converts surplus electricity into storable gas to support heat and power demands. The results confirm that HOA provides an effective decision tool for sustainable IES operation, enabling deeper variable-renewable integration, lower system-wide emissions, and improved economic outcomes, thereby offering practical guidance for utilities and planners pursuing cost-effective decarbonization.

1. Introduction

In the context of the “carbon peaking and carbon neutrality” targets and the rapid expansion of renewable energy, the conventional electricity-centered energy paradigm is undergoing a profound transformation. Multiple energy carriers—including electricity, gas, and heat—are increasingly coupled at both physical and informational levels, giving rise to integrated energy systems (IESs) with enhanced flexibility and robustness. Such systems offer promising pathways for improving renewable energy integration, reducing overall carbon emissions, and increasing energy utilization efficiency [1,2,3,4]. Coupling devices such as combined heat and power (CHP) units, power-to-gas (P2G) facilities, electric boilers, and multi-type energy storage technologies play pivotal roles in enabling short- and long-term energy conversion and allocation. As a result, the optimization and scheduling of IESs must simultaneously address economic considerations (operational costs and investment) and environmental concerns (carbon emissions), while carefully balancing the trade-offs between them. Developing multi-objective optimization models that capture the inherent electricity–gas–heat coupling while maintaining computational tractability has thus become a critical research focus [5,6,7,8,9].
Despite the significant progress made, IES optimization problems remain inherently complex. They involve multi-physics coupling across power flows, gas dynamics, and thermal networks, giving rise to highly nonlinear and tightly constrained formulations. Moreover, the objectives of such problems are often conflicting, as efforts to minimize costs may compromise emission reduction goals, and vice versa. In addition, uncertainties stemming from renewable generation outputs, demand fluctuations, and volatile market signals further exacerbate the challenge. Consequently, optimization algorithms for IESs must not only exhibit strong search capability but also robustness and near real-time computational efficiency. Research efforts have therefore advanced along three main dimensions: modeling, algorithms, and practical applicability. From a modeling perspective, both high-fidelity AC or nonlinear formulations and simplified DC or steady-state approximations have been explored, with the former emphasizing accuracy and the latter prioritizing tractability. From an algorithmic perspective, while traditional mathematical programming approaches (e.g., MILP, MINLP, robust, and stochastic programming) remain widely applied, meta-heuristic and evolutionary algorithms such as PSO, GA, DE, GWO, WOA, NSGA-II/III, and MOEA/D have gained prominence due to their adaptability to non-convex, nonlinear problems [10,11,12,13,14,15,16,17,18]. Hybridization and refinement of these methods continue to improve convergence and expand Pareto front coverage.
Recently, a new class of bio-inspired algorithms has emerged, drawing increasing attention for their unique behavioral mechanisms. Among them, the hippopotamus Optimization Algorithm (HOA) is particularly notable. Proposed in 2024, HOA abstracts the exploratory, defensive, and evasive behaviors of hippopotamuses into a set of position-updating rules designed to balance global exploration and local exploitation. This mechanism enhances the likelihood of identifying high-quality solutions while reducing the risk of premature convergence [19]. Early benchmark tests have demonstrated HOA’s superior search capability and robustness, and subsequent refinements have further improved its convergence and stability [20,21,22]. Given that IES optimization requires both broad exploration of the solution space for efficient, low-carbon configurations and fine-grained exploitation within feasible regions to satisfy physical constraints, HOA aligns naturally with the methodological demands of such problems [23,24,25].
At the same time, the importance of P2G technologies and hydrogen or synthetic gas storage is becoming increasingly apparent in IESs. P2G enables the conversion of surplus or low-price electricity into gaseous fuels, providing a long-duration, cross-carrier storage option critical for peak shaving and balancing in renewable-rich systems. However, its impacts extend beyond electricity integration as follows: P2G also affects gas network pressures, flows, and supply allocation. Therefore, accurate modeling of P2G–gas network coupling is essential in joint scheduling frameworks [26,27,28,29]. Prior studies confirm that deeply integrating P2G and CHP can yield significant cost and emission benefits, though model simplifications (e.g., DC power flow, steady-state gas networks) may introduce biases, highlighting the need for careful evaluation of their effects [30,31,32,33].
In addressing the multi-objective nature of IES scheduling, two general strategies dominate. The first involves applying multi-objective evolutionary algorithms such as NSGA-II/III and MOEA/D directly to approximate the Pareto front. The second transforms the multi-objective problem into a set of single-objective problems using weighted-sum, ε-constraint, or decomposition methods, subsequently solving them to obtain representative solutions. Each approach carries trade-offs: direct algorithms can produce diverse solution sets but often struggle with convergence and resolution in high-dimensional spaces, while scalarization approaches integrate well with single-objective heuristics such as HOA but rely on careful weight selection to adequately approximate the Pareto front [34,35,36,37,38].
Motivated by these challenges, this paper makes several key contributions. First, we develop a joint scheduling model of electricity, gas, and heat subsystems incorporating CHP, P2G, electric boilers, and multiple storage technologies, with annual operating cost and carbon emissions as dual objectives. The model explicitly specifies physical units and dimensions of variables while assessing the potential biases arising from modeling simplifications. Second, we systematically apply HOA to this multi-objective scheduling problem, adopting a weighted-sum strategy with multiple parallel weights, while introducing feasibility repair and boundary truncation mechanisms to ensure compliance with physical constraints. Third, we conduct a quantitative comparison of HOA against PSO and PIO under identical datasets and computational platforms. Finally, we evaluate the robustness of HOA-derived cost savings through a payback period analysis, providing insights into the practical feasibility of the proposed method.
The remainder of this paper is structured as follows: Section 2 describes the IES framework and mathematical model. Section 3 presents the principles and implementation of HOA, with a flowchart illustrating its workflow. Section 4 reports case study parameters and results. Section 5 concludes the paper with a summary of findings and contributions.

2. Framework and Model of Integrated Electricity–Gas–Heat Energy System

The Integrated Electric–Gas–Heat Energy System (IEGHES) is a multi-energy coupling system centered on the power grid and deeply integrated with natural gas and thermal systems. By coordinating sources, networks, loads, and storage at the physical level, the IEGHES achieves integrated operation of energy production, transmission, consumption, and storage. On the supply side, the system incorporates multiple energy inputs such as wind power, coal, and natural gas, enabling the conversion of electricity and heat through generation and heating processes. Among these, combined heat and power (CHP) units—comprising gas turbines and heat recovery boilers—and gas boilers (GB) serve as key coupling facilities, realizing efficient integration of electricity, gas, and heat subsystems [39]. Furthermore, power-to-gas (P2G) technology converts surplus wind power during off-peak periods into storable natural gas, which, in conjunction with gas storage facilities, can be reconverted into electricity and heat during peak demand periods by CHP units, heat recovery boilers, and gas boilers. This significantly enhances wind power absorption capacity and improves the overall efficiency of the system. In this study, the optimization model is formulated with the dual objectives of minimizing total system cost and maximizing integrated energy efficiency, while considering the operational constraints of the electricity, natural gas, and thermal systems, as well as coupling facilities [40]. This provides a theoretical foundation for the optimized operation of IEGHES.

2.1. Framework of Integrated Electric–Gas–Thermal Energy System

Before constructing the Integrated Electric–Gas–Heat Energy System (IEGHES) model, it is essential to clarify the interactions among the energy subsystems within the framework, as well as the input–output characteristics of each subsystem. The most critical aspect lies in understanding the circulation and conversion mechanisms among different forms of energy, such as electricity, natural gas, and heat. As illustrated in Figure 1, the operational framework of the IEGHES enables efficient conversion and coordinated utilization of multiple energy forms through various coupling devices, including combined heat and power (CHP) units and power-to-gas (P2G) facilities [41]. This energy conversion mechanism not only enhances system flexibility but also provides the foundation for multi-energy complementary optimization, thereby supporting stable operation and efficient energy management of the system.
The diagram illustrates the coupling relationship of multi-energy complementarity within the integrated electricity, heat, and natural gas system. The system incorporates primary energy supply units, such as wind power, coal-fired units, and combined heat and power (CHP) plants, along with flexible regulation devices like electric boilers, energy storage, thermal storage, and gas storage units. The green arrows represent electricity flow, the orange arrows represent natural gas flow, and the red arrows represent heat flow. In addition to meeting electricity demand, the electricity system can convert electricity into heat via electric boilers or inject it into the natural gas system through a power-to-gas (P2G) device. The CHP units provide combined electricity and heat supply, while storage devices achieve energy balance and peak shaving across different time scales for electricity, heat, and gas. The overall structure reflects the operational characteristics of multi-energy complementarity, energy coupling, and collaborative multi-storage in the integrated energy system.

2.2. Power System Model

2.2.1. DC Power Flow Model

The DC power flow model is a simplified model used in the steady-state analysis of power systems, primarily for calculating the distribution of active power within the system. This model transforms the AC network model of the power system into a DC network model, neglecting the effects of frequency and phase in the AC system, and represents all AC quantities as DC quantities. In the DC network model, the voltage and power flow distribution at each node are obtained by solving the DC power flow equations. The DC power flow model assumes that the voltage magnitude at each node in the power system remains constant, ignoring factors such as line resistance, charging capacitance, and parallel compensation. This model simplifies the complex nonlinear power flow model into a linear one, which can be expressed by the following equation:
P = α β
where P represents the net active power injection vector at each node, α is the system’s admittance matrix, and β is the voltage phase angle vector at each node. This simplification allows the model to quickly compute the power flow within the power system while maintaining adequate accuracy [42].

2.2.2. Wind Turbine Generator Model

The mathematical modeling of a wind turbine generator (WTG) typically simplifies the aerodynamic and mechanical dynamics, as it is not necessary to include these complex details in power system and integrated energy system simulations. Instead, a simplified power characteristic model is used. This approach not only reflects the basic operating principles of the wind turbine but also facilitates its use in scheduling, optimization, and planning models.
Wind energy is a form of kinetic energy, which is converted into mechanical energy by the turbine blades and then into electrical energy through the generator. The theoretical power can be expressed using the following power formula:
P a e r o = 1 2 ρ A C p V 3
here, ρ represents the air density (approximately 1.225 kg/m3 under standard conditions), A is the swept area of the turbine blades, reflecting the wind energy capture capability, C p is the power coefficient, which represents the efficiency of converting wind energy into mechanical energy (the Betz limit is 59.3%, with actual values ranging from 0.35 to 0.48), and V is the wind speed.
It can be seen that wind power is proportional to the cube of the wind speed, making the output highly sensitive to changes in wind speed.
However, in power system studies, we usually do not directly use the aerodynamic formula above but instead use the power curve provided by the manufacturer for the wind turbine, which expresses the relationship between wind speed and electrical power output.
A typical piecewise power curve is as follows:
P w V = 0 , V < V c i P r a t e d V 3 V c i 3 V r 3 V c i 3 , V c i V < V r P r a t e d , V r V V c o 0 , V > V c o
here, V c i is the cut-in wind speed (typically 3–4 m/s), V r is the rated wind speed (typically 11–13 m/s), V c o is the cut-out wind speed (typically 25 m/s), and P r a t e d is the rated power.
Although this piecewise model is simplified, it effectively reflects the basic operating principles of the wind turbine, making it the most commonly used wind turbine model in scheduling and optimization.

2.2.3. Coal-Fired Unit Model

The coal-fired unit is one of the core power sources in traditional power systems, characterized by large capacity, strong stability, and controllable operation. The mathematical modeling of this unit focuses on describing the relationship between fuel consumption and electrical power output, as well as considering various operational constraints (output range, ramp rate, start-up and shut-down conditions, etc.).
The coal-fired unit generates electricity by burning coal to release chemical energy, which is then converted into electrical energy through a boiler, steam turbine, and generator. The relationship between electrical power output P e and fuel thermal power input Q f u e l is expressed as follows:
P e = η t h Q f u e l
here, P e is the electrical power output (MW), Q f u e l is the thermal power input from the fuel, and η t h is the thermal efficiency (typically ranging from 0.33 to 0.45).

2.3. Natural Gas System Model

2.3.1. Natural Gas Subsystem Model

The natural gas subsystem is an important component of the integrated energy system, mainly responsible for the production, transportation, distribution, and consumption of natural gas. The operating principle of the natural gas subsystem involves the transportation and distribution of natural gas, which consists of natural gas sources, pipelines, compressors, and natural gas loads. Natural gas is transported from the gas source through pipelines to various nodes, where compressors and other equipment regulate the pressure, ultimately reaching the user for consumption. Its structure is shown in Figure 2 [43].
Natural gas in pipeline transmission is influenced by factors such as temperature, flow velocity, and pipeline friction, which cause variations in node gas pressure and pipeline flow. To reduce computational complexity, the natural gas subsystem in integrated energy systems typically uses a steady-state model, neglecting the impact of these factors on node gas pressure and pipeline flow.
1.
Natural gas source
Natural gas sources include gas fields, storage facilities, etc., responsible for the extraction and storage of natural gas. The produced natural gas is transported via pipelines to various nodes of the natural gas subsystem. Similarly to generators in the power subsystem, the gas supply from each source must also meet the following constraint conditions:
w s m i n w s w s m a x
where w s represents the gas output at a certain moment from the natural gas source; w s m i n and w s m a x are the lower and upper limits of the gas output, respectively.
2.
Natural gas pipeline flow
The natural gas pipeline flow is responsible for transporting natural gas from the gas source to various consumption points. Factors such as the pipeline diameter, temperature, and pressure affect the natural gas flow. In this paper, the Weymouth steady-state model is used to describe the natural gas pipeline flow, where the flow is only related to the pressures at both ends of the pipeline, and the gas flows from the node with higher pressure to the node with lower pressure. The specific expression for the natural gas flow through the pipeline in terms of node gas pressure is as follows:
L X Y = ε X Y s g n ( P X , P Y ) | P X 2 P Y 2 |
where L X Y represents the natural gas flow in the pipeline; ε X Y is the pipeline transmission parameter, which includes factors such as temperature, diameter, etc.; P X and P Y represent the gas pressures at nodes X and Y , respectively; s g n ( P X , P Y ) is the direction parameter, indicating the flow direction of natural gas in the pipeline. When s g n ( P X , P Y ) = 1, it means natural gas flows from node X to node Y , and when s g n ( P X , P Y ) = −1, it means natural gas flows from node Y to node X .
3.
Compressor
Due to the impact of the material properties of the pipeline and external factors, natural gas experiences pressure drop during transmission. To maintain the gas pressure within the pipeline, compressors are used to increase the pressure. Since the energy consumed by compressors (either electricity or natural gas) is relatively small, for the sake of simplifying calculations, this paper only considers the pressure relationship between the nodes at both ends of the compressor and does not account for the energy consumed by the compressor. The specific expression is as follows:
P j = ρ c P n
where P j and P n represent the pressures at the outlet and inlet of the compressor, respectively; ρ c is the compression ratio of the compressor. Since the energy consumption characteristics of the compressor are not considered, the compression ratio is treated as a constant.

2.3.2. Natural Gas Pipeline Model

The natural gas pipeline model is a mathematical model used to describe and analyze the flow of natural gas in a pipeline system. These models are crucial for the design, operation, and optimization of natural gas transportation systems. The following is the natural gas pipeline model used in this study:
w x , t + x y Z ( y ) w x y , t = y k v ( y ) w y k , t
w x y , t + w y x , t = 0
w y , t = w y , t w e l l w y , t p g u w y , t l o a d
w x y , t = C x y | φ x , t 2 φ y , t 2 |
φ m i n φ x , t φ m a x
w x y , m i n w x y , t w x y , m a x
0 w y , t l o a d c u t w y , t l o a d
where w x y , t represents the gas flow transmitted from node x to node y in the pipeline; w y , t w e l l and w y , t p g u are the gas injection flow from the gas source point and the gas consumption of the gas turbine at node y , respectively; w y , t l o a d is the gas load at node y ; φ x , t is the gas pressure at node x ; φ m i n and φ m a x are the lower and upper limits of the node gas pressure; w x y , m i n and w x y , m a x are the lower and upper limits of the gas flow transmitted through the pipeline; C x y is the pipeline x y constant, which is related to the pipeline length, diameter, operating temperature, and the pressure difference between nodes.

2.4. Thermodynamic System Model

2.4.1. Heat Source Model

The heat source model primarily consists of the Combined Heat and Power (CHP) units (gas turbines and waste heat boilers) and electric boilers. The efficiency of the CHP unit in this model is 0.35, with a capacity of 50, and the ramping limit is between 0 and 1.5.
C H P ( t ) = 2.58 × P C H P ( t )
where P C H P ( t ) represents the electrical power output of the CHP unit, and C H P ( t ) represents the thermal power generated by the waste heat boiler of the CHP unit.
Natural gas fuel cost as follows:
C f u e l = C n g Q L H V t P ( t ) η ( t ) Δ t
The natural gas consumption of the gas turbine as follows:
H g a s = 1 Q L H V P ( t ) η ( t ) Δ t
where the low calorific value of natural gas Q L H V is 9.7 kwh/m3; C n g is the price of natural gas, unit: $/m3; P ( t ) is the power output of gas turbine in time t ; η ( t ) is the efficiency of gas turbine in time t ; Δ t is the time interval.

2.4.2. Heat Supply Network Model

Heat supply network, which connects heat source and heat load, is an important part of the thermal subsystem. The structure of the thermal subsystem is shown in Figure 3.
In Figure 3, the heating temperature Τ b p s , i n represents the inlet water temperature of the pipeline b in the water supply system, the heating temperature Τ b p s , o u t represents the outlet water temperature of the pipeline b in the water supply system; the return temperature Τ b p r , i n represents the water temperature of the inlet temperature of the pipeline b in the backwater system, the return temperature Τ b p r , o u t represents the outlet water temperature of the pipeline b in the backwater system; Τ i m s and Τ i m r respectively represent the mixing temperature of the water supply system and the backwater system at node i .
Τ b p s , i n = Τ i m s   b S i +
Τ b p r , i n = Τ i m r   b S i

2.4.3. Pipeline Flow Loss Conversion

Heat loss in the district heating network is primarily caused by the temperature difference between the heat medium inside the pipe and the surrounding medium, as well as by the pipe diameter and insulation level. Moreover, short-term heat losses can be considered as a result of changes in the temperature of the heat medium inside the pipe [44]. Assuming that the heating pipe is located underground, heat losses due to insulation are negligible, and the relationship between the inlet and outlet water temperatures of the heating pipeline is as follows:
T t , o u t P = ( T t , i n P T S O I L ) e x p ξ p θ P C W m P + T S O I L
where T t , o u t P and T t , i n P are, respectively, the temperature of outlet and inlet water of the heating pipeline; T S O I L is soil temperature; C W is the heat capacity of water and the value is 4200 J/(Kg·°C); m P is the mass flow rate of water, Kg/s; θ P is the length of the pipeline; ξ p is the heat transfer coefficient of the pipeline.
The heat loss of the heating pipeline is expressed as follows:
H t , y P = C W m y P ( T t , i n P T t , o u t P )
where m y P is the mass flow rate of water in the pipeline y , kg/s; H t , y P is the heat loss of the pipeline y in time t , MW [45].

2.5. Optimization Model

2.5.1. Objective Function

The optimization scheduling model of the integrated electricity–gas–heat energy system aims to minimize the system’s economic cost and maximize overall energy efficiency. A multi-objective optimization scheduling model is established, where the objective function represents the sum of all costs in the system. The costs primarily include the operational cost of the wind turbine generator, the operational cost of the CHP units, the cost of natural gas output, and the equipment costs (which are much smaller than the other costs and are thus omitted).
In this study, in order to see the gap between algorithms more clearly, the objective function is determined to be all the costs invested in the model in one year as follows:
C = 365 × C 1 + C 2 + C 3 + C i n v
The operating cost of generator is generally expressed by quadratic function equation:
C 1 = a x + b x P x , t G + c x P x , t G 2
where a x , b x and c x are the cost coefficients of the generator, respectively, and P x , t G is the active output of the generator x at time t .
The operating cost of CHP unit is mainly the fuel cost, so the calculation equation of the cost is the product of the fuel cost coefficient and fuel consumption as follows:
C 2 = ε C H P ( θ P P x t + θ H H x t )
where ε C H P is the fuel cost factor of the CHP unit, θ P and θ H respectively represent the fuel consumed by the unit electrical power and unit thermal power produced by the CHP unit, and P x t and H x t respectively represent the electrical power and thermal power produced by the CHP unit at any given time.
The cost of natural gas is the cost of natural gas output as follows:
C 3 = γ x Q x , t
where γ x is the cost coefficient of natural gas, and Q x , t is the output value of natural gas source at time t .

2.5.2. Carbon Emissions

In this study, carbon emissions primarily result from direct fuel combustion.
C O 2 k g = Q f u e l × E F k g C O 2 / k W h
Q f u e l = V f u e l × L H V
Here, Q f u e l represents the fuel consumption (in kWh), and E F k g C O 2 / k W h is the energy-based emission factor.

2.5.3. Constraint Condition

In order to ensure the safe and stable operation of the electric thermal integrated energy system, some parts need to be constrained, which is expressed as follows:
1.
Wind turbine generator set output constraint
P G i m i n P G i P G i m a x
where P G i m i n and P G i m a x are the upper and lower limits of generator i output, respectively.
2.
Climbing constraint of wind turbine generator set
P G , i , t P G , i , t 1 X H , i
P G , i , t 1 P G , i , t X L , i
where P G , i , t and P G , i , t 1 respectively represent the output of generator set i at time t and time t 1 ; X H , i and X L , i are, respectively, the upper and lower climbing limits of the generator set.
3.
Electric Boiler
The electric boiler converts electrical energy into heat by heating water or thermal media, serving as an important device in the electricity–heat coupling. The constraints for the electric boiler are as follows:
Output Relationship:
Q E B t = η E B P E B t
Output Range:
0 P E B t P E B m a x
0 Q E B t Q E B m a x
Here, Q E B t is the thermal power output, P E B t is the electrical power input, and η E B is the efficiency of the electric boiler (typically ranging from 0.95 to 0.99).
4.
P2G
The P2G (power-to-gas) technology converts electrical energy into hydrogen or methane using water electrolysis or methanation processes. It is commonly used for renewable energy integration and multi-energy complementarity. The constraints for P2G are as follows:
G P 2 G t = η P 2 G P P 2 G t
Output Range:
0 P P 2 G t P P 2 G m a x
0 G P 2 G t G P 2 G m a x
Here, G P 2 G t is the gas production power from P2G, P P 2 G t is the electricity consumption power for P2G, and η P 2 G is the conversion efficiency (typically ranging from 0.6 to 0.75).
5.
Energy Storage
Energy storage systems can store electricity during off-peak hours and release it during peak hours, achieving dynamic balance between electricity supply and demand. Common energy storage constraints include power range, energy balance, and capacity limitations.
Power constraint:
0 P c h t P c h m a x
0 P d i s t P d i s m a x
where P c h t is the charging power and P d i s t is the discharging power.
To avoid simultaneous charging and discharging, a logical constraint is set:
P c h t P d i s t = 0
6.
Branch power flow constraint
The power flowing on each branch in the model cannot exceed the maximum and minimum values of the power allowed to be transmitted by the branch.
F r m a x F r F r m a x
where F r m a x indicates the maximum power allowed to flow on a branch r .
7.
Node power balance constraints
At the system level, the power balance constraints of all nodes are summed up to form the power balance equation of the whole system. For each node, its power balance constraint can be expressed as:
j ϑ i φ P i j P i d = j ϑ i g P g , i
where ϑ i φ represents the set of lines connected to node i , ϑ i g represents the set of generators on node i , P i j represents the power flowing from node i to node j , P i d represents the load on node i , and P g , i represents the total output of all generators on node i .
8.
Nodal pressure constraint
In order to ensure the safe and stable operation of the natural gas system, the air pressure of each node must be within a reasonable operating range as follows:
P X m i n P X P X m a x
where P X m i n and P X m a x represent the minimum and maximum pressure of node X respectively.
9.
Thermodynamic system equilibrium constraint
In equilibrium, energy conversion and transfer within the system reach a stable state, which conforms to the first law of thermodynamics. At the same time, avoid the situation of excessive or insufficient heat production, and ensure the stability of the system as follows:
ϕ C H P ( t ) + ϕ E B ( t ) = ϕ l o s s ( t ) + ϕ l o a d ( t )
where ϕ C H P ( t ) is the heat energy generated by CHP unit at time t , ϕ E B ( t ) is the heat energy generated by electric boiler at time t , ϕ l o s s ( t ) is the heat energy lost in the heat transmission process, and ϕ l o a d ( t ) is the effective heat energy.

2.6. Chapter Summary

This chapter first establishes the structural and operational models of the electricity, natural gas, and thermal subsystems. On this basis, a multi-objective optimization framework is proposed, with objectives including the minimization of operating costs and carbon emissions, while incorporating various operational constraints. Through this modeling process, the optimization problem is mathematically formulated, thereby providing a complete system model for subsequent solution using the HOA-based approach.

3. Model Solving

3.1. The Connection Between the Hippopotamus Optimization Algorithm and Energy System Optimization

3.1.1. Hippopotamus Optimization Algorithm

The hippopotamus optimization algorithm (HOA) is a novel meta-heuristic (intelligent optimization) algorithm inspired by the inherent behaviors of hippopotamuses. The algorithm models their behavior in three phases: exploration, defense, and escaping from predators. HOA was first proposed by Amiri et al. and has been validated across multiple benchmark tests, demonstrating its effectiveness [2].
In this study, HOA is applied to the optimization of the Integrated Electric-Gas-Heat Energy System (IEGHES), considering two optimization objectives: minimization of operating costs and minimization of carbon emissions. A multi-objective optimization (MOO) strategy is employed to model and solve the problem, as described below:
1.
Objective Function Formulation
Economic Objective: Minimization of the annual total operating cost of the system.
Environmental Objective: Minimization of carbon emissions during system operation.
2.
Multi-objective Optimization Method
The weighted sum method is adopted to transform the bi-objective problem into a single-objective problem, which can then be solved using HOA. Its general form is expressed as follows:
C = α C c o s t + 1 α C c a r b o n
where C c o s t denotes the system operating cost, C c a r b o n denotes carbon emissions, and α ∈ [0, 1] is the weighting coefficient.
When α = 1, the optimization is fully biased toward economic performance.
When α = 0, the optimization is fully biased toward environmental benefits.
When α = 0.5, economic and environmental objectives are equally emphasized.
By adjusting the weighting coefficient, a set of Pareto-optimal solutions with different preferences can be obtained, providing flexible decision-making references for system operators.
3.
HOA for Multi-objective Problem Solving
The core search process of HOA remains consistent with the single-objective case. In the multi-objective setting, however, candidate solutions are evaluated in each iteration using the weighted objective function FFF. To ensure solution diversity, HOA is executed multiple times under varying weights, thereby generating a more comprehensive Pareto front for the decision space.
In the initialization phase of the algorithm, the population is represented by randomly generated hippopotamus locations. The HOA iteratively updates the position of the hippo to optimize the objective function. Hippo location updating involves modeling three behavioral patterns: exploration, defense, and flight from predators. The population initialization phase of HOA involves generating a random initial solution that generates a vector of decision variables using the following formula:
X i : x i , j = l v j + r · u v j l v j , i = 1,2 , , n , j = 1,2 , , m
where X i represents the i candidate solution, r is a random number in the range of 0 to 1, and l v j and u v j represent the lower and upper limits of the j decision, respectively.
1.
Exploration stage (the hippopotamus’ position update in the river or pond): mimic the aggregation behavior of the hippo herd and guide the population search through the position of the dominant hippo. The calculation formula is as follows:
X P 1 i , : = X i , : + A × ( Dominant_hippopotamus I 1 × X i , : )
X P 2 i , : = X i , : + B × ( Dominant_hippopotamus I 2 × M e a n G r o u p )
where A and B are randomly generated coefficients, I 1 and I 2 are random integers, Dominant_hippopotamus is the position of the dominant hippo, and M e a n G r o u p is the average position of the randomly selected hippo group, X i , : is an array of individuals in the i -th population.
2.
Defense phase (hippopotamus defense against predators): describes response to potential threats, such as predators, by making loud calls and turns to avoid attack, using the following formula:
P r e d a t o r j = l v j + r · u v j l v j , j = 1,2 , , m
X P 3 i , : = R L i , : × p r e d a t o r + ( b c d   c o s ( l ) ) × ( 1 d i s t a n c e 2 L e a d e r )
where R L is the Levy flight step [46], v is a parameter associated with the Levy flight step R L , P r e d a t o r j is the j th predator position, b , c , d and r are the random coefficient, u and l are the upper and lower bound parameters, respectively, and d i s t a n c e 2 L e a d e r is the distance [47] between the hippo and the predator.
3.
Escape from predator phase (hippopotamus escaping from the predator): simulate the behavior of the hippo away from danger area during threat using the following formula:
X P 4 i , : = X i , : + r a n d o m ( ) × LO_LOCAL + D × HI_LOCAL LO_LOCAL
where LO_LOCAL and HI_LOCAL are the lower and upper bounds of the local search, D is the randomly generated coefficients and r a n d o m ( ) is the random array.
The selection of parameters, including population size NNN, number of iterations JJJ, and Levy step size, was guided by the original HOA literature and common standards used in comparative studies of optimization algorithms. Preliminary experiments were conducted with N = 10, 20, 30, Ultimately, N = 20 was chosen to balance solution accuracy and computational efficiency.
By integrating three typical behavior patterns of hippos, the HO algorithm realizes the effective combination of global search and local search. Through randomly generated hippo locations and specific update rules, the algorithm can be efficiently explored and developed in the search space to find the optimal solution. Performance evaluation shows that the HO algorithm obtains the best value in 115 of 161 benchmark functions, including single-peak and multi-peak functions, fixed-dimensional multi-peak functions, etc. These functions range from CEC2019 test functions to Zigzag Pattern benchmark functions, showing that the HO algorithm performs well in optimizing performance. In comparison with other classical algorithms such as sparrow optimization algorithm (SSA), HO algorithm achieves better performance on most test functions [2]. The multi-objective optimization scheduling problem of the electric–gas–thermal integrated energy system in this study needs a better algorithm in terms of optimization performance to solve it, which is why the Hippo optimization algorithm is applied to the integrated energy system in this study to solve the multi-objective optimization problem and carbon emission problem.
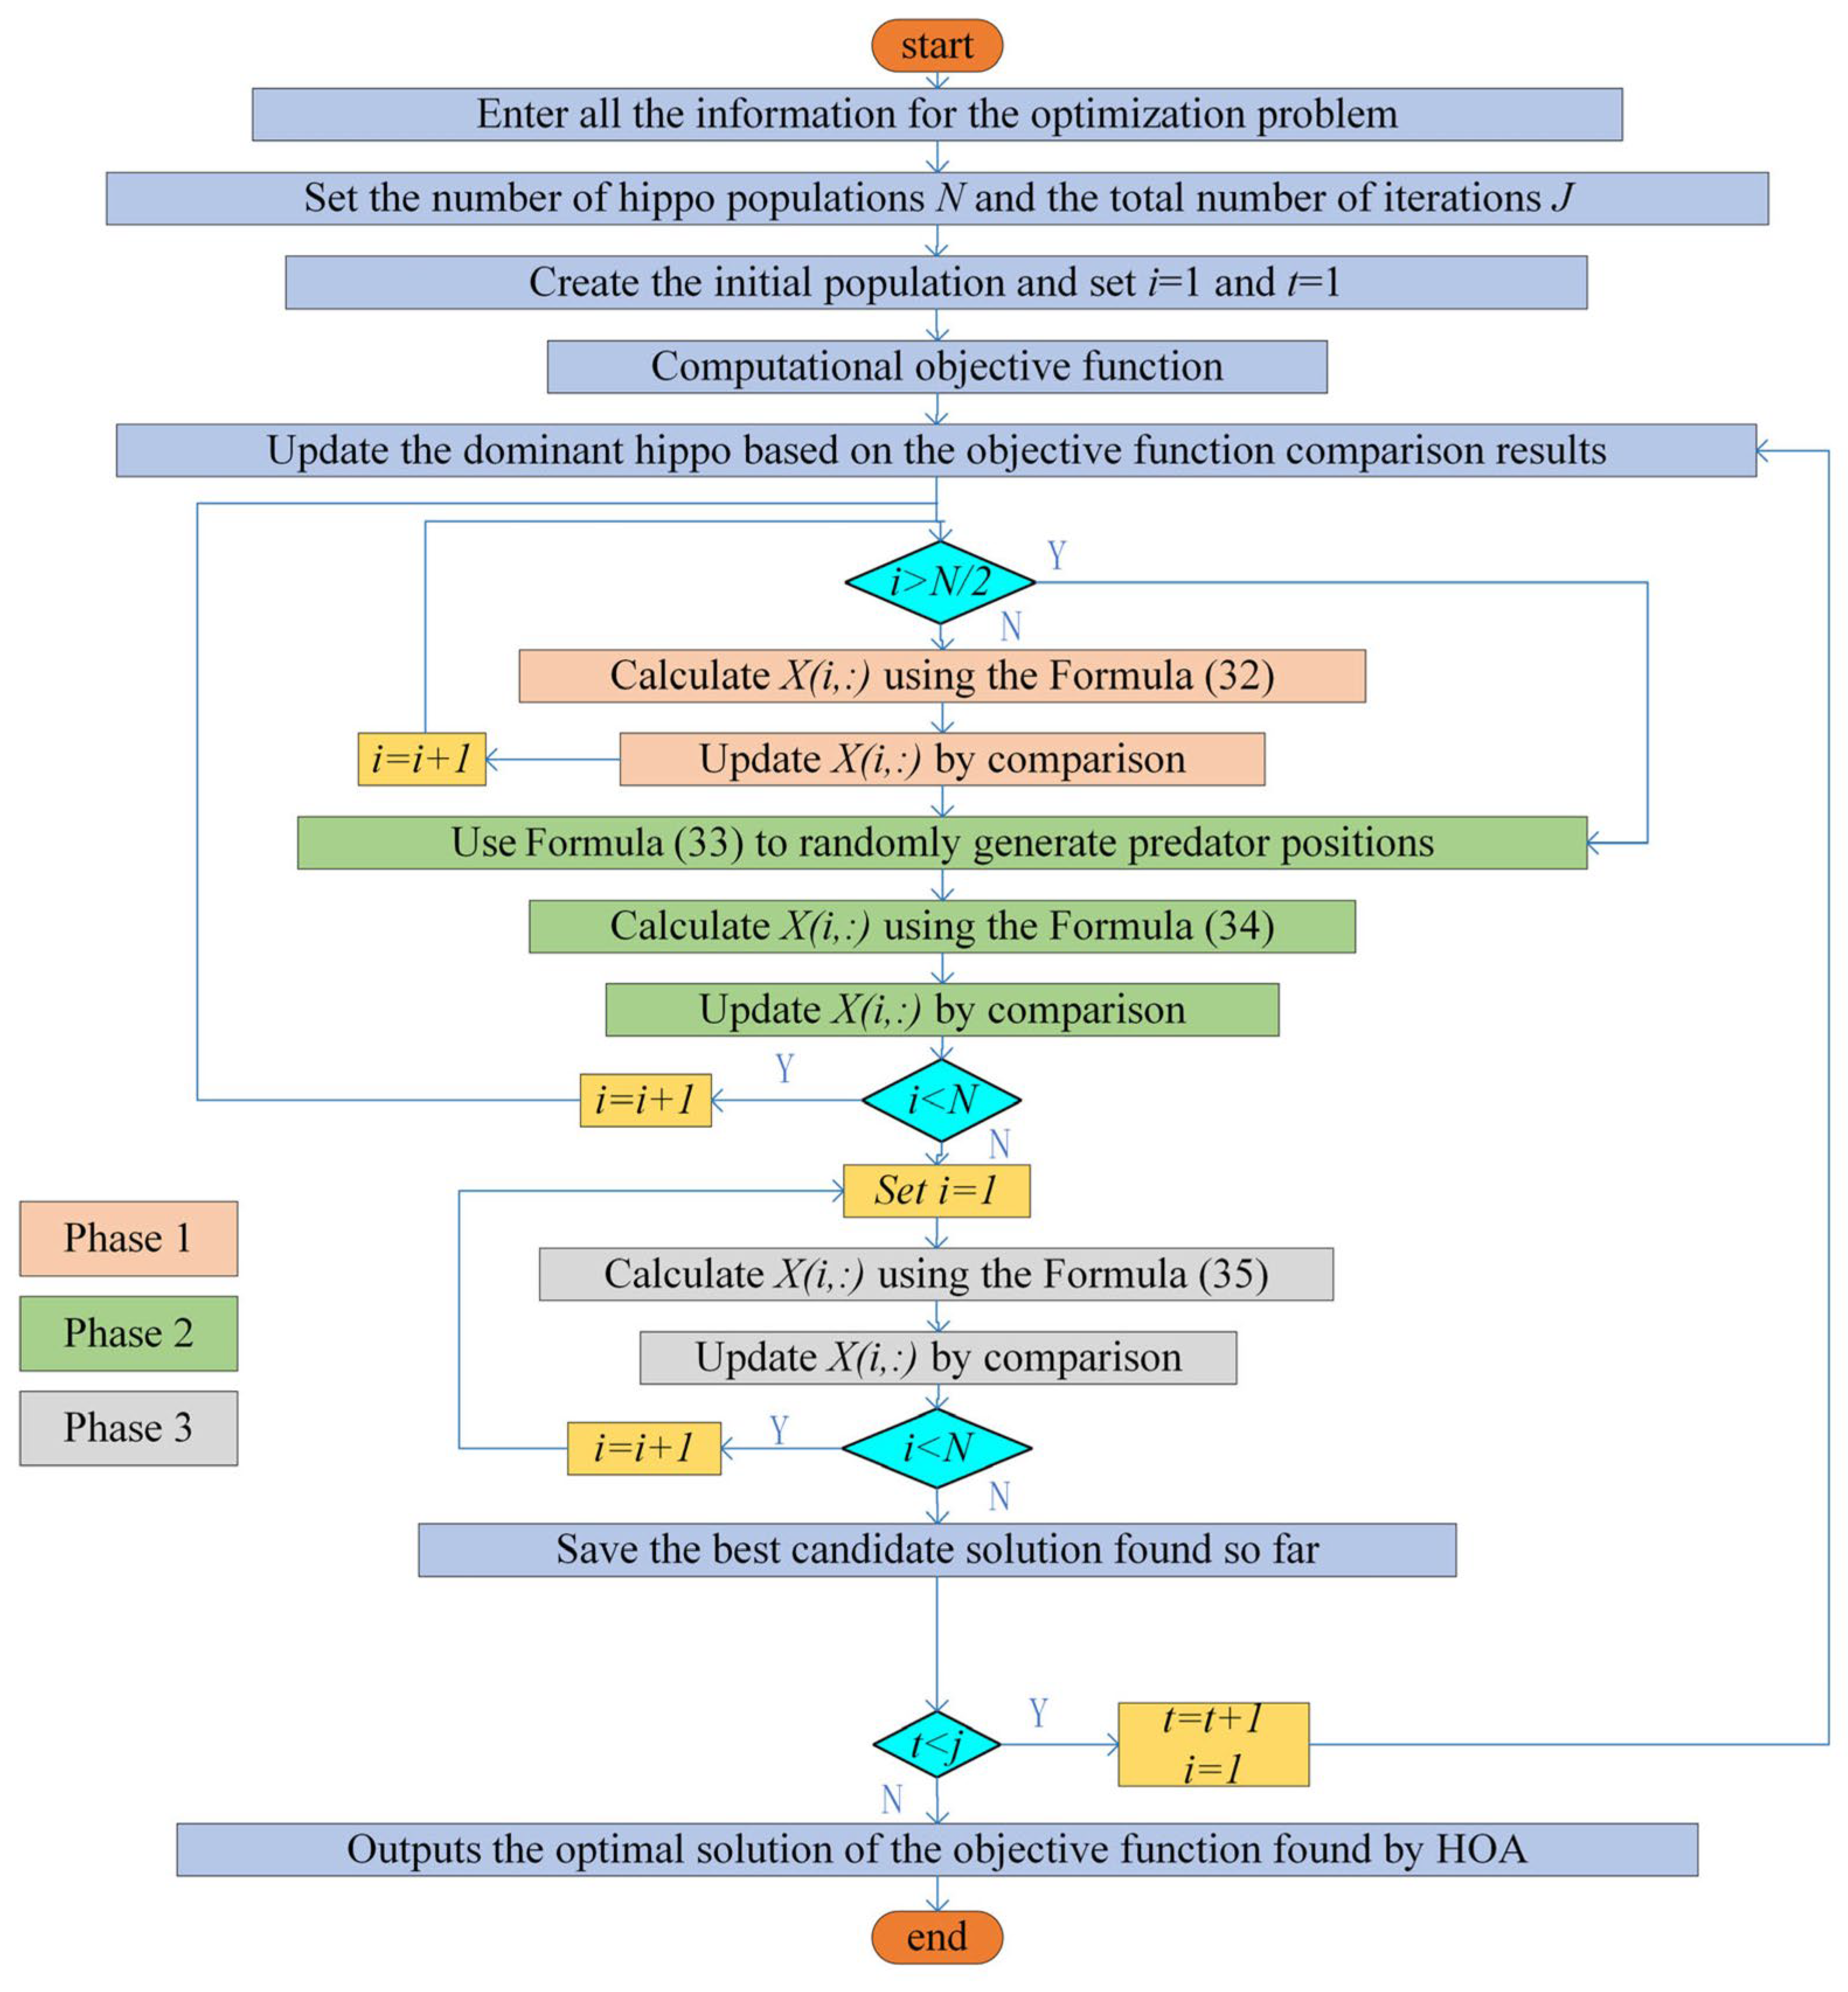
The process of applying the hippo optimization algorithm to a multi-objective problem starts with input of all the information of the optimization problem, including setting the number of hippo population N and the total number of iterations J. Next, create the initial population and set the iteration counter i = 1 and the time step t = 1. Then the objective function is calculated, and the dominant hippo is updated based on the comparison results of the objective function.
The process is divided into three stages:
Stage 1: If i > N/2, then X(i, :) is calculated using Formula (32), and X(i, :) is updated by comparison. Then increase the value of i.
Stage 2: If i < N, the predator’s position is randomly generated using Formula (33), X(i, :) is computed using Formula (34), and X(i, :) is updated by comparison. If i < N, set i = 1 and proceed to the next stage.
Stage 3: Calculate X(i, :) using Formula (35) and update X(i, :) by comparison. Then increase the value of i.
At the end of each phase, save the best candidate solution found so far. If t < J, increment the value of t and return to phase one to continue the iteration. Otherwise, output the best solution of the objective function found by HO and end the process.
Large-step escape. When the search stagnates or individuals become trapped by a “predator-like” solution (a low-quality yet attractive point), HOA activates a heavy-tailed jump to escape the local region. Every τ generations we check for stagnation and loss of diversity (e.g., no improvement of the global best for Δ generations or population mean distance below ε); detecting a crowded, dominated “predator” solution x p r e d also triggers the mechanism. For the selected individual x i we update as follows:
x i t + 1 = x i t + α t L e v y β 1 , d x i t x p r e d x i t x p r e d + δ
where L e v y β with β ∈ (1, 2) provides heavy-tailed steps, α t = η t (ublb) is an adaptive step size (nominal η 0 ≈ 0.05; temporarily enlarged on trigger, e.g., η t ← 2 η t ), and boundary violations are handled by reflection or clipping. The jump is accepted if it improves the objective (single-objective) or yields a non-dominated solution with larger crowding distance (multiobjective); otherwise, it may be kept with a small probability (e.g., p = 0.1) to preserve exploration. This design lets a few individuals perform long flights to escape, while the rest keep regular convergence.
Figure 4 shows the flow chart of hippo optimization algorithm.

3.1.2. Correspondence Between HOA Phases and Energy System Scheduling

The hippopotamus optimization algorithm (HOA) is driven by three behavioral phases: exploration, defense, and escape from predators. To clarify how these behaviors are applied to the integrated electric–gas–heat scheduling problem, the correspondence between algorithmic phases and energy system operational strategies is described as follows:
  • Exploration Phase: In this phase, the algorithm conducts a broad search across the solution space, analogous to exploring various operational modes in system scheduling (e.g., different combinations of unit start-ups and shutdowns, P2G absorption strategies, and energy storage charge–discharge schemes). This stage helps identify diverse candidate operating plans and prevents premature convergence to local minima.
  • Defense Phase: Here, the algorithm performs local refinement of promising individuals while maintaining diversity. This corresponds to fine-tuning the system under operational constraints (e.g., unit ramping limits, pipeline pressure minimums, thermal network temperature requirements) to ensure that solutions remain technically and safely feasible.
  • Escape Phase: When the search is trapped in a local optimum or encounters suboptimal “predator-like” solutions, HOA employs large-step jumps to escape the local region. In scheduling terms, this is equivalent to introducing aggressive operational strategy adjustments (e.g., temporarily increasing P2G absorption or changing power allocation to avoid high-cost zones), thereby seeking superior system-level solutions.
In this study, these three phases are mapped onto decision variables, including unit outputs, P2G outputs, energy storage charge–discharge levels, and gas supply. Constraint correction and feasibility restoration are incorporated in each phase to ensure that updated solutions satisfy the physical and operational constraints of the integrated electric–gas–heat system. This mapping preserves the bio-inspired search advantages of HOA while ensuring that the results are practically implementable in real-world energy systems.

3.1.3. Influence of HOA Phases on the Optimization Process

In energy system optimization, algorithm performance is primarily determined by two factors: the ability to identify high-quality feasible solutions (solution quality) and search efficiency (convergence speed and computational effort). The three-phase mechanism of HOA balances these factors by switching between different search scales:
The exploration phase provides global diversity to discover potential clusters of superior solutions.
The defense phase refines these clusters to enhance solution feasibility and robustness.
The escape phase introduces large jumps to reduce the likelihood of being trapped in local minima, increasing the probability of achieving lower-cost and lower-emission solutions.
To ensure that each behavioral phase positively contributes to system optimization, feasibility restoration (e.g., correcting violations of gas pressure or thermal balance constraints) and boundary truncation operations are implemented, guaranteeing that every algorithmic step remains engineering-feasible.

3.2. Chapter Summary

This chapter introduces the fundamental mechanism of HOA and its three core behaviors—exploration, defense, and escape—and incorporates them into a multi-objective optimization context. The application process of HOA to integrated energy system optimization is further elaborated, including population initialization, fitness function evaluation, Pareto front generation, and convergence analysis. This chapter not only clarifies the mathematical implementation details of HOA but also demonstrates its integration with electric–gas–heat system optimization, providing a theoretical foundation for the subsequent experimental analysis.

4. Example Results and Analysis

4.1. Example Parameters

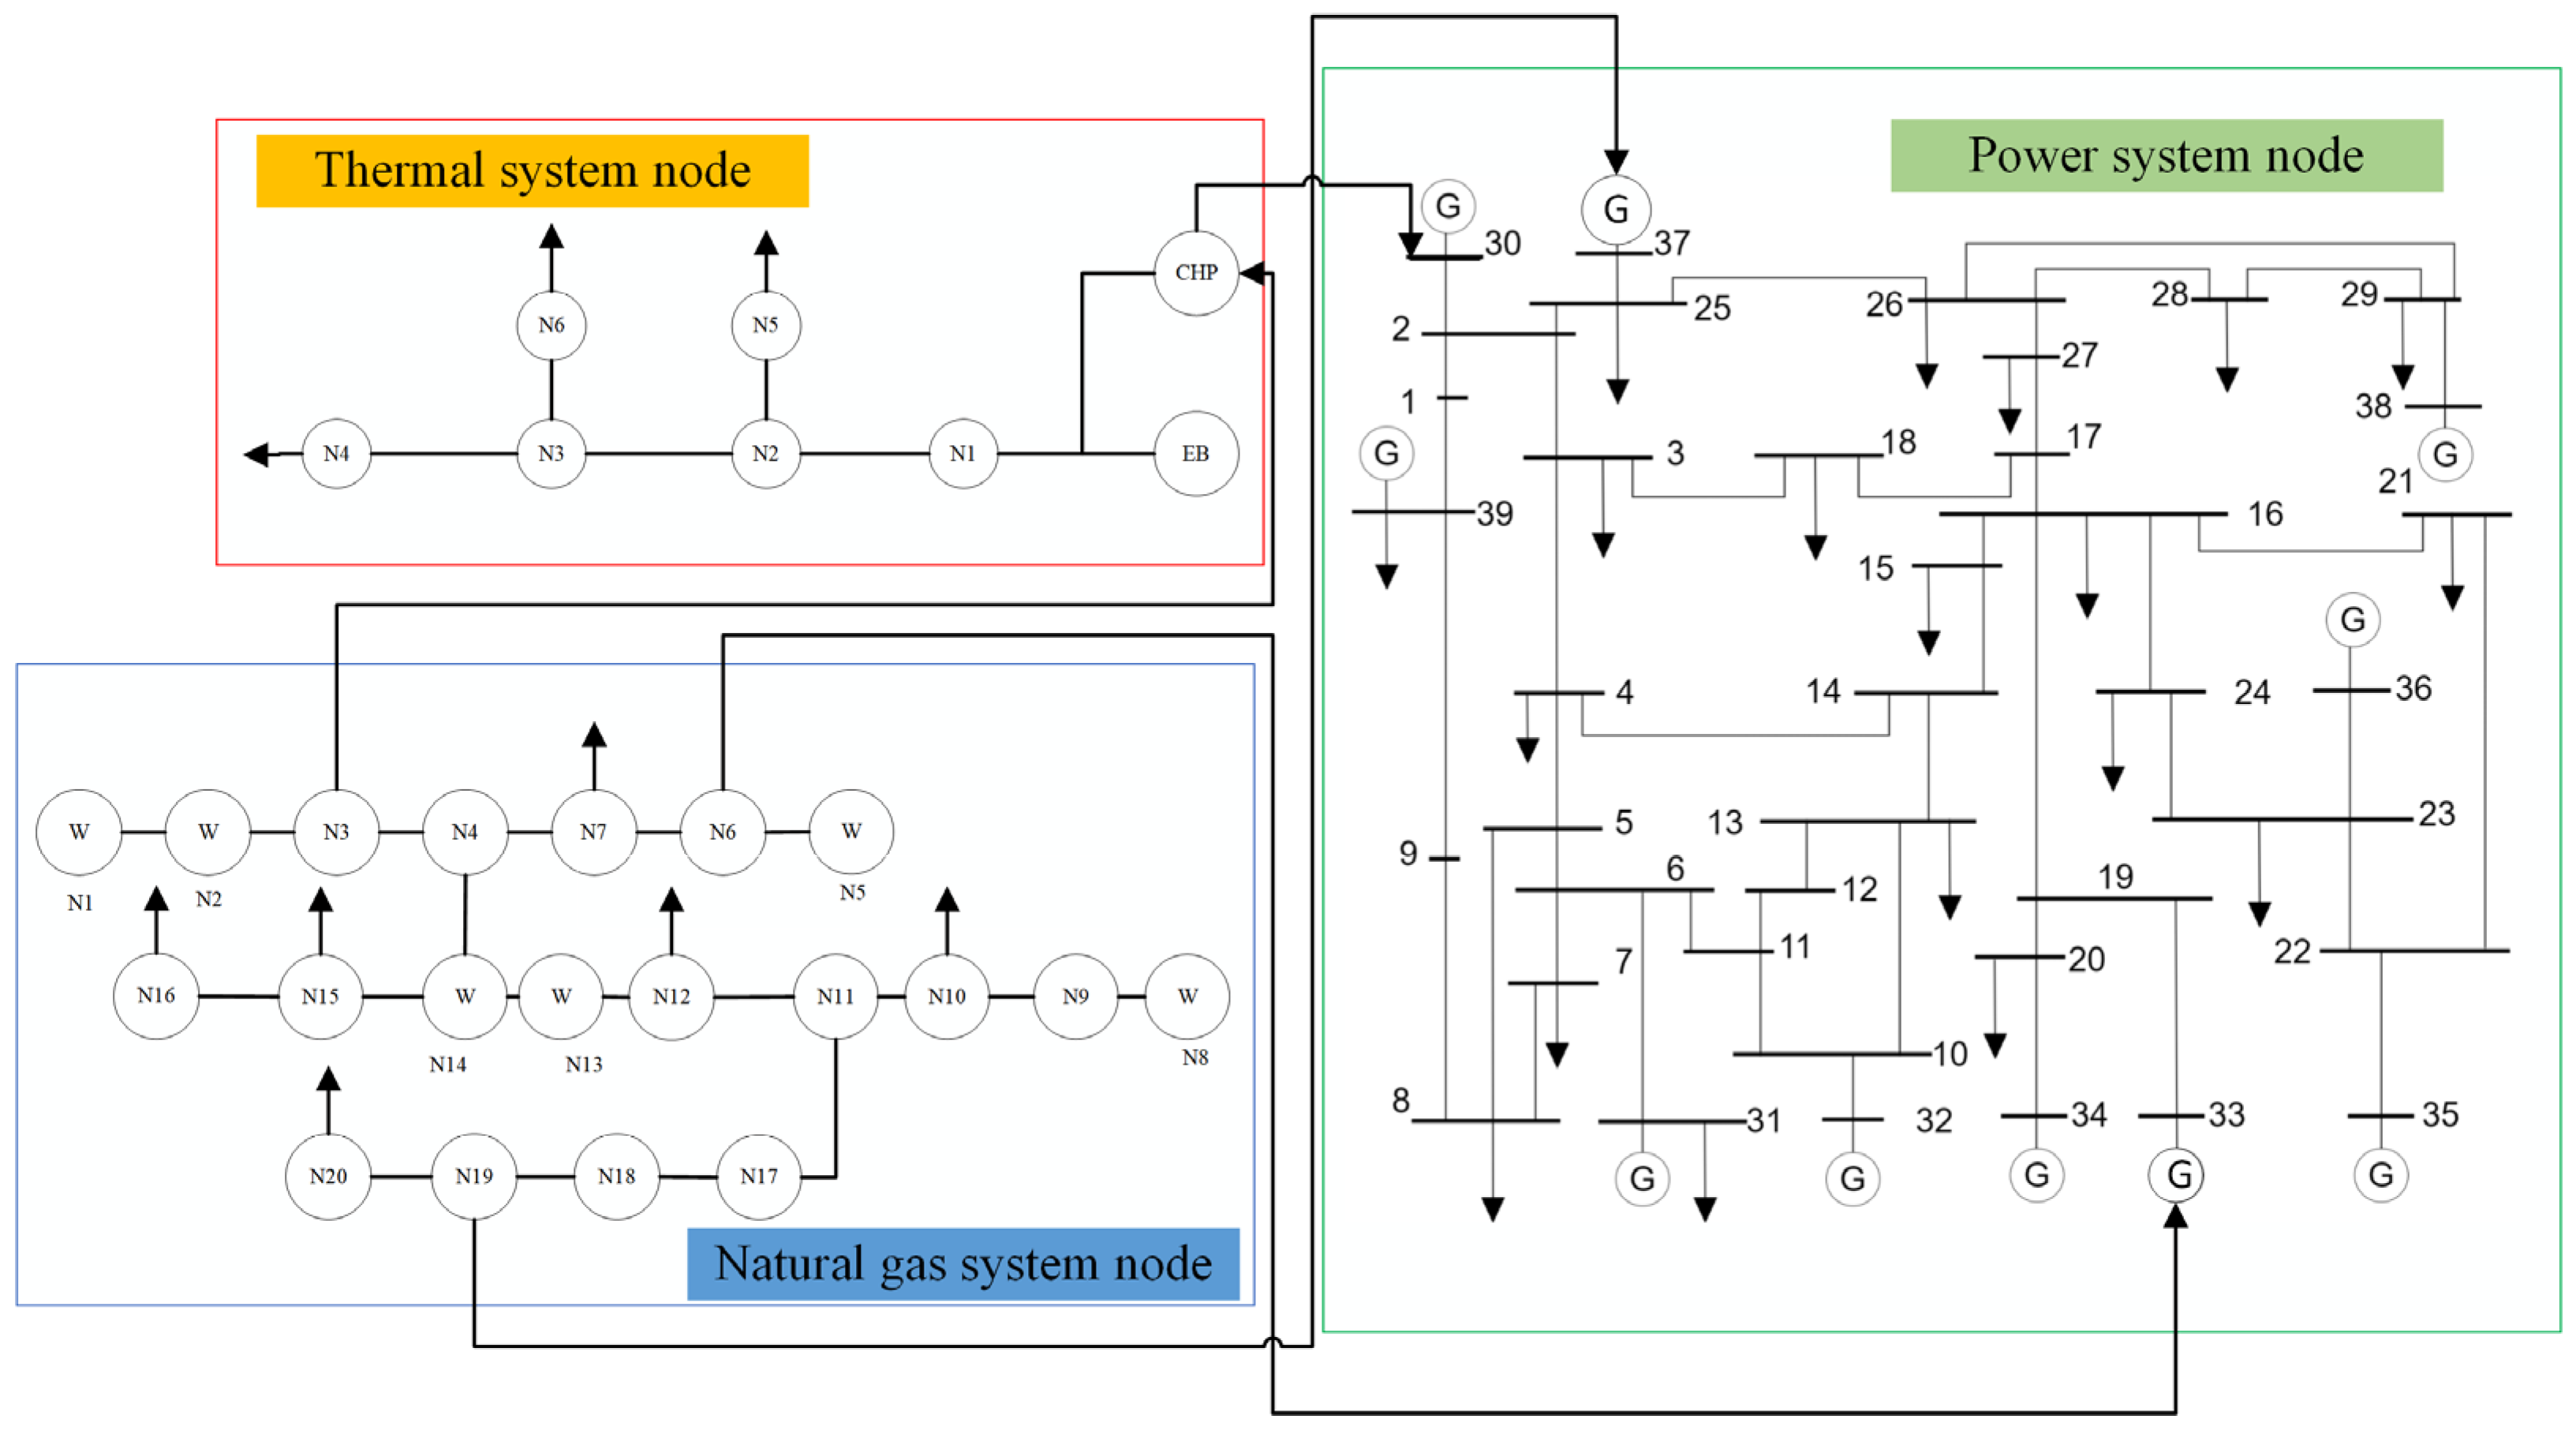
In this case, nodes 33 and 37 of the IEEE-39-node power system [48] are configured as gas-fired generators, and the gas they require is derived from nodes 6 and 19 of the Belgian 20-node gas system, respectively. At the same time, the generator located at node 30 is set up as a combined heat and power (CHP) unit, which not only generates electricity, but also provides heat to the 6-node thermal system. Belgium’s 20-node gas system consists of six gas supply points and nine demand points. The 6-node thermal system consists of a CHP unit and an electric boiler, and the electricity consumption of the electric boiler depends on the power supply of the CHP unit. In order to enhance the interconnection between electricity, natural gas, and heat, the CHP units are designed to be gas-fired, and their natural gas consumption is supplied by node 3 of the natural gas system. In this case, the data of the power system is the same as that of matpower39 nodes. There are 10 generator sets in total, and 2 of them are changed into gas generators. The total installed capacity is 6967 MW, and the total power load is 5941.5 MW.
This study uses the CPLEX solver of yalmip on MATLAB R2022b to solve the problem. The experimental hardware configuration for this study included a 3.40 GHz Intel (R) Core(TM) i7-13700KF CPU with 32.00 GB of memory and an NVIDIA GeForce RTX 4080 SUPER GPU.
Table 1 is the coupling description of the relevant nodes in the power system. Some nodes in the power system can be used as the gas source in the natural gas system and the heat source in the thermal system.
Figure 5 shows the structural diagram of the integrated energy system in this study, which includes all nodes.
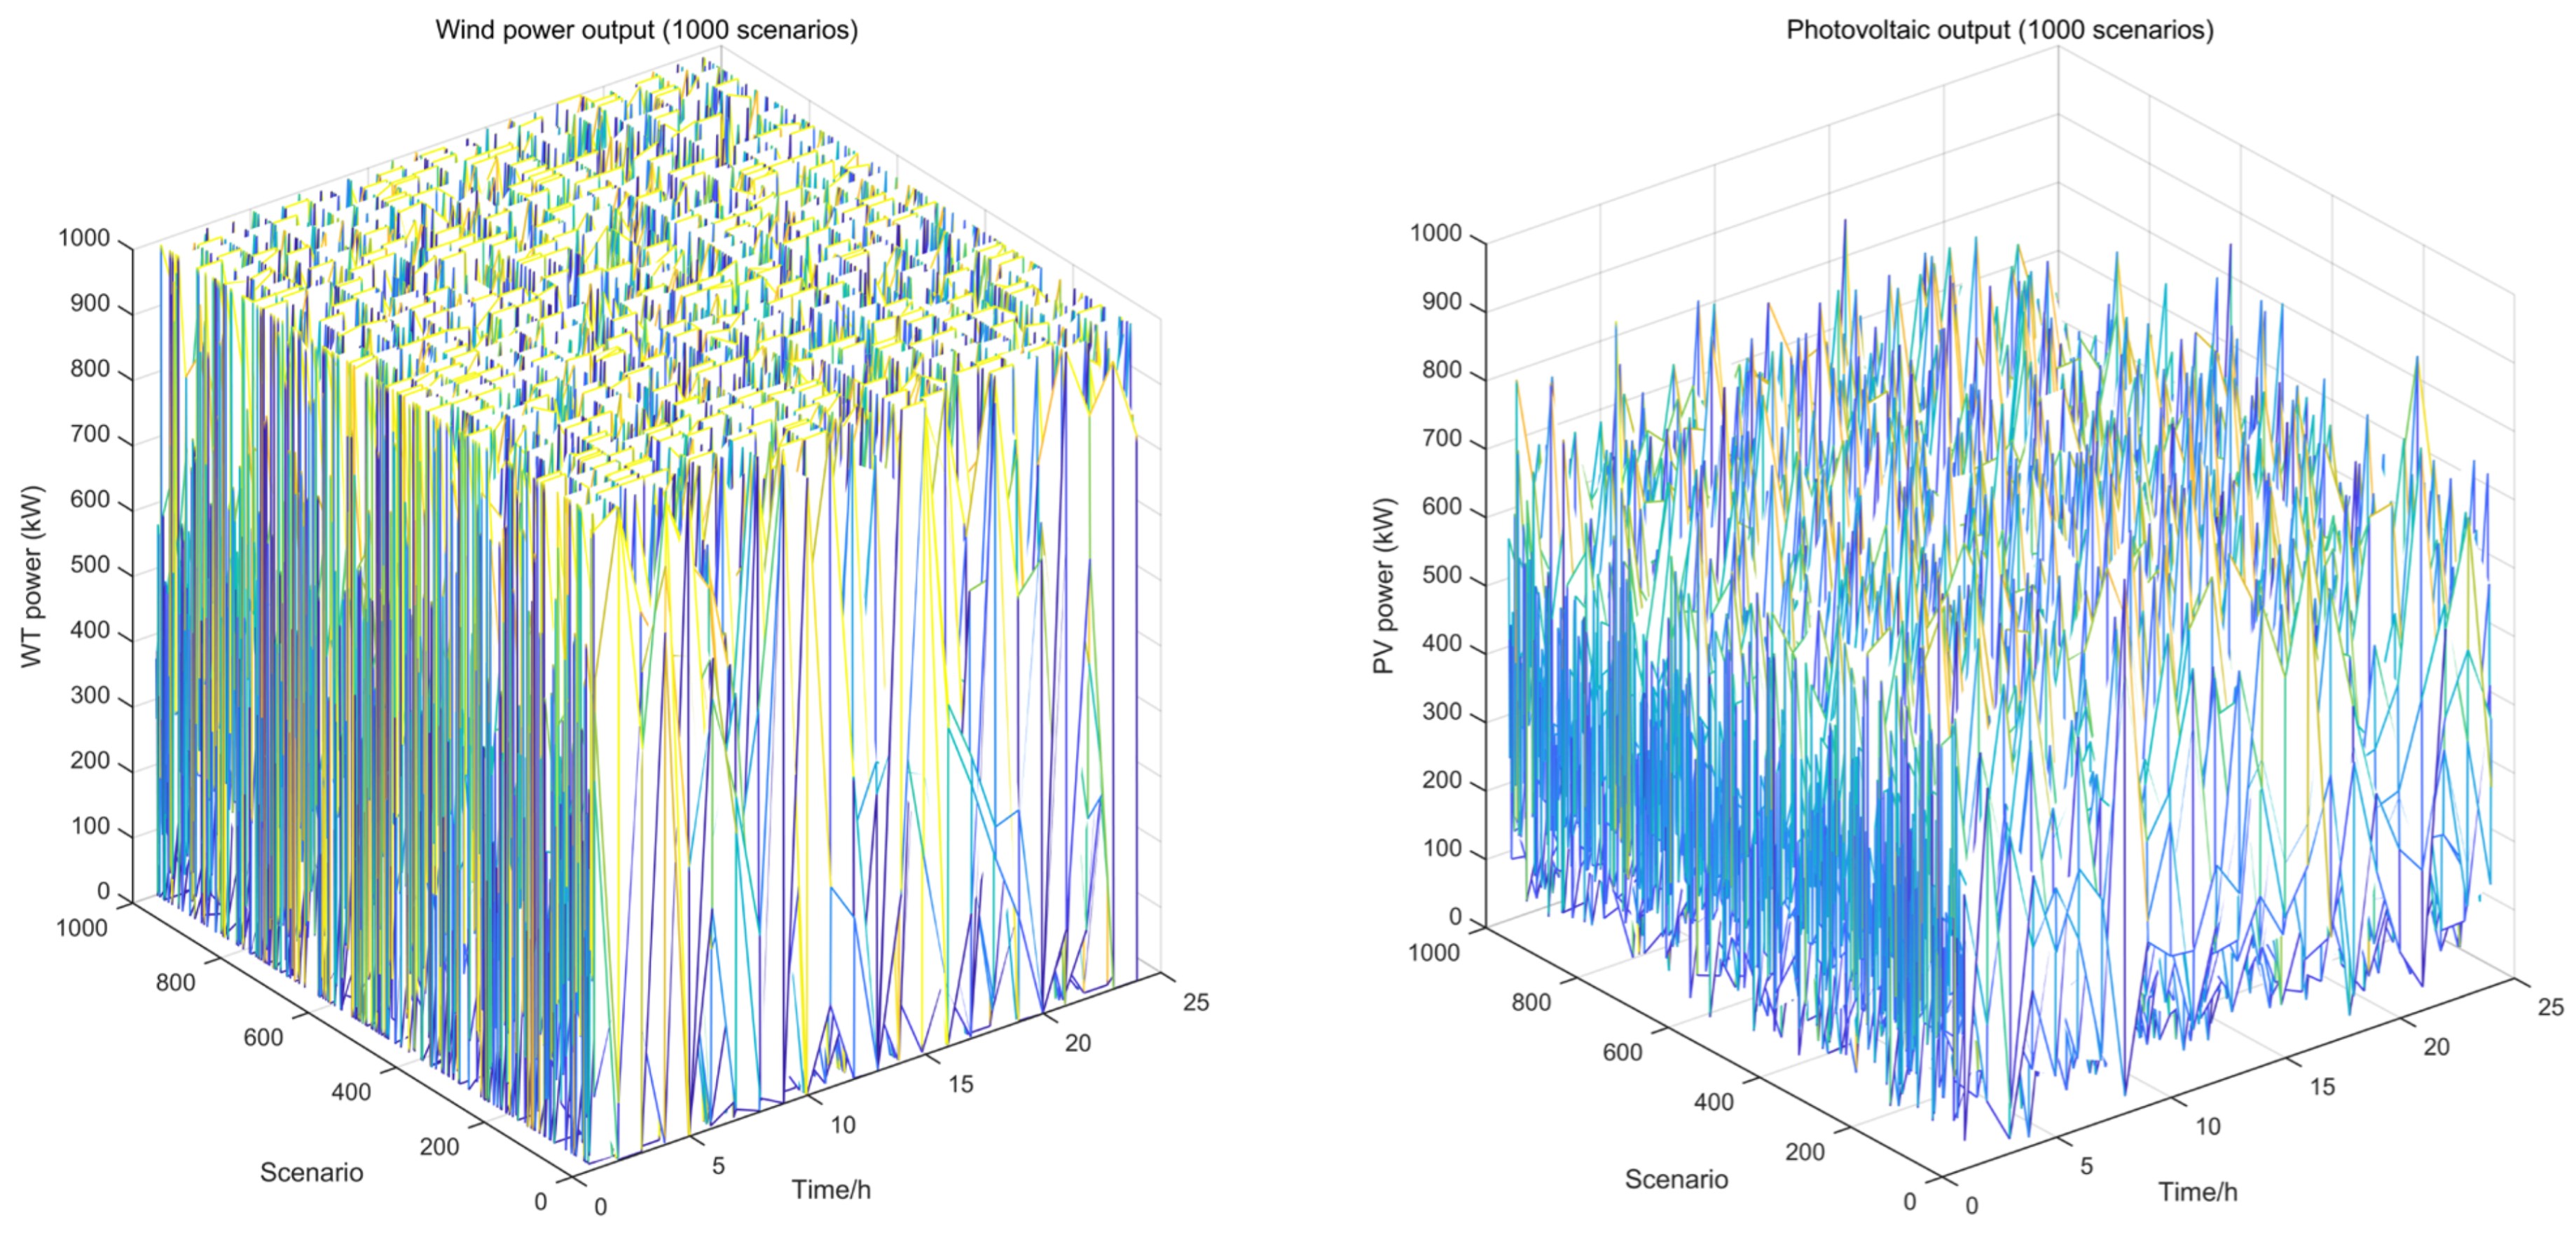
To increase the uncertainty of renewable energy in the model, the experiment used 1000 random wind/solar scenarios for Monte Carlo extrapolation evaluation. Experiments conducted in these random scenarios can demonstrate how robust ranking of each algorithm scheme is when real fluctuations arrive. The random landscape scenarios are as follows (Figure 6):

4.1.1. Power System Data

The cost parameters of generator set are shown in Table 2.

4.1.2. Natural Gas System Data

This case contains a total of 6 gas sources and 9 gas loads: 7 conventional gas loads, 2 gas turbine generator loads. The total load is 2.4608 mm3. One to three cost USD 0.085/m3, and four to six cost USD 0.062/m3. The upper and lower limits of the flow rate for each gas source are shown in Table 3.
The natural gas data used in this study is the Belgian 20-node natural gas system data. The Belgian 20-node natural gas system pipeline data are shown in Table 4. The node data of the Belgian 20-node natural gas system are shown in Table 5.

4.1.3. Thermal System Data

The thermal system in this study consists of one CHP unit, one electric boiler, and three heat loads. The total load is 50 MW, of which the electric boiler heating ratio is 0.8, and the output limit is 30 MW. The basic parameters of the CHP unit are shown in Table 6.
In Table 6, ε C H P is the fuel cost factor of the CHP unit, and θ P and θ H respectively represent the fuel consumed by the unit electrical power and unit thermal power generated by the CHP unit.
The ambient temperatures of 6 nodes in the thermal system shown in Figure 5 are shown in Table 7.

4.2. Result Analysis

4.2.1. Comparative Analysis of Optimization Algorithms

In this study, particle swarm optimization algorithm and the pigeon swarm optimization algorithm [49] were, respectively, used to solve the case, and the results of the solution were compared with those of the hippo optimization algorithm. The number of iterations is set as follows: The number of global search iterations is 30 times, and the number of local search iterations is 5 times. The iteration times of the particle swarm optimization algorithm and the hippo optimization algorithm are 30 times. The same parameter of the three algorithms is that the initial population number is 6.
The principle of the particle swarm optimization algorithm is that during the whole search process, birds pass their information to each other, so that other birds know their position, and through such cooperation, they can judge whether the optimal solution is found, and at the same time, the information of the optimal solution is passed to the whole flock. Finally, the whole flock can gather around the food source; that is, the optimal solution is found. The principle of the pigeon-inspired optimization algorithm is that pigeons use the geomagnetic field and the height of the sun as compass operators to update the position of pigeons. Compared with the hippopotamus algorithm, the convergence accuracy of the above two algorithms is low, and it is easy to fall into the local optimum. In the process of this research experiment, it is found that the parameter setting of the pigeon-inspired optimization algorithm is also difficult. In the following comparative experiments, this research focuses on the detailed analysis of the experimental results of the three algorithms.
To ensure reproducibility and fairness, all algorithms are run under an equal evaluation budget (population size 6 × number of iterations 30) with identical stopping criteria. Hyper-parameters follow defaults commonly used in integrated energy-system studies and open implementations; the nominal values are listed in Table 8. Around these nominal settings, we consider small practical perturbations—N and T by ±20%, and learning/interaction factors by ±10–20% (see Table 8).

4.2.2. Comparative Analysis of Objective Function

One of the objective functions of the model proposed in this study is to minimize the total annual cost of the electricity gas heat integrated energy system, including the cost of machinery and equipment, that is, the investment cost; the operation cost of the thermal power unit; the operation cost of the wind turbine; the natural gas output cost; and the P2g unit operation cost.
The comparison of cost optimization results of the pigeon swarm optimization algorithm, particle swarm optimization algorithm, and hippo optimization algorithm in this case is shown in Table 9.
As can be seen from the cost optimization results in Table 8, compared with the pigeon swarm optimization algorithm and particle swarm optimization algorithm, the Hippo optimization algorithm has greatly reduced the operating cost of the fan after several iterations. Although the cost of other parts has increased, the overall cost has reached the goal of cost reduction, and the overall cost has decreased by about 1.5%.
Following common practice for tractability in integrated energy-system studies, this paper adopts a DC power-flow model and a steady-state gas-network model. High-fidelity alternatives include AC power flow with reactive/voltage constraints and transient gas models with linepack and compressor maps. In planning-oriented or hour-level operational analyses with moderate congestion and price-based scheduling, DC and steady-state gas approximations are widely used and typically reproduce the dispatch decisions that drive cost/emissions. However, under stressed voltage conditions or steep pressure ramps, AC and transient gas models can be necessary. We therefore adopt the simplified models for computational efficiency and transparency, and we explicitly discuss their applicability and limitations in the following text (Table 10).
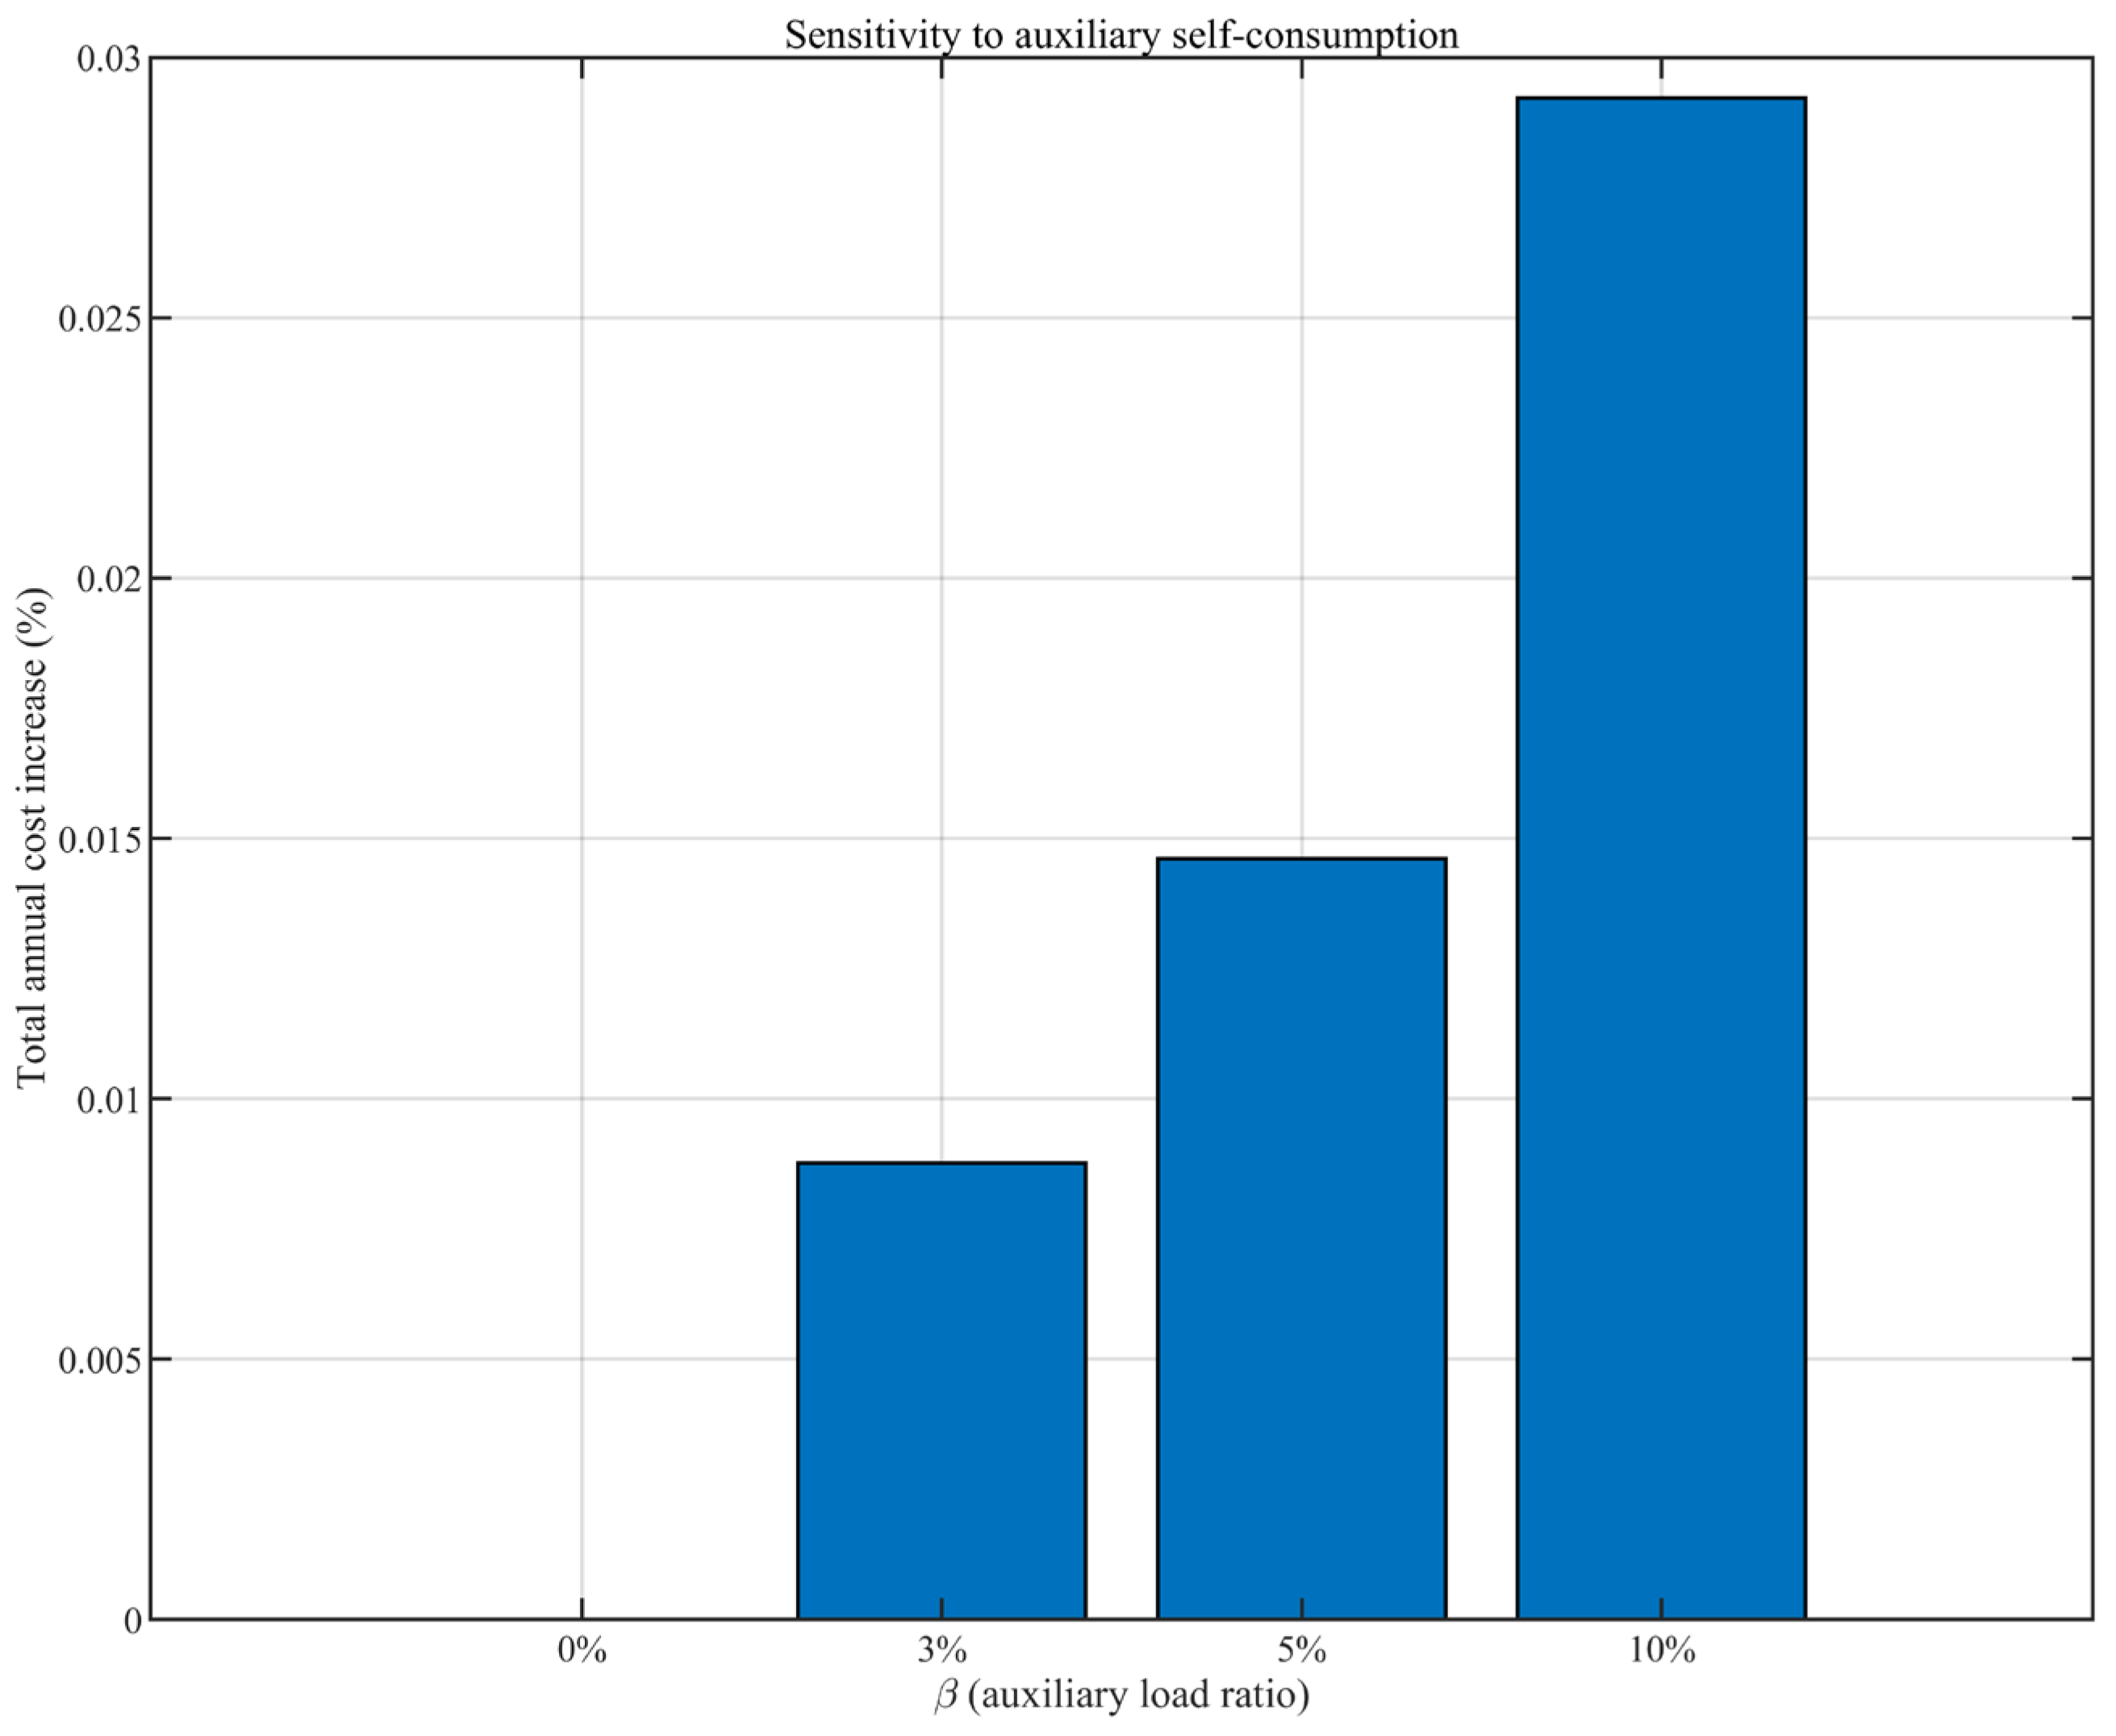
Because this model is simplified by omitting self-consumed energy, a sensitivity analysis was conducted in this study as follows:
P a u x = β P g e n
where P a u x represents the auxiliary self-consumption power, β represents the auxiliary self-consumption proportion coefficient, indicating the proportion of energy consumption of auxiliary equipment relative to the reference power, P g e n is the proportional reference “generation/output power”.
Including auxiliary self-consumption via P a u x = β P g e n leads to only marginal changes in absolute totals (≈+0.009%, +0.015%, +0.03% for β = 3%, 5%, 10%), without altering the comparative performance of HOA against PIO/PSO (Figure 7).
It is necessary to understand the use of natural gas in the strategies solved by each algorithm. The three-dimensional diagram of pipeline natural gas flow of the strategies of pigeon swarm algorithm, particle swarm algorithm and hippo algorithm, is shown in Figure 8.
Figure 8 clearly shows the similarity of the strategies selected by the three algorithms in terms of pipeline natural gas flow data. The overall performance is that the flow of branches 1 to 5 is maintained between 0 and 0.5 m3/h in the morning of the day, and then gradually increases to between 0.5 and 1 m3/h. In Branch 10 of the gas network, the pipeline natural gas flow is the highest among all branches, with an average of about 1.5 m3/h. The curve shows obvious fluctuations in one day, indicating that the gas flow has significant changes in different time periods. In some time periods, the flow reaches a peak, while in other time periods, the flow may drop to close to 0 or negative, indicating that the flow decreases or reverses. The main factors affecting the flow of natural gas in pipelines are various parameters of natural gas pipelines.
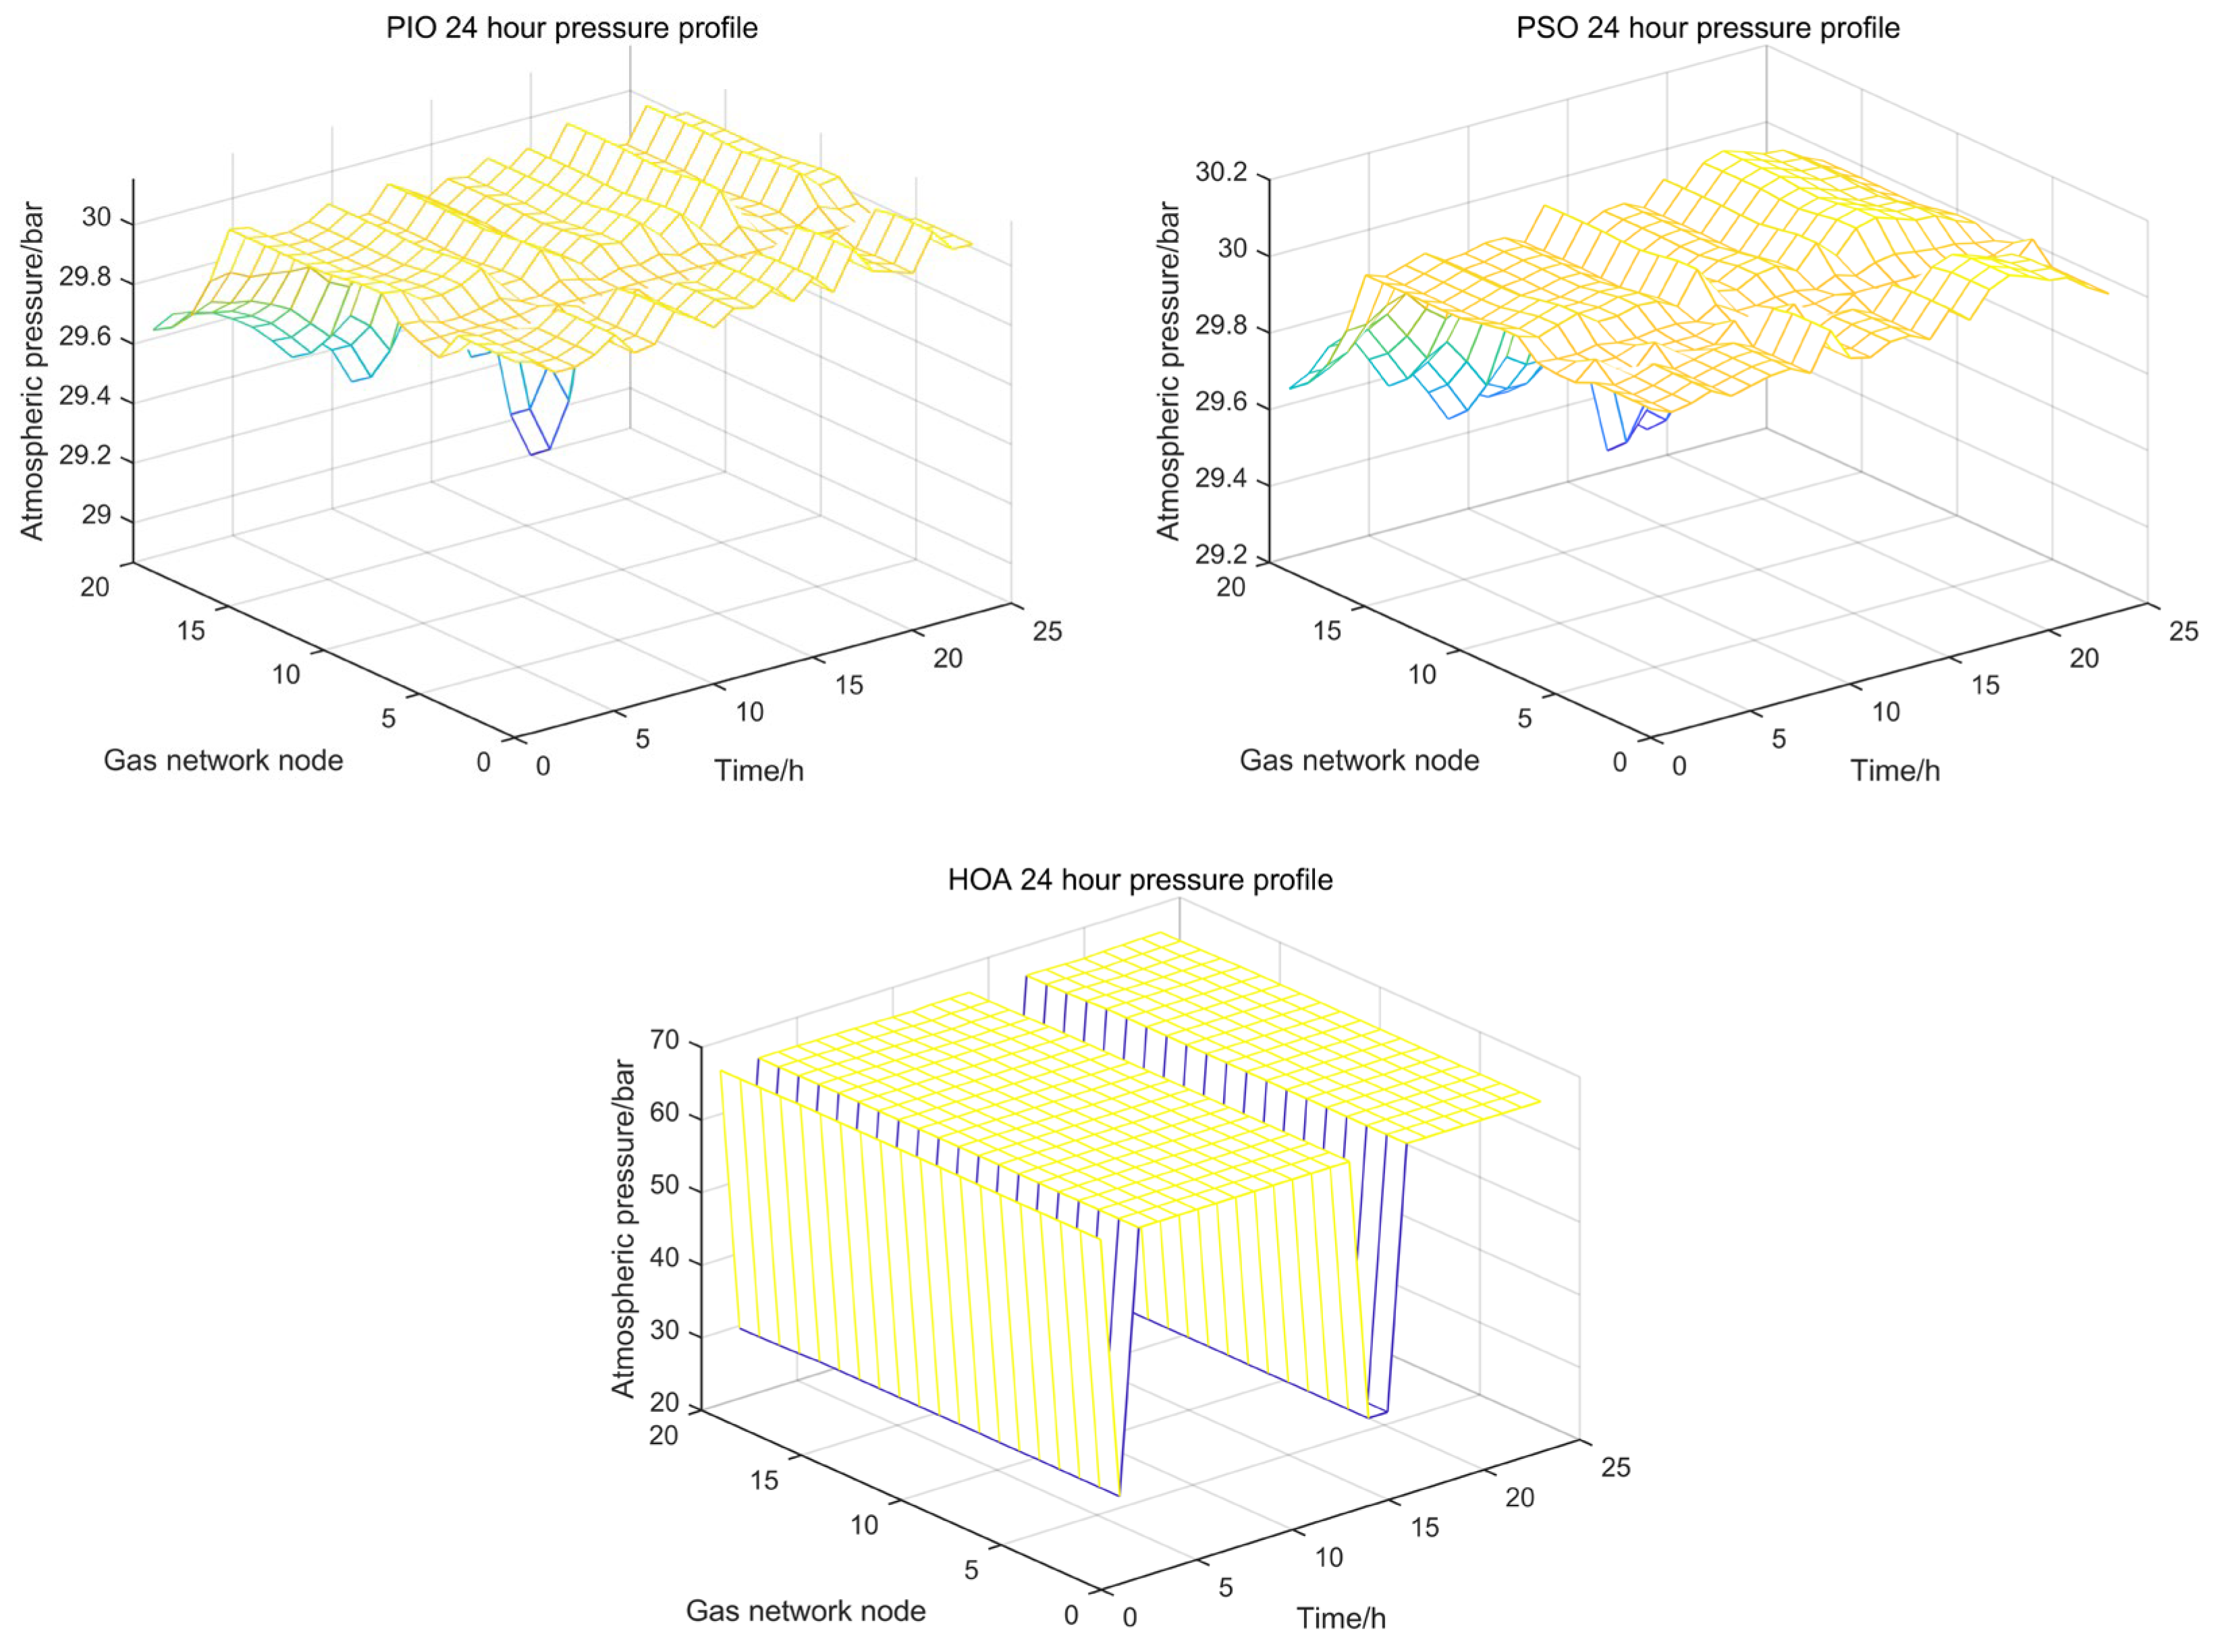
As shown in Figure 9, the pressure distribution of the pigeon swarm algorithm, particle swarm algorithm, and hippo algorithm strategies can often reflect the key operating characteristics or control mechanisms in the model.
The periodic pressure fluctuation may correspond to the intermittent power input of wind power equipment, indicating that the gas grid is actively absorbing excess power through the power-to-gas equipment, and when the fluctuation phase difference is less than 15%, it can be judged as effective peak cutting and valley filling. As shown in Figure 9, the pressure regulation characteristics of the three algorithms in the gas grid nodes show significant differences: (1) PIO algorithm keeps the node pressure stable in the range of 29.2–30.2 bar, and the average fluctuation range within the 24 h operating cycle is only ±0.5%, showing excellent steady-state maintenance ability; (2) Although the PSO algorithm maintains the same pressure interval, its dynamic response has random disturbance of 0.8–1.2 Hz, and the instantaneous pressure fluctuation can reach 1.8 times of the reference value, exposing the defect of insufficient control stability; (3) The HOA presents a wide range of 20–70 bar pressure regulation, and realizes dynamic energy balance through periodic pressure oscillation (period 2.5 h ± 5%), and its pressure change curve presents a phase matching degree of 82.3% with the load demand of the P2G system. Compared with PIO and PSO, this algorithm has the technical advantage of 21.5% and 17.2% improvement in energy conversion dimension, respectively.
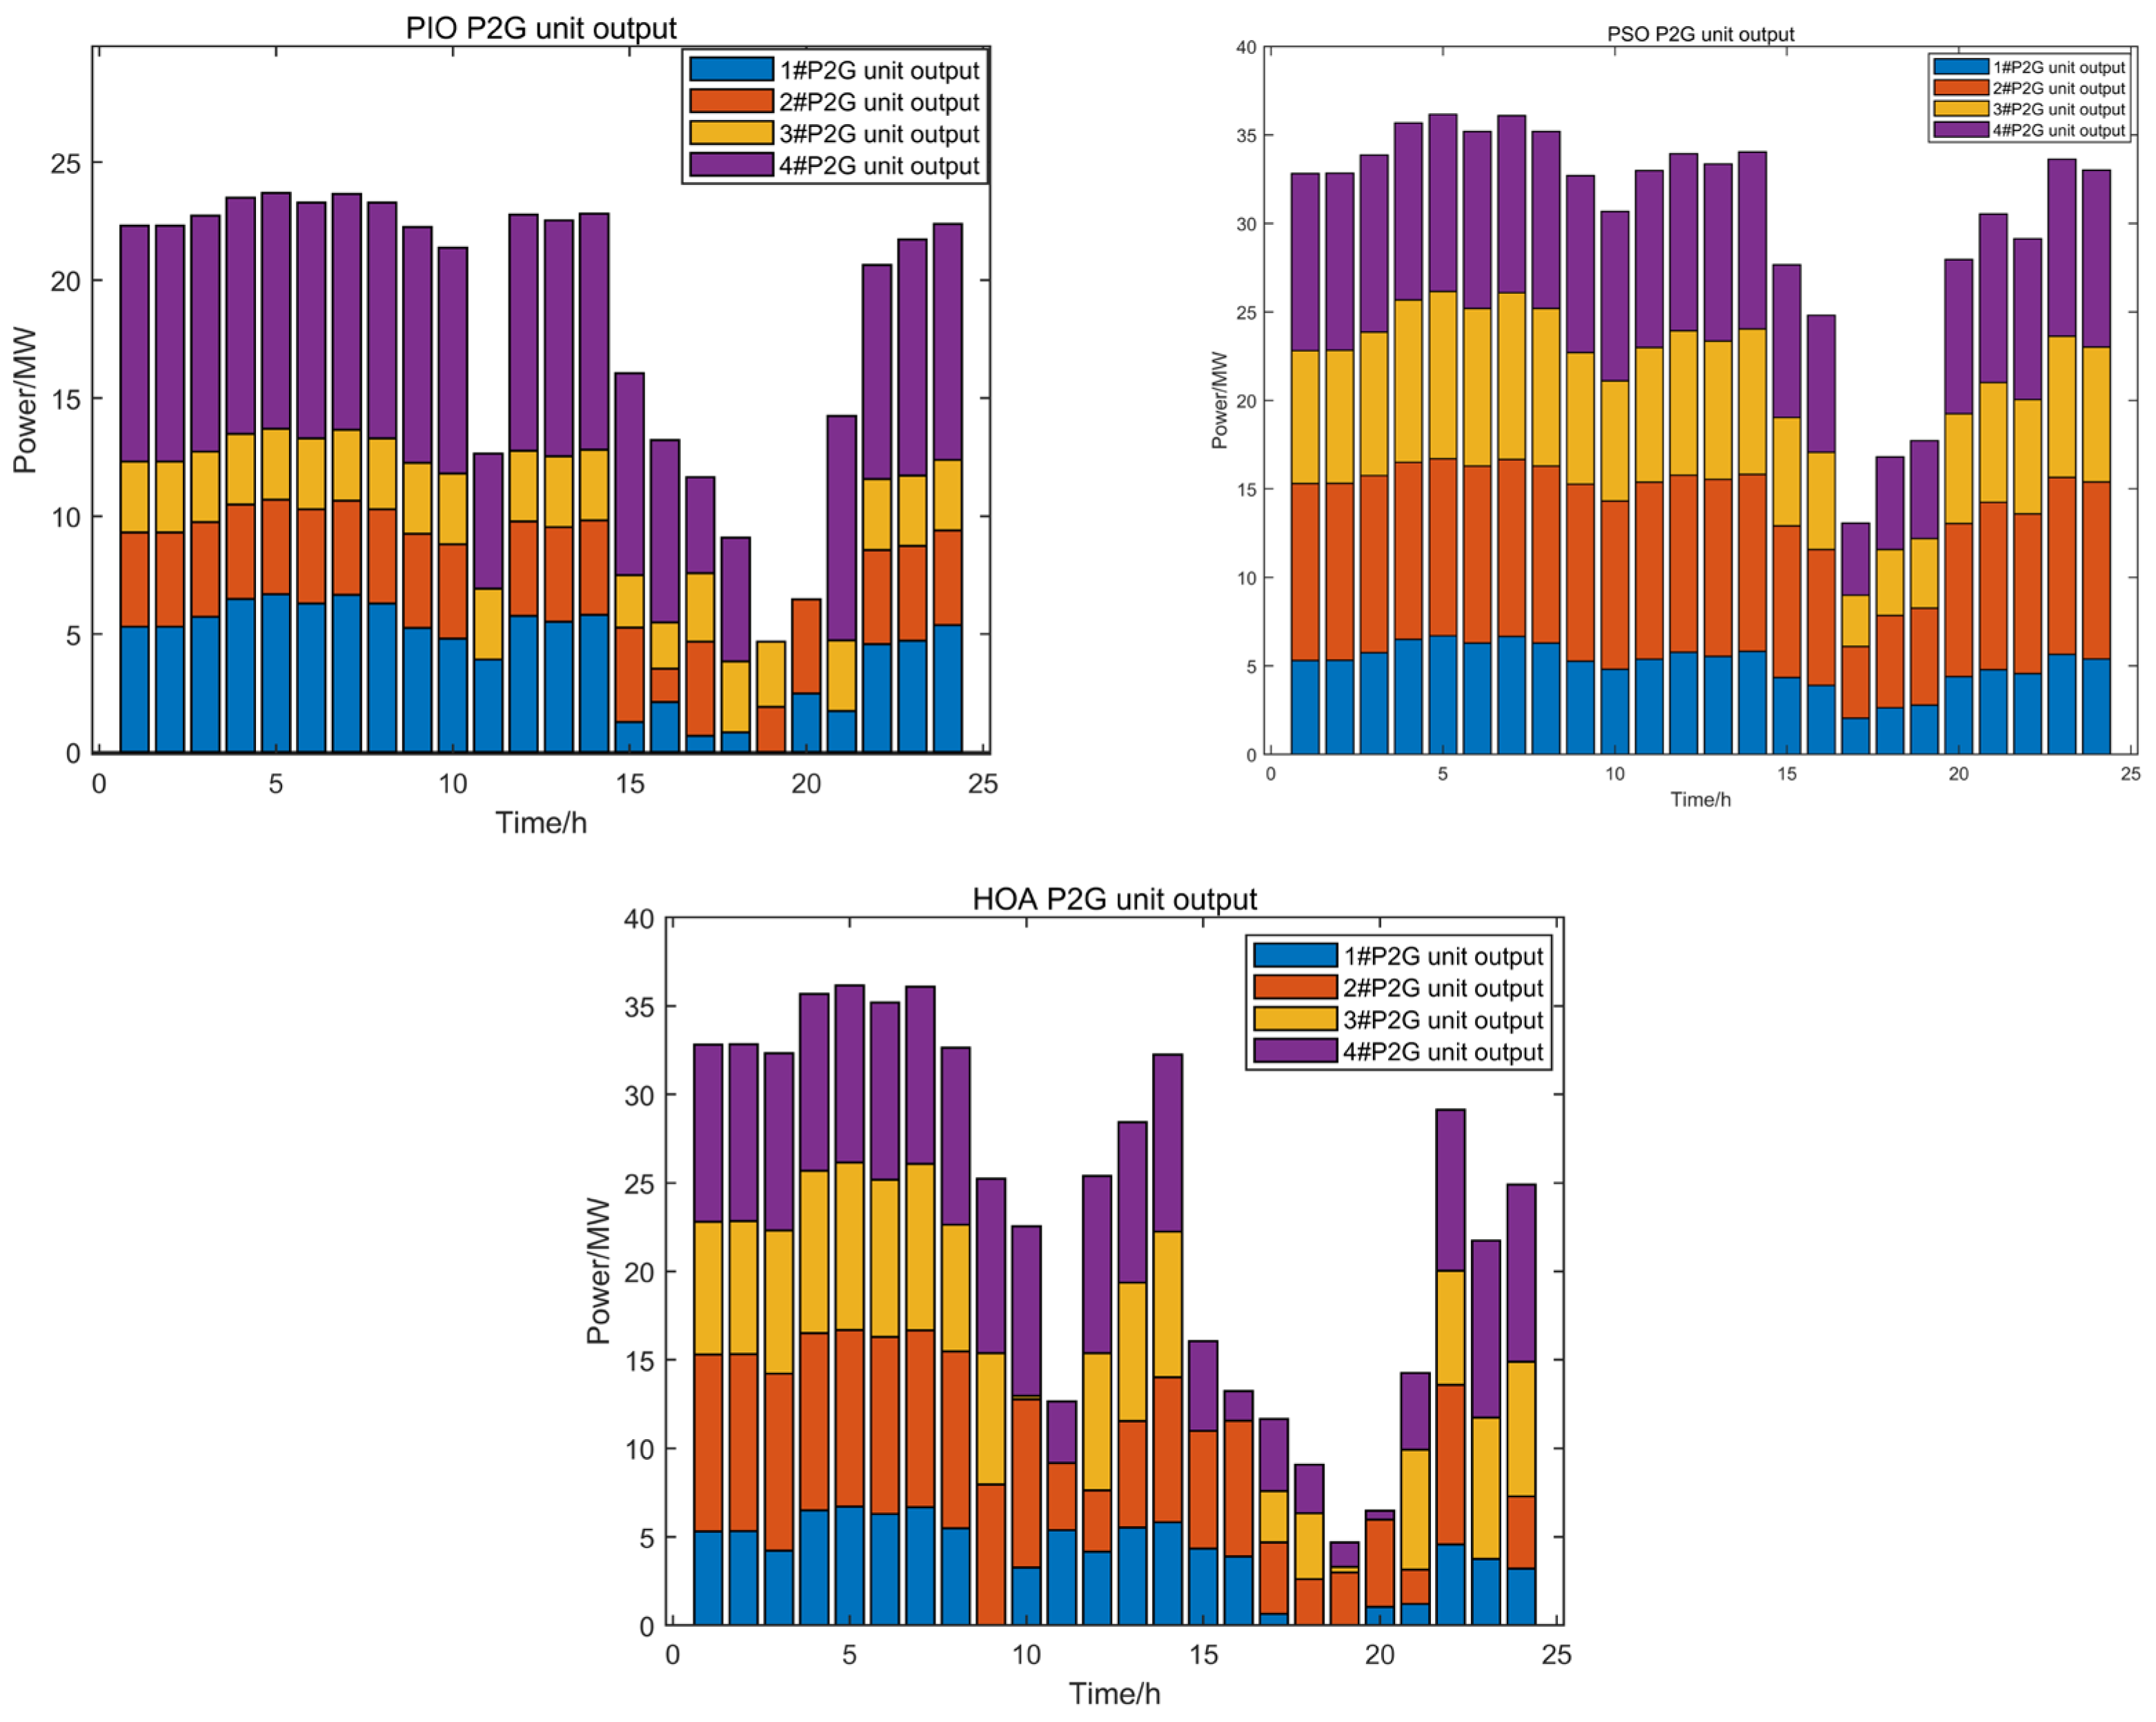
In the electric–gas–thermal integrated energy system, the output of P2G (power-to-gas) units is the core index reflecting the dynamic characteristics of multi-energy coupling. The output of P2G units based on the strategies of the pigeon swarm algorithm, particle swarm algorithm, and hippo algorithm is shown in Figure 10.
As can be seen in Figure 10, the P2G output of PIO and PSO is relatively stable, and the HOA strategy fluctuates greatly. In the strategy of HOA and PSO, the output power of the P2G unit is higher than that of PSO, and the peak value of PIO is maintained at about 23 MW, while the peak value of HOA and PSO is maintained at about 33 MW. The higher the output of P2G units, the more technical support it provides for large-scale power generation of renewable energy, and it can indirectly reduce the power consumption of fossil fuels and other fossil fuels. This technology strengthens the connection between the power system and the natural gas systems, helps realize coordinated and optimized operation of multi-energy system, and improves economic and social benefits [50]. It is proved which hippopotamus optimization algorithm is stronger than pigeon-inspired optimization algorithm in environmental protection and renewable energy utilization, and reduces carbon emissions by about 23%.
The branch power of the 24 h power system based on the strategies of Pigeon-inspired Optimization algorithm, particle swarm optimization algorithm and hippopotamus optimization algorithm is shown in Figure 11.
In Figure 11, we can observe that the power of each branch of the power system calculated by the three algorithms fluctuates roughly in the range of −0.3 MVA to 0.3 MVA. The power strategies of these algorithms show significant volatility throughout the day. In particular, the power of branches 1 to 10 gradually increases throughout the day, but the overall change trend is more stable. In addition, the power of all branches showed high stability, without violent fluctuations. It shows that the strategies of the three algorithms can ensure the smooth operation of the power system.
The output of wind turbines based on the strategies of pigeon-inspired optimization algorithm, particle swarm optimization algorithm, and hippopotamus optimization algorithm is shown in Figure 12.
It can be seen from Figure 12 that the PIO power varies in a wide range, from 0 to 12 MW, showing high volatility. The power curves of different wind turbines are obviously different, which indicates that the PIO algorithm may have some limitations when dealing with the cooperative work of multiple wind turbines. In some time periods, the power output of some units is close to zero, and there may be inefficiency problems. The PIO algorithm shows great fluctuation in power output and may not be suitable for scenarios requiring high stability. The PSO power range is small, from −0.5 to 3.5 MW, and the overall output is relatively stable. The power curves of different units are close to each other, which indicates that the PSO algorithm performs well in multi-unit cooperative work. During some time periods, the power output of some units is negative, and there may be energy feedback or efficiency problems. The PSO algorithm performs well in terms of stability, but the power output is low and may not be able to meet high power requirements. The HOA power range is moderate, from −2 to 12 MW, and the overall output is more balanced. The power curves of different units are consistent, which indicates that the HOA performs well in the cooperative work of multiple units. Most of the time, the power output is maintained at a high level, and the fluctuation is small, showing high efficiency and stability. HOA achieves a good balance between power output and stability, which is suitable for most application scenarios.
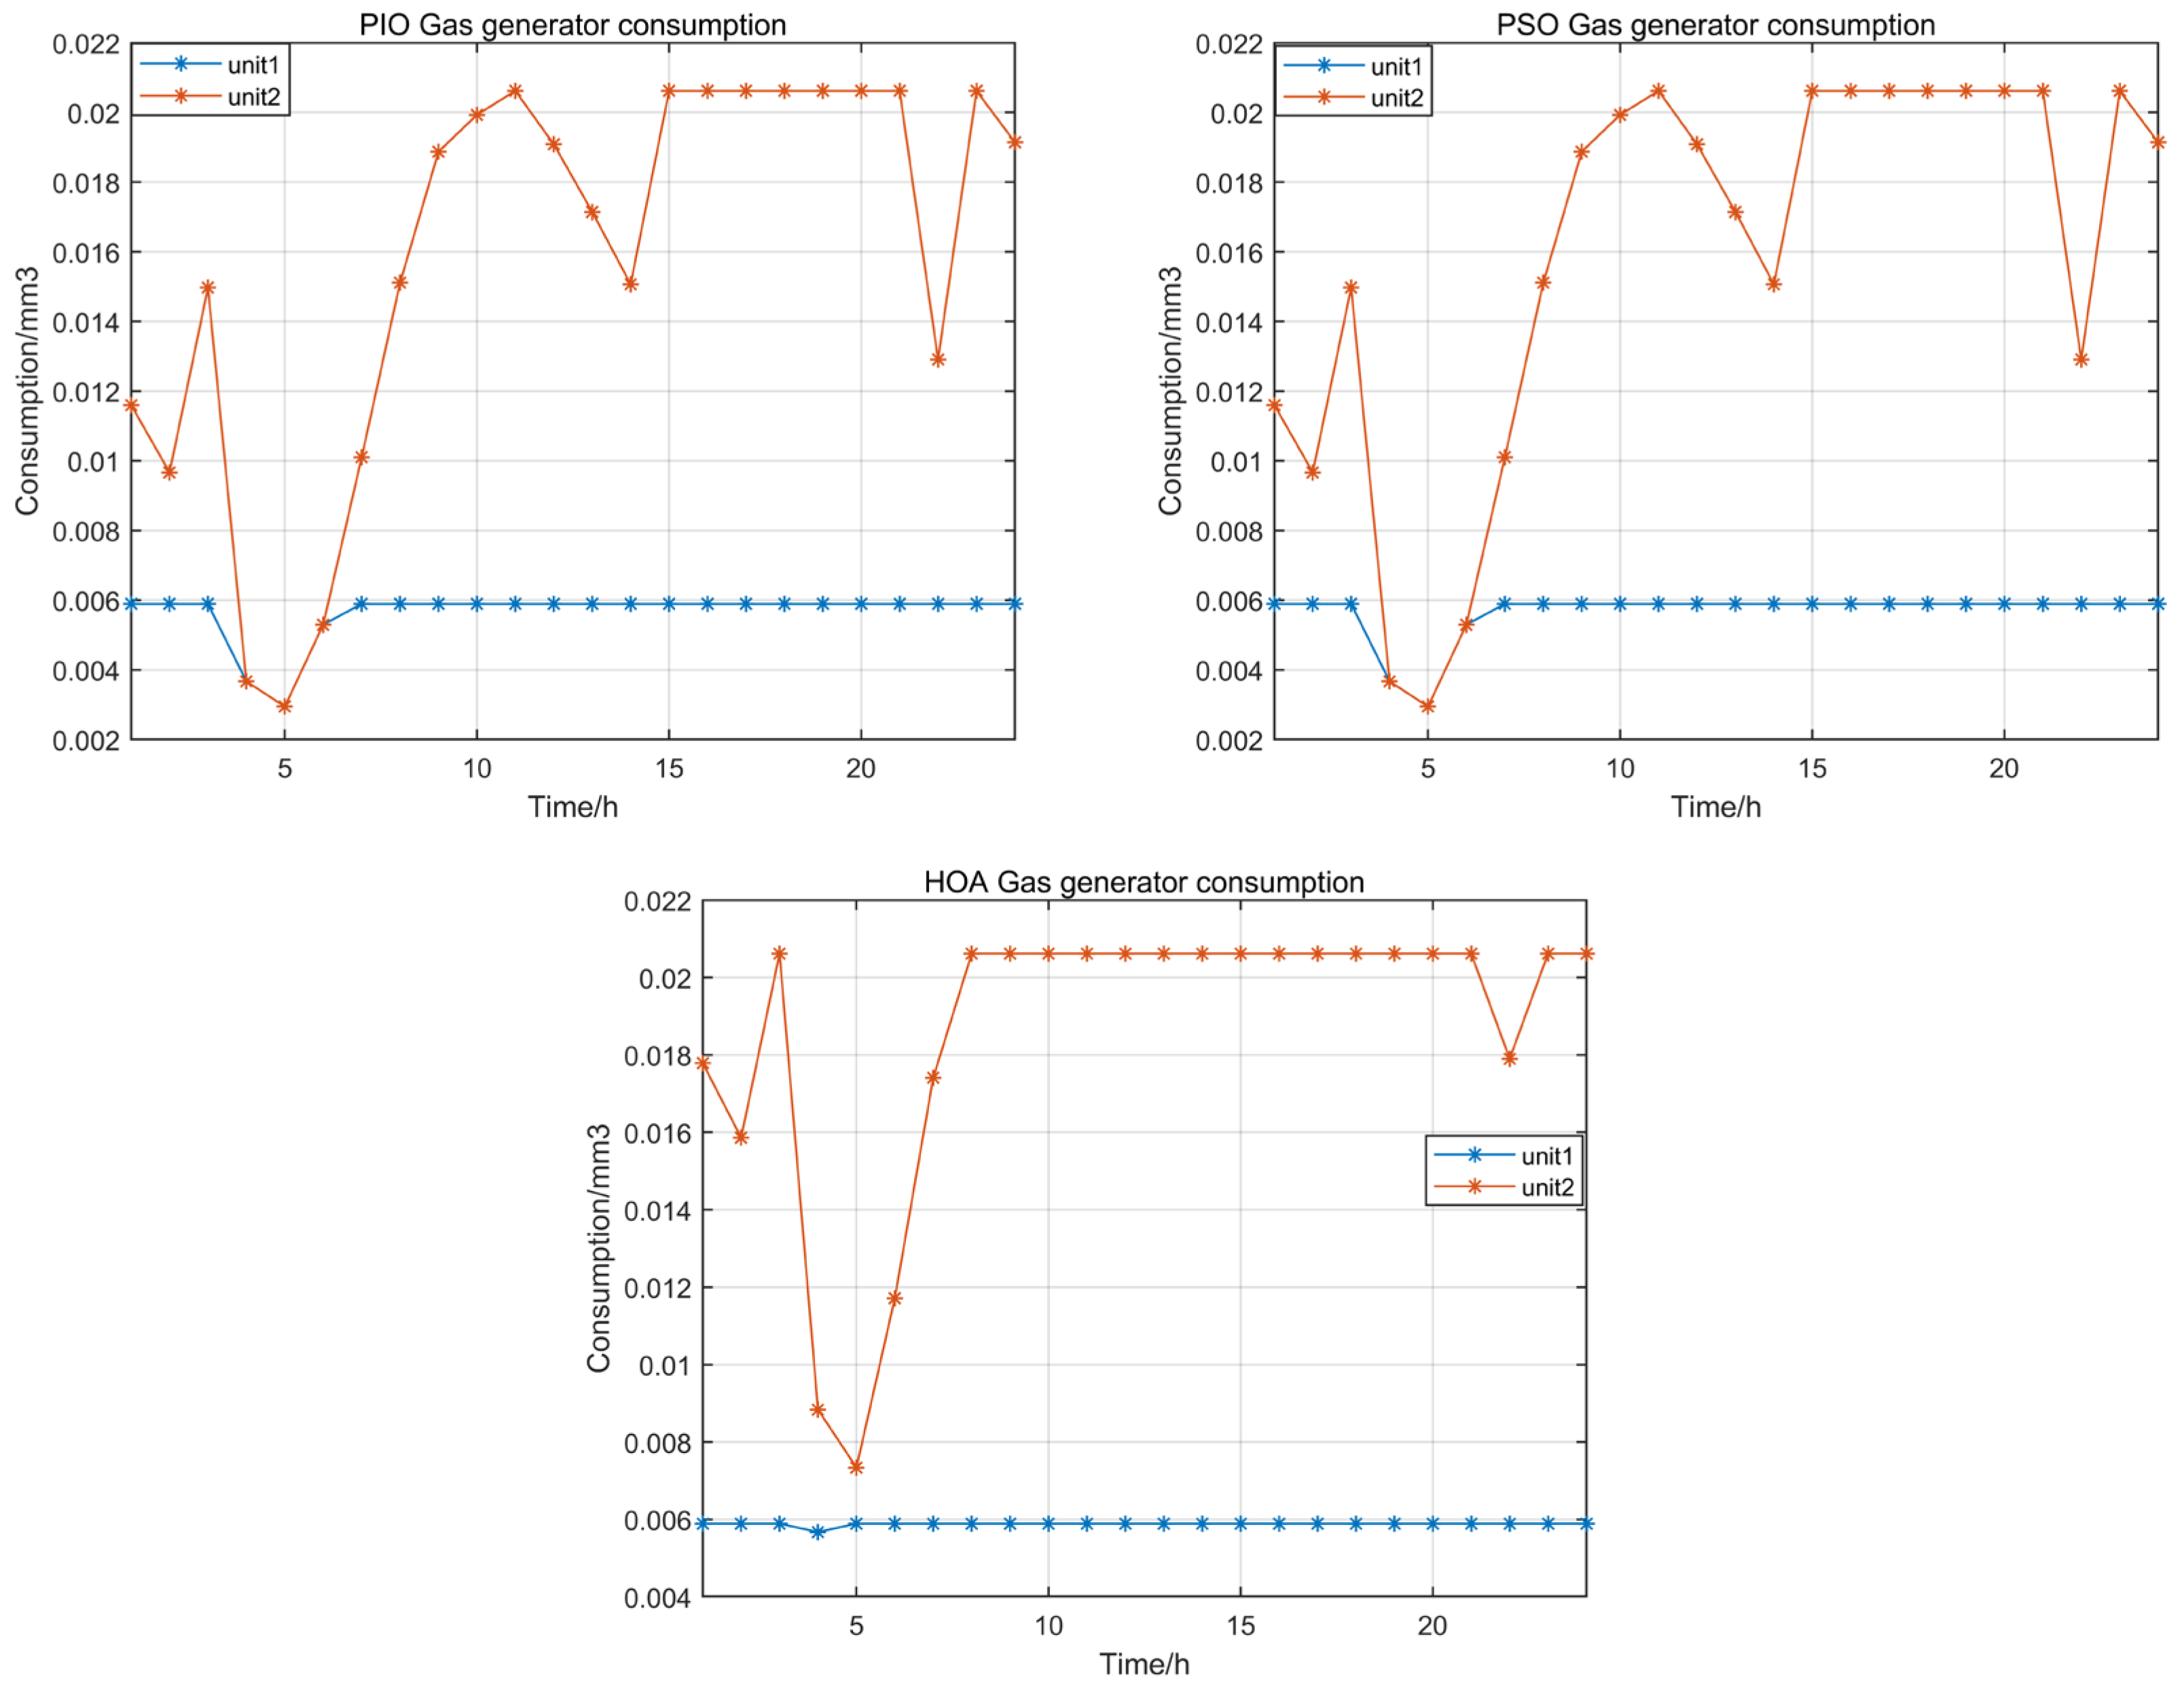
The gas consumption of a natural gas generator based on pigeon-inspired optimization algorithm, particle swarm optimization algorithm, and the hippopotamus optimization algorithm is shown in Figure 13.
It can be seen from Figure 13 that at the same time of day, the gas consumption of HOA natural gas generator is higher than that of the other two algorithms at the same time of day. The gas consumption of the HOA unit 1 is stable at 0.006 mm3, while the gas consumption of unit 2 is stable at 0.0205 mm3 after 8 h, although it fluctuates significantly. The other two algorithm units 1 also stabilized at 0.006 mm3, but reached the lowest value of 0.003 mm3 at 5 h. The gas consumption of unit 2 fluctuated frequently, floating between 0.003 and 0.019 mm3 before 8 h, and then became more stable. It can be seen that HOA strategy is more inclined to use natural gas for power generation, and natural gas is a clean energy, indicating that HOA strategy pays more attention to the use of clean energy to achieve the effect of environmental protection.
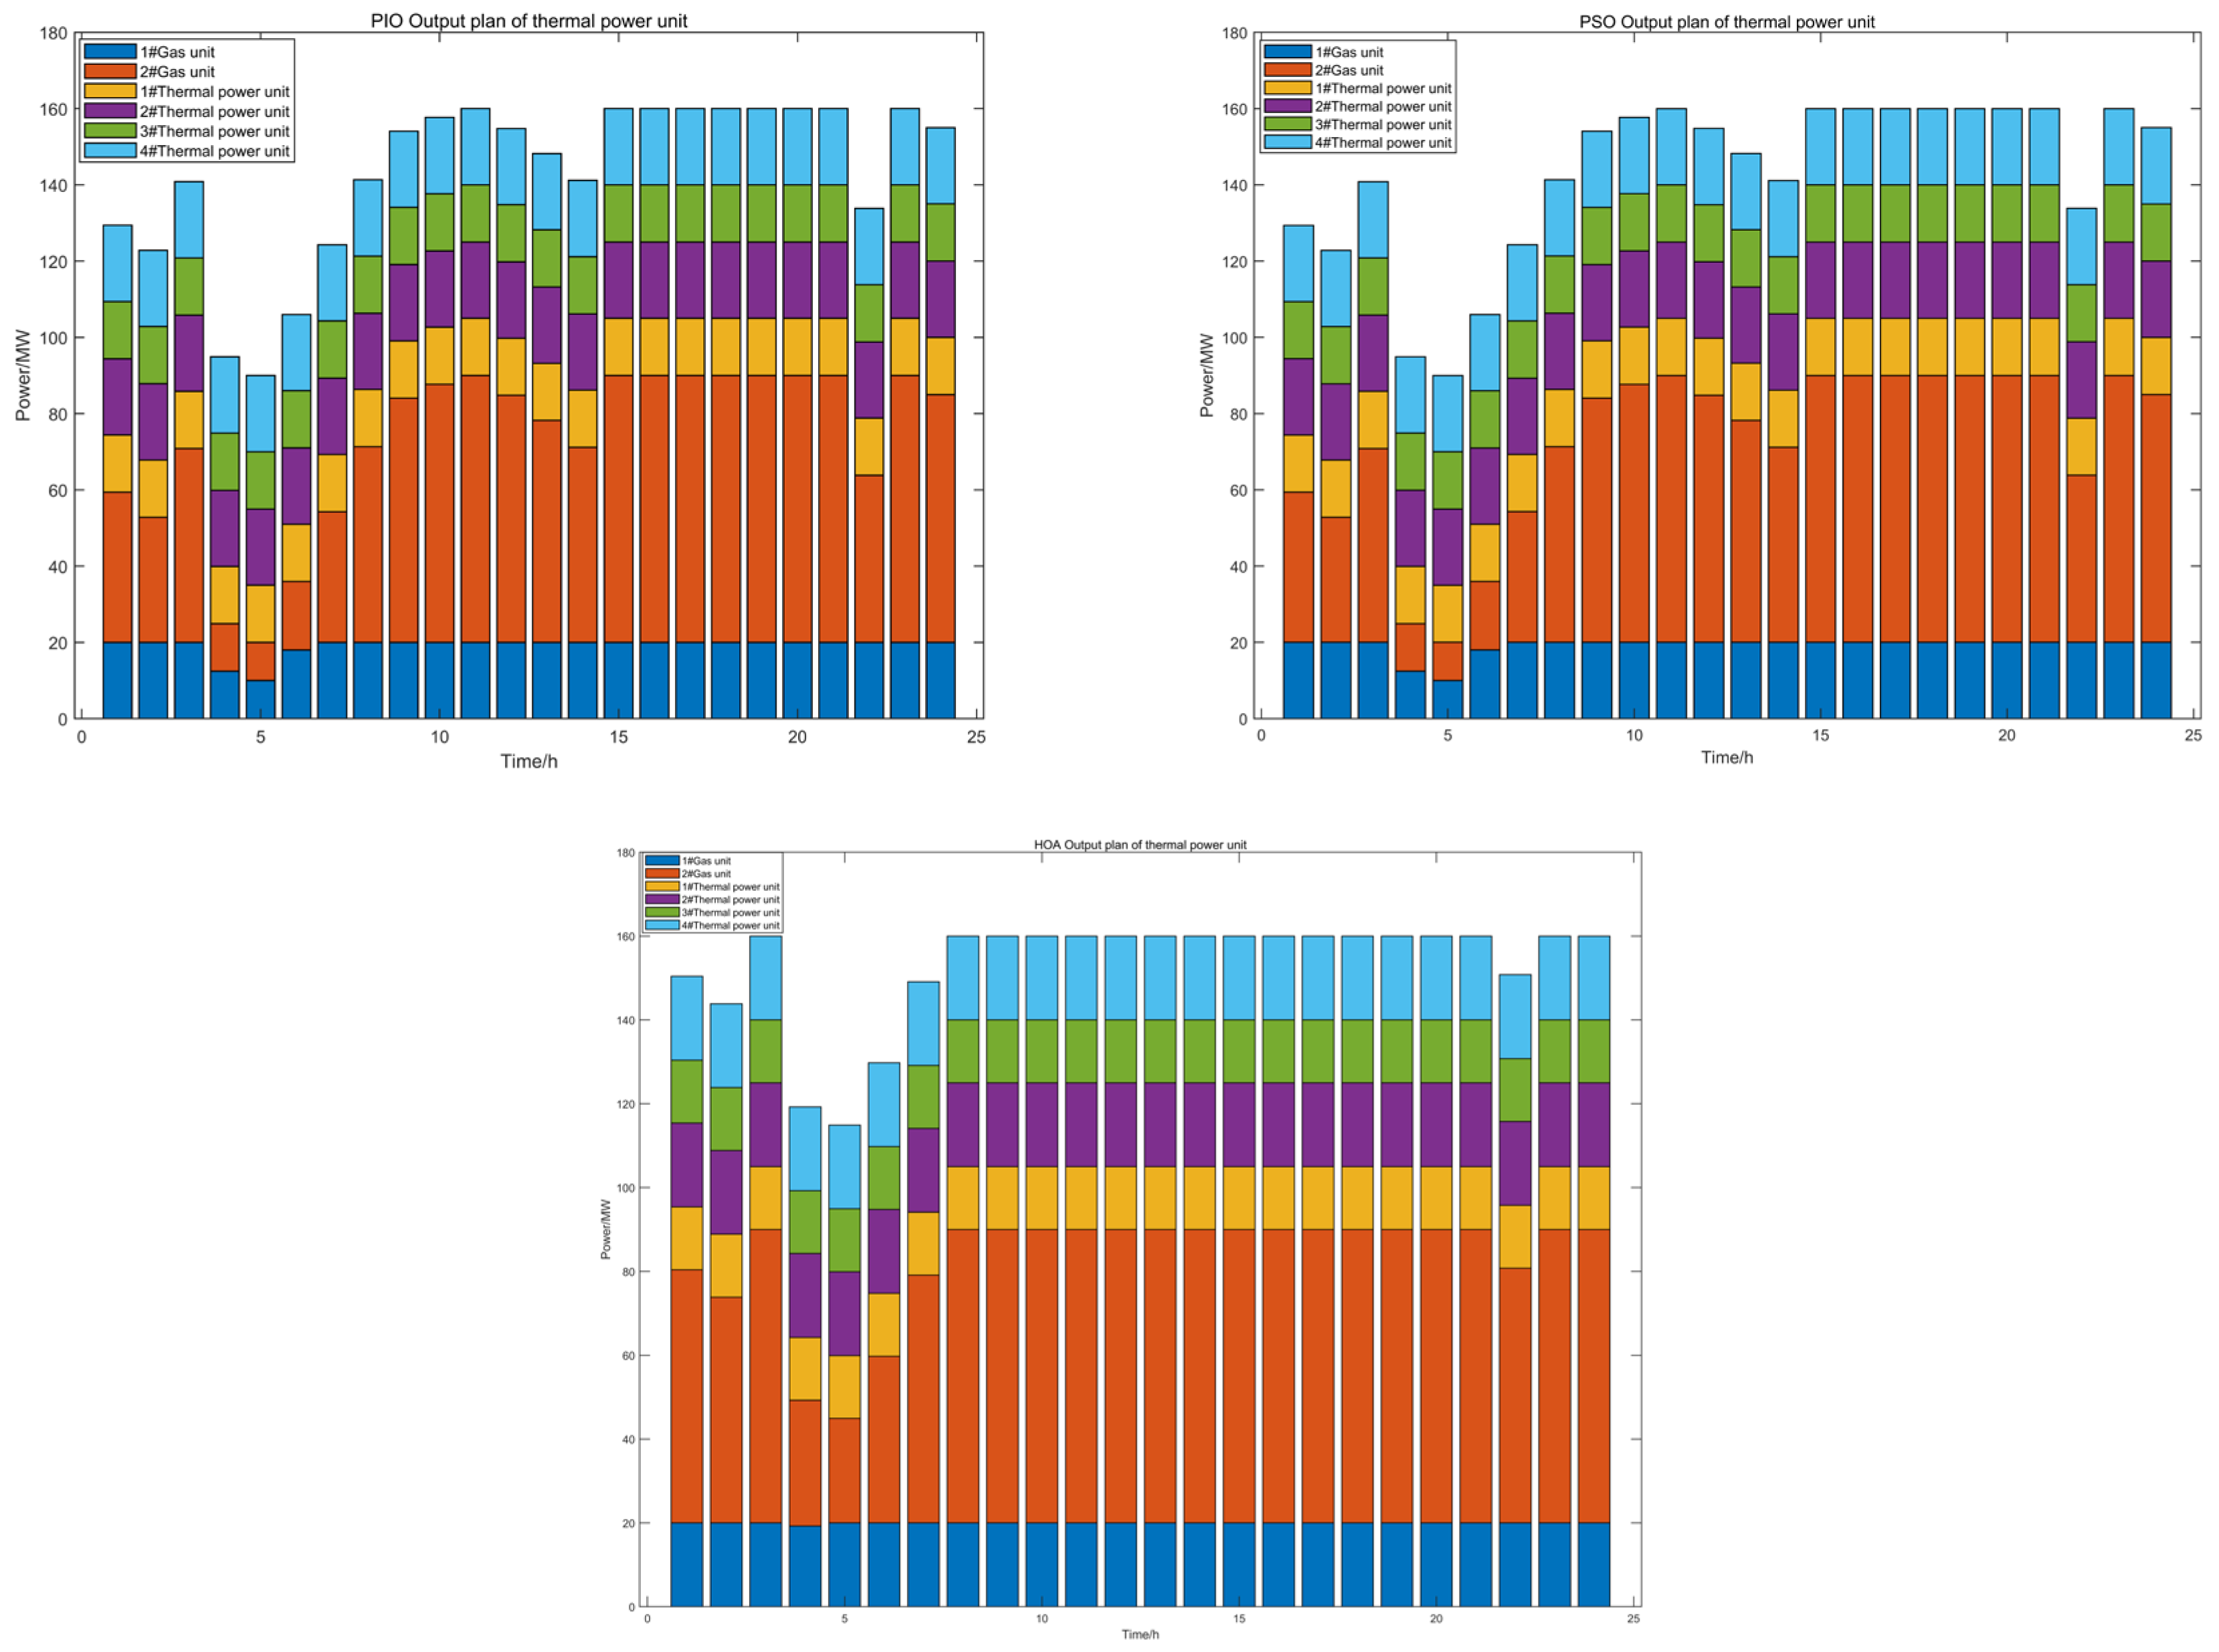
The output of thermal power units based on pigeon-inspired optimization algorithm, particle swarm optimization algorithm and Hippopotamus optimization algorithm is shown in Figure 14.
From Figure 14, we can clearly see that the output situation of the thermal power unit of PIO and PSO algorithm strategies is basically the same. Before 10 h, the output power of the thermal power unit fluctuated between 90 and 150 MW, which fluctuated greatly during this period, and then stabilized at about 160 MW. In HOA, the output power fluctuated between 115 and 160 MW before 10 h, and then stabilized at 160 MW. These data show that the HOA strategy invests more in the output of thermal power units than the other two algorithms.
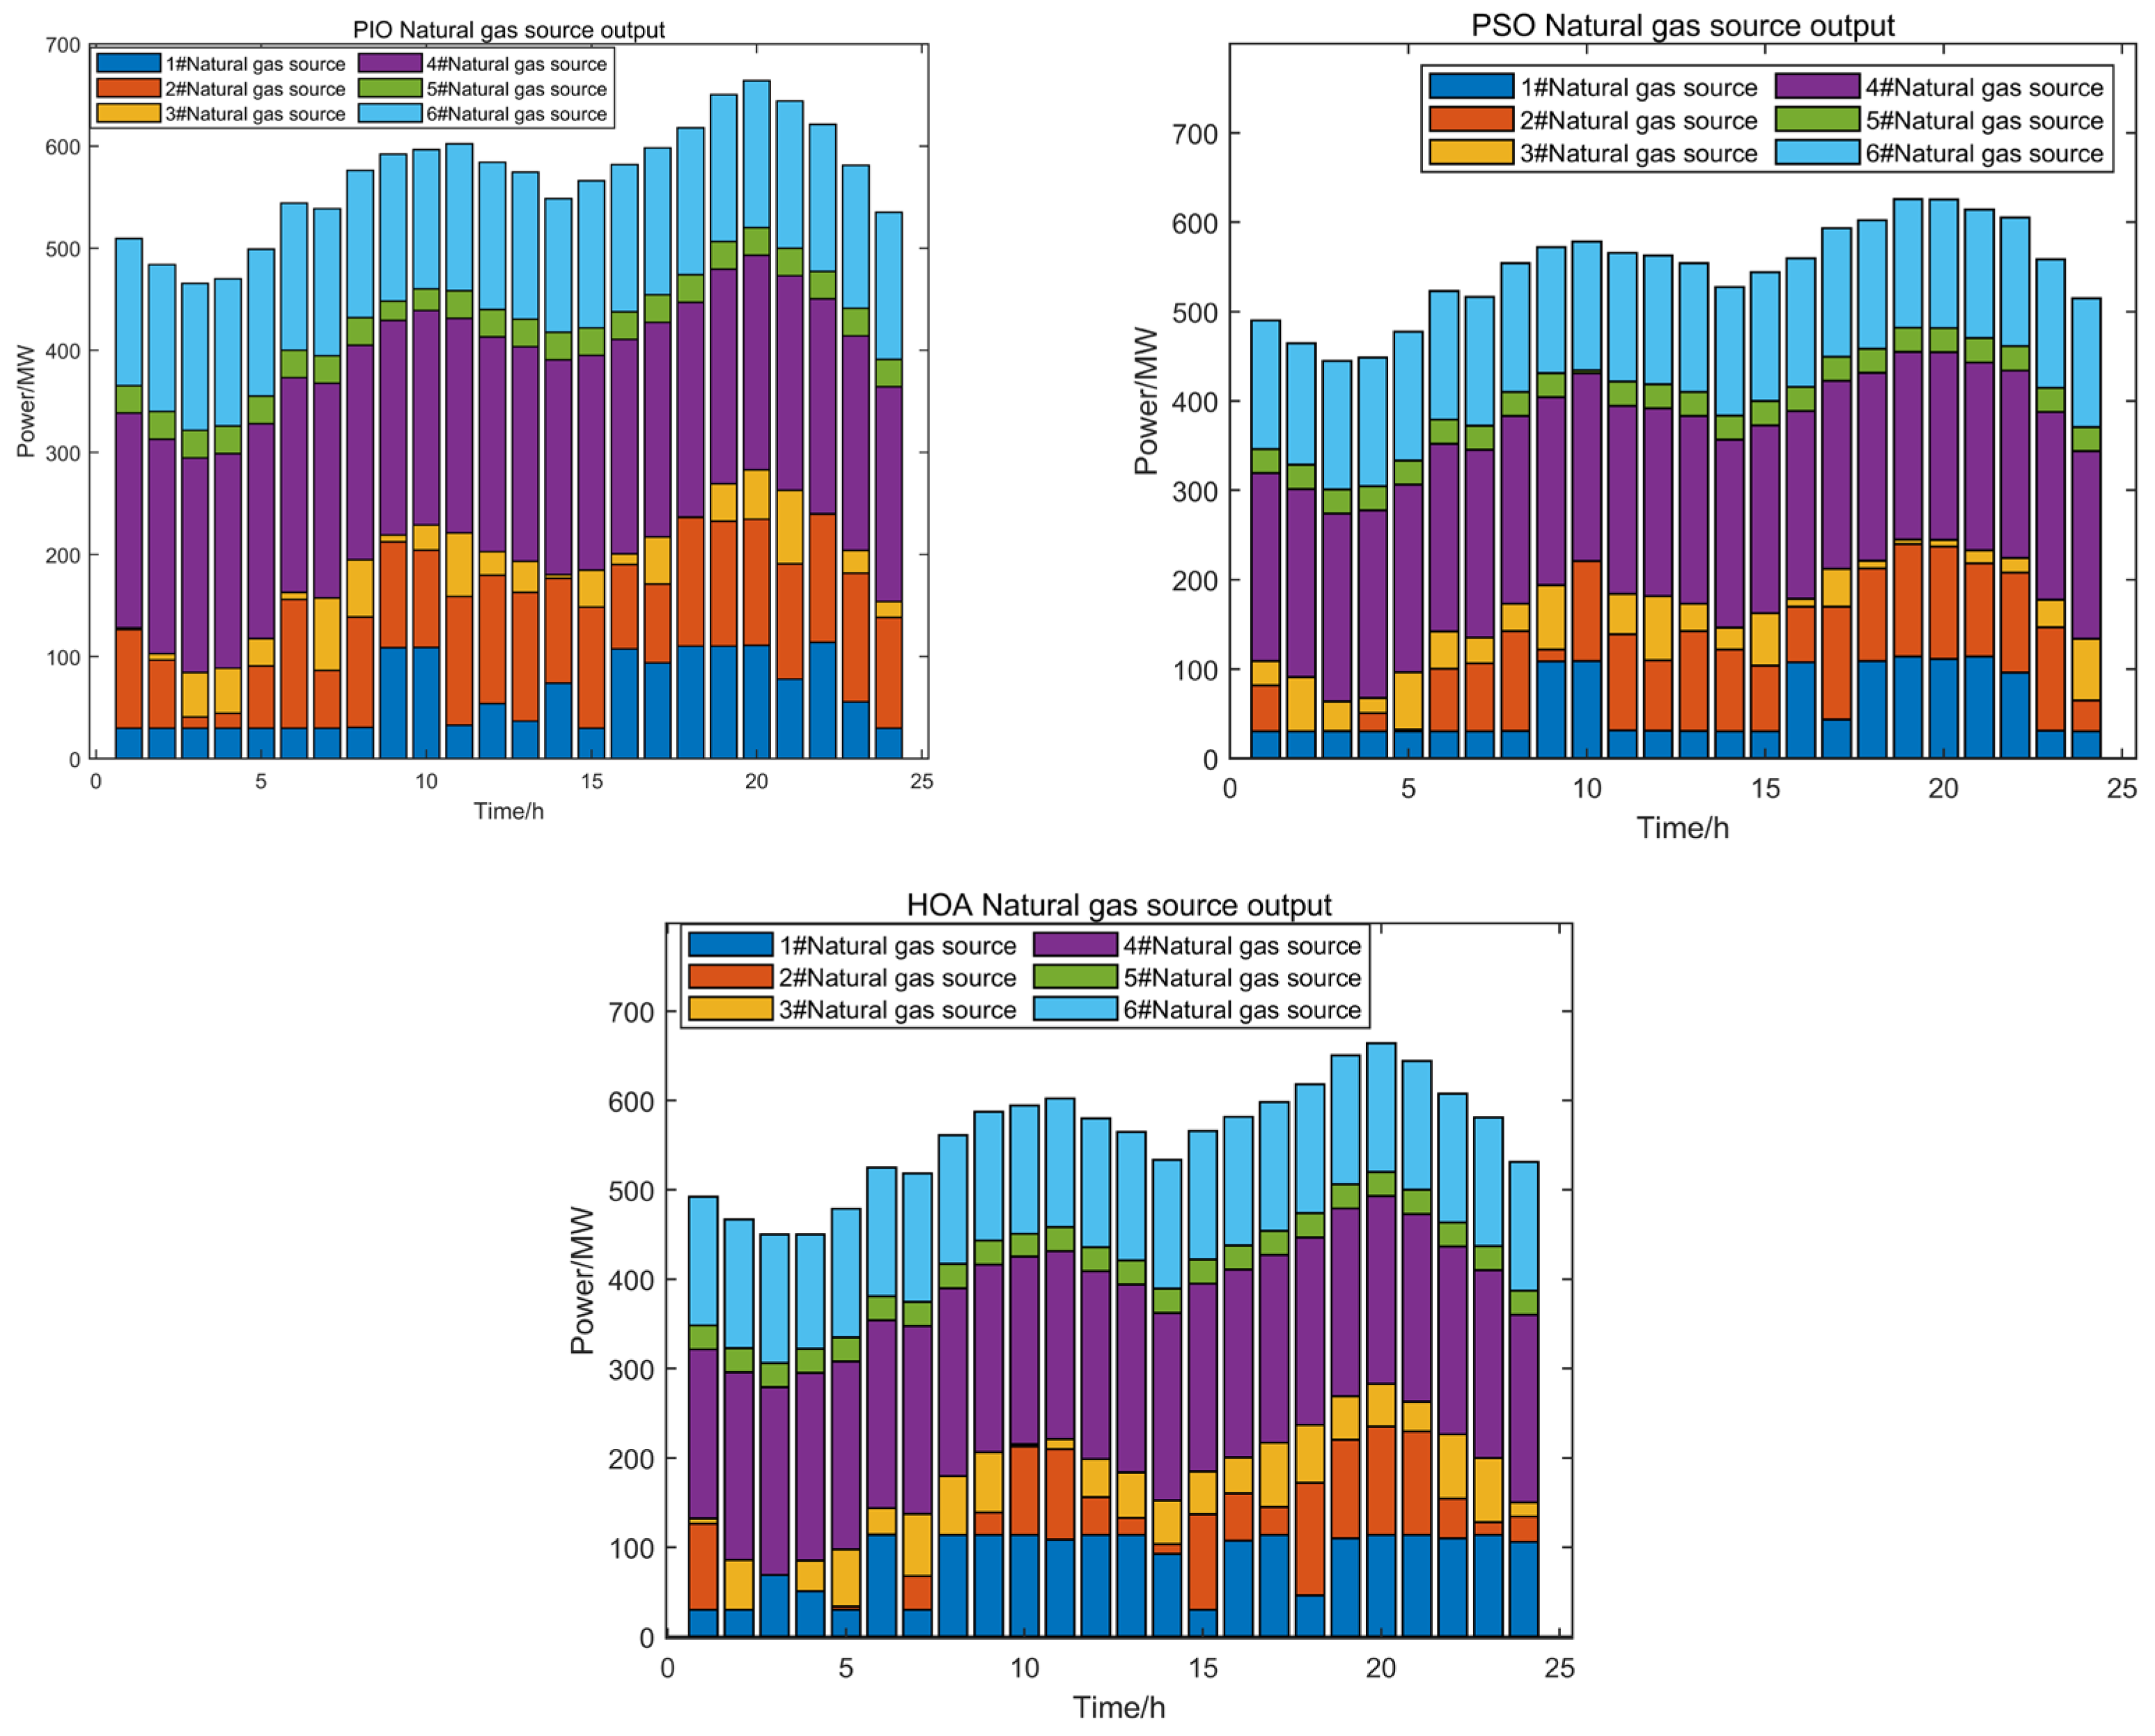
The output of natural gas sources based on pigeon-inspired optimization algorithm, particle swarm optimization algorithm and hippopotamus optimization algorithm is shown in Figure 15.
As can be seen from Figure 15, the output power distribution of all natural gas sources under the PIO algorithm strategy is relatively uniform. Especially in the early period, the output of all gas sources is relatively stable, with an average value of about 600 MW and the highest value reaching 650 MW in 20 h. PSO algorithm strategy—natural gas source output is relatively low, the average value is about 570 MW, and the highest value reaches 600 MW in 20 h. HOA is similar to PIO algorithm, with an average value of 585 MW and a maximum value of 640 MW. It can be seen that HOA has a high utilization rate of clean energy natural gas.
From the above experimental results, we can know that the hippo optimization algorithm in this case is better than the pigeon swarm algorithm and particle swarm algorithm in some aspects; its excellent performance is mainly reflected in the energy utilization rate increasing by 16.3% and carbon emissions reducing by about 23%, and the objective function of the cost optimization result is lower than the pigeon swarm algorithm and particle swarm algorithm. By about 1.5%. In most other data, the strategies of these algorithms are nearly the same.

4.2.3. Payback Period Analysis

(1)
Investment cost composition and annualisation.
The total capital expenditure (CAPEX) in this study comprises the following items: P2G equipment (electrolyzer, rectifier), CHP/boilers, compressors and auxiliary equipment, gas/heat pipelines. To align with the annual operating cost boundary, CAPEX is annualized using the capital recovery factor (CRF) as follows:
C R F r , n = r 1 + r n 1 + r n 1
C A P E X a n n = C A P E X × C R F r , n
Here r denotes the discount rate and n the asset lifetime (years). All annual costs in this subsection are accounted for under the same pricing year and system boundary.
(2)
Based on the data in Table 8, the investment cost of HOA increased by Δ I = I H O A I P I O = 19,208,000 yuan compared with PIO, while the annual operational cost saving is 4.85 × 10⁸ yuan/year. Substituting into the formula yields the following:
T P B P = Δ I Δ C a n n u a l 0.0396   y e a r
The results indicate that the additional investment in HOA can be recovered within approximately 0.0396 years, which is far shorter than the typical system lifetime of 15–20 years. Therefore, the investment in HOA is reasonable and economically feasible.

4.3. Limitations and Scope of Applicability

4.3.1. Limitations

This study adopts a pragmatic modeling boundary and several standard simplifications. Minor auxiliary self-consumption (e.g., compressors, pumps, controls) is not explicitly modeled in the base case; this choice may lead to a slight underestimation of absolute operating cost and emissions, while leaving the qualitative comparison among methods unchanged in typical engineering settings. In addition, unit characteristics are represented with steady-state or part-load approximations, and the analysis is conducted at an hourly resolution for a representative day. These assumptions favor tractability and transparency but can understate cycling losses and long-term variability. Future work will incorporate metered auxiliary profiles, start/stop dynamics, and multi-year datasets to further consolidate the findings.

4.3.2. Scope of Applicability

The approach and conclusions hold under the modeling boundary, operating conditions and parameter ranges considered in this paper, and are most relevant to planning-oriented studies at hourly resolution. When transferring the framework to other regions or to larger networks, key drivers such as price and emission factors should be re-calibrated, and gas-network dynamics (e.g., linepack and compressor maps) may be required if short-term ramping is critical. With these adjustments, the framework remains applicable and informative for integrated electricity–gas systems.

4.4. Chapter Summary

This chapter validates the effectiveness of the proposed model and HOA using a typical integrated electric–gas–heat energy system case study. Comparative results with PSO and PIO demonstrate that HOA achieves superior performance in terms of operating cost, carbon emissions, and energy utilization efficiency. Furthermore, sensitivity analyses and convergence curve comparisons are presented, confirming the stability and adaptability of HOA. Overall, the results indicate that HOA effectively balances economic and low-carbon objectives, showing strong potential for practical applications in integrated energy system optimization. These limitations delineate the bounds within which our findings are most informative; future work will incorporate metered auxiliary loads and multi-year temporal datasets to enhance external validity.

5. Conclusions

This study applied the hippopotamus optimization algorithm (HOA) to multiobjective scheduling of an integrated electricity–gas–thermal system. Under an aligned model, parameterization, constraints, scenario set, and computational budget, HOA was benchmarked against pigeon swarm optimization (PIO) and particle swarm optimization (PSO). Within this controlled setting, HOA produced higher-quality solutions and more stable performance across scenarios, achieving on average ≈ 1.5% lower annual total system cost, ≈16.3% improvement in the system-level energy-efficiency index (as defined in this study), and ≈23% reduction in operational CO2 emissions. These results indicate that, for the stated test system and evaluation protocol, HOA offers a practical and computationally efficient approach to balancing cost, efficiency, and emissions in a complex, nonlinear IES.
The scalability of HOA on very large systems is constrained primarily by the cost of fitness evaluation. As spatial resolution, temporal horizon, and unit-commitment-type constraints grow, runtime can increase sharply even with efficient solver settings; practical deployment therefore depends on parallel hardware and careful engineering. Mitigation paths include problem decomposition and warm starts (spatial/temporal decomposition, Lagrangian or Benders-type coordination), surrogate or incremental fitness evaluation (reduced-order or learning-based models), adaptive population and early-stopping strategies, and distributed/heterogeneous parallelization (multi-core/GPU/cluster).
Overall, HOA shows promise for broader multiobjective energy-system optimization. Future work will (i) extend to larger and more heterogeneous IES, (ii) incorporate uncertainty via chance-constrained, stochastic, or robust formulations, (iii) examine sensitivity to key economic/technical parameters, (iv) consider degradation-aware/maintenance proxies for cycling and ramping, and (v) explore hybridization with machine learning (e.g., surrogate modeling and policy initialization) to further improve performance and ease real-world deployment.

Author Contributions

Conceptualization, K.H.; Methodology, K.H.; Software, L.L.; Validation, L.L.; Formal analysis, Q.Y.; Investigation, Y.F.; Resources, Y.F.; Data curation, Q.Y.; Writing—original draft, L.L.; Writing—review & editing, K.H.; Visualization, Q.Y.; Supervision, B.W.; Project administration, K.H.; Funding acquisition, B.W. All authors have read and agreed to the published version of the manuscript.

Funding

This research was supported by the Baima Lake Laboratory Joint Fund of the Zhejiang Provincial Natural Science Foundation of China (Grant No. LBMHY25E060007), the Education Science Planning Project of Zhejiang Province, China (Grant No. 2024SCG026), Collaborative Education Project of the Ministry of Education, China (Grant No. 231004994121114), Teaching Construction and Reform Project (2024) at Hangzhou Normal University, China (Research on Smart Teaching Reform Based on Digital Twins), “Artificial Intelligence+” Course Construction Project (2025) at Hangzhou Normal University, China (Digital Twin Technology and Applications).

Institutional Review Board Statement

Not applicable.

Informed Consent Statement

Not applicable.

Data Availability Statement

The original contributions presented in this study are included in the article. Further inquiries can be directed to the corresponding authors.

Conflicts of Interest

The authors declare no conflicts of interest.

References

  1. Zhang, M.; Wang, J.; Zhi, H.; Zhao, J.; Chang, X.; Zhang, S.; Guo, X.; Wang, T. An Integrated Electricity–Gas–Heat Energy System Based on the Synergy of Long-and Short-Term Energy Storage. Energies 2025, 18, 55. [Google Scholar] [CrossRef]
  2. Amiri, M.H.; Mehrabi Hashjin, N.; Montazeri, M.; Mirjalili, S.; Khodadadi, N. Hippopotamus optimization algorithm: A novel nature-inspired optimization algorithm. Sci. Rep. 2024, 14, 5032. [Google Scholar] [CrossRef] [PubMed]
  3. Faisal, S.; Gao, C. A Comprehensive Review of Integrated Energy Systems Considering Power-to-Gas Technology. Energies 2024, 17, 4551. [Google Scholar] [CrossRef]
  4. Zhang, Y.; Li, J.; Ji, X.; Yang, M.; Ye, P. Optimal scheduling of electricity–gas–heat integrated energy system with coordination of flexibility and reliability. Sustain. Energy Technol. Assess. 2024, 71, 103968. [Google Scholar] [CrossRef]
  5. Clegg, S.; Mancarella, P. Integrated modeling and assessment of the operational impact of power-to-gas (P2G) on electrical and gas transmission networks. IEEE Trans. Sustain. Energy 2015, 6, 1234–1244. [Google Scholar] [CrossRef]
  6. Qin, L.; Ma, H.; Huang, C.; Li, H.; Wu, S.; Wang, G. Low-carbon operation optimization of integrated energy system considering CCS-P2G and multi-market interaction. Front. Energy Res. 2024, 11, 1337164. [Google Scholar] [CrossRef]
  7. Fambri, G.; Diaz-Londono, C.; Mazza, A.; Badami, M.; Weiss, R. Power-to-Gas in gas and electricity distribution systems: A comparison of different modeling approaches. J. Energy Storage 2022, 55, 105454. [Google Scholar] [CrossRef]
  8. Alizad, E.; Rastegar, H.; Hasanzad, F. Dynamic planning of Power-to-Gas integrated energy hub considering demand response programs and future market conditions. Int. J. Electr. Power Energy Syst. 2022, 143, 108503. [Google Scholar] [CrossRef]
  9. Tao, J.; Duan, J.; Tuo, L.; Gao, Q.; Tian, Q.; Lu, W. Exergy efficiency based multi-objective configuration optimization of energy hubs in the multi-energy distribution system. Energy 2025, 329, 136554. [Google Scholar] [CrossRef]
  10. Ming, M.; Wang, R.; Zha, Y.; Zhang, T. Multi-objective optimization of hybrid renewable energy system using an enhanced multi-objective evolutionary algorithm. Energies 2017, 10, 674. [Google Scholar] [CrossRef]
  11. Zhang, Z. Multi-objective optimization method for building energy-efficient design based on multi-agent-assisted NSGA-II. Energy Inform. 2024, 7, 90. [Google Scholar] [CrossRef]
  12. Mokaramian, E.; Shayeghi, H.; Younesi, A.; Shafie-Khah, M.; Siano, P. Energy hubs components and operation: State-of-the-art review. Renew. Sustain. Energy Rev. 2025, 212, 115395. [Google Scholar] [CrossRef]
  13. Ghaemifard, S.; Ghannadiasl, A. A comparison of metaheuristic algorithms for structural optimization: Performance and efficiency analysis. Adv. Civ. Eng. 2024, 2024, 2054173. [Google Scholar] [CrossRef]
  14. Zhang, J.; Kong, X.; Shen, J.; Sun, L. Day-ahead optimal scheduling of a standalone solar-wind-gas based integrated energy system with and without considering thermal inertia and user comfort. J. Energy Storage 2023, 57, 106187. [Google Scholar] [CrossRef]
  15. Shang, K.; Ishibuchi, H.; He, L.; Pang, L.M. A survey on the hypervolume indicator in evolutionary multiobjective optimization. IEEE Trans. Evol. Comput. 2020, 25, 1–20. [Google Scholar] [CrossRef]
  16. Wang, Z.; Younesi, A.; Liu, M.V.; Guo, G.C.; Anderson, C.L. AC optimal power flow in power systems with renewable energy integration: A review of formulations and case studies. IEEE Access 2023, 11, 102681–102712. [Google Scholar] [CrossRef]
  17. Mirzaei, M.A.; Oskouei, M.Z.; Mohammadi-Ivatloo, B.; Loni, A.; Zare, K.; Marzband, M.; Shafiee, M. Integrated energy hub system based on power-to-gas and compressed air energy storage technologies in the presence of multiple shiftable loads. IET Gener. Transm. Distrib. 2020, 14, 2510–2519. [Google Scholar] [CrossRef]
  18. Mao, Y.; Cai, Z.; Jiao, X.; Long, D. Multi-timescale optimization scheduling of integrated energy systems oriented towards generalized energy storage services. Sci. Rep. 2025, 15, 8549. [Google Scholar] [CrossRef]
  19. Wang, L. Building Energy Efficiency Design and Energy Consumption Analysis Based on MOEA/D Algorithm. IEEE Access 2024, 12, 187313–187328. [Google Scholar] [CrossRef]
  20. Fambri, G.; Diaz-Londono, C.; Mazza, A.; Badami, M.; Sihvonen, T.; Weiss, R. Techno-economic analysis of Power-to-Gas plants in a gas and electricity distribution network system with high renewable energy penetration. Appl. Energy 2022, 312, 118743. [Google Scholar] [CrossRef]
  21. Ma, Y.; Wang, H.; Hong, F.; Yang, J.; Chen, Z.; Cui, H.; Feng, J. Modeling and optimization of combined heat and power with power-to-gas and carbon capture system in integrated energy system. Energy 2021, 236, 121392. [Google Scholar] [CrossRef]
  22. Fan, G.; Peng, C.; Wang, X.; Wu, P.; Yang, Y.; Sun, H. Optimal scheduling of integrated energy system considering renewable energy uncertainties based on distributionally robust adaptive MPC. Renew. Energy 2024, 226, 120457. [Google Scholar] [CrossRef]
  23. Alonso, A.M.; Costa, D.; Messagie, M.; Coosemans, T. Techno-economic assessment on hybrid energy storage systems comprising hydrogen and batteries: A case study in Belgium. Int. J. Hydrogen Energy 2024, 52, 1124–1135. [Google Scholar] [CrossRef]
  24. Liang, T.; Zhang, X.; Tan, J.; Jing, Y.; Liangnian, L. Deep reinforcement learning-based optimal scheduling of integrated energy systems for electricity, heat, and hydrogen storage. Electr. Power Syst. Res. 2024, 233, 110480. [Google Scholar] [CrossRef]
  25. Wang, W.; Tian, J. An improved hippopotamus optimization algorithm utilizing swarm-elite learning mechanism’s levy flight and quadratic interpolation operators for optimal parameters extraction in photovoltaic models. In Proceedings of the International Conference on Intelligent Computing, Tianjin, China, 5–8 August 2024; Springer Nature: Singapore, 2024; pp. 264–277. [Google Scholar]
  26. Zhang, Y.; Zhang, P.; Du, S.; Dong, H. Economic optimal scheduling of integrated energy system considering wind–solar uncertainty and power to gas and carbon capture and storage. Energies 2024, 17, 2770. [Google Scholar] [CrossRef]
  27. Duan, Y.; Gao, C.; Xu, Z.; Ren, S.; Wu, D. Multi-Objective Optimization for the Low-Carbon Operation of Integrated Energy Systems Based on an Improved Genetic Algorithm. Energies 2025, 18, 2283. [Google Scholar] [CrossRef]
  28. Tang, D.; Zheng, Z.; Guerrero, J.M. A hybrid multi-criteria dynamic sustainability assessment framework for integrated multi-energy systems incorporating hydrogen at ports. Int. J. Hydrogen Energy 2025, 99, 540–552. [Google Scholar] [CrossRef]
  29. Xie, Q.; Huang, C.; Zhou, Y.; Shen, Z.; Fu, Q.; Wang, X. Improved hippo algorithm optimization strategy for heliostat field layout with dynamic time weighting. Appl. Therm. Eng. 2025, 279, 127598. [Google Scholar] [CrossRef]
  30. Mao, Y.; Li, X.; Liu, J.; Yu, M.; Kim, M.K.; Yang, K. Multi-objective optimization of integrated energy systems in natural gas industrial zones: Enhancing performance through variable hydrogen blending ratios. Appl. Therm. Eng. 2025, 268, 125942. [Google Scholar] [CrossRef]
  31. Han, T.; Wang, H.; Li, T.; Liu, Q.; Huang, Y. MHO: A Modified Hippopotamus Optimization Algorithm for Global Optimization and Engineering Design Problems. Biomimetics 2025, 10, 90. [Google Scholar] [CrossRef]
  32. Zhao, Y.; Wei, Y.; Zhang, S.; Guo, Y.; Sun, H. Multi-objective robust optimization of integrated energy system with hydrogen energy storage. Energies 2024, 17, 1132. [Google Scholar] [CrossRef]
  33. Krishna Meera, V.; Balasubramanian, C.; Praveen, R. Hybrid Hippopotamus Optimization Algorithm–Based Energy-Efficient Stable Cluster Construction Protocol for Data Routing in VANETs. Int. J. Commun. Syst. 2025, 38, e70171. [Google Scholar] [CrossRef]
  34. Asim, A.M.; Awad, A.S.A.; Attia, M.A. Integrated optimization of energy storage and green hydrogen systems for resilient and sustainable future power grids. Sci. Rep. 2025, 15, 25656. [Google Scholar] [CrossRef] [PubMed]
  35. Lu, M.; Teng, Y.; Chen, Z.; Song, Y. A bi-level optimization strategy of electricity-hydrogen-carbon integrated energy system considering photovoltaic and wind power uncertainty and demand response. Sci. Rep. 2025, 15, 18. [Google Scholar] [CrossRef]
  36. Zheng, Z.; Xiwang, A.; Sun, Y. Optimal scheduling of integrated energy system considering hydrogen blending gas and demand response. Energies 2024, 17, 1902. [Google Scholar] [CrossRef]
  37. Lei, Y. Application of improved hippopotamus optimization algorithm integrating multi-strategy. Nat. Sci. Hainan Univ. 2025, 43, 289–296. [Google Scholar]
  38. Wang, Y.; Wu, Z.; Ni, D. Real-time optimization of heliostat field aiming strategy via an improved swarm intelligence algorithm. Appl. Sci. 2024, 14, 416. [Google Scholar] [CrossRef]
  39. Wang, R.; Wang, J. Multi-objective collaborative optimization of system configurations and energy scheduling of integrated energy system with electricity-fuel-heat storage systems. J. Energy Storage 2025, 132, 117846. [Google Scholar] [CrossRef]
  40. Yang, J.; Zeng, L.; He, K.; Gong, Y.; Zhang, Z.; Chen, K. Optimization of the Joint Operation of an Electricity–Heat–Hydrogen–Gas Multi-Energy System Containing Hybrid Energy Storage and Power-to-Gas–Combined Heat and Power. Energies 2024, 17, 3144. [Google Scholar] [CrossRef]
  41. Liu, X.; Mancarella, P. Modelling, assessment and Sankey diagrams of integrated electricity-heat-gas networks in multi-vector district energy systems. Appl. Energy 2016, 167, 336–352. [Google Scholar] [CrossRef]
  42. Liu, S.; Mu, T.; Guo, Y.; Lei, K.; An, D. Research and Application of Network Structure Optimization Method Based on DC Power Flow Model. Inn. Mong. Electr. Power 2022, 40, 45–49. [Google Scholar]
  43. Deng, H.W. Evaluating Nodal Energy Price of Carbon Emission-Embedded Electricity-Gas-Heat Integrated Energy System. Master’s Thesis, Northeast Electric Power University, Jilin, China, 2019. [Google Scholar]
  44. Benonysson, A.; Bohm, B.; Ravn, H.F. Operational optimiz ion in a district heating system. Energy Convers. Manag. 1995, 36, 297–314. [Google Scholar] [CrossRef]
  45. Zheng, H.; Yang, G.; Pan, H.; Hu, R.; Zou, Y.; Yi, J. Day-ahead Scheduling of Integrated Energy System Considering Districted Heating System and Uncertain Factors. Proc. CSU-EPSA 2019, 32, 83–90. [Google Scholar]
  46. Modu, B.; Abdullah, P.; Bukar, A.L.; Hamza, M.F.; Adewolu, M.S. Operational strategy and capacity optimization of standalone solar-wind-biomass-fuel cell energy system using hybrid LF-SSA algorithms. Int. J. Hydrogen Energy 2024, 50, 92–106. [Google Scholar] [CrossRef]
  47. Yu, X.; Duan, Y.; Cai, Z. Sub-population improved grey wolf optimizer with Gaussian mutation and Lévy flight for parameters identification of photovoltaic models. Expert Syst. Appl. 2023, 232, 120827. [Google Scholar] [CrossRef]
  48. Schneider, K.; Phanivong, P.; Lacroix, J.S. IEEE 342-node low voltage networked test system. In Proceedings of the 2014 IEEE PES General Meeting|Conference & Exposition, National Harbor, MD, USA, 27–31 July 2014; IEEE: New York, NY, USA, 2014; pp. 1–5. [Google Scholar]
  49. Goel, S. Pigeon optimization algorithm: A novel approach for solving optimization problems. In Proceedings of the 2014 International Conference on Data Mining and Intelligent Computing (ICDMIC), Delhi, India, 5–6 September 2014; IEEE: New York, NY, USA, 2014; pp. 1–5. [Google Scholar]
  50. Borge-Diez, D.; Rosales-Asensio, E.; Açıkkalp, E.; Alonso-Martínez, D. Analysis of power to gas technologies for energy intensive industries in European Union. Energies 2023, 16, 538. [Google Scholar] [CrossRef]
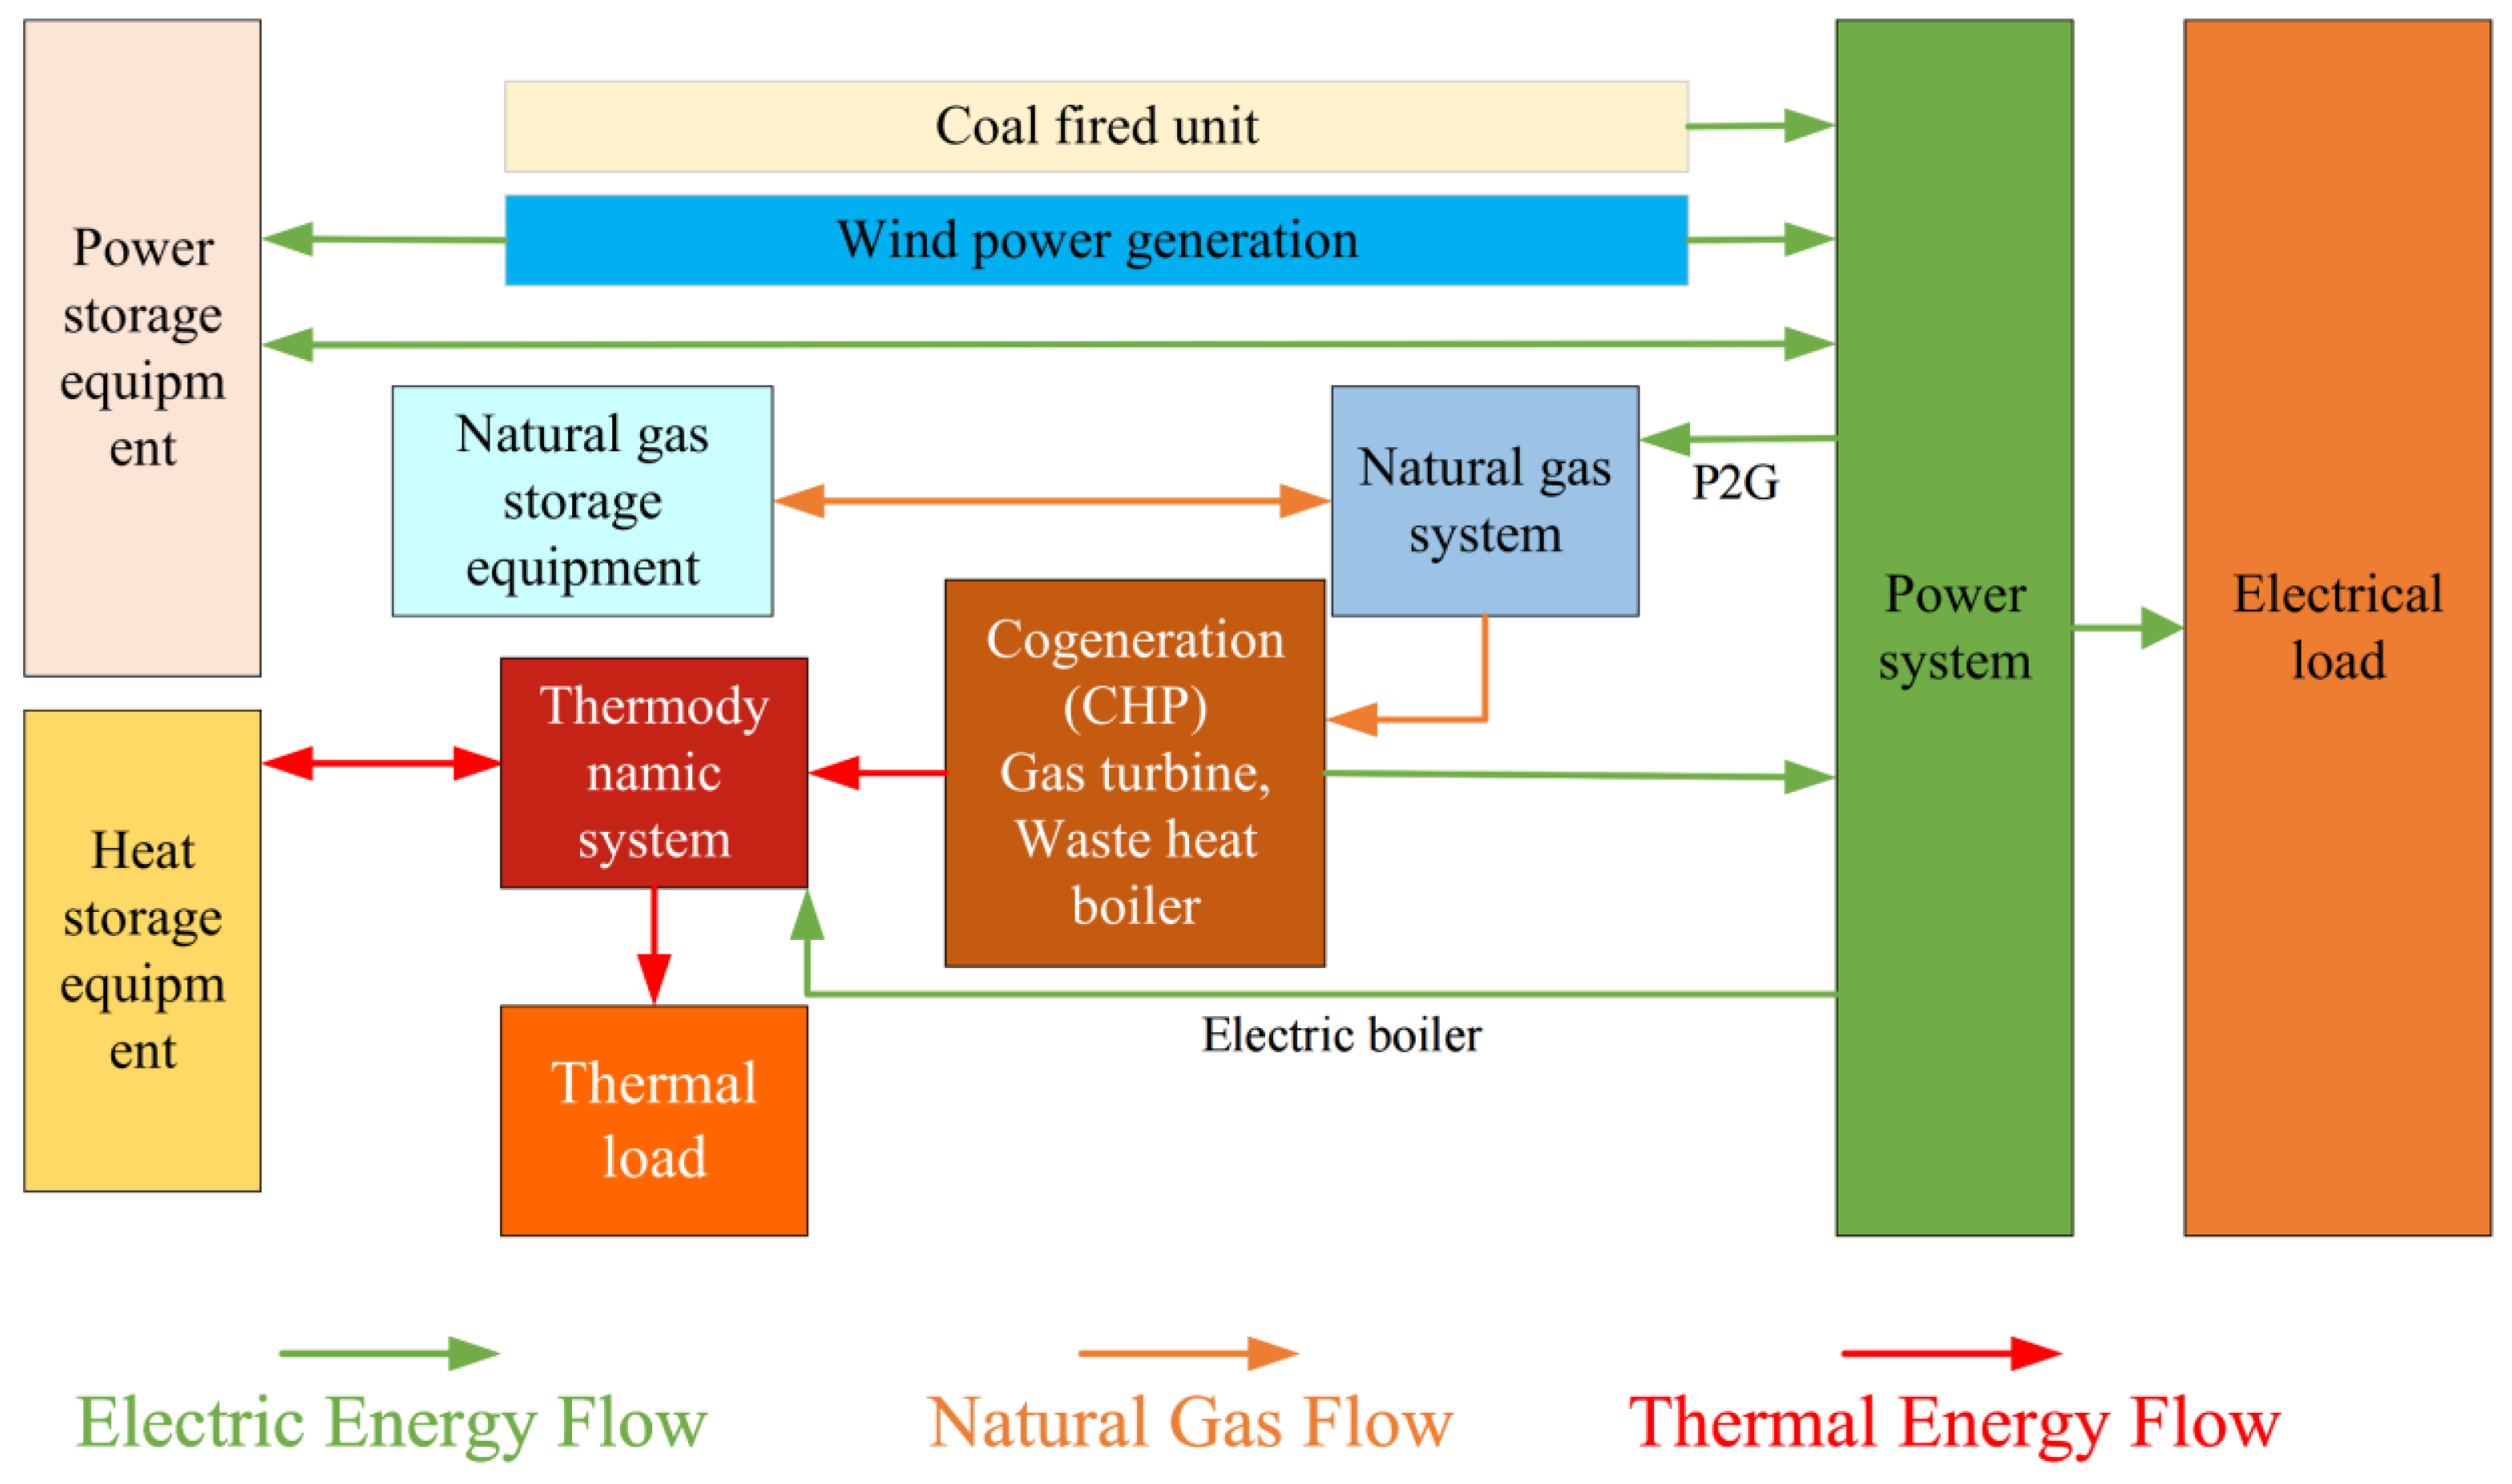
Figure 1. Operation framework of electric–gas–thermal integrated energy system.
Sustainability 17 09970 g001
Figure 2. Schematic diagram of natural gas system structure.
Sustainability 17 09970 g002
Figure 3. Schematic diagram of thermal subsystem structure.
Sustainability 17 09970 g003
Figure 4. Flow chart of hippo optimization algorithm.
Sustainability 17 09970 g004
Figure 5. Schematic diagram of integrated energy system nodes.
Sustainability 17 09970 g005
Figure 6. 1000 landscape uncertainty scenarios.
Sustainability 17 09970 g006
Figure 7. Sensitivity to auxiliary self-consumption.
Sustainability 17 09970 g007
Figure 8. Three-dimensional diagram of pipeline natural gas flow with three algorithms.
Sustainability 17 09970 g008
Figure 9. Three-dimensional diagram of pressure distribution of the three algorithms.
Sustainability 17 09970 g009
Figure 10. P2G unit output diagram of the three algorithms. “1#” merely represents Device One.
Sustainability 17 09970 g010
Figure 11. Three-dimensional diagram of power system branch power of three algorithms.
Sustainability 17 09970 g011
Figure 12. Wind turbine output diagram of the three algorithms. “1#” merely represents Device One.
Sustainability 17 09970 g012
Figure 13. Gas consumption diagram of natural gas generator with three algorithms.
Sustainability 17 09970 g013
Figure 14. Output planning diagram of thermal power units with three algorithms. “1#” merely represents Device One.
Sustainability 17 09970 g014
Figure 15. Natural gas source generation diagram of the three algorithms. “1#” merely represents Device One.
Sustainability 17 09970 g015
Table 1. Description table of important nodes.
Node NumberMachine TypeGas Input SourceRemark
Grid node 33gas turbineNode 6 of the air network supplies gasnone
Grid node 37gas turbineNode 19 of the air network supplies gasnone
Grid node 30CHP unitsNode 3 of the air network supplies gasHeat source of the heat network node 1
The remaining 7 power supply nodesCoal-fired unitsnonenone
Table 2. The cost of generator unit parameters.
Node IDCost FactorUpper Output Limit/MWLower Output Limit/MW
a x / $ b x / $ · M W h 1 c x / $ · M W h 2
30146919.710.07710400
31263921.020.0096460
32263921.020.0097250
33146920.310.0306520
34283924.020.0771080
35263921.020.0096870
36263921.020.0095800
37146920.310.0305640
38146919.710.0778650
39146919.710.07711000
Where a x , b x , and c x are the cost coefficients of the generator.
Table 3. Basic parameters of natural gas source.
Gas Source NumberLower Flow Limit/mm3Traffic Upper Limit/mm3
10.901.7391
201.26
300.72
41.002.3018
500.27
601.44
Table 4. Belgium 20-node natural gas system pipeline data.
Pipeline NumberFirst NodeEnd Node c k n Pipeline NumberFirst NodeEnd Node c k n
1129.0701111120.860
2236.0401212130.910
3341.3901313147.260
4560.1001414153.630
5670.1501515161.450
6740.2201611170.050
74140.6601717180.006
8897.2601818190.002
99101.8101919200.030
1010111.450
Where c k n is the flow of the natural gas pipeline from node k to node n .
Table 5. Node data for Belgium’s 20-node gas system.
Node NumberUpper Pressure Limit (Bar)Lower Pressure Limit (Bar)Node NumberUpper Pressure Limit (Bar)Lower Pressure Limit (Bar)
177.001166.20
277.001266.20
380.030.01366.20
480.001466.20
577.001566.20
680.030.01666.20
780.030.01766.20
866.201880.00
966.201966.20
1066.230.02066.225.0
Table 6. CHP unit parameters.
CHP NumberCHP Cost Factor
ε C H P / $ · M W h θ P θ H
124.20.312.40
224.20.312.40
Table 7. Thermal system 6 node ambient temperature.
Moment (h)Temperature (°C)Moment (h)Temperature (°C)Moment (h)Temperature (°C)
1−10.009−7.1017−5.94
2−10.0010−6.5218−6.52
3−8.8411−5.9419−6.52
4−9.4212−5.3520−6.52
5−9.4213−4.7721−7.10
6−9.4214−4.7722−7.68
7−8.8415−4.7723−8.26
8−8.2616−5.3524−8.26
Table 8. Nominal hyper-parameters and planned sensitivity ranges.
Hyper-ParameterHOA (Nominal)PSO (Nominal)PIO (Nominal)Planned Perturbation
Population size N666±20%
Iterations T3030T1 = 30; T2 = 5±20%
Learning/interaction factorsLévy = 0.05c1 = 1.49445, c2 = 1.49445, ω = 0.729R = 0.3 (geomagnetic factor)±10–20%
Randomness and implementationFixed seed/unified init/elitism/constraintsFixed seed/unified init/elitism/constraintsFixed seed/unified init/elitism/constraints
Table 9. Comparison of cost optimization results of three algorithms.
Pigeon-Inspired Optimization AlgorithmParticle Swarm Optimization AlgorithmHippopotamus Optimization Algorithm
Investment cost (Yuan)139,600,000.0000187,400,000.0000206,608,000.0000
Operation cost of thermal power unit (Yuan/day)541,983.3137563,482.2677574,552.2387
Operation cost of wind turbine (Yuan/day)21,952,737.099013,170,759.017313,783,126.4225
Natural gas output cost (Yuan/day)66,513,243.042065,409,457.878565,342,420.3912
P2G unit operation cost (Yuan/day)27,864,853.289545,245,191.215935,424,791.5274
Optimal objective function (Yuan/year)42,798,178,111.644242,712,635,496.632242,227,193,061.6362
Table 10. Compare the simplified model with the unsimplified model.
SubsystemSimplified Model UsedUnsimplified AlternativeCaptured EffectsMissed EffectsTypical Use Cases
Power networkDC power flow (linear, P–θ)AC power flow (full P–Q–V–θ)Active-power dispatch, line loadingVoltage/reactive limits, losses, voltage stability marginsDay-ahead scheduling, planning under moderate loading
Gas networkSteady-state algebraic flow (Weymouth-type, constant compression ratio)Transient gas with linepack and compressor mapsAverage pressures/flows, capacity usageLinepack dynamics, fast ramping feasibility, compressor efficiency curvesPlanning, hourly operation without fast ramps
CouplingLinear energy links (CHP/P2G in steady state)Dynamic unit/efficiency curves, start/stopAverage production, energy balanceCycling losses, start-up penaltiesSame as above
Disclaimer/Publisher’s Note: The statements, opinions and data contained in all publications are solely those of the individual author(s) and contributor(s) and not of MDPI and/or the editor(s). MDPI and/or the editor(s) disclaim responsibility for any injury to people or property resulting from any ideas, methods, instructions or products referred to in the content.