Abstract
The rapid use of renewables like wind power (WP) and photovoltaic (PV) power is essential for a sustainable energy future, yet their volatility poses a threat to grid stability. Electric vehicles (EVs) contribute to the solution by providing storage, while biomass energy (BE) ensures a reliable and sustainable power supply, solidifying its critical role in the stable operation and sustainable development of the power system. Therefore, a dynamic economic emission dispatch (DEED) model based on WP–PV–BE–EVs (DEEDWPBEV) is proposed. The DEEDWPBEV model is designed to simultaneously minimize operating costs and environmental emissions. The model formulation incorporates several practical constraints, such as those related to power balance, the travel needs of EV owners, and spinning reserve. To obtain a satisfactory dispatch solution, an adaptive improved multi-objective evolutionary algorithm based on decomposition with differential evolution (IMOEA/D-DE) is further proposed. In IMOEA/D-DE, the initialization of the population is achieved through an iterative chaotic map with infinite collapses, and the differential evolution mutation operator is adaptively adjusted. Finally, the feasibility and effectiveness of the proposed model and algorithm are verified on the ten-units system. The experimental results show that the proposed model and algorithm can effectively mitigate renewable energy uncertainty, reduce system costs, and lessen environmental impact.
1. Introduction
Driven by the growing imperatives for environmental sustainability, the use of renewable energy sources, particularly wind power (WP) and photovoltaic (PV), has seen a significant rise in power systems. However, the inherent intermittency and volatility of these renewables may lead to power imbalances, frequency deviations, and even cascading failures, which severely restrict their large-scale grid integration and utilization, and pose major challenges to the stability, security, and economic operation of power systems [1,2]. Therefore, there is an urgent need to develop effective strategies to mitigate renewable energy fluctuations and achieve efficient, economical, and stable grid operation, making the management of WP and PV uncertainty a critical priority in smart grid research.
To address these challenges, the multi-energy complementary power system (MCPS) has emerged as a promising solution. Extensive research has been dedicated to integrating WP, PV, and other flexible resources to improve overall system reliability by mitigating renewable energy uncertainty. For instance, Dong et al. [3] designed a multi-energy complementary system in which the integrated energy storage system supplements power, alleviates the volatility of renewable energy, and enhances system stability. Lin et al. [4] developed an integrated energy system with WP, PV, and energy storage to smooth fluctuations. Other approaches include using hydropower regulation [5] or combining PV with battery and thermal systems [6]. Notably, electric vehicles (EVs) serve not only as controllable loads but also, through vehicle-to-grid (V2G) technology, provide grid services like peak shaving and frequency regulation. This capability has been leveraged to stabilize large-scale PV fluctuations [7], enhance system stability and user revenue in dispatching models [8], alleviate PV uncertainty through grid-connected EVs [9], and maximize renewable utilization in systems with EVs and storage capacity [10]. Similarly, Wang et al. [11] used large-scale EVs integration to smooth WP. In summary, existing research primarily focuses on mitigating renewable uncertainty through MCPS and flexible EVs dispatch. However, a significant gap remains: the power generation potential of urban biomass, particularly urban solid waste (USW), has been largely overlooked in MCPS frameworks.
As a dispatching and stable energy source, biomass energy (BE) effectively compensates for the intermittency of WP and PV, thereby enhancing the reliability of the energy supply. However, the current utilization efficiency of biomass remains unsatisfactory, leading to considerable resource waste. Globally, about 33% of USW is not recycled, indicating significant untapped potential [12]. In Europe, up to 90% of USW is directly landfilled without treatment, contributing to both resource depletion and environmental pollution [13]. Studies suggest that the efficient use of municipal waste could offset approximately 65% of Europe’s oil consumption [14]. Internationally, the energy potential of biomass derived from MSW is recognized, with projections indicating it could supply up to 76% of Pakistan’s energy needs [15]. Quantitatively, the energy currently wasted through landfilling represents 260 petajoules, equivalent to 20.7% of urban residential electricity demand [16]. Consequently, researchers are exploring the integration of BE into MCPS to improve its efficiency and environmental benefits. For example, Zheng et al. [17] incorporated a BE system with energy storage into a microgrid, effectively reducing overall operating costs. Wu [18] developed a rural integrated energy system combining WP, PV, BE, and biogas generation, significantly increasing user income. Wang et al. [19] established a complementary power generation model with PV and BE, considerably lowering comprehensive operating costs. Jayarathna et al. [20] enhanced sustainability by leveraging diversified BE resources for large-scale power generation. Li et al. [21] proposed an MCPS framework integrating renewables and BE in agricultural areas, substantially cutting operating costs. While converging evidence underscores dual contributions of BE to enhanced energy sustainability and reduced dispatch costs, a systematic architecture for the co-optimization of WP, PV, BE, and EVs clusters remains underdeveloped. Further research is thus required to fully exploit the complementary potential between the distributed, mobile storage of EVs and the stable, dispatching generation of BE.
Power system dispatch is a typical high-dimensional, strongly constrained, and multi-objective optimization problem, for which conventional optimization algorithms are often not directly applicable. Dai et al. [22] developed a multi-form evolutionary algorithm framework to address strongly constrained multi-objective optimization in integrated coal energy systems. Li et al. [23] tackled multi-constraint and strong-coupling issues in electrical-thermal integrated energy systems by hybridizing the non-dominated sorting genetic algorithm with multi-objective particle swarm optimization. Zio et al. [24] applied a multi-objective genetic algorithm guided by Pareto optimality to resolve nonlinear, constrained power dispatch problems. Ji et al. [25] proposed an environmentally featured PSO to address ocean current influences on autonomous underwater vehicles, achieving time-optimal path planning through the integration of current characteristics. Li et al. [26] introduced an adaptive decomposition strategy and an enhanced solution assignment mechanism into the multi-objective evolutionary algorithm based on decomposition (MOEA/D), significantly improving computational efficiency. Zhang et al. [27] incorporated a penalty-based boundary intersection method into MOEA/D to handle uncertainties from intermittent sources in hybrid energy systems while reducing operational costs. Shao et al. [28] integrated Lévy flight into MOEA/D, markedly boosting its performance in solving multi-objective optimization problems for grid-connected EVs in power systems. Despite these advances, most enhanced MOEA/D variants still suffer from limited distribution diversity and insufficient convergence performance when applied to high-dimensional, dynamic-constrained multi-objective dispatch problems.
Significant progress has been made in existing research on multi-energy complementary systems for mitigating renewable energy uncertainty. However, two critical limitations persist. First, while multi-energy coordination has been explored, the potential of EVs as a distributed, rapid-response storage resource for real-time fluctuation absorption remains under-used in dispatch models. Second, BE continues to be under-used in current research. Its potential as a scalable, stable power source for system-wide emission reduction and cost efficiency has yet to be fully leveraged within coordinated dispatch frameworks. To overcome these limitations, this paper proposes a novel multi-objective dynamic economic emission dispatching DEEDWPBEV integrated power system model. The uniqueness of this model is primarily manifested in the establishment of a unified framework, within which systematic collaborative optimization of high-penetration renewable energy, distributed electric vehicle energy storage, dispatching biomass power generation, and large-scale thermal power generation is realized. Compared to traditional multi-energy dispatching methods, the dynamic coupling relationship between the distributed energy storage characteristics of EVs and WP, and PV is fully leveraged by the DEEDWPBEV model, resulting in a significant improvement in renewable energy consumption efficiency. Meanwhile, the BE is innovatively introduced by this model as a partially dispatching alternative energy source, effectively alleviating the emission control and fuel cost pressures faced by traditional thermal power generation. And to solve the DEEDWPBEV model, an adaptive multi-objective evolutionary algorithm based on decomposition with differential evolution (IMOEA/D-DE) multi-objective optimal dispatching method is developed.
The main contributions are summarized as follows: (1) A multi-energy complementary dynamic economic emission dispatch (DEEDWPBEV) model is proposed based on WP-PV-BE-EVs (DEEDWPBEV). (2) An improved IMOEA/D-DE algorithm is proposed to optimize the DEEDWPBEV model. Compared with the MOEA/D algorithm, the iterative chaotic map with infinite collapses (ICMIC) was employed in IMOEA/D-DE for population initialization, while a DE mutation strategy was introduced, and a new adaptive adjustment mechanism was proposed, which can automatically select different mutation operators through different iteration stages to enhance the search capability. (3) The effectiveness of the proposed DEEDWPBEV and IMOEA/D-DE was verified on a ten-units system. The results show that the proposed model and algorithm provide a good framework and method for addressing new energy uncertainty and biomass energy grid integration.
2. Modeling of DEED Based on WPBEV
2.1. Dispatch Model of Electric Vehicles
EVs can be categorized based on their primary functions into public transport, private transport, and commercial applications. Among these, commercial vehicles are less suitable for participation in V2G enabled grid services due to their high daily utilization rates. In contrast, privately owned EVs remain stationary and connected to the grid for extended periods, particularly after daily commutes, making them highly amenable to integration into grid dispatching via V2G. Therefore, this research primarily focuses on privately owned passenger EVs. This work adopts a hierarchical dispatching framework rather than directly controlling the charging and discharging processes of individual EVs. Specifically, all EVs within a designated area are grouped into several aggregates, with the charging and discharging behavior of each aggregate managed centrally by an aggregator. Under this structure, the aggregator participates in grid dispatching as a single entity, thereby eliminating the need to monitor or manage the behavior of each EV [29].
The operational mode of electric vehicles during each dispatching interval is defined by a sign function, with specific operational cases specified in Table 1. The function is formally defined as follows:

Table 1.
The description of EV charging and discharging states.
2.2. Modeling of Biomass Energy
In 2025, renewable energy is projected to contribute 14.9% of the global energy [30]. Within this share, BE accounts for 22.8% and demonstrates a steady year-on-year growth trajectory, as shown in Figure 1. Nevertheless, the integration of BE into power system dispatch remains relatively limited at present. Particularly in urban areas, substantial quantities of raw materials suitable for biomass power generation are discarded, resulting in considerable resource waste. The full utilization of these discarded biomass resources could not only mitigate environmental pollution but also enhance overall energy efficiency. This paper focuses on the coordinated operation of BE within a WP-PV-EVs system. Through multi-energy complementation, the proposed approach effectively alleviates environmental pollution and reduces operational stresses on power systems caused by conventional fossil-based energy sources.
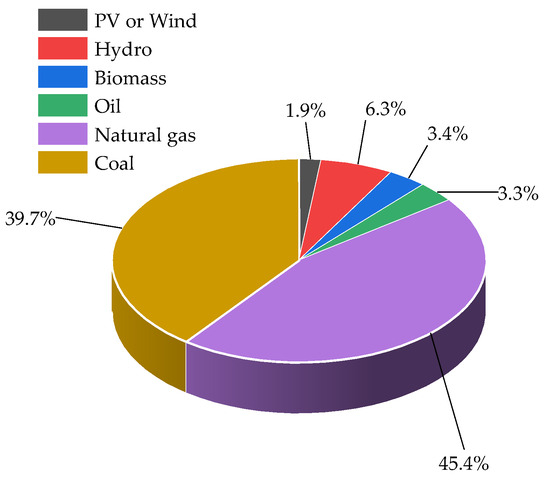
Figure 1.
The total annual power generation of each energy in 2025.
As a renewable energy source, organic matter is employed as fuel in BE and is converted into thermal energy or combustible gases through combustion or conversion technologies, which are subsequently used to power generation equipment for electricity generation. Fundamentally, this technology achieves clean power production by converting energy from biomass resources. Ref. [31] indicates that there are two primary models for biomass power generation, one of which is the biomass steam turbine generation model, described as follows:
where PBE represents biomass power. Q stands for steam passing through the steam turbine in unit time. stands for the efficiency of a biomass energy turbine, which represents the ability of a biomass energy turbine to convert steam heat energy into mechanical energy. denotes the thermal energy conversion efficiency of biomass materials. kr is a constant, depending on the pressure and temperature of the steam.
Biomass boilers are as follows:
where HV represents boiler efficiency. denotes the fuel consumption rate. is the efficiency of biomass heating equipment. It is especially noted that this article only conducts macro-level control of BE.
2.3. Modeling of WP and PV
WP and PV power output exhibit significant intermittency and stochasticity, fundamentally due to their high dependence on natural conditions such as wind speed and solar radiation intensity. To accurately model the uncertainty of renewable power generation, this paper first employs QRF to generate probabilistic forecasts of key natural factors [32] and subsequently derives the final power output of WP and PV generation using a physical power curve model [33]. The physical model of dispatching active power and wind speed of WP is the following:
where represents the dispatching power of the WP; denotes the wind speed of the ith wind turbine at time t.
The physical model of PV dispatches active power and solar radiation intensity is as the following:
where denotes the dispatch power of PV. is the maximum output power under standard conditions. and represent the solar radiation intensity and temperature of the nth photovoltaic power generation unit at time t, respectively.
2.4. Modeling of DEED with WPBEV
A new DEEDWPBEV model is proposed in this work to mitigate the impact of WP and PV uncertainty on the grid, with a structure presented in Figure 2. In this model, a portion of the power for EVs charging is sourced directly from renewable generation, while the remainder is supplied through the unified dispatch of the power grid control center. When renewable energy generation is insufficient, energy discharged from EVs is used to compensate for the shortfall. Conversely, EVs charging is used to absorb excess generation, thereby mitigating renewable curtailment. If the combined discharge from EVs and renewable energy is insufficient to meet the load demand, BE is dispatched to cover the deficit. If the BE power supply remains inadequate, conventional thermal power is activated to compensate for the remaining shortfall.
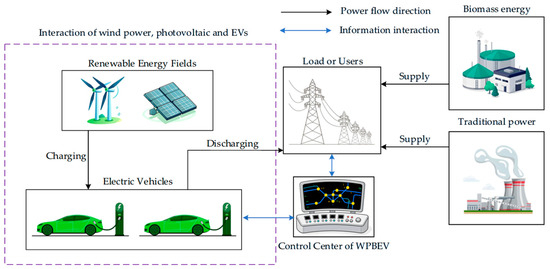
Figure 2.
The DEEDWPBEV system.
2.5. Objective Functions
The DEEDWPBEV model proposed in this paper incorporates two objective functions: the total system cost and the emission cost. The total system cost encompasses the integration costs associated with coordinating WP, PV, and EVs. Within the considered system, WP, PV, and EVs are treated as zero-emission resources. Consequently, operational emissions, and thus the associated emission costs, are primarily attributable to thermal power generation. The objective function for minimizing total emission cost is formulated as follows:
The uncertainty in WP and PV leads to forecasting errors, which incur imbalance costs for both overestimation and underestimation. In contrast, EVs participating in V2G services primarily incur operational costs related to charging and discharging cycles. Therefore, the total cost objective function comprises the following components: (1) the fuel cost of traditional thermal power units and BE; (2) the operating costs of EVs providing V2G services; (3) the imbalance costs (for both over- and under-estimation) of renewable generation; and (4) the net cost of WP and PV. The objective function is formulated as follows:
where the WP operational cost is obtained from the following equation:
where represents the dispatching active power from the nth wind turbine at time t. denotes the operating cost of the unit active power of WP. The PV operational cost is defined as the following:
where represents the dispatching active power from the nth solar turbine at time t. denotes the operating cost of the unit active power of PV. The charging and discharging cost of EVs is defined as the following:
where represents the charging power and the discharging power at time t. , are charging price and discharging price at time t. The interactive cost of WP-PV-EVs is defined as the following:
In the DEEDWPBEV model, there are two main operating scenarios. Firstly, when the combined output of WP and PV is high, it may exceed demand of the system even after dispatching, resulting in the curtailment of renewable generation and incurring a corresponding cost, as shown in Equation (13). Secondly, when the output from WP and PV is insufficient, the system may still be unable to meet the load demand even after EVs dispatching is implemented, leading to a load loss cost, as quantified in Equation (14). These two costs, curtailment cost and load loss cost, are collectively termed the interactive cost WP-PV-EVs within the system, where is the new energy curtailment given by Equation (12) and is the new energy shortage given by Equation (15) as the following:
where represents the available power from all WP and PV at time t. stands for the dispatched power for all WP and PV at time t. and represent the cost coefficients for WP and PV curtailment. The constraint for the first operational scenario is given by the following:
The constraint for the second operational scenario is given by the following:
New energy power shortage as follows:
where denotes the available power from all WP and PV at time t. and represent the cost coefficients for WP and PV uncurtail, respectively. The operation cost of thermal power units is defined as the following:
The operation cost of BE units is defined as follows:
where is the cost per unit active power of the nth BE unit.
2.6. Constraints
The equality and inequality constraints of the DEEDWPBEV model are as follows:
Power balance constraints: In each interval, the sum of the total active power of thermal power units, the EVs charging or discharging power, WP, PV, and BE should satisfy the sum of system loss and load demands as the following:
where represents the load demand of the system at time t. represents the network loss of the system at time t, which is calculated by the B-coefficient method [34].
EVs constraints: The main purpose of EVs is the daily travel of users, so the travel constraints of EVs owners in a dispatching period are shown in Equation (20) as the following:
where , are charging and discharging power coefficient. is power consumption of EVs when driving, which can be calculated by Equation (22), when the EVs are connected to the grid through the V2G system, at the t time the remaining power constraint of the EVs is shown in Equation (21) as the following:
where is the power consumed per unit distance of the EVs, and L is the distance driven.
The remaining battery capacity of the EVs in Equation (23) should also meet the limit of the maximum and minimum values in each dispatching cycle as follows:
For the sake of safety, EVs must also meet the rated power of EVs when charging and discharging through V2G as follows:
where and are the maximum power of EVs charging and discharging, respectively.
WP, PV, and BE constraints are defined as the following:
The WP, PV, and BE in the system should satisfy the upper and lower limits.
Spinning reserve constraints: The uncertainty in WP and PV requires the model to incorporate spinning reserves to maintain system reliability. Therefore, upward and downward spinning reserve constraints are formulated using chance constraints [35] as follows:
The amounts of upper and lower spinning reserve are given by Equations (26) and (27), respectively. and respectively denotes the spinning reserve capacity coefficients of WP. and respectively denotes the spinning reserve capacity coefficients of PV. Similarly, and represent the spinning reserve capacity coefficients of BE, respectively. and represent the spinning reserve capacity coefficients of EVs, respectively. and are two pre-specified confidence levels, which are used to represent the spinning reserve capacity range, when dispatching new energy power generation is insufficient. stands for the spinning reserve capacity demand for time t, usually 5–10% of the load demand, this is mentioned in [33]. and are calculated as follows:
3. Adaptive IMOEA/D-DE with ICMIC
This section focuses on the improved IMOEA/D-DE proposed in this paper, with detailed explanations of both its algorithmic flow and implementation for model solving.
3.1. The Proposed IMOEA/D-DE
The DEEDWPBEV dispatching problem is a high-dimensional, strongly constrained, multi-objective optimization that necessitates the use of efficient solution algorithms. MOEA/D, which employs a cooperative optimization strategy, has been shown to achieve high computational efficiency and rapid convergence when solving such multi-period problems with complex constraints [36].
In evolutionary algorithms, the quality of the initial population plays a critical role in overall performance. A well-distributed and diverse initial population not only improves convergence speed and robustness during optimization but also fundamentally shapes the distribution and convergence characteristics of the final Pareto fronts (PFs). To address this problem, a chaotic mapping method is introduced to enhance the population initialization process in MOEA/D, thereby effectively increasing population diversity. Additionally, a differential mutation strategy derived from differential evolution (DE) is integrated to strengthen the algorithm’s search capability and convergence performance during optimization.
The ICMIC, an iterative chaotic map characterized by infinite folding properties, is known to possess an infinite number of fixed points. It is indicated by these features that the ICMIC chaotic map exhibits strong sensitivity to initial conditions, which allows it to be used effectively in enhancing the global exploration capability of algorithms with exceptional performance [37] as follows:
where is the adjustable parameter.
In the DE, a new individual is generated for each existing individual by leveraging the vector differences between other individuals in the current population [38]. Five common mutation strategies are listed in Equation (30) as follows:
where xr1, xr2, xr3, xr4, and xr5 represent five distinct individuals randomly selected from the population, xbest denotes the current best individual, and F is the mutation factor. This paper integrates these five strategies and proposes a novel stage-adaptive dynamic mutation strategy.
3.2. Adaptive Dynamic Mutation Strategy
In the conventional MOEA/D framework, mutation is performed using the polynomial mutation operator. While this approach promotes some diversity, its performance degrades when handling high-dimensional multi-objective problems, making it ill-suited for application to the DEEDWPBEV model introduced in this work. To address this limitation, the mutation mechanism is enhanced by integrating DE strategies.
In IMOEA/D-DE, the mutation strategy is adaptively adjusted based on the evolutionary stage. During the early iterations, mutation strategies biased toward global exploration are preferentially employed to broadly probe the solution space and mitigate premature convergence. As the algorithm progresses to the middle stage, exploration and exploitation capabilities are gradually balanced, with population diversity preserved while individuals are guided toward the PFs. In the later stages of evolution, the focus of the strategy is shifted to local exploitation, with fine-grained searches conducted in the optimal solution region to enhance convergence precision.
The improved algorithm is particularly well-suited for the complex DEEDWPBEV model. The overall flowchart is presented in Figure 3, and the pseudocode of the adaptive mutation strategy is provided in Algorithm 1. The enhanced MOEA/D is evaluated using the hypervolume (HV) metric [39], a comprehensive performance indicator that quantifies both the convergence and distribution diversity of solutions. The HV results from a comparative work with several state-of-the-art algorithms are presented in Table 2, where a higher value indicates superior overall performance.
| Algorithm 1. Adaptive dynamic mutation strategy |
| Input: |
| itrCounter: Represents the number of iterations |
| itrCounterratio: The running progress of the current algorithm |
| jn: The stage represents the coefficient |
| xn: Mutation parameter |
| mutprob: Select mutation Indicators |
| piter: Current number of iterations |
| Output: |
| newpoint: The generated new individual |
| for i = 1 to itrCounter do |
| % Calculate the proportion of iteration progress |
| itrCounterratio = piter/itrCounter |
| % Three-stage adaptive strategy selection |
| if itrCounterratio jn then % Early stage |
| mutprob = xn |
| else if itrCounterratio jn |
| mutprob = xn % Middle stage |
| else mutprob = xn % Late stage |
| end else |
| end if |
| end if |
| if rand() < mutprob then |
| % MOEA/D mutation strategy |
| else rand() mutprob % DE multi-strategy variation |
| % DE mutation strategy |
| end else |
| end if |
| end |
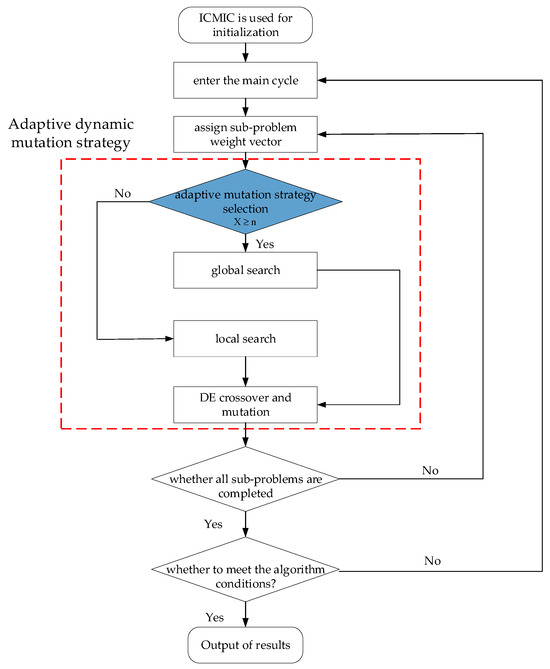
Figure 3.
The flowchart of IMOEA/D-DE.

Table 2.
Comparison of the hypervolume index.
The superior overall performance of IMOEA/D-DE in both convergence and diversity is confirmed by the experimental results in Table 2, which demonstrate a significantly higher HV value compared to traditional algorithms. In the table, the bolded data represent the best performance.
4. Experimental Results and Analysis
4.1. Test System and Algorithm Parameters
The performance of the proposed DEEDWPBEV model and IMOEA/D-E was evaluated using multiple test scenarios. For demonstration purposes, a ten-units system was simulated, with its load demand and parameters referenced from [40], which are given in Table 3 and Table 4.

Table 3.
The load demand of the system.

Table 4.
Ten-units system parameters.
All simulations were performed in the MATLAB R2024b environment on a computational platform equipped with an Intel Core i7-12700 CPU and 32 GB of RAM. In each test system, the key algorithm parameters were configured as follows: NP was 100, and the Max _Fes were 3000. The EVs data corresponded to the Nissan Leaf model [41], while the BE parameters were adopted from [31]. A complete list of EVs parameters is presented in Table 5.

Table 5.
The parameters of EVs.
The DEEDWPBEV model comprises 20,000 EVs, 50 wind turbines, 50 photovoltaic units, and two biomass generators (each with a rated capacity of 100 MW). The experiment used historical wind speed, solar irradiance, and temperature data from a renewable energy power station in northwest China. The data spans from 1 September 2019 to 31 December 2019 with a sampling interval of 15 min. Detailed parameters of the wind turbines and photovoltaic units are provided in Table 6.

Table 6.
Parameters of new energy.
4.2. Verify the Proposed IMOEA/D-DE
The performance of the proposed IMOEA/D-DE was evaluated through comparative experiments with several state-of-the-art algorithms, including MOEA/D, MOPSO [42], MODE [43], MODA [44], MOAHA [45], NSGA-II [46], and NSGA-III [47]. To ensure statistical significance, each algorithm was independently executed 30 times.
PFs represent the set of non-dominated solutions obtained by each algorithm in the objective space. As illustrated in Figure 4, the PFs achieved by the proposed IMOEA/D-DE demonstrate superior performance in both convergence and diversity compared to all other algorithms. Specifically, the PF of IMOEA/D-DE is positioned closer to the bottom-left corner of the objective space, indicating enhanced convergence, while also exhibiting a more uniform distribution of solutions. The inferior performance of NSGA-III, as evident from its PFs, serves as a benchmark for comparison. The marked superiority of IMOEA/D-DE can be attributed to its effective global search mechanism, facilitated by the incorporated differential evolution mutation strategy, which effectively prevents premature convergence. The extreme and compromise solutions obtained by each algorithm are summarized in Table 7, where the extreme solutions comprise the optimal cost solution and the optimal emission solution, with superior solutions highlighted in bold.
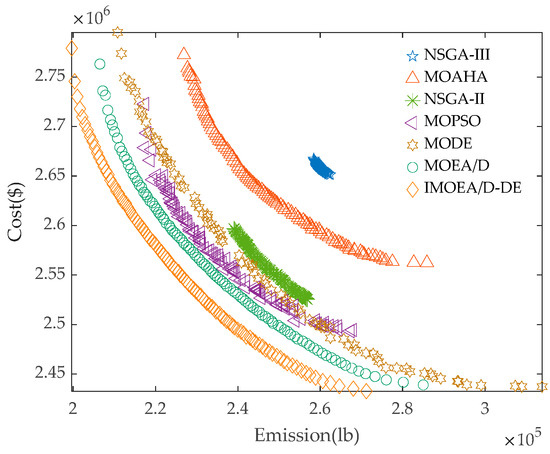
Figure 4.
The PFs obtained by different algorithms.

Table 7.
The solution of different algorithms.
As shown in Table 7, both the best cost and the best emission were obtained by the proposed IMOEA/D-DE, reaching 2.4326 × 10⁶ USD and 1.9967 × 10⁵ lb, respectively. This indicates that the proposed IMOEA/D-DE provides the optimal solution in terms of both system cost and emission objectives. In addition, the best compromise solution was also achieved by IMOEA/D-DE among all compared algorithms. Overall, the proposed algorithm demonstrates superior performance in minimizing the total system cost and total emission. Compared with the traditional MOEA/D, the proposed IMOEA/D-DE exhibits reductions of 3.39% in FM and 0.02% in FC. Overall, the proposed algorithm demonstrates superior performance in minimizing the total system cost and total emission.
The convergence behaviors of the six algorithms with respect to cost and emission objectives are depicted in Figure 5 and Figure 6, respectively. As observed in Figure 5, the proposed IMOEA/D-DE exhibits significantly superior convergence performance compared to the other five algorithms. Figure 6 further illustrates that although IMOEA/D-DE demonstrates a higher convergence rate than MOEA/D in the early iteration phase, it is temporarily surpassed by MOEA/D during the mid-iteration stage. Nevertheless, IMOEA/D-DE regains a faster convergence trend in the later iterations. Overall, IMOEA/D-DE maintains the best comprehensive convergence speed and performance throughout the entire iterative process. This advantage can be attributed to two main factors. The adaptive DE mutation operator embedded in IMOEA/D-DE enables dynamic switching of operator types at different iteration stages, thereby enhancing global optimization capability. Second, the initial population generated by ICMIC improves population diversity, providing a favorable foundation for accelerated convergence and high-quality solution attainment.
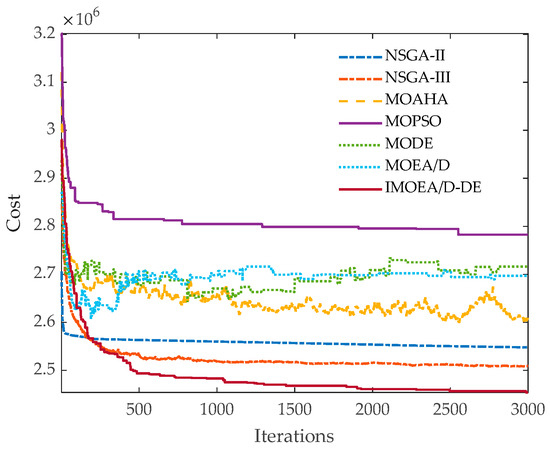
Figure 5.
The convergence of cost by different algorithms.
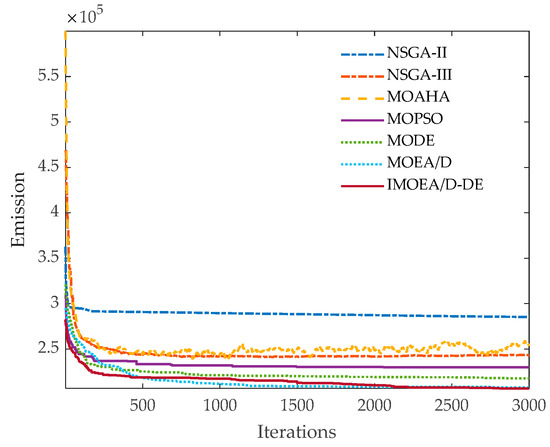
Figure 6.
The convergence of emission by different algorithms.
The best compromise solution obtained by IMOEA/D-DE is presented in Table 8. It can be observed that V2G charging events were concentrated during predefined electric vehicle travel periods, while discharging primarily occurred during peak load hours from 10:00–14:00 to 20:00–24:00, which is consistent with the experimental design. Additionally, photovoltaic power generation was active only between 13:00 and 17:00, corresponding to the period of maximum solar irradiance. The power balance constraint condition can be checked for each interval in Figure 7. In the Figure 7 demonstrates that power balance is maintained across all time periods, meeting the system constraints.

Table 8.
The best compromise solution obtained by IMOEA/D-DE.
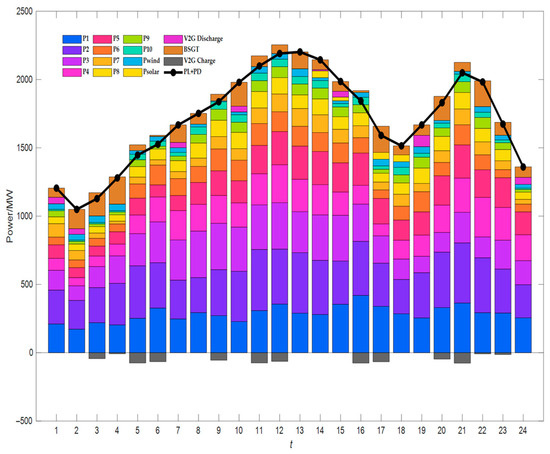
Figure 7.
Constraints checked IMOEA/D-DE for the best compromise solution.
4.3. Verify the DEEDWPBEV Model
The reliability of the DEEDWPBEV model was tested through a sensitivity analysis across the following five scenarios:
Scenario 1: Combines QRF for renewable uncertainty forecasting, WP-PV-EVs interaction for curtailment reduction, and BE for emission or fuel cost abatement.
Scenario 2: Replaces QRF with fixed forecasts, keeping other components identical to Scenario 1.
Scenario 3: Removes the WP-PV-EVs interaction component.
Scenario 4: Eliminates the BE component, requiring thermal generators to meet all demands.
Scenario 5: Only a ten-unit system is used to meet the load demand.
The extreme and best compromise solutions for the five scenarios are displayed in Table 9, which including the optimal cost and emission values, with superior solutions highlighted in bold. The comparison between Scenario 1 and Scenario 2 indicates that the better performance of Scenario 1 demonstrates the superior capability of QRF in capturing the uncertainty associated with WP and PV generation compared to the use of fixed values. Comparing Scenario 1 with Scenario 3 reveals that removing the WP-PV-EVs interaction in Scenario 3 leads to a shift in both optimal cost and emission levels. When Scenario 1 is compared with Scenario 4, the incorporation of BE is shown to substantially reduce system emissions. Specifically, the best emission value in Scenario 1 is 28.48% lower than that in Scenario 4, attributable to the cleaner profile of BE relative to conventional thermal power. This environmental gain is accompanied by only a slight increase of 0.35% in the best cost. This demonstrates that the incorporation of BE is instrumental in promoting the system sustainable development. A comparison of Scenario 1 and Scenario 5 underscores that the DEEDWPBEV model employed in Scenario 1 achieves considerable improvements in both cost and emission objectives over the traditional ten-units thermal system model used in Scenario 5. In summary, a substantial improvement in sustainability is demonstrated by the proposed DEEDWPBEV model, as confirmed through a comparative analysis of extreme scenarios. The critical value of the model for advancing sustainable development is thereby underscored.

Table 9.
Solutions under different scenarios.
A comparative analysis of the optimal compromise solutions across various scenarios unveils the impact of each model component. When compared with Scenario 1, Scenario 2 demonstrates a 0.63% increment in the minimum cost and a 3.07% rise in the minimum emissions. Scenario 3 shows a 0.11% increase in the minimum cost and a 0.05% growth in the minimum emissions relative to Scenario 1.
Conversely, although Scenario 4 cuts the minimum cost by 4.23%, it brings about a substantial 27.82% surge in the minimum emissions. Similarly, Scenario 5 attains a 3.92% reduction in the minimum cost, yet it results in a 26.85% hike in the minimum emissions when compared to Scenario 1. Figure 8 depicts the state-of-charge profiles of electric vehicles at different time intervals in scenarios 1–4. In these profiles, downward trends indicate discharging, while upward trends signify charging. As illustrated in Figure 8, all EVs conduct charging and discharging operations under complete availability conditions (100%) while achieving full recharge by the conclusion of the dispatching period. Within scenario 1, the most distinct discharge behavior is evident, leading to the maximum cost reduction in the system model. In contrast, scenarios 2, 3, and 4 exhibit suboptimal utilization of EV dispatch capabilities, resulting in comparatively elevated operational costs.
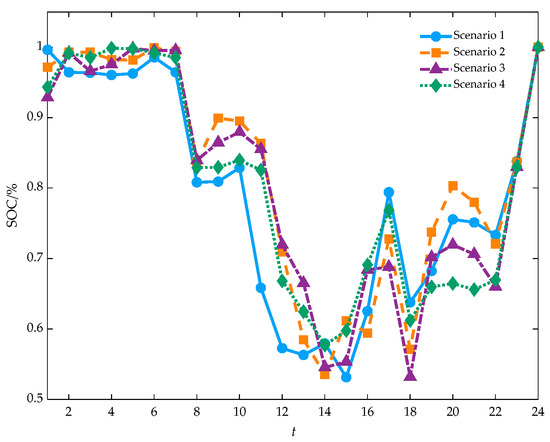
Figure 8.
The SOC of EVs in different scenarios.
The extreme and optimal compromise solutions for different EV scales are presented in Table 10, with the superior solutions highlighted in bold. The Pareto-optimal solution was achieved when the number of EVs reached 20,000. At this point, the minimum cost was 2.4792 × 10⁶ USD, and the minimum emissions were 2.0712 × 10⁵ lb. The analysis indicated that the number of EVs had a significant effect on the performance of the DEEDWPBEV model. Specifically, 20,000 EVs strike the optimal balance, resulting in the lowest total cost and emissions. This optimal state occurred because an insufficient number of EVs failed to fully use the model consumption capacity. Conversely, an excessive number of EVs imposed an operational burden on the system. Therefore, 20,000 EVs were identified as the most effective configuration for the proposed DEEDWPBEV model. The costs resulting from the interaction between EVs and the new energy system are depicted in Figure 9. As clearly illustrated in Figure 9, the highest interaction cost between EVs and the renewable energy system was observed at a fleet size of 60,000 EVs. When the EVs penetration level was 10,000 vehicles, the interaction cost was found to be lower than that with 20,000 EVs only during the hours of 7:00, 15:00, 16:00, and 19:00, while it was exceeded by the 20,000-EV benchmark during all other time periods. Furthermore, higher interaction costs were consistently demonstrated by systems with 30,000, 40,000, and 50,000 EVs when compared to the 20,000 EVs scenario across most operational intervals. In conclusion, an EV fleet size of 20,000 was identified as the optimal configuration for the proposed model.

Table 10.
The solution under a different number of EVs.
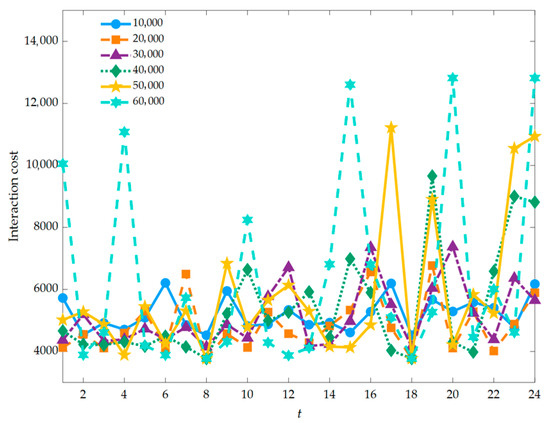
Figure 9.
Interaction cost obtained with different scales of EVs.
4.4. Sensitivity Analysis for Parameters
Different Population Size and Number of Iterations
Two sets of comparative experiments were conducted to evaluate the impact of EVs and BE on system economics and operational costs, as well as to examine the influence of population size and iteration number on algorithmic efficiency. In the first experimental group, the population size was varied while the maximum number of iterations was fixed at 3000 to assess algorithm performance in identifying extreme-value and best compromise solutions. The corresponding results are presented in Table 11, with the superior solutions highlighted in bold. In the second group, the number of iterations was adjusted under a fixed population size to evaluate algorithmic performance, with results provided in Table 12, with the superior solutions highlighted in bold.

Table 11.
Different initial population extreme and optimal compromise schemes.

Table 12.
Extreme and optimal compromise schemes with different iterations.
As summarized in Table 11. The best emission value of 1.9967 × 10⁵ lb is achieved with a population size of 100, representing reductions of 1.49%, 1.01%, 2.46%, and 5.08% compared to populations of 200, 300, 400, and 500, respectively. The best cost of 2.4254 × 10⁶ USD is obtained with a population size of 300, which is 0.29%, 0.64%, 0.83%, and 0.92% lower than when the population is 100, 200, 400, and 500. Regarding the best compromise solutions, the lowest emission of 2.2341 × 10⁵ lb attained at a population size of 100, while the lowest cost of 2.5326 × 10⁶ USD is observed at a population size of 200. In terms of computational efficiency, the shortest average computation time of 2103.2 s was recorded at a population size of 100 under the 3000-iteration limit. In summary, the experimental findings indicate that the algorithm achieves optimal performance when the population size is set to 100 and the maximum number of iterations is fixed at 3000.
As evidenced by the results in Table 12, the number of iterations influences solution quality to some extent. However, more iterations do not invariably lead to better solutions. Analysis of the compromise solutions in Table 12 reveals that the best cost and emission outcomes are achieved when the population size is 100 and the number of iterations is 3000. Therefore, considering the combined effects of population size on cost, emission, and computational time, the population size and iteration number were set to 100 and 3000, respectively, in this study.
4.5. Verify Algorithm and Model Scalability
The ten-units model was extended to a forty-units large-scale energy system to evaluate the scalability of the proposed model and algorithm. Comparative evaluations were conducted against the IMOEA/D-DE, NSGA-II, MODE, MOAHA, MOEA/D, and MOPSO algorithms, with cost and emission values employed as performance metrics. The experimental results are summarized in Table 13, with the superior solutions highlighted in bold.

Table 13.
The comparison of different optimization methods for testing forty-units.
Table 13 shows the extreme solutions and optimal compromise solutions obtained by the compared algorithms. Based on a comparative analysis of the algorithmic results, the following conclusions can be drawn. First, the proposed IMOEA/D-DE achieves optimal performance in both cost and emission objectives, attaining a minimum emission value of 2.6831 × 10⁶ lb and the lowest cost value of 2.9799 × 10⁶ USD among all compromise solutions. These results confirm the effectiveness of IMOEA/D-DE in balancing economic and environmental objectives, providing superior decision-making support. Furthermore, the forty-units experiment demonstrates that the algorithm can supply a wider range of high-quality solutions, confirming its applicability to large-scale energy systems.
5. Conclusions
In this paper, a new DEEDWPBEV model is proposed based on the multi-energy system. In DEEDWPBEV, the QRF method was employed to simulate the uncertainty of WP and PV. Additionally, an IMOEA/D-DE with ICMIC initialization population and adaptive adjustment mutation strategy was proposed to solve the DEEDWPBEV model. To verify the effectiveness of the proposed model and algorithm, simulation experiments were conducted on a ten-units system with different numbers of electric vehicles and different scenarios. The results show that, compared with other algorithms, the proposed IMOEA/D-DE algorithm can obtain the optimal solution. The DEEDWPBEV model is crucial in advancing the sustainability transition, effectively promoting renewable utilization while mitigating the ecological impact of conventional power generation. This study focuses on the grid-side influence of electric vehicle integration, omitting the effects of extreme weather, load fluctuation stability, user behavior uncertainty, and battery aging. Subsequent studies could incorporate these factors to improve the model practical applicability.
Author Contributions
Conceptualization, B.Q. and J.Y.; methodology, B.Q. and J.Y.; software, B.Q. and J.Y.; validation, B.Q., J.Y. and P.W.; formal analysis, P.W. and H.H.; investigation, J.Y.; resources, P.W. and H.H.; data curation, J.Y. and B.Q.; writing—original draft preparation, J.Y. and B.Q.; writing—review and editing, B.Q., P.W. and H.H.; visualization, B.Q., J.Y. and H.H.; supervision, B.Q. and P.W.; project administration, B.Q. and P.W.; funding acquisition, B.Q. and P.W. All authors have read and agreed to the published version of the manuscript.
Funding
This work was supported in part by the National Natural Science Foundation of China under Grant (62503513, 62373389, 62576372), in part by the Natural Science Foundation of Henan Province under Grant 252300421821, the Key Scientific Research Projects in Higher Education Institutions in Henan Province under Grant 24A120017, the Leading talents of science and technology in the Central Plain of China under Grant 254200510055, the Science and Technology Innovation Talents of Colleges and Universities in Henan Province under Grant 24HASTIT037, the Postgraduate Education Reform and Quality Improvement Project of Henan Province under Grant YJS2026YBGZZ20, the Key Research and Development Program of Henan under Grant 241111210100, the Discipline Strength Enhancement Plan of Zhongyuan University of Technology under Grant SD202418, and the Natural Science Foundation of Zhongyuan University of Technology under Grant K2025YB010.
Institutional Review Board Statement
Not applicable.
Informed Consent Statement
Not applicable.
Data Availability Statement
The original contributions presented in this study are included in the article. Further inquiries can be directed to the corresponding author.
Acknowledgments
The authors would like to thank the reviewers for their critical comments and valuable suggestions.
Conflicts of Interest
The authors declare no conflicts of interest.
Abbreviations
The following abbreviations are used in this manuscript:
| WP rated power | |
| , , | Cut-in wind speed, cut-out wind speed, and rated wind speed |
| Temperature under standard conditions | |
| k | Temperature-power coefficient |
| Light intensity under standard conditions | |
| T | Dispatching cycle |
| Np | Number of units |
| , , , , | Emission coefficients of the nth thermal generator |
| Net operating cost of the unit, active power of WP | |
| Net operating cost of the unit, active power of PV | |
| , | Charging price and discharging price |
| , | New energy abandonment and the shortage cost coefficient |
| , | Abandoned wind and photovoltaic coefficient |
| , , | Fuel cost coefficient of the jth thermal generator |
| Network loss at time t | |
| , | Charging and discharging power coefficient |
| Power consumed by EVs during driving | |
| L | The distance driven by EVs |
| , , | Coefficients of the B-coefficient method |
| Nnew | Number of new energy-generating units |
| , | Shortage of power and new energy waste power |
References
- Zhou, W.; Lou, C.; Li, Z.; Lu, L.; Yang, H. Current status of research on optimum sizing of stand-alone hybrid solar–wind power generation systems. Appl. Energy 2010, 87, 380–389. [Google Scholar] [CrossRef]
- Ameur, A.; Berrada, A.; Loudiyi, K.; Aggour, M. Analysis of renewable energy integration into the transmission network. Electr. J. 2019, 32, 106676. [Google Scholar] [CrossRef]
- Dong, W.; Sun, H.; Li, Z.; Yang, H. Design and optimal scheduling of forecasting-based campus multi-energy complementary energy system. Energy 2024, 309, 133088. [Google Scholar] [CrossRef]
- Lin, J.; Gu, Y.; Wang, Z.; Zhao, Z.; Zhu, P. Operational characteristics of an integrated island energy system based on multi-energy complementarity. Renew. Energy 2024, 230, 120890. [Google Scholar] [CrossRef]
- Tan, Q.; Wen, X.; Sun, Y.; Lei, X.; Wang, Z.; Qin, G. Evaluation of the risk and benefit of the complementary operation of the large wind-photovoltaic-hydropower system considering forecast uncertainty. Appl. Energy 2021, 285, 116442. [Google Scholar]
- Ikeda, S.; Ooka, R. A new optimization strategy for the operating schedule of energy systems under uncertainty of renewable energy sources and demand changes. Energy Build. 2016, 125, 75–85. [Google Scholar] [CrossRef]
- Sharma, S.; Ali, I. Optimized electric vehicle charging and discharging with sporadic renewable energy source. In Proceedings of the 2023 International Conference on Power, Instrumentation, Energy and Control (PIECON), Aligarh, India, 10–12 February 2023; IEEE: New York, NY, USA, 2023; pp. 1–6. [Google Scholar]
- Wang, N.; Li, B.; Duan, Y.; Jia, S. A multi-energy dispatching strategy for orderly charging and discharging of electric vehicles based on multi-objective particle swarm optimization. Sustain. Energy Technol. Assess. 2021, 44, 101037. [Google Scholar]
- Wang, H.; Liao, Y.; Zhang, J.; Cai, Z.; Zhao, Y.; Wang, W. Optimization of shared energy storage configuration for village-level photovoltaic systems considering vehicle charging management. Energy 2024, 311, 133373. [Google Scholar] [CrossRef]
- Yi, T.; Cheng, X.; Chen, Y.; Liu, J. Joint optimization of charging station and energy storage economic capacity based on the effect of alternative energy storage of electric vehicle. Energy 2020, 208, 118357. [Google Scholar] [CrossRef]
- Wang, W.; Chen, P.; Zeng, D.; Liu, J. Electric vehicle fleet integration in a virtual power plant with large-scale wind power. IEEE Trans. Ind. Appl. 2020, 56, 5924–5931. [Google Scholar] [CrossRef]
- Nanda, S.; Berruti, F. Municipal solid waste management and landfilling technologies: A review. Environ. Chem. Lett. 2021, 19, 1433–1456. [Google Scholar] [CrossRef]
- Parrodi, J.C.; Lucas, H.; Gigantino, M.; Sauve, G.; Esguerra, J.L.; Einhäupl, P.; Vollprecht, D.; Pomberger, R.; Friedrich, B.; Van Acker, K.; et al. Integration of resource recovery into current waste management through (Enhanced) landfill mining. Detritus 2019, 8, 141–156. [Google Scholar] [CrossRef]
- Drożyner, P.; Rejmer, W.; Starowicz, P.; Klasa, A.; Skibniewska, K.A. Biomass as a renewable source of energy. Tech. Sci. 2013, 16, 211–220. [Google Scholar]
- Saeed, M.A.; Irshad, A.; Sattar, H.; Andrews, G.; Phylaktou, H.; Gibbs, B. Agricultural waste biomass energy potential in pakistan. In Proceedings of the International Bioenergy (Shanghai) Exhibition and Asian Bioenergy Conference, Shanghai, China, 21–23 October 2015. [Google Scholar]
- Shi, Y.; Ge, Y.; Chang, J.; Shao, H.; Tang, Y. Garden waste biomass for renewable and sustainable energy production in China: Potential, challenges and development. Renew. Sustain. Energy Rev. 2013, 22, 432–437. [Google Scholar] [CrossRef]
- Wang, Z.; Zheng, Y. Optimal scheduling of Biomass-Hybrid Microgrids with Energy Storage: An LSTM-PMOEVO Framework for Uncertain Environments. Appl. Sci. 2025, 15, 2702. [Google Scholar] [CrossRef]
- Wu, C. Carbon emission evaluation and low carbon economy optimization scheduling of rural integrated energy system based on LCA method. IEEE Access 2025, 13, 17182–17194. [Google Scholar] [CrossRef]
- Wang, P.; Pan, L.; He, G.; Li, G.; Song, J.; Zhou, M.; Wang, J. Constructing a biomass-data center nexus for circular economy-based energy systems integration. IEEE Open Access J. Power Energy 2025, 12, 270–283. [Google Scholar] [CrossRef]
- Jayarathna, L.; Kent, G.; O’Hara, I. Spatial optimization of multiple biomass utilization for large-scale bioelectricity generation. J. Clean. Prod. 2021, 319, 128625. [Google Scholar] [CrossRef]
- Li, W.; Zou, Y.; Yang, H.; Fu, X.; Xiang, S.; Li, Z.; Xiang, S. Two stage stochastic energy scheduling for multi energy rural microgrids with irrigation systems and biomass fermentation. IEEE Trans. Smart Grid 2024, 16, 1075–1087. [Google Scholar] [CrossRef]
- Dai, C.; Sun, X.; Hu, H.; Song, W.; Zhang, Y.; Gong, D. Multiform differential evolution with elite-guided knowledge transfer for coal mine integrated energy systems constrained dispatch. IEEE Trans. Evol. Comput. 2024. [Google Scholar] [CrossRef]
- Li, J.; Gong, Z.; Miao, G.; Wang, X.; Yuan, L.; Jia, X.; Ma, H. Multi-objective optimization of power-gas-heat integrated energy system based on NSGA-II-MOPSO hybrid intelligent algorithm. J. Electr. Eng. Technol. 2025, 20, 4941–4957. [Google Scholar] [CrossRef]
- Zio, E.; Baraldi, P.; Pedroni, N. Optimal power system generation scheduling by multi-objective genetic algorithms with preferences. Reliab. Eng. Syst. Saf. 2009, 94, 432–444. [Google Scholar] [CrossRef]
- Ji, D.; Cheng, H. Path Planning Algorithm for Long-Range Autonomous Underwater Vehicles Based on Environmental Features. In Proceedings of the 2023 WRC Symposium on Advanced Robotics and Automation (WRC SARA), Beijing, China, 19 August 2023; IEEE: New York, NY, USA, 2023; pp. 168–173. [Google Scholar]
- Li, X.; Fang, Y. Dynamic environmental/economic scheduling for microgrid using improved MOEA/D-M2M. Math. Probl. Eng. 2016, 2016, 2167153. [Google Scholar] [CrossRef]
- Zhang, H.; Yue, D.; Yue, W.; Li, K.; Yin, M. MOEA/D-based probabilistic PBI approach for risk-based optimal operation of hybrid energy system with intermittent power uncertainty. IEEE Trans. Syst. Man Cybern. Syst. 2019, 51, 2080–2090. [Google Scholar] [CrossRef]
- Shao, P.; Yang, Z.; Zhu, X.; Zhao, S. Multi-objective optimization of electric vehicle and unit commitment considering users satisfaction: An improved MOEA/D algorithm. In Proceedings of the International Conference on Life System Modeling and Simulation, Hangzhou, China, 30 October–1 November 2021; Springer: Singapore, 2021; pp. 76–85. [Google Scholar]
- Marwali, M.K.C.; Ma, H.; Shahidehpour, S.M.; Abdul-Rahman, K.H. Short term generation scheduling in photovoltaic-utility grid with battery storage. In Proceedings of the 20th International Conference on Power Industry Computer Applications, Columbus, OH, USA, 11 May–16 June 1997; IEEE: New York, NY, USA, 1997; pp. 239–244. [Google Scholar]
- Fernandez, M.I.; Go, Y.I.; Früh, W.G.; Wong, D.M. Projection of electricity generation profiles and carbon emissions towards 2050: A Malaysia context. Energy Sustain. Dev. 2025, 85, 101681. [Google Scholar] [CrossRef]
- Ji, J.; Xie, Y.; Wang, Y.; Xiao, J.; Wen, W.; Zhang, C.; Sun, N.; Huang, H.; Zhang, C. Holistic optimization of grid-connected multi-energy systems: Biomass and flexible storage integration. Energy Convers. Manag. 2025, 327, 119558. [Google Scholar] [CrossRef]
- Vaysse, K.; Lagacherie, P. Using quantile regression forest to estimate uncertainty of digital soil mapping products. Geoderma 2017, 291, 55–64. [Google Scholar] [CrossRef]
- Qiao, B.; Liu, J. Multi-objective dynamic economic emission dispatch based on electric vehicles and wind power integrated system using differential evolution algorithm. Renew. Energy 2020, 154, 316–336. [Google Scholar] [CrossRef]
- Khoa, T.H.; Vasant, P.M.; Singh, M.S.B.; Dieu, V.N. Swarm based mean-variance mapping optimization for convex and non-convex economic dispatch problems. Memetic Comput. 2017, 9, 91–108. [Google Scholar] [CrossRef]
- Liu, G.; Zhu, Y.L.; Jiang, W. Wind-thermal dynamic economic emission dispatch with a hybrid multi-objective algorithm based on wind speed statistical analysis. IET Gener. Transm. Distrib. 2018, 12, 3972–3984. [Google Scholar] [CrossRef]
- Zhang, Q.; Li, H. MOEA/D: A multi objective evolutionary algorithm based on decomposition. IEEE Trans. Evol. Comput. 2007, 11, 712–731. [Google Scholar] [CrossRef]
- Yang, D.; Liu, Z.; Zhou, J. Chaos optimization algorithms based on chaotic maps with different probability distribution and search speed for global optimization. Commun. Nonlinear Sci. Numer. Simul. 2014, 19, 1229–1246. [Google Scholar] [CrossRef]
- Fu, S.; Ma, C.; Li, K.; Xie, C.; Fan, Q.; Huang, H.; Xie, J.; Zhang, G.; Yu, M. Modified LSHADE-SPACMA with new mutation strategy and external archive mechanism for numerical optimization and point cloud registration. Artif. Intell. Rev. 2025, 58, 72. [Google Scholar] [CrossRef]
- Guerreiro, A.P.; Fonseca, C.M.; Paquete, L. The hypervolume indicator: Computational problems and algorithms. ACM Comput. Surv. (CSUR) 2021, 54, 119. [Google Scholar] [CrossRef]
- Qu, B.; Qiao, B.; Zhu, Y.; Jiao, Y.; Xiao, J.; Wang, X. Using multi-objective evolutionary algorithm to solve dynamic environment and economic dispatch with EVs. In Proceedings of the International Conference on Swarm Intelligence, Fukuoka, Japan, 27 July–1 August 2017; Springer International Publishing: Cham, Switzerland, 2017; pp. 31–39. [Google Scholar]
- Qu, B.; Qiao, B.; Zhu, Y.; Liang, J.; Wang, L. Dynamic power dispatch considering electric vehicles and wind power using decomposition based multi-objective evolutionary algorithm. Energies 2017, 10, 1991. [Google Scholar] [CrossRef]
- Alvarez-Benitez, J.E.; Everson, R.M.; Fieldsend, J.E. A MOPSO algorithm based exclusively on pareto dominance concepts. In Proceedings of the International Conference on Evolutionary Multi-Criterion Optimization, Guanajuato, Mexico, 9–11 March 2005; Springer: Berlin/Heidelberg, Germany, 2005; pp. 459–473. [Google Scholar]
- Babu, B.V.; Jehan, M.M.L. Differential evolution for multi-objective optimization. In Proceedings of the 2003 Congress on Evolutionary Computation, 2003. CEC’03, Canberra, Australia, 8–12 December 2003; IEEE: New York, NY, USA, 2003; Volume 4, pp. 2696–2703. [Google Scholar]
- Mirjalili, S. Dragonfly algorithm: A new meta-heuristic optimization technique for solving single-objective, discrete, and multi-objective problems. Neural Comput. Appl. 2016, 27, 1053–1073. [Google Scholar] [CrossRef]
- Zhao, W.; Wang, L.; Mirjalili, S. Artificial hummingbird algorithm: A new bio-inspired optimizer with its engineering applications. Comput. Methods Appl. Mech. Eng. 2022, 388, 114194. [Google Scholar] [CrossRef]
- Deb, K.; Agrawal, S.; Pratap, A.; Meyarivan, T. A fast elitist non-dominated sorting genetic algorithm for multi-objective optimization: NSGA-II. In Proceedings of the International Conference on Parallel Problem Solving from Nature, Paris, France, 18–20 September 2000; Springer: Berlin/Heidelberg, Germany, 2000; pp. 849–858. [Google Scholar]
- Deb, K.; Jain, H. An evolutionary many-objective optimization algorithm using reference-point-based nondominated sorting approach, part I: Solving problems with box constraints. IEEE Trans. Evol. Comput. 2013, 18, 577–601. [Google Scholar] [CrossRef]
Disclaimer/Publisher’s Note: The statements, opinions and data contained in all publications are solely those of the individual author(s) and contributor(s) and not of MDPI and/or the editor(s). MDPI and/or the editor(s) disclaim responsibility for any injury to people or property resulting from any ideas, methods, instructions or products referred to in the content. |
© 2025 by the authors. Licensee MDPI, Basel, Switzerland. This article is an open access article distributed under the terms and conditions of the Creative Commons Attribution (CC BY) license (https://creativecommons.org/licenses/by/4.0/).