Advancing Sustainable Pavements: Life Cycle Assessment and Global Warming Potential Benchmarking for Asphalt Mixtures in Louisiana
Abstract
1. Introduction
2. Objective and Scope
- (A)
- Conduct an LCA for asphalt mixture production in Louisiana,
- (B)
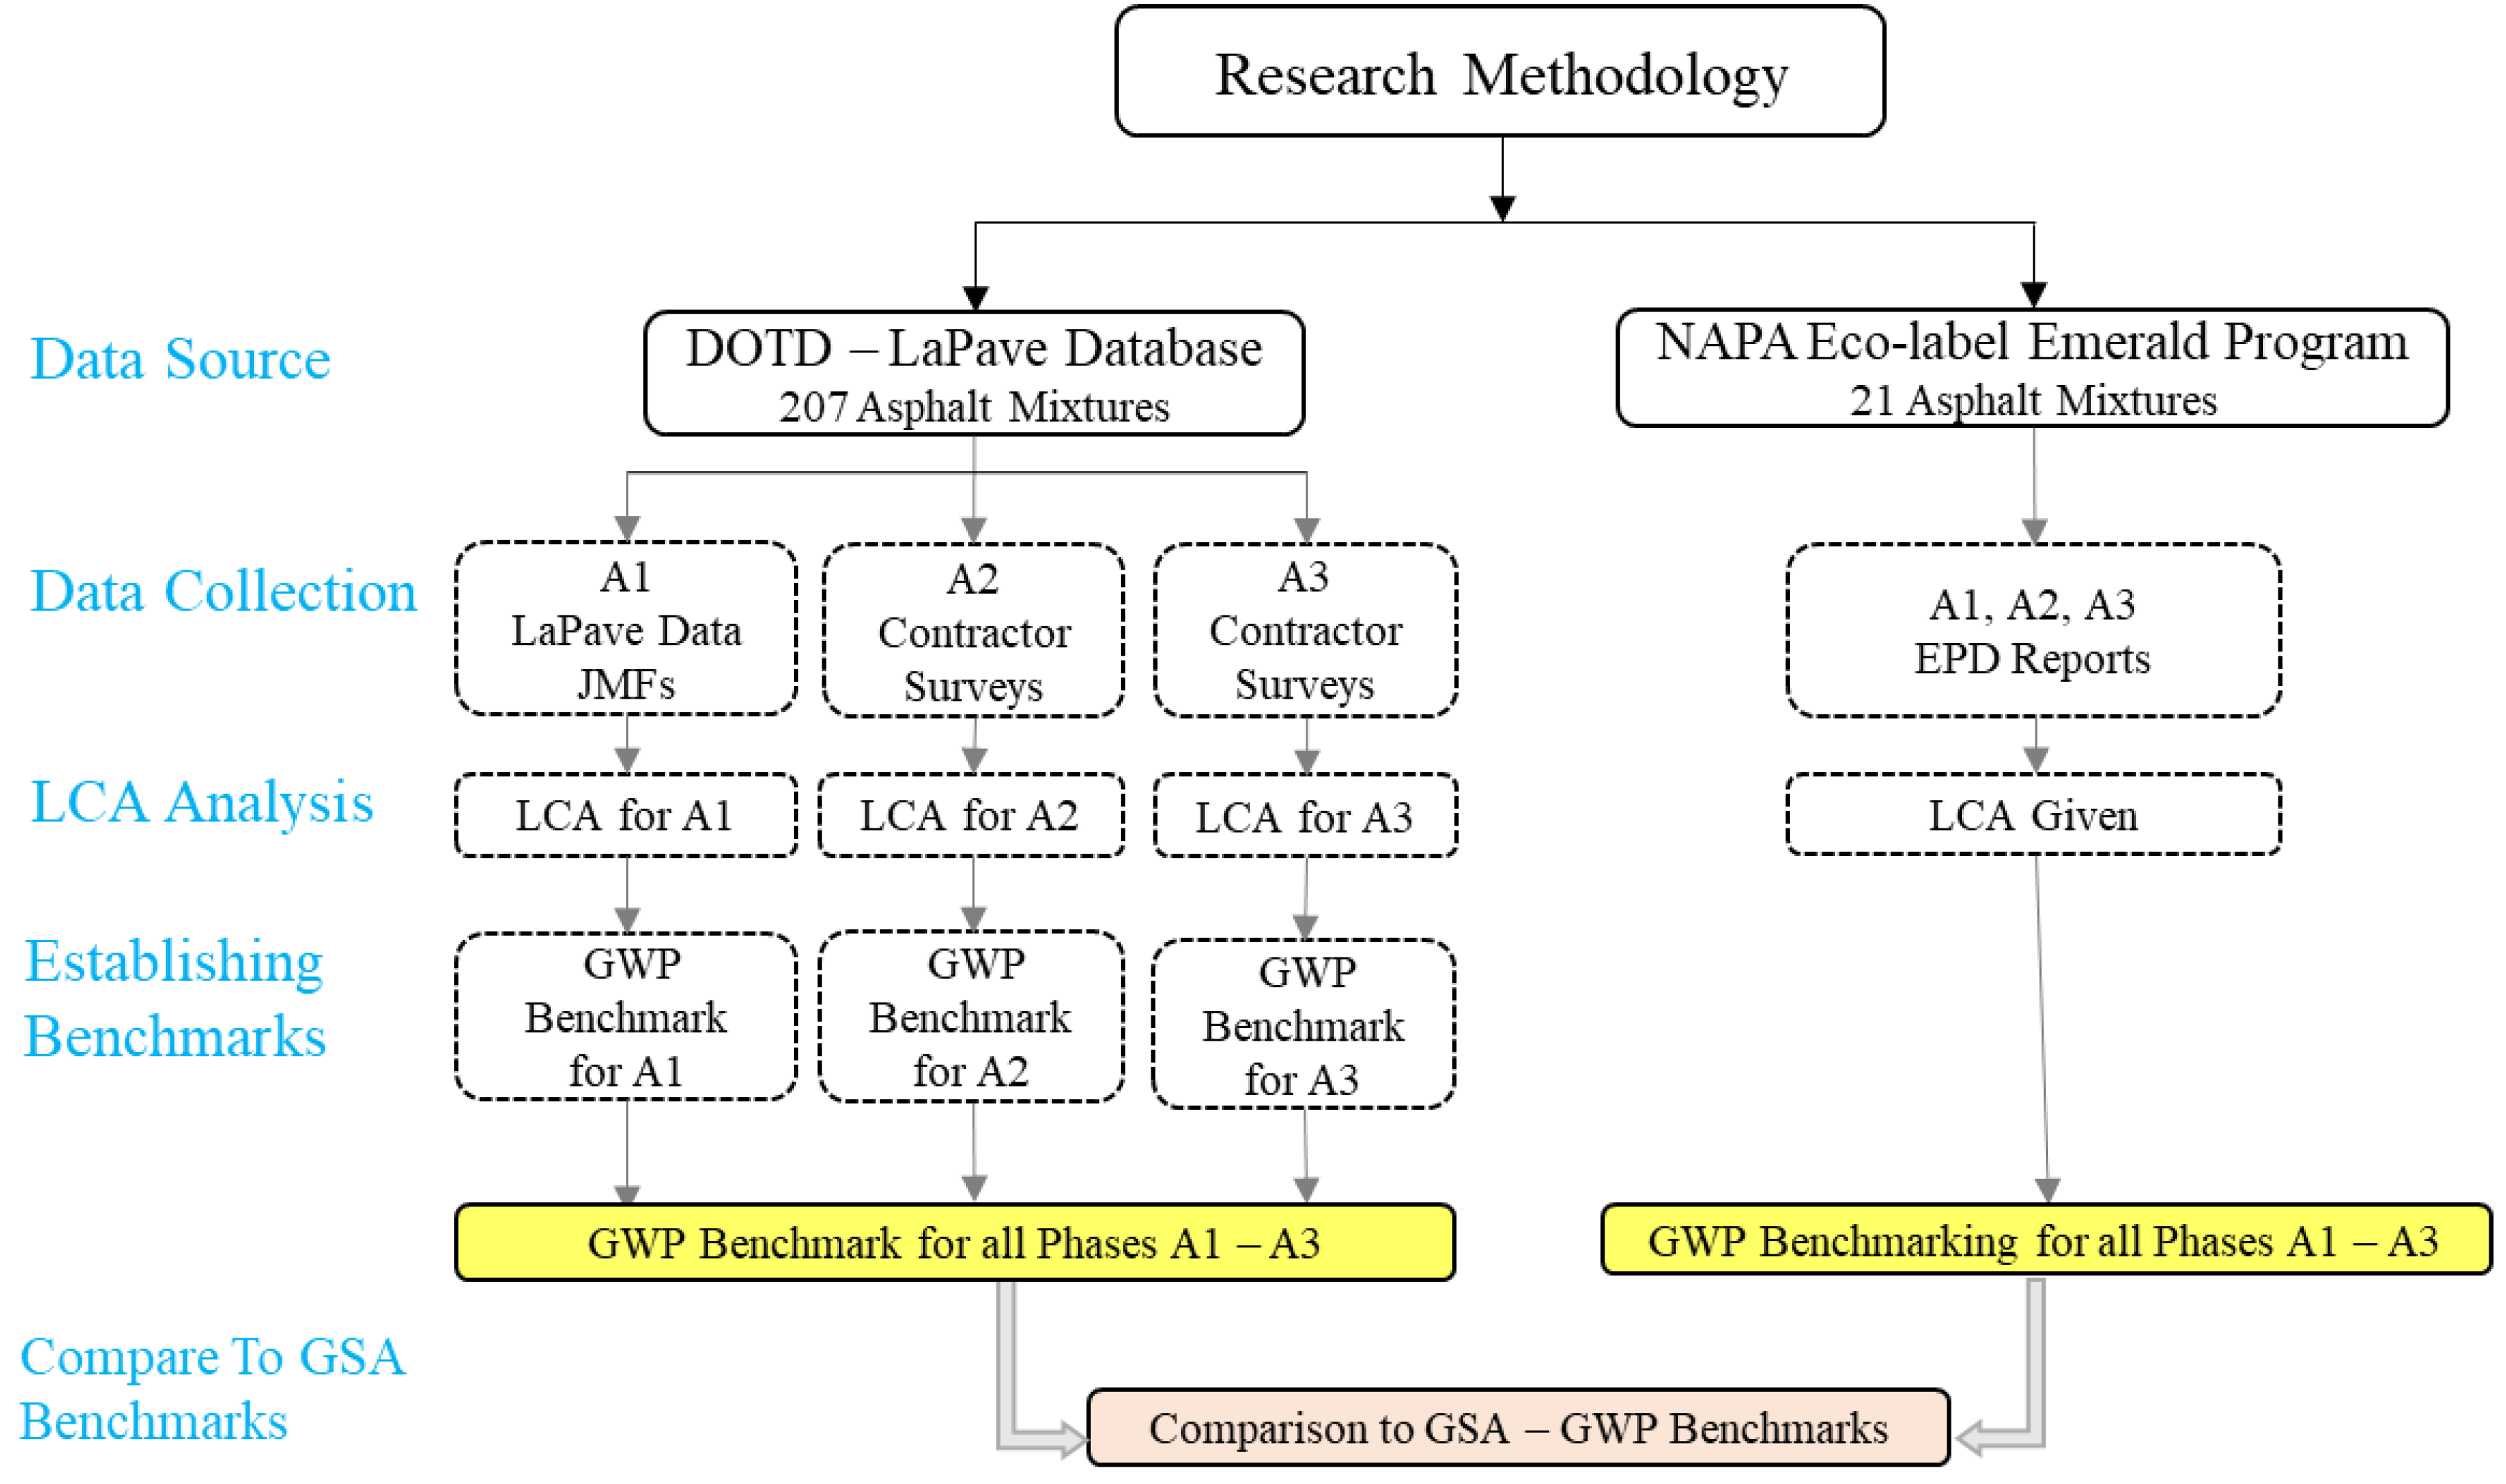
- Establish GWP benchmarks for asphalt mixture production in Louisiana based on two data sources: EPD reports collected from NAPA’s Eco-label Emerald program, and historical data collected from the LaPave database at DOTD and contractor surveys,
- (C)
- Develop GWP benchmarks tailored to specific asphalt mixture types, categorized by their mixture design level as classified by DOTD, and
- (D)
- Compare both approaches of GWP benchmarks to the ones proposed by GSA.
3. Data Collection and Life Cycle Inventory
- DOTD (LaPave) construction materials database: A total of 207 asphalt mixtures’ JMFs, which were utilized in paving routes in Louisiana, were collected. The properties of the collected asphalt mixtures are presented in Table 1.
- The 21 EPD asphalt mixture reports of Louisiana were collected from the NAPA website [15], and the asphalt mixtures’ properties are presented in Table 1. EPD reports contain GWP for phases A1, A2, and A3. As such, there was no need to conduct an LCI or LCA for NAPA’s reports in this study; subsequently, GWP benchmarks were established directly.
4. Environmental Impact Analysis and Life Cycle Assessment
5. Global Warming Potential (GWP) Benchmarking
- xi is the value of GWP for a studied mixture.
- N is the total number of studied mixtures.
- Sort the GWP values in ascending order.
- Determine the first (Q1 = GWP at 25% of data points), second (Q2 = GWP at 50% of data points), and third (Q3 = GWP at 75% of data points) quartiles.
- Compute the Interquartile Range (IQR): IQR = Q3 − Q1
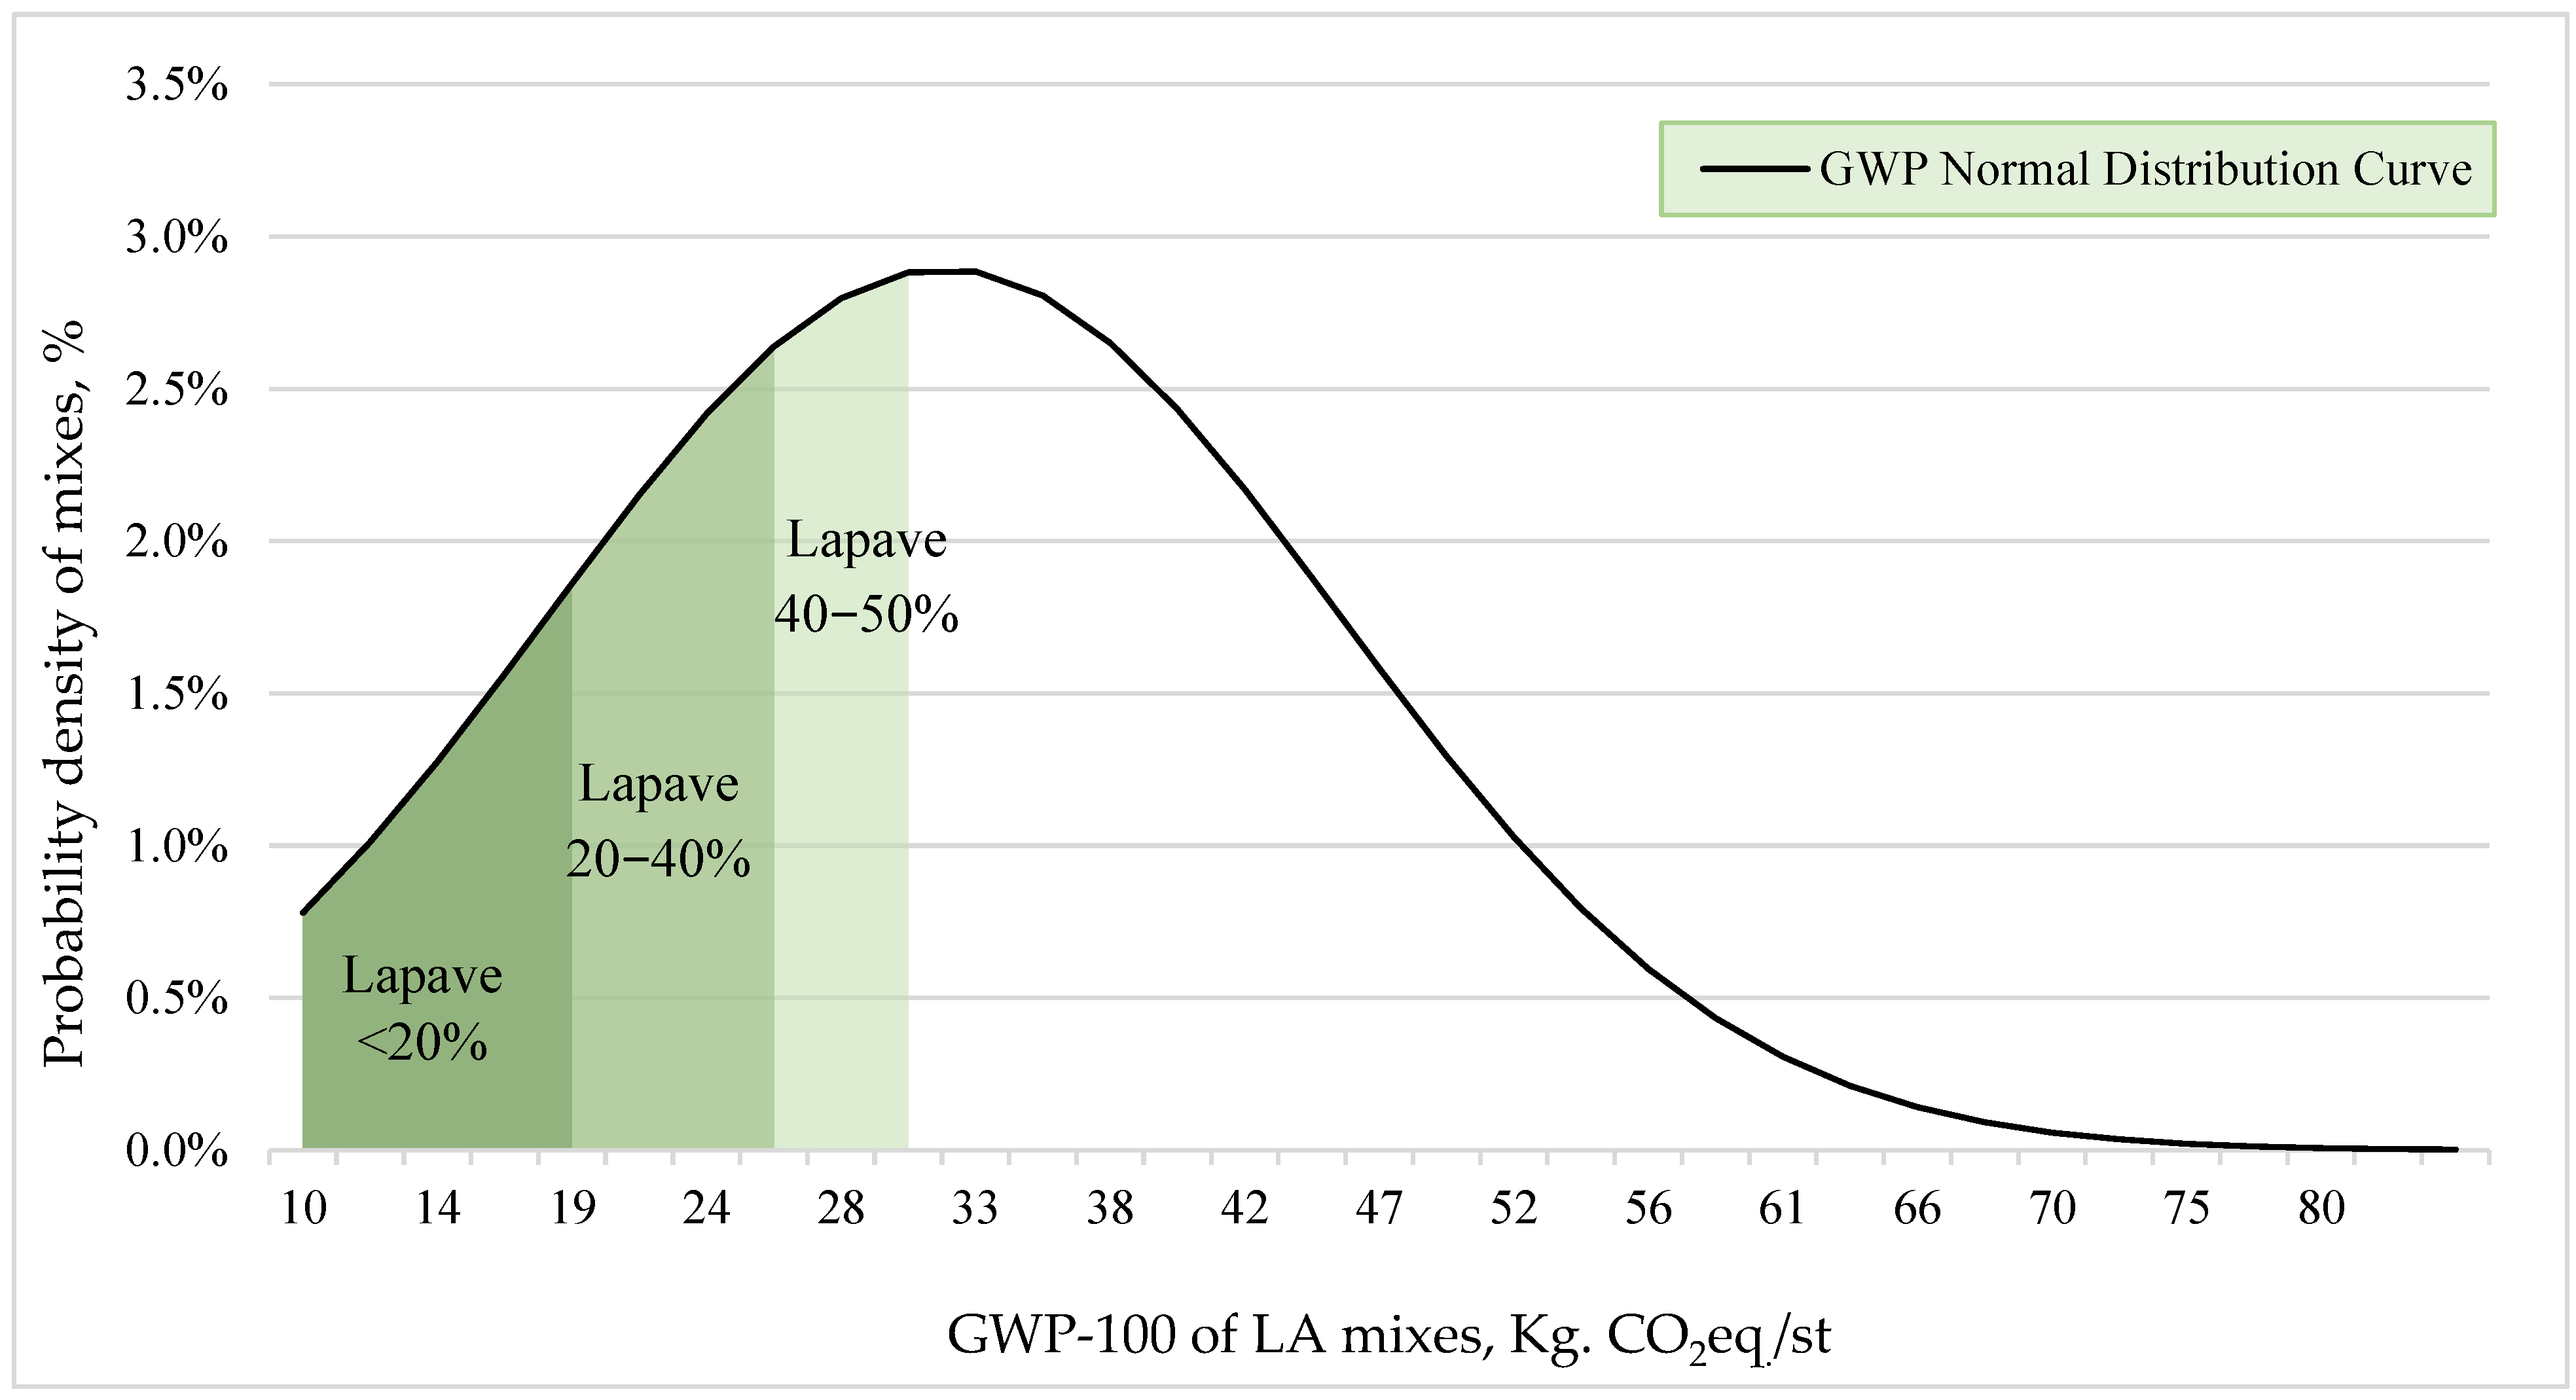
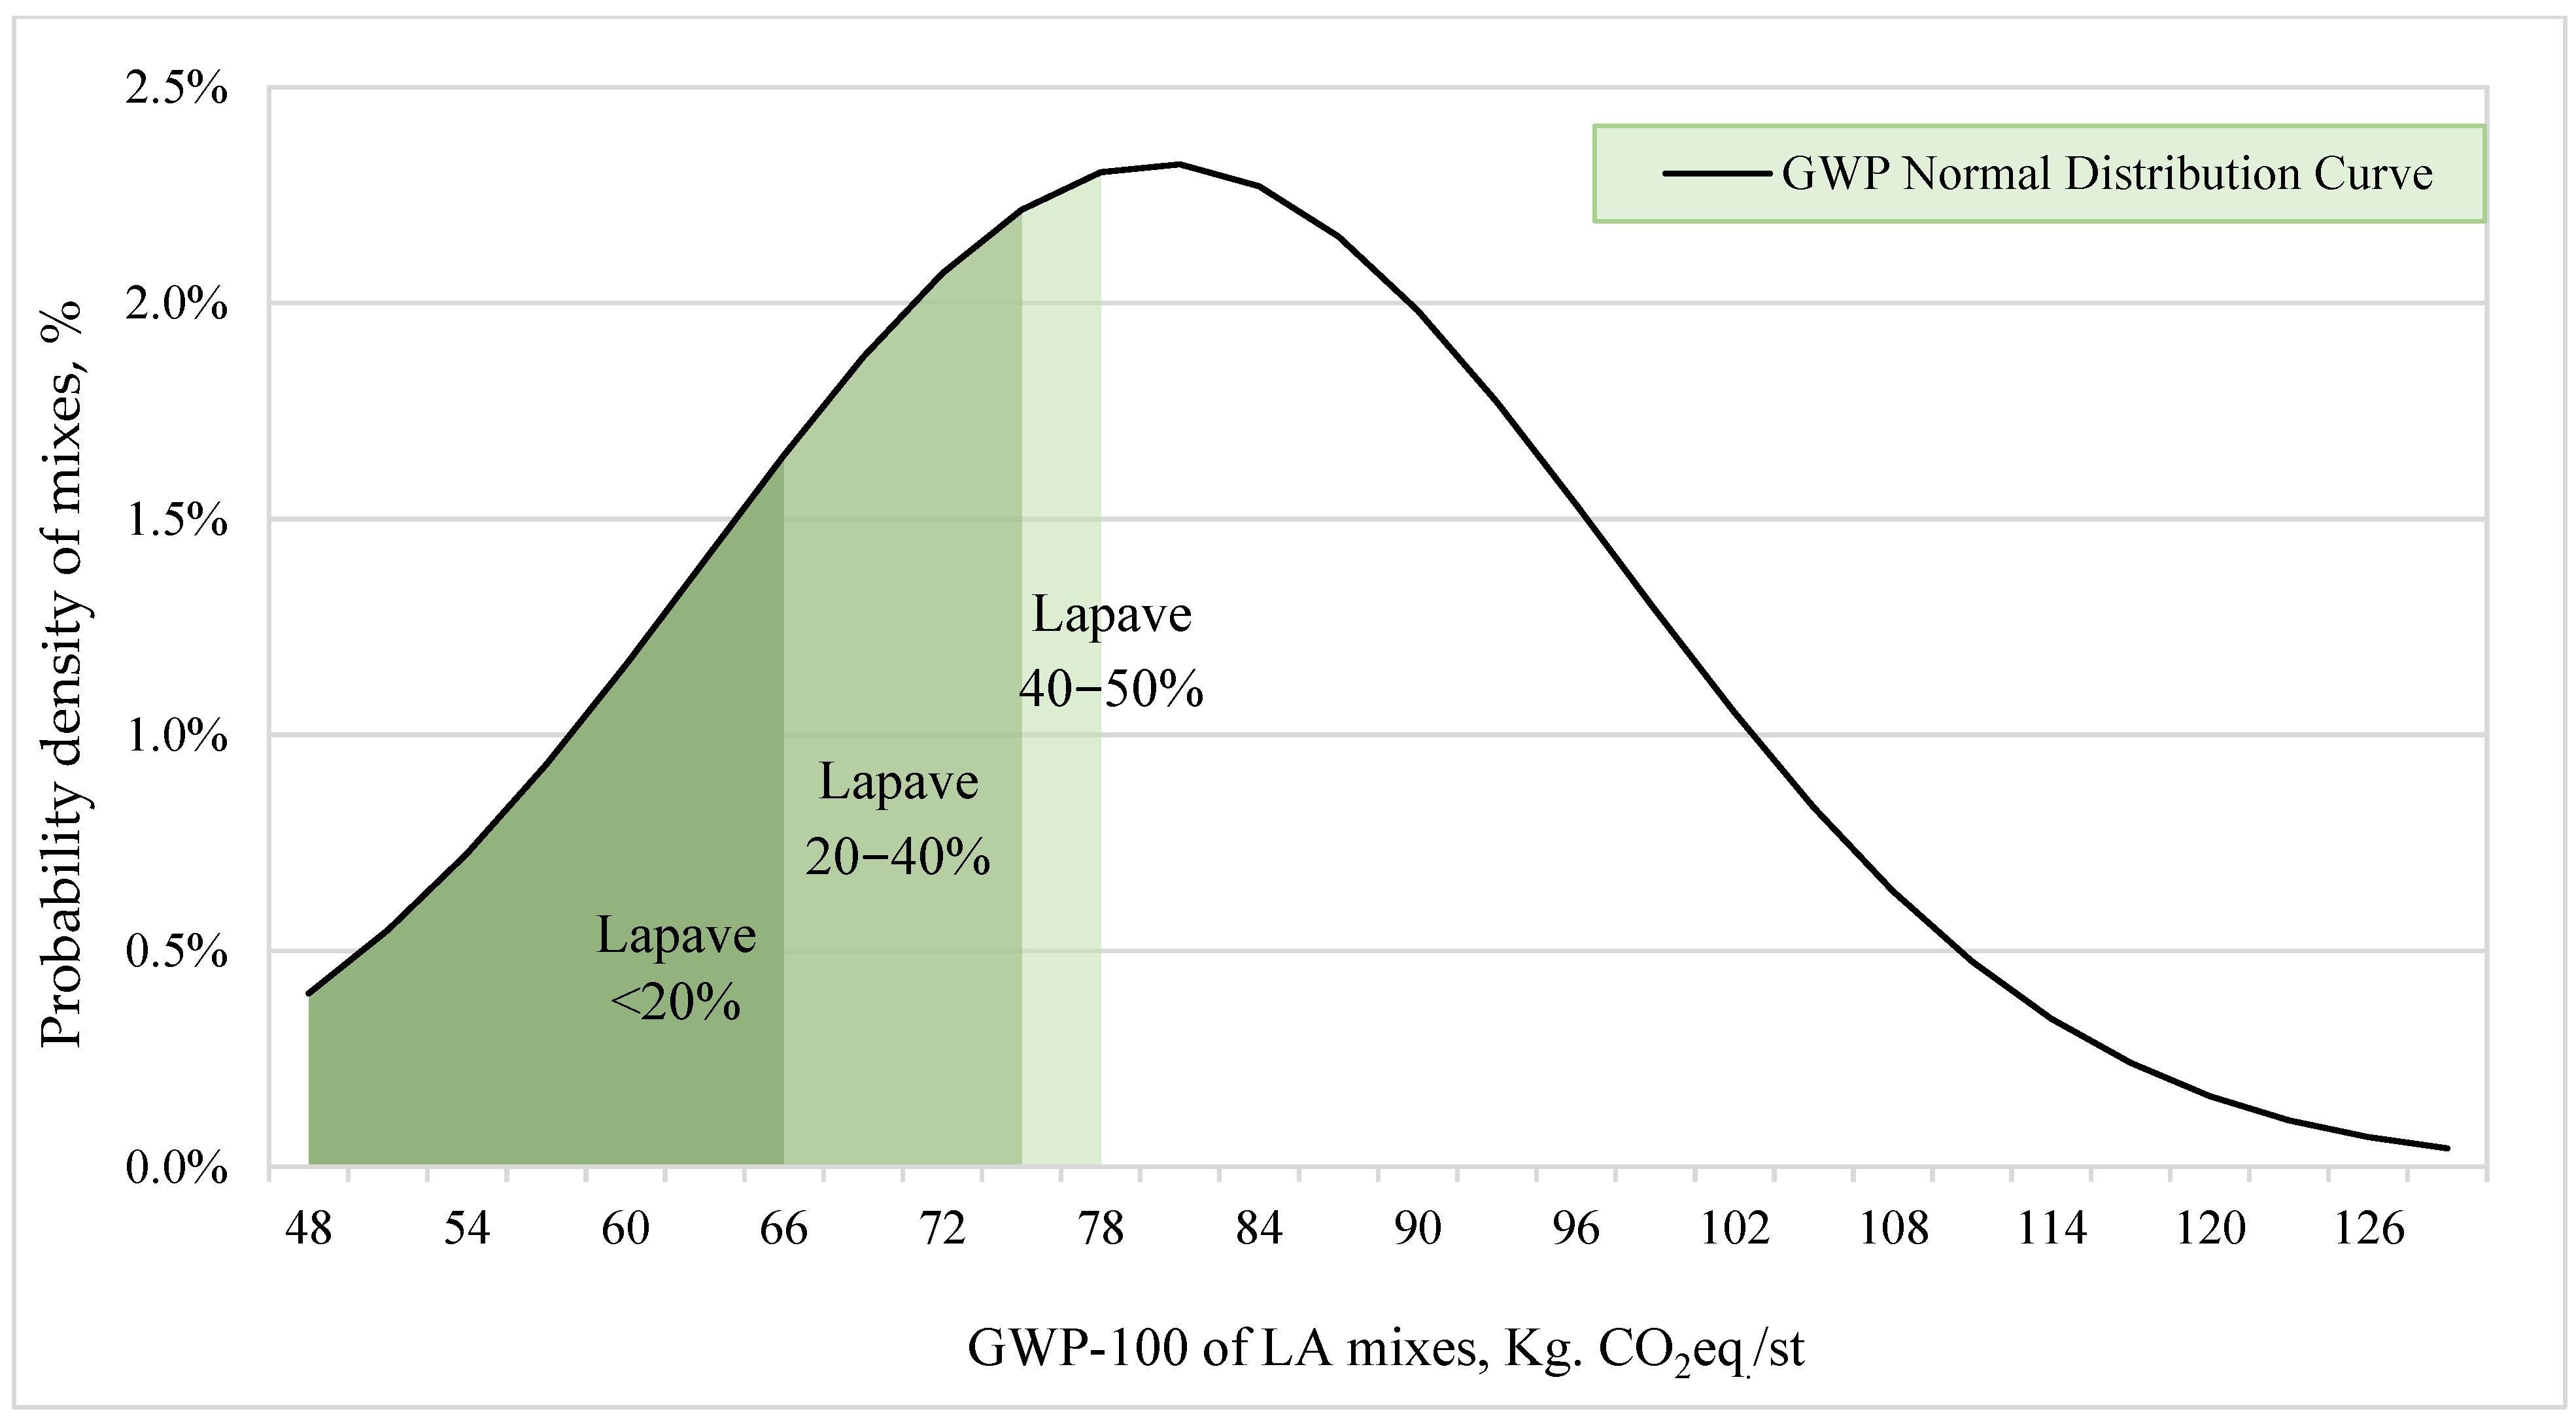
6. Establishing Normal and Cumulative Distribution Curves
- a.
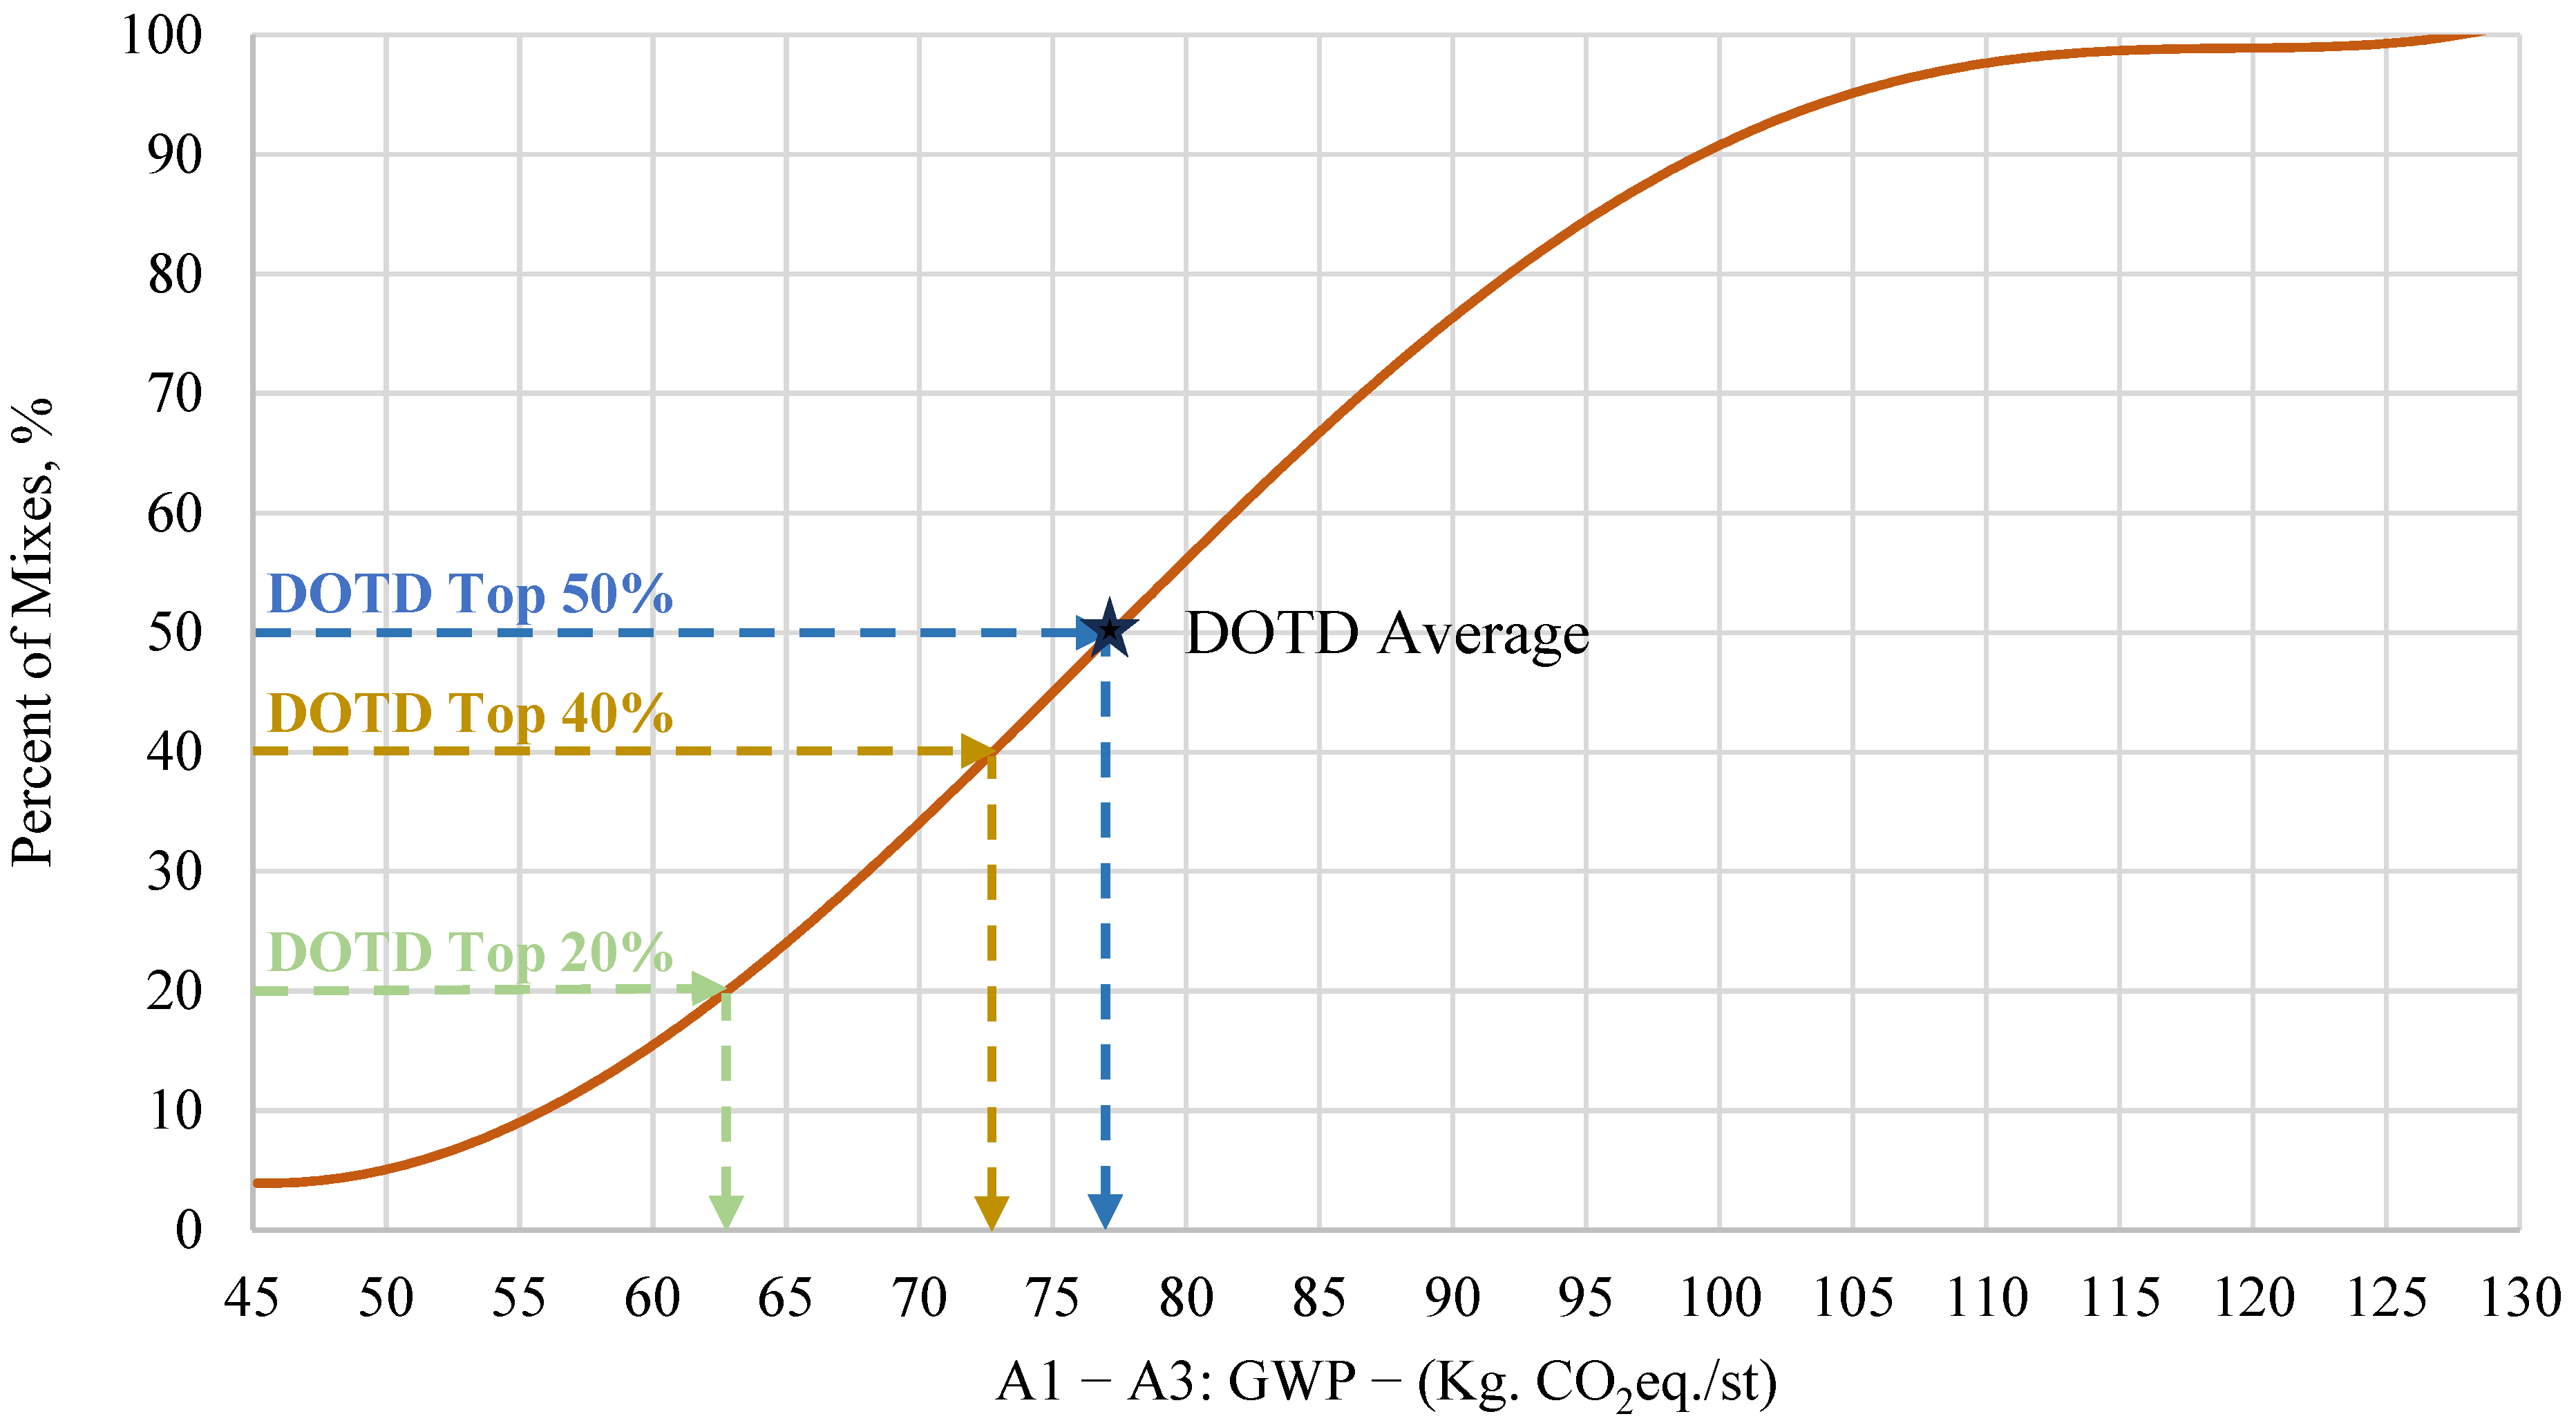
- GWP values for asphalt mixtures obtained from the LaPave database
- b.
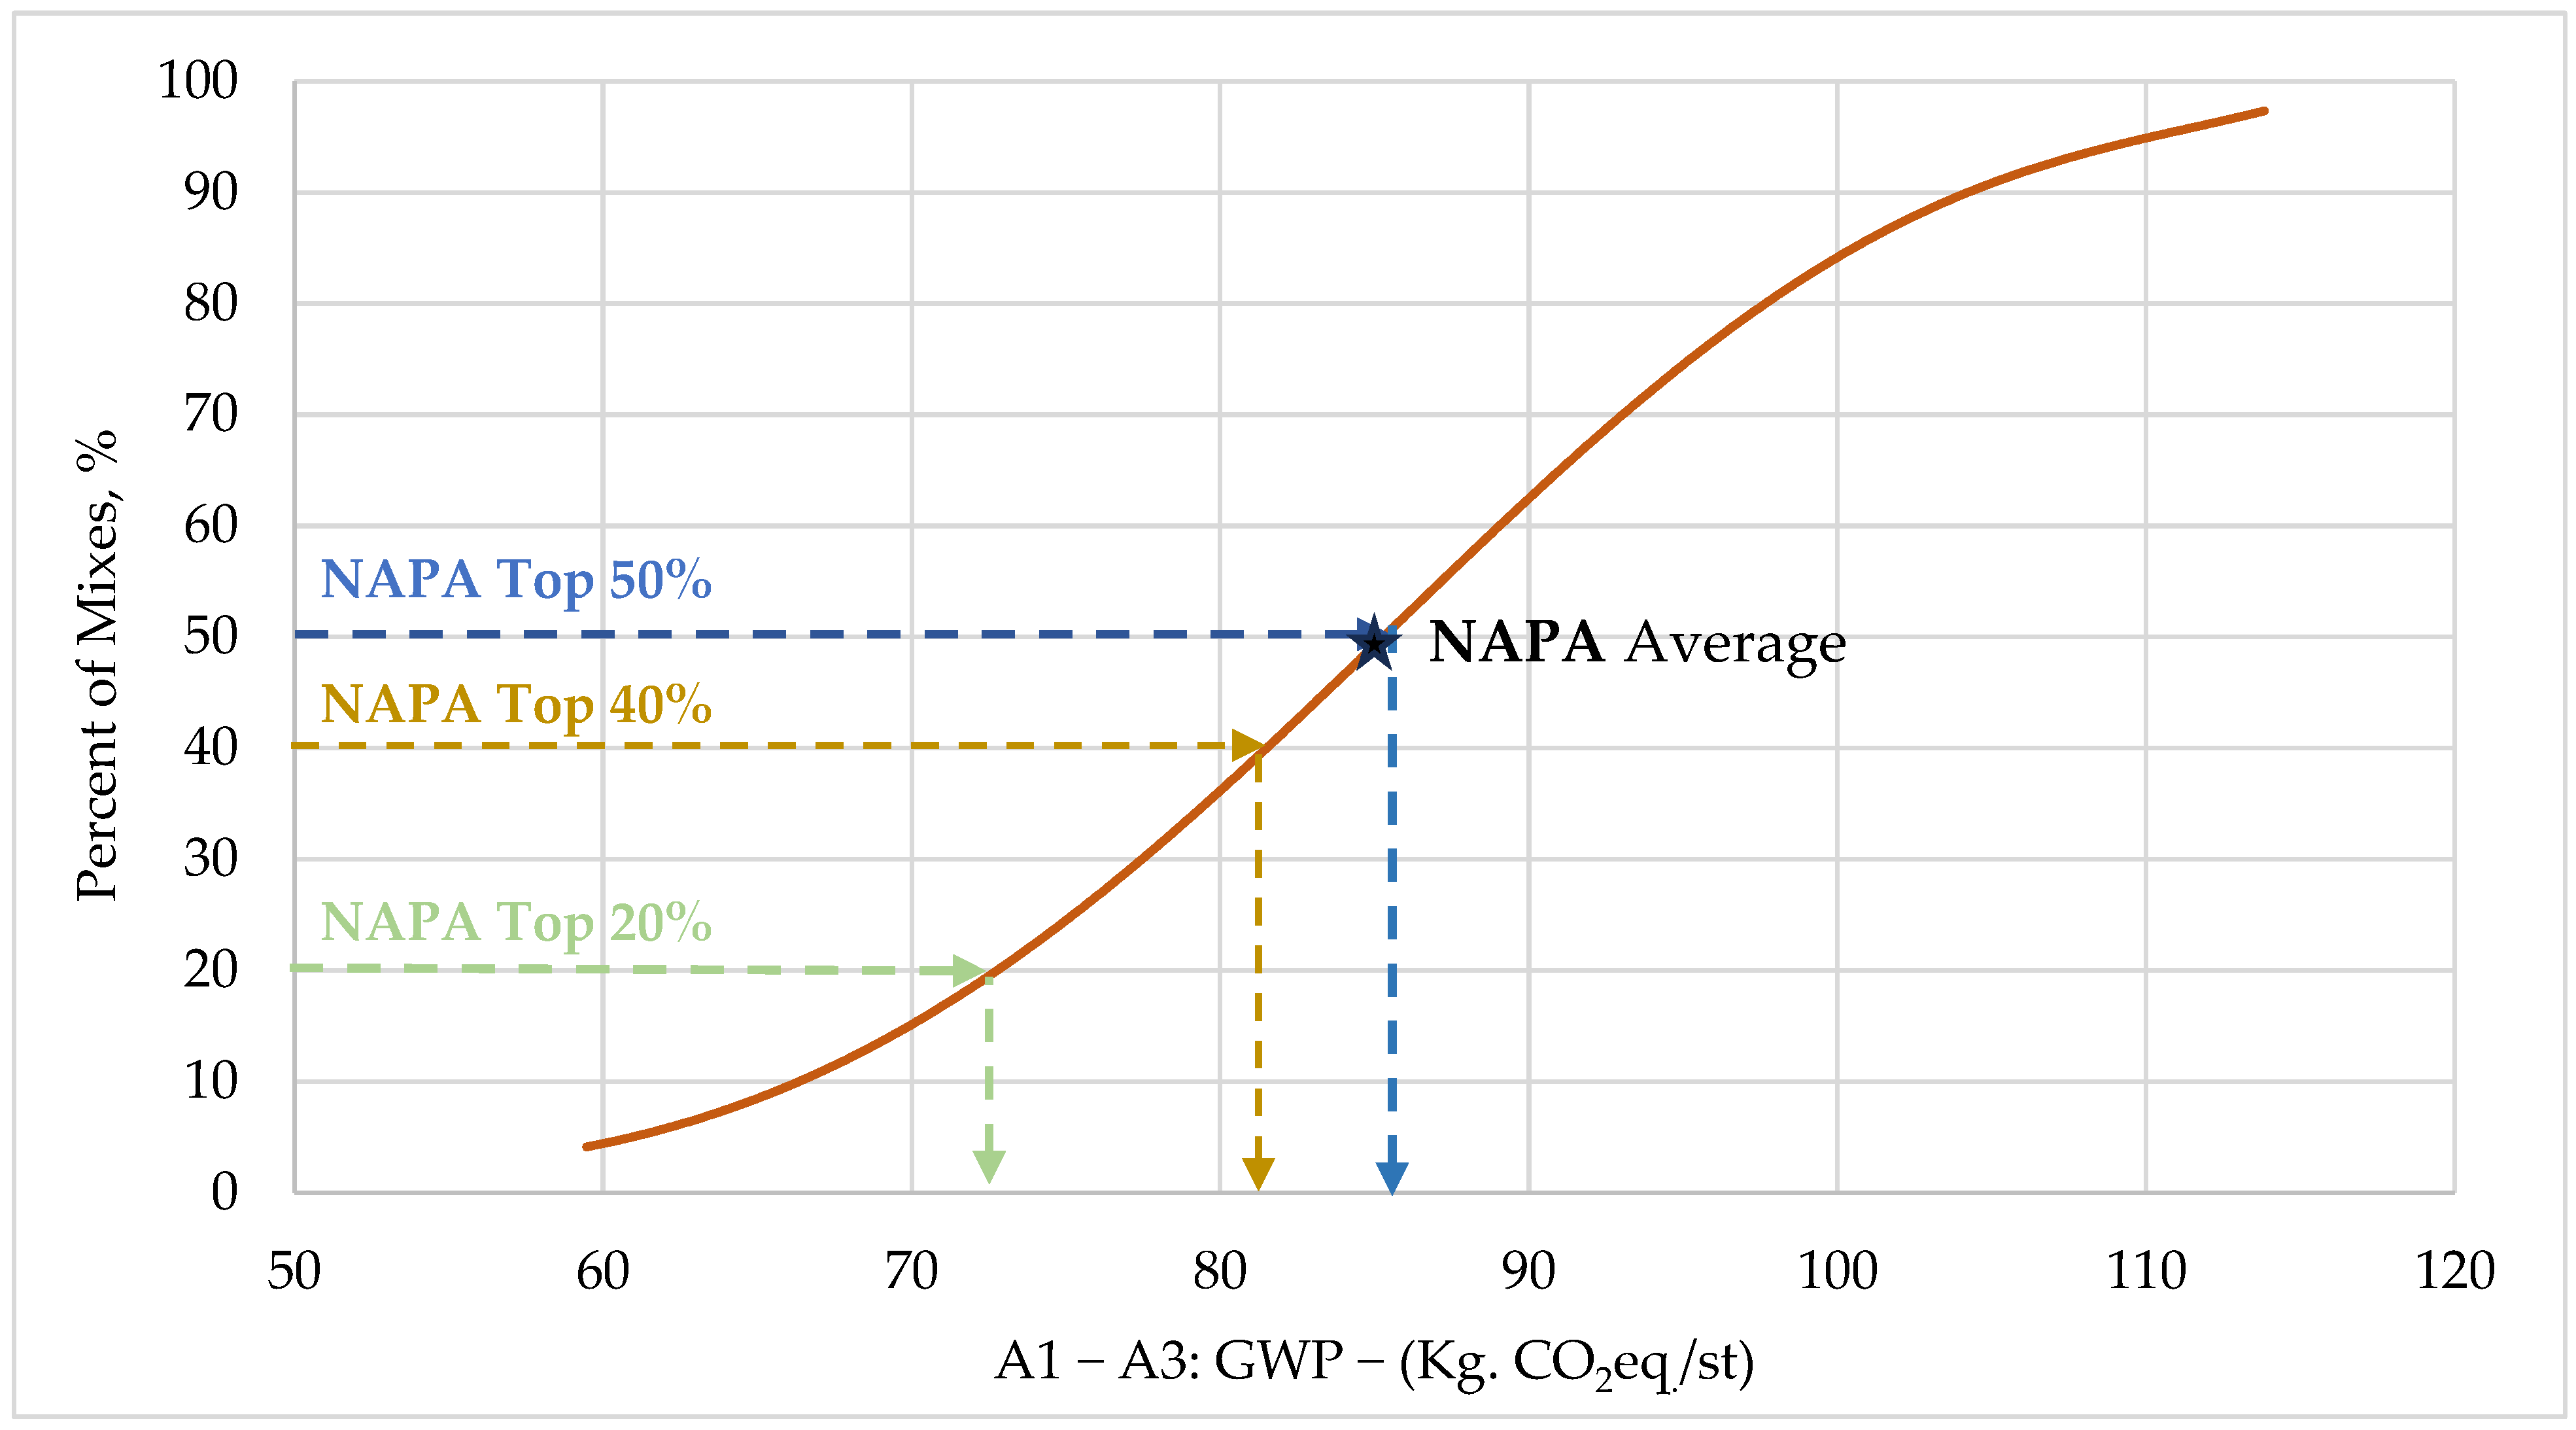
- GWP values for asphalt mixtures obtained from NAPA Reports
7. Developing GWP Benchmarks for Asphalt Mixtures as Classified by DOTD
- Based on nominal maximum aggregate size (NMAS)
- Based on the traffic design level
- Based on average daily traffic (ADT)
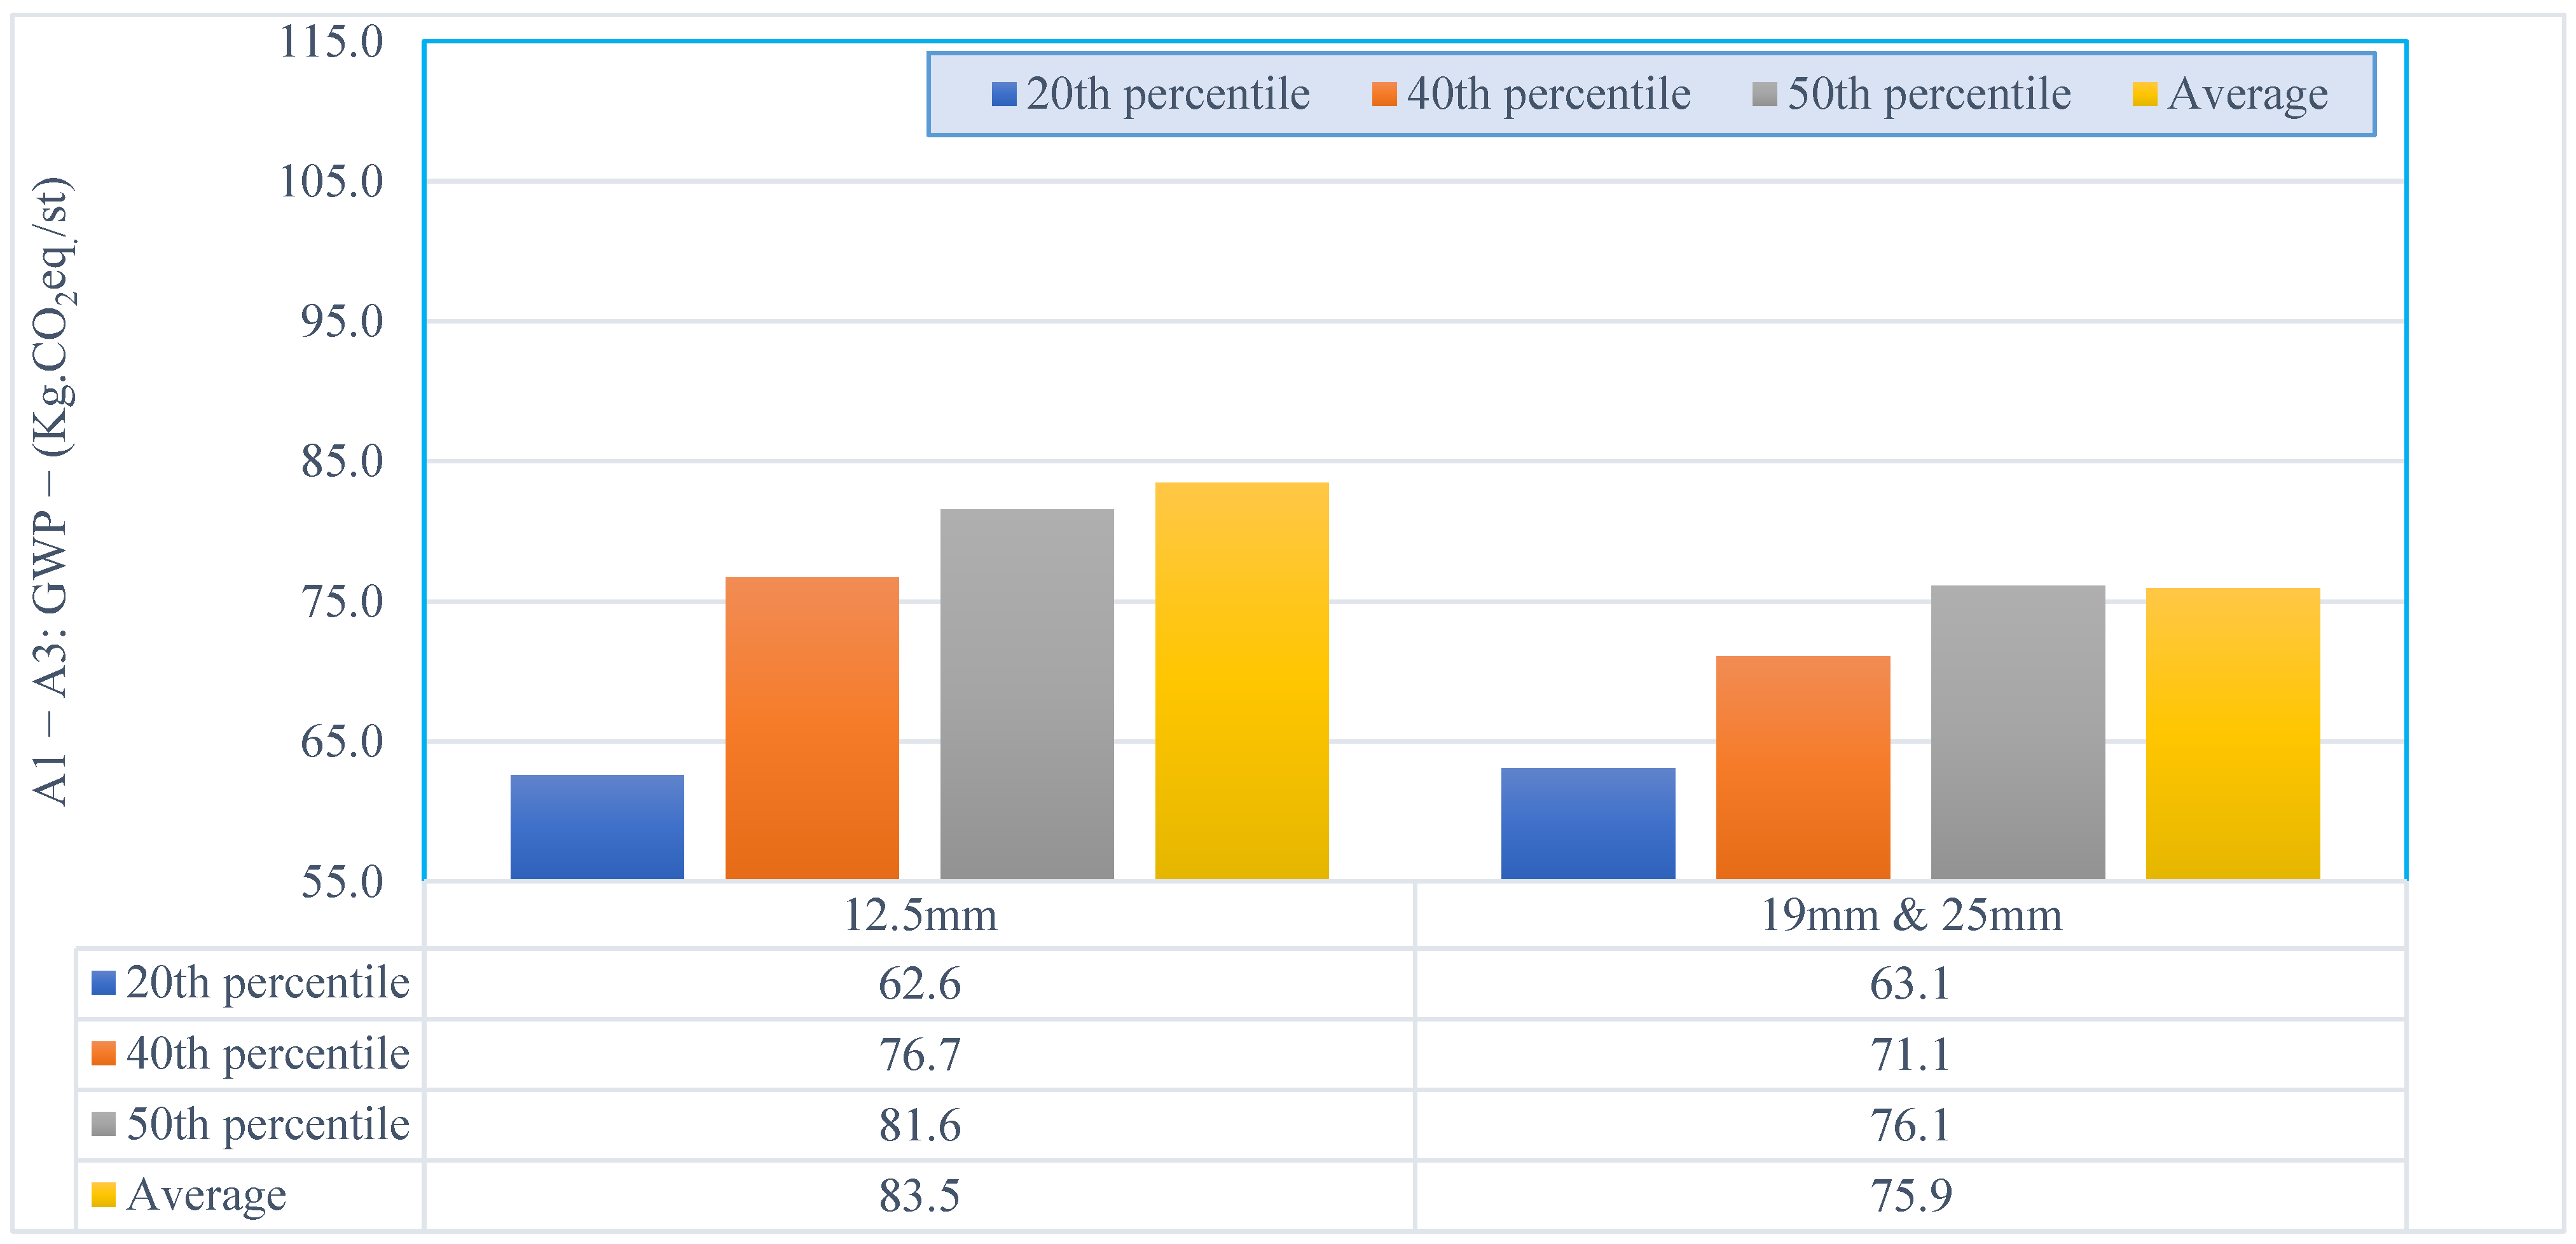
- The results showed a statistically significant difference between mixtures with an NMAS of 12.5 mm and mixtures with a larger NMAS (19 mm and 25 mm), with a p-value of 0.017, Figure 10. It is worth noting that finer-graded mixtures release higher GWP emissions due to increased surface area of finer aggregates, which necessitates higher asphalt binder content to achieve adequate coating and workability. Asphalt binder is known for producing significantly high GWP emissions.
- 2.
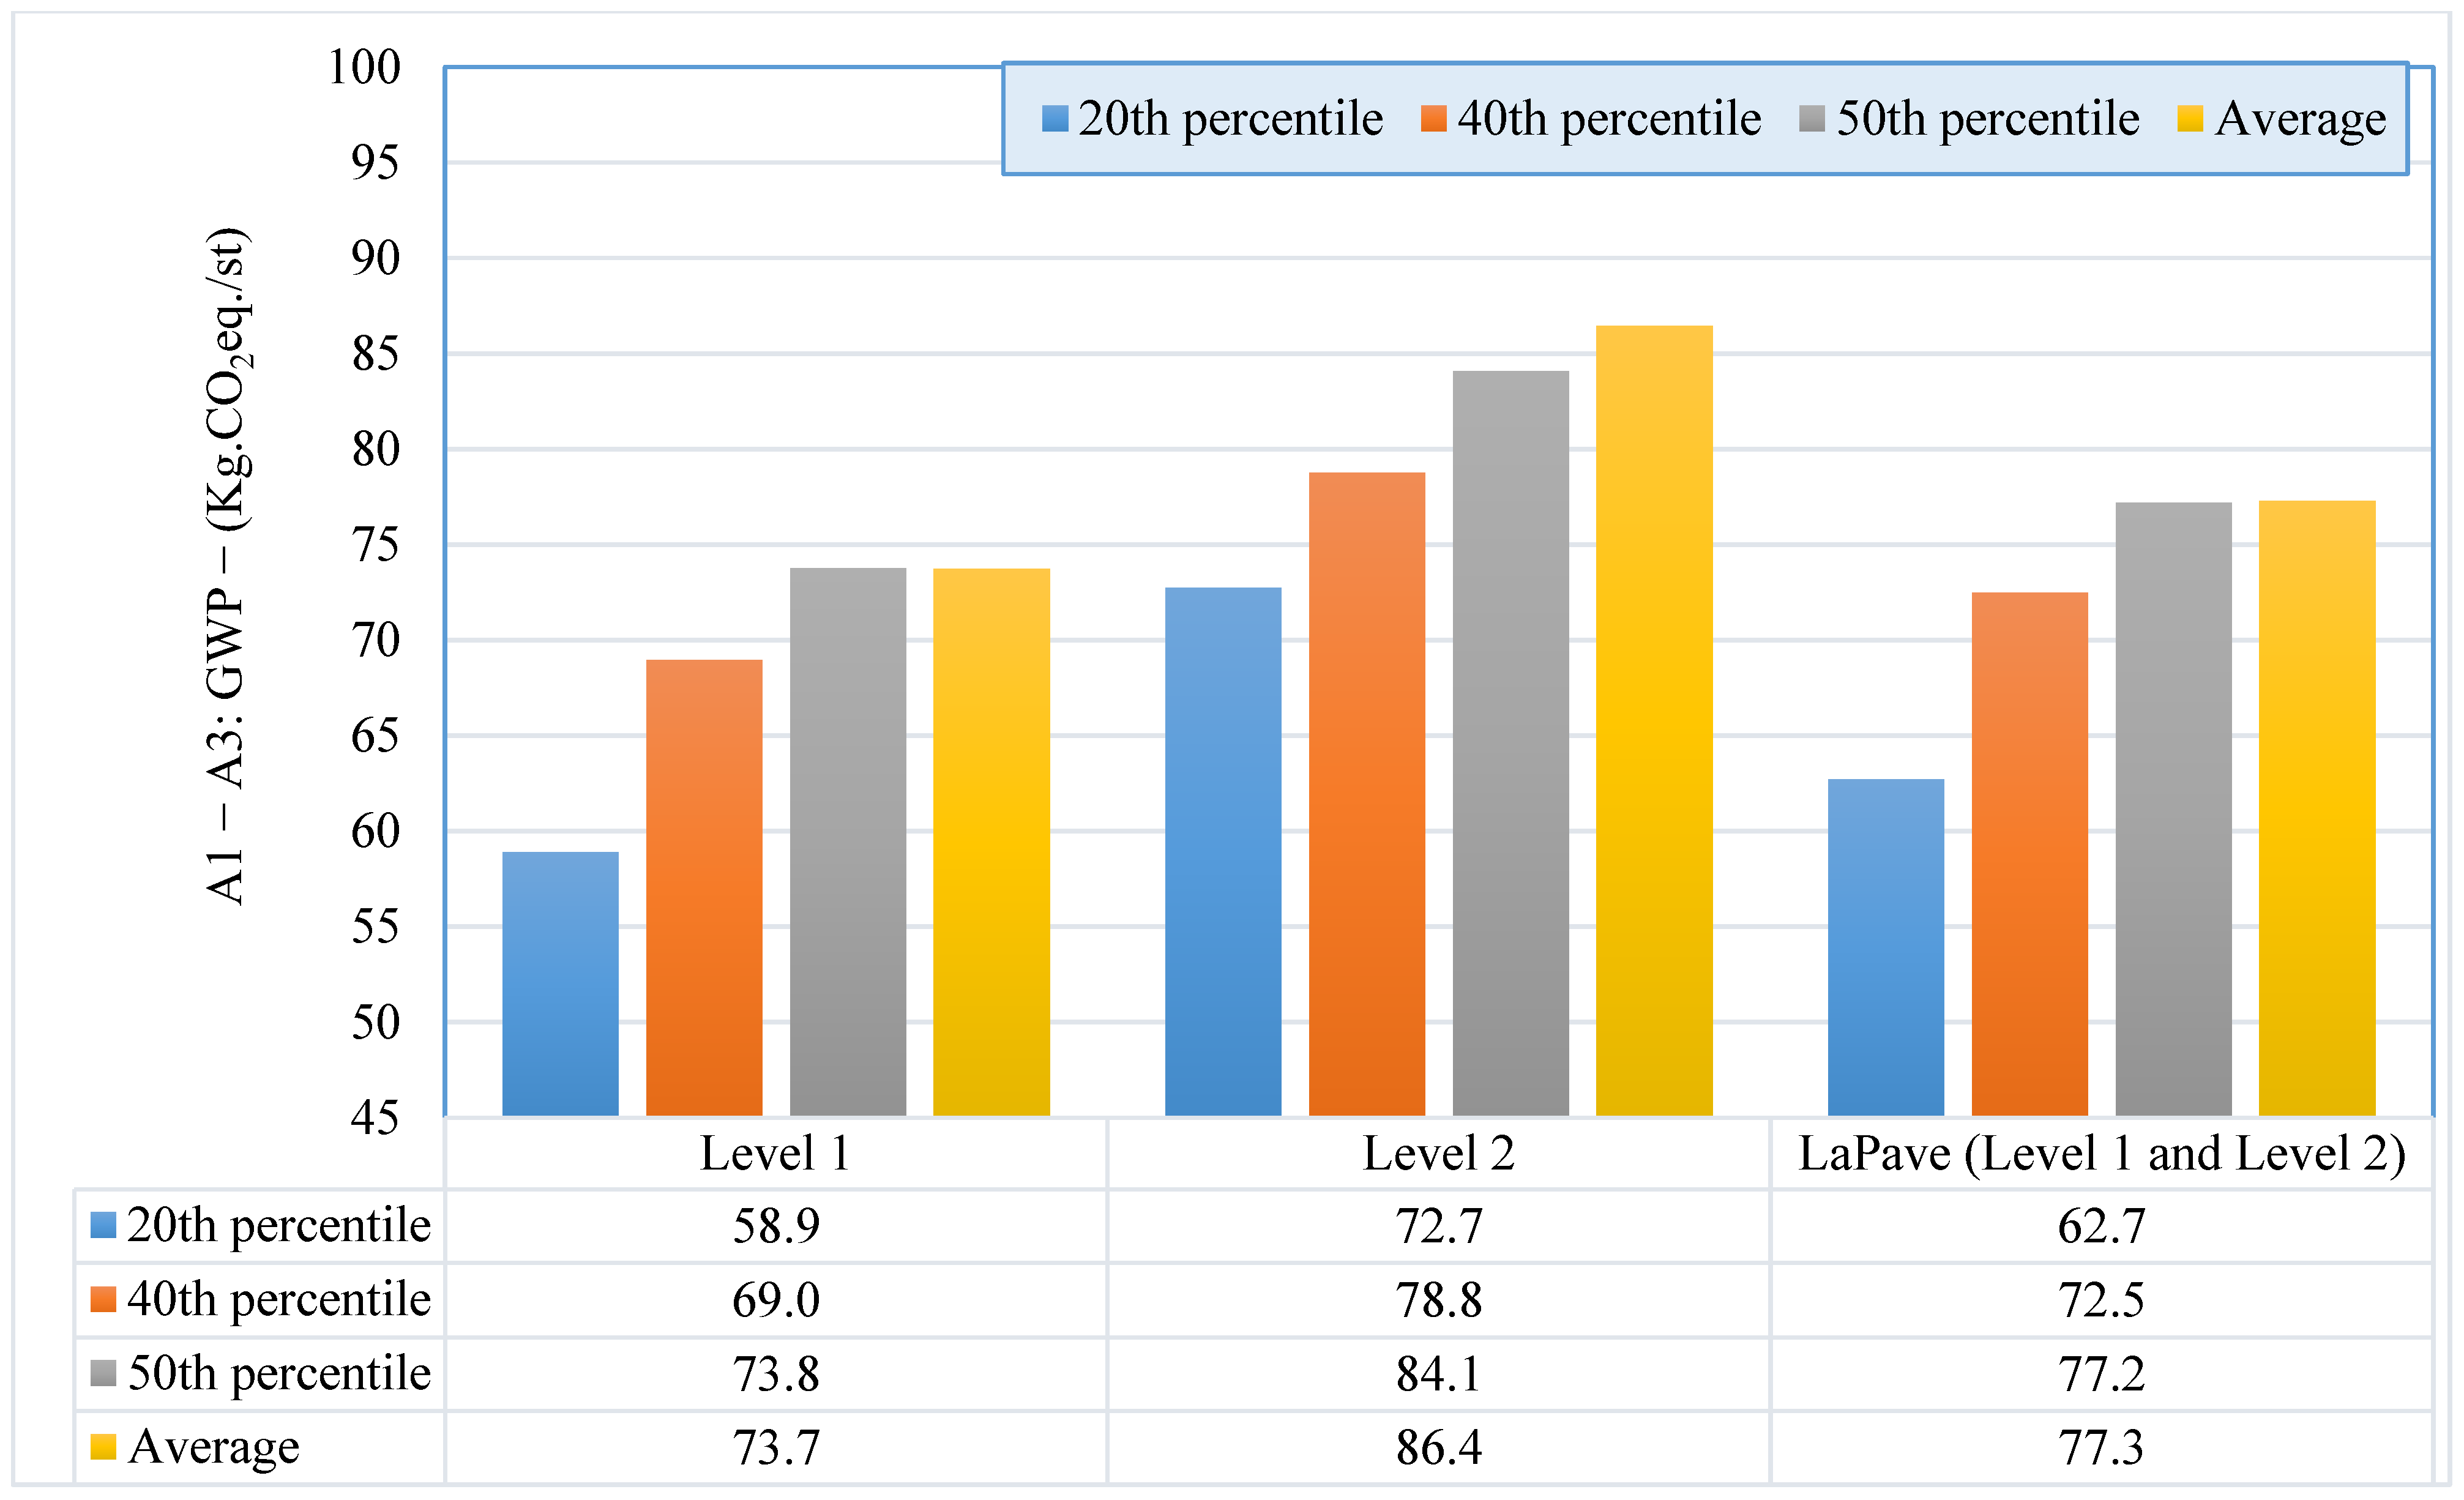
- The asphalt mixture designed for traffic level 2 showed significantly higher GWP emissions (p < 0.001) than mixtures designed for traffic level 1. Mixtures designed for higher traffic levels (more than three mESALs) produce 17.2% higher emissions compared to mixtures designed for lower traffic design level (Less than three mESALs), Figure 11. This might be attributable to the structural requirements of high-traffic pavements, which often demand high-quality binder, higher binder content, and less recycled materials than low-traffic pavements.
- 3.
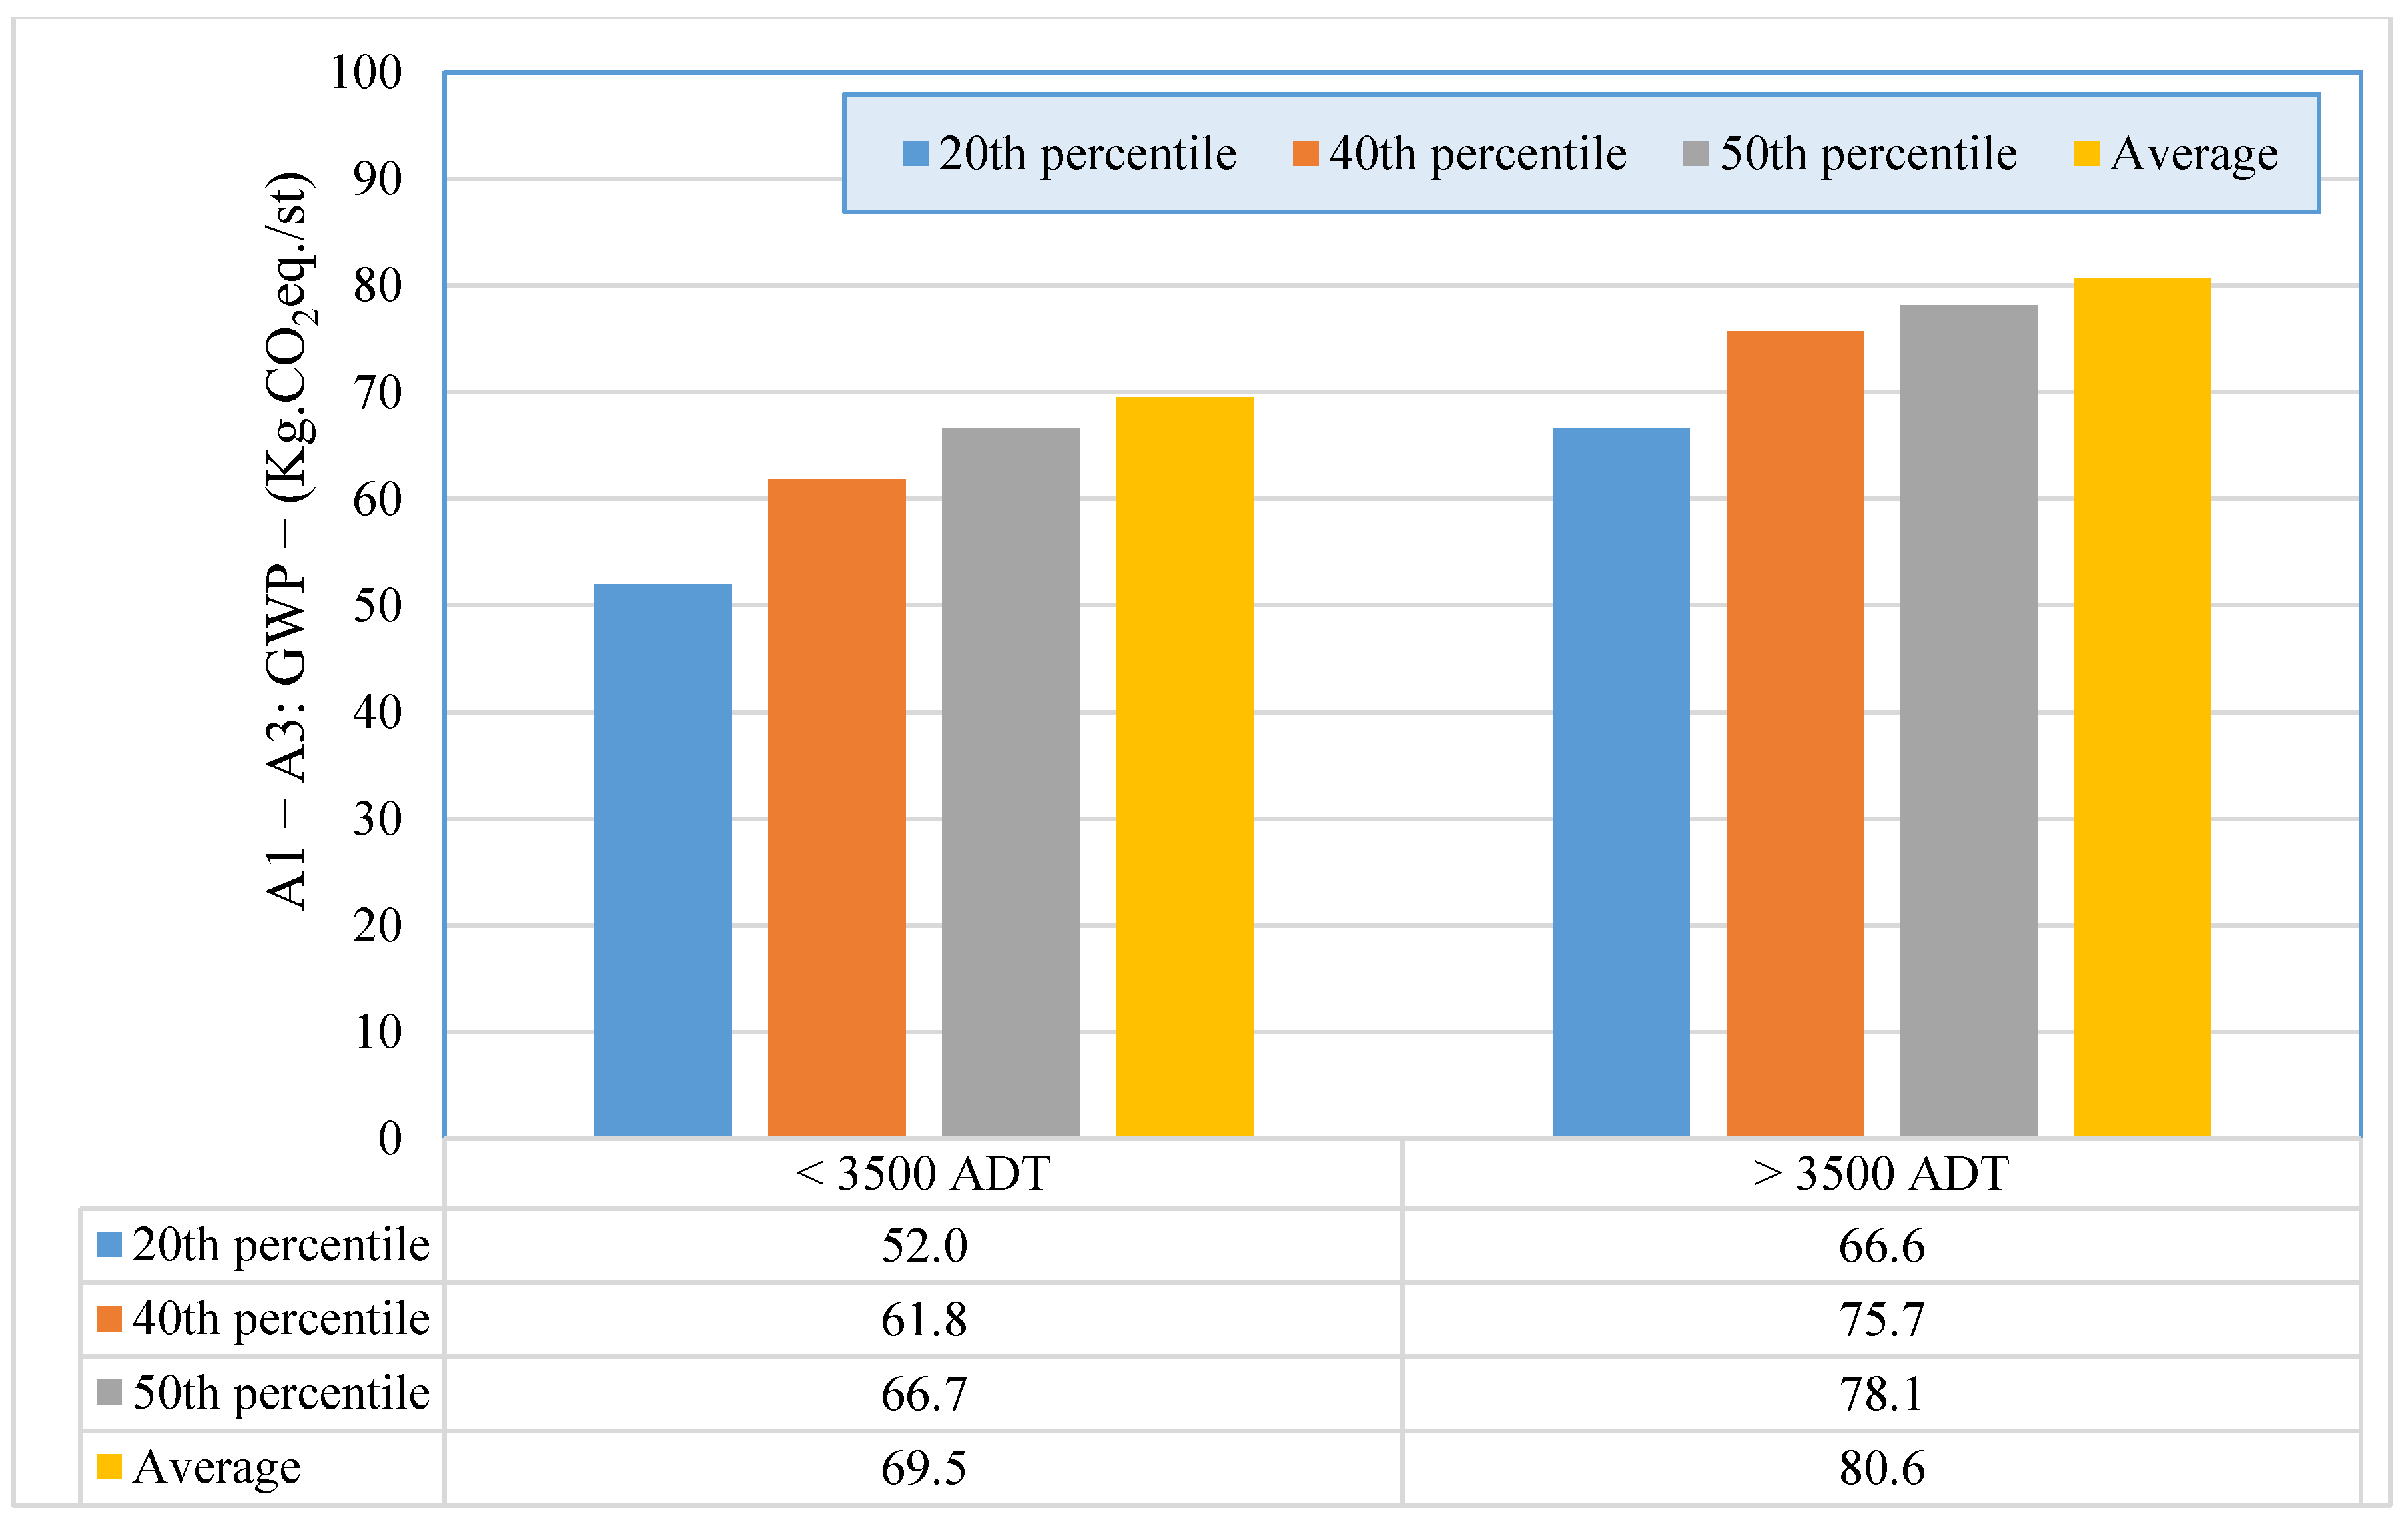
- The asphalt mixtures serving less ADT than 3500 vehicle per day (vpd) showed a significant reduction in GWP emissions when compared to the ones with higher ADT, Figure 12. This might be attributable to the higher structural requirements for high volume roads, which often demand high-quality binder, higher binder content, and less recycled materials.
8. Conclusions
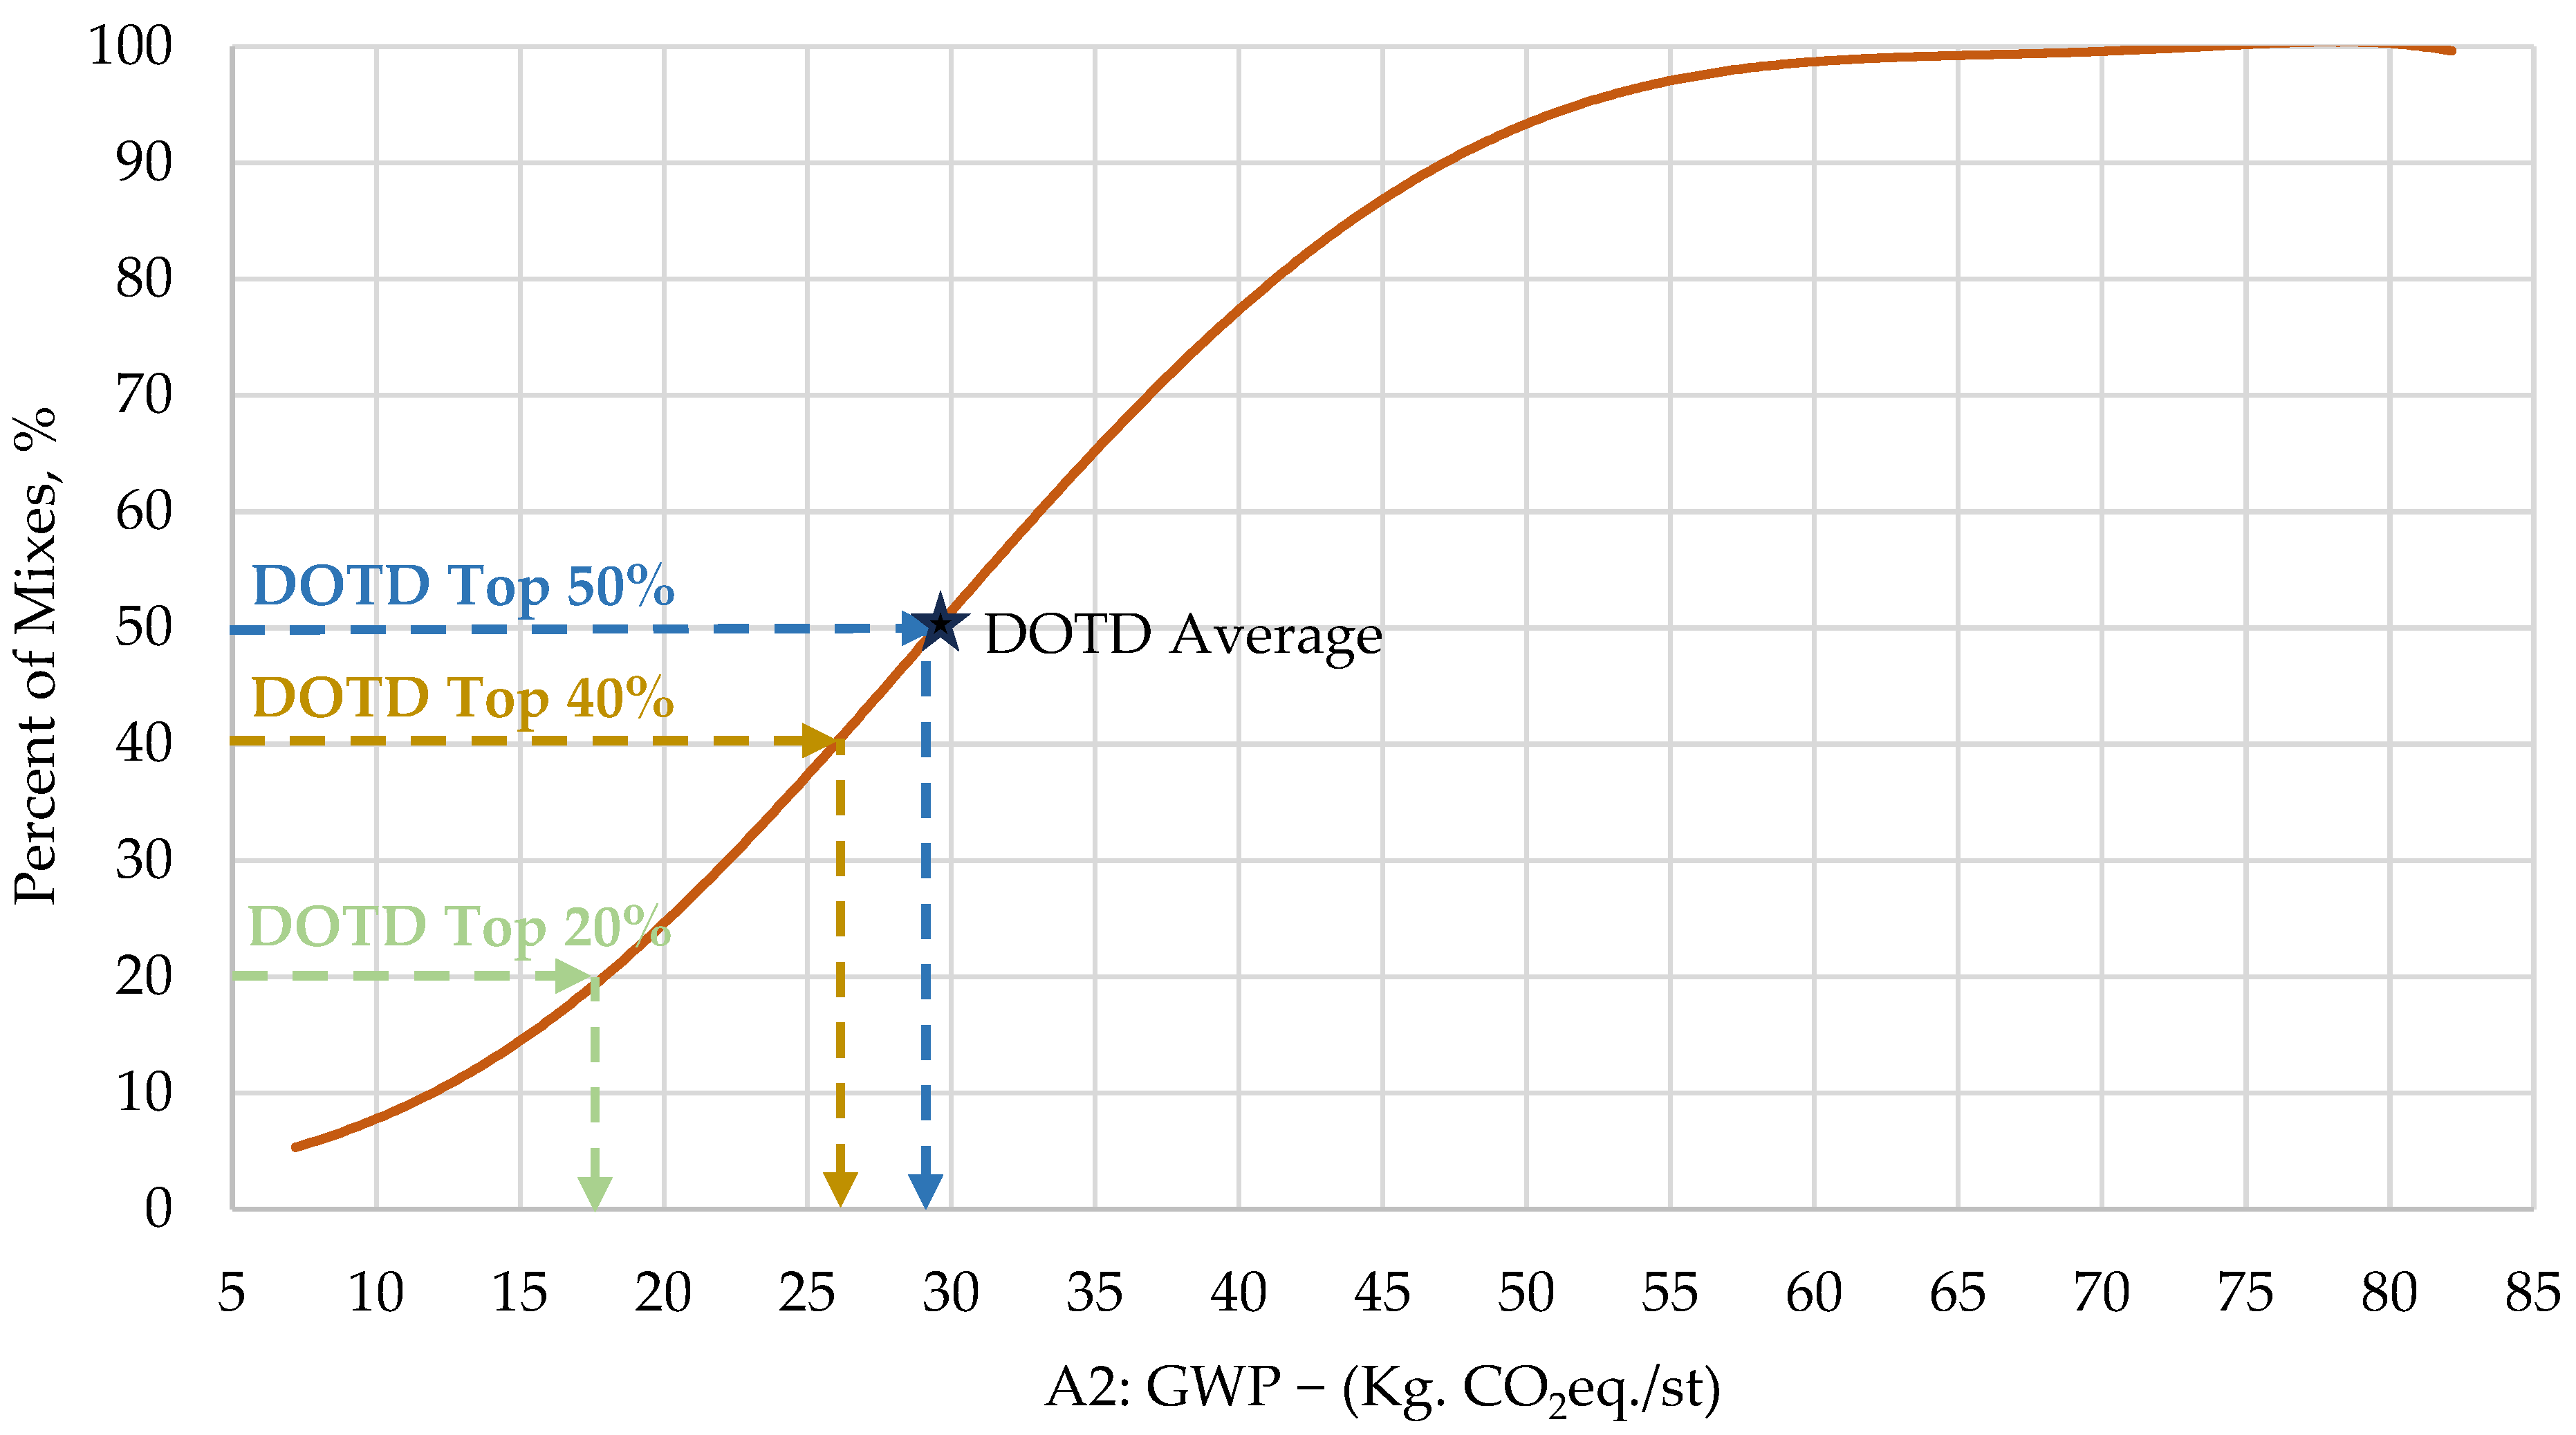
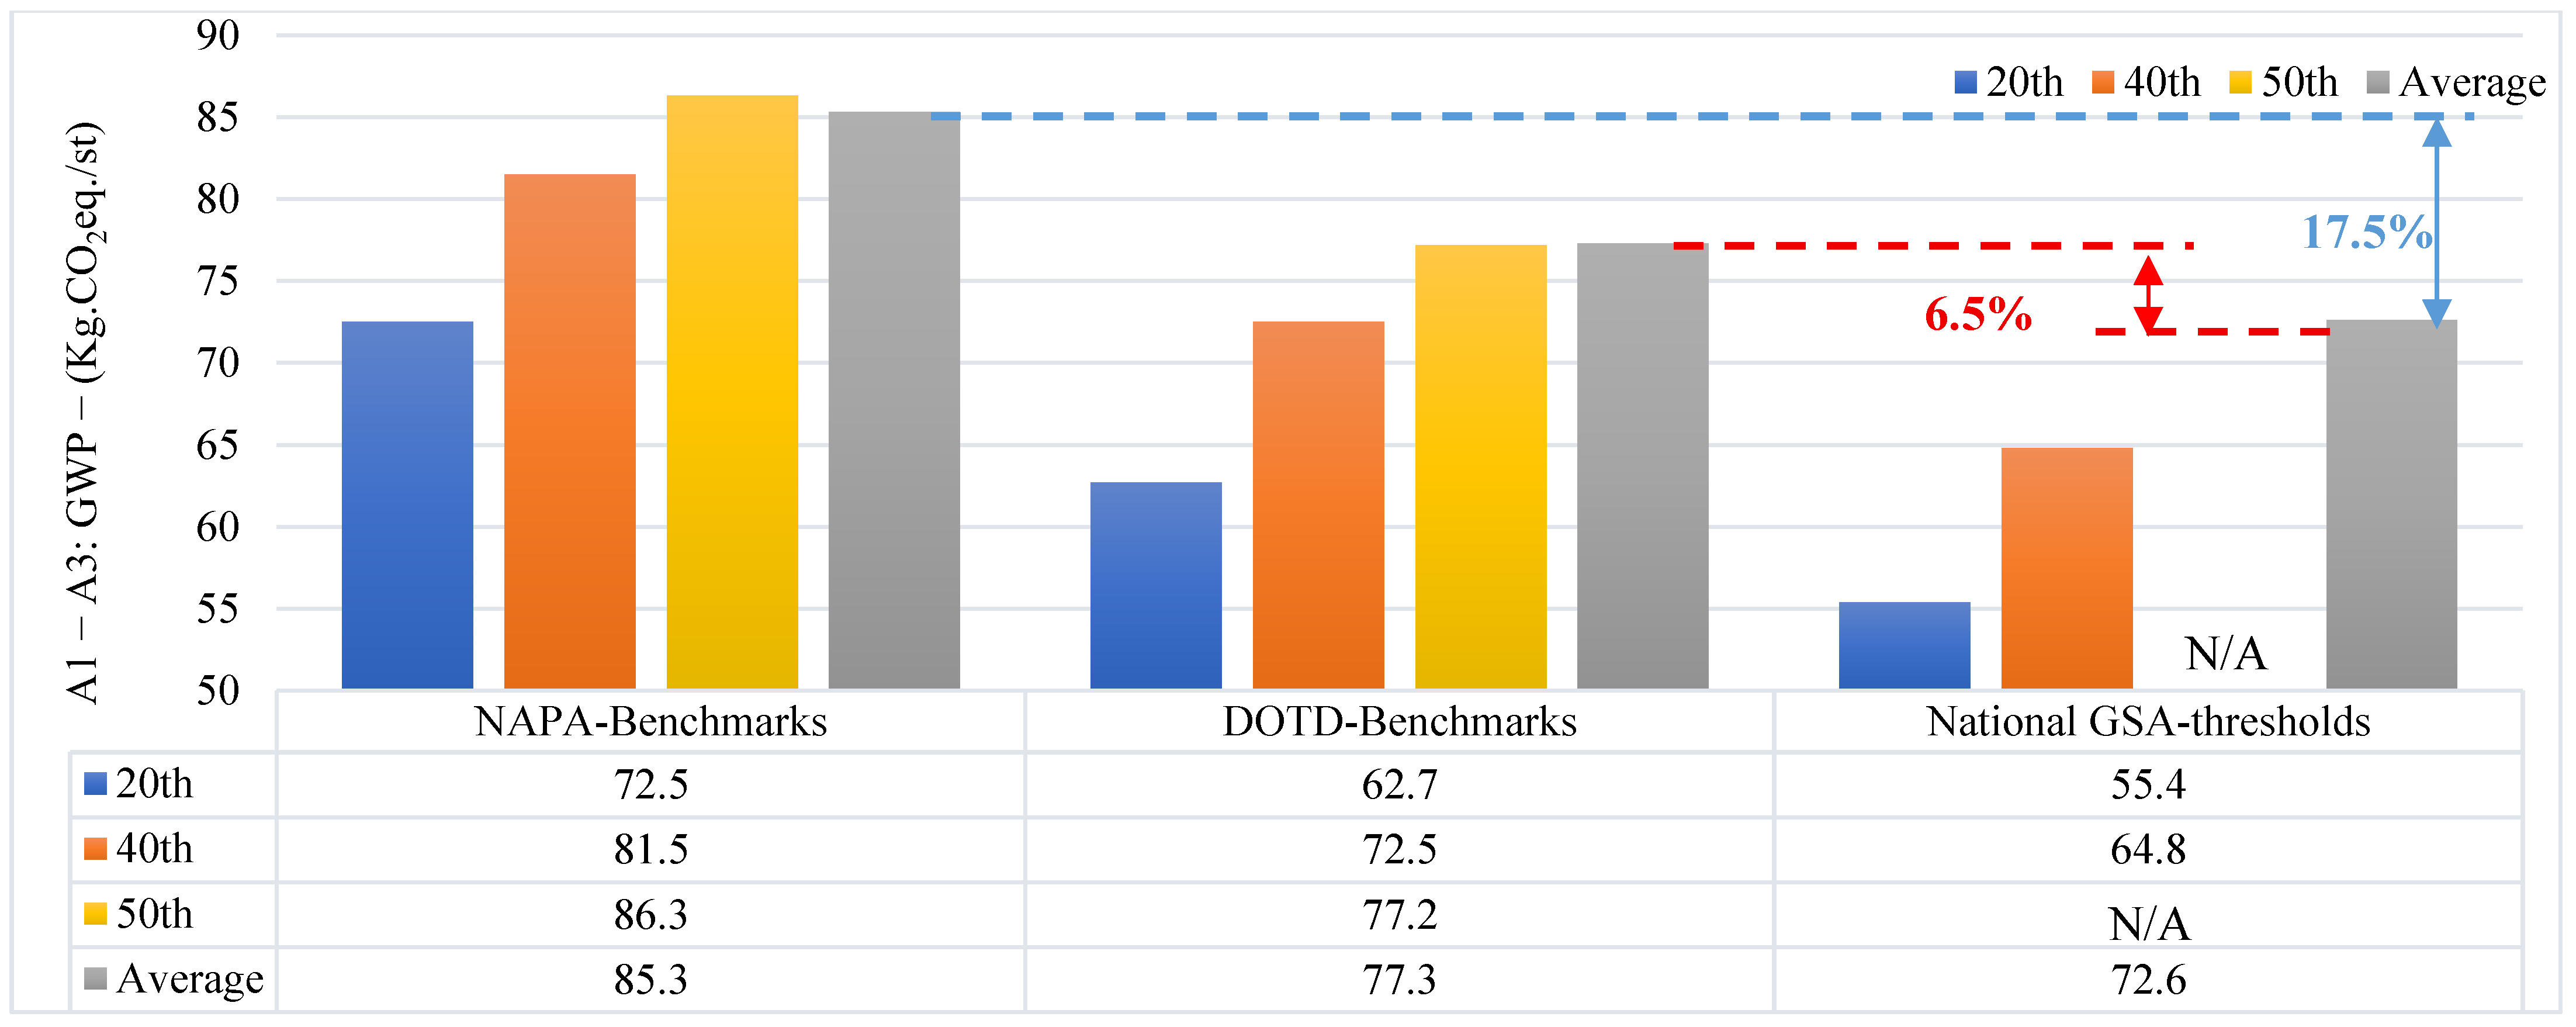
- GWP benchmarks were established for Louisiana’s asphalt mixtures at 20th, 40th, 50th percentiles, and average.
- GWP benchmarks collected from NAPA data (Average percentile = 85.3 Kg.CO2eq./st) showed slightly higher values than those obtained from the DOTD database (Average percentile = 77.3 Kg.CO2eq./st). This is due to the differences and uncertainties of the GWP values of phase A3.
- The average GWP benchmarks established based on DOTD data were numerically higher (6.5%) than the GWP thresholds determined by GSA. This emphasized the need for innovative strategies to reduce asphalt-related GHG emissions in Louisiana.
- Significant differences were found between GWP emissions of asphalt mixtures with different NMAS, traffic levels, and ADT as classified by DOTD. This finding necessitated an accurate, tailored GWP benchmark for asphalt mixtures to obtain more sustainable pavement and greener infrastructure.
- In this study, Phase A3 data inventory was limited to plant-average energy and emissions rather than mixture-specific data, reducing accuracy. Future work should collect mixture-level data to lower uncertainty and improve comparability across plants. In addition, this study was limited to a cradle-to-gate system boundary. Future research should extend to cradle-to-grave analyses and include sensitivity assessments of key factors to better identify emission reduction strategies and inform policy and practice.
Author Contributions
Funding
Institutional Review Board Statement
Informed Consent Statement
Data Availability Statement
Acknowledgments
Conflicts of Interest
Abbreviations
| A1 | Product Phase 1: raw material extraction and processing |
| A1–A3 | The production stages total (sum of A1, A2, and A3) |
| A2 | Product Phase 2: transport of constituents to the mixing plant |
| A3 | Product Phase 3: mix manufacturing at the plant |
| AC | Asphalt Content |
| ACLCA | American Center for Life Cycle Assessment |
| ADT | Average Daily Traffic |
| ANOVA | Analysis of Variance |
| CO2 | Carbon Dioxide |
| CO2e (or CO2eq) | Carbon Dioxide Equivalent |
| DOTD | Department of Transportation and Development |
| EPA | U.S. Environmental Protection Agency |
| EPDs | Environmental Product Declarations |
| erf | Error Function |
| FHWA | Federal Highway Administration (U.S.) |
| GHG | Greenhouse Gases |
| GSA | General Services Administration |
| GWP | Global Warming Potential |
| IQR | Interquartile Range |
| JMF | Job Mix Formula |
| kWh | Kilowatt Hour |
| LA | Louisiana State |
| LCA | Life Cycle Assessment |
| LCI | Life Cycle Inventory |
| mESALs | Million Equivalent Single-Axle Loads |
| MFC | Thousand Cubic Feet |
| MMT | Million Metric Tons |
| NAPA | National Asphalt Pavement Association |
| NMAS | Nominal Maximum Aggregate Size |
| OGFC | Open Graded Friction Course |
| PG | Performance Grade |
| RAP | Reclaimed Asphalt Pavement |
| SBS | Styrene-Butadiene-Styrene polymer |
| st | Short Ton |
| TRACI | Tool for the Reduction and Assessment of Chemical and other Environmental Impacts |
| USLCI | U.S. Life Cycle Inventory Database |
| vpd | Vehicles Per Day |
References
- United States Environmental Protection Agency. Transportation Sector Emissions. Available online: https://www.epa.gov/ghgemissions/transportation-sector-emissions#:~:text=When%20considering%20only%20direct%20emissions,decreased%20by%20less%20than%201%25 (accessed on 24 April 2025).
- Dismukes, D.E. Louisiana 2021 Greenhouse Gas Inventory; LSU Center for Energy Studies: Baton Rouge, LA, USA, 2021. [Google Scholar]
- United States Environmental Protection Agency. Inventory of US Greenhouse Gas Emissions and Sinks: 1990–1994; United States Environmental Protection Agency: Washington, DC, USA, 1995. [Google Scholar]
- Thives, L.P.; Ghisi, E. Asphalt mixtures emission and energy consumption: A review. Renewable and Sustainable Energy Reviews 2017, 72, 473–484. [Google Scholar] [CrossRef]
- Parmesan, C.; Morecroft, M.D.; Trisurat, Y. Climate Change 2022: Impacts, Adaptation and Vulnerability; GIEC: Geneva, Switzerland, 2022. [Google Scholar]
- Shacat, J.; Willis, J.R.; Ciavola, B. GHG Emissions Inventory for Asphalt Mix Production in the United States: Current Industry Practices and Opportunities to Reduce Future Emissions; National Asphalt Pavement Association: Greenbelt, MD, USA, 2022. [Google Scholar]
- Keches, C.; LeBlanc, A. Reducing Greenhouse Gas Emissions from Asphalt Materials; Worcester Polytechnic Institute: Worcester, MA, USA, 2007. [Google Scholar]
- Miller, L.; Ciavola, B.; Mukherjee, A. EPD Benchmark for National Asphalt Pavement Association: Version 2.0 Including Round 2 Data Collection; National Asphalt Pavement Association: Lanham, MD, USA, 2024. [Google Scholar]
- Elnaml, I.; Mohammad, L.N.; Baumgardner, G.; Cooper, S., III; Cooper, S., Jr. Sustainability of Asphalt Mixtures Containing 50% RAP and Recycling Agents. Recycling 2024, 9, 85. [Google Scholar] [CrossRef]
- Elnaml, I.; Dylla, H.; Liu, J.; Mohammad, L.N.; Cooper, S.B., III; Cooper, S.B., Jr. Incorporating environmental impact analysis into Louisiana’s balanced asphalt mixture design. Transportation Research Record 2023, 2679, 1078–1090. [Google Scholar] [CrossRef]
- Liu, Y.; Liu, Z.; Zhu, Y.; Zhang, H. A Review of Sustainability in Hot Asphalt Production: Greenhouse Gas Emissions and Energy Consumption. Applied Sciences 2024, 14, 10246. [Google Scholar] [CrossRef]
- Miller, L.; Ciavola, B.; Mukherjee, A. EPD Benchmark for Asphalt Mixtures; National Asphalt Pavement Association: Greenbelt, MD, USA, 2024. [Google Scholar]
- Diedrich, G. Evaluating local climate policy: Municipal action plans through the lens of resilience and environmental justice. PLoS Clim 2024, 3, e0000395. [Google Scholar] [CrossRef]
- Rangelov, M.; Dylla, H.; Mukherjee, A.; Sivaneswaran, N. Use of environmental product declarations (EPDs) of pavement materials in the United States of America (USA) to ensure environmental impact reductions. Journal of Cleaner Production 2021, 283, 124619. [Google Scholar] [CrossRef]
- National Asphalt Pavement Association. Emerald Eco-Label EPD Program; National Asphalt Pavement Association: Greenbelt, MD, USA, 2023; Available online: https://asphaltepd.org/published/all?state=LA (accessed on 24 April 2025).
- National Asphalt Pavement Association. Emerald Eco-Label Program Documents; National Asphalt Pavement Association: Greenbelt, MD, USA, 2023; Available online: https://www.asphaltpavement.org/programs/napa-programs/emerald-eco-label/product-category-rules (accessed on 24 April 2025).
- Gkyrtis, K.; Kokkalis, A. Toward the Inclusion of Waste Materials at Road Upper Layers: Integrative Exploration of Critical Aspects. Future Transportation 2025, 5, 67. [Google Scholar] [CrossRef]
- Bhat, C.G. Life Cycle Information Models with Parameter Uncertainty Analysis to Facilitate the Use of Life-Cycle Assessment Outcomes in Pavement Design Decision-Making. Ph.D. Thesis, Michigan Technological University, Houghton, MI, USA, 2020. [Google Scholar]
- Fedral Highway Adminastration. LCA Pave: A Tool to Assess Environmental Impacts of Pavement Material and Design Decisions. Available online: https://www.fhwa.dot.gov/pavement/lcatool (accessed on 1 June 2025).
- Bare, J.; Young, D.; Qam, S.; Hopton, M.; Chief, S. Tool for the Reduction and Assessment of Chemical and other Environmental Impacts (TRACI); United State Environmental Protection Agency: Washington, DC, USA, 2012. [Google Scholar]
- ISO 21930: 2017; Sustainability in Buildings and Civil Engineering Works, Core Rules for Environmental Product Declarations of Construction Products and Services. ISO: Geneva, Switzerland, 2017.
- Martin Marietta. Environmental Product Declaration. Martin Marietta, Raleigh, NC, USA. Available online: https://pcr-epd.s3.us-east-2.amazonaws.com/359.EPD_for_Martin_Marietta_EPD_final.pdf (accessed on 1 July 2025).
- Al-Qadi, I.L.; Yang, R.; Kang, S.; Ozer, H.; Ferrebee, E.; Roesler, J.R.; Salinas, A.; Meijer, J.; Vavrik, W.R.; Gillen, S.L. Scenarios developed for improved sustainability of Illinois Tollway: Life-cycle assessment approach. Transportation Research Record 2015, 2523, 11–18. [Google Scholar] [CrossRef]
- Asphalt Institute. Life Cycle Assessment of Asphalt Binder; Asphalt Institute: Lexington, KY, USA, 2019; Available online: https://www.asphaltinstitute.org/engineering/sustainability/life-cycle-assessment-of-asphalt-binder/ (accessed on 28 October 2025).
- Argonne National Laboratory (ANL). Concrete: Material Flow Dataset; U.S Federal LCA Commons Database: Argonne, IL, USA, 2012. Available online: https://www.lcacommons.gov/lca-collaboration/Argonne_National_Lab/Concrete/dataset/FLOW/73c7494d-4e93-3769-896b-8bb82f0dfccc (accessed on 28 October 2025).
- National Institute of Standards and Technology (NIST). Construction Materials: Material Flow Dataset. U.S. Federal LCA Commons Database. Available online: https://www.lcacommons.gov/lca-collaboration/NIST/construction_materials/dataset/FLOW/a1242640-8306-366c-9c55-6dfd23e77bd7 (accessed on 28 October 2025).
- US. Forest Service–Forest Products Laboratory (USFS FPL). Woody Biomass: Material Flow Dataset. Federal LCA Commons. Available online: https://www.lcacommons.gov/lca-collaboration/US_Forest_Service_Forest_Products_Lab/Woody_biomass/dataset/FLOW/628c07ec-0802-39c1-ab88-1c62848ef436 (accessed on 28 October 2025).
- Federal LCA Commons. IMPACT World+: Material Flow Dataset. Available online: https://www.lcacommons.gov/lca-collaboration/Federal_LCA_Commons/Impact_World_Plus/dataset/FLOW/617b4c08-cfb6-3209-b232-bb7e1b7b1bfc (accessed on 28 October 2025).
- National Renewable Energy Laboratory (NREL). Electricity, bituminous coal, at power plant: Material Flow Dataset. U.S. Federal LCA Commons, U.S. Department of Energy. Available online: https://www.lcacommons.gov/lca-collaboration/National_Renewable_Energy_Laboratory/USLCI_Database_Public/dataset/FLOW/737e3efb-29d4-3b9d-8d78-6269508c1f59 (accessed on 28 October 2025).
- Federal LCA Commons. U.S. Electricity Baseline: Material Flow Dataset. U.S. Federal LCA Commons Database. Available online: https://www.lcacommons.gov/lca-collaboration/Federal_LCA_Commons/US_electricity_baseline/dataset/FLOW/4c20788d-fdef-365a-a050-7a92e858e170 (accessed on 28 October 2025).
- Baumel, P.; Hurburgh, C.; Lee, T. Estimates of Total Fuel Consumption in Transporting Grain from Iowa to Major Grain Countries by Alternatives Modes and Routes; Iowa Grain Quality Initiative: Ames, IA, USA, 2015; Available online: https://www.extension.iastate.edu/grain/topics/EstimatesofTotalFuelConsumption.htm (accessed on 1 July 2025).
- Corporation, A.T. Rail vs. Truck Fuel Efficiency: The Relative Fuel Efficiency of Truck Competitive Rail Freight and Tuck Operations Compared in a Range of Corridors; US Department of Transportation-Federal Railroad Administration: Washington, DC, USA, 1991. [Google Scholar]
- Protopapas, A.; Kruse, C.J.; Olson, L.E. Modal comparison of domestic freight transportation effects on the general public. Transportation Research Record 2013, 2330, 55–62. [Google Scholar] [CrossRef]
- Executive, T.M. Barge Transport Wins on Fuel Efficiency; The Maritime Executive: Vero Beach, FL, USA, 2017. [Google Scholar]
- US. Army Corps of Engineers. Inland Waterway Navigation: Value to the Nation; U.S. Army Corps of Engineers: Washington, DC, USA, 2013. [Google Scholar]
- CSX Transportation. Class I Railroad Annual Report R-1; Norfolk Southern: Atlanta, GA, USA, 2024. [Google Scholar]
- Association of American Railroads. Freight Railroads & Climate Change: Reducing Emissions, Enhancing Resiliency; Association of American Railroads: Washington, DC, USA, 2023. [Google Scholar]
- RSI Logistics. Is Rail Better for the Environment Than Trucks? Available online: https://www.rsilogistics.com/blog/is-rail-better-for-the-environment-than-trucks/ (accessed on 20 September 2025).
- DasGupta, A. Normal Distribution. In Fundamentals of Probability: A First Course; Springer: New York, NY, USA, 2010; pp. 195–212. [Google Scholar]
- Li, L.; Chan, P.; Zollinger, D.G.; Lytton, R.L. Quantitative analysis of aggregate shape based on fractals. Materials Journal 1993, 90, 357–365. [Google Scholar]
- Berger, V.W.; Zhou, Y. Kolmogorov–Smirnov Test: Overview. In Wiley StatsRef: Statistics Reference Online; John Wiley & Sons: Hoboken, NJ, USA, 2014. [Google Scholar]
- Navidi, W.C. Statistics for Engineers and Scientists; McGraw-Hill: New York, NJ, USA, 2006; Volume 2. [Google Scholar]


| Parameter | Asphalt Mixture Type | Number of Mixtures, % | |
|---|---|---|---|
| DOTD Database | NAPA Reports | ||
| Mix Type | Wearing Course | 77 (37) | 5 (24) |
| Binder Coarse | 69 (33) | - | |
| Base Coarse | 24 (12) | 16 (76) | |
| Incidental | 27 (13) | - | |
| Thin lift (OGFC, Coarse Mix, Dense Mix) | 10 (5) | - | |
| NMAS | ½ inch | 105 (51) | 13 (62) |
| ¾ inch | 67 (32) | 4 (19) | |
| 1 inch | 35 (17) | 4 (19) | |
| Asphalt Binder Grades | PG 58–28 | 10 (5) | 3 (14) |
| PG 67–22 | 67 (32) | 3 (14) | |
| PG 70–22 | 65 (31) | 12 (58) | |
| PG 76–22 | 65 (31) | 3 (14) | |
| RAP Content * | 0% | 26 (13) | 1 (5) |
| 0–20% | 121 (59) | 10 (48) | |
| 20–25% | 50 (24) | 3 (14) | |
| >25% | 10 (5) | 7 (33) | |
| Phase | LCI Parameter | Quantity |
|---|---|---|
| A1 | Coarse Aggregates, % | 82.4 |
| Fine Aggregates, % | 12.5 | |
| Virgin unmodified asphalt binder | PG 76–22 | |
| Virgin AC, % | 5.1 | |
| A2 | Coarse Aggregate 1—train distance, miles | 375 |
| Coarse Aggregate 2—train distance, miles | 603 | |
| Fine Aggregate—train distance, miles | 417 | |
| AC—Transport distance, miles | 1056 | |
| SBS—Transport distance, miles | 192 | |
| A3 | Burner Energy Consumption (Natural Gas) (MFC/st) | 425.2 |
| Electricity (kWh/st) | 3.72 | |
| Fuel (Gallons/st) | 0.019 |
| Sub-Phase | Materials/Equipment | Unit | Kg CO2eq | LCI Data Source–Year Published | Other Properties | Meta-Analysis |
|---|---|---|---|---|---|---|
| A1 | Coarse aggregates | St | 2.06 | Martin Marietta—2017 | EPD 4531 [22] | 77.1% |
| Fine aggregates | St | 4.2 | Martin Marietta—2017 | EPD 952 [22] | 77.1% | |
| RAP | St | 1.26 | Illinois Tollway LCI—2016 | [23] | 74.4% | |
| PG 76–22 | St | 694 | Asphalt Institute, 2019 | 3.5% SBS [24] | 79.7% | |
| PG 70–22 | St | 628 | Asphalt Institute, 2019 | 1.5% SBS [24] | 79.7% | |
| PG 67–22 | St | 578 | Asphalt Institute, 2019 | unmodified [24] | 79.7% | |
| A2 | Train (diesel) | St-mile | 0.0538 | USLCI data, 2000 | [25] | 51.5% |
| Barge (Diesel) | St-mile | 0.0795 | USLCI data, 2000 | [26] | 53.2% | |
| Truck (diesel) | St-mile | 0.2264 | USLCI data, 2000 | [27] | 53.2% | |
| A3 | Natural Gas | MFC | 0.05 | USLCI data, 2002 | [28] | 41.5% |
| Electricity (U.S.) | kWh | 0.546 | National Energy Technology, 2019 | [29] | 68.2% | |
| Fuel | Diesel | 10.45 | USLCI data, 1998 | [30] | 41.5% |
| Phase A1 | Quantity (st) | GWP Equivalent Factor | Kg.CO2eq/st | ||
|---|---|---|---|---|---|
| Coarse aggregates | 0.824 | 2.06 | 0.78 | ||
| Fine aggregates | 0.125 | 4.20 | 1.80 | ||
| Asphalt binder and SBS | 0.051 | 694 | 35.39 | ||
| 37.62 | |||||
| Phase A2 | Quantity (st) | Distance (mi) | Transportation Means | Equivalent CO2eq Factor/st.mi | Kg.CO2eq/st |
| Coarse aggregates 1 | 0.291 | 375 | Train | 0.0538 | 5.87 |
| Coarse aggregates 2 | 0.532 | 603 | Train | 0.0538 | 17.26 |
| Fine aggregates | 0.125 | 417 | Train | 0.0538 | 2.80 |
| Asphalt binder | 0.051 | 207 | Truck | 0.2264 | 2.39 |
| SBS (3.5% of AC) | 0.002 | 192 | Truck | 0.2264 | 0.09 |
| Fiber (2% of AC) | 0.001 | 1037 | Truck | 0.2264 | 0.23 |
| 28.65 | |||||
| Adding unloaded return | Multiply fuel consumption by (1.80 for Trucks—1.46 for Barge—1.50 for Trains) ** | 43.77 | |||
| Phase A3 | Quantity/st | GWP Equivalent Factor | Kg.CO2eq/st | ||
| Burner (MFC) | 276.7 | 0.05 | 13.84 | ||
| Electricity (kWh) | 3.62 | 0.546 | 1.98 | ||
| Fuel (Gallon) | 0.02 | 10.45 | 0.21 | ||
| 16.02 | |||||
| Total (A1 + A2 + A3) | 97.41 | ||||
| Mode | Reference | Summery | Percent Reduction (Unloaded/Loaded) | Return Haul Factor -Considered | |
|---|---|---|---|---|---|
| Truck | [31] | 6.2 MPG loaded 7.3 MPG unloaded | 85% | 80% | |
| [32] | 5.5 MPG loaded 7.5 MPG unloaded | 73% | |||
| Barge | General, USA | [33,34] | 675 TMPG —loaded | 40% | 46% |
| [35] | 270 TMPG —unloaded | ||||
| Lower Mississippi River | [31] | 1290 TMPG—loaded southbound 185 TMPG (31.5%)—unloaded northbound | 185 × (100/31.5)/1290 = 46% | ||
| Train | [36] | 528 TMPG loaded 260 TMPG unloaded | 49% | 50% | |
| [37] | 500 TMPG loaded 250 TMPG unloaded | 50% | |||
| [38] | 470 TMPG loaded 235 TMPG unloaded | 50% | |||
| Test | A1 | A2 | A3 | A1–A3 |
|---|---|---|---|---|
| p-value | 0.832 | 0.052 | <0.001 | 0.124 |
| Normal distribution check (p ≥ 0.05) | pass | pass | fail | pass |
| Phase A1–A3 | GWP, Kg.CO2eq./st |
|---|---|
| Mix 1 | 48.16 |
| Mix 2 | 48.23 |
| : | : |
| Mix 207 | 126.2 |
| Mean (µ) | 77.3 |
| Standard deviation () | 17.9 |
| Quartile 1 (Q1) | 65.7 |
| Quartile 2 (Q2) | 75.9 |
| Quartile 3 (Q3) | 87.2 |
| Interquartile Range IQR = Q3 − Q1 | 21.5 |
| Step size = | 3.0 |
| Statistical Parameter | DOTD-LaPave (207 Mixes) | NAPA (21 Mixes) | ||||||
|---|---|---|---|---|---|---|---|---|
| A1 | A2 | A3 | A1–A3 | A1 | A2 | A3 | A1–A3 | |
| 20th percentile | 29.3 | 17.2 | 12.1 | 62.7 | 26.1 | 12.0 | 25.9 | 71.2 |
| 40th percentile | 31.6 | 26.7 | 14.5 | 72.5 | 28.1 | 22.5 | 27.3 | 83.7 |
| 50th percentile | 32.5 | 28.5 | 14.6 | 77.2 | 31.5 | 28.2 | 27.3 | 86.3 |
| Mean ± Std. | 32.5 ± 3.8 | 29.5 ± 14.3 | 15.3 ± 3.7 | 77.3 ±17.9 | 30.4 ± 6.1 | 26.5 ± 15.4 | 28.4 ± 3.0 | 85.3 ± 14.8 |
| Minimum | 24.2 | 9.5 | 12.1 | 48.2 | 20.1 | 2.1 | 25.9 | 59.47 |
| Maximum | 42.4 | 82.2 | 23.4 | 126.2 | 42.1 | 55.8 | 34.9 | 113.83 |
| Classification 1: Nominal Maximum Aggregate Size | ||||
|---|---|---|---|---|
| NMAS | 12.5 mm | 19 mm and 25 mm | p-value | Significant differences |
| No. of Mixes | 105 | 102 | ||
| Average GWP Value | 79.4 | 73.7 | 0.017 | yes |
| Classification 2: Traffic design level | ||||
| Traffic Level | 1 (less than 3 mESALs) | 2 (more than 3 mESALs) | p-value | Significant differences |
| No. of Mixes | 148 | 59 | ||
| Average GWP Value | 73.7 | 86.4 | <0.001 | Yes |
| Classification 3: Average daily traffic | ||||
| ADT | <3500 ADT | >3500 ADT | p-value | Significant differences |
| No. of Mixes | 61 | 146 | ||
| Average GWP Value | 69.5 | 80.6 | <0.001 | Yes |
Disclaimer/Publisher’s Note: The statements, opinions and data contained in all publications are solely those of the individual author(s) and contributor(s) and not of MDPI and/or the editor(s). MDPI and/or the editor(s) disclaim responsibility for any injury to people or property resulting from any ideas, methods, instructions or products referred to in the content. |
© 2025 by the authors. Licensee MDPI, Basel, Switzerland. This article is an open access article distributed under the terms and conditions of the Creative Commons Attribution (CC BY) license (https://creativecommons.org/licenses/by/4.0/).
Share and Cite
Elnaml, I.; Shehata, M.; Mohammad, L.N.; Dylla, H.; Cooper, S., III. Advancing Sustainable Pavements: Life Cycle Assessment and Global Warming Potential Benchmarking for Asphalt Mixtures in Louisiana. Sustainability 2025, 17, 9966. https://doi.org/10.3390/su17229966
Elnaml I, Shehata M, Mohammad LN, Dylla H, Cooper S III. Advancing Sustainable Pavements: Life Cycle Assessment and Global Warming Potential Benchmarking for Asphalt Mixtures in Louisiana. Sustainability. 2025; 17(22):9966. https://doi.org/10.3390/su17229966
Chicago/Turabian StyleElnaml, Ibrahim, Mohamed Shehata, Louay N. Mohammad, Heather Dylla, and Samuel Cooper, III. 2025. "Advancing Sustainable Pavements: Life Cycle Assessment and Global Warming Potential Benchmarking for Asphalt Mixtures in Louisiana" Sustainability 17, no. 22: 9966. https://doi.org/10.3390/su17229966
APA StyleElnaml, I., Shehata, M., Mohammad, L. N., Dylla, H., & Cooper, S., III. (2025). Advancing Sustainable Pavements: Life Cycle Assessment and Global Warming Potential Benchmarking for Asphalt Mixtures in Louisiana. Sustainability, 17(22), 9966. https://doi.org/10.3390/su17229966


