Abstract
Transportation-related greenhouse gas (GHG) emissions in Louisiana have risen significantly, yet the environmental impacts of asphalt mixture production remain underexplored. This study conducted a cradle-to-gate environmental life cycle assessment (LCA) to quantify global warming potential (GWP) for asphalt mixtures produced in Louisiana and establish GWP benchmarks tailored to mixture types. The LCA encompassed material extraction and production, transport to plants, and asphalt mixing, using two datasets: Environmental Product Declarations from the NAPA Eco-label program (21 mixtures) and Job Mix Formulas from the LaPave database at the Louisiana Department of Transportation and Development (DOTD) (207 mixtures). GWP was evaluated using the FHWA LCA Pave tool with TRACI 2.1 factors, and benchmarks were set at the 20th, 40th, 50th percentiles, and the average. Statistical analyses assessed differences across nominal maximum aggregate sizes and traffic levels. Results showed GWP benchmarks from both datasets exceeded U.S. General Services Administration thresholds by an average of 6.5%, with significant variation among mixture types. These findings highlight the need for targeted emission reduction strategies and accurate environmental performance evaluation to promote more sustainable pavement practices and greener infrastructure in Louisiana.
1. Introduction
The transportation sector accounted for 29% of the U.S. greenhouse gas (GHG) emissions in 2022 [1]. In Louisiana, the GHG emissions of the transportation sector increased by 29.8%, from 32.1 million metric tons (MMT) of Carbon Dioxide equivalent (CO2eq) weight in 2018 (ranked 21st among U.S. states) to 41.6 MMT CO2eq in 2022 (ranked 13th among U.S. states) [1,2]. Carbon Dioxide (CO2) accounts for approximately 80% of greenhouse gas (GHG) emissions in the U.S. and over 92% in Louisiana [2,3]. One of the primary contributors to GHG emissions in the transportation sector is asphalt pavement production [4]. An environmental cradle-to-gate Life Cycle Assessment (LCA) has been conducted to quantify GHG emissions during asphalt pavement production. The system boundary for the cradle-to-gate LCA encompasses raw material extraction (Phase A1), transporting materials to the asphalt facility (Phase A2), and manufacturing the asphalt mixture (Phase A3). The consumed energy was converted to GHG emissions or environmental impacts for each phase, including global warming potentials (GWP).
The GWP serves as the primary indicator for the environmental impacts of GHG emissions (referred to herein after as CO2eq) related to asphalt mixtures [5,6]. During phase A1, GWP is relatively affected by the asphalt mixture component materials within the Job Mix Formula (JMF), including the type and proportion of asphalt binder, aggregates, reclaimed asphalt pavement (RAP), and additives. Asphalt binder makes the highest contribution to GWP due to its derivation from fossil fuel production [7]. Additives are used in relatively small quantities, yet have high GWP intensities [8]. During Phase A2, aggregate transportation represents the largest contributor to the global warming potential (GWP), particularly when local sources are unavailable and materials must be imported from other states, as observed in Louisiana [9] and Florida [6]. It is worth noting that RAP reduces the demand for virgin binder and aggregates, and reduces transportation-related emissions due to its local availability [8,10]. During phase A3, energy consumption in the mixer/burner is the primary contributor to GWP, representing around 80% [11]. It is worth noting that burner fuel consumption increases significantly with age, maintenance, and mix temperature requirements; as such, asphalt plants might have different energy consumption within the same organization [8].
The General Services Administration (GSA) has implemented material requirements to reduce embodied GHG emissions, emphasizing the use of Environmental Product Declarations (EPDs) for construction materials, including asphalt mixtures. EPDs are standardized documents that provide a transparent and comprehensive assessment of a product’s environmental impact, especially GWP throughout its LCA. Under the Emerald Eco-Label Program, the National Asphalt Pavement Association (NAPA) has published 4977 third-party verified EPDs for asphalt mixtures across various states, including 21 EPD reports from Louisiana’s asphalt plants [8]. The EPD requirements have established benchmark limits for the GWP indicator, normalized to a CO2-equivalent unit over a 100-year timeframe [8,12]. According to ISO 21678, benchmark values are categorized into limit values (minimum acceptable performance), reference values (current practice), and target values (ambitious performance levels based on best practices). As such, the GSA has identified national GWP benchmarks for asphalt mixtures at the 20th percentile (target value), 40th percentile (reference value), and above-average performance (limit value) [13].
Several states are independently advancing the use of EPDs in their efforts toward more sustainable asphalt pavement, such as California, Oregon, Washington, Minnesota, and Colorado [14]. These distinct state-level actions highlight a growing recognition of the value of transparent environmental data in shaping more sustainable asphalt pavement across the nation. The sustainability of asphalt pavement production necessitates the establishment of GWP benchmarks for asphalt mixtures in Louisiana to enable effective mitigation of GHG emissions within the transportation sector. Despite having 21 published EPD reports under the NAPA ECO-Labeled program, Louisiana’s data remains insufficient for deriving statistically significant and regionally representative GWP benchmarks. As such, there is a critical need for localized benchmarks and standardized LCA methodologies, as emphasized by the GSA. While previous studies have mainly applied LCA as a complementary tool to support mechanical performance results, this research is dedicated solely to the LCA of asphalt mixture manufacturing. This study addresses this critical gap by conducting a project-level LCA specific to Louisiana’s asphalt mixture production to establish GWP benchmarks. By enhancing the precision of environmental impact benchmarks, this research will strengthen the reliability of guiding industry efforts to reduce GHG emissions, promote material efficiency, and ultimately support sustainable pavement objectives in Louisiana’s transportation sector.
2. Objective and Scope
The objectives of this study were to:
- (A)
- Conduct an LCA for asphalt mixture production in Louisiana,
- (B)
- Establish GWP benchmarks for asphalt mixture production in Louisiana based on two data sources: EPD reports collected from NAPA’s Eco-label Emerald program, and historical data collected from the LaPave database at DOTD and contractor surveys,
- (C)
- Develop GWP benchmarks tailored to specific asphalt mixture types, categorized by their mixture design level as classified by DOTD, and
- (D)
- Compare both approaches of GWP benchmarks to the ones proposed by GSA.
Figure 1 presents the research methodology for GWP benchmarking of asphalt mixtures in Louisiana. Two approaches were followed based on data sources: (1) published EPDs for 21 asphalt mixtures within the NAPA Eco-label Emerald Program, and (2) JMFs of 207 asphalt mixtures available at the LaPave database and contractor surveys. The cumulative distribution curves of GWP values were developed for both datasets. These curves rank GWP values from 0 to 100%, allowing for identification of mixtures below specific benchmarks, such as the 20th, 40th, 50th percentiles, and the average. Cumulative curves are useful for regulatory policy, sustainability targets, procurement strategies, and benchmarking studies [12].
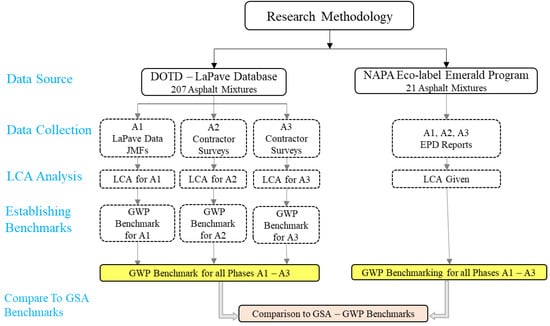
Figure 1.
Research Methodology.
3. Data Collection and Life Cycle Inventory
Two approaches were considered for GWP benchmarking based on data sources:
- DOTD (LaPave) construction materials database: A total of 207 asphalt mixtures’ JMFs, which were utilized in paving routes in Louisiana, were collected. The properties of the collected asphalt mixtures are presented in Table 1.
 Table 1. Properties of asphalt mixtures investigated in this study.
 - The 21 EPD asphalt mixture reports of Louisiana were collected from the NAPA website [15], and the asphalt mixtures’ properties are presented in Table 1. EPD reports contain GWP for phases A1, A2, and A3. As such, there was no need to conduct an LCI or LCA for NAPA’s reports in this study; subsequently, GWP benchmarks were established directly.
The EPD tool data gathering sheet (Version 5), created under the Emerald Eco-Label EPD program [16], was distributed as a survey to asphalt mixtures’ contractors to provide details about transporting material to the asphalt plant (Phase A2). The survey includes the transportation means, distances, capacities, and fuel consumption for acquiring each component material of a studied asphalt mixture to the associated asphalt plant. In addition, the survey included details about energy consumption at the asphalt plant during asphalt mixture production (Phase A3). In this study, all asphalt plants utilized natural gas fuel for the burner/mixer.
It is worth mentioning that LCA studies inherently involve assumptions in defining system boundaries, data quality, and the allocation methods used to determine GWP intensities. These assumptions can strongly influence the outcomes and may introduce uncertainty or lead to sparse results that are difficult to interpret [17].
Table 2 presents an example of data collection for a studied asphalt mixture. It encompasses details about component materials types and percentages, transporting materials to asphalt plants, and asphalt mixture production.
Table 2.
Example of data collection for a studied asphalt mixture.
This study employed the recommended public background datasets from the American Center for Life Cycle Assessment (ACLCA) Open Standard and the FHWA LCA Pave tool to assess the potential environmental impacts. The environmental impacts used in this study were evaluated using the enhanced Environmental Protection Agency’s (EPA’s) pedigree matrix for use in the pavement LCA domain [18,19]. In the absence of an industry-wide aggregate lifecycle inventory, this study relied on publicly available Environmental Product Declarations (EPDs) from LCA Pave, which encompass the cradle-to-gate impacts of aggregate production. Transportation distances were determined using the material supplier and mixing plant locations. The environmental impacts of pavement materials were assessed using the LCA Pave tool, which applies TRACI 2.1 (Tool for the Reduction and Assessment of Chemicals and Other Environmental Impacts), an EPA-developed and ISO-recognized methodology for calculating midpoint indicators [20,21].
Table 3 presents the life cycle inventory for the studied asphalt mixtures. It contains GWP impact factors for converting materials and energies consumed during the production of one short ton of asphalt mixture to GWP by weight of CO2eq. It is worth mentioning that meta-analysis was reported by LCA Pave software using a scale from 1 (best) to 5 (worst) for factors, such as reliability, TRACI compatibility, representatives, data age, manufacturing technology, reviews, and completeness. However, the factor scores were averaged and weighted on a scale of 100%.
Table 3.
Life cycle inventory for a studied asphalt mixture.
4. Environmental Impact Analysis and Life Cycle Assessment
Table 4 presents an example of calculations for GHG emissions of an asphalt mixture. The environmental impact analysis was conducted on the collected data (LCI) for each phase of LCA.
Table 4.
Example calculations for GHG emissions of a studied asphalt mixture.
Table 5 presents the relative fuel consumption of unloaded return trips compared to loaded trips, expressed as a return factor. This factor varies considerably by mode of transportation. Reported values are approximately 80% for trucks and 50% for trains. For barges, the return factor is more location-dependent; although a general value of 40% is often cited, a higher factor of 46% has been observed along the Lower Mississippi River, which is geographically more accurate for this study.
Table 5.
Average return haul factor for fuel consumption across transportation modes in southern states.
5. Global Warming Potential (GWP) Benchmarking
To evaluate the GWP of asphalt mixtures, collected data are fitted to a normal distribution curve. This statistical approach allows for the determination of the data’s central tendency, dispersion, and overall pattern [39]. In addition, based on the premise that asphalt mixture properties exhibit natural variability, a normal distribution was chosen for this environmental analysis to identify the average carbon emissions and potential outliers. The normal distribution, characterized by the dataset values’ mean and standard deviation, is widely used due to its simplicity and robustness in representing such variability [40]. The validity of the normal distribution assumption was assessed through the Kolmogorov–Smirnov statistical test [41].
Table 6 presents the results of the Kolmogorov–Smirnov statistical analysis to validate the possibility of fitting the GWP results using a normal distribution curve. The normality of the data is evaluated using the p-value, a statistical measure that assesses how well the data fit a normal distribution. When the p-value is equal to or more than 0.05, it indicates that the data do not significantly deviate from normality, providing 95% confidence that the data follows a normal distribution. However, if the p-value is less than 0.05, it suggests that the data significantly differs from a normal distribution, indicating abnormality. It is worth noting that the GWP values for phases A1, A2, and A1–A3 (i.e., the combined phases A1, A2, and A3) followed a normal distribution (p-value ≥ 0.05). However, the GWP values for phase A3 did not conform to normality (p-value < 0.05). This deviation is attributed to the data source of A3; energy consumption during asphalt production (burner, electricity, and diesel use) was collected at the plant level, independent of mixture-specific components and mixing temperature. Similar uncertainty and difficulty of collecting accurate data regarding mixing production were reported by NAPA [12].
Table 6.
Statistical test (Kolmogorov–Smirnov) for normal distribution fitting.
Steps of establishing normal and cumulative distribution curves:
Step 1. Calculate mean (μ) using Equation (1), and standard deviation (σ) using Equation (2):
where
- xi is the value of GWP for a studied mixture.
- N is the total number of studied mixtures.
Step 2. Step size (bin width) Estimation:
To construct a well-shaped and representative frequency distribution, an optimal bin width was calculated using the Freedman–Diaconis Rule [30] as follows:
- Sort the GWP values in ascending order.
- Determine the first (Q1 = GWP at 25% of data points), second (Q2 = GWP at 50% of data points), and third (Q3 = GWP at 75% of data points) quartiles.
- Compute the Interquartile Range (IQR): IQR = Q3 − Q1
Calculate bin width (step size) using Equation (3):
where N is the number of data points.
Table 7 illustrates an example of the calculations of optimal bin width for the normal and cumulative distribution for the A1–A3 phase of the studied asphalt mixture.
Table 7.
The calculations of optimal bin width for normal and cumulative curves.
6. Establishing Normal and Cumulative Distribution Curves
- a.
- GWP values for asphalt mixtures obtained from the LaPave database
Normal Distribution Function:
The probability density function of the normal distribution curve was calculated using Equation (4) [42]:
Figure 2, Figure 3 and Figure 4 shows the normal distribution curves of GWP values resulting from A1, A2, and A1–A3 phases for the studied asphalt mixtures.
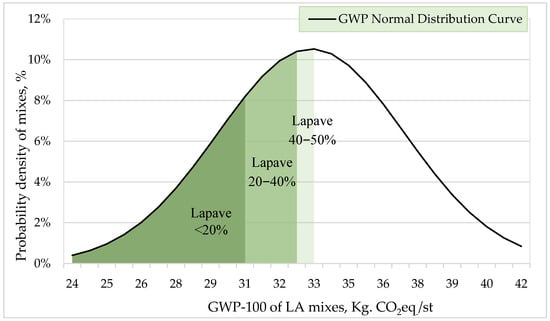
Figure 2.
Normal distribution curve for GWP values—Phase A1.
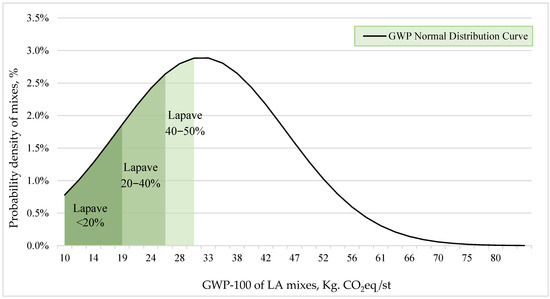
Figure 3.
Normal distribution curve for GWP values—Phase A2.
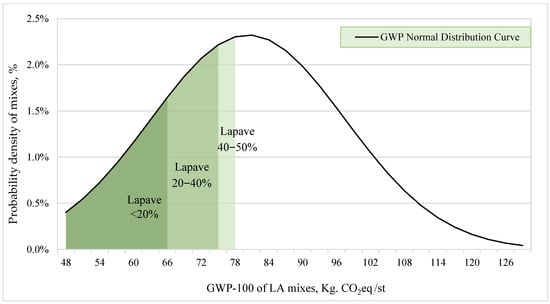
Figure 4.
Normal distribution curve for GWP values—Combined phases A1−A3.
Cumulative Distribution Function:
The normal distribution curve was transformed into a cumulative distribution curve, which ranks a GWP value from zero to one hundred percent. This percentile rank can identify the proportion of asphalt mixtures exhibiting GWP values below specific thresholds or benchmarks, such as the 20th, 40th, and 50th percentiles. Cumulative curves serve as valuable tools for informing regulatory policies, sustainability targets, procurement strategies, and benchmarking studies [12]. The cumulative distribution function was calculated using Equation (5) [42]:
where “erf” is the Gauss error function, approximated by the Maclaurin series using Equation (6). The Maclaurin series expansion of the error function converges for all finite values of z [30]; however, in this study, it converges up to the maximum asphalt mixture emissions level in the studied dataset.
Figure 5, Figure 6 and Figure 7 present the resulting cumulative distribution graphs based on a proper bin width. The 20th, 40th, and 50th percentiles, and the average were plotted to determine the GWP levels aligned with the GSA thresholds for GWP of asphalt mixtures.
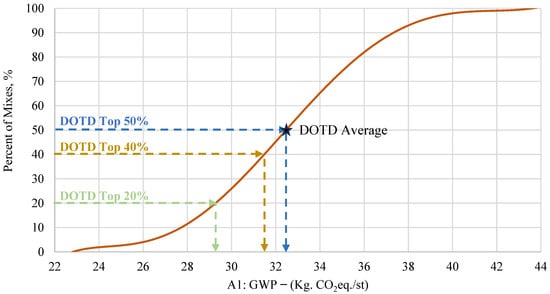
Figure 5.
Cumulative density distribution curve for GWP values—Phase A1.
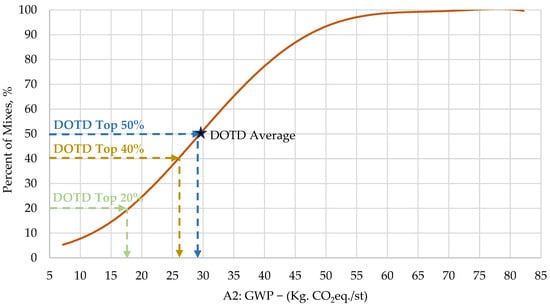
Figure 6.
Cumulative density distribution curve for GWP values—Phase A2.
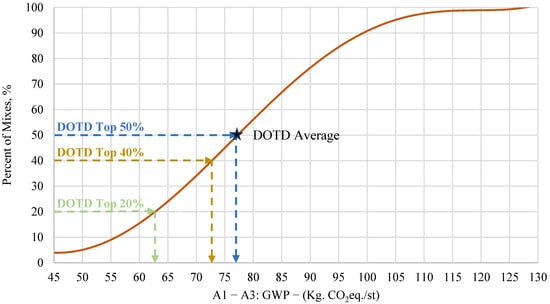
Figure 7.
Cumulative density distribution curve for GWP values—Combined phases A1–A3.
- b.
- GWP values for asphalt mixtures obtained from NAPA Reports
Figure 8 illustrates the cumulative distribution curve of GWP values for phases A1–A3 for Louisiana’s reported asphalt mixtures.
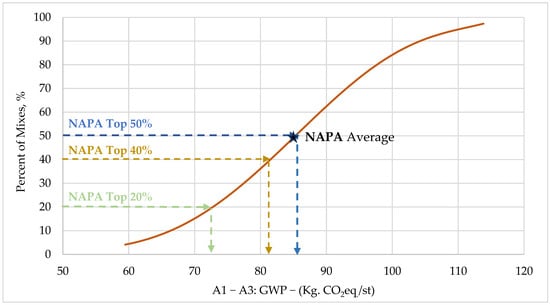
Figure 8.
NAPA-GWP for phase A1–A3 based on published EPDs.
Table 8 illustrates the descriptive statistical parameters for different phases to clarify the central tendency and variation in results.
Table 8.
Descriptive Statistics of Phases A1, A2, A3, and A1–A3.
Figure 9 presents the estimated GWP benchmarks for Louisiana’s asphalt mixtures, derived from two distinct data sources: the LaPave database and NAPA published EPD reports. These benchmarks were subsequently compared against the National GSA thresholds. It is worth noting that the GWP benchmarks exhibited variation based on the data source. Specifically, the benchmarks derived from the LaPave database were consistently lower than those obtained from the NAPA EPD reports. It is worth noting that the background database and allocation methods for both analyses from NAPA and DOTD are identical and based on the TRACI V2.1 database. However, the quality of data and different percentages of high-RAP mixtures might have reduced the overall emissions of NAPA mixtures. NAPA analysis had 33% of mixtures containing more than 25% RAP compared to only 5% mixes in DOTD analysis.
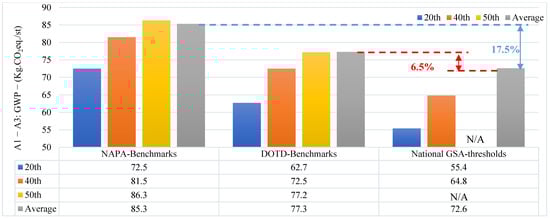
Figure 9.
GWP limits for Louisiana asphalt mixture versus the National GSA thresholds. Notes: GWP: Global warming potential; GSA: General Services Administration. N/A: Not available.
However, both the LaPave and NAPA-derived GWP benchmarks for asphalt mixtures were numerically higher (17.5%) than the thresholds proposed by the GSA. This variability shows the necessity to account for regional variations in specifications, material selection, and production methodologies when establishing such environmental benchmarks. In addition, the average GWP of DOTD mixtures was numerically higher (6.5%) than the GSA average threshold, which emphasizes the need for innovative strategies to reduce asphalt-related GHG emissions in Louisiana.
7. Developing GWP Benchmarks for Asphalt Mixtures as Classified by DOTD
In the Louisiana Standard Specifications for Roads and Bridges-Table 502-6, asphalt mixtures have been categorized based on:
- Based on nominal maximum aggregate size (NMAS)
- Based on the traffic design level
- Based on average daily traffic (ADT)
To ascertain whether significant differences existed in GWP benchmarking values across various asphalt mixture categories, an ANOVA (Analysis of Variance) and Bonferroni post hoc test were conducted. Table 9 presents a detailed breakdown of these asphalt mixture categories, including the results of the statistical analyses (represented by the p-value), indicating the presence or absence of significant differences among asphalt mixture types within each category.
Table 9.
Asphalt mixture categorized by the DOTD specification.
ANOVA and the Bonferroni post hoc tests were performed to determine whether the GWP values among different categories were statistically significant. The null hypothesis for each comparison assumed that no differences existed between the categories. If the p-value is lower than 0.05, it means the difference between categories is statistically significant.
- The results showed a statistically significant difference between mixtures with an NMAS of 12.5 mm and mixtures with a larger NMAS (19 mm and 25 mm), with a p-value of 0.017, Figure 10. It is worth noting that finer-graded mixtures release higher GWP emissions due to increased surface area of finer aggregates, which necessitates higher asphalt binder content to achieve adequate coating and workability. Asphalt binder is known for producing significantly high GWP emissions.
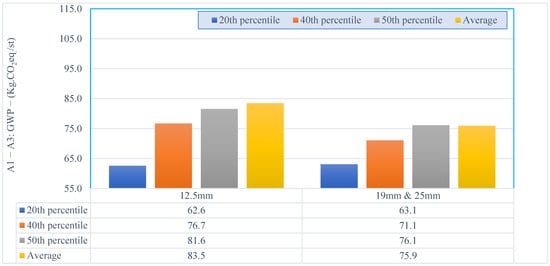 Figure 10. GWP benchmarks for asphalt mixtures as classified by NMAS.
- 2.
- The asphalt mixture designed for traffic level 2 showed significantly higher GWP emissions (p < 0.001) than mixtures designed for traffic level 1. Mixtures designed for higher traffic levels (more than three mESALs) produce 17.2% higher emissions compared to mixtures designed for lower traffic design level (Less than three mESALs), Figure 11. This might be attributable to the structural requirements of high-traffic pavements, which often demand high-quality binder, higher binder content, and less recycled materials than low-traffic pavements.
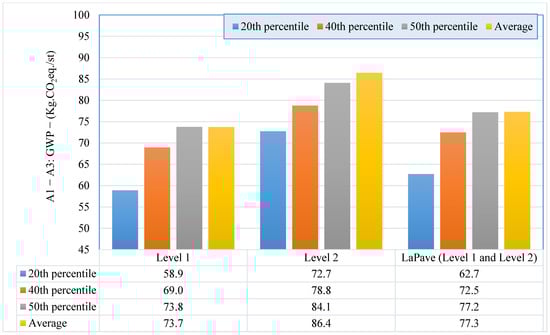 Figure 11. GWP benchmarks for asphalt mixtures as classified by traffic level.
 - 3.
- The asphalt mixtures serving less ADT than 3500 vehicle per day (vpd) showed a significant reduction in GWP emissions when compared to the ones with higher ADT, Figure 12. This might be attributable to the higher structural requirements for high volume roads, which often demand high-quality binder, higher binder content, and less recycled materials.
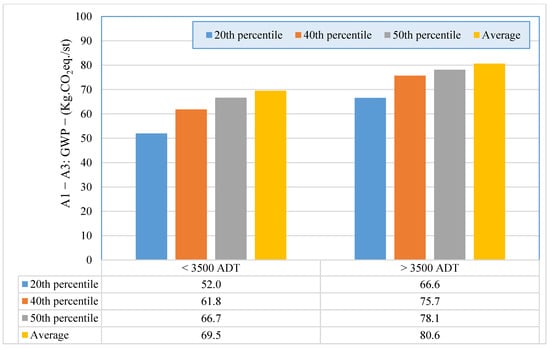 Figure 12. GWP benchmarks for asphalt mixtures as classified by traffic volume category.
8. Conclusions
This study developed a global warming potential (GWP) benchmarking framework for asphalt mixtures in Louisiana using two complementary data sources: Environmental Product Declaration (EPD) reports from the NAPA Eco-label program and approved Job Mix Formulas (JMFs) from the LaPave database available at DOTD. The GWP values were assessed using the FHWA LCA Pave tool and TRACI 2.1 methodology for DOTD mixtures, while GWP values for the NAPA mixtures were directly obtained from published EPDs. Normal and cumulative distribution curves were constructed to derive percentile-based benchmarks at 20th, 40th, and 50th percentiles, which enabled comparison across categories and against national General Services Administration (GSA) thresholds. Further, statistical analyses using ANOVA and a Bonferroni post hoc test were conducted between different types of asphalt mixtures containing various nominal maximum aggregate sizes, traffic levels, and Average Daily Traffic, following the classification of DOTD. Based on the findings of this study, the following conclusions were made:
- GWP benchmarks were established for Louisiana’s asphalt mixtures at 20th, 40th, 50th percentiles, and average.
- GWP benchmarks collected from NAPA data (Average percentile = 85.3 Kg.CO2eq./st) showed slightly higher values than those obtained from the DOTD database (Average percentile = 77.3 Kg.CO2eq./st). This is due to the differences and uncertainties of the GWP values of phase A3.
- The average GWP benchmarks established based on DOTD data were numerically higher (6.5%) than the GWP thresholds determined by GSA. This emphasized the need for innovative strategies to reduce asphalt-related GHG emissions in Louisiana.
- Significant differences were found between GWP emissions of asphalt mixtures with different NMAS, traffic levels, and ADT as classified by DOTD. This finding necessitated an accurate, tailored GWP benchmark for asphalt mixtures to obtain more sustainable pavement and greener infrastructure.
- In this study, Phase A3 data inventory was limited to plant-average energy and emissions rather than mixture-specific data, reducing accuracy. Future work should collect mixture-level data to lower uncertainty and improve comparability across plants. In addition, this study was limited to a cradle-to-gate system boundary. Future research should extend to cradle-to-grave analyses and include sensitivity assessments of key factors to better identify emission reduction strategies and inform policy and practice.
Author Contributions
Conceptualization, I.E., M.S. and L.N.M.; Methodology, L.N.M., H.D. and S.C.III; Formal analysis, I.E., M.S., L.N.M. and H.D.; Data curation, I.E. and M.S.; writing—original draft, I.E. and M.S.; writing—review & editing, H.D. and S.C.III; Supervision, L.N.M.; Funding acquisition, L.N.M. All authors have read and agreed to the published version of the manuscript.
Funding
This research was funded by the Louisiana Department of Transportation and Development, USA, and the Federal Highway Administration, USA, under the Louisiana Transportation Research Center Project number 24-1B.
Institutional Review Board Statement
Not applicable.
Informed Consent Statement
Not applicable.
Data Availability Statement
Data will be made available on request.
Acknowledgments
The authors acknowledge the Louisiana Transportation Research Center, USA, for their support.
Conflicts of Interest
Author Heather Dylla is from Construction Partners Inc., Alabama, USA. The remaining authors declare that the research was conducted in the absence of any commercial or financial relationships that could be construed as a potential conflict of interest.
Abbreviations
The following abbreviations are used in this manuscript:
| A1 | Product Phase 1: raw material extraction and processing |
| A1–A3 | The production stages total (sum of A1, A2, and A3) |
| A2 | Product Phase 2: transport of constituents to the mixing plant |
| A3 | Product Phase 3: mix manufacturing at the plant |
| AC | Asphalt Content |
| ACLCA | American Center for Life Cycle Assessment |
| ADT | Average Daily Traffic |
| ANOVA | Analysis of Variance |
| CO2 | Carbon Dioxide |
| CO2e (or CO2eq) | Carbon Dioxide Equivalent |
| DOTD | Department of Transportation and Development |
| EPA | U.S. Environmental Protection Agency |
| EPDs | Environmental Product Declarations |
| erf | Error Function |
| FHWA | Federal Highway Administration (U.S.) |
| GHG | Greenhouse Gases |
| GSA | General Services Administration |
| GWP | Global Warming Potential |
| IQR | Interquartile Range |
| JMF | Job Mix Formula |
| kWh | Kilowatt Hour |
| LA | Louisiana State |
| LCA | Life Cycle Assessment |
| LCI | Life Cycle Inventory |
| mESALs | Million Equivalent Single-Axle Loads |
| MFC | Thousand Cubic Feet |
| MMT | Million Metric Tons |
| NAPA | National Asphalt Pavement Association |
| NMAS | Nominal Maximum Aggregate Size |
| OGFC | Open Graded Friction Course |
| PG | Performance Grade |
| RAP | Reclaimed Asphalt Pavement |
| SBS | Styrene-Butadiene-Styrene polymer |
| st | Short Ton |
| TRACI | Tool for the Reduction and Assessment of Chemical and other Environmental Impacts |
| USLCI | U.S. Life Cycle Inventory Database |
| vpd | Vehicles Per Day |
References
- United States Environmental Protection Agency. Transportation Sector Emissions. Available online: https://www.epa.gov/ghgemissions/transportation-sector-emissions#:~:text=When%20considering%20only%20direct%20emissions,decreased%20by%20less%20than%201%25 (accessed on 24 April 2025).
- Dismukes, D.E. Louisiana 2021 Greenhouse Gas Inventory; LSU Center for Energy Studies: Baton Rouge, LA, USA, 2021. [Google Scholar]
- United States Environmental Protection Agency. Inventory of US Greenhouse Gas Emissions and Sinks: 1990–1994; United States Environmental Protection Agency: Washington, DC, USA, 1995. [Google Scholar]
- Thives, L.P.; Ghisi, E. Asphalt mixtures emission and energy consumption: A review. Renewable and Sustainable Energy Reviews 2017, 72, 473–484. [Google Scholar] [CrossRef]
- Parmesan, C.; Morecroft, M.D.; Trisurat, Y. Climate Change 2022: Impacts, Adaptation and Vulnerability; GIEC: Geneva, Switzerland, 2022. [Google Scholar]
- Shacat, J.; Willis, J.R.; Ciavola, B. GHG Emissions Inventory for Asphalt Mix Production in the United States: Current Industry Practices and Opportunities to Reduce Future Emissions; National Asphalt Pavement Association: Greenbelt, MD, USA, 2022. [Google Scholar]
- Keches, C.; LeBlanc, A. Reducing Greenhouse Gas Emissions from Asphalt Materials; Worcester Polytechnic Institute: Worcester, MA, USA, 2007. [Google Scholar]
- Miller, L.; Ciavola, B.; Mukherjee, A. EPD Benchmark for National Asphalt Pavement Association: Version 2.0 Including Round 2 Data Collection; National Asphalt Pavement Association: Lanham, MD, USA, 2024. [Google Scholar]
- Elnaml, I.; Mohammad, L.N.; Baumgardner, G.; Cooper, S., III; Cooper, S., Jr. Sustainability of Asphalt Mixtures Containing 50% RAP and Recycling Agents. Recycling 2024, 9, 85. [Google Scholar] [CrossRef]
- Elnaml, I.; Dylla, H.; Liu, J.; Mohammad, L.N.; Cooper, S.B., III; Cooper, S.B., Jr. Incorporating environmental impact analysis into Louisiana’s balanced asphalt mixture design. Transportation Research Record 2023, 2679, 1078–1090. [Google Scholar] [CrossRef]
- Liu, Y.; Liu, Z.; Zhu, Y.; Zhang, H. A Review of Sustainability in Hot Asphalt Production: Greenhouse Gas Emissions and Energy Consumption. Applied Sciences 2024, 14, 10246. [Google Scholar] [CrossRef]
- Miller, L.; Ciavola, B.; Mukherjee, A. EPD Benchmark for Asphalt Mixtures; National Asphalt Pavement Association: Greenbelt, MD, USA, 2024. [Google Scholar]
- Diedrich, G. Evaluating local climate policy: Municipal action plans through the lens of resilience and environmental justice. PLoS Clim 2024, 3, e0000395. [Google Scholar] [CrossRef]
- Rangelov, M.; Dylla, H.; Mukherjee, A.; Sivaneswaran, N. Use of environmental product declarations (EPDs) of pavement materials in the United States of America (USA) to ensure environmental impact reductions. Journal of Cleaner Production 2021, 283, 124619. [Google Scholar] [CrossRef]
- National Asphalt Pavement Association. Emerald Eco-Label EPD Program; National Asphalt Pavement Association: Greenbelt, MD, USA, 2023; Available online: https://asphaltepd.org/published/all?state=LA (accessed on 24 April 2025).
- National Asphalt Pavement Association. Emerald Eco-Label Program Documents; National Asphalt Pavement Association: Greenbelt, MD, USA, 2023; Available online: https://www.asphaltpavement.org/programs/napa-programs/emerald-eco-label/product-category-rules (accessed on 24 April 2025).
- Gkyrtis, K.; Kokkalis, A. Toward the Inclusion of Waste Materials at Road Upper Layers: Integrative Exploration of Critical Aspects. Future Transportation 2025, 5, 67. [Google Scholar] [CrossRef]
- Bhat, C.G. Life Cycle Information Models with Parameter Uncertainty Analysis to Facilitate the Use of Life-Cycle Assessment Outcomes in Pavement Design Decision-Making. Ph.D. Thesis, Michigan Technological University, Houghton, MI, USA, 2020. [Google Scholar]
- Fedral Highway Adminastration. LCA Pave: A Tool to Assess Environmental Impacts of Pavement Material and Design Decisions. Available online: https://www.fhwa.dot.gov/pavement/lcatool (accessed on 1 June 2025).
- Bare, J.; Young, D.; Qam, S.; Hopton, M.; Chief, S. Tool for the Reduction and Assessment of Chemical and other Environmental Impacts (TRACI); United State Environmental Protection Agency: Washington, DC, USA, 2012. [Google Scholar]
- ISO 21930: 2017; Sustainability in Buildings and Civil Engineering Works, Core Rules for Environmental Product Declarations of Construction Products and Services. ISO: Geneva, Switzerland, 2017.
- Martin Marietta. Environmental Product Declaration. Martin Marietta, Raleigh, NC, USA. Available online: https://pcr-epd.s3.us-east-2.amazonaws.com/359.EPD_for_Martin_Marietta_EPD_final.pdf (accessed on 1 July 2025).
- Al-Qadi, I.L.; Yang, R.; Kang, S.; Ozer, H.; Ferrebee, E.; Roesler, J.R.; Salinas, A.; Meijer, J.; Vavrik, W.R.; Gillen, S.L. Scenarios developed for improved sustainability of Illinois Tollway: Life-cycle assessment approach. Transportation Research Record 2015, 2523, 11–18. [Google Scholar] [CrossRef]
- Asphalt Institute. Life Cycle Assessment of Asphalt Binder; Asphalt Institute: Lexington, KY, USA, 2019; Available online: https://www.asphaltinstitute.org/engineering/sustainability/life-cycle-assessment-of-asphalt-binder/ (accessed on 28 October 2025).
- Argonne National Laboratory (ANL). Concrete: Material Flow Dataset; U.S Federal LCA Commons Database: Argonne, IL, USA, 2012. Available online: https://www.lcacommons.gov/lca-collaboration/Argonne_National_Lab/Concrete/dataset/FLOW/73c7494d-4e93-3769-896b-8bb82f0dfccc (accessed on 28 October 2025).
- National Institute of Standards and Technology (NIST). Construction Materials: Material Flow Dataset. U.S. Federal LCA Commons Database. Available online: https://www.lcacommons.gov/lca-collaboration/NIST/construction_materials/dataset/FLOW/a1242640-8306-366c-9c55-6dfd23e77bd7 (accessed on 28 October 2025).
- US. Forest Service–Forest Products Laboratory (USFS FPL). Woody Biomass: Material Flow Dataset. Federal LCA Commons. Available online: https://www.lcacommons.gov/lca-collaboration/US_Forest_Service_Forest_Products_Lab/Woody_biomass/dataset/FLOW/628c07ec-0802-39c1-ab88-1c62848ef436 (accessed on 28 October 2025).
- Federal LCA Commons. IMPACT World+: Material Flow Dataset. Available online: https://www.lcacommons.gov/lca-collaboration/Federal_LCA_Commons/Impact_World_Plus/dataset/FLOW/617b4c08-cfb6-3209-b232-bb7e1b7b1bfc (accessed on 28 October 2025).
- National Renewable Energy Laboratory (NREL). Electricity, bituminous coal, at power plant: Material Flow Dataset. U.S. Federal LCA Commons, U.S. Department of Energy. Available online: https://www.lcacommons.gov/lca-collaboration/National_Renewable_Energy_Laboratory/USLCI_Database_Public/dataset/FLOW/737e3efb-29d4-3b9d-8d78-6269508c1f59 (accessed on 28 October 2025).
- Federal LCA Commons. U.S. Electricity Baseline: Material Flow Dataset. U.S. Federal LCA Commons Database. Available online: https://www.lcacommons.gov/lca-collaboration/Federal_LCA_Commons/US_electricity_baseline/dataset/FLOW/4c20788d-fdef-365a-a050-7a92e858e170 (accessed on 28 October 2025).
- Baumel, P.; Hurburgh, C.; Lee, T. Estimates of Total Fuel Consumption in Transporting Grain from Iowa to Major Grain Countries by Alternatives Modes and Routes; Iowa Grain Quality Initiative: Ames, IA, USA, 2015; Available online: https://www.extension.iastate.edu/grain/topics/EstimatesofTotalFuelConsumption.htm (accessed on 1 July 2025).
- Corporation, A.T. Rail vs. Truck Fuel Efficiency: The Relative Fuel Efficiency of Truck Competitive Rail Freight and Tuck Operations Compared in a Range of Corridors; US Department of Transportation-Federal Railroad Administration: Washington, DC, USA, 1991. [Google Scholar]
- Protopapas, A.; Kruse, C.J.; Olson, L.E. Modal comparison of domestic freight transportation effects on the general public. Transportation Research Record 2013, 2330, 55–62. [Google Scholar] [CrossRef]
- Executive, T.M. Barge Transport Wins on Fuel Efficiency; The Maritime Executive: Vero Beach, FL, USA, 2017. [Google Scholar]
- US. Army Corps of Engineers. Inland Waterway Navigation: Value to the Nation; U.S. Army Corps of Engineers: Washington, DC, USA, 2013. [Google Scholar]
- CSX Transportation. Class I Railroad Annual Report R-1; Norfolk Southern: Atlanta, GA, USA, 2024. [Google Scholar]
- Association of American Railroads. Freight Railroads & Climate Change: Reducing Emissions, Enhancing Resiliency; Association of American Railroads: Washington, DC, USA, 2023. [Google Scholar]
- RSI Logistics. Is Rail Better for the Environment Than Trucks? Available online: https://www.rsilogistics.com/blog/is-rail-better-for-the-environment-than-trucks/ (accessed on 20 September 2025).
- DasGupta, A. Normal Distribution. In Fundamentals of Probability: A First Course; Springer: New York, NY, USA, 2010; pp. 195–212. [Google Scholar]
- Li, L.; Chan, P.; Zollinger, D.G.; Lytton, R.L. Quantitative analysis of aggregate shape based on fractals. Materials Journal 1993, 90, 357–365. [Google Scholar]
- Berger, V.W.; Zhou, Y. Kolmogorov–Smirnov Test: Overview. In Wiley StatsRef: Statistics Reference Online; John Wiley & Sons: Hoboken, NJ, USA, 2014. [Google Scholar]
- Navidi, W.C. Statistics for Engineers and Scientists; McGraw-Hill: New York, NJ, USA, 2006; Volume 2. [Google Scholar]
Disclaimer/Publisher’s Note: The statements, opinions and data contained in all publications are solely those of the individual author(s) and contributor(s) and not of MDPI and/or the editor(s). MDPI and/or the editor(s) disclaim responsibility for any injury to people or property resulting from any ideas, methods, instructions or products referred to in the content. |
© 2025 by the authors. Licensee MDPI, Basel, Switzerland. This article is an open access article distributed under the terms and conditions of the Creative Commons Attribution (CC BY) license (https://creativecommons.org/licenses/by/4.0/).