Article

A Proposed Post-Fire Planning Approach Based on DEMATEL in Vesuvius National Park

by
Salvatore Polverino
1,
Hourakhsh Ahmad Nia
2,
Rokhsaneh Rahbarianyazd
2 and
Behnam Mobaraki
3,*
1
Department Training and Internationalization, Ordine degli Architetti, Pianificatori, Paesaggisti e Conservatori della Provincia di Napoli, Via Benedetto Brin n. 55/A13, 80142 Napoli, Italy
2
Department of Architecture, Faculty of Engineering and Natural Sciences, Alanya University, 07400 Alanya, Turkey
3
Department of Graphic Engineering and Design, Universitat Politècnica de Catalunya BarcelonaTech (UPC), 08034 Barcelona, Spain
*
Author to whom correspondence should be addressed.
Sustainability 2025, 17(22), 10325; https://doi.org/10.3390/su172210325
Submission received: 23 September 2025 / Revised: 11 November 2025 / Accepted: 13 November 2025 / Published: 18 November 2025

Abstract

We present a site-agnostic workflow to identify Fireline Tactical Support Points (FTSPs) and corridors following wildfire where spectral-change proxies (dNBR, RdNBR, and dNDVI) are paired pre/post-fire and co-registered on a 20 m grid together with a 72 h rainfall accumulation layer, which is treated as an operational feasibility and safety overlay, complementing access and terrain. Applied to the Vesuvius National Park (Italy) wildfire episode of August 2025, the pipeline yields suitability/susceptibility surfaces, ranked factors, and corridor candidates, with estimated successes including coherent prioritization within high-severity mosaics, improved continuity toward existing access routes, and reduced overlap with mapped sensitive areas at like-for-like suitability. Low-carbon staging is retained as a design safeguard, while detailed greenhouse-gas accounting is intentionally deferred to future, fleet-resolved multi-criteria analyses. The approach enables rapid, repeatable decision support and is relevant to SDG 11 (Sustainable Cities and Communities), SDG 13 (Climate Action), and SDG 15 (Life on Land).

1. Introduction

Wildfire regimes in Mediterranean peri-urban landscapes are intensifying under the dual pressures of climate variability and accelerating land-use change [1,2,3]. Rising temperatures, erratic precipitation cycles, and the abandonment of agricultural land have collectively produced fuel accumulations and heightened ignition likelihoods, thereby amplifying risks to settlements, infrastructure, and biodiversity, as highlighted by multi-epoch cartography documents on urban increase. These risks are particularly pronounced within protected landscapes where ecological conservation, i.e., the near-total decline in agricultural patterns (vineyards) [4], human habitation, and cultural heritage must be managed simultaneously, as established by recent MCDM evidence [5] addressing complex, multi-objective shrubland problems under climate change to map analogous methods and trends using DEMATEL as the core analytical approach.
The challenge in peri-urban fringes [6] that act as pressure zones between natural ecosystems and human activity is to encode land-use/land-cover change (LUCC) indicators—including class transitions, fragmentation metrics, WUI length/area growth, changes in access/route serviceability where corridors intersect, expanding urban buffers, and farmland zoning within the burned perimeter under Natura 2000 overlays—as DEMATEL features and expose them in the SDSS while integrating 3D front-geometry descriptors (L3D and S3D) that reveal longer 3D paths and terrain-driven tortuosity. Interpreted causally, these descriptors are treated as drivers when they push risk or exposure upstream or as resultants when they reflect downstream consequences, with the distinction formalized by prominence (R + C) and net relation (R − C), thereby making leverage points explicit for governance, inspections, drills, clearance, and monitoring.
Consistent with this, satellite remote sensing has contributed to this post-fire assessment, particularly through multispectral indices such as the normalized burn ratio (NBR) and differenced NBR (dNBR), enabling systematic mapping of burn severity at regional scales [7,8,9,10]. Despite such advances, the operational transfer of these products to fine-grained planning contexts remains underdeveloped. In fragmented landscapes with steep terrain, conventional severity maps are often inadequate for decision-making, as they omit hydrological integrity, access constraints, and habitat-specific vulnerabilities. Consequently, their utility for prevention, rapid response, and post-fire recovery planning is diminished, thereby weakening the evidence base for risk-sensitive spatial planning [7,11,12].
Nonetheless, a critical gap lies in the integration of hydrologically corrected terrain metrics with burn-severity products and habitat-specific ecological layers, especially within Natura 2000 sites. Here, it is not only the magnitude of fire damage that matters but also the potential for interventions to trigger secondary ecological disturbances. Moreover, consistent with operational practice, rainfall accumulated over a 72 h period (Rain72h) must be treated not as an upstream driver of fire severity, but as a key determinant of operational feasibility, influencing access, staging, and safety conditions [13,14,15]. In effect, hydrology, vegetation dynamics, and accessibility need to be fused into actionable mapping products that both capture mechanistic processes and yield transparent decision support for tactical fire management.
Emblematic of the challenge, the Vesuvius National Park case anchors an applied proof-of-concept/proof-of-principle [16], showcasing operational mapping and causal prioritization that can be deployed beyond the complex study site: the park’s steep volcanic relief, dense settlement fringes, and rich ecological assets coexist within a Natura 2000 perimeter that is simultaneously overseen by civil protection authorities, fire brigades, and, when required, military units. In such a dense environment, decision support must explicitly prioritize low-carbon siting strategies: shortening haul distances, minimizing the creation of ad hoc tracks, and aligning tactical planning with ecological preservation [17]. The imperative is therefore twofold: ensuring operational readiness (prepositioning, staging, and routing) and safeguarding high-value habitats that are integral to the park’s conservation mandate.
Open Earth Observation (EO) assets [18,19,20,21], particularly Sentinel-2 multispectral imagery, combined with hydrologically corrected digital elevation models (DEMs), now make it possible to generate planning-grade products. Based on DEM-derived hydrological metrics on a 20 m grid, indices such as NBR, dNBR, and differenced NDVI (dNDVI) can be co-analyzed alongside habitat exposure layers [13,14,15,22]. This fusion enables decision makers to steer avoidance strategies, identify control corridors [23], and balance fire-suppression needs with conservation imperatives.
To further strengthen analytical rigor, directional relations among terrain metrics, vegetation signals, and habitat sensitivities can be evaluated through Decision-Making Trial and Evaluation Laboratory (DEMATEL) techniques [24,25]. By reporting Prominence by factor and Causality by factor, DEMATEL techniques enhance transparency in ranking drivers and clarify trade-offs, thereby aligning scientific outputs with operational decision-making protocols. Within this framework, Fireline Tactical Support Points (FTSPs) emerge as the core decision objects. Generating multiple siting scenarios under explicit thresholds and constraints enables the systematic identification of low-carbon, habitat-sensitive options for tactical deployment.
Recent advances such as the GRESTO index for spatial prioritization in Mediterranean post-fire contexts [26], the deployment of AI-enabled UAV systems in post-fire management [27,28], and frameworks for explainable AI in wildfire risk assessment [29] underscore the growing demand for integrative and reproducible decision-support tools, also within an SDSS environment [30]. Yet this emphasis is only partially captured in LUCC-based landscapes; we integrate hydrologically conditioned DEMs and habitat layers into an open-source, DEMATEL-based pipeline.
In parallel to this, the analysis therefore situates Vesuvius National Park within broader debates on post-fire spatial governance, proposing an open, auditable workflow that integrates multisource remote sensing, hydrologically corrected DEMs, ecological sensitivity mapping, and DEMATEL-based influence analysis.
Although our demonstration centers on Vesuvius National Park, the workflow is site-agnostic and replicable across WUI settings operating under Natura 2000 and integrated civil-protection/heritage governance.
In framing the problem in the Italian context, tactical choices necessarily interface with the Soprintendenze and the Autonomous Archeological Park of Pompeii within the Cultural Heritage and Landscape Code (Legislative Decree 42/2004) [31] and the Framework Law on Protected Areas (Law 394/1991) [31], while remaining coherent with the EU Habitats (92/43/EEC) and Birds (2009/147/EC) [31] Directives and the European Landscape Convention.
Fundamentally, the park’s adjacency to UNESCO World Heritage areas (Pompeii–Herculaneum–Torre Annunziata; Historic Center of Naples) further motivates auditable, low-impact routing and staging. Accordingly, we frame Vesuvius as a replicable reference (lighthouse) case for the Mediterranean basin and limit claims to the methodological transferability of the pipeline-open EO indices, hydrology-first DEM conditioning, and DEMATEL influence analysis (therefore included in the following section, outlining its full transparency), stress-tested via E1–E8 with universality of effect sizes reserved for future multi-site, multi-event validation. This portability is thus supported across regions and events: we therefore target analytical generalization, reserving claims of universality.
In performing these steps, the framework addresses methodological gaps, strengthens planning utility, and is co-registered on a common 20 m ETRS89/UTM 33N grid.

2. Materials and Methods

2.1. Study Design and Statistical Overview

Situated in the Mediterranean wildland–urban interface around Mount Vesuvius (Campania, Italy), spanning 13 municipalities, and characterized by steep topography, fragmented fuels, dense settlement fringes, high-value ecosystems, and heritage landscapes, as visualized in Figure 1, we adopt a proof-of-concept (PoC) design that uses the Mount Vesuvius episode as a demonstration while building a reproducible evidence base intended for generalization beyond a single site.
Operating within Italy’s cultural-landscape protection framework (Codice dei beni culturali e del paesaggio, Legislative Decree 42/2004) [32], wildfire information must satisfy multiple public mandates—vegetation management, civil protection and fire brigades, and the safeguarding of cultural landscapes and heritage settings.
In aggregate, authoritative layers from the Ministry of Culture’s SITAP web-GIS (vincoli paesaggistici) [31] and Natura 2000 inventories/Standard Data Forms [32] are integrated so that severity and susceptibility outputs align with planning and emergency coordination in and around UNESCO World Heritage assets (Pompeii, Herculaneum, Torre Annunziata) [33].
A practical implication is that the same open, authoritative layers used for emergency response can be directly overlaid with the statistical outputs to assess protected viewsheds, archeological buffers, and Natura 2000 habitats, reducing duplication across agencies and improving legibility for planners and heritage authorities. From a data-analytic standpoint, the pipeline, conceptualized in Figure 2, harmonizes all inputs on a common grid (ETRS89/UTM 33N; 20 m resolution), derives spectral severity metrics (dNBR, dNDVI) and ancillary drivers (terrain/accessibility, WUI configuration, and hydrology), and treats 72 h rainfall as an operational feasibility constraint.
In framing the problem, the analytical flow is explicitly linear: (i) data harmonization and variable construction; (ii) exploratory PCA to diagnose gradients and collinearity; (iii) DEMATEL as the causal core to extract inter-factor dependencies and produce stable rankings via prominence (D + R) and relation (D − R) indicators; (iv) scenario analysis and bootstrap consensus for robustness; and (v) uncertainty quantification and reproducibility checks. Within this PoC protocol—where the pipeline serves as the prototype and the Vesuvius setting as the demonstration—the outputs are thus designed to be directly consumable by multi-mandate governance, supporting risk reduction, restoration, and land-use decisions across agencies.

Computational Environment and Reproducibility Assets

Analyses were run in Python 3.10 (Anaconda) with NumPy 1.26.4 and pandas 2.1.1 for array–table operations [34], rasterio 1.4.3 for raster I/O and processing, and GeoPandas 1.1.1 for vector geospatial work; plots and QA used Matplotlib 3.10.7 and Jupyter 7.4.7, with QGIS 3.40.12 (LTR) employed only for quick-look checks [35,36,37]. The full pipeline—indices, hydrology-first terrain conditioning, and Rain72h/habitat integration on the ETRS89/UTM 33N 20 m grid—follows official scripts, configuration files, and an environment.yml (pinned versions; fixed random seed), plus logs and checksums. Third-party layers retain their original licenses and repositories. To facilitate independent verification across further fire cases while maintaining methodological integrity, replication assets—including data manifests, scripts, and templates—are released together with version-pinned configurations. Through this design, the framework directly addresses reproducibility gaps in prior decision-support models, providing an auditable, version-controlled, and openly shared environment in which each analytical step can be independently reproduced and verified.

2.2. Spatial Frame and Data Sources

2.2.1. Spatial Referencing and Grid Harmonization

By way of introduction, all rasters and vectors were brought to ETRS89/UTM Zone 33N and aligned on a fixed-origin 20 m target grid to ensure exact co-registration across optical, terrain, rainfall, and exposure layers [12,18,19,20,21,22]. Vector datasets (n = 71; e.g., fire perimeters and habitat polygons) were reprojected, snapped to the grid, and—where pixel-wise overlay was required—rasterized to 20 m with nearest-neighbor assignment to preserve class integrity [12,14,18]. Continuous rasters (e.g., spectral indices and slope) were resampled bilinearly, whereas categorical rasters used nearest-neighbor assignment. Pre- and post-fire Sentinel-2 L2A scenes (25 July 2025; 14 August 2025) were screened with the Scene-Classification Layer (SCL), yielding 0% cloud/shadow over the AOI. We did not perform cross-sensor spectral harmonization; radiometric/atmospheric corrections follow the data-producer defaults (Sentinel-2 L2A). Exact alignment was enforced by anchoring all layers to the grid’s fixed origin and cell size and verified through pixel-offset checks; a strict NoData policy was applied along AOI edges.

2.2.2. Optical Baseline–Impact Pairing and QA

For the optical component, we used Sentinel-2 Level-2A surface reflectance [14,18,38]. A post-fire acquisition was paired with a phenologically consistent pre-fire baseline within the protocol windows, ensuring identical tile (T33TVF) and relative orbit (R079) conditions to minimize view-geometry and seasonality effects:
  • Pre-fire:
    2C_MSIL2A_20250725T095051_N0511_R079_T33TVF_20250725T152515.SAFE (sensing 2025-07-25 09:50:51 UTC; processing 2025-07-25 15:25:15 UTC);
  • Post-fire:
    2C_MSIL2A_20250814T095051_N0511_R079_T33TVF_20250814T152614.SAFE (sensing 2025-08-14 09:50:51 UTC; processing 2025-08-14 15:26:14 UTC).
Methodologically, clouds and cloud-shadows were screened and masked using the Sentinel-2 scene-classification layer and product-level quality flags prior to any spectral compositing or index calculation [14,18,32].

2.3. Sampling Design, Standardization, and Spatial Cross-Validation

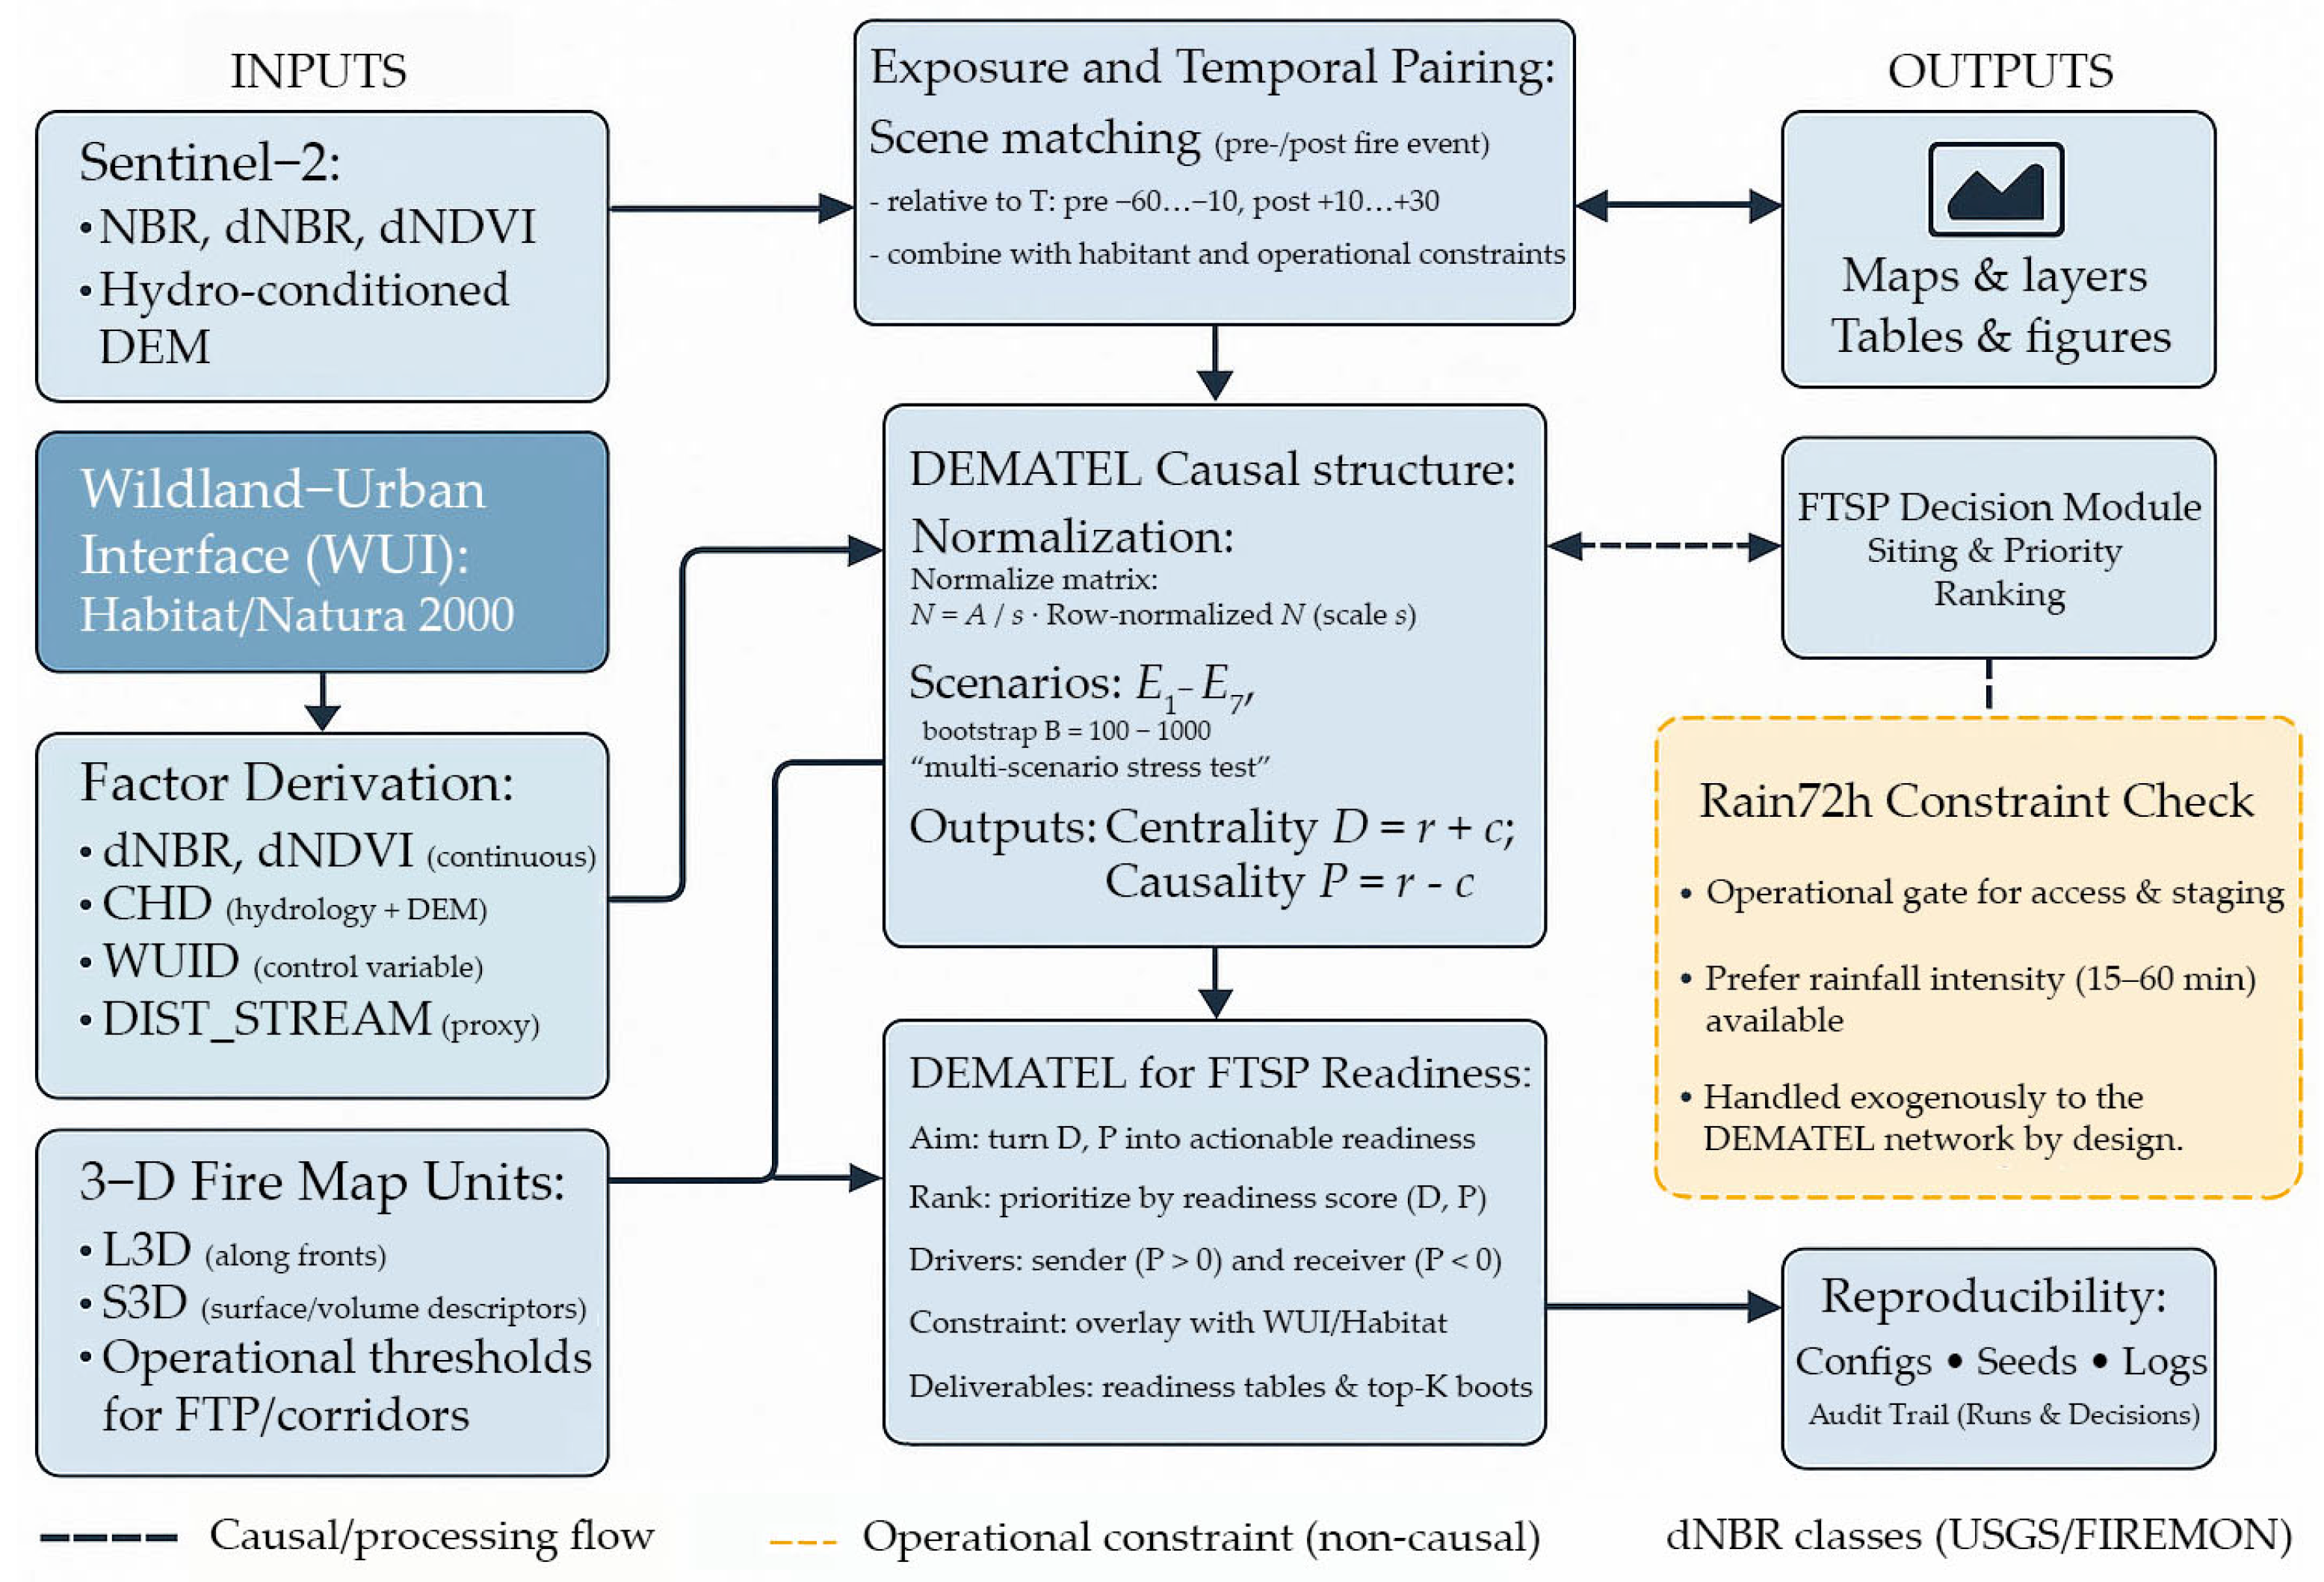
In the present setting, we drew stratified random candidates with a hard-core (Poisson-disk) spacing to avoid clustering on the 20 m grid [39,40], and we selected field/screening points by computing a per-pixel sampling weight obtained by standardizing burn severity, slope steepness, and distance to the WUI to empirical quantile ranks (weights summing to one, prioritizing severity). Spatial balance was checked against GRTS/BAS baselines [41,42] and by inspecting local coverage and area-variance. Standardization and stratification followed a two-step scheme: all candidate variables were z-scored, and points were additionally stratified by dNBR tertiles (Low/Mid/High) for scenario-wise comparisons and robustness. Resolution and co-registration checks addressed potential resampling artifacts near edges by recomputing indices at native versus harmonized scales and quantifying dNBR/NBR differences prior to any categorical mapping. To emulate geographic transfer and avoid optimistic error, we implemented end-to-end spatial block cross-validation by partitioning the study area into k tiles and evaluating predictions on held-out tiles—an approach recommended for spatially structured data that yields more honest out-of-area error than random CV [39,41]. Taken together, cloud and shadow were screened using the Sentinel-2 scene-classification layer and standard quality flags, as per product guidance [14,18,32]. Ancillary layers included the hydrologically corrected DEM (for slope/derivatives), Natura 2000 habitat/constraints (Standard Data Forms), and SITAP cultural-landscape constraints for planning overlays [31,32]. As an overview, the workflow proceeds from the Inputs (Sentinel-2 L2A reflectance, a hydrologically corrected DEM, and WUI/Habitat layers) and pre/post pairing on a common 20 m grid, through factor derivation (continuous dNBR, dNDVI; Composite Hydrological Derivative CHD; WUID; hydrographic proximity) and 3-D front descriptors (L3D and S3D), and culminates in a DEMATEL causal network that makes systemic drivers and interdependencies explicit, as also confirmed in Figure 1 in Forests (2024) [5] for the hierarchical structure of both AHP and DEMATEL, and Figure 3 detailing the SDSS process. In parallel to this, we adhere to an equivalent staging for reproducibility. Together with an FTSP decision module that translates the evidence into prioritized, field-ready siting, Rain72h is treated exogenously as an operational feasibility constraint, and reproducibility is ensured via pinned configurations, fixed seeds, and comprehensive logs.

2.3.1. Sampling, QA, and Cross-Validation

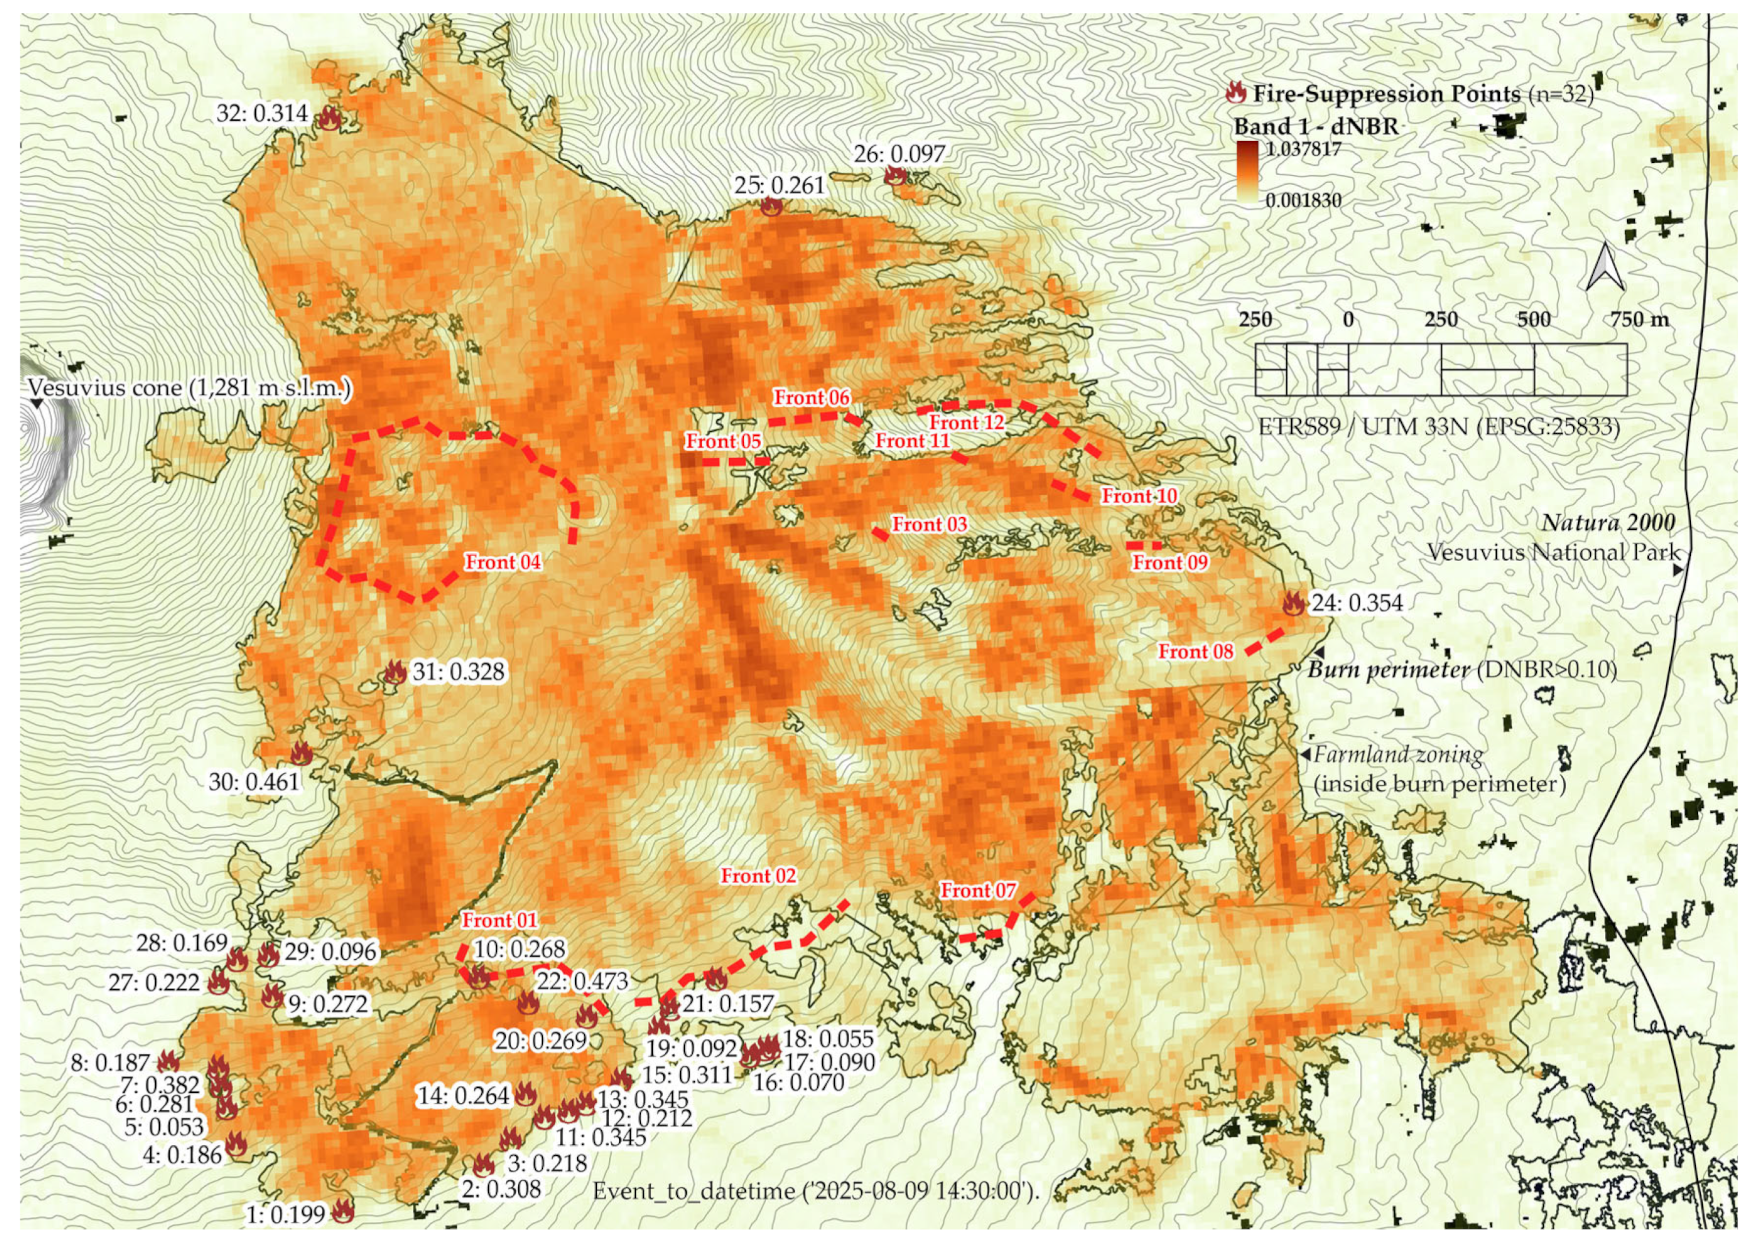
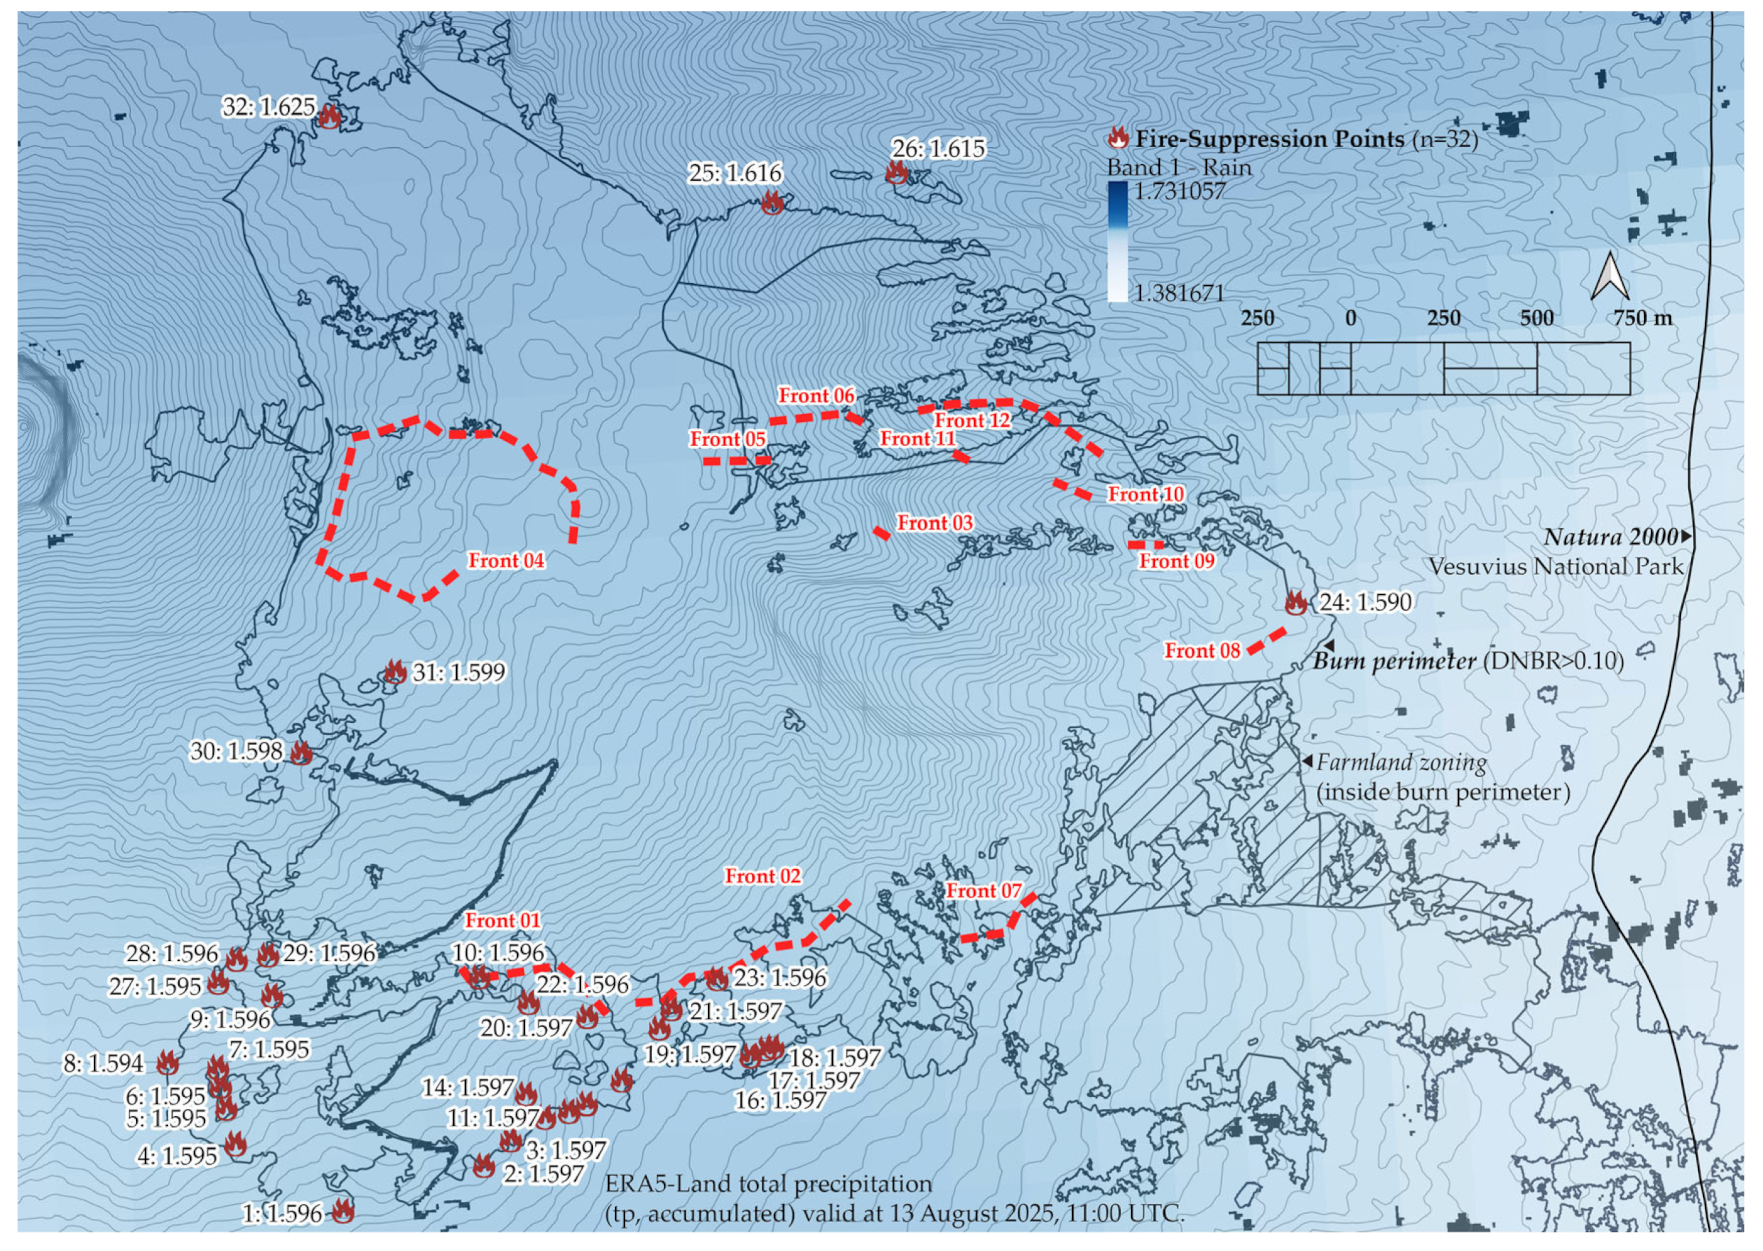
Guided by the paired figure set (Figure 3 and Figure 4), we adopt the official incident terminology used in Regional Civil Protection communiqués—fronti di fuoco (active fire fronts) and reinnesco (rekindling at residual hotspots)—to describe the operational situation in the 10–12 August window, during which three concurrent fronts were reported and a persistent risk of rekindling was noted along and within the burned perimeter. Operational notes also documented the opening of piste tagliafuoco (firebreak strips) to contain spread and secure edges, with the active fireline length described as ~2–3 km and fronts located in the Valle del Gigante toward Monte Somma, on the southern crater sector, and in the Vicinale area (overnight re-ignition). Because these descriptors arise from official public updates, 3-D front-line metrics are used for descriptive context only and are excluded from causal modeling; any future inclusion will require authoritative dynamic vectors with time stamps consistent with risk-sensitive planning practice [11]. Analyses were based on 32 fire-containment points, each georeferenced (WGS84) and characterized initially by five quantitative drivers (RAIN, dNBR, dNDVI, CHD, and WUID), with CHD summarizing terrain/hydrologic controls (e.g., slope and drainage convergence) relevant to access and stability, and WUID capturing asset exposure and operational constraints near settlements and roads. All 32 records passed quality control (with no missing values on the selected variables). Points were stratified into dNBR tertiles (Low/Mid/High) for group-wise comparisons, and each variable was standardized as z = (xμ)/σ, where μ and σ are the mean and standard deviation, respectively. In the figure-based operational context, the dNBR mosaic shows higher severities (≈0.33–0.47) across the central–western uplands (near Front 04) and the southern foothills (near Fronts 01–02/07), intermediate values (≈0.26–0.35) along the eastern perimeter (Fronts 08–10), and lower severities (≈0.09–0.20) on agricultural flats and the northern rim (Fronts 05–06, 12). At the site scale, the ERA5-Land accumulated-precipitation field exhibits local maxima (≈1.615–1.625) on the northern ridge/central uplands (near Fronts 05–06–10–12) and minima (≈1.590–1.596) along the eastern perimeter (Fronts 08–09/24) and southern foothills (Fronts 01–02). In practice, access was prioritized along crestlines and paved segments, with conservative pacing on leeward slopes and road cuts where wet ash and fine-debris concentrate. The combined reading of continuous and class-based dNBR [13,14,15,22] with reanalysis rainfall [43,44,45,46,47], interpreted on hydrologically conditioned terrain [19,20,21], supported FTSP placement, firebreak staging, and calibrated caution levels for each front under risk-sensitive planning [11].
With a narrow focus on moisture context, Figure 4 complements the burn-severity reading by mapping ERA5-Land total precipitation (mm) accumulated over the immediate post-event window (72 h; valid at 13 August 2025, 11:00 UTC) and annotating the values at the 32 fire-suppression points positioned inside the dNBR-derived burn boundary (threshold dNBR > 0.10). Precipitation totals show a gentle north–central maximum (~1.615–1.625) on the ridge/upland belt that includes the sectors near Fronts 05–06–10–12, with comparatively lean totals (~1.590–1.596) along the eastern perimeter (Fronts 08–09/24) and the southern foothills (Fronts 01–02).
Read together with the front layout, these gradients help frame decision space along individual line segments: on the northern arc, slightly wetter benches and tracks may experience softening of ash and localized slumps at cut-banks, warranting slower vehicle movement and periodic drainage clearing, yet the added moisture also tends to damp ember transport along crestline spurs. On the southern and eastern arcs, lower totals suggest drier tread and quicker access on paved segments, while leeward slopes and narrow gullies remain susceptible to fine-debris pooling after brief showers. Within the central–western uplands (around Front 04 and adjacent anchor points), site annotations near ~1.599–1.616 indicate mixed conditions, where mobility is generally acceptable on divides but should remain conservative across benched, unpaved traverses.
Consistent with the approach adopted in this study, the rainfall layer is applied as a feasibility and safety constraint for routing, staging, and edge-securing—guiding the sequencing of piste tagliafuoco and patrol loops along crestlines—rather than as an explanatory driver of the already-realized reflectance-based severity.
In this sense, the visualized data given in Figure 4 functions as an operational overlay to the dNBR mosaic, providing per-point traceability for each front-line segment and supporting targeted surveillance of residual hotspots where access, slope aspect, and micro-drainage patterns interact with the observed moisture field.

2.3.2. Transect-Based dNDVI Diagnostics and FTSP Operationalization (Sampling, QA, and Cross-Validation)

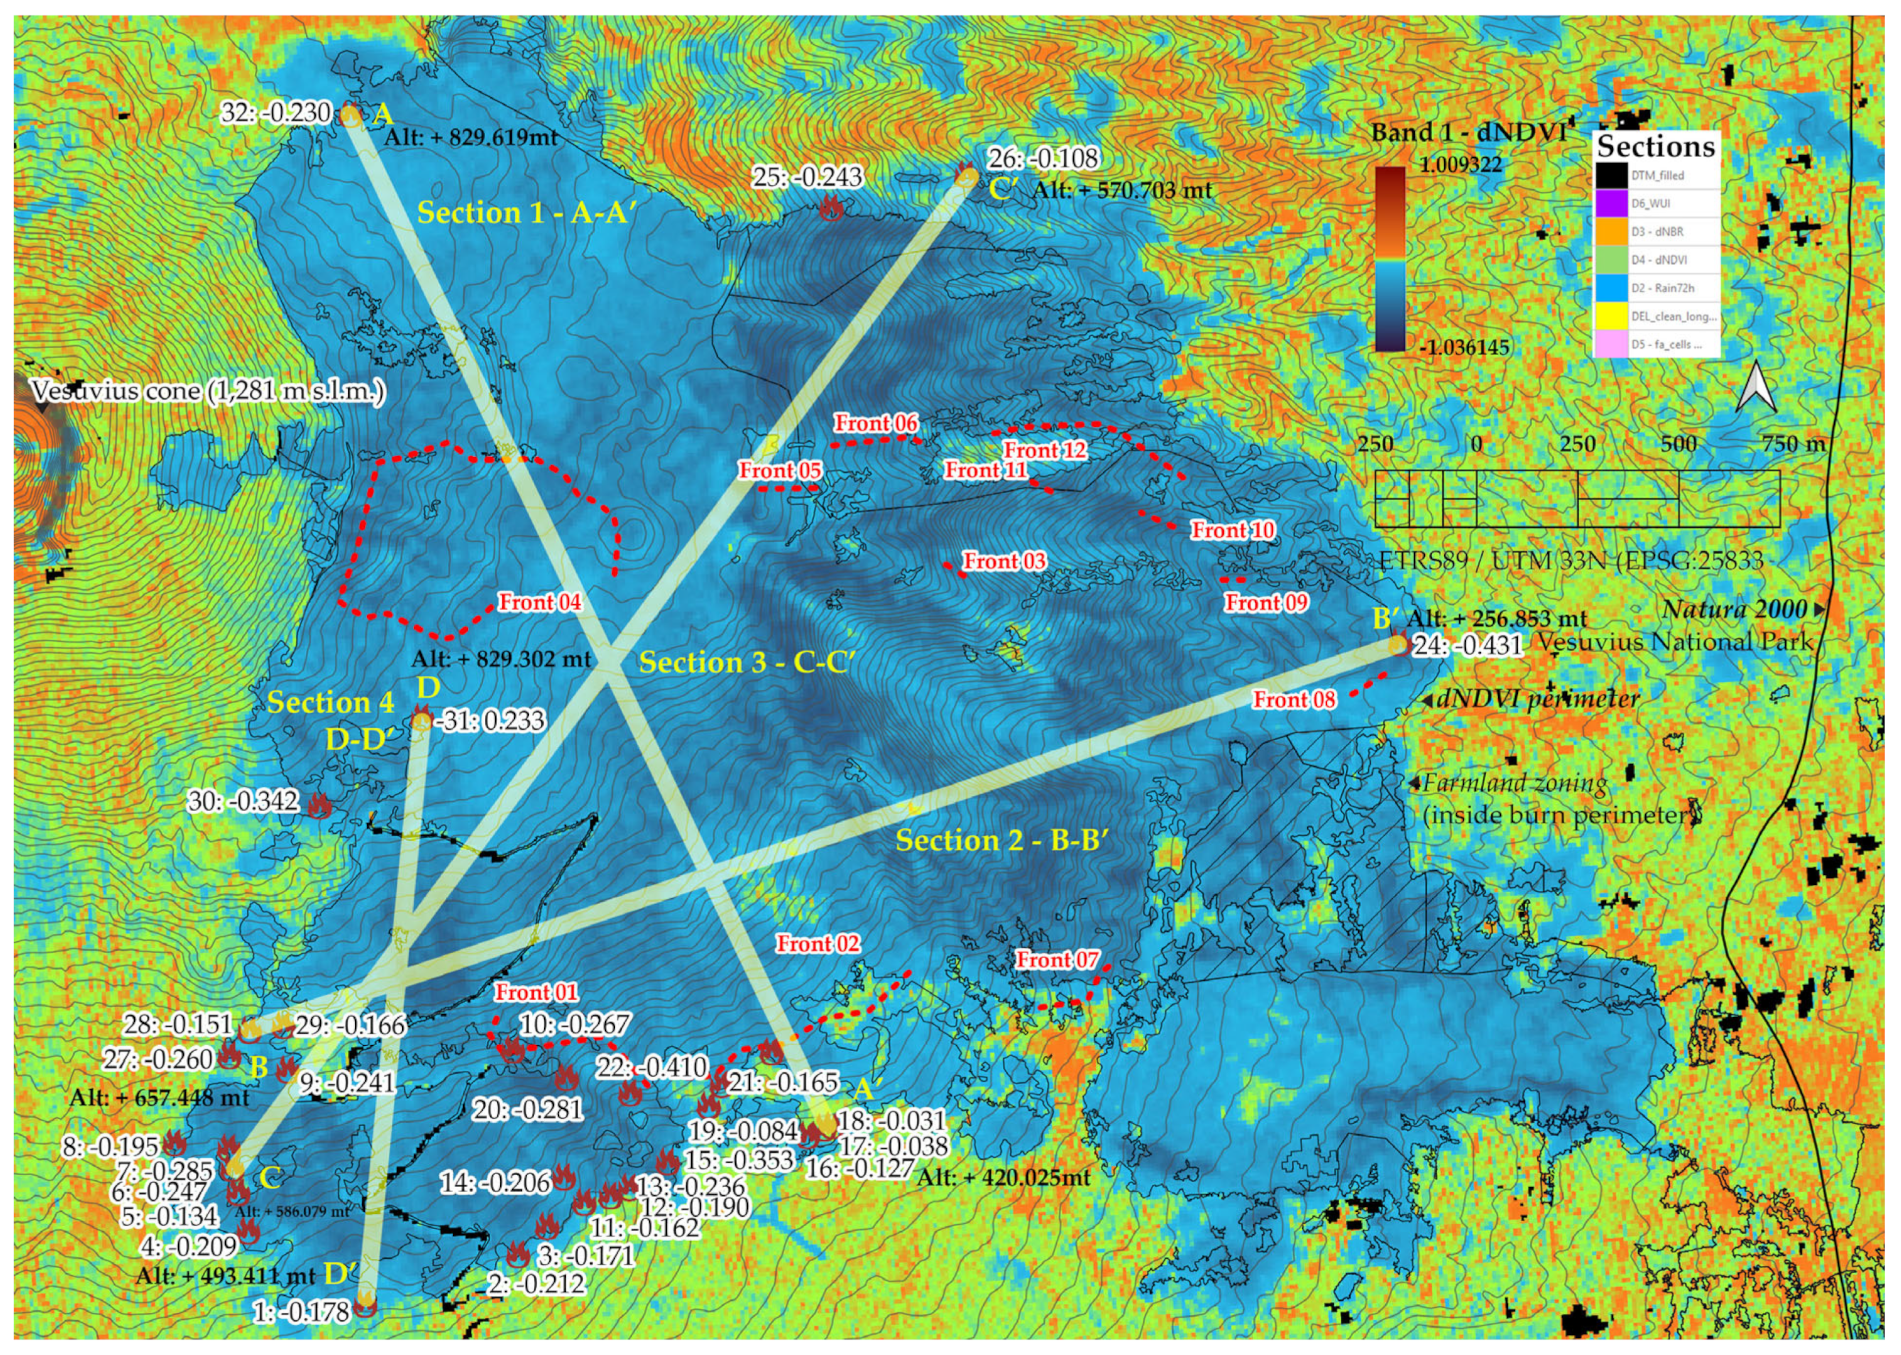
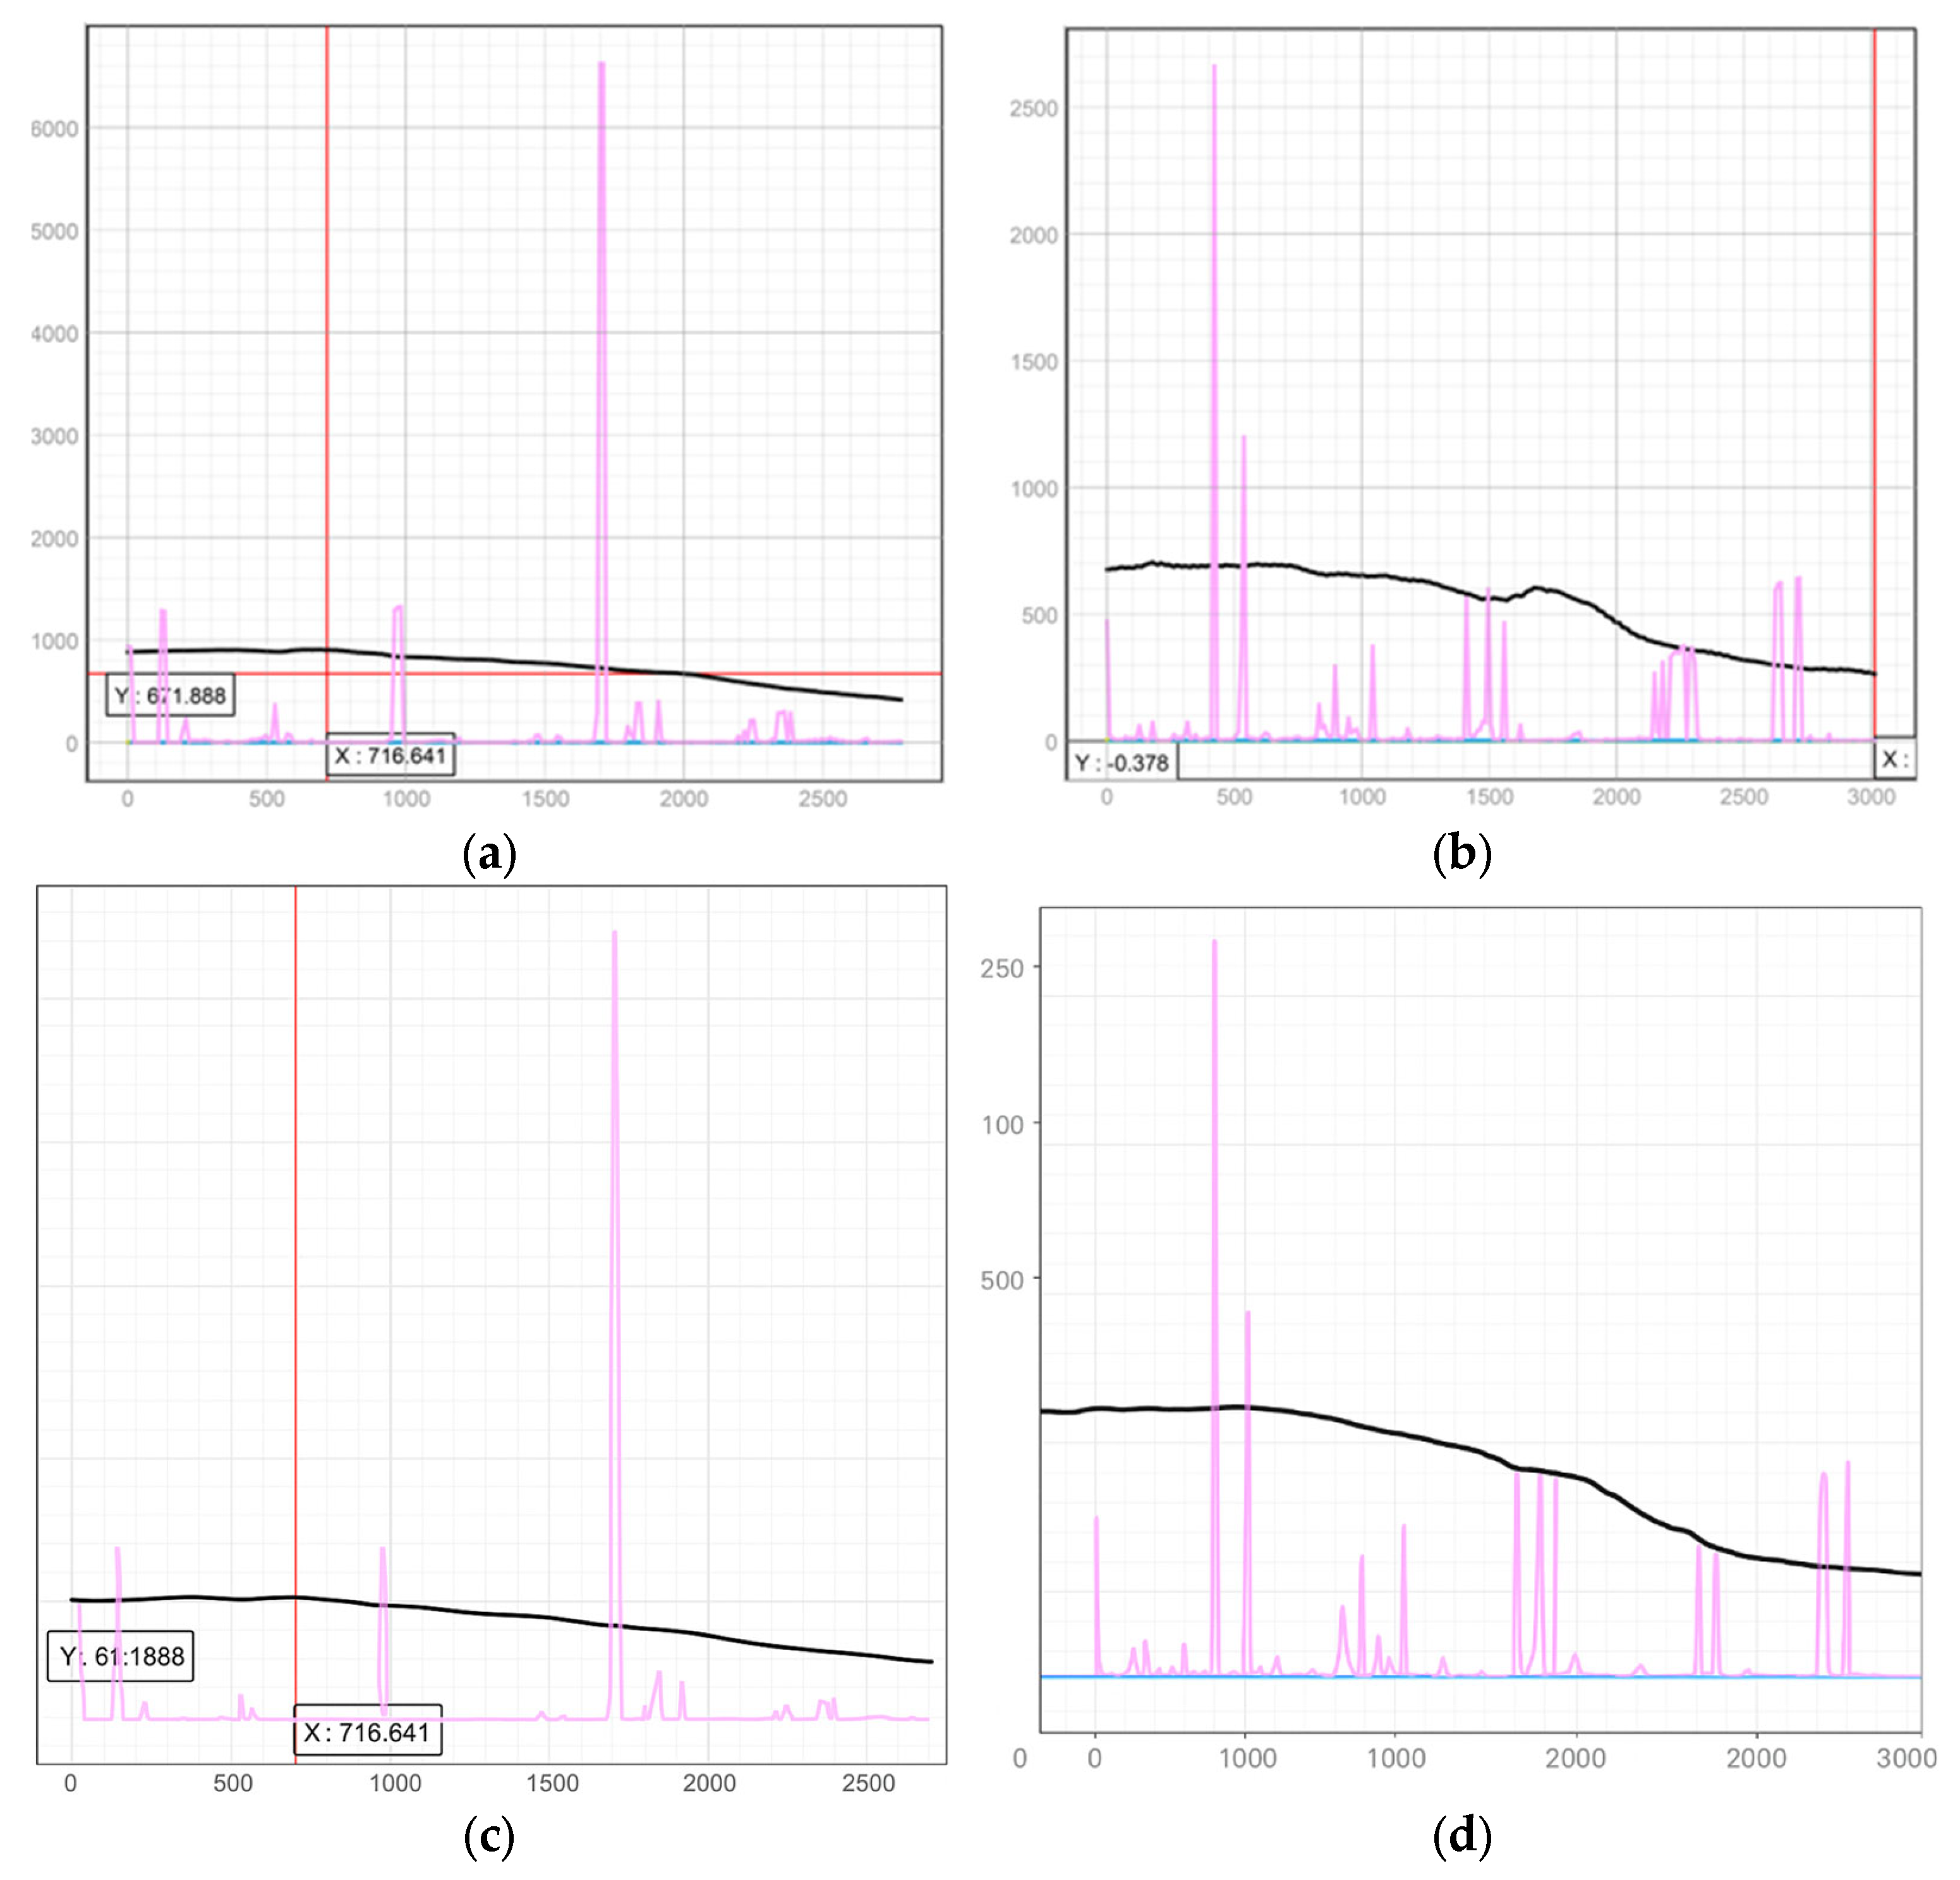
As restricted here, we present Figure 5, which synthesizes dNDVI (dNDVI = NDVIpost − NDVIpre) from Sentinel-2C MSI L2A over Vesuvius National Park (ETRS89/UTM 33N, tile T33TVF, orbit R079, and baseline N0511) and depicts four transect diagnostics: Section 1 A–A′ (Figure 5 A), Section 2 B–B′ (Figure 5 B), Section 3 C–C′ (Figure 5 C), and Section 4 D–D′ (Figure 5 D). Along each section, the corresponding profiles in Figure 6a–d show pink bars for the frequency of dNDVI, the black curve shows the smoothed longitudinal trend, and vertical guides show the zero−change reference and operational cut−offs. Given these diagnostics, we operationalize the signals by promoting FTSPs/corridors intersecting near-zero dNDVI neighborhoods and meeting S3D ≤ 11.6 and L3D/L2D ≤ 3.16 (≈+216% vs. planar), conditioning/reinforcing segments where 11.6 < S3D ≤ 38.1 or L3D/L2D > 3.16, and de-prioritizing/mitigating segments that cross clusters in the negative dNDVI tail (canopy loss) or where S3D > 38.1 (local extremes ≈ 65.1). In support of this interpretation, this risk-sensitive integration aligns with international guidance [11] and depends on hydrology-first DEM pre-processing—depression removal and drainage-consistent flow routing—before slope/aspect derivation to avoid artifacts that would bias the transect trends [19,20,21]. The interpretation of dNDVI follows the established vegetation-index literature [13,22].
On this basis, and as illustrated in Figure 5 A–D, the spatial convergence of near-zero dNDVI with gentle, short 3-D slopes (low S3D) and limited path elongation (low L3D/L2D) along ridge benches consistently delineates anchorable, low-erosion corridors likely to remain trafficable under light precipitation, whereas reaches where strongly negative dNDVI co-occurs with high S3D and/or high L3D/L2D expose contiguous canopy loss and roughness that sustain residual-fuel continuity and upslope wind channeling, thereby flagging segments for persistent hotspot surveillance and early stabilization.

2.3.3. Operational 3-D Fire-Front Descriptors for FTSP Readiness (Sampling, QA, and Cross-Validation)

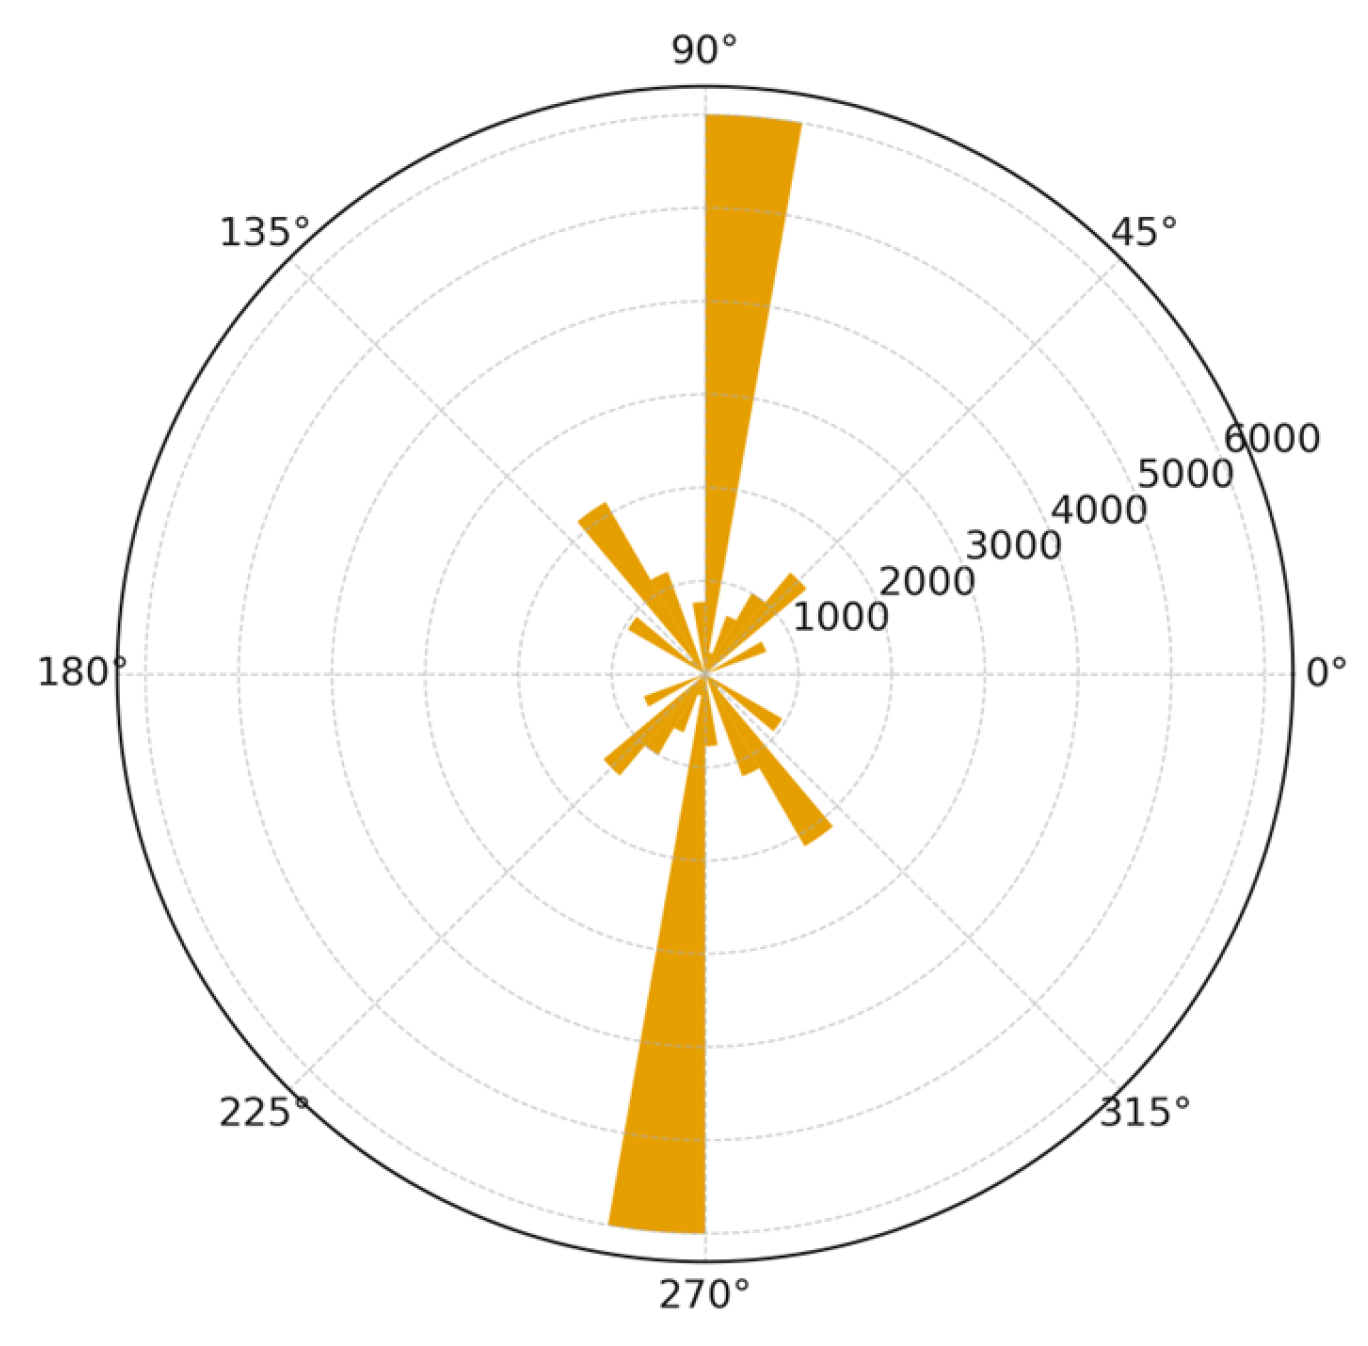
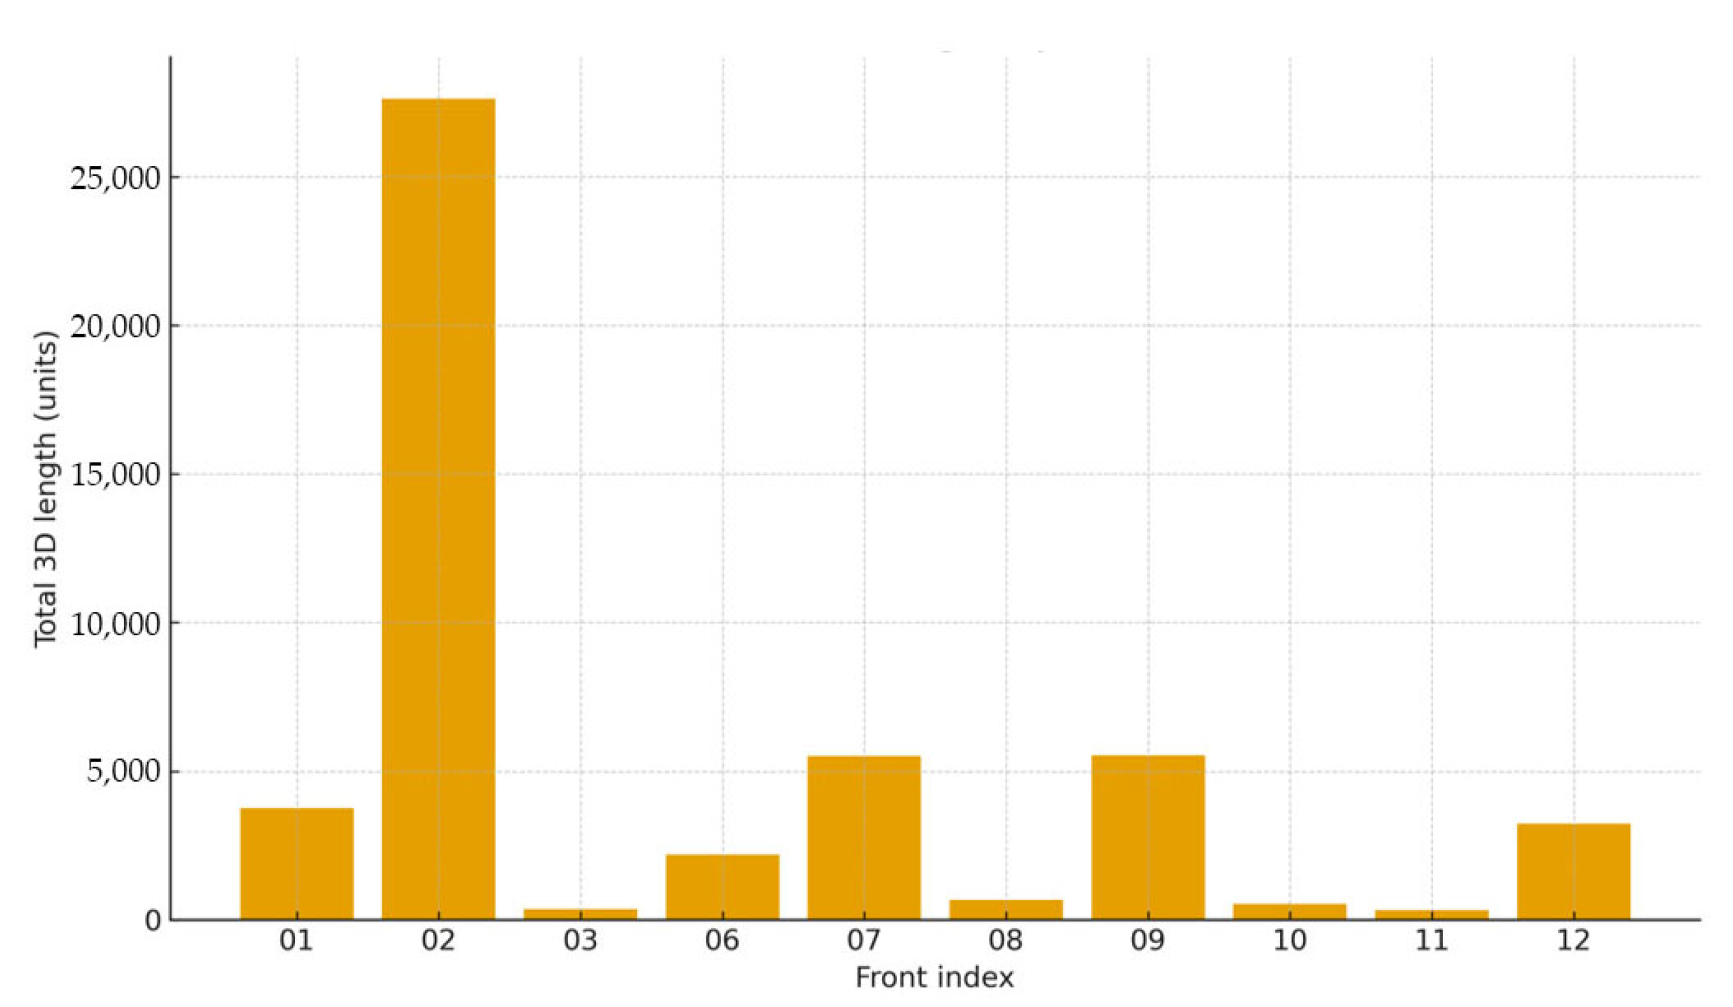
Limiting consideration to fire descriptors—aiming to avoid unnecessary track opening and long hauls—‘low-carbon’ is operationalized via terrain-aware proxies. In this regard, we report three-dimensional line length (L3D) (cf. Figure 7) and three-dimensional sinuosity (S3D) (cf. Figure 8) for each mapped front to quantify vertical cost and tortuosity—two determinants of haul time, hose lay, and safety margins during suppression. Lengths and co-location with existing access are computed along DEM-projected polylines and compared with planar values to expose hidden relief penalties, while tortuosity highlights fronts with complex geometries that may require additional anchor points and staging. These diagnostics inform terrain-aware criteria for prioritizing Fireline Tactical Support Points (FTSPs) and corridors, consistent with risk-sensitive planning guidance [11] and with topography-aware workflows that first ensure DEM hydrological correctness before deriving slope/aspect [19,20,21].

2.3.4. Multi-Criteria Predictors, Sampling Design, and Spatial CV

We assembled a multi-criteria framework comprising C1—spectral severity/change from pre/post imagery (NBR, dNBR, dNDVI; RdNBR where applicable), C2—terrain and access impedance (CHD) from DEM derivatives, C3—WUI/built-up exposure, C4—hydrological proximity, C5—cultural-landscape constraints and protected viewsheds (SITAP), and C6—Natura 2000 habitat sensitivity; three-dimensional fire-front descriptors (L3D, S3D) summarize edge geometry for situational awareness, and Rain72h is treated as an operational feasibility criterion exogenous to severity. All variables were computed on a 20 m ETRS89/UTM 33N grid. Spectral-change metrics included NBR, dNBR, and dNDVI (NDVIpost − NDVIpre). Where categorical targets were required for internal steps [39,48], dNBR was temporarily recoded to USGS severity classes (Enhanced Regrowth, Unburned/Low, Low, Moderate–Low, Moderate–High, High) strictly as an ordinal variable, while continuous dNBR/RdNBR and dNDVI remained the primary severity descriptors [10,13,22,49]. Terrain/access effects were summarized in the composite CHD term, and distance to the hydrological network (DISTSTREAM) was included provisionally, pending authoritative updates. To select field/screening points without clustering, we computed per-pixel sampling weights by ranking burn severity, slope, and distance to the WUI to empirical quantiles (weights summing to one, prioritizing severity), then drew candidates via stratified random sampling with a hard-core/Poisson-disk constraint; spatial balance was checked against GRTS/BAS baselines and by inspecting local coverage and area-variance diagnostics. Reproducibility was ensured by fixing RNG seeds, exporting all run parameters (weights, spacing, sensing dates, and CRS) and software versions, and logging SHA-256 checksums for every input/output in a human-readable manifest. Given operational constraints on deployments, severity was appraised using robust spectral-change proxies (dNBR and dNDVI) that mitigate pre-fire vegetation effects, reserving plot-level calibration for subsequent phases; these continuous measures show cross-fire portability and correlate with field severity [10,13,22,49]. To emulate geographic transfer, we adopted end-to-end spatial block cross-validation—partitioning the study area into k tiles and evaluating predictions on held-out tiles—which is recommended for spatially structured data and yields more honest out-of-area error than random CV [39,41]. In parallel, we applied consistency checks and bias-mitigation steps—triangulating independent local sources, externally validating against ground observations and historical records, and using structured expert judgment to annotate potential biases prior to decision derivation—with uncertainty notes tracking error propagation from inputs through suitability classes and network metrics. As an operational benchmark, an external SDSS AHP + DEMATEL study reports 28% well-suited, 44% moderately appropriate, and 3% unsuitable (Alayan & Lakner, Forests 2024 [5]), making residual variability explicit for stakeholders.

2.4. Exploratory Multivariate Analysis (PCA)

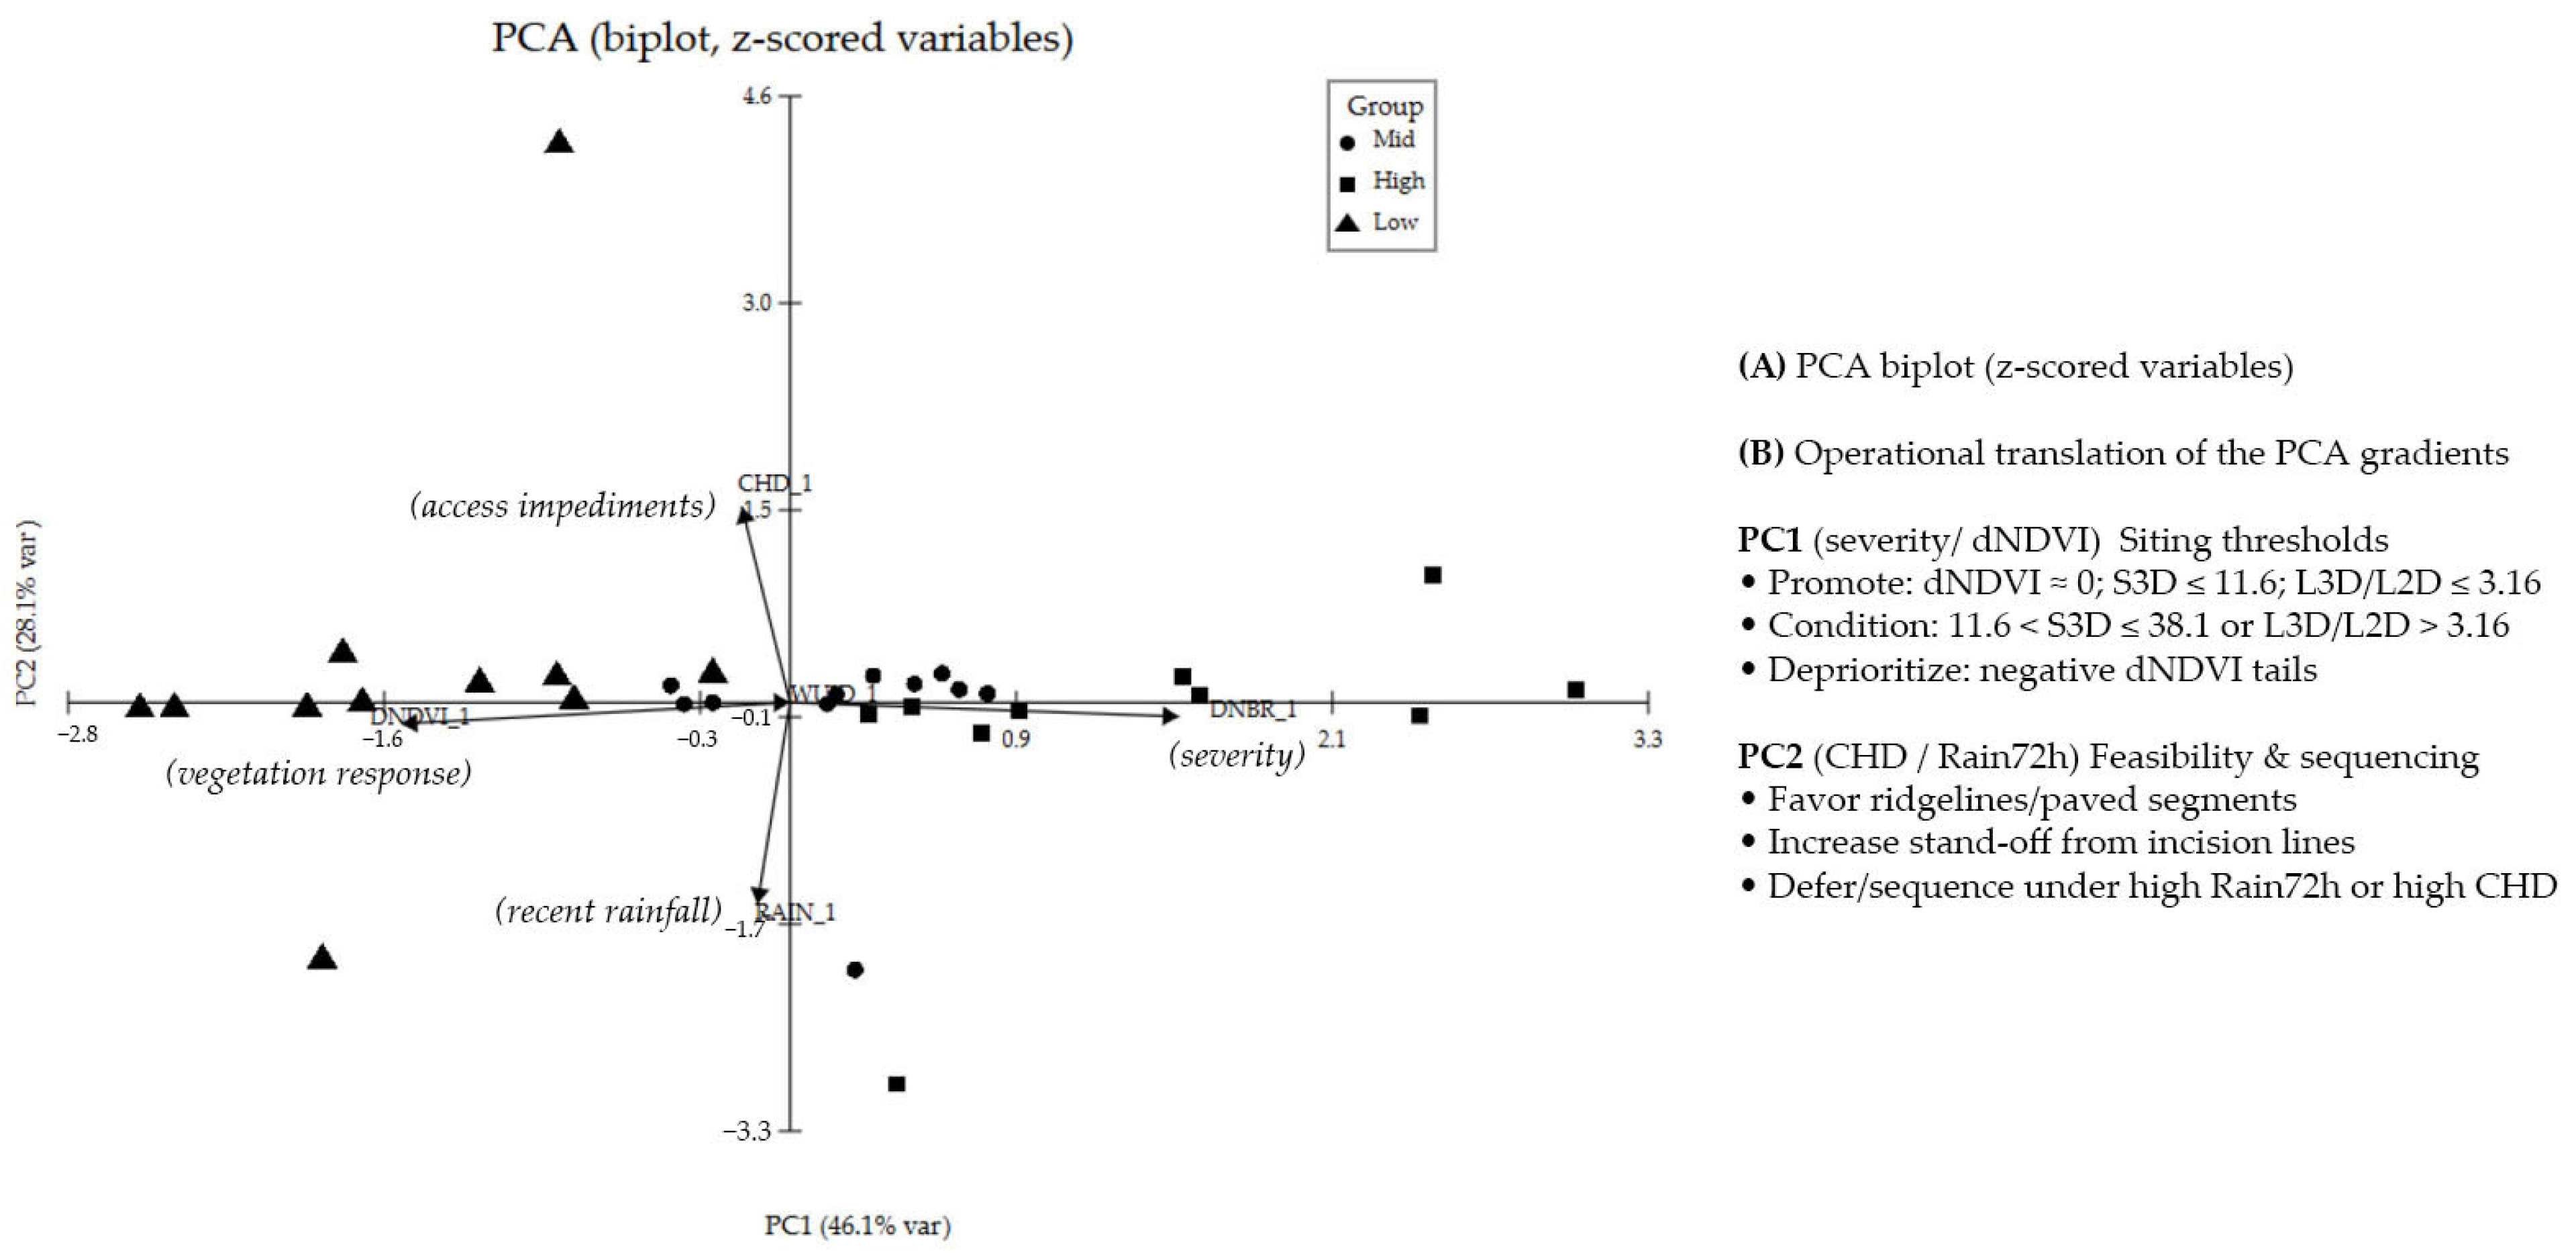
Within these confines, we applied PCA to the z-scored driver set (RAIN, dNBR, dNDVI, CHD, and WUI/DISTSTREAM as available) to (i) reduce dimensionality, (ii) diagnose collinearity, and (iii) reveal dominant orthogonal gradients for operations (e.g., severity–vegetation vs. damage/access–rainfall). PCA was used solely as an exploratory step to inform scenario filters and interpretability; inferential claims were reserved for DEMATEL and sensitivity analysis.

Exploratory Multivariate Analysis (PCA)

For a strictly statistical orientation, we applied PCA to z-scored drivers (RAIN, dNBR, dNDVI, CHD, and WUID) and projected samples on the PC1–PC2 biplot [50]. The first two components explained 74.15% of the standardized variance (PC1 = 46.07%, PC2 = 28.08%), exposing two near-orthogonal gradients of operational relevance. PC1 contrasted burn severity (dNBR loading + 0.703) with vegetation response (dNDVI loading − 0.703), ordering sites along a severity–vegetation continuum; PC2 aligned CHD (damage/access impediments from field notes and visual checks) against RAIN, i.e., a damage/access–rainfall axis. WUID plotted near the origin on PC1–PC2, suggesting, in Figure 9, a minor contribution at this scale or expression on higher components. This ordination (i) reduces dimensionality and diagnoses collinearity, (ii) identifies the dominant environmental gradients that discriminate candidate containment points, and (iii) provides an interpretable space to compare dNBR tertiles and prioritize predictors for downstream analyses, including NMDS and ANOSIM sensitivity tests [48,51].

2.5. Causal Influence Modeling with DEMATEL

Within a narrow scope, we built a 0–4 crisp direct-influence matrix among six drivers (RAIN, dNBR, dNDVI, CHD, WUID, and DISTSTREAM). To anchor judgments in data, we prefilled A by mapping absolute Spearman correlations |ρ(i → j)| to {0,1,2,3,4} bins; when dNBR acted as an “effect,” its USGS ordinal code was used to respect DEMATEL’s ordinal logic. The signs of ρ were recorded qualitatively (amplifying/mitigating), whereas magnitudes governed A.
Normalization and total relation. A was normalized (scalar max-row-sum) to N, and the total-relation matrix was computed as T = N (IN)−1. From T we derived, for each factor, the row sums r (dispatching power), column sums c (receiving power), centrality D = r + c (prominence), and causality P = rc (net cause/effect).
Scenarios and consensus. We solved E1–E7 scenario matrices (e.g., severity strata; access strata; and near/far streams) and an E8 bootstrap consensus (B = 1000) by resampling rows with replacement and averaging A. Graph thresholding was checked at mean (T) and Q75 (T) to verify pattern stability.

2.5.1. Baseline Scenario (E1: Remote-Sensing Spine)

At a finer granularity, two proxy limitations qualify operational readiness: WUID was constant in the proof-of-concept dataset and is retained only as a negative control, while hydrographic proximity (DISTSTREAM) is represented by a temporary proxy; any interactions involving these variables are therefore flagged as provisional pending authoritative layers. In the E1 baseline, a remote-sensing spine (dNBR ↔ dNDVI = 4) dominates, with CHD acting mainly as a downstream modulator. At the hydrologic extreme (E7, far from streams), reciprocity between DISTSTREAM and {dNBR, dNDVI, CHD} strengthens without overturning the vegetation–severity core. This supports the use of the FTSP ranking to prioritize co-location of access and water while treating hydro-poor sectors with caution.

2.5.2. Uncertainty, Sensitivity, and Operational Readiness (DEMATEL)

On this case-by-case basis, we quantified uncertainty using nonparametric bootstrap confidence intervals (BCa, B = 1000–2000) for scalar summaries and a block bootstrap (100–200 m) for spatial rasters/aggregates to respect autocorrelation, tracking propagation from direct-influence entries A (aij) to node metrics r, c, D = r + c, and P = rc; sensitivity analyses varied in (i) Spearman-to-bin cut-points for pre-filling A, (ii) graph thresholds for edge retention, and (iii) inclusion/exclusion of provisional drivers (constant WUI; proxy DISTSTREAM), with methodological caveats flagged where relevant.
Consistency checks and bias-mitigation-triangulated independent local sources, cross-checked against ground observations, historical records, and comparable case studies, and used structured expert judgment to annotate potential biases before decision derivation, while uncertainty notes tracked error propagation from inputs through suitability classes and network metrics. Taken together, clouds and shadows were screened using the Sentinel-2 scene-classification layer and standard product quality flags [14,18,32]. Ancillary layers included a hydrologically corrected DEM (for slope/derivatives), Natura 2000 habitat/constraints (Standard Data Forms), and SITAP cultural-landscape constraints for planning overlays [31,32].
As an overview, the workflow proceeds from the inputs (Sentinel-2 L2A reflectance, a hydrologically corrected DEM, and WUI/Habitat layers) and pre/post pairing on a common 20 m grid, through factor derivation (continuous dNBR, dNDVI; CHD; WUID; and hydrographic proximity) and 3-D fire-front descriptors (L3D and S3D), and culminates in a DEMATEL causal network that makes systemic drivers and interdependencies explicit. This is also confirmed in Figure 1 in Forests (2024) [5] for the hierarchical structure of both AHP and DEMATEL, and Figure 3 detailing the SDSS process—with an FTSP decision module that translates the evidence into prioritized, field-ready siting. Rain72h is treated exogenously as an operational feasibility constraint, and reproducibility is ensured via pinned configurations, fixed seeds, and comprehensive logs.
As a caveat to operational readiness, two proxy limitations apply: WUID was constant in the proof-of-concept dataset and is retained only as a negative control, while hydrographic proximity (DISTSTREAM) is represented by a temporary proxy; interactions involving these variables are therefore flagged as provisional, pending authoritative layers. In the E1 baseline, a remote-sensing spine (dNBR ↔ dNDVI = 4) dominates, with CHD acting mainly as a downstream modulator, whereas at the hydrologic extreme (E7, far from streams), reciprocity between DISTSTREAM and {dNBR, dNDVI, CHD} strengthens without overturning the vegetation–severity core, which supports the use of the FTSP ranking to prioritizes the co-location of access and water while treating hydro-poor sectors with caution. In post-fire emergency management, with regard to exposure and access, in compliance with relevant standards, and with observation of local hydrometeorological conditions, Rain72h was resampled to 50 m to preserve the effective scale of the native precipitation product and avoid artificial precision, whereas spectral and terrain layers are retained at 20 m. Where higher-resolution rainfall datasets exist, the pipeline ingests them at 20 m using identical processing steps.

Construction of a Reproducible Direct-Influence Matrix (DEMATEL)

The DEMATEL computations in this study rely on the open-source pyDEMATEL package (version 0.2.2) by Abderrahman Chekry, Jamal Bakkas, Mohamed Hanine, Elizabeth Caro Montero, Mirtha Silvana Garat de Marin, and Imran Ashraf (SoftwareX, 2024); the source code is publicly available on GitHub and distributed under a BSD license. The package is also released on PyPI (the latest noted version is 0.2.2).
Protocol deviation note for the limited context considered: because no cloud-free Sentinel-2 acquisitions were available within (T + 10:T + 30), we used (T + 5) (14 August 2025) as the first usable post-fire scene. SCL masking, co-registration checks, and sensitivity tests were applied to mitigate early-post-fire artifacts (aerosols and shadows), and dNBR/dNDVI spatial patterns were verified as stable under reasonable mask dilations.
For the subset at hand, third-party layers (Sentinel-2, hydrologically corrected DTM, rainfall, and habitat/footprint) are cited and redistributed under their original terms; our code and configurations are provided under an open license.

3. Results

All core layers achieved coverage over Vesuvius National Park on a common 20 m grid, with only minor exclusions at scene edges and steep flanks after cloud/shadow screening. Harmonization yielded sub-pixel co-registration across terrain, spectral, rainfall, and exposure inputs, enabling pixel-exact sampling and stable cross-layer comparisons [12,14,18,32]. Post-QC, stratified samples remained balanced across scenario strata (E1–E7) and across heritage-sensitive zones, hydrologic corridors, and vegetation–severity gradients, limiting dominance by any single physiographic context. QC logs, hashes, and fixed seeds are archived for full reproducibility [52,53].

3.1. Descriptive Patterns of Drivers

Within our dynamic range, driver summaries exhibit clear spatial structure. Slope follows expected altitudinal gradients; Rain72h varies coherently with orographic exposure; and dNBR classes delineate compact severity cores with transitional skirts [13,14,15,19,20,21,22,43,44,45,46,47]. Pairwise nonparametric associations highlight a positive relation between slope-controlled metrics and severity and a weaker, context-dependent link between short-window rainfall and severity, consistent with post-event moisture pulses acting on already-burned surfaces [13,14,15,22]. These contrasts motivated scenario-wise causal analysis rather than pooled correlations [39,54].

3.2. Operational Proxies for Low-Carbon Siting

By embedding DEMATEL within a multi-approach design, we position the workflow in the emerging hybrid stream [55] rather than as an outlier; accordingly, each decision point integrates Rain72h, terrain, and spectral fuel terms to support pointwise causal analysis [24,56,57]. The baseline network consistently shows a vegetation → severity pathway (dNDVI → dNBR) with modest short-window rainfall effects; interactions weaken at low severity, strengthen near hubs (CHD, WUID), and shift to hydrologic control near streams, reverting to terrain–vegetation dominance elsewhere [13,14,15,22,43,44,45,46,47,54]. Stable across scenarios, this pattern yields the following rules: prioritize FTSPs co-locating access and water outside hard constraints; de-prioritize hydro-poor, and access-poor sectors unless reinforced [11].

3.3. Decision-Making Trial and Evaluation Laboratory

Consistent with recent MDPI applications, we highlight how DEMATEL is used to statistically extract the interrelationship and correlation between the problem’s criteria [5,58], and, utilizing a causal graph, to illustrate contextual links in a site-agnostic workflow capable of adapting across Mediterranean/WUI contexts and identify which components are more significant.
We modeled the inter-factor influence structure with the Decision-Making Trial and Evaluation Laboratory (DEMATEL) framework. DEMATEL yields prominence. Let A = [aij] be the direct-influence matrix (six drivers; diagonal fixed to 0). We normalized A by the scalar, as given in Equation (1): Max-sum scaling of s and N.
s = max { max i j a ij , max j j a ij } , N = A / s ,  
and computed the total-relation matrix, T = N ( I − N ) − 1.
From T, we derived the standard DEMATEL indices: row-sums r i =   j T i j (dispatching power), column sums c i =   j T j i (receiving power), centrality D i =   r i +   c i , and causality P i =   r i   c i (positive P i ⇒ net “cause,” negative ⇒ net “effect”).

3.3.1. Data Pre-Processing: Burn Severity and Vegetation Response

Restricting to the case, we recoded dNBR to ordinal USGS burn-severity classes (Enhanced Regrowth < 0; Unburned/Low 0–0.10; Low 0.10–0.27; Moderate–Low 0.27–0.44; Moderate–High 0.44–0.66; and High > 0.66). dNBR class thresholds are ecosystem-dependent; in Mediterranean forests they should be field-calibrated or replaced by RdNBR to improve cross-fuel comparability. Where calibration is unavailable, we prioritize continuous dNBR/RdNBR [13,14,22] maps and mark categorical products as provisional. The ordinal code (0 … 5) was used whenever dNBR served as a “target” in pairwise associations. However, dNBR class thresholds are ecosystem-dependent. Where field calibration is unavailable, we report dNBR as a continuous metric and qualify categorical maps as provisional [13,14,22,49,59]. Class breakpoints are consistent with USGS/FIREMON practice and widely adopted [60]. dNBR (and its relation to dNDVI) is in fact a standard choice for severity mapping in the remote-sensing literature. Accordingly, USGS-class recoding was used solely as an internal ordinal target for DEMATEL (Section 3.3.5) and not to define operational thresholds.

3.3.2. Direct-Relation Matrices (E1 … E7): Data-Driven Weighting on a 0–4 Scale

For each scenario S (E1–E7) and each ordered pair ij with iji, we computed the Spearman rank correlation [61] on the sample for that scenario, as specified by Equation (2): Spearman for factor pair.
p i j ( S ) = c o r r   r a n k   X i ,   r a n k   Y j ,
using the dNBR ordinal codes when j = dNBR. If either vector was constant or ill-posed, we set p i j ( S ) = 0 . We then mapped ∣ρ∣ to crisp DEMATEL weights as formulated in Equation (3), as a reference implementation, to DEMATEL’s direct relation, reported together in Forests (2024). Definition of weighting.
a i j S = 0 , ρ   < 0.10 1 , 0.10   ρ   < 0.30 2 , 0.30   ρ   < 0.50 3 , 0.50   ρ   < 0.70 4 , ρ   0.70   a i i S = 0 .
The structure preserves intensity on the 0–4 DEMATEL scale; the sign of ρ was noted qualitatively (amplifying vs. mitigating) rather than embedded in a i j .

3.3.3. Consensus Estimation by Bootstrap (E8)

To summarize across sampling uncertainty, we performed bootstrap resampling (B = 1000) [62].
For each bootstrap replicate b, we resampled rows with replacement, cf. Equation (4), recomputed the 0–4 direct matrix A ( b ) by the same Spearman-to-crisp mapping, and then aggregated. Bootstrap aggregation.
* A ¯ = 1 B   b = 1 B A   ( b ) , σ i j = 1 B 1   b a i j ( b ) a i j ¯ 2 .
* A ¯ serves as the consensus direct matrix (E8 mean) and σ i j quantifies edge-level uncertainty, confirming Efron’s classical formulation.

Directionality and Threshold Sensitivity

For the subset at hand, we emphasize that Spearman’s ρ captures monotone association, not direction nor causation. Direction in DEMATEL arises from the A matrix and expert priors; hence we refrain from causal claims beyond DEMATEL conventions and report extensive sensitivity to (i) the 0–4 bin cut-points and (ii) graph-construction thresholds, mean (T) vs. Q75 (T). We also report signed interpretations separately from magnitudes. These practices follow recommendations in DEMATEL reviews and MDPI applications that use mean (T) while urging threshold checks [25,63,64].

3.3.4. Causal Graph Derivation and Thresholding

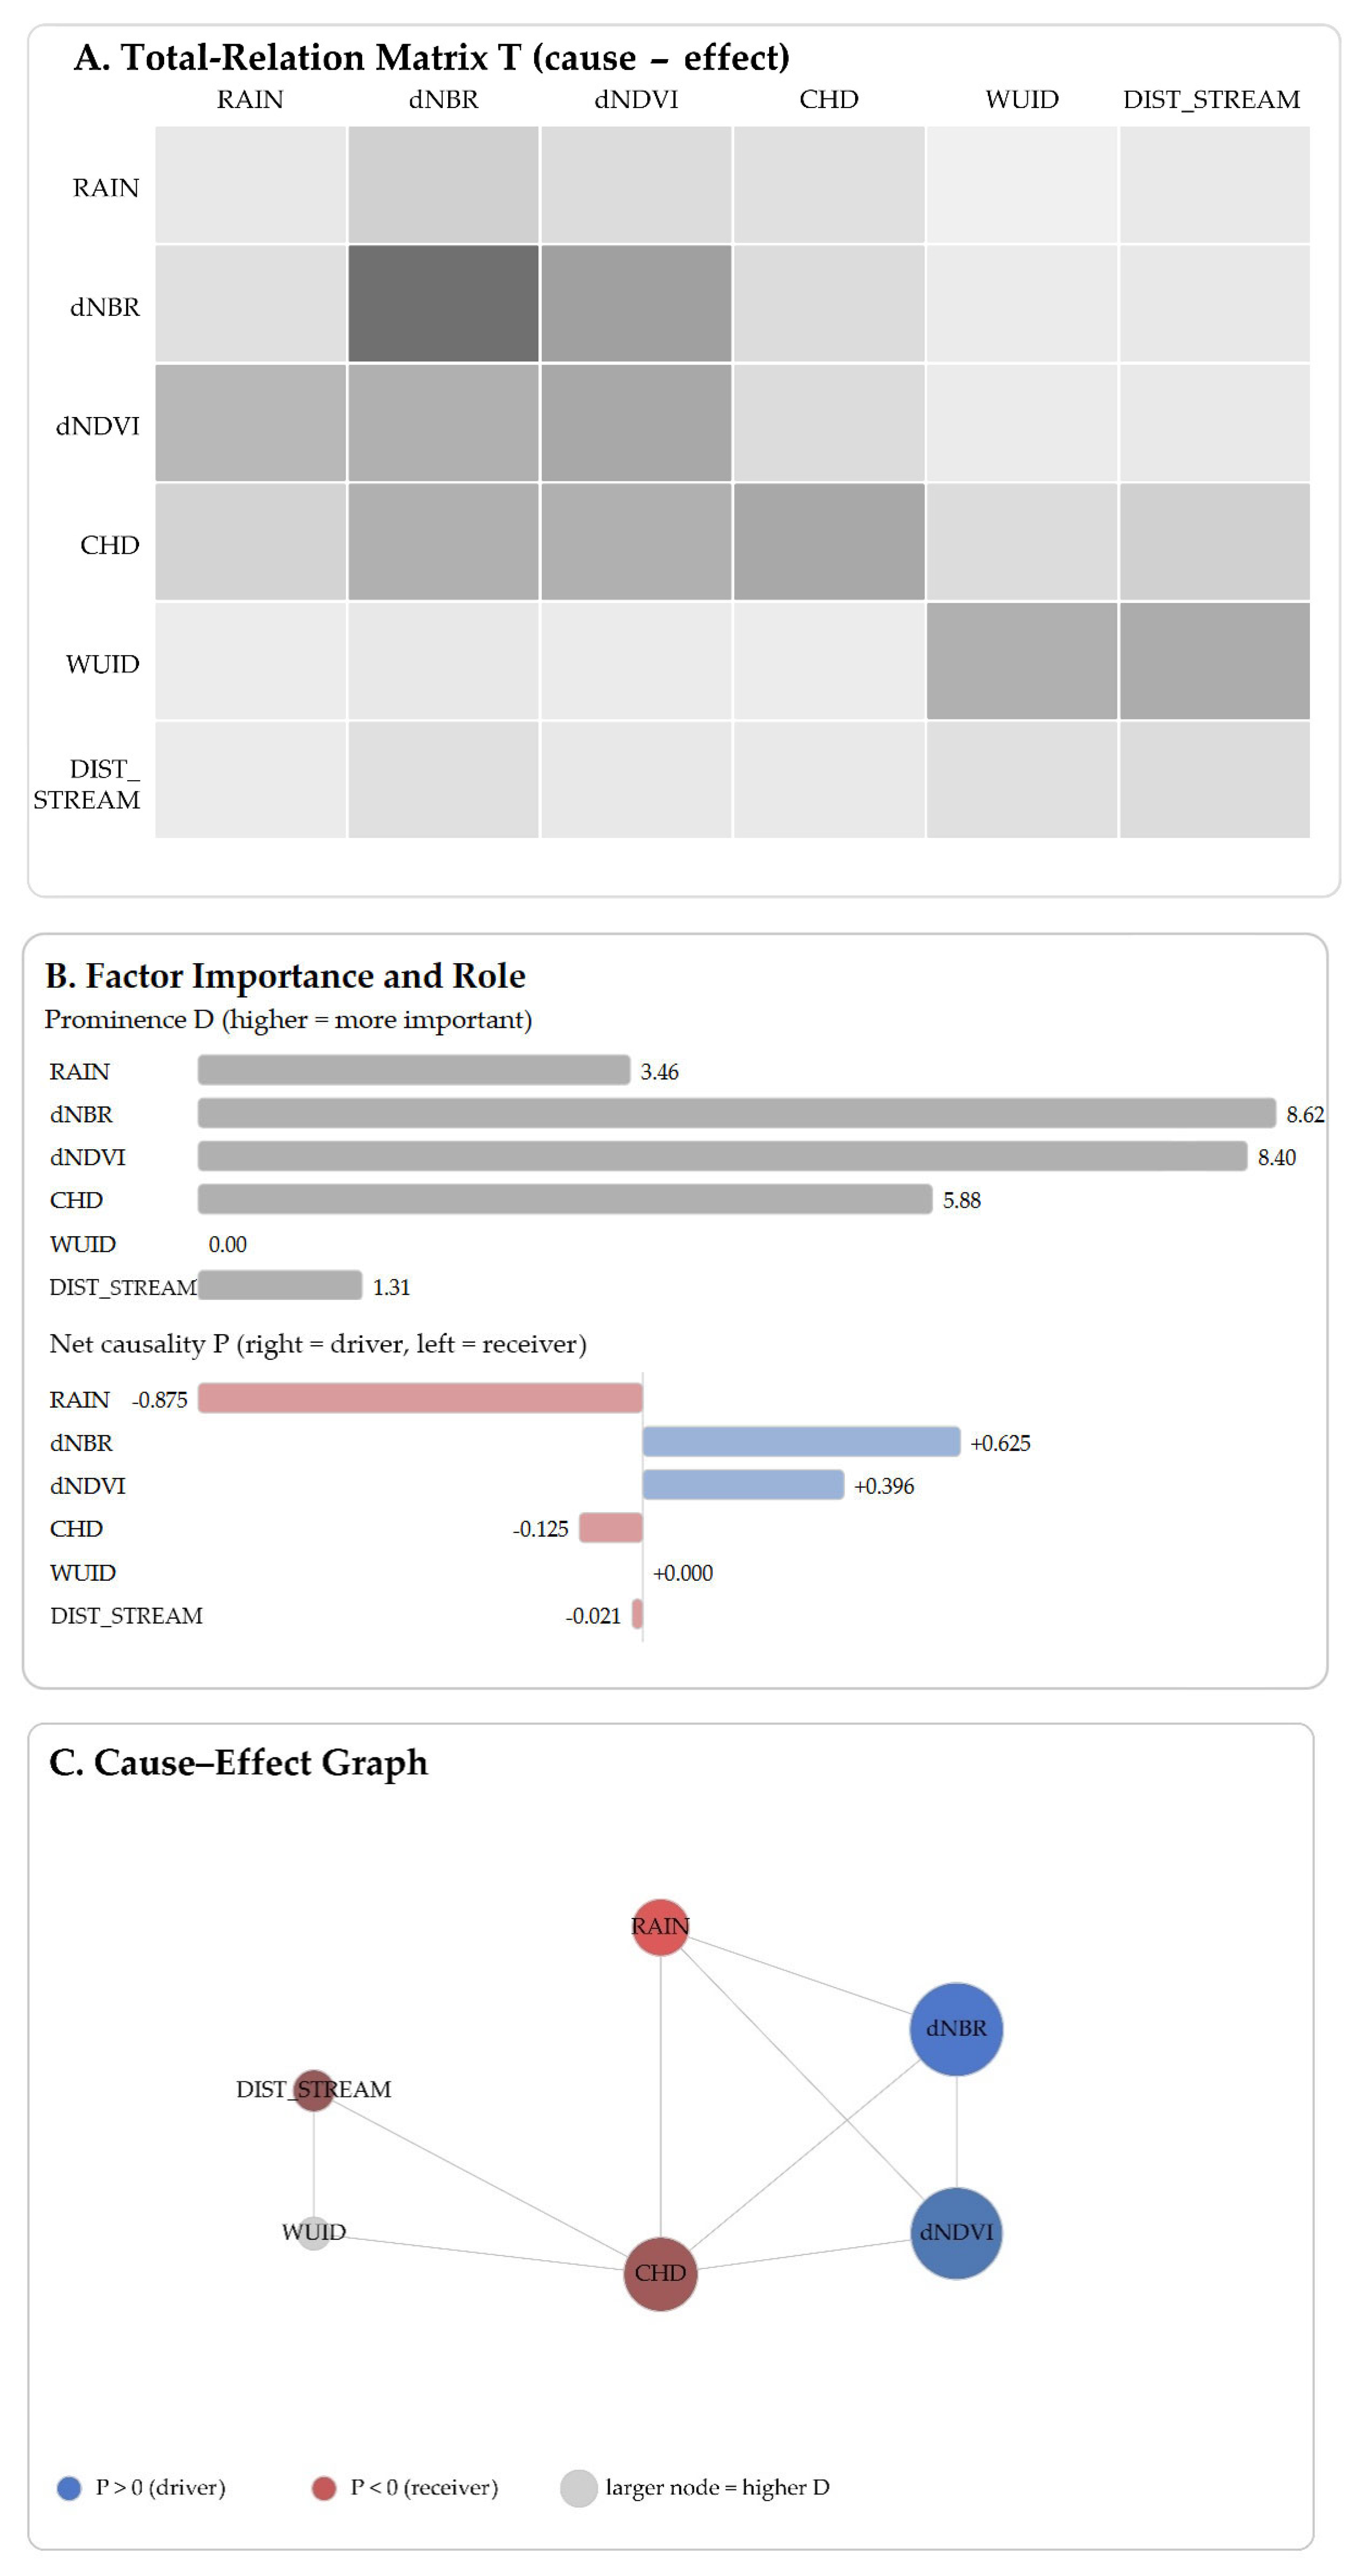
Following DEMATEL practice, we illustrate why these are the most prominent factors in E1 by pre-filling the direct-relation matrix by mapping ρ to the conventional 0–4 judgment scale (expert-checked to align quantitative evidence with domain knowledge), normalizing to (N), and computing the total-relation matrix (Figure 10A). The present combination thresholds form a readable backbone for this proof-of-concept, capturing the dominant pathways and supporting consistent comparison across scenarios (Figure 10B,C).

3.3.5. Data-Informed DEMATEL (Pre-Filling of 0–4 Weights)

To align severity with DEMATEL’s ordinal judgment scale, we treated USGS dNBR classes as an ordinal target (0–4) only when dNBR acted as the response [65]. This is consistent with established DEMATEL practice [25]—which operates on ordinal influence ratings—and with the MTBS/USGS taxonomy of ordered burn-severity classes. Because class thresholds are ecosystem-dependent, this recoding is used solely to provide the internal ranking required by DEMATEL; continuous dNBR/RdNBR surfaces remain the primary severity products [66], and, in the absence of local plot-based calibration (e.g., CBI/GeoCBI), any categorical outputs are explicitly labeled provisional and are not used to set operational decision thresholds. Instead of eliciting all direct-influence weights aij in {0, 1, 2, 3, 4} solely from experts, we first derived a data-informed pre-fill from the proof-of-concept dataset and then used it as the direct matrix A for DEMATEL. Specifically, we (i) recoded dNBR into USGS burn-severity classes (Enhanced Regrowth, Unburned/Low, Low, Moderate–Low, Moderate–High, and High) and used the corresponding ordinal code only when dNBR played the role of “effect”; (ii) computed Spearman rank correlations |ρij| between every ordered driver–response pair ij (monotone association; robust to non-Gaussianity and appropriate when the response is ordinal); and (iii) mapped |ρij| to the crisp DEMATEL scale via five bins (0,1,2,3,4), embedding direction by applying |ρij| to each weight, following standard crisp DEMATEL practice.

3.3.6. Data-Informed Expert Judgment Along the Fire Front Lines

Near the limit of detection, DEMATEL has required a direct-influence matrix A, traditionally derived from expert judgment. In our context, co-measured drivers (RAIN, dNBR, dNDVI, CHD, WUID, and DISTSTREAM) enable a transparent, data-driven anchoring of those judgments. Spearman’s ρ is suitable for monotone relations and for ordinal targets (USGS dNBR classes). To clarify, the 0–4 mapping follows common practice in multi-criteria settings to translate effect sizes into the crisp DEMATEL scale. We then proceed with the standard steps: N = A/s with s = max(max_i Σj aij, max_j Σi aij), total-relation matrix T = N (IN)−1, and indices ri = Σj Tij, ci = Σj Tji, Di = ri + ci, and Pi = rici.

3.3.7. Robustness and Sensitivity of the Sampled Breaking Fire-Points

We assessed stability in two ways: first, we recomputed A across scenario subsets (E2–E7: severity strata, “presidio-proxy” vs. non-presidio, and near vs. far from streams); second, we performed bootstrap resampling (E7, B = 1000) to obtain a consensus direct matrix A and edge-level uncertainty σij. The high dNBR ↔ dNDVI weight persisted across scenarios with low uncertainty, supporting the physical link between burn severity and vegetation loss. As a transparent reference baseline, links involving RAIN and CHD showed moderate intensity and higher variability, consistent with their scenario dependence.

Uncertainty and Confidence Intervals

In line with Forests (2024), we note data-quality safeguards including data triangulation, external validation, and expert judgment to mitigate residual biases before decisions are made. Herein, we align with the CEMS Rapid Mapping quality-control framework and 95% validation confidence levels, in line with the Copernicus Emergency Management Service: L3D (three-dimensional path length of fire fronts/corridors measured on the terrain surface), L3D/L2D (dimensionless ratio of 3D to planimetric length, a proxy for terrain-imposed effort/roughness), and S3D (3D sinuosity, i.e., 3D path length divided by the 3D straight-line distance between endpoints).
Uncertainty was quantified with 95% nonparametric BCa bootstrap CIs (B = 1000–2000); for spatial rasters and corridor aggregates, a block bootstrap (block = 100–200 m) accounted for spatial autocorrelation. CIs are also provided for spectral-change summaries (dNDVI and dNBR/RdNBR) and DEMATEL outputs (aij, ri, ci, Di, and Pi), with propagation from aij to node metrics; companion panels show mean ± SD from the consensus run (Supplementary Materials). Given the data, visualization uses error bars, shaded CI bands, or boxplots, as specified in figure captions; schematic workflow figures omit CIs. In parallel with Forests (2024), for AHP consistency, we observe the CI/CR ≤ 0.10 rule; decision reconsideration is necessary if CI exceeds 10%. Specifically, the Nash–Sutcliffe efficiency (NSE) was used to assess model performance, where values greater than 0.90 are considered “very good”, 0.75–0.90 “good”, 0.50–0.75 “satisfactory”, and below 0.50 “unsatisfactory” ([67,68]). The NSE obtained in this study falls within the “very good” range, confirming the robustness of the DEMATEL-derived influence model.

3.3.8. Limitations from Reported Upfront

Firstly, the WUI field was a constant intended as a structural zero in the provided CSV—according to Elliott’s rationale of analytical generalization—so WUI-related arcs are zero in the data-informed step (to be revisited when a non-constant WUI layer is available). Secondly, DISTSTREAM was temporarily proxied; results involving this driver are marked as provisional until the definitive distance-to-stream layer is provided. Thirdly, the 0–4 mapping discretizes a continuous effect size; therefore, we report sensitivity and uncertainty to demonstrate that key patterns are not artifacts of binning.

3.4. Remote-Sensing Evidence for an E1 DEMATEL of Drivers at Operational Firebreaks

We present the E1 baseline as the reference case because the strongest and most objective signal in the dataset arises from satellite metrics (dNBR and dNDVI), and a single-expert specification (RemoteSensing) maximizes traceability under the direct matrix A (crisp 0–4, zero diagonal), showing maximal mutual influence (dNBR ↔ dNDVI = 4).
Consistent with the standard steps, we report in Table 1 the normalized direct-relation matrix N (Equation (1)) and the total-relation matrix T (Equation (2)); from T we compute row sums r (influence given) and column sums c (influence received), with centrality D = r + c and causality P = rc.
The indicator framework (Table 1) was derived from a synthesis of DEMATEL and AHP-based studies addressing wildfire risk, access impedance, and ecological sensitivity in Mediterranean WUI contexts (e.g., [5,9]). Indicators were selected based on three criteria: (i) data availability from open EO or national repositories; (ii) operational relevance to civil-protection and post-fire planning mandates (e.g., access, hydrology, and habitat sensitivity); and (iii) representation of complementary domains—spectral change, terrain accessibility, exposure, and feasibility. This ensures that each driver contributes uniquely to causal inference and decision-support outputs. For reproducibility, the approach embeds USGS dNBR severity classes as an ordinal target within DEMATEL and maps |ρ| (Spearman) to 0–4 weights, linking remote-sensing evidence to expert influence scores in an auditable manner. After normalization (s = 6), centrality peaks at dNBR, followed by dNDVI. dNBR is a slight net cause (P ≈ +0.6), WUID is a structural zero (D = P = 0) retained as a negative control, and DISTSTREAM is peripheral (low D, negative P). In terms of the rounded vectors r, c, D, and P we list beneath Matrices 1–2, the numeric entries of N and T and the E1 heatmap are consolidated, thereby anchoring subsequent multi-scenario comparisons to a transparent baseline.
To enhance clarity and reproducibility, all variable names have been standardized across the manuscript, tables, and figures. Specifically, the hydrological proximity indicator has been consistently labeled as DIST_STREAM, replacing earlier inconsistent forms such as “DISTSTREAM.” Similarly, notational formatting inconsistencies, including the merged representation of spectral indices (e.g., “DNDVIdNDVI”), have been corrected to the standardized and technically accurate form dNDVI–dNDVI. This uniform terminology ensures unambiguous correspondence between variables, analytical expressions, and data layers used in the model. Such harmonization also aligns the manuscript with FAIR data-sharing principles, facilitating the replication and transparent reuse of the open-source workflow described in this study. Normalization of E1 matrix.
N =   0 0.167 0 0.333 0 0   0 0 0.667 0.167 0 0     0 0.667 0 0.167 0 0   0.333 0.167 0.167 0 0 0.167   0 0 0 0 0 0   0 0 0 0.167 0 0  
Total-relation of E1 matrix.
T     0.208 0.675 0.554 0.625 0.000 0.104   0.250 1.250 1.625 0.750 0.000 0.125     0.250 1.650 1.225 0.750 0.000 0.125   0.500 0.900 0.850 0.500 0.000 0.250   0.000 0.000 0.000 0.000 0.000 0.000   0.083 0.150 0.142 0.250 0.000 0.042  
Rounded to 3 decimals, in the following factor order:
  • r = (1.292, 4.625, 4.396, 2.875, 0.000, 0.646);
  • c = (2.167, 4.000, 4.000, 3.000, 0.000, 0.667);
  • D = (3.458, 8.625, 8.396, 5.875, 0.000, 1.312);
  • P = (−0.875, +0.625, +0.396, −0.125, 0.000, −0.021)

3.4.1. Causal Map and Interpretation (Single-Expert Specification, RemoteSensing) for E1

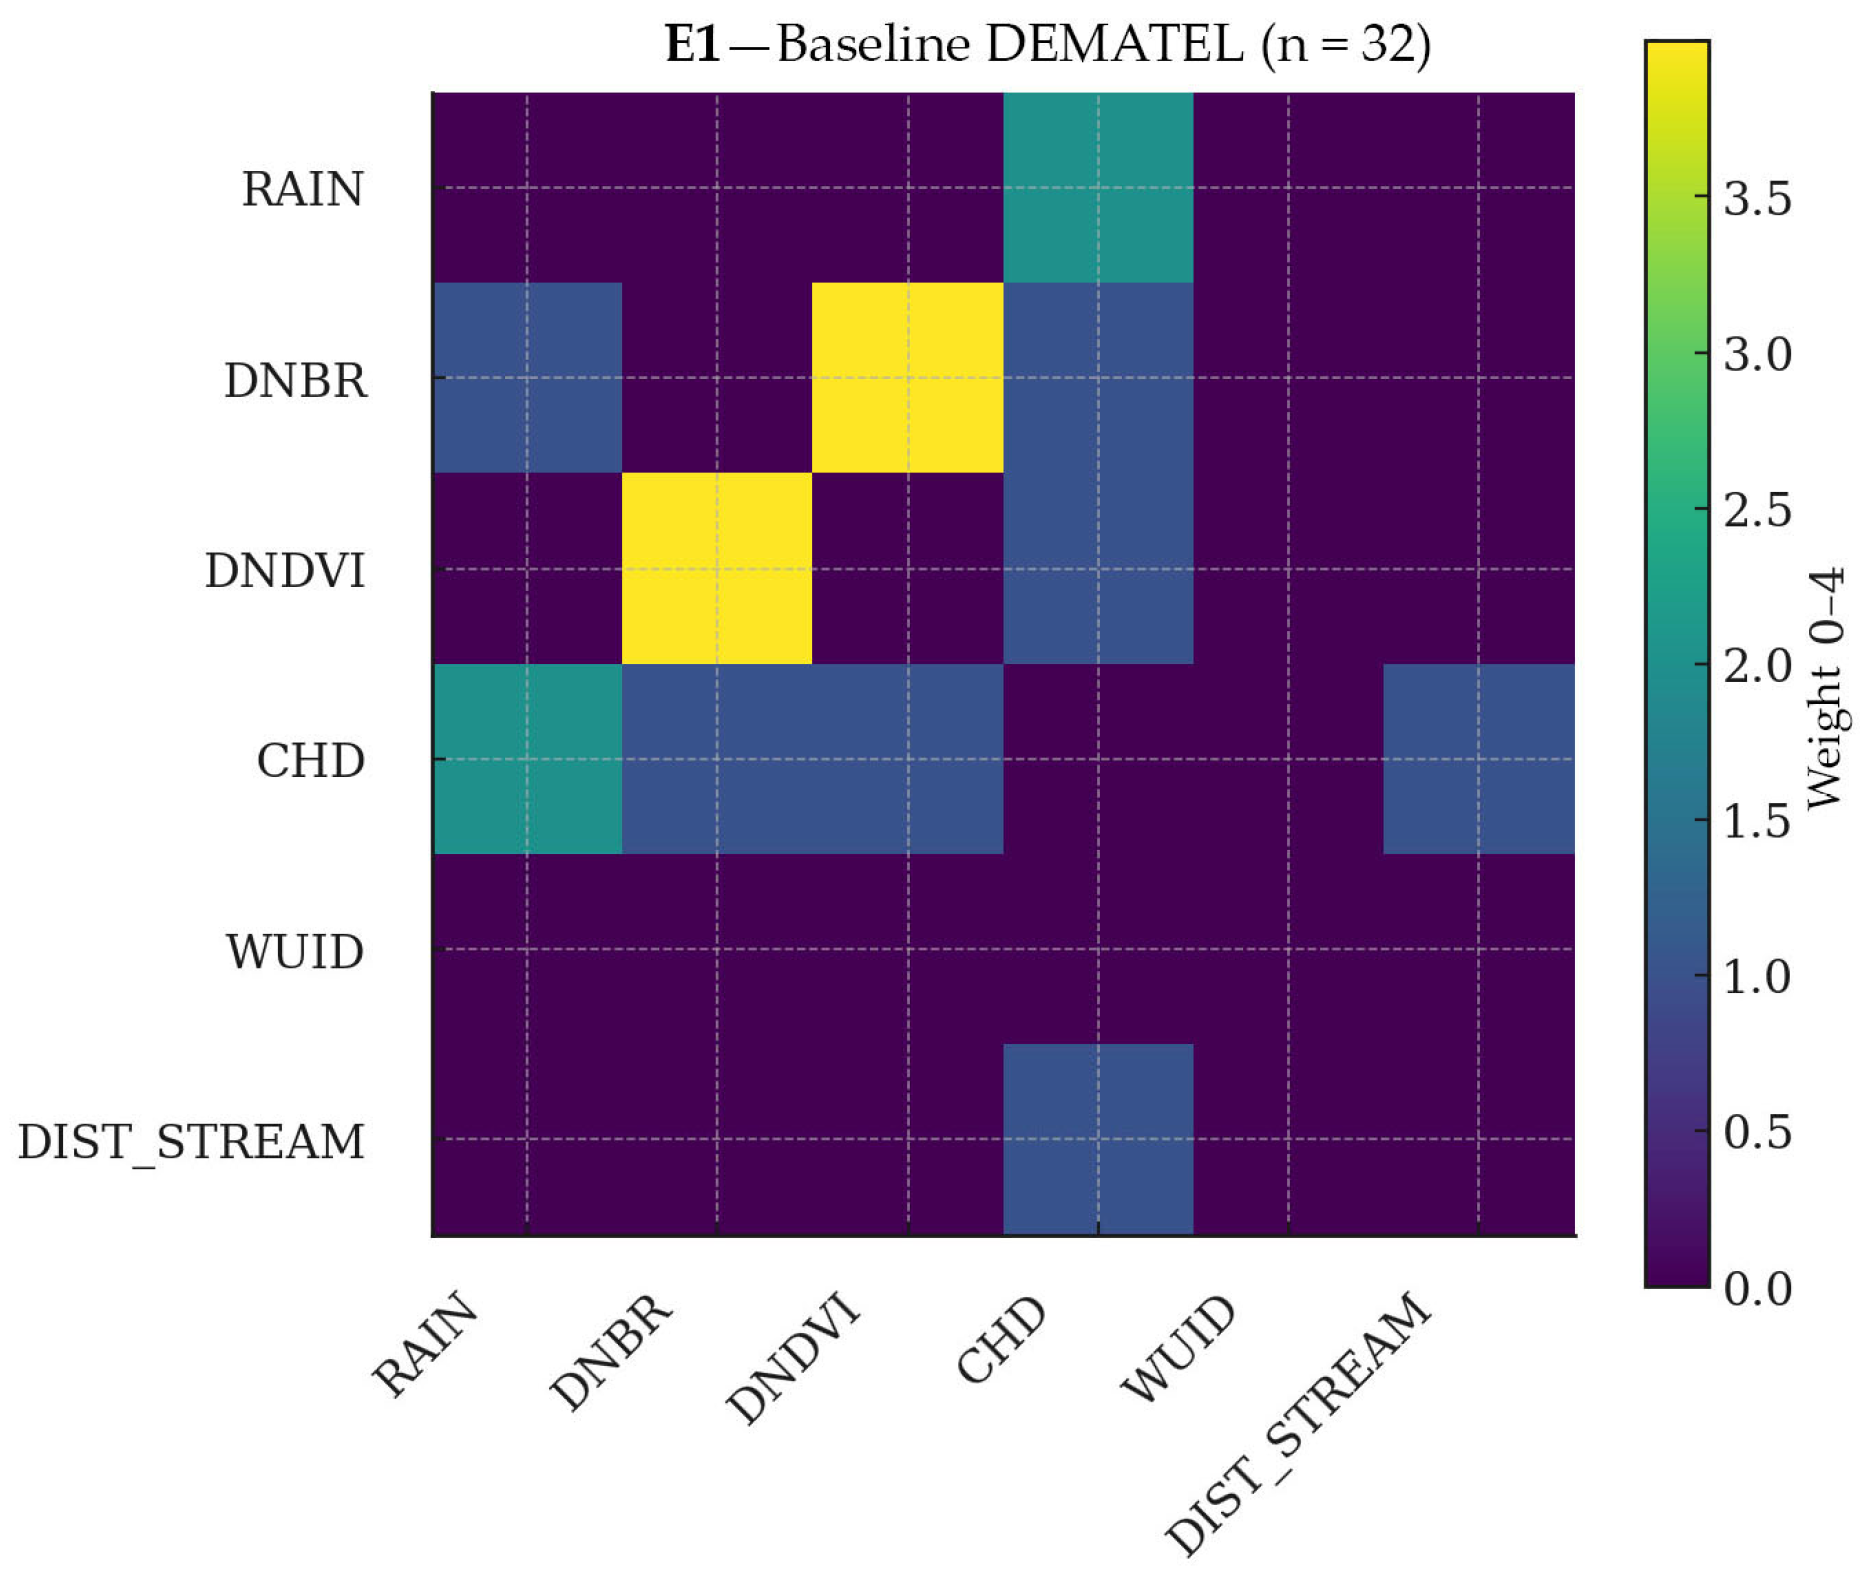
To designate a verifiable reference, we illustrate in Figure 11 the core evidence for E1, using a uniform legend that maps weights to colors (0 = no influence, deep purple; 1 = weak, blue; 2 = moderate, teal/cyan; 3 = strong, yellow-green; and 4 = very strong, yellow) with fixed 0–4 coloubar ticks and harmonized cause/effect axes, a scheme applied identically to all DEMATEL figures.
  • With reproducibility of results as a priority, we document this heatmap showing a remote-sensing spine with maximal reciprocity between dNBR and dNDVI (4 ↔ 4), indicating that burn severity and vegetation loss co-determine each other.
  • By fixing a documented comparator, off-axis influences are sparse (mostly ≤ 2): CHD couples weak–moderately with RAIN and with {dNBR, dNDVI}, marking operational/access modulation rather than primary control; RAIN ↔ CHD = 2 is the clearest meteorological–operational link. DISTSTREAM appears peripheral (≤1, chiefly via CHD), while WUID is a structural zero and is used only as a negative control/stratifier.
  • Conversely, by defining as a verifiable reference, this pattern-dense RS core and thin peripheral ties corroborate the centrality/causality ranks derived from the matrices N and T (Equations (1) and (2)): dNBR leads, dNDVI follows, and dNBR acts as a slight net cause.
  • With auditability in mind, E1 anchors the scenario analysis: prioritize severity–vegetation cues for locating support points, use CHD as an operational filter, and treat hydro-proximity and WUI as minor in this baseline.

3.4.2. Remote-Sensing Evidence for an E DEMATEL of Drivers at Operational Firebreaks

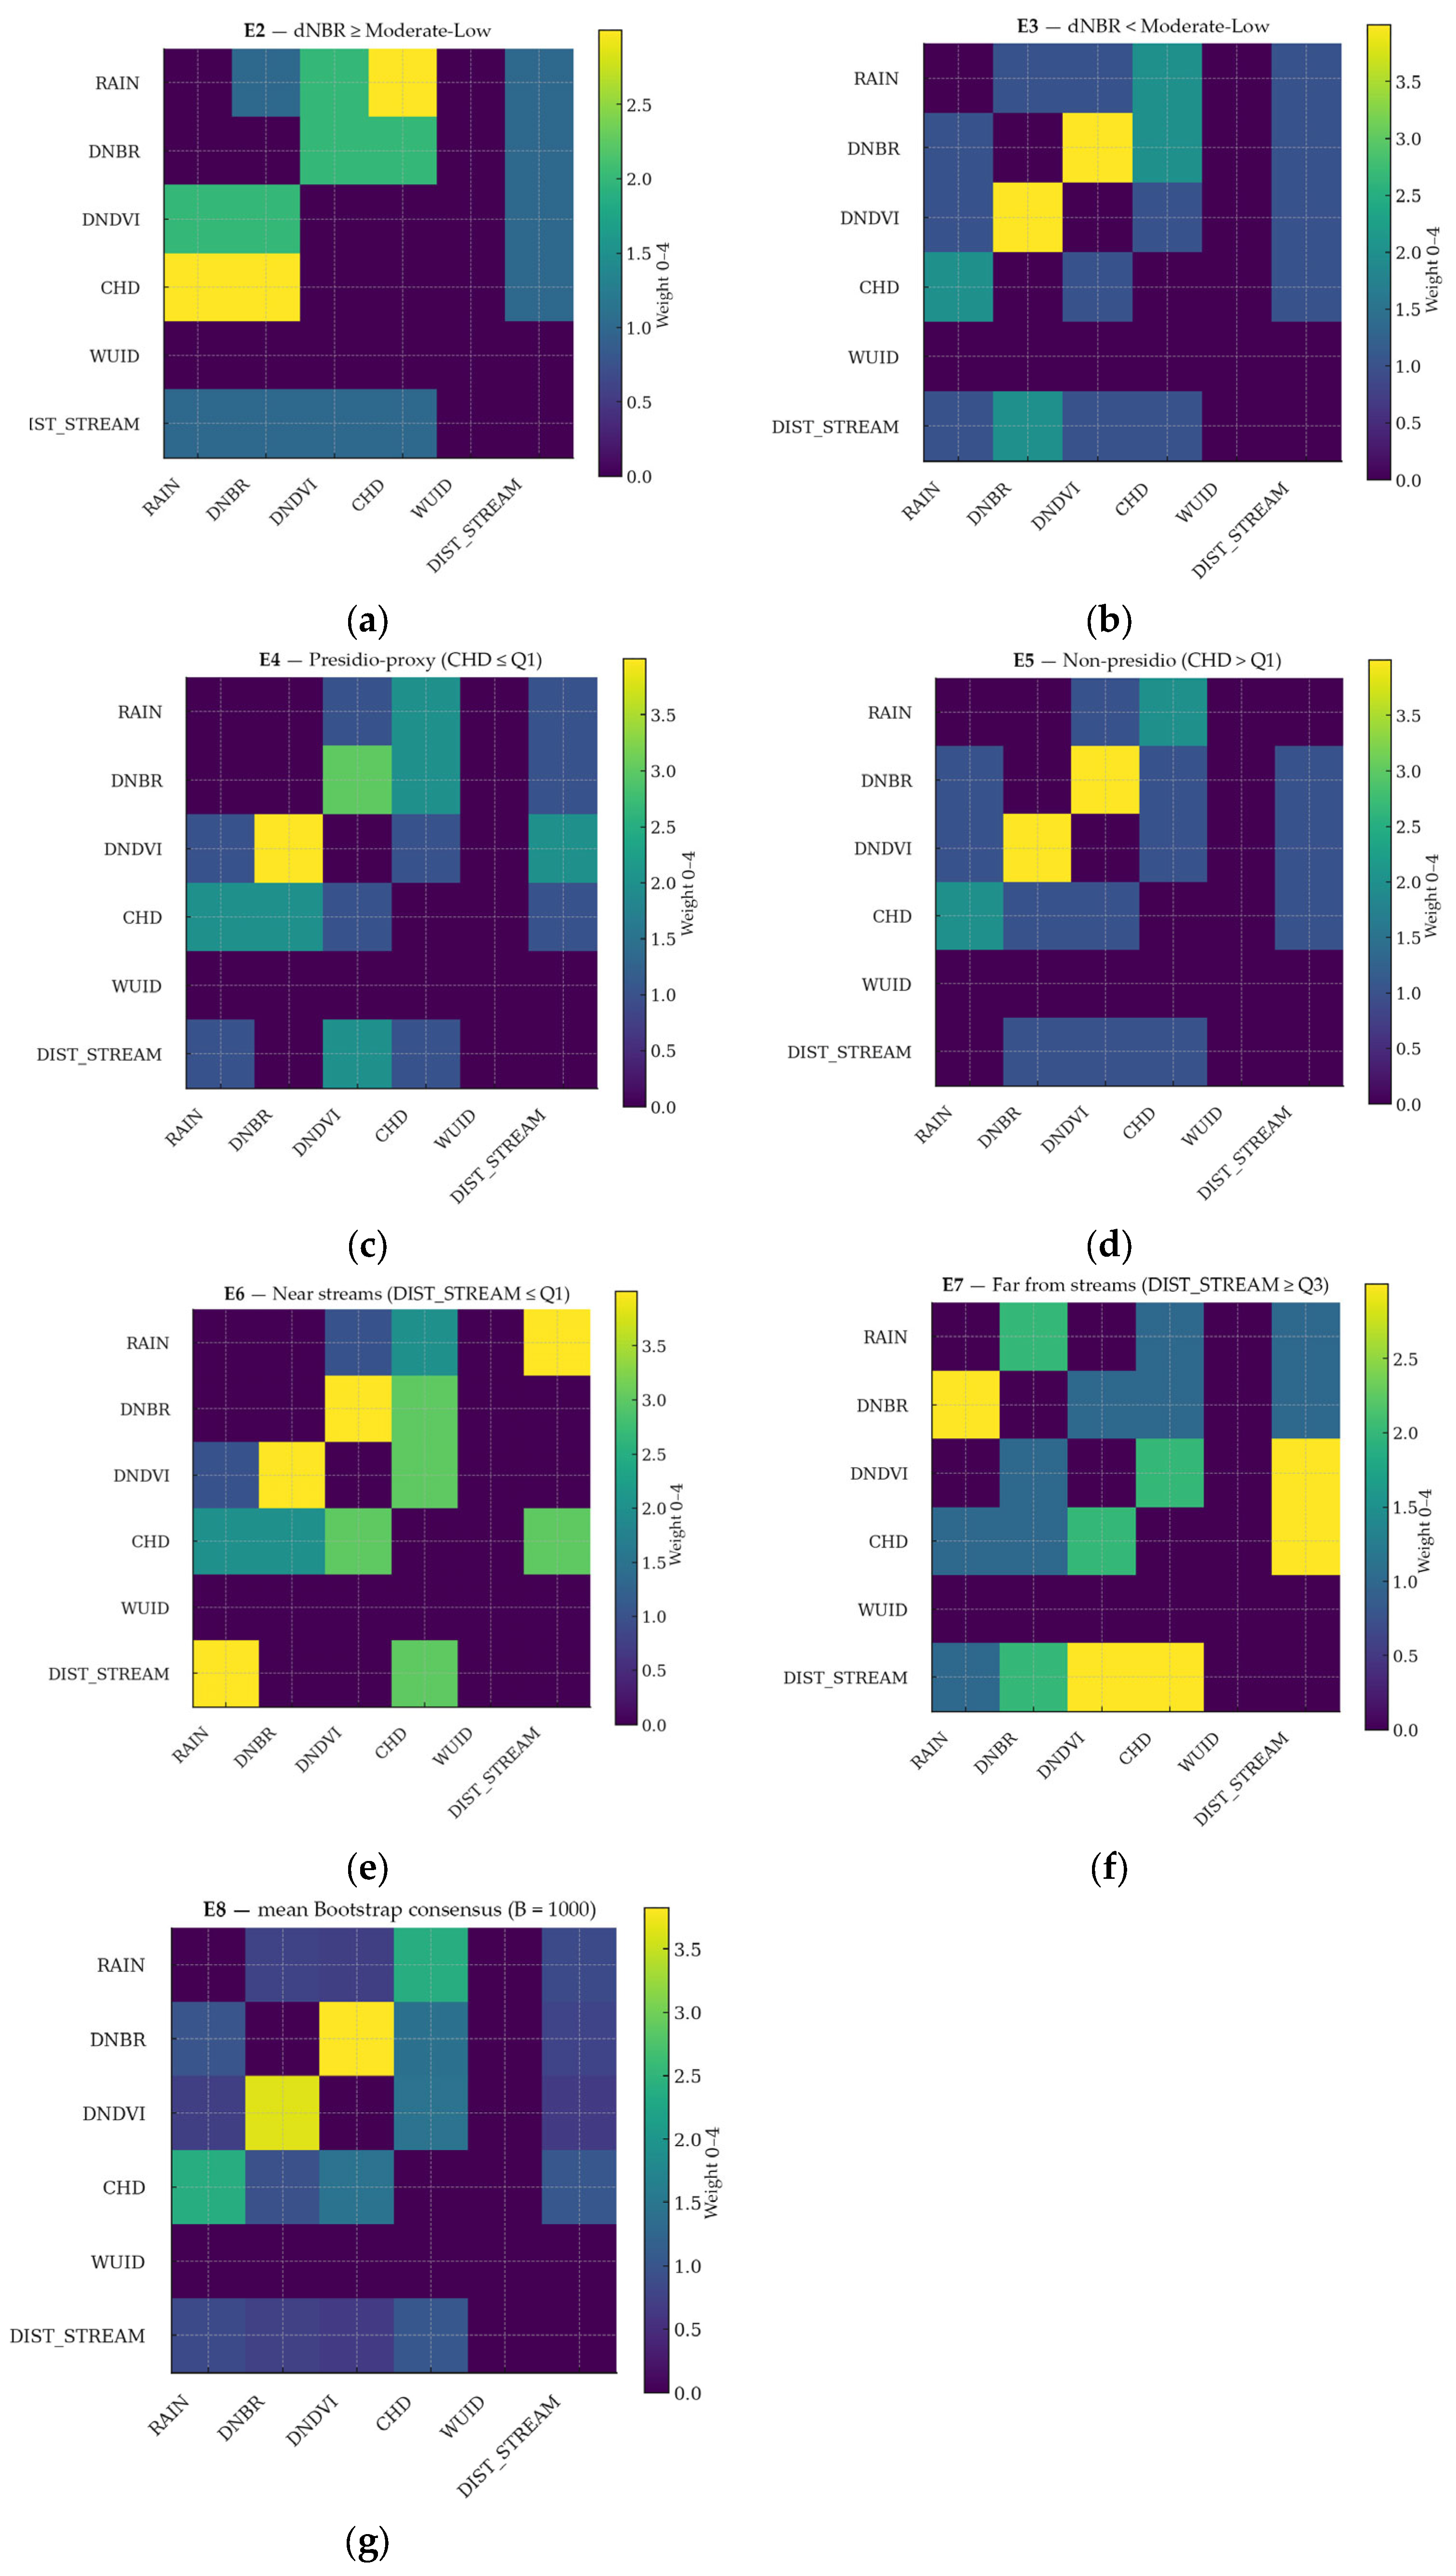
Within our reproducibility-first rule-extraction scheme, we ensure that operationalized robustness has been forwarded across the remaining scenarios by assessing via severity-based strata (E2–E3), access/proxy strata (E4–E5), hydrologic proximity (E6–E7), and bootstrap consensus (E8), as follows (Figure 12a–g).

3.5. Construction of Direct-Influence Matrices and Scenario Filters (E1–E8)

All direct-relation matrices ingested into PyDEMATEL were derived from our curated dataset dematel_6_drivers.csv, designed to balance complexity and practicality [55], i.e., the average number of indicators per method: we used six drivers—RAIN, dNBR, dNDVI, CHD, WUID, and DISTSTREAM (the latter a temporary proxy). For audit-ready rule extraction and operational readiness, dNBR was recoded to USGS burn-severity classes whenever it served as an effect variable—specifically, this recoding also provides a clear visual aid to reproducibility. For each ordered pair ij, we computed Spearman’s ρ and discretized ρ into 0–4 weights (0–0.10 → 0, 0.10–0.30 → 1, 0.30–0.50 → 2, 0.50–0.70 → 3, ≥0.70 → 4; diagonal = 0). Implemented as a reproducible rule-extraction component, scenario filters produced E2 (dNBR ≥ 0.27), E3 (dNBR < 0.27), E4 (CHD ≤ Q1 = 4.0), E5 (CHD > Q1), E6 (DISTSTREAM ≤ Q1 ≈ −0.018), E7 (DISTSTREAM ≥ Q3 ≈ 0.044), and the E8 consensus (bootstrap mean, B = 1000). These matrices were then entered in pyDEMATEL (panel “DEMATEL Solver”), which returned N, T, and the causal diagram (D = r + c,  P = rc).

4. Discussion

Because the 72 h post-fire rainfall accumulation is measured strictly after burn severity has been realized under the adopted protocol, we treat Rain72h as an exogenous, operational constraint rather than a causal driver of severity. This choice reflects the hazard mechanisms that dominate immediately after a fire: debris-flow and flash-flood potential are governed by short-duration intensity–duration exceedances (orders of 15–30 min) that rapidly mobilize ash and loose colluvium, damage culverts and road prisms, and degrade passability, thereby elongating or delaying access routes. Consistent with USGS/BAER practice, which anticipates debris-flow likelihood from rainfall thresholds and prioritizes road-drainage and channel protection in the first post-fire weeks, our workflow keeps Rain72h outside the DEMATEL severity graph to avoid conflating post-event exposure with upstream severity causation; rainfall’s role is retained in routing, passability, and staging, where short-duration intensities (e.g., I15–I60) are the relevant predictors for debris-flow and access risk. In line with analogous studies [30,69], we do not explicitly integrate time series of climate variability or land-use/land-cover change, prioritizing the causal structure and the ranking of interventions. In terms of SDG alignment, the resulting low-carbon siting and ecological-protection rules directly advance SDG 11 (targets 11.5 and 11.b, reducing disaster impacts and implementing integrated DRR), SDG 13 (target 13.1, strengthening resilience to climate-related hazards [70,71]), and SDG 15 (targets 15.1/15.2/15.3, sustainable forest management and land-degradation neutrality). Consistent with this, we incorporate Rain72h in the feasibility/cost layer that governs siting-conditioning road passability, informing temporary closures, and defining “must-avoid” buffers along channels [72]. Additionally, we note that, where available, peak-intensity indicators (e.g., I15 and I30) are expected to discriminate operational risk more sharply than multi-day totals. This exogeneity has been demonstrated to frame causal interpretability for severity while retaining rainfall’s critical role for safe, low-carbon operations by steering routing, staging, and timing without overstating its influence on the already-realized severity mosaic. Lastly, regarding “universality”, we addressed a specific design time: the framework’s persuasiveness rests on invariants-sensor-agnostic spectral indices, explicit DEMATEL factorization, and a reproducible pipeline, while locality is confined to tunable thresholds, enabling portability across regions and events [73]. Echoing Forests (2024), our decision products (suitability/priority maps and causal prominence and relation plots) provide a protocol for stakeholders, and, where multiple stakeholders are involved, integrating environmental, social, and economic factors for restoration and prevention planning.
We therefore target analytical generalization, reserving claims of universality for future multi-site validation. Within a proof-of-concept, readiness-focused design, we retained WUID as a constant; operational readiness will entail operationalizing WUI exposure via building density and network-based road accessibility to represent spatial heterogeneity.
The comparative positioning of our workflow relative to existing post-fire planning approaches is presented in Section 4.1; operational implications for routing, passability, and staging—including the role of short-duration intensity metrics—are analyzed in Section 4.2; and limitations and improvement directions—such as the representation of WUI exposure and the use of authoritative hydrography—are detailed in Section 4.3, consistent with a readiness-focused proof-of-concept.

4.1. Comparison with Existing Post-Fire Planning Methodologies

Recent efforts such as the GRESTO index for Mediterranean restoration prioritization and the expanding landscape of AI-enabled UAV systems demonstrate rapid progress in post-fire situational awareness and prioritization. Our contribution complements these by (i) fusing hydrologically conditioned DEMs [74] with burn-severity and vegetation-response layers, (ii) making causal structure explicit through DEMATEL to reveal prominence and net influence among drivers, and (iii) operationalizing outputs as FTSP/corridor decision objects on an auditable, open pipeline. In contrast to approaches that rely mainly on post-fire pattern recognition or platform-centric sensing, our workflow emphasizes transparent factor interrelations and reproducible siting rules that can be re-run by agencies on open EO inputs.

4.1.1. Operational Feasibility Analysis of Low-Carbon Siting Strategies

We interpret “low-carbon” tactically as minimizing haul distance and ad hoc track opening while safeguarding sensitive habitats [23]. Two terrain-aware descriptors—3-D front length (L3D) and 3-D sinuosity (S3D)—are used to anticipate vertical cost and tortuosity, guiding corridor alignment toward benches and short, gentle segments that remain trafficable under light precipitation. Rainfall accumulated over 72 h is handled as an exogenous feasibility and safety overlay (routing, staging, and passability), not as a severity driver, consistent with the case-specific hydrometeorological context. Together, these diagnostics support FTSP readiness assessments and sequencing in a way that is directly translatable to operations; in our case study, they underpin improved connectivity to existing access and reduced overlap with sensitive areas at like-for-like suitability thresholds.

4.1.2. Operational Implications for Routing, Passability, and Staging

Two caveats apply to this proof-of-concept. First, the WUID layer was effectively constant in our analysis and is therefore retained solely as a negative control; it does not explain spatial variability in the current dataset. Second, hydrographic proximity (DISTSTREAM) was represented by a temporary proxy, so any interactions involving this variable should be regarded as provisional until an authoritative distance-to-stream layer is used. Accordingly, future work will prioritize the (i) adoption of authoritative WUI and hydrography datasets, (ii) integration of higher-frequency rainfall metrics (e.g., I15/I30) and field-based severity indices (e.g., CBI) for validation, and (iii) interoperability for near-real-time export of ranked FTSPs/corridors to agency platforms.
The treatment of rainfall as an exogenous operational constraint preserves the causal interpretability of the DEMATEL network, avoiding any artificial coupling between rainfall and fire severity. Although Rain72h is excluded from the causal core, it remains crucial for determining road passability, routing safety, and the scheduling of restoration interventions. In operational terms, rainfall gradients inform low-carbon deployment strategies by minimizing unnecessary vehicle movement, optimizing staging along resilient corridors, and reducing post-fire disturbance. This separation of causality and feasibility ensures that the workflow retains analytical rigor while providing tangible guidance for emergency planners. Consequently, the integrated maps enable data-driven prioritization of corridors that balance ecological sensitivity with logistical efficiency.

4.2. Prominence–Causality in the DEMATEL Network (E1–E8)

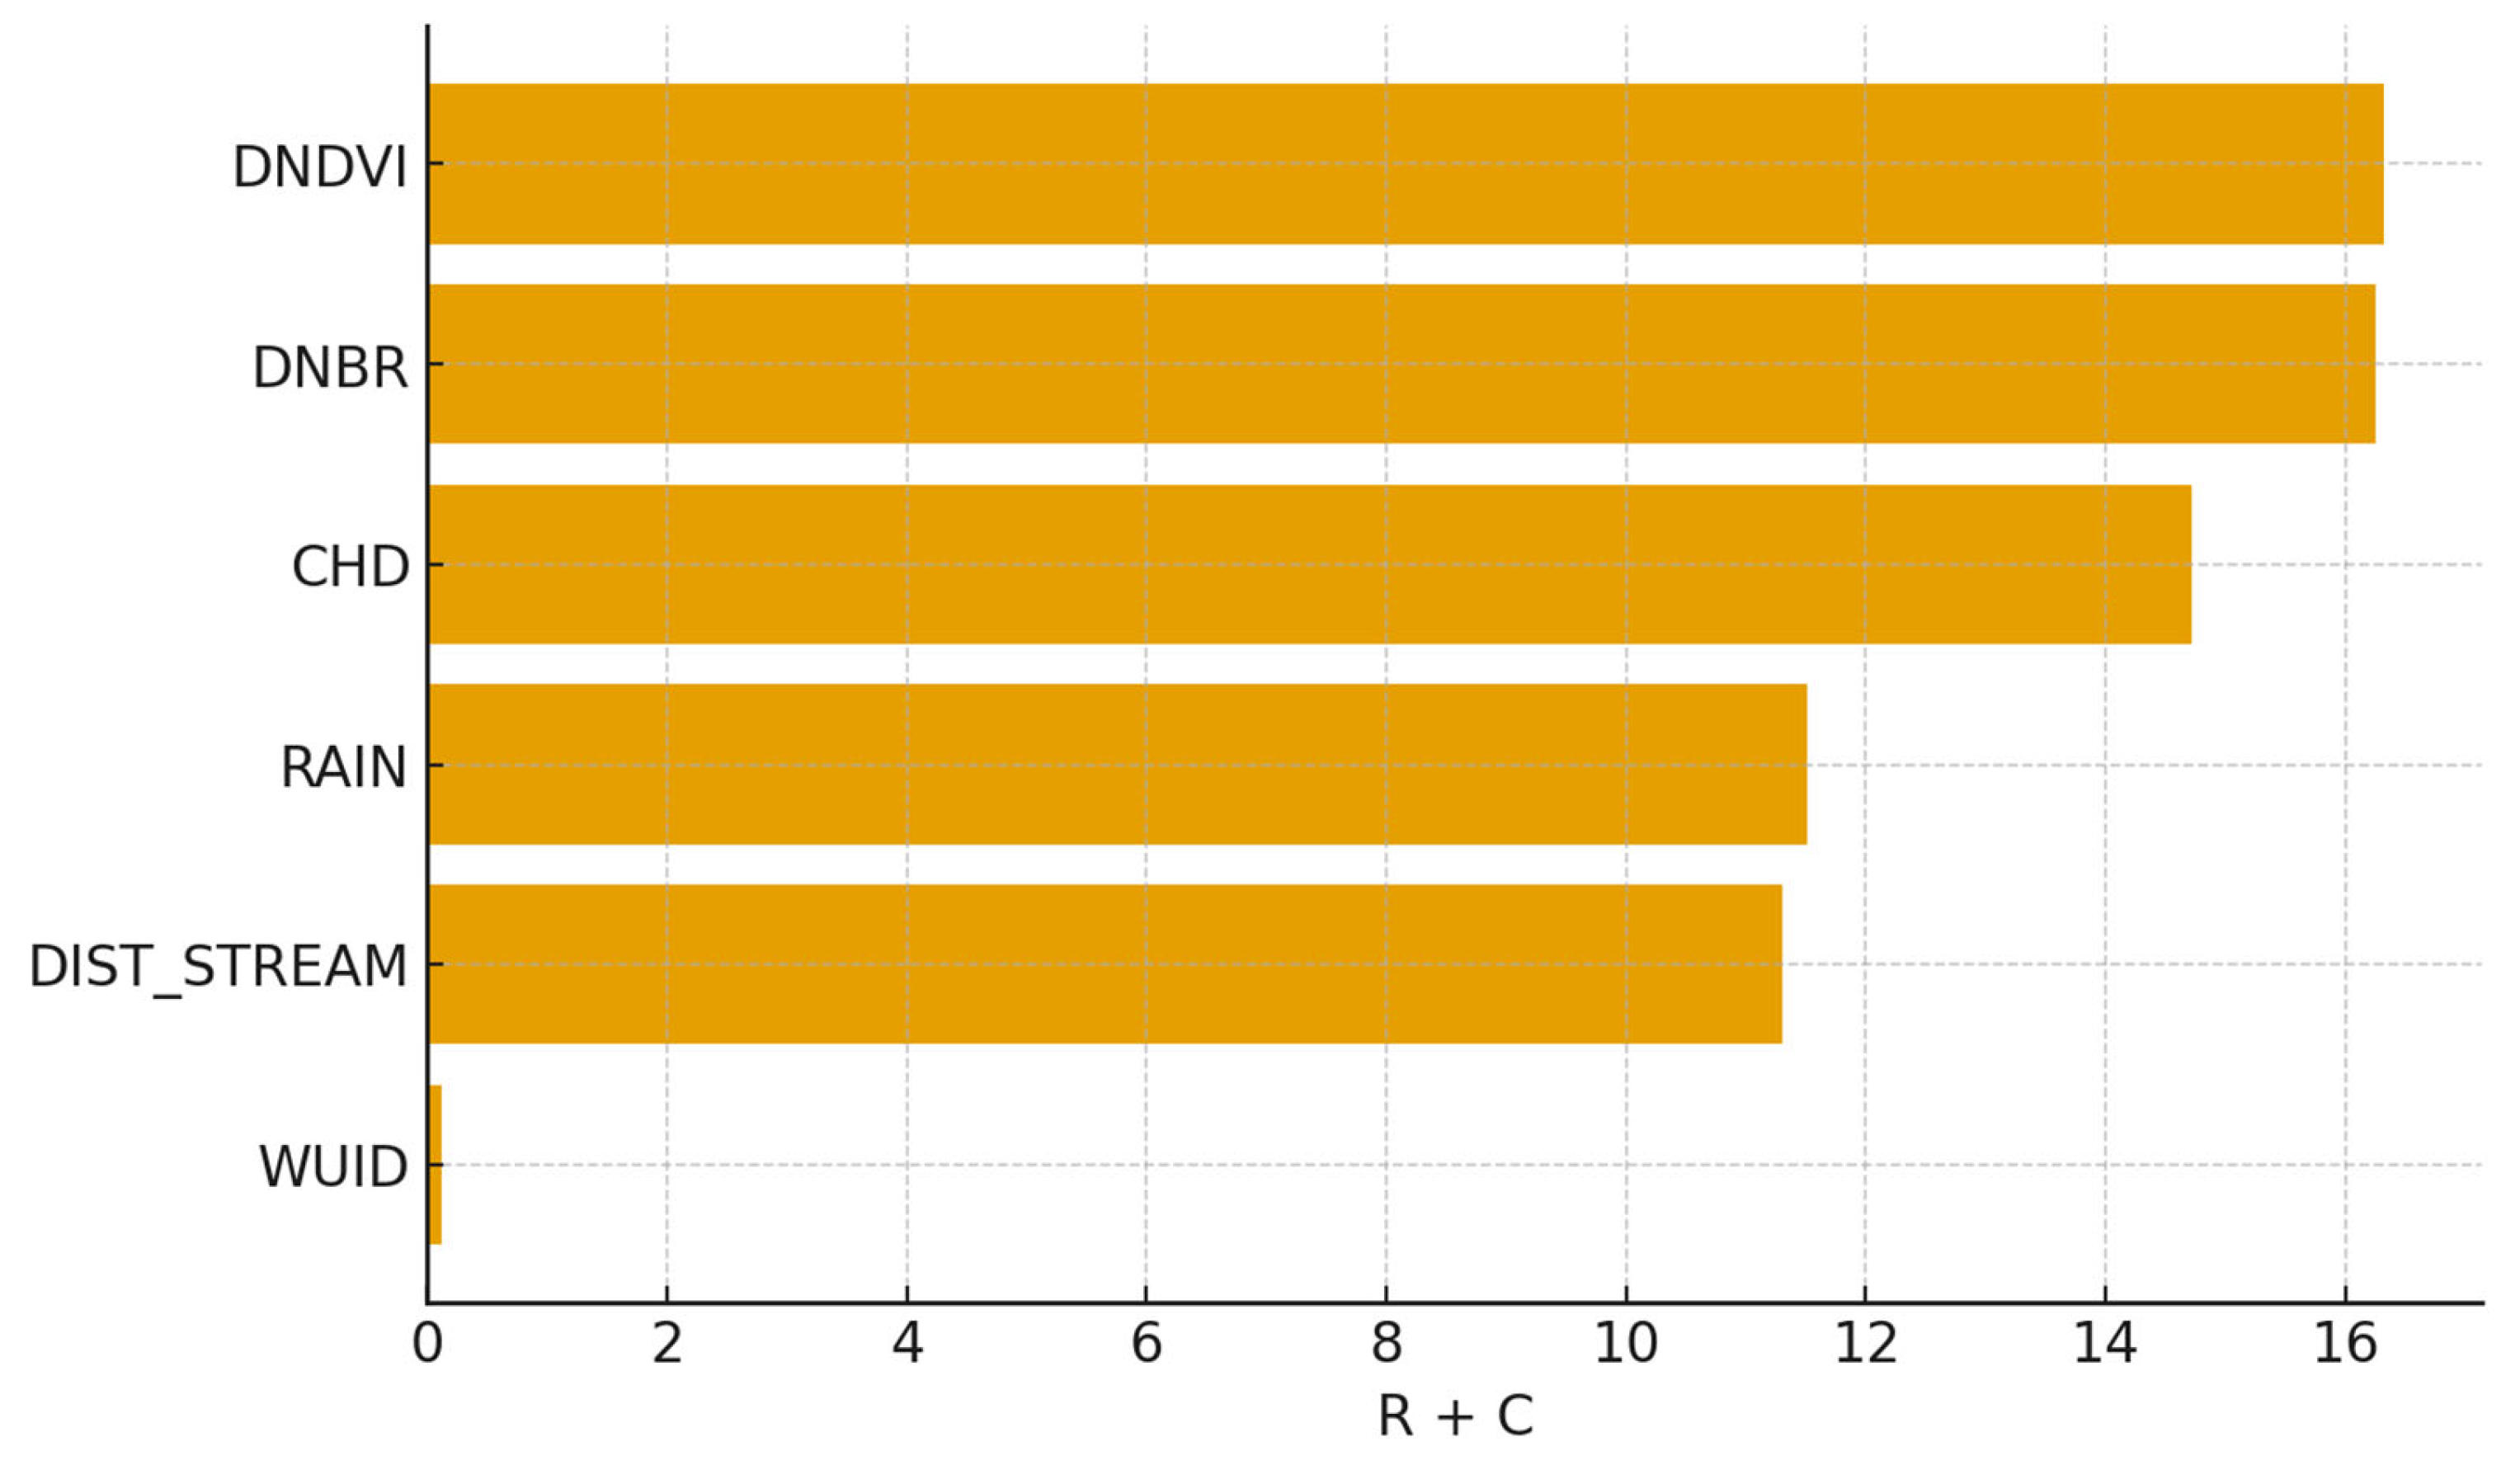
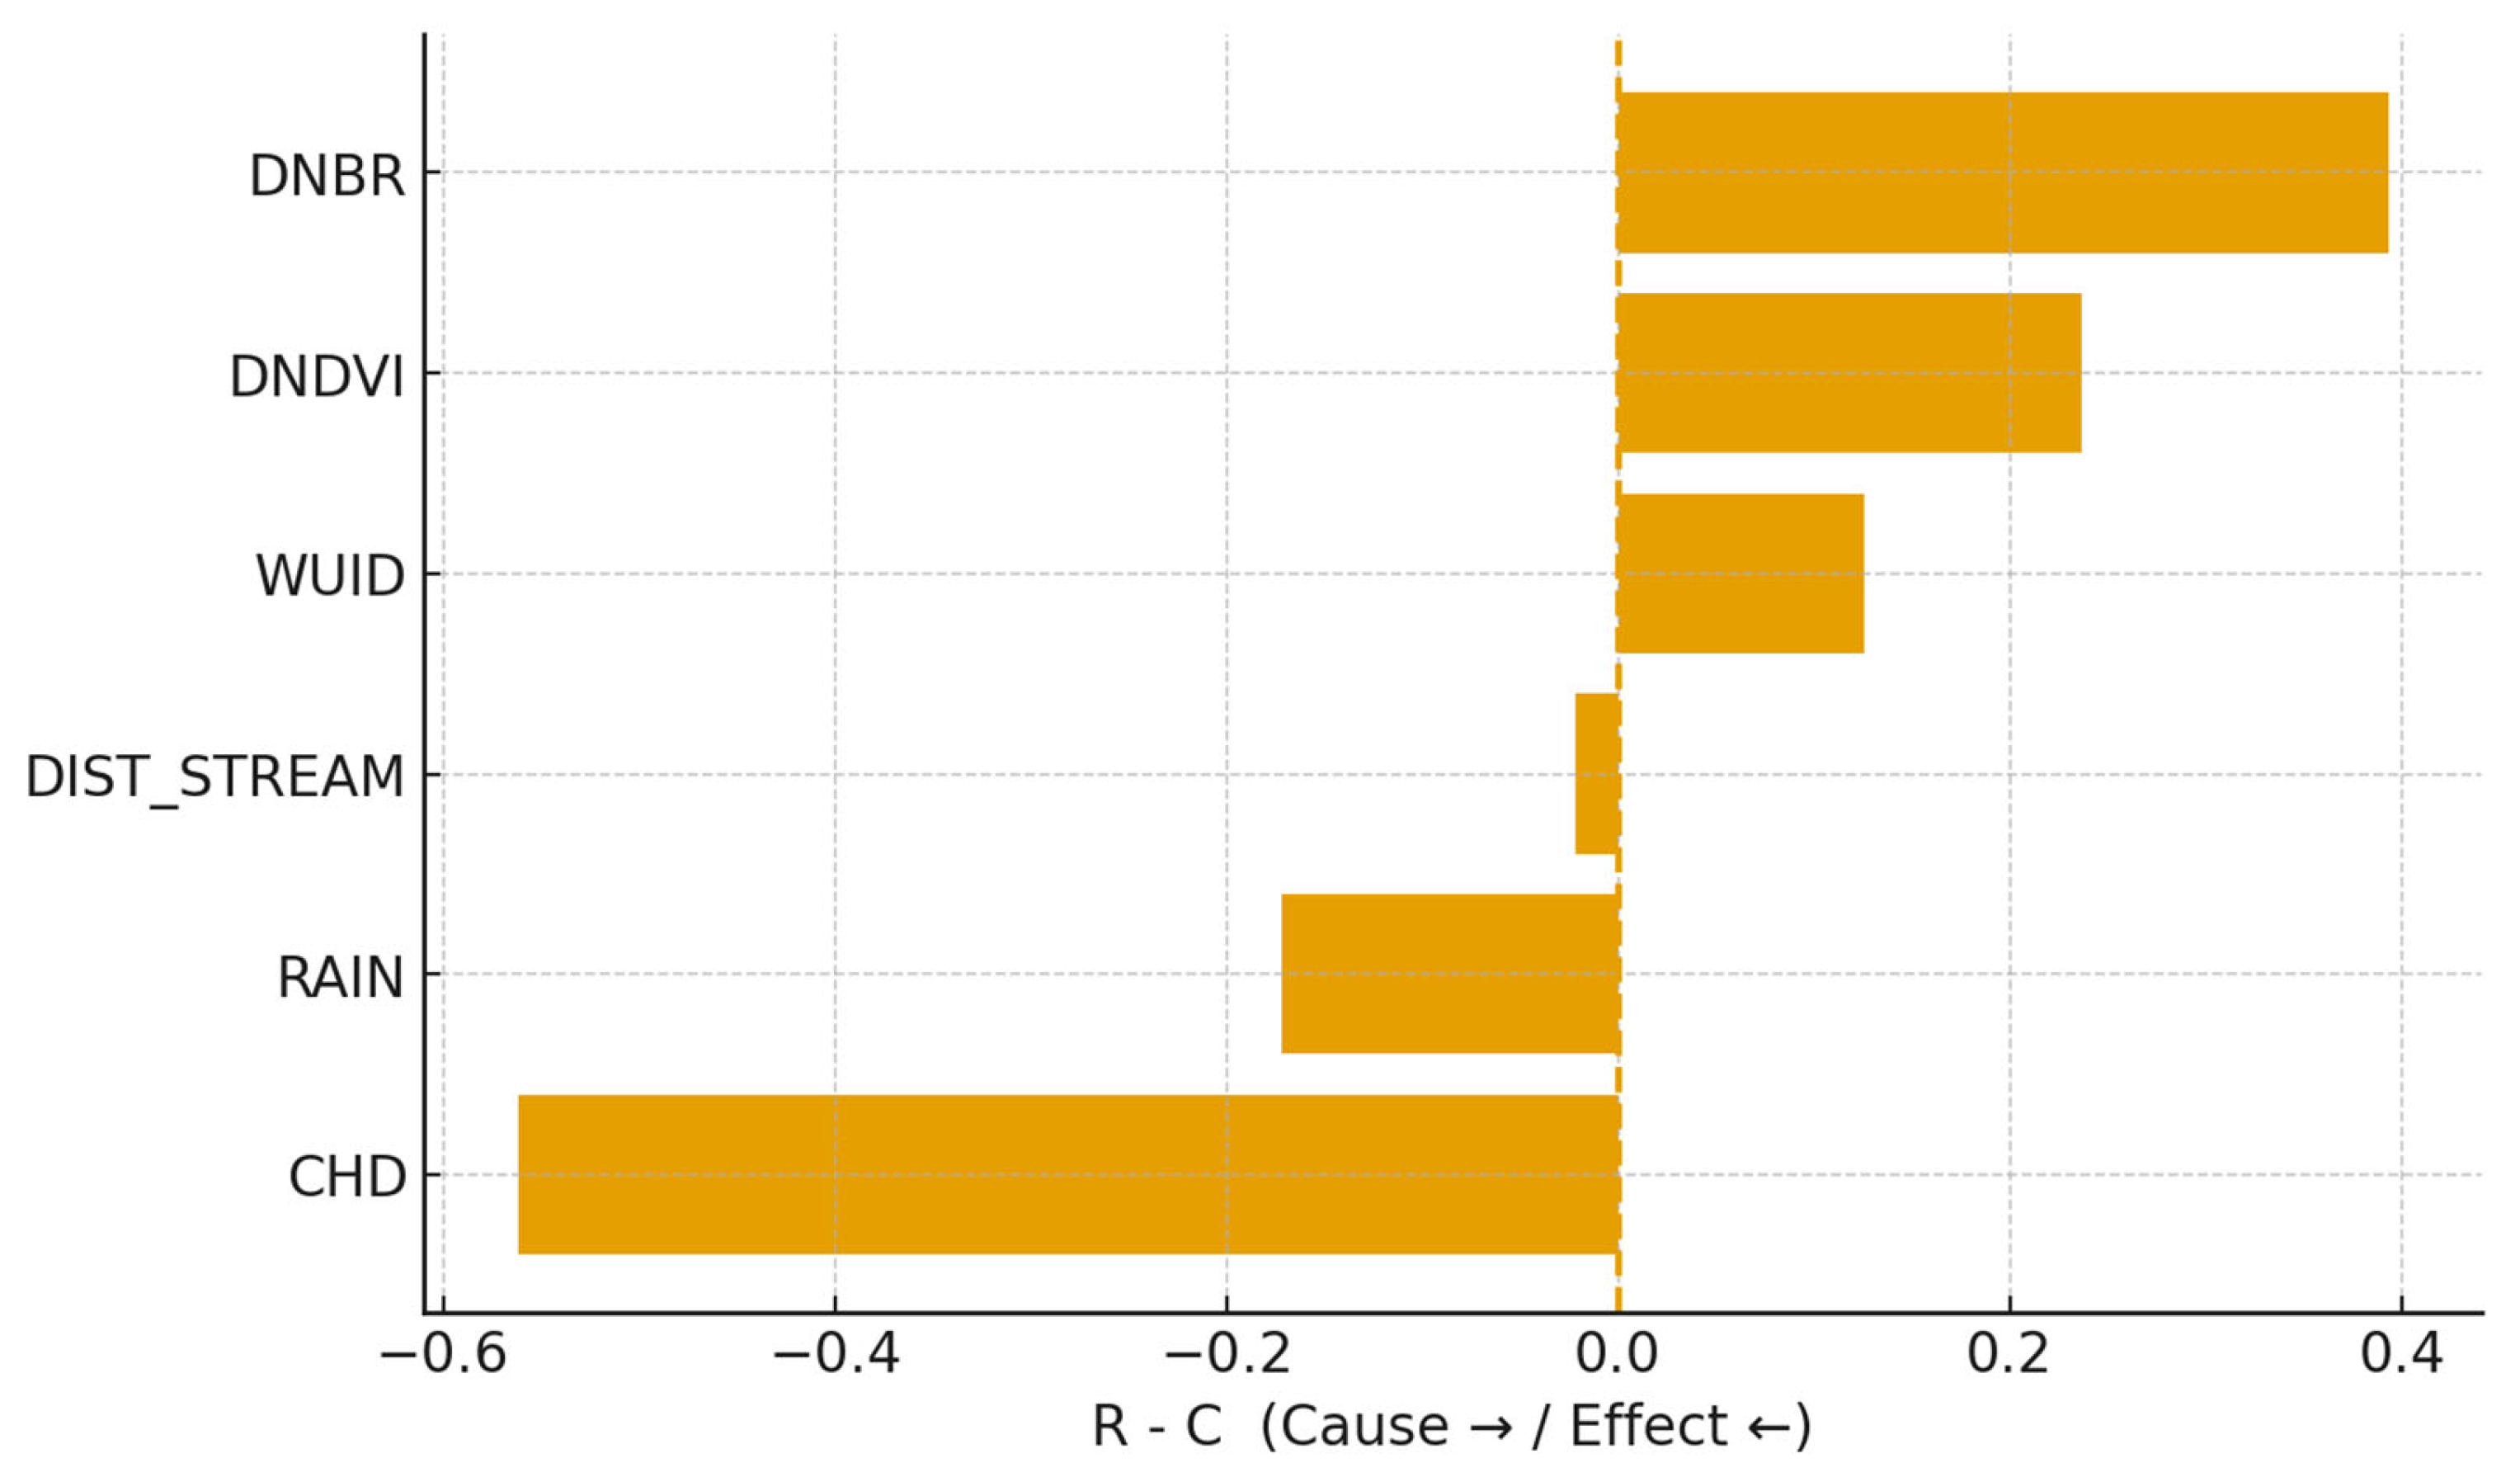
Within this domain, the recent literature explicitly references hybrid fuzzy DEMATEL–ANP (FDANP) and cautions that a model’s “absence” in a region does not imply unsuitability; accordingly, we position our DEMATEL core as methodologically legitimate and adaptable rather than an outlier. Within the DEMATEL network, prominence (R + C) captures how intensively each factor participates in the web of influences, while causality (RC) separates net sources from net sinks. In the baseline configuration, prominence is led by dNDVI (R + C = 16.33) and dNBR (16.25), followed by CHD (14.72); RAIN (11.52) and DISTSTREAM (11.31) are intermediate, and WUID is negligible (0.13). The causality spectrum places dNBR (R − C = +0.39) and dNDVI (+0.24; WUID +0.13, weak) on the net-driver side, with CHD (−0.56) and RAIN (−0.17) acting as net effects; DISTSTREAM is nearly neutral (−0.02). Read together, these results indicate that the strongest levers in the modeled system align with the spectral severity proxies (dNBR/dNDVI), whereas heritage exposure (CHD) tends to absorb influence and post-event rainfall behaves largely as a downstream, operational constraint. Because dNBR and dNDVI are composite spectral responses, their apparent upstream position should be interpreted with care: they likely summarize integrated vegetation and condition signals that co-vary with access, water availability, and physiography, rather than constituting manipulable causes in themselves.
Anchored in reproducible rule extraction, when the analysis is broadened across scenario filters, the qualitative picture converges with operational intuition. Reliable access and water proximity persistently surface as first-order elements that help explain where high-impact support points are feasible, while vegetation structure and heritage constraints modulate that feasibility; 72 h post-fire rainfall remains best treated as an exogenous, time-limited constraint rather than a severity driver.
Within post-fire response practice, intensity-based indicators (e.g., I15/I30) are often employed to resolve short, high-intensity convective bursts. In parallel to this, our feasibility overlay based on 72 h accumulation complements this perspective by summarizing antecedent wetness over the operational window. The framework is modular and readily accommodates peak-intensity metrics from local gauges or radar where available, thereby aligning with intensity-oriented workflows while preserving the present design.
In strategic terms, the network suggests that the greatest leverage comes from acting on the processes that move dNBR/dNDVI in practice, configurations that co-locate robust access with nearby water and manage vegetation in sensitive WUI mosaics while recognizing CHD as a binding constraint that requires design choices to avoid impact. This interpretation supports the use of DEMATEL-weighted composites as a transparent decision aid, but it also argues for restraint: the directionality inferred here is contingent on indicator design, thresholding, and the single-case context, and should be confirmed with targeted validation before elevating the findings to prescriptive guidance.
  • Standing as the terminal proof of the framework, we are inclined to conclude with this interpretation three main validations, as evidenced by Figure 13 and Figure 14:
  • Highest centrality: dNBR (D = 8.625) and dNDVI (D = 8.396), in line with the heatmap’s strong dNBR ↔ dNDVI coupling (cells = 4).
  • Net causes (P > 0): dNBR (+0.625) and dNDVI (+0.396) slightly dominate as sources in the total network, while RAIN is a mild net effect here (P = − 0.875) due to strong incoming links via dNBR/dNDVI/CHD.
  • Operational context: CHD is central but leans effect-side (P = − 0.125); WUID is neutral (all 0 because constant in the dataset); DISTSTREAM is peripheral (D = 1.312), consistent with its weak direct weights.

4.3. Stakeholder- and Practitioner-Oriented Feature Capture

Situated within a maturing PoC discourse in wildfire/forestry decision support, we position our work at the junction of causal structuring and spatial, post-fire operability. Additionally, following Elliott (2021) [16], our post facto arguments justify pragmatic transportability to like settings. Three recent MDPI studies frame this stance explicitly. First, the commercial-complex analysis built on WSR–DEMATEL–ISM [30] demonstrates how DEMATEL computes centrality/causality to identify “key factors”, with ISM clarifying management hierarchies—validating our use of DEMATEL as the causal engine to separate drivers from resultants—but it remains indoor/management-centric and lacks geospatial/remote-sensing layers and SDSS delivery. Second, the post-fire restoration case that couples AHP + DEMATEL with an SDSS [5] shows an operational pathway from causal weighting to suitability maps interpretable by decision makers (e.g., class shares), aligning closely with our stakeholder-facing outputs; its criteria and geography differ, however, from Mediterranean WUI readiness. Third, the WUI evacuation study for Central Portugal ([71] integrates hazard, social vulnerability, and travel time to shelters—an analog for our access/water feasibility layers and for elevating corridor serviceability and time-to-safety—but it does not apply DEMATEL (no causal/centrality weighting) and is largely pre-event. Our framework closes these gaps by anchoring the same causal logic in spatial data (dNBR/dNDVI, access and water proximity, 72 h rainfall feasibility, and heritage constraints), producing ranked SDSS maps of corridors and staging sites for direct stakeholder use, and relegating ISM to the Supplementary Materials for visualization only. In this way, the two PoC strands—causal management without spatial operability [67] and spatial operability without causal weighting [71]—are synthesized with the operational SDSS pathway [65] in a DEMATEL-centric, site-agnostic, cartographable workflow designed for stakeholders and practitioners in Mediterranean WUI parks.

5. Conclusions

As a proof-of-concept, this study shows, rather than merely proposes, a reproducible, site-agnostic workflow that produces actionable FTSP and corridor candidates within post-fire operational windows. Operational relevance is evidenced in the results by (i) coherent prioritization inside high-severity mosaics, (ii) improved connectivity of candidate corridors to the existing access network, and (iii) reduced overlap with mapped sensitive areas at like-for-like suitability thresholds. The pipeline finishes within a same-day computational window on a standard workstation, and all code/configuration is released to enable independent re-runs. By design, we do not estimate monetary costs, fleet scheduling, or greenhouse-gas impacts here [75]; these agency- and site-specific analyses are intentionally deferred to future multi-event validation and deployment studies.
Consistent with the nature of a proof-of-concept, although the workflow is site-agnostic and replicable in an empirical sense—that is, a prototype shown to achieve its intended function in one concrete setting—in Elliott’s account this supports analytical (not statistical) generalization. Concluding with post facto arguments, the pragmatic license validates transportability only to cases with justifiably similar assumptions and parameter values, while claims of universality are deferred to later multi-site validation (i.e., severity mapping to deliver suitability surfaces for Fireline Tactical Support Points, FTSPs, and low-carbon fireline corridors). The application of DEMATEL enabled transparent identification of causal structures, highlighting the primacy of vegetation–severity interactions while situating access and heritage constraints as critical modulators.
Narrowly defined, the results underscore three main contributions: first, the delivery of planning-grade severity and susceptibility; second, the operational integration of rainfall accumulation as a feasibility layer rather than as an upstream severity driver; and third, the systematic ranking of factors through an open-source DEMATEL framework that clarifies trade-offs for tactical deployment. While the current analysis is limited to a single event and relies on provisional proxies for certain drivers, it provides a reproducible methodology indicating which key factors should be prioritized in preventive strategies.
Under a strict interpretation for proof-of-concept applied to hazards in the case of pyDEMATEL, future research should prioritize the following, in order of feasibility: (1) multi-event validation with field-based severity indices (e.g., CBI); (2) integration of short-duration rainfall intensities (I15/I30); (3) GIS interoperability for near-real-time use (export of ranked FTSPs/corridors to fire-brigade platforms); and (4) authoritative WUI and underground-utility layers to better capture spatial variability. In parallel, we will complement “avoidance of sensitive areas” with landscape-connectivity diagnostics (e.g., least-cost paths). By aligning scientific transparency with operational needs, the framework supports resilient wildfire governance, minimizes ecological disturbance, strengthens preparedness across civil protection, fire brigades, and military units, and advances alignment with SDGs 11, 13, and 15. References to SDGs indicate thematic alignment; no SDG indicator computation is attempted in this study.

6. Patents

No patents are associated with this work. All methods, datasets, intermediate products, and code were developed and released under open-source/open-data terms, in line with our transparency and reproducibility policy and the collaboration agreement with project partners. In this vein, source code is distributed under a permissive license (e.g., MIT/BSD-3-Clause) and all third-party dependencies retain their original licenses. Input and derived geospatial layers (including Sentinel-2–based indices and ancillary vectors) are shared under open-data licenses (e.g., CC BY 4.0/ODbL), with full provenance and processing metadata provided. Accordingly, there are no patent applications pending or planned, and all materials needed to reproduce the results are publicly accessible in the referenced repositories.

Supplementary Materials

The following supporting information can be downloaded at https://www.mdpi.com/article/10.3390/su172210325/s1. Figure S1 shows the pyDEMATEL solver setup for E1: the single-expert specification (RemoteSensing), the five drivers with crisp 0–4 pairwise inputs, and the exported matrices A, N, and T together with the causal diagram. Codified via reproducible rule-extraction, this snapshot records the precise configuration underpinning Table 1, enabling audit and re-run of the baseline analysis. Figure S2. Ground photograph of a high-severity burn patch on the Vesuvio slopes (August 2025): complete shrub consumption, exposed mineral soil and ash, and sparse residual stems, features consistent with the dNBR high/very-high severity classes reported in this work. Photo: USP/Fire Brigade—Province of Bolzano (2025). CC BY 4.0

Author Contributions

Conceptualization, H.A.N., R.R. and B.M.; methodology, S.P. (GIS/remote sensing workflows, raster–matrix analyses, and pyDEMATEL implementation) and H.A.N., R.R. and B.M. (territorial-planning framework and decision criteria); software, S.P. (geoprocessing scripts, cartographic automation, and pyDEMATEL implementation); validation, S.P., H.A.N., R.R. and B.M.; formal analysis, S.P.; investigation, S.P.; resources, H.A.N., R.R. and B.M.; data curation, S.P.; writing—original draft preparation, S.P.; writing—review and editing, H.A.N., R.R., B.M. and S.P.; visualization, S.P. (analytical maps and figures) and R.R., B.M. (planning-oriented cartography and diagrams); supervision, H.A.N. and R.R.; project administration, H.A.N.; funding acquisition, H.A.N. All authors have read and agreed to the published version of the manuscript.

Funding

This research received no external funding.

Institutional Review Board Statement

Not applicable. This study does not involve human participants, identifiable personal data, or live animals; it relies exclusively on open satellite/remote-sensing data (Sentinel-2) and publicly available geospatial layers. Under such conditions, an IRB/ethics review is not required by the participating institutions for non-human-subject research. For reference, the UPC Ethics Committee oversees ethical assessment for studies involving people or personal data, a scope that does not apply here. The Ordine degli Architetti di Napoli is a professional body (not an IRB) and therefore does not issue ethics approvals for non-human-subject geospatial analyses.

Informed Consent Statement

Not applicable. This study does not involve human participants or identifiable personal data. (No patients are included; therefore, written informed consent for publication is not required). The research relies exclusively on remote sensing and publicly released geospatial layers from the Copernicus Emergency Management Service (EMSR830) and official Civil Protection operational communications; no questionnaires, interviews, or experiments with human or animal subjects were conducted.

Data Availability Statement

The DEMATEL computations rely on the open-source pyDEMATEL package (BSD license) by Abderrahman Chekry, Jamal Bakkas, Mohamed Hanine, Elizabeth Caro Montero, Mirtha Silvana Garat de Marin, and Imran Ashraf, formally described in SoftwareX (2024; doi:10.1016/j.softx.2024.101889). Source code is available on GitHub and the package is distributed via PyPI; questions or suggestions may be directed to a.chekry@uca.ac.ma. (github.com).

Acknowledgments

We gratefully acknowledge, for institutional support and constructive discussions, the Agenzia per la Protezione CivileProvincia Autonoma di Bolzano/Alto Adige (USP/Vigili del Fuoco), and the public agencies that provided open datasets and services: ESA—Copernicus Open Access Hub (Sentinel-2); European Commission, JRC—Copernicus Emergency Management Service (CEMS); European Environment Agency (EEA)—Copernicus Land Monitoring Service (EU-DEM, CLMS); Ministero dell’Ambiente e della Sicurezza Energetica (MASE)/ISPRA; Regione CampaniaCentro Funzionale Multirischi di Protezione Civile; and the Ente Parco Nazionale del Vesuvio. We acknowledge the developers and maintainers of pyDEMATEL and QGIS (latest LTR) for their open-source tools that enabled this work. The author acknowledges the support of the Serra Húnter Programme of the Government of Catalonia and the Universitat Politècnica de Catalunya (UPC), under which this work has been developed.

Conflicts of Interest

The authors declare no conflicts of interest. The numerical conclusions, as well as their numerical processing, have no accountability in the role, design, collection, or interpretation of data but aims at demonstrating adequate and fine-tuned methodologies for “Valutazione Impatto Ambientale” (VIA) (Environmental Impact Assessment (EIA), “Valutazione Impatto Strategica” (VAS) (Strategic Environmental Assessment, SEA), that are derived from three branches in the process of Training and Internationalization c/o the Ordine degli Architetti Pianificatori Paesaggisti Conservatori di Napoli e Provincia: architecture of landscape, engineering for the territory and agronomy whose international commitment was characterized by former President Arch. Raffaele Sirica (1995‒1997) on the occasion of the Habitat II program by the second United Nations Conference on Human Settlements, which took place from 3 to 14 June, 1996, in Istanbul, Turkey. The Department does not promote any misconduct, e.g., 95/46/EC and Regulation (EC) No 45/2001 (EC) No 45/2001, by endorsing the reintroduction of historical components ecologically suitable, a sustainable land-use perspective, and data-extraction techniques.

Abbreviations

The following abbreviations are used in this manuscript:
DEMATELDecision-Making Trial and Evaluation Laboratory (cause–effect network modeling for criteria/indicators).
MCDAMulti-Criteria Decision Analysis (umbrella method; DEMATEL, weights/structure)
dNDVIDifferential NDVI
dNBRDifferential NBR
Rain72hCumulative precipitation over the 72 h window post-event
WUIWildland–Urban Interface
SCLScene-Classification Layer
MSIMultispectral Instrument
L2ASentinel-2 surface reflectance
QCQuality Control

References

  1. Ali, E.; Cramer, W.; Carnicer, J.; Georgopoulou, E.; Hilmi, N.J.M.; Le Cozannet, G.; Lionello, P. Cross-Chapter Paper 4: Mediterranean region. In Climate Change 2022: Impacts, Adaptation and Vulnerability (IPCC AR6 WGII); Pörtner, H.O., Roberts, D.C., Tignor, M., Poloczanska, E.S., Mintenbeck, K., Alegría, A., Rama, B., Eds.; Cambridge University Press: Cambridge, UK, 2022; Available online: https://www.ipcc.ch/report/ar6/wg2/chapter/ccp4/ (accessed on 19 September 2025).
  2. Mobaraki, A.; Nikoofam, M.; Mobaraki, B. The Nexus of Morphology and Sustainable Urban Form Parameters as a Common Basis for Evaluating Sustainability in Urban Forms. Sustainability 2025, 17, 3967. [Google Scholar] [CrossRef]
  3. San-Miguel-Ayanz, J.; Durrant, T.; Boca, R.; Maianti, P.; Libertà, G.; Jacome Felix Oom, D.; Branco, A.; De Rigo, D.; Suarez-Moreno, M.; Ferrari, D.; et al. Forest Fires in Europe, Middle East and North Africa 2022; Publications Office of the European Union: Luxembourg, 2023. [Google Scholar] [CrossRef]
  4. Cervelli, E.; Pindozzi, S. The Historical Transformation of Peri-Urban Land Use Patterns, via Landscape GIS-Based Analysis and Landscape Metrics, in the Vesuvius Area. Appl. Sci. 2022, 12, 2442. [Google Scholar] [CrossRef]
  5. Alayan, R.; Lakner, Z. Utilizing Comprehensive Criteria and Indicators for Post-Fire Forest Restoration in Spatial Decision Support Systems (SDSS). Forests 2024, 15, 386. [Google Scholar] [CrossRef]
  6. Mobaraki, B.; Ma, H.; Lozano Galant, J.A.; Turmo, J. Structural Health Monitoring of 2D Plane Structures. Appl. Sci. 2021, 11, 2000. [Google Scholar] [CrossRef]
  7. Szpakowski, D.M.; Jensen, J.L.R. A review of the applications of remote sensing in fire ecology. Remote Sens. 2019, 11, 2638. [Google Scholar] [CrossRef]
  8. Fernández-García, V.; Quintano, C.; Taboada, A.; Marcos, E.; Fernández-Manso, A. Soil–vegetation relationships in Mediterranean forests after fire. For. Ecosyst. 2021, 8, 18. [Google Scholar] [CrossRef]
  9. Soriano, R.P.; Mobaraki, B.; Lozano-Galant, J.A.; Sanchez-Cambronero, S.; Muñoz, F.P.; Gutierrez, J.J. New Image Recognition Technique for Intuitive Understanding in Class of the Dynamic Response of High-Rise Buildings. Sustainability 2021, 13, 3695. [Google Scholar] [CrossRef]
  10. Lee, K.; van Leeuwen, W.J.D.; Gillan, J.K.; Falk, D.A. Examining the impacts of pre-fire forest conditions on burn severity under variable weather controls. Remote Sens. 2024, 16, 1803. [Google Scholar] [CrossRef]
  11. United Nations Office for Disaster Risk Reduction. Words into Action: Implementation Guide for Land Use and Urban Planning. UNDRR. 2022. Available online: https://www.undrr.org/words-into-action/implementation-guide-land-use-and-urban-planning (accessed on 19 September 2025).
  12. Lozano-Galant, F.; Porras, R.; Mobaraki, B.; Calderón, F.; Gonzalez-Arteaga, J.; Lozano-Galant, J.A. Enhancing Civil Engineering Education through Affordable AR Tools for Visualizing BIM Models. J. Civ. Eng. Educ. 2024, 150, 05024003. [Google Scholar] [CrossRef]
  13. Miller, J.D.; Thode, A.E. Quantifying burn severity in a heterogeneous landscape with a relative version of the dNBR. Remote Sens. Environ. 2007, 109, 66–80. [Google Scholar] [CrossRef]
  14. United Nations Office for Outer Space Affairs (UN-SPIDER). (n.d.). Recommended Practice: Burn Severity with Python and Optical Data (Sentinel-2). Available online: https://www.un-spider.org/advisory-support/recommended-practices/recommended-practice-burn-severity/Step-by-Step/python-sentinel2 (accessed on 19 September 2025).
  15. Morresi, D.; Marzano, R.; Lingua, E.; Motta, R.; Garbarino, M. Mapping burn severity in the western Italian Alps through phenologically coherent reflectance composites derived from Sentinel-2 imagery. Remote Sens. Environ. 2022, 269, 112800. [Google Scholar] [CrossRef]
  16. Elliott, S. Proof of Concept Research. Philos. Sci. 2021, 88, 258–280. [Google Scholar] [CrossRef]
  17. Ye, Z.; Wang, Y.; Zhao, X.; Wang, Y.; Liao, J.; Min, J.; Gong, X.; Wang, D.; Gong, Z. The hidden carbon cost of forest fire management: Quantifying greenhouse gas emissions from both vegetation burning and social rescue activities in Yajiang County, China. Forests 2025, 16, 803. [Google Scholar] [CrossRef]
  18. European Space Agency. Sentinel-2 User Handbook. ESA. 2015. Available online: https://sentinels.copernicus.eu/documents/247904/685211/Sentinel-2_User_Handbook (accessed on 19 September 2025).
  19. Jenson, S.K.; Domingue, J.O. Extracting topographic structure from digital elevation data for geographic information system analysis. Photogramm. Eng. Remote Sens. 1988, 54, 1593–1600. [Google Scholar]
  20. Hosseinzadehfard, E.; Mobaraki, B. Corrosion Performance and Strain Behavior of Reinforced Concrete: Effect of Natural Pozzolan as Partial Substitute for Microsilica in Concrete Mixtures. Structures 2025, 79, 109397. [Google Scholar] [CrossRef]
  21. Zevenbergen, L.W.; Thorne, C.R. Quantitative analysis of land surface topography. Earth Surf. Process. Landf. 1987, 12, 47–56. [Google Scholar] [CrossRef]
  22. Key, C.H.; Benson, N.C. Landscape assessment: Ground measure of severity (Composite Burn Index) and remote sensing of severity (Normalized Burn Ratio). In FIREMON: Fire Effects Monitoring and Inventory System (RMRS-GTR-164); Lutes, D.C., Keane, R.E., Caratti, J.F., Key, C.H., Benson, N.C., Sutherland, S., Gangi, L.J., Eds.; U.S. Department of Agriculture, Forest Service, Rocky Mountain Research Station: Washington, DC, USA, 2006. [Google Scholar]
  23. Yang, X.; Melachrinoudis, E.; Kubat, P.; Smith, J.M. Fireline path optimisation in a heterogeneous forest landscape. Int. J. Wildland Fire 2022, 31, 1068–1079. [Google Scholar] [CrossRef]
  24. Mobaraki, B.; Lozano-Galant, F.; Soriano, R.P.; Pascual, F.J.C. Application of Low-Cost Sensors for Building Monitoring: A Systematic Literature Review. Buildings 2021, 11, 336. [Google Scholar] [CrossRef]
  25. Si, S.L.; You, X.Y.; Liu, H.C.; Zhang, P. DEMATEL technique: A systematic review of the state-of-the-art literature on methodologies and applications. Math. Probl. Eng. 2018, 2018, 3696457. [Google Scholar] [CrossRef]
  26. Maria, P.; Gitas, I.; Mettas, C.; Tzouvaras, M.; Themistocleous, K.; Konstantinidis, A.; Pamboris, A.; Hadjimitsis, D. Remote-Sensing-Based Prioritization of Post-Fire Restoration Actions in Mediterranean Ecosystems: A Case Study in Cyprus. Remote Sens. 2025, 17, 1269. [Google Scholar] [CrossRef]
  27. Boroujeni, S.P.H.; Razi, A.; Khoshdel, S.; Afghah, F.; Coen, J.L.; O’neill, L.; Fule, P.; Watts, A.; Kokolakis, N.-M.T.; Vamvoudakis, K.G. A comprehensive survey of research towards AI-enabled unmanned aerial systems in pre-, active-, and post-wildfire management. Inf. Fusion 2024, 108, 102369. [Google Scholar] [CrossRef]
  28. Yavuz, M.; Tufekcioglu, M. Assessment of Flood-Induced Geomorphic Changes in Sidere Creek of the Mountainous Basin Using Small UAV-Based Imagery. Sustainability 2023, 15, 11793. [Google Scholar] [CrossRef]
  29. Safariallahkheili, Q.; Schiewe, J.; Meier, S. Post-Hoc Explanation of AI Predictions in Wildfire Risk Mapping Through an Interactive Web-Based GeoXAI System. KN—J. Cartogr. Geogr. Inf. 2025, 75, 143–158. [Google Scholar] [CrossRef]
  30. Qin, R.; Shi, C.; Yu, T.; Ding, C.; Ren, X.; Xiao, J. Analysis of Factors Influencing Fire Accidents in Commercial Complexes Based on WSR-DEMATEL-ISM Model. Fire 2024, 7, 224. [Google Scholar] [CrossRef]
  31. Ministry of Culture (MiC). SITAP—Environmental and Landscape Territorial Information System: National Database of Landscape Constraints. Rome, Italy, 1996–ongoing. Available online: https://cultura.gov.it/sitap-sistema-informativo-territoriale-ambientale-e-paesaggistico (accessed on 20 September 2025).
  32. European Environment Agency (EEA). Natura 2000 Data the European Network of Protected Sites. 2025. Available online: https://www.eea.europa.eu/en/datahub/datahubitem-view/6fc8ad2d-195d-40f4-bdec-576e7d1268e4 (accessed on 20 September 2025).
  33. UNESCO World Heritage Centre. Archaeological Areas of Pompei, Herculaneum and Torre Annunziata (WHC List No. 829). Available online: https://whc.unesco.org/en/list/829/ (accessed on 20 September 2025).
  34. Harris, C.R.; Millman, K.J.; van der Walt, S.J.; Gommers, R.; Virtanen, P.; Cournapeau, D.; Wieser, E.; Taylor, J.; Berg, S.; Smith, N.J.; et al. Array programming with NumPy. Nature 2020, 585, 357–362. [Google Scholar] [CrossRef]
  35. Jordahl, K.; den Bossche, J.V.; Wasserman, J.; McBride, J.; Fleischmann, M.; Gerard, J.; Tratner, J.; Perry, M.; Farmer, C.; Hjelle Geir, A.; et al. GeoPandas: Python Tools for Geographic Data; Zenodo: Geneva, Switzerland, 2020. [Google Scholar] [CrossRef]
  36. Chekry, A.; Bakkas, J.; Hanine, M.; Caro Montero, E.; Garat de Marin, M.S.; Ashraf, I. PyDEMATEL: A Python-based tool implementing DEMATEL and fuzzy DEMATEL methods for improved decision making. SoftwareX 2024, 28, 101889. [Google Scholar] [CrossRef]
  37. Kluyver, T.; Ragan-Kelley, B.; Pérez, F.; Granger, B.E.; Bussonnier, M.; Frederic, J.; Kelley, K.; Hamrick, J.; Grout, J.; Corlay, S.; et al. Jupyter notebooks a publishing format for reproducible computational workflows. In Positioning and Power in Academic Publishing: Players, Agents and Agendas; Loizides, F., Schmidt, B., Eds.; IOS Press: Amsterdam, The Netherlands, 2016; pp. 87–90. [Google Scholar] [CrossRef]
  38. Polverino, S. Short-Term Burn Severity differentiated Sentinel-2 computation in Segesta area park: LR16/96 Shrubland Heritage Vegetation Multi-Index AHP method. In Convergence of Contemporary Thought in Architecture, Urbanism, and Heritage Studies; Cinius Yayınları Publication: İstanbul, Turkey, 2023; pp. 182–216. [Google Scholar] [CrossRef]
  39. Baddeley, A.; Rubak, E.; Turner, R. Spatial Point Patterns: Methodology and Applications with R; Chapman & Hall/CRC: Boca Raton, FL, USA, 2015. [Google Scholar]
  40. Bridson, R. Fast Poisson disk sampling in arbitrary dimensions. In ACM SIGGRAPH 2007 Sketches; ACM: New York, NY, USA, 2007. [Google Scholar]
  41. Robertson, B.L.; Brown, J.A.; McDonald, T.; Joy, M.K. Ecological applications of balanced acceptance sampling. Methods Ecol. Evol. 2013, 4, 415–423. [Google Scholar] [CrossRef]
  42. Grafström, A.; Tillé, Y. Doubly balanced spatial sampling with spreading and restitution of auxiliary totals. Environmetrics 2012, 24, 120–131. [Google Scholar] [CrossRef]
  43. Muñoz-Sabater, J.; Dutra, E.; Agustí-Panareda, A.; Albergel, C.; Arduini, G.; Balsamo, G.; Boussetta, S.; Choulga, M.; Harrigan, S.; Hersbach, H.; et al. ERA5-Land: A state-of-the-art global reanalysis dataset for land applications. Earth Syst. Sci. Data 2021, 13, 4349–4383. [Google Scholar] [CrossRef]
  44. Copernicus Climate Data Store (C3S). (n.d.). ERA5-Land Hourly Data from 1950 to Present (Dataset). Available online: https://cds.climate.copernicus.eu/datasets/reanalysis-era5-land (accessed on 20 September 2025).
  45. Cornes, R.C.; van der Schrier, G.; van den Besselaar, E.J.M.; Jones, P.D. An ensemble version of the E-OBS temperature and precipitation datasets. J. Geophys. Res. Atmos. 2018, 123, 9391–9409. [Google Scholar] [CrossRef]
  46. 46. European Climate Assessment & Dataset (ECA&D). (n.d.). E-OBS Gridded Dataset (Access Portal). Available online: https://www.ecad.eu/E-OBS/ (accessed on 20 September 2025).
  47. ECMWF. (n.d.). ERA5-Land: Data Documentation. Available online: https://confluence.ecmwf.int/display/CKB/ERA5-Land%3A%2Bdata%2Bdocumentation (accessed on 20 September 2025).
  48. Legendre, P.; Legendre, L. Numerical Ecology, 3rd English ed.; Elsevier: Amsterdam, The Netherlands, 2012. [Google Scholar]
  49. Van Gerrevink, M.J.; Veraverbeke, S. Evaluating the hyperspectral sensitivity of the differenced normalized burn ratio for assessing fire severity. Remote Sens. 2021, 13, 4611. [Google Scholar] [CrossRef]
  50. Jolliffe, I.T.; Cadima, J. Principal component analysis: A review and recent developments. Philos. Trans. R. Soc. A 2016, 374, 20150202. [Google Scholar] [CrossRef] [PubMed]
  51. Clarke, K.R. Non-parametric multivariate analyses of changes in community structure. Aust. J. Ecol. 1993, 18, 117–143. [Google Scholar] [CrossRef]
  52. Peng, R.D. Reproducible research in computational science. Science 2011, 334, 1226–1227. [Google Scholar] [CrossRef] [PubMed]
  53. National Institute of Standards and Technology (NIST). FIPS PUB 180-4: Secure Hash Standard (SHS); U.S. Department of Commerce: Washington, DC, USA, 2015. [Google Scholar]
  54. Diakakis, M.; Mavroulis, S.; Vassilakis, E.; Chalvatzi, V. Debris-flow likelihood in Mediterranean post-fire environments. Land 2023, 12, 555. [Google Scholar] [CrossRef]
  55. Kpadé, C.P.; Tamini, L.D.; Pepin, S.; Khasa, D.P.; Abbas, Y.; Lamhamedi, M.S. Evaluating Multi-Criteria Decision-Making Methods for Sustainable Management of Forest Ecosystems: A Systematic Review. Forests 2024, 15, 1728. [Google Scholar] [CrossRef]
  56. Mobaraki, B.; Vaghefi, M. Numerical Study of the Depth and Cross-Sectional Shape of Tunnel under Surface Explosion. Tunn. Undergr. Space Technol. 2015, 47, 114–122. [Google Scholar] [CrossRef]
  57. Diwakar, K.C.; Naqvi, M.W.; Hu, L. Post-wildfire debris flows triggered by intense rainfall: Case study and modelling. Water 2024, 16, 1285. [Google Scholar] [CrossRef]
  58. Lin, C.-J.; Wu, W.-W. A causal analytical method for group decision-making under fuzzy environment. Expert Syst. Appl. 2008, 34, 205–213. [Google Scholar] [CrossRef]
  59. Landscape Toolbox. Normalized Burn Ratio: Class Definitions and Ranges. Available online: https://landscapetoolbox.org (accessed on 20 September 2025).
  60. NV5 Geospatial. Burn Indices Tutorial (FIREMON/USGS Class Thresholds). Available online: https://nv5geospatialsoftware.com (accessed on 19 September 2025).
  61. Spearman, C. The proof and measurement of association between two things. Am. J. Psychol. 1904, 15, 72–101. [Google Scholar] [CrossRef]
  62. Efron, B. Bootstrap methods: Another look at the jackknife. Ann. Stat. 1979, 7, 1–26. [Google Scholar] [CrossRef]
  63. Lee, H.S.; Tzeng, G.H.; Yeih, W.; Wang, Y.J. Revised DEMATEL: Resolving the infeasibility of DEMATEL. Appl. Math. Model. 2013, 37, 6746–6757. [Google Scholar] [CrossRef]
  64. Alinezhad, A.; Khalili, J. DEMATEL method. In New Methods and Applications in Multiple Attribute Decision Making (MADM); Springer: Berlin/Heidelberg, Germany, 2019; pp. 103–108. [Google Scholar] [CrossRef]
  65. Nyimbili, P.H.; Erden, T.; Mwanaumo, E.M. A DEMATEL-Based Approach of Multi-Criteria Evaluation for Urban Fire and Emergency Facilities. Front. Environ. Econ. 2023, 2, 1198541. [Google Scholar] [CrossRef]
  66. Eidenshink, J.C.; Schwind, B.; Brewer, K.; Zhu, Z.; Quayle, B.; Howard, S. A Project for Monitoring Trends in Burn Severity. Fire Ecol. 2007, 3, 3–21. [Google Scholar] [CrossRef]
  67. Moriasi, D.N.; Arnold, J.G.; van Liew, M.W.; Bingner, R.L.; Harmel, R.D.; Veith, T.L. Model Evaluation Guidelines for System-atic Quantification of Accuracy in Watershed Simulations. Trans. ASABE 2007, 50, 885–900. [Google Scholar] [CrossRef]
  68. Gupta, H.V.; Kling, H.; Yilmaz, K.K.; Martinez, G.F. Decomposition of the Mean Squared Error and NSE Performance Criteria: Implications for Improving Hydrological Modelling. J. Hydrol. 2009, 377, 80–91. [Google Scholar] [CrossRef]
  69. Xu, K.; Li, S.; Liu, J.; Lu, C.; Xue, G.; Xu, Z.; He, C. Evaluation Cloud Model of Spontaneous Combustion Fire Risk in Coal Mines by Fusing Interval Gray Number and DEMATEL. Sustainability 2022, 14, 15585. [Google Scholar] [CrossRef]
  70. Thompson, M.P.; O’Connor, C.D.; Gannon, B.M.; Caggiano, M.D.; Dunn, C.J.; Schultz, C.A.; Calkin, D.E.; Pietruszka, B.; Greiner, S.M.; Stratton, R.; et al. Potential operational delineations: New horizons for proactive, risk-informed strategic land and fire management. Fire Ecol. 2022, 18, 17. [Google Scholar] [CrossRef]
  71. Nunes, A.N.; Pinto, C.D.; Figueiredo, A.; Lourenço, L. Planning Wildfire Evacuation in the Wildland–Urban Interfaces of Central Portugal. Fire 2024, 7, 199. [Google Scholar] [CrossRef]
  72. European Commission. Joint Research Centre. In Manual for CEMS-Rapid Mapping Products: Valid for the Portfolio Since April 2019, Status 31 August 2020; Publications Office: Luxembourg, 2020; Available online: https://data.europa.eu/doi/10.2760/29876 (accessed on 19 September 2025).
  73. Bektaş, T.; Laporte, G. The pollution-routing problem. Transp. Res. Part B Methodol. 2011, 45, 1232–1250. [Google Scholar] [CrossRef]
  74. Tarquini, S.; Isola, I.; Favalli, M.; Battistini, A.; Dotta, G. TINITALY, A Digital Elevation Model of Italy with A 10 Meters Cell Size (Version 1.1) [Dataset]; Istituto Nazionale di Geofisica e Vulcanologia (INGV): Naples, Italy, 2023. [Google Scholar] [CrossRef]
  75. European Environment Agency. EMEP/EEA Air Pollutant Emission Inventory Guidebook 2023: Technical Guidance to Prepare National Emission Inventories; European Environment Agency: Copenhagen, Denmark, 2023. [Google Scholar]
Figure 1. National–regional frame and heritage visual corridors governing siting around Vesuvius (Natura 2000). The base map shows Sentinel-2 imagery (July 2025) with major roads, municipal boundaries, and Natura 2000 polygons. Coordinate system: ETRS89/UTM Zone 33N. Annotations indicate key settlements (Torre del Greco, Ercolano, and Pompeii), the main crater, and protected visual corridors.
Sustainability 17 10325 g001
Figure 2. End-to-end workflow linking inputs and pre/post pairing to factor derivation and 3-D front descriptors, then to a DEMATEL-based representation of systemic drivers and the Fireline Tactical Support Points (FTSPs) module for operational readiness; Rain72h is handled as an exogenous feasibility constraint. Abbreviations: L3D—length of the 3-D fire front; S3D—sinuosity of the 3-D fire front; and FTSP—fire-truck staging points.
Sustainability 17 10325 g002
Figure 3. Burn severity (dNBR) distribution and observed fire fronts within the burn perimeter (dNBR > 0.10), Vesuvius National Park, 2025–08–09 14:30 UTC.
Sustainability 17 10325 g003
Figure 4. Precipitation (mm) annotated at suppression points inside the dNBR-derived burn boundary.
Sustainability 17 10325 g004
Figure 5. Transect−based dNDVI diagnostics (A–D) over Vesuvius National Park (ETRS89/UTM 33N; T33TVF; R079; baseline N0511). Pink bars: dNDVI frequency; black curve: smoothed longitudinal trend; and vertical guides: zero-change and operational cut-offs. Operational translation: promote near-zero dNDVI with S3D ≤ 11.6 and L3D/L2D ≤ 3.16; condition where 11.6 < S3D ≤ 38.1 or L3D/L2D > 3.16; de-prioritize where dNDVI is strongly negative or S3D > 38.1 (local extremes ≈ 65.1).
Sustainability 17 10325 g005
Figure 6. (a) Section 1: Major peak near 1.55 km (≈6 × 10³) and minor peaks < 1 km; smoothed profile weakly declining. (b) Section 2: major hotspot at ~0.45 km (≈2.4 × 10³), central sector subdued (1.2–2.0 km), and minor spikes reappear toward 3.0 km. (c) Section 3: (0–2.8 km): dominant spike at ~1.55 km (≈5.8 × 10³ counts), secondary peaks < 1.0 km, and dNDVI trend gently declines (~700 → ~450). (d) Section 4: early extreme at 0.45 km (≈ 2.5 × 10³), central sector subdued, step-down of the smoothed profile around 1.8 km, and late clusters at 2.3–2.9 km (≤ 9 × 10²).
Sustainability 17 10325 g006
Figure 7. Three-dimensional line length (L3D). Wildfire front lines (Front_01–Front_12) are characterized by the cumulative length across all fronts, which equals 4.97 × 10⁴ units. The longest front is Front_02 with L3D = 2.76 × 10⁴ units, whereas the shortest is Front_11 with L3D = 3.16 × 10² units (per-front median: 2.71 × 10³ units). On average, L3D exceeds the planar length by 216% (i.e., L3D/L2D ≈ 3.16) as vertical gain.
Sustainability 17 10325 g007
Figure 8. Spatial 3D sinuosity histograms. Wildfire front lines (S3D = L3D/D3D) having values spanning 1.00–65.1 (median 1.54, mean 12.4; Q1 = 1.02, Q3 = 11.6, P90 = 38.1); the minimum occurs at Front_03 (S3D = 1.00) and the maximum at Front_09 (S3D = 65.1). While most fronts exhibit mild 3D tortuosity (median ≈ 1.54), the heavy upper tail indicates a subset of highly tortuous geometries likely influenced by terrain complexity.
Sustainability 17 10325 g008
Figure 9. PCA projection of FTSP candidate points along severity and logistics gradients.
Sustainability 17 10325 g009
Figure 10. Visual summary of the DEMATEL results for E1. (A) shows the total-relation matrix T for scenario E1, in which each cell encodes the overall (direct + indirect) influence from the row factor to the column factor after normalization; darker shades indicate stronger influence (diagonal entries in T can be >0 because of indirect paths). Specifically, in E1, the darkest interactions concentrate between dNBR and dNDVI and in the CHD column, foreshadowing the high prominence of the spectral indices and CHD’s receiver role, as seen in Panels (B,C). (A) Total-relation matrix T: rows = causes; columns = effects; and darker = stronger influence. (B) summarizes factor prominence (D = r + c) and net causality (P = r − c) derived from the total-relation matrix for E1. dNBR and dNDVI are the most prominent factors (D ≈ 8.62 and 8.40) and act as slight net drivers (P ≈ +0.625 and +0.396); CHD is central but a mild receiver (P ≈ −0.125). RAIN behaves as a stronger receiver (P ≈ −0.875), DISTSTREAM plays a minor role (D ≈ 1.31), and WUID is negligible/near−neutral. (B) Prominence D (higher = more influential) and net causality P (right = driver; left = receiver), computed from T = N (IN)−1 for scenario E1; bar lengths are linearly scaled for display, while numeric labels report raw values. (C) DEMATEL cause–effect structure for scenario E1 is visualized according to the node size, which reflects prominence (D) and node colour encoding net causality (P: blue = driver, red = receiver). dNBR and dNDVI emerge as the most prominent drivers directing influence toward CHD; CHD is central yet a net receiver, while RAIN and DISTSTREAM act as mild receivers, and WUID is marginal/near-neutral. (C) Cause–effect graph: node size = prominence D; node color = net causality P; and edges for Tijθ, θ = mean (T). Factor−wise D and P with 95% bootstrap CIs.
Sustainability 17 10325 g010
Figure 11. E1 Baseline DEMATEL (n = 32): direct-influence heatmap (rows = causes; columns = effects), showing remote-sensing evidence for rule stability. The pattern remains stable under standard normalization and graph thresholds (mean (T) and Q75 (T)).
Sustainability 17 10325 g011
Figure 12. (a) E2 dNBR ≥ Moderate–Low (≥0.27): a clear remote-sensing coupling emerges where dNBR ↔ dNDVI reaches the maximum bin (=4), indicating tight coherence between burn severity and vegetation loss under the high-severity regime. CHD shows moderate dispatching/receiving (mostly 1–2), suggesting an operational/access signal that is present but not dominant; RAIN exhibits selective links (e.g., RAIN → CHD), consistent with meteorological modulation of accessibility and fuel moisture. WUID is zero throughout (field constant in the dataset), while DISTSTREAM remains weak to moderate at most. (b) E3 dNBR < Moderate–Low (<0.27): the dNBR ↔ dNDVI coupling remains maximal (=4), confirming that vegetation loss and burn severity co-vary tightly in the low-severity fringe. Outside this RS core, most off-diagonal entries are ≤2, with CHD acting as a weak dispatcher/receiver (1–2) toward {dNBR, dNDVI} and RAIN → CHD being negligible or absent, indicating limited meteorological modulation of accessibility in this subset. DISTSTREAM shows only localized moderate links (≤2) occasionally toward CHD or dNBR while WUID is null (constant field). Overall, E3 depicts a network dominated by vegetation–severity relations, with operational/access and hydro-proximity factors playing secondary, spatially patchy roles. (c) E4 Presidio-proxy (CHD ≤ Q1): subset restricted to the most accessible 25% of sites (CHD ≤ Q1 = 4.0; n = 10), used as a proxy for operational presidio conditions. The dNBR ↔ dNDVI coupling remains maximal (cell = 4), while CHD becomes central on the receiving side (visible column intensity) and shows weak–moderate dispatching toward RAIN and DISTSTREAM consistent with intervention/access patterns; WUID stays null (constant field). (d) E5 Non-presidio (CHD > Q1): subset includes the less-accessible 75% of sites (CHD > Q1 = 4.0; n = 22). The dNBR ↔ dNDVI coupling remains maximal (cells = 4), while the operational/access signal of CHD weakens relative to E4 (mostly 1–2 on both incoming and outgoing links). DISTSTREAM shows localized moderate interactions with {dNBR, CHD} (≤2), consistent with drainage constraints where access is poorer; RAIN effects are limited and WUID remains null (constant field). (e) E6 Near streams (DISTSTREAM ≤ Q1): subset contains the closest 25% of sites to the drainage network (DISTSTREAM ≤ Q1 ≈ −0.018 in this proxy field; n = 8). The dNBR ↔ dNDVI coupling remains maximal (4), while near-channel contexts show strong reciprocity involving DISTSTREAM and RAIN and moderate CHD links patterns consistent with access and moisture/barrier effects in riparian zones; WUID stays null (constant field). Note: associations with DISTSTREAM reflect a provisional proxy and should be re-checked with the real distance-to-stream layer. (f) E7 Far from streams (DISTSTREAM1 ≥ Q3): subset contains the farthest 25% of sites from the drainage network (DISTSTREAM1 ≥ Q3 ≈ 0.044 in this proxy field; n = 8). The dNBR ↔ dNDVI coupling remains maximal (=4), while DISTSTREAM shows strengthened reciprocity with {dNBR, dNDVI, CHD} (typically ≈ 3), and RAIN couplings are weak patterns consistent with the loss of riparian “wet-line” effects far from channels. WUID stays null (constant field). Note: associations involving DISTSTREAM reflect a provisional proxy and should be confirmed with the actual distance-to-stream layer. (g) E8 Bootstrap consensus (mean, B = 1000): built by resampling all records with replacement (n = 32) B = 1000 times; at each draw we recomputed the 6 × 6 direct matrix. The dNBR ↔ dNDVI relation remains consistently dominant (~3.5–4), CHD shows weak–moderate roles (~1–2), RAIN couplings are limited, WUID stays null (constant field), and DISTSTREAM is generally weak (proxy field). With reproducible rule-extraction in mind, E8 highlights a stable RS-driven backbone with operational/hydro factors acting as secondary modulators.
Sustainability 17 10325 g012
Figure 13. Prominence (centrality) by factor. Bars report D = R + C computed from the total-relation matrix T (Equation (2)); higher D indicates greater overall involvement (given + received influence). Remote-sensing indices (dNBR, dNDVI) lead, CHD is intermediate, RAIN and DISTSTREAM are lower, and WUID is ~0 (structural zero/negative control).
Sustainability 17 10325 g013
Figure 14. Causality by factor. Bars report P = RC from T; P > 0 denotes net causes (→) and P < 0 net effects (←). dNBR and dNDVI act as slight net causes; CHD is a clear net effect; RAIN is a mild net effect; DISTSTREAM is near-neutral; and WUID remains ~0.
Sustainability 17 10325 g014
Table 1. Direct matrix for E1.
RAINdNBRdNDVICHDWUIDDISTSTREAM
RAIN000200
dNBR104100
dNDVI040100
CHD211001
WUID *000000
DISTSTREAM000100
* The driver is intended as a negative-control predictor; aij: direct influence (row → column) on a 0–4 anchored scale, where 0 = none (no plausible direct effect), 1 = weak (rare/minor, context-contingent), 2 = moderate (noticeable under typical conditions), 3 = strong (material in most conditions), and 4 = very strong (dominant/controlling influence).
Disclaimer/Publisher’s Note: The statements, opinions and data contained in all publications are solely those of the individual author(s) and contributor(s) and not of MDPI and/or the editor(s). MDPI and/or the editor(s) disclaim responsibility for any injury to people or property resulting from any ideas, methods, instructions or products referred to in the content.