Article

Life Cycle Assessment of Greenhouse Gas Emissions in Hydrogen Production via High-Calorific Mixed Waste Gasification

Energy Environment Research Center, Institute for Advanced Engineering, Yongin-si 17180, Republic of Korea
*
Author to whom correspondence should be addressed.
Sustainability 2025, 17(22), 10308; https://doi.org/10.3390/su172210308
Submission received: 7 August 2025 / Revised: 5 November 2025 / Accepted: 14 November 2025 / Published: 18 November 2025
(This article belongs to the Section Energy Sustainability)

Abstract

This study evaluates the environmental sustainability of hydrogen production from high-calorific mixed waste gasification through a Gate-to-Gate (GtG) Life Cycle Assessment (LCA) based on operational data from a 2 TPD pilot plant. The Global Warming Potential (GWP) was calculated to be 9.80 kg CO2-eq per kg of H2 produced. A contribution analysis identified the primary environmental hotspots as external electricity consumption (37.0%), chelated iron production for syngas cleaning (19.5%), externally supplied oxygen 18.6%), and plant construction (12.3%). A comparative analysis, contextualized within South Korea’s energy structure, demonstrates this GWP is competitive with regionally contextualized Steam Methane Reforming (SMR) and lower than coal gasification. Furthermore, a scenario analysis based on national energy policies reveals a clear pathway for GWP reduction. Aligning with the 2030 renewable energy target (20% RE share) reduces the GWP to 9.14 kg CO2-eq, while a full transition to 100% wind power lowers it to 6.27 kg CO2-eq. These findings establish this Waste-to-Hydrogen (WtH) technology as a promising transitional solution that simultaneously valorizes problematic waste. This research provides a critical empirical benchmark for the technology’s commercialization and establishes an internationally transferable framework. It confirms that the technology’s ultimate environmental sustainability is intrinsically linked to the decarbonization of the local electricity grid.

1. Introduction

Globally, energy consumption is continuously increasing, driven by economic and population growth, which has led to severe environmental problems. The fossil fuel-centric energy system, in particular, has been identified as a primary contributor to global warming and climate change due to its substantial greenhouse gas (GHG) emissions [1]. In response, the transition to a sustainable energy system has emerged as a global imperative. Hydrogen is gaining significant attention as a key clean energy carrier for achieving a carbon-neutral society. Currently, the majority of commercially produced hydrogen relies on Steam Methane Reforming (SMR) of natural gas, which accounts for approximately 67% of total global production; however, this process is constrained by its significant carbon dioxide emissions [2,3]. Consequently, there is a pressing need for the development of low-carbon hydrogen production technologies. Among these alternatives, Waste-to-Energy (WtE) technologies that produce hydrogen from waste resources are gaining prominence. WtE technologies offer more than simple waste disposal; they utilize waste as an energy source. This approach provides the dual benefit of addressing environmental issues while simultaneously securing energy resources [4,5].
Among WtE technologies, gasification is a thermochemical conversion process. It transforms solid waste into synthesis gas (syngas)—a mixture composed mainly of hydrogen and carbon monoxide—through high-temperature reactions under oxygen-limited conditions [6]. This syngas can be converted into high-purity hydrogen through a reforming process, used as a feedstock for various chemical products such as methanol and ammonia, or utilized for electricity generation. In this respect, gasification technology is a key enabling technology for the circular economy, aligning with its core principles of waste elimination and material circulation. Specifically, it transforms non-recyclable waste into a versatile chemical feedstock (syngas). This process reintegrates materials into the value chain at a higher value than energy recovery from simple incineration [7,8]. While waste gasification is emerging as a promising alternative for hydrogen production, its commercialization and widespread adoption necessitate an objective and quantitative assessment of its environmental sustainability.
Life Cycle Assessment (LCA) is a standardized methodology for holistically evaluating the potential environmental impacts of a product or service throughout its entire life cycle. While numerous LCA studies have evaluated gasification using feedstocks like biomass, municipal solid waste, and plastic waste, these assessments often reveal significant variability rather than a clear consensus [9,10,11,12,13,14,15]. The results are shown to be highly dependent on the chosen gasification technology, the defined system boundary, and, critically, the carbon intensity of the electricity mix utilized. These studies highlight a crucial research gap: there is a notable scarcity of in-depth LCA studies based on empirical operational data from integrated pilot-scale plants. Pilot-scale research is crucial as it bridges the gap between laboratory-scale and commercial-scale plants. This approach enables a more realistic environmental assessment by reflecting actual operational parameters and efficiencies [16]. Furthermore, few studies have been tailored to the specific domestic context of South Korea, a nation with a unique, carbon-intensive energy structure [17].
Therefore, this study aims to address this gap by performing a comprehensive LCA of a 2 TPD high-calorific mixed waste gasification pilot plant, grounded in actual operational data. This study adopts a ‘gate-to-gate’ system boundary, encompassing all processes from the feeding of high-calorific mixed waste to the final production of hydrogen, including the plant construction phase. The objectives of this research extend beyond a simple GWP calculation. This research aims to (1) establish a critical empirical benchmark for future scaling and commercialization by identifying real-world environmental hotspots from pilot-scale operations. Further objectives include (2) quantifying the GWP reduction potential through scenario analysis based on South Korean national energy policies, and (3) providing an internationally transferable framework by conducting a comparative analysis against conventional technologies (e.g., SMR) within a specific regional energy context.
This paper is structured as follows: Section 2 details the pilot plant’s system configuration and the LCA methodology. Section 3 presents the quantitative results, including the baseline GWP, the primary hotspot analysis, and the results of the improvement scenario and sensitivity analyses. Section 4 provides a detailed discussion by interpreting these hotspots, benchmarking the technology’s performance within the South Korean regional context, and addressing the study’s methodological limitations. Finally, Section 5 concludes the paper by summarizing the key findings and providing a framework for future research.

2. Methods

2.1. System Description: Gasification Pilot Plant and Process

The system under investigation in this study is based on a pilot-scale gasification plant with a processing capacity of 2 tons per day (TPD), designed and operated to produce hydrogen-rich syngas from high-calorific mixed waste. The entire system is composed of sequential process stages, from waste feeding to the final hydrogen separation step. The process is configured to maximize hydrogen yield and purity. As illustrated in Figure 1, the integrated process consists of (1) a waste feeding system, (2) a gasifier, (3) a syngas cleaning system, (4) a syngas reforming system, and (5) a virtually applied Pressure Swing Adsorption (PSA) system for hydrogen separation. Collected high-calorific mixed waste is converted into syngas in the gasification reactor, which then undergoes dust removal, desulfurization, and dechlorination in the cleaning system. The purified syngas is reformed into an H2-rich gas in the reforming system (Water-Gas Shift), and finally, the PSA unit separates high-purity hydrogen of over 99.9%. Process simulations based on heat and mass balance calculations were conducted to determine the design specifications for each unit, leading to the construction of the 2 TPD-class gasifier and hydrogen production pilot plant.

2.1.1. Waste Feeding

To select the feedstock for gasification, three types of mixed waste were collected: (1) waste from a Refuse-Derived Fuel (RPF) manufacturing process, containing materials such as synthetic resins, paper, and wood; (2) Automotive Shredder Residue (ASR); and (3) incinerator feed waste. For optimal thermal efficiency in the gasification process, it is crucial to use waste with a high calorific value and a low ash content [18]. Elemental and calorific value analyses were performed to measure the moisture, ash, elemental composition, and heating value of each waste type (Table 1). Among the three candidates, the waste from the RPF manufacturing process was ultimately selected as the feedstock for this study, as it exhibited the highest calorific value and the lowest ash content. The collected waste is crushed to ensure smooth feeding into the gasifier.

2.1.2. Gasification

The primary objective of the waste gasification process is to convert the solid waste into a combustible gaseous fuel with high conversion efficiency. The collected and pre-treated high-calorific waste is fed into the gasifier via a constant-rate feeding system to ensure stable operation. Inside the gasifier, the waste undergoes a series of thermochemical reactions at high temperatures, ranging from 800 to 1200 °C, under oxygen-limited conditions. The carbon (C), hydrogen (H), and oxygen (O) components in the feedstock undergo various reactions, including combustion (Table 2), and are converted into a primary syngas composed of CO, H2, CO2, and HCl [19].
The gasifier was designed based on reaction kinetics and process simulation results. A fixed-bed reactor was employed due to its flexibility with varying waste shapes and minimal pretreatment requirements [20]. The designed operating conditions for the gasifier are a waste feed rate of 2 tons/d, an oxygen supply rate of 1700 Nm3/d, and a temperature of 1100 °C. This high-temperature condition (1100 °C) was strategically chosen to achieve two critical objectives based on the pilot plant’s design. The primary objective was to ensure the thermal cracking of complex tars, leading to cleaner syngas production. The secondary objective was to convert inorganic ash into a stable, molten slag. This approach facilitates both operational stability and environmentally sound residue management [7]. During the initial start-up, an auxiliary fuel (LPG) was used to raise the gasifier temperature. Once stabilized, the temperature was maintained by adjusting the waste feed rate.

2.1.3. Syngas Cleaning

The high-temperature syngas produced in the gasifier contains various impurities that can cause corrosion of downstream equipment or catalyst deactivation [21,22]. Therefore, a cleaning system was implemented to maximize the efficiency of the subsequent catalytic reforming and separation processes. The cleaning system consists of a high-temperature dry-cleaning system and a low-temperature wet-cleaning system, installed sequentially (Figure 2).
The dry high-temperature cleaning system was configured to remove high concentrations of pollutants (dust, HCl, H2S) from the syngas. It comprises a primary bag filter, a dechlorination fixed-bed reactor, a desulfurization fixed-bed reactor, and a secondary bag filter. The process begins with cooling the syngas to approximately 600 °C using a cooler, followed by the physical removal of particulate matter (e.g., dust, ash) with a ceramic filter. The gas then sequentially passes through reactors packed with dry sorbents to remove acid gases (HCl, H2S). Sodium carbonate (Na2CO3) was used in the dechlorination reactor, as it demonstrates excellent hydrogen chloride removal performance without requiring special processing. For the desulfurization reactor, zinc oxide was utilized due to its superior removal efficiency compared to iron-based desulfurizing agents (Fe2O3, Fe3O4) [23,24,25].
A wet low-temperature cleaning system was used to remove trace impurities remaining after the dry high-temperature cleaning. This step is necessary to prevent catalyst deactivation in the WGS reactor and ensure high-purity hydrogen production in the PSA unit. This wet system consists of a rapid cooler (quencher) to prevent dioxin synthesis and a wet scrubber for pollutant removal [26,27]. In the wet scrubber, water, NaOH, and chelated iron were injected for dechlorination and desulfurization, respectively.

2.1.4. Syngas Reforming

The purified syngas is transferred to the reforming system to achieve a composition optimized for hydrogen production. The core process in this stage is the Water-Gas Shift (WGS) reaction (CO + H2O ↔ CO2 + H2), which was carried out in a fixed-bed reactor. The primary purpose of the WGS reaction is to reduce the concentration of carbon monoxide (CO) while simultaneously increasing the concentration of hydrogen (H2) in the syngas. This adjustment makes the H2/CO molar ratio suitable for final product synthesis. A commercial Fe2O3-based catalyst (Fe-Al-Cu), known for its thermal stability and poison resistance, was used for the reforming reaction. To maintain a high CO conversion rate, the reactor was operated at a steam/CO ratio of 2.0–2.5 and a reaction temperature of 400–450 °C [28,29,30]. The steam was self-supplied, generated using energy recovered from the syngas produced in the gasifier. The consumption rate was calculated assuming a catalyst lifetime of 5 years (approximately 40,000 operating hours), which required four replacements over the plant’s 20-year operational lifespan. The total catalyst mass was then allocated to the functional unit (1 kg of H2), and this consumption is explicitly quantified in the Life Cycle Inventory (LCI) data presented in Table 3.

2.1.5. Hydrogen Separation

For the final separation of hydrogen, a Pressure Swing Adsorption (PSA) system was modeled as a virtual unit in this study, as the pilot plant’s physical operation concluded prior to the installation of this final stage. The syngas, enriched with hydrogen and carbon dioxide after passing through the WGS reactor, is fed into the PSA unit. This process produces a high-purity hydrogen product. It utilizes pressure changes to selectively adsorb impurities (e.g., CO2, CH4, residual CO) onto a sorbent material, thereby separating the hydrogen. The performance of this virtual unit was conservatively defined based on established data from commercial applications. While typical PSA systems report hydrogen recovery rates of 85–90% and purities of 99.99% [31,32,33], this study assumed a conservative recovery rate of 85% and a purity of 99.99% to avoid overestimating the system’s performance. For the purpose of this assessment, the remaining off-gas, which contained the unrecovered 15% of hydrogen and other impurities, was assumed to be captured separately.

2.2. Life Cycle Assessment

Life Cycle Assessment (LCA) is a standardized methodology for evaluating the environmental impacts of a product throughout its entire life cycle (“from cradle to grave”). The life cycle encompasses all stages from raw material acquisition to production, use, and end-of-life (EoL). System boundaries can be adjusted according to the scope of the study. The international standards ISO 14040 and 14044 define the framework for LCA in four phases: (1) Goal and Scope Definition, (2) Life Cycle Inventory Analysis, (3) Life Cycle Impact Assessment, and (4) Interpretation [34,35]. This study conducted an LCA following this framework to quantitatively assess the potential environmental impacts of a hydrogen production system based on high-calorific mixed waste gasification.

2.2.1. Goal and Scope Definition

The primary goal of this LCA is to quantitatively assess the Global Warming Potential (GWP) and identify the environmental hotspots of the hydrogen production system. The functional unit for this analysis was defined as 1 kg of produced hydrogen. The system boundary of this study focuses on the gasification plant itself. The boundary begins with the reception of RPF manufacturing residues at the plant gate and culminates in the final hydrogen product. This operational scope corresponds to a “gate-to-gate” assessment. Additionally, the environmental burdens from the plant construction phase, including the upstream production of all necessary materials like steel and concrete, are included within the boundary. As illustrated in Figure 3, upstream processes related to the feedstock itself, such as initial waste collection, transportation, and pre-treatment to produce the RPF residues, are excluded from the system boundary. This exclusion was necessary due to limitations in obtaining reliable data for these activities, which were outside the direct operational scope of the pilot plant project. The primary focus of this research was therefore to isolate and evaluate the environmental performance of the novel gasification-to-hydrogen technology based on direct empirical data.

2.2.2. Inventory Data Acquisition and Impact Assessment

The Life Cycle Inventory (LCI) analysis is a critical phase of an LCA, involving the collection of data on all inputs and outputs required to produce the functional unit [36]. However, a different approach was necessary for the plant construction phase. Specific LCI data for a 2 TPD-scale pilot plant is not available in established databases. Furthermore, to create a more relevant comparison with commercial-scale technologies, this study modeled a hypothetical 40 TPD commercial facility. Construction data were therefore sourced from the Ecoinvent v3.11 database, specifically the ‘synthetic gas factory construction’ dataset, which was scaled to represent a 40 TPD biomass gasifier. The selection of this dataset was justified by its process scope, which encompasses a gasifier and a gas treatment and conditioning facility, thereby ensuring consistency with the core process configuration of this study. This dataset was thus considered the most suitable available proxy. This decision was based on the assumption that the fundamental construction materials (e.g., steel, concrete, alloys) for a gasification plant are primarily determined by its thermal duty and processing capacity, rather than the specific type of carbonaceous feedstock (waste vs. biomass). The collected data were then quantified for the functional unit, assuming a plant lifespan of 20 years and 8000 annual operating hours.
The life-cycle greenhouse gas emissions were assessed using GaBi software (v10.9). The CML methodology, developed by Leiden University in the Netherlands, was employed for the impact assessment. The scope of the assessment was focused on a single impact category: Global Warming Potential (GWP). GWP measures the potential increase in the Earth’s average temperature caused by greenhouse gases such as CO2, CH4, and N2O. The environmental impact calculation included materials input into the plant, waste generated during the hydrogen production process, and plant construction. Steam was excluded from the environmental impact assessment as it was produced and utilized internally within the plant.

3. Results

3.1. Performance of the Gasification Plant

Continuous operation of the 2 TPD pilot gasification plant was conducted to verify its performance and hydrogen production rate. As illustrated in Figure 1, hydrogen was produced from the residual waste of the RPF manufacturing process through sequential stages of gasification, syngas cleaning, syngas reforming, and syngas separation. The waste feed rate into the gasifier was approximately 2 ton/d, and the oxidant (oxygen) was supplied at a rate of approximately 1700 Nm3/d. The average composition of the syngas generated after the gasification reaction was found to be 24.78% hydrogen, 38.78% carbon monoxide, and 33.40% carbon dioxide (Table 4). This composition is highly consistent with findings from other oxygen-blown gasification systems for municipal solid waste (MSW). For instance, the Purox gasification system reports a typical syngas composition of 24% H2, 40% CO, and 24% CO2. While the H2 and CO concentrations fall within the typical ranges for waste gasification, the observed CO2 level is relatively high. This can be attributed to the specific characteristics of the RPF residue feedstock and the high-temperature operating conditions [37,38,39].
To determine the purification efficiency of contaminants in the syngas, sampling was performed at the inlet and outlet of each unit within the cleaning process. A total of six sampling points were established: the syngas inlet (S1), downstream of the primary bag filter (S2), downstream of the dechlorination fixed-bed reactor (S3), downstream of the desulfurization fixed-bed reactor (S4), downstream of the secondary bag filter (S5), and downstream of the wet scrubber (S6) (Figure 2). The parameters measured to verify cleaning efficiency were dust, HCl, and H2S. The sampling results indicated a removal efficiency exceeding 99.99% for all contaminants (Table 5).
The purified syngas is subsequently converted into high-purity hydrogen via the WGS reactor and the PSA system. Through the WGS reaction, the syngas achieved a CO conversion rate of approximately 60%. This reaction increased the hydrogen composition from an initial 24.78% to 38.93%. Following syngas reforming, a hydrogen separation process is carried out using the PSA unit. The reformed syngas was fed into the PSA unit at a controlled flow rate of 100 Nm3/h. This process ultimately yielded a hydrogen production rate of 2.95 kg/h from the gasification of high-calorific waste (Table 4).

3.2. Gasification Plant LCA

3.2.1. Life Cycle Inventory

Table 3 presents the key inventory data for the inputs and outputs required to produce 1 kg of hydrogen via high-calorific waste gasification. The LCI analysis revealed that approximately 28.8 kg of waste and 23.8 Nm3 of oxygen were consumed to produce 1 kg of hydrogen. For pollutant removal, water, sorbents (for desulfurization and dechlorination), NaOH, and chelated iron were utilized. Steam and catalyst were supplied for the WGS reaction, and electricity was consumed for the overall plant operation (gasification, cleaning, reforming, and separation). The auxiliary fuel (LPG), used only during the initial start-up phase, was excluded from consideration due to its negligible quantity. The materials and utilities for plant construction were considered a one-time input. These inputs were allocated by dividing their total amounts by the total quantity of hydrogen produced over the plant’s operational lifetime (160,000 h). The outputs of the plant consist of hydrogen, wastewater from the cleaning unit, and a solid residue composed of ash and slag from the gasifier.

3.2.2. Life Cycle GHG Emissions

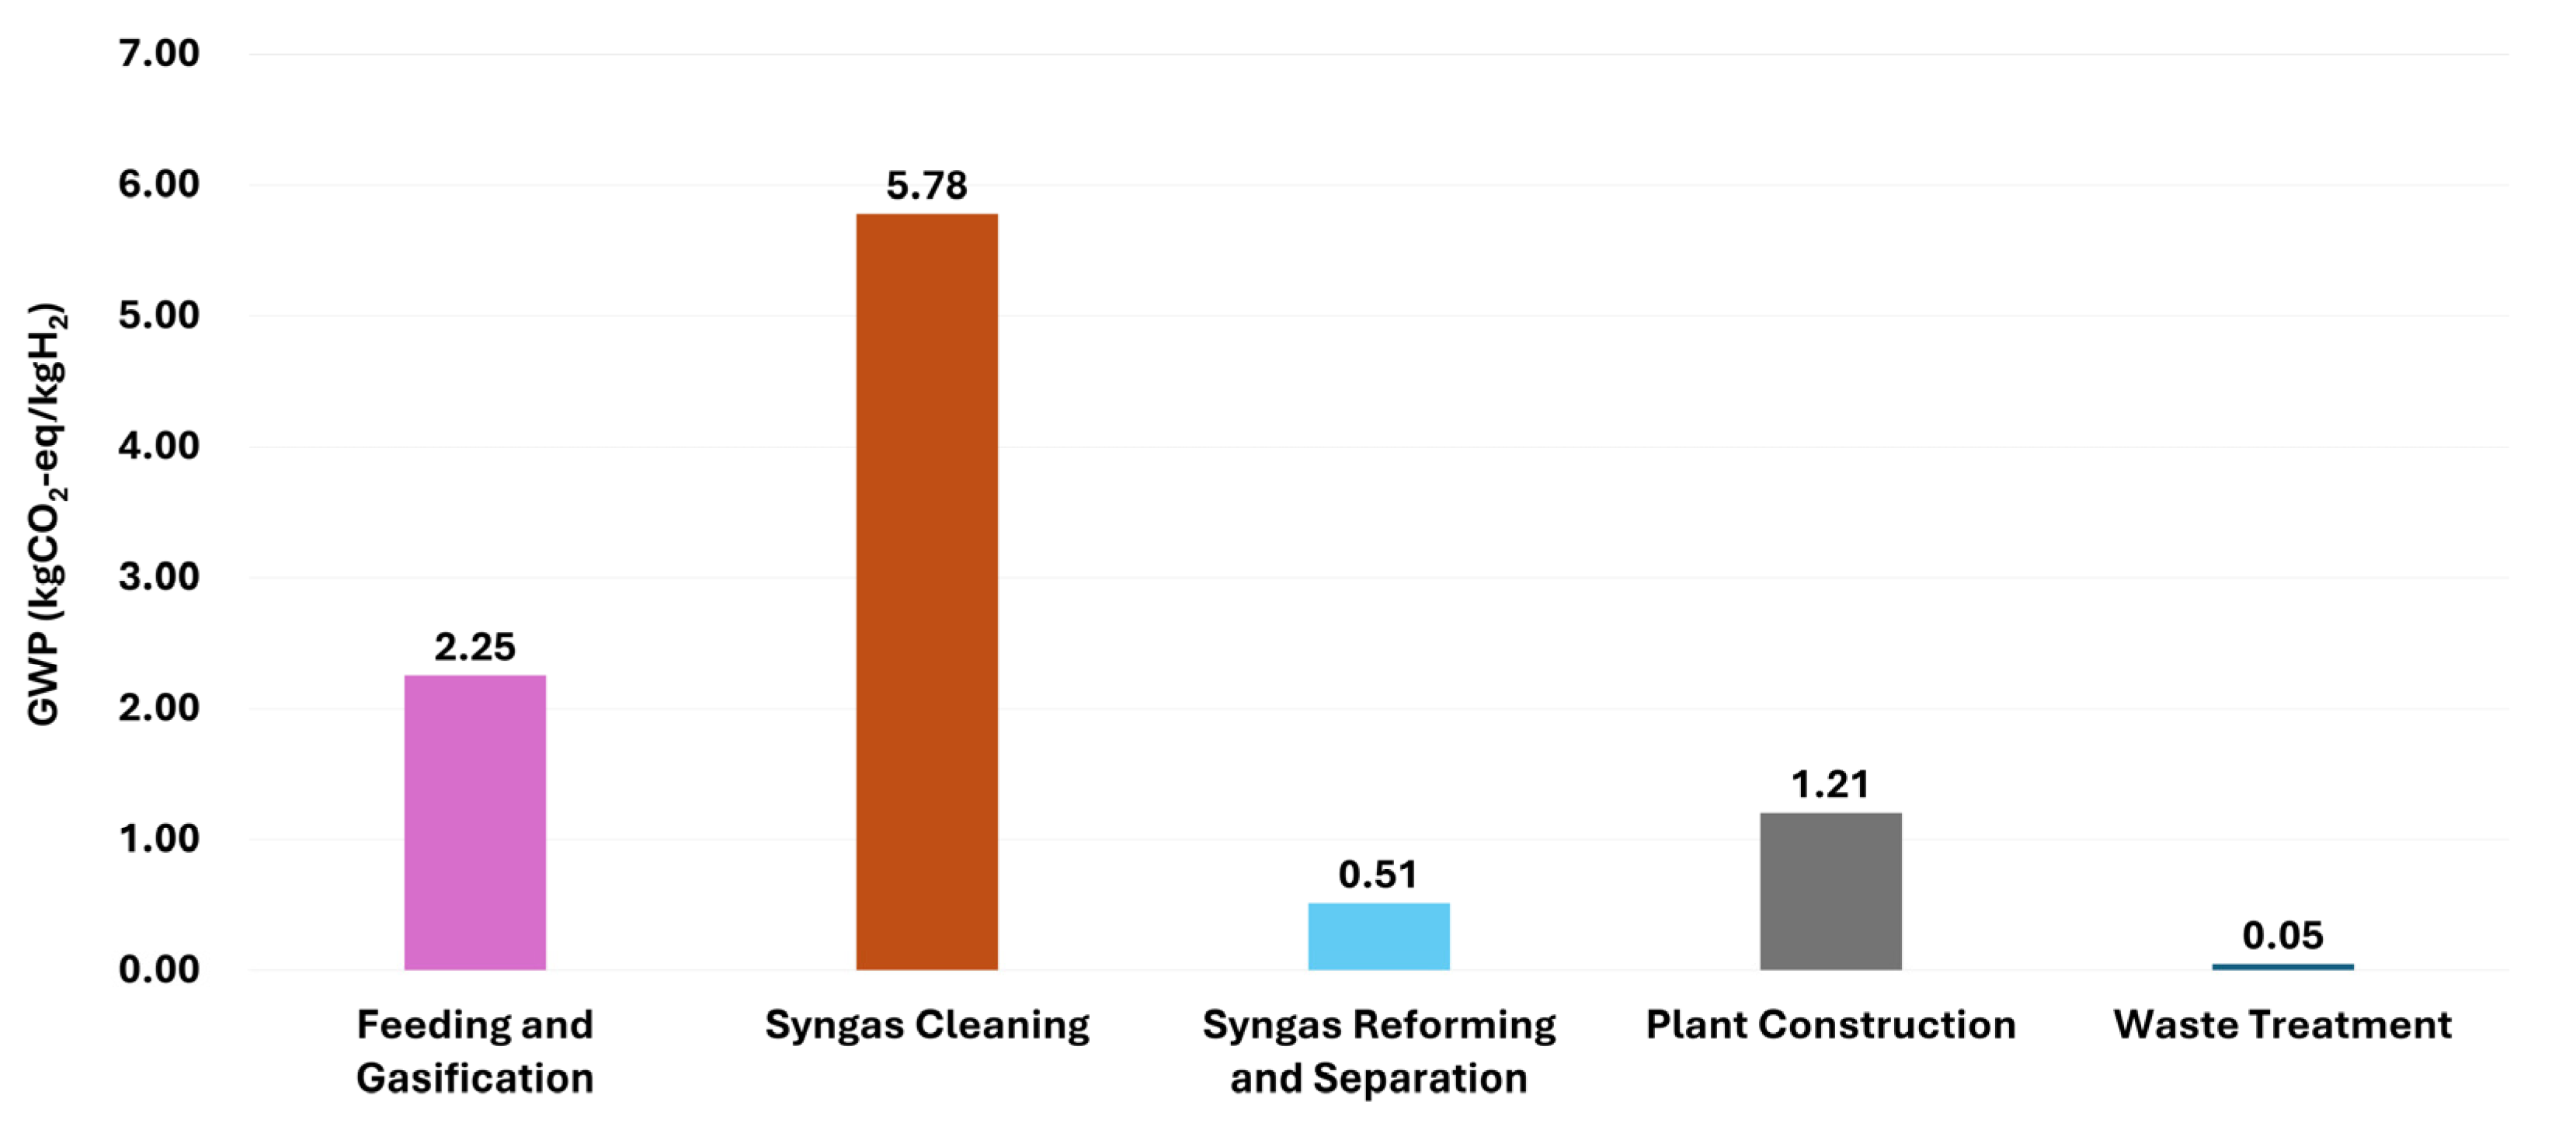
Table 6 shows the GWP environmental impact for the production of 1 kg of hydrogen from high-calorific waste gasification, and Figure 4 illustrates the contribution analysis (hotspot) results by process stage. The total GWP for producing 1 kg of hydrogen was determined to be 9.80 kg CO2-eq. The syngas cleaning process exhibited the highest environmental impact at 5.78 kg CO2-eq, accounting for the largest share (58.95%) of the total impact. This was followed by the feeding and gasification process (2.25 kg CO2-eq; 22.99%), plant construction (1.21 kg CO2-eq; 12.30%), and reforming and separation (0.515 kg CO2-eq; 5.25%). Waste treatment had the lowest impact (0.049 kg CO2-eq; 0.50%).
Within the feeding and gasification process, the impact from oxygen was identified as the most significant contributor, at 1.82 kg CO2-eq (80.73%). The impact of electricity was dominant within both the syngas cleaning process (accounting for 46.70% of its GWP; 2.70 kg CO2-eq) and the syngas reforming and separation process (96.59% of its GWP; 0.497 kg CO2-eq).
As shown in Figure 5, which presents the contribution analysis by material, the impact of electricity was the highest contributor to the GWP for producing 1 kg of hydrogen, accounting for 37.0% (3.63 kg CO2-eq). This was followed by chelated iron at 19.5% (1.91 kg CO2-eq), oxygen at 18.6% (1.82 kg CO2-eq), and plant construction at 12.3% (1.21 kg CO2-eq). Collectively, electricity, chelated iron, oxygen, and plant construction accounted for approximately 88% of the total GWP, with the remaining items contributing 12%.

3.3. Scenario and Sensitivity Analysis

3.3.1. Improvement Scenarios: Impact of Alternative Electricity Supplies

The hotspot analysis (Section 3.2.2) identified external electricity consumption as the single largest contributor to the system’s GWP. This input accounted for 37.0% (3.63 kg CO2-eq) of the total 9.80 kg CO2-eq/kg H2. To assess the technology’s practical applicability and quantify its GWP reduction potential, a 4-stage scenario analysis was conducted. This analysis focused exclusively on decarbonizing the electricity supply. It incorporates the specific regional energy structure and policy goals of South Korea to evaluate performance under various realistic and future-oriented energy mixes.
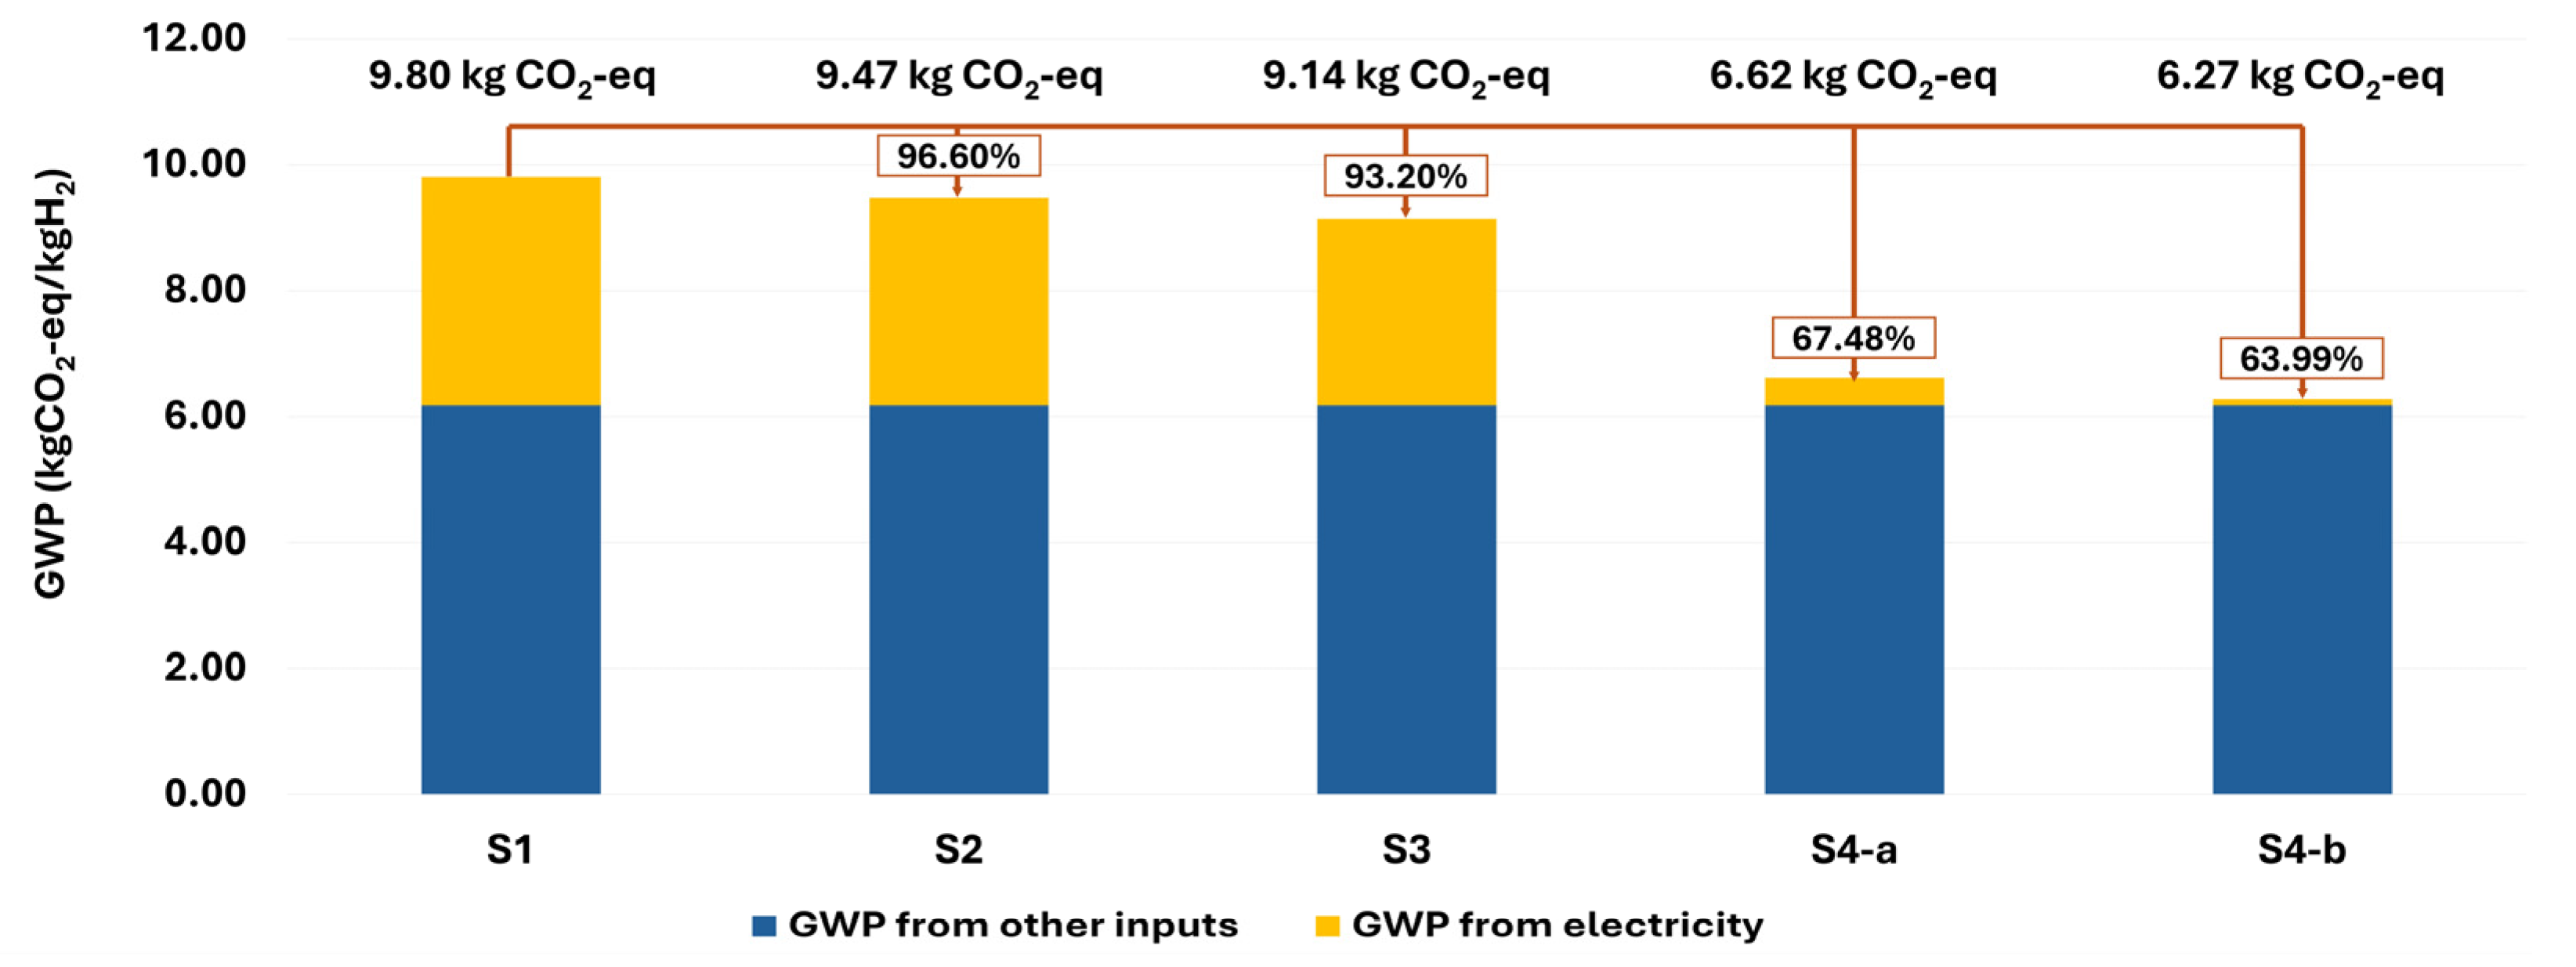
The scenarios were designed to model a progressive decarbonization pathway, from the current grid mix to full renewable adoption, reflecting both current realities and long-term national policies. The scenarios are defined as (S1) the Baseline, using the current South Korean grid mix; (S2) the Current RE scenario, reflecting the 2025 national target of a 10% renewable energy (RE) share; (S3) the Policy RE scenario, based on the 2030 national target of a 20% RE share; and (S4) the Potential RE scenario, which models the long-term potential of using 100% renewable electricity.
The renewable energy mix for S2 and S3 was modeled in alignment with South Korea’s ‘5th Basic Plan for New and Renewable Energy Technology Development, Utilization, and Supply’ [39]. This plan outlines a 20% RE share by 2030, with solar (approx. 40%) and wind (approx. 30%) as the key energy sources, accounting for 70% of the RE capacity. To represent this, while acknowledging data availability limitations for other sources, the renewable portion of the electricity mix in S2 and S3 was calculated using a weighted average. This average was based on the 5th Basic Plan’s key sources: solar (57%, derived from 40/(40 + 30)) and wind (43%, derived from 30/(40 + 30)). The S4 scenario was further divided into S4a (100% Solar PV) and S4b (100% Wind Power) to assess the full potential of each technology.
Table 7 and Figure 6 show the GWP results for each scenario. The results show a clear, progressive reduction in GWP as the grid decarbonizes. The near-term policy-aligned scenarios show immediate environmental benefits, with the S2 (10% RE) and S3 (20% RE) scenarios achieving total GWP reductions of 3.40% and 6.80%, respectively. This demonstrates the practical, short-term applicability of the WtH technology in conjunction with national energy transition goals. The long-term potential scenarios (S4) show a substantial reduction. By transitioning to 100% solar PV (S4a), the total GWP is reduced by 32.52% to 6.62 kg CO2-eq/kg H2. The best-case scenario, 100% wind power (S4b), achieves the lowest GWP of 6.27 kg CO2-eq/kg H2, a 36.01% reduction from the baseline. This analysis confirms that the environmental competitiveness of this WtH technology is intrinsically linked to the carbon intensity of its electricity supply. Consequently, significant GWP improvements are attainable by aligning its operation with the expansion of renewable energy infrastructure.

3.3.2. Sensitivity Analysis: Effect of Operational Lifetime

The environmental impact attributed to plant construction varies depending on the operational lifetime of the plant. Table 8 and Figure 7 present the environmental impact resulting from operating the plant for 10, 20, 30, and 40 years, assuming 8000 annual operating hours. For a 10-year operational lifetime, the GWP impact from plant construction is 2.41 kg CO2-eq, which constitutes 21.91% of the total GWP of 11.0 kg CO2-eq. However, as the operational lifetime extends to 20, 30, and 40 years, the contribution of plant construction to the GWP diminishes to 12.30%, 8.55%, and 6.56%, respectively. Furthermore, it was confirmed that with the increase in the operational period, the GWP per 1 kg of hydrogen produced decreases by 16.36%, from 11.0 kg CO2-eq for a 10-year lifetime to 9.20 kg CO2-eq for a 40-year lifetime.

4. Discussion

4.1. Interpretation of Environmental Hotspots

The contribution analysis in Section 3.2.2 identified the primary sources of Global Warming Potential (GWP) for this WtH process: external electricity consumption (37.0%), chelated iron (19.5%), oxygen supply (18.6%), and plant construction (12.3%). The significant environmental impact attributed to electricity consumption is a characteristic feature of typical gasification and syngas production plants. This results from the substantial power required to operate various units, including the gasifier, compressors, cleaning, reforming, and separation facilities [40,41]. The critical nature of this hotspot was further confirmed by the scenario analysis in Section 3.3.1. The results demonstrated that the total GWP is intrinsically linked to the carbon intensity of the grid, with a potential GWP reduction of up to 36.01% achievable by transitioning to 100% wind power. This highlights that decarbonizing the power supply is the most effective strategy for improving the environmental performance of this technology. Other strategies, such as enhancing the process’s intrinsic energy efficiency via high-efficiency equipment or process optimization, could offer additional, albeit smaller, GWP reductions.
Beyond electricity, the current practice of purchasing liquid oxygen from external suppliers induces a high environmental burden (18.6% of total GWP), owing to the substantial energy consumption inherent in cryogenic oxygen production. As a potential mitigation strategy, the adoption of a non-cryogenic air separation unit, appropriately scaled for the plant, can be considered. Non-cryogenic air separation consumes approximately 20–35% of the energy required for liquid oxygen production; this approach could therefore substantially reduce the GWP associated with oxygen supply [42,43].
Alongside oxygen, chelated iron used for syngas cleaning was identified as another major environmental load (19.5% of total GWP). To mitigate the associated environmental impact, strategies could include optimizing the operating conditions of the chelated iron regeneration (oxidation) reactor, such as air injection rate and pH. Enhancing the efficiency of the sulfur separation and washing systems could also minimize the decomposition and loss of the chelated iron [44].

4.2. Comparative Analysis and Regional Context
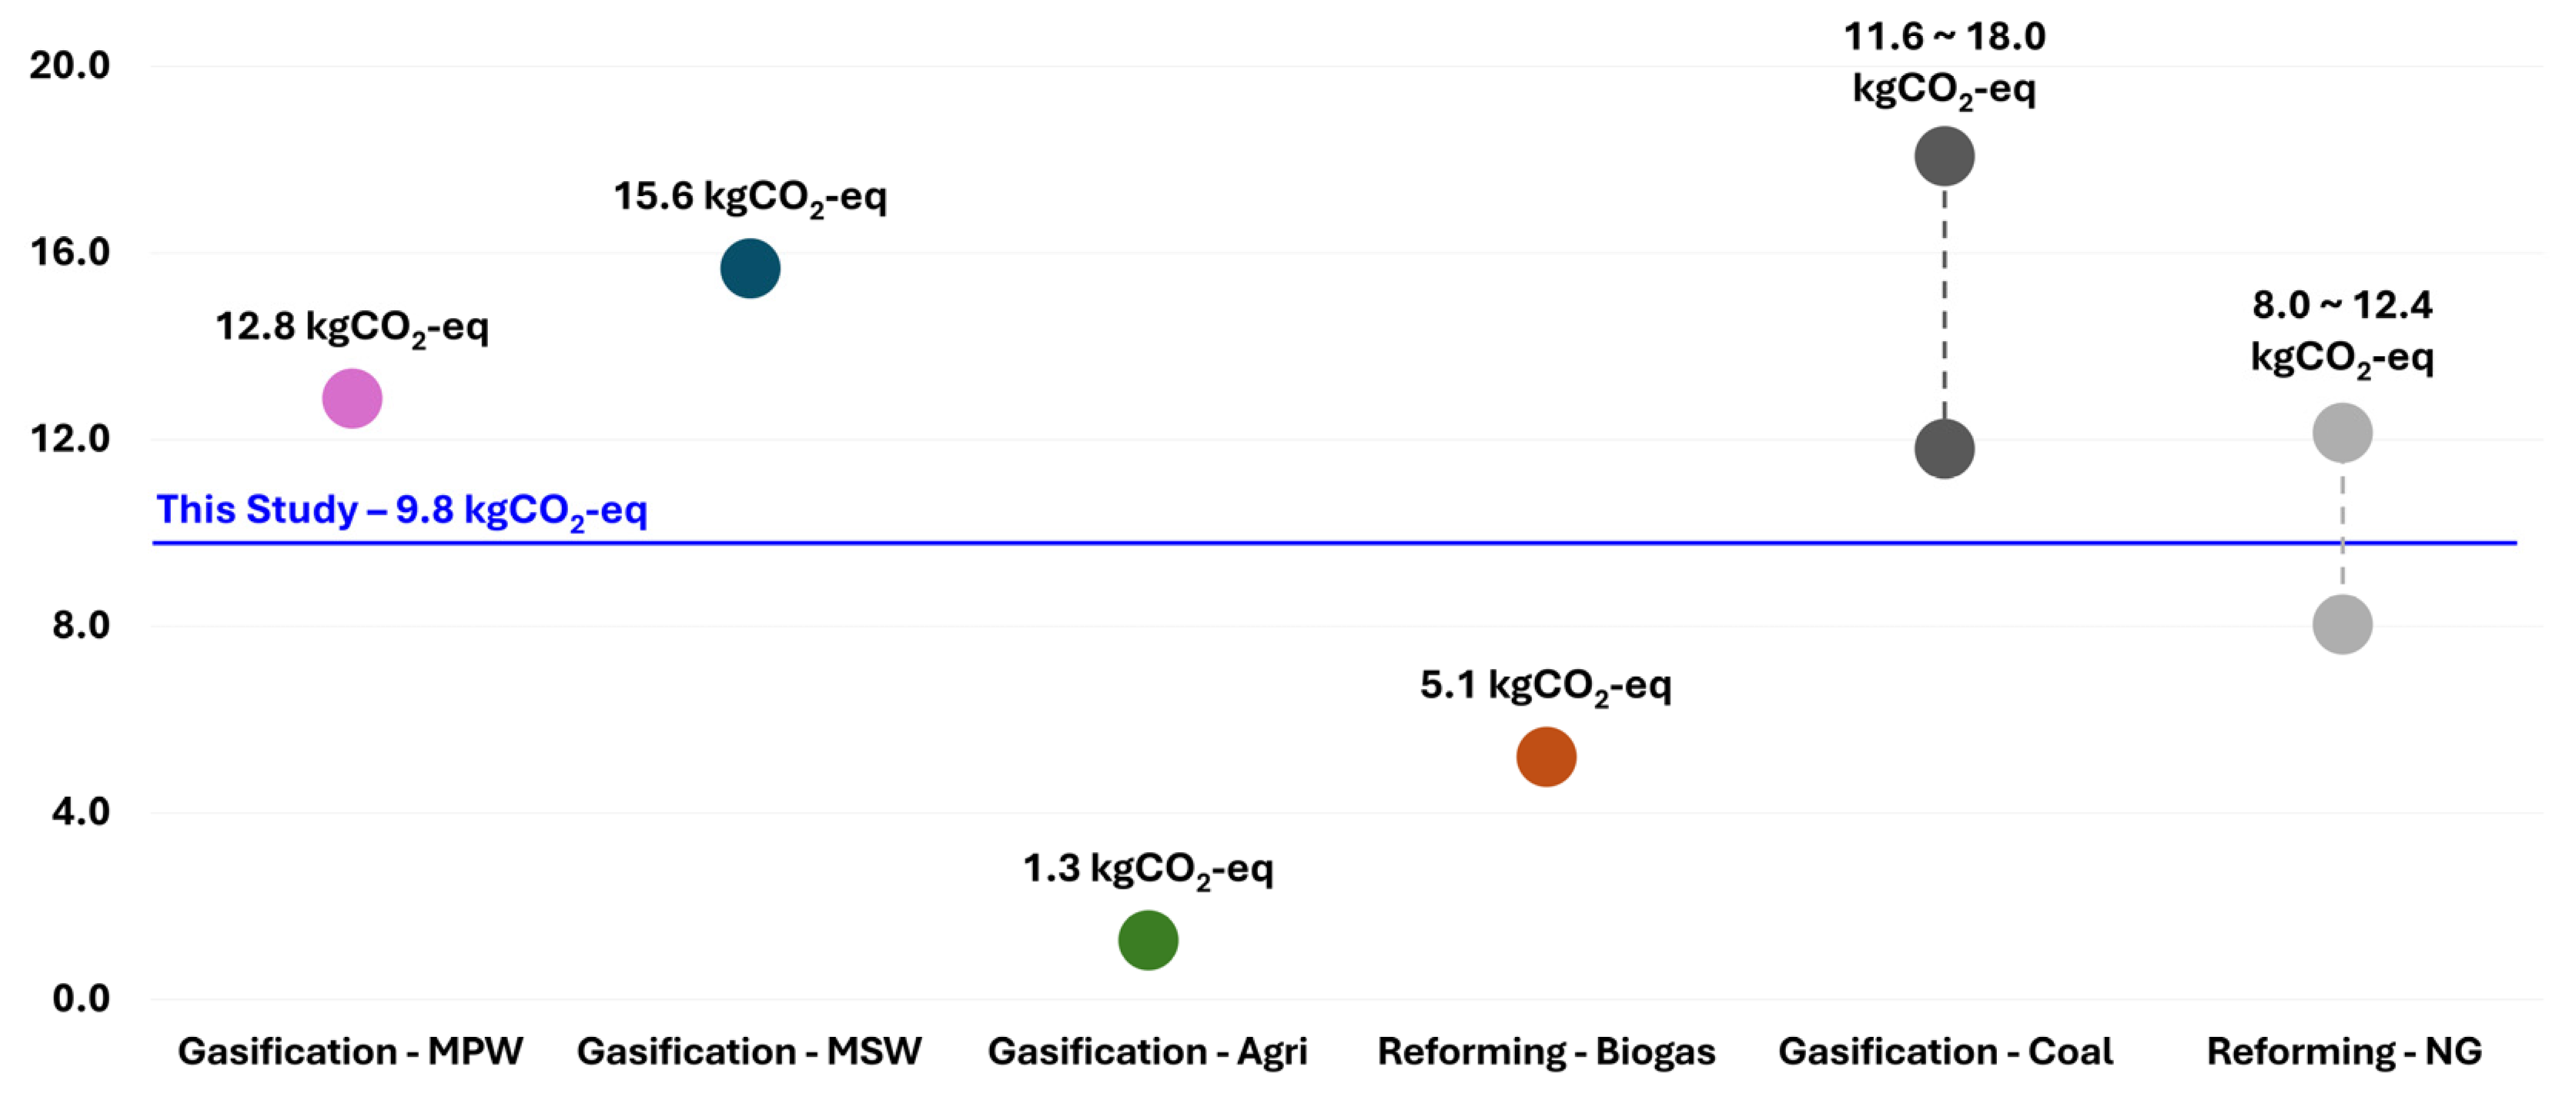
The life-cycle greenhouse gas (GWP) emissions from hydrogen production via high-calorific mixed waste gasification were determined in this study to be 9.80 kg CO2-eq/kg H2. This result was comparatively analyzed with previous LCA studies on other hydrogen production technologies; the data are summarized in Table 9, and the comparison is visually benchmarked in Figure 8. However, a simple comparison of absolute GWP values is insufficient, as the environmental competitiveness of any energy technology is highly dependent on the regional energy structure [45].
The baseline GWP of this study (9.80 kg CO2-eq/kg H2) is a direct reflection of the specific energy context of South Korea. As the hotspot analysis identified (Section 3.2.2), external electricity consumption is the largest environmental burden (37.0%). This is attributable to the high carbon intensity of the South Korean grid mix, which in 2025 still relies on fossil fuels for approximately 60% of its electricity generation.
This regional context must also be applied when evaluating the GWP of conventional technologies. The widely cited GWP for Steam Methane Reforming (SMR) (8.0–12.4 kg CO2-eq/kg H2) and coal gasification (11.6–18.0 kg CO2-eq/kg H2) represent energy-intensive processes requiring significant auxiliary electricity [46,47,48]. If these technologies were deployed in South Korea, they would rely on the same carbon-intensive grid. This reliance would likely place their actual GWP at the higher end of their respective literature ranges. Furthermore, SMR in South Korea would rely on imported Liquefied Natural Gas (LNG) [49]. This introduces a higher upstream carbon footprint from liquefaction and transport compared to the pipeline gas assumed in many SMR studies. Therefore, when assessed within a “like-for-like” regional context, the 9.80 kg CO2-eq/kg H2 of this WtH technology demonstrates clear environmental competitiveness, particularly against coal gasification and a regionally contextualized SMR process.
The most directly comparable study is that of Afzal et al. [50], which investigated mixed plastic waste (MPW) gasification. In their research, the GWP for hydrogen production from MPW gasification was estimated at 12.8 kg CO2-eq/kg H2, a value slightly higher than that of the present study. The primary difference is analyzed to stem from the energy supply methodology. Their study reported higher GHG emissions due to a significant reliance on natural gas combustion to supply heat for multiple endothermic reaction stages, including the gasifier, tar reformer, and steam reformer. This indicates that even in similar waste gasification processes, the level of internal heat integration and the choice of external energy sources can have a substantial impact on the overall GWP. Furthermore, their study reported an even higher GWP of 15.6 kg CO2-eq/kg H2 for MSW gasification. This was attributed to the lower hydrogen yield resulting from the lower calorific value and hydrogen content of MSW.
Gasification technologies utilizing biomass as a feedstock present a stark contrast to the results of this study. Abawalo et al. [51] evaluated the GWP for hydrogen production from agricultural residue (rice straw) gasification to be as low as 1.30 kg CO2-eq/kg H2. This low value is because biomass is considered a ‘carbon-neutral’ feedstock, and the process minimized fossil fuel use by recycling by-product gases as an energy source. Abawalo et al. [51] also conducted a study on a process that produces hydrogen by reforming biogas, assessing the GWP from biogas reforming at 5.05 kg CO2-eq/kg H2. The GWP of this study’s process is higher than that of biogas reforming for two primary reasons. First, the feedstock (plastic) is a fossil-fuel-based material lacking the carbon fixation effect of biomass. Second, more energy (particularly electricity and oxygen) is consumed in the high-temperature gasification and purification processes.
This comparative analysis confirms that the GWP of this WtH technology is comparable to SMR. However, its environmental positioning is profoundly influenced by two factors: the origin of the feedstock (fossil-derived plastics vs. bio-based biomass) and, critically, the high carbon intensity of the external energy supplied. This reliance on the South Korean grid means that, in its current unoptimized state, the WtH process does not yet demonstrate a decisive GHG reduction effect compared to SMR.
This finding reinforces the conclusion from the improvement scenario analysis (Section 3.3.1). The environmental competitiveness of this WtH technology—and indeed, most large-scale hydrogen production pathways in South Korea—is not static. It is dynamically linked to the decarbonization of the national grid. As shown in Scenarios S3 and S4, aligning the plant’s operation with national renewable energy goals (20% RE share by 2030) or transitioning fully to renewable power (100% Wind) can reduce the total GWP by 6.8% and 36.01%, respectively. This result confirms that enhancing process energy self-sufficiency and utilizing renewable energy are imperative for securing the environmental competitiveness of this technology in the future.
Figure 8. Benchmarking of WtH (This Study) GWP against alternative hydrogen production pathways. Data for comparative pathways are sourced from: MPW and MSW gasification [50], Agricultural Residue gasification and Biogas reforming [51], and Coal gasification and NG reforming [47,48].
Sustainability 17 10308 g008
Table 9. Comparative GWP of different hydrogen production pathways.
CategoryMain ProcessFeedstockGWPRef
   WasteGasificationHigh-calorific mixed waste9.8Our Study
    GasificationMixed plastic waste12.8[50]
    GasificationMunicipal solid waste15.6[50]
    GasificationAgricultural Residue1.3[51]
    ReformingBiogas from Organic waste5.1[51]
   Fossil FuelGasificationCoal11.6–18.0[47,48]
ReformingNatural Gas8.0–12.4[47,48]

4.3. Methodological Limitations and Uncertainties

While this study provides a critical empirical benchmark for WtH technology based on pilot-scale operational data, it is important to acknowledge several methodological limitations and uncertainties. These limitations, primarily arising from the pilot-scale nature of the study and data availability, provide clear directions for future research.
First, the final hydrogen separation (PSA) unit was modeled as a virtual component, as the physical installation was not completed during the pilot plant’s operational campaign. Although the performance was conservatively defined based on established commercial data (85% recovery rate), this approach introduces uncertainty. The actual energy consumption, hydrogen recovery rate, and the precise composition of the off-gas from a physically integrated PSA unit could differ. This modeling choice, as noted in Section 2.1.5, also means the environmental impact of treating the unrecovered off-gas stream was not included in the GWP calculation, as it was assumed to be captured separately. This warrants further empirical investigation.
Second, the scaling logic for the plant construction phase presents a notable uncertainty. The LCI for the 40 TPD commercial-scale scenario was derived by scaling an Ecoinvent dataset for a biomass gasifier. This approach was necessary due to the lack of specific LCI data for a plant of this exact type and scale. However, it does not account for non-linear ‘economies of scale’. Chemical engineering principles suggest that larger plants are generally more resource-efficient on a per-unit-of-capacity basis. Consequently, the linear scaling used in this study may have led to a conservative, or potentially overestimated, GWP impact for the plant construction phase (12.3% of the total GWP).
Third, the ‘gate-to-gate’ system boundary, as defined in Section 2.2.1, represents a significant limitation. The assessment begins with the reception of RPF manufacturing residues at the plant gate, thereby excluding the environmental burdens associated with the upstream processes: initial waste collection, transportation, and the pre-treatment (e.g., crushing, sorting) required to produce the RPF residues. This exclusion, deemed necessary due to data limitations, results in a ‘boundary truncation bias’. The energy and emissions from these upstream activities are non-negligible, and their inclusion in a full ‘cradle-to-gate’ analysis would invariably increase the total GWP of the produced hydrogen.
Despite these limitations, the primary conclusions of this study remain robust. The objective was to evaluate the environmental performance of the core gasification-to-hydrogen technology using direct empirical data. The identification of the main environmental hotspots—namely external electricity consumption, chelated iron, and oxygen supply—is derived from the actual operational inputs of the pilot plant. These findings are therefore valid within the defined system boundary. They provide a critical empirical foundation for guiding future optimization efforts and more comprehensive, commercial-scale assessments.

4.4. Scientific Contribution and International Transferability

Despite the limitations discussed in Section 4.3, this study makes two significant scientific contributions, addressing the gap between laboratory-scale research and future commercial deployment.
First, this study provides a crucial “empirical benchmark for scaling and commercialization”. Unlike many LCA studies based on purely theoretical models or lab-scale experiments, this assessment is grounded in actual operational data from a 2 TPD pilot plant. The identified hotspots are not abstract projections; they are empirically validated burdens. For example, the finding that electricity consumption (37.0%) and consumables like chelated iron (19.5%) and oxygen (18.6%) constitute over 75% of the operational GWP provides a robust, real-world benchmark for engineers and developers. This focuses commercialization efforts on solving these specific, high-impact challenges.
Second, this research offers a clear framework for “international transferability.” The feedstock—high-calorific mixed waste—is a globally recognized challenge for nations transitioning to a circular economy. While the baseline GWP (9.80 kg CO2-eq/kg H2) is specific to South Korea, the key finding is universally applicable: the environmental viability of this WtH technology is critically dependent on the carbon intensity of the local electricity grid. The scenario analysis (Section 3.3.1) explicitly demonstrates this transferability. For a nation with a low-carbon grid (e.g., nuclear or hydro-dominant), the GWP would approach the S4b scenario (6.27 kg CO2-eq/kg H2). Conversely, for nations heavily reliant on fossil fuels, the GWP will remain high, similar to the S1 baseline. This study, therefore, provides not just a single data point. It offers a transferable model for any region to assess this technology’s potential based on its own energy structure.

5. Conclusions

This study performed a gate-to-gate life cycle assessment (LCA) of hydrogen production via high-calorific mixed waste gasification, utilizing actual operational data from a 2 TPD pilot plant. The Global Warming Potential (GWP) was determined to be 9.80 kg CO2-eq per kg of H2 produced. A detailed hotspot analysis identified the primary environmental burdens as external electricity consumption (37.0%), chelated iron production (19.5%), the supply of externally produced oxygen (18.6%), and plant construction (12.3%). The critical dependence on electricity was further confirmed by a scenario analysis (Section 3.3.1). This analysis demonstrated that aligning with national renewable energy goals (20% RE share by 2030) offers a 6.8% GWP reduction, while a full transition to 100% wind power could reduce the total GWP by 36.01%.
These findings indicate that this Waste-to-Hydrogen (WtH) technology serves a critical dual purpose: valorizing problematic waste streams while simultaneously producing a valuable energy carrier. The comparative analysis (Section 4.2), when contextualized within the South Korean energy structure, shows its GWP is competitive with regionally contextualized SMR (8.0–12.4 kg CO2-eq/kg H2) and lower than coal gasification (11.6–18.0 kg CO2-eq/kg H2). Therefore, it is considered a promising transitional pathway rather than a fully ‘green’ solution. However, as discussed in Section 4.3, this study has several methodological limitations: the analysis relies on a linear scale-up from pilot data, the system boundary was restricted to gate-to-gate, and the final hydrogen purification unit (PSA) was a virtual model.
To address these limitations and build upon this research, future work must follow a more specific and integrated framework. First, a feasible testing plan for the virtualized components is essential. This plan should involve (a) the physical integration and continuous operation of the PSA unit to establish empirical hydrogen recovery rates and actual energy consumption (kWh/kg H2). It must also include (b) a detailed compositional analysis of the resulting off-gas stream to accurately model its environmental treatment impact. Second, this LCA study provides a direct framework for an integrated Techno-Economic Analysis (TEA). Such a framework should evaluate the trade-offs identified. This includes assessing (a) the levelized cost of hydrogen ($/kg H2) for each electricity decarbonization scenario (S1–S4) presented in Section 3.3.1. It should also assess (b) the capital (CAPEX) and operating (OPEX) trade-offs of mitigating other hotspots, such as adopting an on-site non-cryogenic air separation unit versus purchasing liquid oxygen. Finally, the system boundary must be expanded to a full ‘cradle-to-gate’ assessment to holistically validate this technology’s role in a circular economy by including the upstream impacts of waste collection and pre-treatment.
In conclusion, this empirical LCA provides a vital benchmark for the future scaling and commercialization of WtH technology. It validates that high-calorific mixed waste gasification is a promising enabling technology that bridges waste management and the emerging hydrogen economy. Furthermore, it establishes an internationally transferable framework for assessing the technology’s GWP, demonstrating that its environmental competitiveness is critically linked to the decarbonization of local electricity grids.

Author Contributions

Conceptualization, G.K. and Y.P.; methodology, G.K.; software, G.K.; validation, J.-H.G., Y.P.; data curation, G.K. and Y.P.; writing—original draft preparation, G.K.; writing—review and editing, Y.P.; visualization, G.K. and J.-H.G.; supervision, J.-H.G.; project administration, J.-H.G. All authors have read and agreed to the published version of the manuscript.

Funding

This work is supported by the Korea Agency for Infrastructure Technology Advancement (KAIA) grant funded by the Ministry of Land, Infrastructure and Transport (Grant RS-2024-00417444). And The APC was funded by the Korea Agency for Infrastructure Technology Advancement (KAIA) (Grant RS-2024-00417444).

Institutional Review Board Statement

Not applicable.

Informed Consent Statement

Not applicable.

Data Availability Statement

The data presented in this study are available on request from the corresponding author.

Conflicts of Interest

The authors declare no conflicts of interest.

References

  1. Agarwal, R. Transition to a hydrogen-based economy: Possibilities and challenges. Sustainability 2014, 14, 15975. [Google Scholar] [CrossRef]
  2. International Energy Agency (IEA). Global Hydrogen Review 2024; IEA: Paris, France, 2024. [Google Scholar]
  3. Soltani, R.; Rosen, M.A.; Dincer, I. Assessment of CO2 capture options from various points in steam methane reforming for hydrogen production. Int. J. Hydrogen Energy 2014, 39, 20266–20275. [Google Scholar] [CrossRef]
  4. Soni, A.; Gupta, S.K.; Rajamohan, N.; Yusuf, M. Waste-to-energy technologies: A sustainable pathway for resource recovery and materials management. Mater. Adv. 2025, 6, 4598–4622. [Google Scholar] [CrossRef]
  5. Javed, M.H.; Ahmad, A.; Rehan, M.; Musharavati, F.; Nizami, A.S.; Khan, M.I. Advancing Sustainable Energy: Environmental and Economic Assessment of Plastic Waste Gasification for Syngas and Electricity Generation Using Life Cycle Modeling. Sustainability 2025, 17, 1277. [Google Scholar] [CrossRef]
  6. Maitlo, G.; Ali, I.; Mangi, K.H.; Ali, S.; Maitlo, H.A.; Unar, I.N.; Pirzada, A.M. Thermochemical conversion of biomass for syngas production: Current status and future trends. Sustainability 2022, 14, 2596. [Google Scholar] [CrossRef]
  7. Kun, U.H.; Ksepko, E. Advancing Municipal Solid Waste Management Through Gasification Technology. Processes 2025, 13, 2000. [Google Scholar] [CrossRef]
  8. Pini, M.; Nocentini, A.; Chiaramonti, D. A Circular Economy Approach to the Gasification of Municipal Solid Waste and Other Biogenic Residues: State of the Art, Challenges, and Perspectives in Europe. Sustainability 2025, 17, 6704. [Google Scholar] [CrossRef]
  9. Kalinci, Y.; Hepbasli, A.; Dincer, I. Life cycle assessment of hydrogen production from biomass gasification systems. Int. J. Hydrogen Energy 2012, 37, 14026–14039. [Google Scholar] [CrossRef]
  10. Muresan, M.; Cormos, C.C.; Agachi, P.S. Comparative life cycle analysis for gasification-based hydrogen production systems. J. Renew. Sustain. Energy 2014, 6, 013131. [Google Scholar] [CrossRef]
  11. Hajjaji, N.; Martinez, S.; Trably, E.; Steyer, J.P.; Helias, A. Life cycle assessment of hydrogen production from biogas reforming. Int. J. Hydrogen Energy 2016, 41, 6064–6075. [Google Scholar] [CrossRef]
  12. Chari, S.; Sebastiani, A.; Paulillo, A.; Materazzi, M. The environmental performance of mixed plastic waste gasification with carbon capture and storage to produce hydrogen in the UK. ACS Sustain. Chem. Eng. 2023, 11, 3248–3259. [Google Scholar] [CrossRef]
  13. Tavares Borges, P.; Silva Lora, E.E.; Venturini, O.J.; Errera, M.R.; Yepes Maya, D.M.; Makarfi Isa, Y.; Alexander, K.; Zhang, S. A comprehensive technical, environmental, economic, and bibliometric assessment of hydrogen production through biomass gasification, including global and brazilian potentials. Sustainability 2024, 16, 9213. [Google Scholar] [CrossRef]
  14. Maniscalco, M.P.; Longo, S.; Cellura, M.; Miccichè, G.; Ferraro, M. Critical review of life cycle assessment of hydrogen production pathways. Environments 2024, 11, 108. [Google Scholar] [CrossRef]
  15. Al-Moftah, A.M.S.; Marsh, R.; Steer, J. Life cycle assessment of solid recovered fuel gasification in the state of Qatar. Chem. Eng. 2021, 5, 81. [Google Scholar] [CrossRef]
  16. Dennis, G.; Brian, L.C. Scaleup Issues from Bench to Pilot. In Proceedings of the 2009 AIChE Annual Meeting, Nashville, TN, USA, 12 November 2009. [Google Scholar]
  17. Rosyadi, A.A.; Lim, O.A. Comparative Environmental Life Cycle Assessment (LCA) Study of Hydrogen Fuel Production from Different Waste Feedstock in South Korea. Int. J. Automot. Technol. 2025, 26, 1839–1856. [Google Scholar] [CrossRef]
  18. Kumar, S.; Shukla, S.K. A review on recent gasification methods for biomethane gas production. Int. J. Energy Eng. 2016, 6, 32–43. [Google Scholar] [CrossRef]
  19. Lopez, G.; Artetxe, M.; Amutio, M.; Alvarez, J.; Bilbao, J.; Olazar, M. Recent advances in the gasification of waste plastics. A critical overview. Renew. Sustain. Energy Rev. 2018, 82, 576–596. [Google Scholar] [CrossRef]
  20. Salah, C.; Cobo, S.; Pérez-Ramírez, J.; Guillén-Gosálbez, G. Environmental sustainability assessment of hydrogen from waste polymers. ACS Sustain. Chem. Eng. 2023, 11, 3238–3247. [Google Scholar] [CrossRef]
  21. Leuter, P.; Fendt, S.; Spliethoff, H. Requirements on synthesis gas from gasification for material and energy utilization: A mini review. Front. Energy Res. 2024, 12, 1382377. [Google Scholar] [CrossRef]
  22. Jayanarasimhan, A.; Pathak, R.M.; Shivapuji, A.M.; Rao, L. Tar formation in gasification systems: A holistic review of remediation approaches and removal methods. ACS Omega 2024, 9, 2060–2079. [Google Scholar] [CrossRef]
  23. Baek, J.I.; Eom, T.H.; Lee, J.B.; Jegarl, S.; Ryu, C.K.; Park, Y.C.; Jo, S.H. Cleaning of gaseous hydrogen chloride in a syngas by spray-dried potassium-based solid sorbents. Korean J. Chem. Eng. 2015, 32, 845–851. [Google Scholar] [CrossRef]
  24. Marcantonio, V.; Müller, M.; Bocci, E. A review of hot gas cleaning techniques for hydrogen chloride removal from biomass-derived syngas. Energies 2012, 14, 6519. [Google Scholar] [CrossRef]
  25. Chen, K.Y.; Chen, Y.Y.; Wei, W.C.J. Reforming and Desulphurization of Syngas by 3D-printed Catalyst Carriers. Innov. Ener Res. 2017, 6, 1000172. [Google Scholar] [CrossRef]
  26. Shibamoto, T.; Yasuhara, A.; Katami, T. Dioxin formation from waste incineration. Rev. Environ. Contam. Toxicol. 2007, 190, 1–41. [Google Scholar] [CrossRef]
  27. Miao, X.; Ma, Y.; Chen, Z.; Gong, H. Oxidative degradation stability and hydrogen sulfide removal performance of dual-ligand iron chelate of Fe-EDTA/CA. Environ. Technol. 2018, 39, 3006–3012. [Google Scholar] [CrossRef]
  28. Eddi, I.; Chibane, L. Parametric study of high temperature water gas shift reaction for hydrogen production in an adiabatic packed bed membrane reactor. Rev. Roum. Chim. 2020, 65, 149–164. [Google Scholar] [CrossRef]
  29. Reddy, G.K.; Kim, S.J.; Dong, J.; Smirniotis, P.G.; Jasinski, J.B. Long-term WGS stability of Fe/Ce and Fe/Ce/Cr catalysts at high and low steam to CO ratios—XPS and Mössbauer spectroscopic study. Appl. Catal. A Gen. 2012, 415, 101–110. [Google Scholar] [CrossRef]
  30. Lee, Y.L.; Kim, K.J.; Jang, W.J.; Shim, J.O.; Jeon, K.W.; Na, H.S.; Kim, M.K.; Bae, J.W.; Nam, S.C.; Jeon, B.H.; et al. Increase in stability of BaCo/CeO2 catalyst by optimizing the loading amount of Ba promoter for high-temperature water-gas shift reaction using waste-derived synthesis gas. Renew. Energy 2020, 145, 2715–2722. [Google Scholar] [CrossRef]
  31. Krótki, A.; Bigda, J.; Spietz, T.; Ignasiak, K.; Matusiak, P.; Kowol, D. Performance Evaluation of Pressure Swing Adsorption for Hydrogen Separation from Syngas and Water–Gas Shift Syngas. Energies 2025, 18, 1887. [Google Scholar] [CrossRef]
  32. Ahn, S.; You, Y.W.; Lee, D.G.; Kim, K.H.; Oh, M.; Lee, C.H. Layered two-and four-bed PSA processes for H2 recovery from coal gas. Chem. Eng. Sci. 2012, 68, 413–423. [Google Scholar] [CrossRef]
  33. Moon, D.K.; Lee, D.G.; Lee, C.H. H2 pressure swing adsorption for high pressure syngas from an integrated gasification combined cycle with a carbon capture process. Appl. Energy 2016, 183, 760–774. [Google Scholar] [CrossRef]
  34. ISO 14040; Environmental Management-Life Cycle Assessment-Principles and Framework 2006. ISO: Geneva, Switzerland, 2006.
  35. ISO 14044; Environmental management-Life cycle assessment-Requirements and guidelines 2006. ISO: Geneva, Switzerland, 2006.
  36. Lijó, L.; González-García, S.; Bacenetti, J.; Fiala, M.; Feijoo, G.; Lema, J.M.; Moreira, M.T. Life Cycle Assessment of electricity production in Italy from anaerobic co-digestion of pig slurry and energy crops. Renew. Energy 2014, 68, 625–635. [Google Scholar] [CrossRef]
  37. School of Chemical, Biological and Materials Engineering. Municipal Solid Waste to Chemical Products: Supplemental Narrative; University of Oklahoma: Norman, OK, USA, 2018. [Google Scholar]
  38. National Energy Technology Laboratory. Syngas Composition. In Gasifipedia; U.S. Department of Energy: Morgantown, WV, USA, 2019. [Google Scholar]
  39. Korea Gas Corporation (KOGAS). 5th Basic Plan for New and Renewable Energy Technology Development, Utilization, and Supply; KOGAS: Incheon, Republic of Korea, 2025. [Google Scholar]
  40. Niu, F.; Wu, Z.; Chen, D.; Huang, Y.; Ordomsky, V.V.; Khodakov, A.Y.; Van Geem, K.M. State-of-the-art and perspectives of hydrogen generation from waste plastics. Chem. Soc. Rev. 2025, 54, 4948–4972. [Google Scholar] [CrossRef]
  41. Niu, M.; Huang, Y.; Jin, B.; Wang, X. Simulation of syngas production from municipal solid waste gasification in a bubbling fluidized bed using aspen plus. Ind. Eng. Chem. Res. 2013, 52, 14768–14775. [Google Scholar] [CrossRef]
  42. Kaszuba, M.; Ziółkowski, P.; Mikielewicz, D. Comparative study of oxygen separation using cryogenic and membrane techniques for nCO2PP. In Proceedings of the 36th International Conference on Efficiency, Cost, Optimization, Simulation and Environmental Impact of Energy Systems (ECOS 2023), Las Palmas de Gran Canaria, Spain, 25–30 June 2023. [Google Scholar]
  43. Tolley, J.; Estupinan, L. Energy Consumption of Pressure Swing Adsorption vs. Vacuum Swing Adsorption—A Thermodynamic Study; Benchmark Oxygen Solutions: Alberta, Canada, 2022. [Google Scholar]
  44. Sun, M.; Song, W.; Zhai, L.F.; Cui, Y.Z. Effective sulfur and energy recovery from hydrogen sulfide through incorporating an air-cathode fuel cell into chelated-iron process. J. Hazard. Mater. 2013, 263, 643–649. [Google Scholar] [CrossRef] [PubMed]
  45. Christopher, L.W.; Paulina, J.; Joe, M.; Constantine, S. Life Cycle Assessment and Grid Electricity: What Do We Know and What Can We Know? ACS Environ. Sci. Technol. 2010, 44, 1895–1901. [Google Scholar] [CrossRef]
  46. Franchi, G.; Capocelli, M.; De Falco, M.; Piemonte, V.; Barba, D. Hydrogen production via steam reforming: A critical analysis of MR and RMM technologies. Membranes 2020, 10, 10. [Google Scholar] [CrossRef]
  47. Elgowainy, A.; Vyawahare, P.; Ng, C.; Frank, E.D.; Bafana, A.; Burnham, A.; Sun, P.; Cai, H.; Lee, U.; Reddi, K.; et al. Environmental life-cycle analysis of hydrogen technology pathways in the United States. Front. Energy Res. 2024, 12, 1473383. [Google Scholar] [CrossRef]
  48. Verma, A. Life Cycle Assessment and Greenhouse Gas Abatement Costs of Hydrogen Production from Underground Coal Gasification. Master’s Thesis, University of Alberta, Edmonton, AB, Canada, 2014. [Google Scholar]
  49. Korea Gas Corporation (KOGAS). Global LNG Outlook 2025; KOGAS: Incheon, Korea, 2025. [Google Scholar]
  50. Afzal, S.; Singh, A.; Nicholson, S.R.; Uekert, T.; DesVeaux, J.S.; Tan, E.C.; Dutta, A.; Carpenter, A.C.; Baldwin, R.M.; Beckham, G.T. Techno-economic analysis and life cycle assessment of mixed plastic waste gasification for production of methanol and hydrogen. Green Chem. 2023, 25, 5068–5085. [Google Scholar] [CrossRef]
  51. Abawalo, M.; Pikoń, K.; Landrat, M. Comparative Life Cycle Assessment of Hydrogen Production via Biogas Reforming and Agricultural Residue Gasification. Appl. Sci. 2025, 15, 5029. [Google Scholar] [CrossRef]
Figure 1. Schematic diagram of the process for hydrogen production from high-calorific mixed waste.
Sustainability 17 10308 g001
Figure 2. Schematic diagram of the syngas cleaning system.
Sustainability 17 10308 g002
Figure 3. System boundary for the LCA of the hydrogen production process.
Sustainability 17 10308 g003
Figure 4. Global Warming Potential (GWP) contribution by process stage.
Sustainability 17 10308 g004
Figure 5. Relative contribution of input materials and utilities to total GWP (100%).
Sustainability 17 10308 g005
Figure 6. Global Warming Potential (GWP) of 1 kg H2 by electricity supply scenario.
Sustainability 17 10308 g006
Figure 7. Sensitivity analysis of total GWP to plant operational lifetime.
Sustainability 17 10308 g007
Table 1. Elemental analysis and heating values of waste samples.
RPF Manufacturing ResidueASRIncineration Feed Waste
   C (wt.%)51.852.839.6
   H (wt.%)7.87.05.3
   N (wt.%)1.115.81.5
   S (wt.%)0.40.70.2
   Cl (wt.%)0.41.40.5
   O (wt.%)18.65.018.0
   Moisture (wt.%)8.51.27.5
   Ash (wt.%)11.416.127.4
   LHV (kcal/kg)573551624143
Table 2. Key thermochemical reactions in the gasifier.
ReactionsEquationΔH (MJ/kmol)
   Combustion reactionC + 1/2O2 = CO−111
CO + 1/2O2 = CO2−283
H2 + 1/2O2 = H2O−242
   Boudouard reactionC + CO2 = 2CO172
   Water-gas reactionC + H2O ↔ H2 + CO131
   Water-gas shift reactionCO + H2O ↔ H2 + CO2−47
   Methanation reactionC + 2H2 ↔ CH4−75
Table 3. Life cycle inventory data per 1 kg of hydrogen produced.
CategoryItemValueUnit
   Input
   Feeding and gasification   Mixed waste28.8kg
       Oxygen23.8Nm3
       Electricity0.630kWh
   Cleaning   Adsorbent (ZnO)0.579kg
       Adsorbent (Na2CO3)93.8g
       Chelated Iron2.68kg
       NaOH0.479kg
       Water49.9kg
       Electricity3.91kWh
   Reforming and separation   Catalyst (Fe-Al-Cu)8.83g
       Steam20.6kg
       Electricity0.721kWh
   Plant construction   Aluminum487mg
       Concrete0.00104m3
       Copper761mg
       Reinforcing steel2.28kg
       Steel (low alloyed)0.114kg
       Diesel0.00381MJ
       Electricity2.28kWh
       Heat0.127MJ
   Output
   Product   Hydrogen1.00kg
   Waste treatment   Wastewater50.4kg
   Solid residue3.28kg
Table 4. Syngas composition at different process stages.
After GasifierAfter WGSAfter PSA
   H2 (vol%)24.7838.9399.99
   CO (vol%)38.7812.66<0.001
   CO2 (vol%)33.4045.93<0.001
   CH4 (vol%)1.551.26<0.001
   CXHY (vol%)1.501.22<0.001
Table 5. Pollutant concentrations at different stages of the cleaning system.
S1S2S3S4S5S6
   Dust (mg/Nm3)36,922.664351.21--7.20<0.001
   HCl (ppm)170.21-21.99NDNDND
   H2S (ppm)1050.27-822.750.230.05ND
Table 6. Global Warming Potential (GWP) per functional unit (1 kgH2).
CategoryItemGWP
(kgCO2-eq)
   Input
   Feeding and gasification   Oxygen1.82 × 100
       Electricity4.35 × 10−1
   Cleaning   Adsorbent (ZnO)4.17 × 10⁻¹
       Adsorbent (Na2CO3)3.99 × 10⁻²
       Chelated Iron1.91 × 100
       NaOH6.96 × 10−1
       Water2.06 × 10−2
       Electricity2.70 × 100
   Reforming and separation   Catalyst (Fe-Al-Cu)1.76 × 10⁻²
       Electricity4.97 × 10−1
   Plant construction   Construction1.21 × 100
   Output
   Product   Hydrogen1.00
   Waste treatment   Wastewater2.35 × 10−2
   Solid residue2.55 × 10−2
Table 7. GWP results of electricity decarbonization scenarios for hydrogen production.
ScenarioElectricity Mix
Description
GWP from
Electricity
Total GWPGWP
Reduction
S1
(Baseline)
Current South Korean
Grid Mix
3.63 kg CO2-eq9.80 kg CO2-eq-
S2
(Current RE)
90% Grid Mix +
10% Renewable Mix
3.30 kg CO2-eq9.47 kg CO2-eq3.40%
S3
(Policy RE)
80% Grid Mix +
20% Renewable Mix
2.96 kg CO2-eq9.14 kg CO2-eq6.80%
S4a
(100% Solar)
100% Solar PV Power0.443 kg CO2-eq6.62 kg CO2-eq32.52%
S4b
(100% Wind)
100% Wind Power0.101 kg CO2-eq6.27 kg CO2-eq36.01%
Table 8. GWP variation with plant operational lifetime.
10 Years20 Years30 Years40 Years
   Total1.10 × 1019.80 × 1009.40 × 1009.20 × 100
   Plant Construction2.41 × 1001.21 × 1008.04 × 10−16.03 × 10⁻¹
Disclaimer/Publisher’s Note: The statements, opinions and data contained in all publications are solely those of the individual author(s) and contributor(s) and not of MDPI and/or the editor(s). MDPI and/or the editor(s) disclaim responsibility for any injury to people or property resulting from any ideas, methods, instructions or products referred to in the content.