Article

Digital Empowerment and Sustainable Tourism: Spatiotemporal Coupling Coordination Analysis of Digital Technology and High-Quality Development in China’s A-Level Scenic Spots

by
Hongmei Dong
* and
Jiali Zeng
College of Management, Xi’an University of Science and Technology, Xi’an 710054, China
*
Author to whom correspondence should be addressed.
Sustainability 2025, 17(22), 10293; https://doi.org/10.3390/su172210293
Submission received: 30 September 2025 / Revised: 2 November 2025 / Accepted: 13 November 2025 / Published: 17 November 2025
(This article belongs to the Special Issue Sustainable Development of Regional Tourism)

Abstract

The rapid advancement of digital technology has profoundly transformed the tourism industry, driving a shift from scale expansion toward high-quality and sustainable growth. However, spatiotemporal nature of digital empowerment’s support for sustainable tourism, particularly under heterogeneous regional conditions, remains insufficiently examined. To address this gap, this study constructs a dual-system evaluation framework and employs the entropy method to measure the spatiotemporal Coupling Coordination Degree (CCD) between digital technology and tourism development of A-Level Scenic Spots across 30 Chinese provinces (2013–2020). The entropy method is employed to build indicator systems for both subsystems, and CCD is calculated to assess the interaction strength and coordination level. The results reveal that: (1) A-level scenic spot development exhibits significant spatial heterogeneity, declining clearly from Eastern/Central to Western/Northeast regions; (2) CCD showed a general upward trend during 2013–2019 and it followed a nonlinear trajectory of decline first but then recovery, establishing a stable spatial pattern: East > Central > West/Northeast; (3) The COVID-19 pandemic in 2020 caused a temporary drop in CCD nationwide, but regional resilience varied considerably; (4) Provinces in the disordered stage are generally of the digital technology lagging type. Economic foundation, digital facilities, industrial structure and innovation capability are key drivers of coordination differences. We propose that leading regions should focus on cross-regional data sharing and green-smart upgrading, while lagging regions must prioritize digital infrastructure investment and talent introduction to effectively bridge the digital divide and foster equitable and high-quality sustainable tourism development. This study provides new insights for promoting regional sustainability through digital technology development and offers policy recommendations for advancing digital–tourism synergy in different regional contexts.

1. Introduction

Tourism is widely regarded as an important driver of economic growth, cultural exchange, and regional sustainable development. Against the backdrop of the global tourism industry’s transformation from scale expansion to quality enhancement, promoting high-quality tourism development (HQTD) has become a hot topic in national strategies and local policies [1,2,3]. In particular, within the context of China’s dual carbon goals, rural revitalization, and common prosperity, sustainable tourism has been tasked with promoting regional coordination, cultural inheritance, and ecological civilization construction [4,5,6]. However, traditional tourism still faces challenges [7,8] such as inefficient resource allocation, unbalanced regional development, homogeneous visitor experiences, and increasing ecological pressures. These issues urgently require systematic transformation and upgrading through the application of new technologies.
With the rapid development of the digital economy, digital technology has increasingly reshaped tourism production and consumption patterns [1,7,9]. Tourism digitalization has become an essential catalyst for improving service quality and sustainable competitiveness. Technologies such as big data, artificial intelligence, cloud computing, and intelligent sensing have improved tourism services, optimized governance efficiency, and enhanced visitors’ experience, thereby promoting the transformation of tourism toward smart and sustainable development [10,11,12,13]. The Chinese government has clearly stated the need to accelerate the construction of digital infrastructure, and the 14th Five-Year Plan for Tourism Development also emphasizes the need to promote the development of smart tourism and enhance the digitalization of tourism. In this context, digital technologies have become not merely supplementary tools for the tourism industry, but rather the core engine driving its shift toward high-quality development [9,14,15].
In China, A-level scenic spots (ALSSs) (1A–5A) represent the highest-quality tourism attractions officially certified by the government and form the backbone of tourism competitiveness nationwide. By December 2024, China had about 16,541 ALSSs, including 358 rated 5A, 4792 rated 4A and 8397 rated 3A, distributed unevenly across regions. The eastern region hosts a higher concentration of 4A–5A scenic areas, such as the Forbidden City (Beijing, China), West Lake (Zhejiang, China), and Mount Tai (Shandong, China), whereas western provinces like Qinghai and Xinjiang contain fewer but larger-scale natural attractions such as Qinghai Lake and Kanas National Park. These sites serve as the backbone of the national tourism system and as indicators of regional tourism quality and governance capacity.
The integration of digital technologies into these attractions has not only reshaped visitor experiences and service delivery but also played an increasingly important role in scenic area governance, resource allocation, and industry coordination [16,17,18]. Despite their importance, research has not sufficiently examined how digital empowerment supports quality upgrading within these destinations, particularly under regional development disparities. The current development of ALSSs in China still faces challenges such as regional imbalances, irrational supply structures, and weak digital infrastructure. The empowering effects of digital technologies have not been fully realized [19,20]. Moreover, the concept of high-quality development in tourism has yet to form a unified evaluation framework, and there is a lack of systematic research on the logical relationship between quality and digital empowerment.
Existing studies focus on macro [21,22] or technological aspects [8,23,24] but overlook spatial coordination between digital technology and tourism quality. Research on whether and how digital technologies and tourism development are coordinated is still in its early stages [3], typically limited to qualitative or case-based approaches [4,25], particularly the lack of studies that empirically measure the coupling and coordination degree between digital technologies and tourism development at the micro-level of ALSSs. To date, few provincial-level analyses [4,18,26] have employed the coupling-coordination degree model to examine the digital economy and tourism economy dyad, and none have disaggregated the tourism subsystem to the A-level scenic-spot scale. There is also a gap in analyzing the spatial heterogeneity [23,27] and relative development status of digital empowerment in these areas [7,28,29]. Although the aforementioned studies confirm the existence of spatial heterogeneity, they remain at the province or prefecture scale and stop short of tracing stage evolution, quantifying the relative development degree between digital technology and scenic-spot quality, and identifying which specific provinces are digital-leading, tourism-leading or synchronous.
From a sustainability perspective, digital tourism development is expected to enhance efficiency, reduce environmental pressure, and promote inclusiveness. However, the coordination relationship between digital technology and high-quality tourism development remains unclear: (1) Are digitalization and tourism development progressing synchronously? (2) Do regions with advanced digital infrastructure benefit more significantly? (3) What factors drive or hinder coordination? These questions remain insufficiently addressed in current research, hindering policymaking aimed at balanced digital tourism development in China. To fill these gaps, this study aims to develop a dual-system evaluation framework to analyze the spatiotemporal coupling between digital technology and high-quality tourism development, examine regional disparities and coordination stages across 30 Chinese provinces from 2013 to 2020, and identify the main drivers of regional disparities and propose targeted sustainable development strategies. This study contributes to a deeper understanding of sustainable tourism transformation in the digital era and supports evidence-based decision-making in regional tourism planning.

2. Literature Review

2.1. High-Quality Tourism Development and Sustainability Transition

High-quality tourism development (HQTD), as the core objective of the tourism industry’s transformation and upgrading in the new era, has gradually shifted from scale expansion to a balance of quality efficiency and sustainability. Guided by the Sustainable Development Goals (SDGs), tourism quality improvement increasingly focuses on industrial upgrading, innovation-driven growth, and ecological protection. Existing studies [21,30,31] generally agree that HQTD should encompass multiple dimensions, including economic efficiency, ecological environment, social and cultural factors, public services, and innovation capacity. For example, Liu and Tang [21] constructed an evaluation system based on China’s inter-provincial panel data, covering tourism resource utilization efficiency, environmental quality, tourist satisfaction, and regional coordination, emphasizing the importance of green and low-carbon growth and inclusive development. Wang et al. (2024) [32] further proposed that HQTD should possess resilience, which refers to the ability to recover and adapt to shocks such as pandemics. HQTD emphasizes culture–environment–economy synergy, shifting from scale expansion toward green, inclusive, and resilient growth. Digital empowerment plays a pivotal role in this transition: facilitates intelligent services and smart mobility; improves heritage and environmental monitoring; enhances stakeholder participation and equitable accessibility. Thus, digitalized tourism transformation represents a key pathway to sustainability.
Evaluation methods for HQTD commonly employ models such as the coupling coordination degree model, entropy-TOPSIS, and DEA efficiency models [18,32,33]. Additionally, space econometric methods are frequently utilized to reveal regional differences and evolutionary trends [26]. Liu & Tang (2022) [21] suggested five dimension to evaluate evaluation of tourism development quality, there are concept, driving forces, structure, efficiency, and goals. This reflects a broader disciplinary shift from static evaluation using single economic indicators toward dynamic monitoring and comprehensive multi-dimensional assessment, thereby providing robust theoretical support for policymaking and regional planning.
Furthermore, the deep integration of digital technologies is establishing technology empowerment as a critical new dimension in measuring tourism quality [9,15,22,34,35]. For instance, smart tourism infrastructure, digital cultural tourism integration, and immersive experiences not only enhance visitor satisfaction but also serve as crucial drivers for optimizing the tourism industry structure and upgrading the value chain [24,36]. Consequently, constructing an HQTD indicator system that incorporates both digital technology application and scenic area supply quality has become an inevitable trend in current research [8,24,37]. However, most of this emerging research remains at the macro-level, lacking the micro-level empirical analyses necessary to focus on ALSSs as the core carriers.

2.2. The Application of Digital Technology in the Tourism Industry and Scenic Spots

Digital technology has been recognized as a key enabler of tourism innovation, enhancing service efficiency, operational intelligence, and visitor engagement. Technologies such as big data analytics, AI-powered recommendation, and cloud-based governance systems improve destination competitiveness and support refined management [11,38,39,40]. Pencarelli (2020) [10] pointed out that digital platforms, mobile applications, and big data analytics significantly enhance the personalization of tourism services and operational efficiency. In recent years, emerging technologies such as artificial intelligence (AI), augmented reality (AR)/virtual reality (VR) [41,42], blockchain, and the Internet of Things (IoT) have gradually embedded themselves into scenic area management and service processes [13,38]. For example, Kong et al. (2025) [43] proposed a smart tourism framework based on total quality management, emphasizing the systemic role of digital technologies in controlling visitor flow, monitoring service quality, and achieving sustainable development. Carlisle & Ivanov (2023) [14] discussed the critical prerequisite of enhancing digital literacy among tourism workers for enabling technology empowerment. In the Chinese context, research has increasingly focused on the application of digital technologies in rural revitalization and cultural tourism integration, with Yang & Ning (2025) [24] exploring the symbiotic mechanisms driven by digitalization and highlighting the role of technological interventions in revitalizing cultural heritage and promoting community participation.
Digital technologies in the tourism industry have evolved from being auxiliary tools to becoming core drivers. Studies [12,42,44] demonstrate that digitalization accelerates smart tourism development, reshaping tourism value chains from production to consumption. Research on these technologies has concentrated on three main areas: (1) immersive experience innovation, with widespread applications of VR/AR, digital twins, and holographic projections in cultural heritage activation [43,44]; (2) intelligent service upgrades, such as AI-guided tours, smart itinerary planning, and real-time crowd control, significantly enhancing both the operational efficiency of scenic spots and the visitor experience [8,14,45]; and (3) operational optimization, where IoT, big data platforms, and 5G networks are used for resource scheduling, environmental monitoring, and safety alerts in scenic spots [16,28]. Digital technologies contribute to sustainability goals by improving resource allocation efficiency [39], reducing environmental pressure, and enabling low-carbon tourism behavior.
However, the empowerment of digital technologies is not a one-size-fits-all solution. Some studies [46,47] highlight that regions in the central and western parts of China, as well as the northeast, face difficulties in implementing digital technologies due to insufficient infrastructure, a lack of interdisciplinary talent, and long investment return cycles, leading to the underutilization of digital technology In the domain of rural cultural tourism, digitally driven mechanisms for sustainable integration have emerged as a prominent research frontier [24]. Concurrently, the digital economy’s role in advancing industrial structure optimization has been well-documented in the tourism sector [48]. Furthermore, studies examining the spatial effects of the digital economy on high-quality agricultural development [49] offer valuable methodological and empirical references for exploring regional disparities in the adoption and application of digital technologies across tourist attractions. Therefore, identifying the match and synchronization between digital technology development and the enhancement of scenic area quality has become crucial in understanding regional tourism development disparities.

2.3. The Coupling Coordination of Digital Technologies and Tourism Scenic Area Development

The concept of coupling coordination has recently emerged as a theoretical tool for evaluating dynamic relationships between complex systems, but its application to tourism digitalization remains in early development [2,19,44]. As digital technologies further integrate into tourism, researchers have started focusing on the coupling and coordination relationship between digital technologies and tourism development, aiming to determine whether these two factors progress in tandem or remain unbalanced. The majority of studies use coupling coordination degree models (CCDM), spatial Durbin models, and threshold regression methods to explore the interaction mechanisms between the digital economy and tourism development [17,26]. For instance, Shu et al. (2024) [26] found that the coupling coordination degree between the digital economy and high-quality tourism development generally shows an upward trend, but regional disparities are significant, with the eastern regions outperforming the central and western areas.
CCDM has been widely applied in the analysis of the digital economy-tourism-ecology triad [50]. For example, Wang et al. (2024) [18] observed that the coupling coordination degree between digital technology and high-quality tourism development continues to improve, with significant regional differences, and the eastern region leads clearly. Ma et al. (2023) [31] further noted that digital technology’s positive impact on tourism economy exhibits a threshold effect, meaning that its positive influence becomes significant only when a region’s digitalization level reaches a certain threshold.
Some studies have also focused on nonlinear relationships and spatial spillover effects [17]. Liu et al. (2022) [21] found that digital technology’s impact on tourism economy follows a threshold effect—only when a region’s digital level surpasses a certain threshold does it significantly affect tourism quality. Moreover, research on the digital-tourism-ecology triad’s coupling coordination has started to emphasize the role of green development in the technological embedding process [50]. Some studies have also incorporated the ecological environment into the coupling coordination analysis of the digital economy and tourism development [51], thereby broadening the analytical dimensions of coupling coordination research. At the same time, investigations at the provincial level into the driving factors of coupling coordination between the digital economy and high-quality tourism development [26], as well as evidence on the role of the digital economy in enhancing the resilience of the tourism economy [22], provide additional perspectives for deepening the understanding of the coupling coordination relationship between digital technologies and the development of tourist attractions.
In conclusion, studies on the coupling of digital technologies and tourism development are moving from whether coordination exists to how coordination occurs, from static assessment to dynamic evolution, providing a theoretical basis and policy insights for the construction of a sustainable smart tourism system. However, research remains limited few studies assess whether digital and tourism subsystems develop harmoniously, particularly under regional disparities.
Nonetheless, most current studies focus on the macro coupling between digital economy and tourism economy and lack empirical analysis at the micro level of tourism spaces, particularly overlooking the measurement and classification of relative development levels. The coordination mechanism underlying digital–tourism interaction remains insufficiently examined, and spatiotemporal divergence and drivers of sustainable digital tourism transformation lack systematic empirical verification. This paper addresses this gap by proposing a dual-system coupling framework between digital technology and high-quality scenic area development, systematically revealing their spatial patterns and evolutionary stages, thus filling the gap in current research.

2.4. Measuring the Digital Economy and Digital Technologies

Quantitative research on the digital economy and digital technologies has expanded rapidly over the past decade [9,28,52], accompanied by major advances in indicator construction. However, t existing measurement systems remain fragmented. Some studies emphasize macro-level composite indices of informatization [21], while others rely on single proxy variables such as internet penetration or mobile phone ownership [22]. These differences result in limited comparability, low spatiotemporal resolution, and weak policy relevance. As digital technologies evolve rapidly, traditional economic indicators can no longer capture the dynamic nature of the digital economy. Therefore, updated frameworks integrating new digital and economic dimensions are needed.
In recent years, Shen et al. (2023) [53] and He et al. (2023) [5] proposed a dual-dimensional framework for digital technology development, adhering to the principles of comprehensiveness, consistency, and data availability. This framework defines digital technology based on two key dimensions: digital infrastructure and digital talent. The former includes mobile phone, internet penetration rate, fiber optic cable length, mobile phone switch capacity, and internet broadband access points, which collectively reflect the level of digital infrastructure in a region. The latter, referring to the number of information technology employees, serves as a proxy for the supply of digital technology talent, an essential element for the development of the digital economy.
In contrast to infrastructure, digital technology application focuses on the practical utilization of technologies within the socio-economic sphere. This dimension is measured by indicators (Table 1) such as websites per 100 businesses, the proportion of businesses in e-commerce t, total e-commerce sales, overall telecom business volume, and the output value of software and information technology services. However, existing studies mostly focus on provincial-level digital economy composite indices, which lack a direct correlation with micro-level tourism spatial units (e.g., scenic spots). Furthermore, these studies often fail to incorporate the dynamic characteristics of indicator weights over time.
Building on the aforementioned research gaps, this paper makes two core methodological contributions: First, we refined previous framework [5,53] into 11 available provincial-level indicators (Table 1). Second, we apply the entropy weight method to assign annual dynamic weights to these indicators, constructing a comprehensive Digital Technology Development Index for 30 provinces in China from 2013 to 2020. This index is then coupled with the High-Quality Scenic Area Development Index for measurement. This integrated approach serves a dual purpose: it effectively bridges the scale gap between macro-level digital economy measurements and micro-level scenic area research, while simultaneously providing a verifiable and replicable quantitative tool for revealing the spatiotemporal evolution of digital technology’s empowerment of scenic area quality.
In the practice of integrating the digital economy with the tourism industry, different regions encounter unique challenges [54]. Research on the coordination models and driving mechanisms between the digital economy and high-quality tourism development [18], as well as studies examining their coupled interactions [32], collectively underscore the heightened necessity for refining the measurement systems of digital technologies. Specifically, to accurately capture and reflect actual development dynamics, measurement indicators must be improved. Therefore, improving and applying this measurement system is of significant practical necessity and academic value for promoting smart tourism’s refined management and regional differentiated policymaking.

3. Data and Methods

3.1. Data Sources

All 31 provincial-level regions are categorized according to the four major regions defined by the National Bureau of Statistics of China, reflecting distinct levels of economic development, industrial structure, and digital infrastructure (Table 2). The eastern region represents economically advanced and highly urbanized areas; the central region features transitional industrial structures; the western region is resource-oriented with weaker infrastructure; and the northeast is characterized by industrial restructuring. The western region is resource-oriented with weaker infrastructure; and the northeastern region is characterized by industrial restructuring. This study examines 30 provincial-level regions in China (excluding Tibet, Hong Kong, Macao, and Taiwan due to data unavailability). The research period spans from 2013 to 2020, with the consistency and availability of data being key considerations in determining the time frame. Data for 2021–2024 were excluded due to pandemic-related disruptions and methodological inconsistencies in provincial reporting. The digital technology indicators used in this study, including mobile phone penetration rates, internet penetration rates, fiber optic cable lengths, mobile phone switch capacities, internet broadband access points, the number of websites per 100 businesses, the proportion of businesses engaged in e-commerce, e-commerce sales, total telecom business volume, etc., are sourced from the China Statistical Yearbook (2013–2020) and the national economic and social development statistical bulletins of each province. Data on the output value of software and information technology services and employment in IT services are drawn from the China Tertiary Industry Statistical Yearbook (2013–2020). The data on tourism infrastructure indicators including the number of local travel agencies, hotels, customer numbers, bed numbers, rail transport mileage, highway transport mileage, and civil aviation passenger traffic come from the China Tourism Statistical Yearbook (2013–2020). The data on scenic spot-related indicators for the number of ALSSs, employment numbers, construction investment, visitor numbers, tourism income, and tourism income composition are sourced from the China Tourism Scenic Spot Development Report (2013–2020). Current research on digital tourism and smart development [28], as well as analyses of the opportunities and challenges of the digital economy in the new era of technological communication [52], both highlight that accurate and comprehensive data form the foundation of related studies. Accordingly, the selection of data sources in this research also draws on these studies’ emphasis on data quality requirements.

3.2. Construction of Evaluation Index System

The connotation of high-quality tourism development is not yet uniformly defined in academia. Previous studies have constructed measurement indicators from perspectives such as input–output performance [30], the new development paradigm [31], and the sustainable development goals (SDGs) of tourism [5]. Based on supply–demand theory, the essence of high-quality tourism development lies in reducing ineffective supply, expanding effective supply, improving supply quality, and enhancing the adaptability between supply and demand.
Accordingly, the high-quality development of ALSSs should emphasize both the scale and structural quality of scenic spot resources, improve their utilization efficiency and economic benefits, and strengthen alignment with supporting infrastructure. This ensures harmony between A-level scenic spot supply, tourist demand, tourism economy, and infrastructure development.
Following the principles of data availability, indicator consistency, and scientific rigor, and building on prior research [21,31,55], we construct an evaluation system from three dimensions: tourism infrastructure supply, A-level scenic spot supply, and tourism economic development (Table 3).
To ensure comparability among scenic spot grades, we adopt the 1A-equivalent weights (5A = 20, 4A = 16.67, 3A = 10, 2A = 3.33, 1A = 1) calibrated by Wang et al. (2022) [30] from average annual visitor capacity and revenue per grade, and measure industrial upgrading via the ratio of non-basic to basic tourism revenue. we standardized the data by converting the number of 2A–5A scenic spots into 1A equivalents’ using proportional weights derived from average visitor capacity and economic scale contributions Visitor volume and tourism revenue per 1A scenic spot are then calculated accordingly. This approach reflects both spatial capacity and economic value differentials.
The Industrial Structure Upgrading Index (ISU) captures the regional shift from primary and secondary industries toward tertiary and digital service sectors. It was included as a control variable to account for the underlying economic transformation influencing the coupling coordination between digital and tourism systems. It is measured by the ratio of non-basic tourism consumption (e.g., shopping, entertainment, performances) to basic tourism consumption (e.g., transportation, accommodation, catering). This indicator measures the proportion of tertiary industry value added and reflects the level of structural optimization in regional economies [56]. It is included as a supporting variable in the coupling coordination framework, representing the internal economic basis that mediates the relationship between digital empowerment and tourism quality.
Based on the principles of data availability, consistency, and scientific rigor, this study constructs an evaluation index system for the high-quality development of ALSSs, drawing on previous research [30,31,55]. The system covers three dimensions: tourism infrastructure supply, ALSS supply, and economic development of ALSSs (Table 3). Specifically, the calculation of visitors per A-class scenic area and tourism revenue per A-class scenic area is based on the reference visitor volume standards for different ALSSs. The number of ALSSs in each province is adjusted to the equivalent of one A-class scenic area using the following conversion Equation:
1A ALSS equivalent = 5A × 20 + 4A × 16.67 + 3A × 10 + 2A × 3.33 + 1A
Then, the actual number of visitors and tourism revenue for each province’s ALSS is divided by their respective 1 A-class scenic area equivalent values. The advanced industrial structure of scenic spots is measured by the ratio of non-essential tourism consumption income (such as shopping, entertainment, and performance revenue) to essential tourism consumption income (such as transportation, accommodation, and catering revenue). This ratio can represent the level of industrial upgrading and optimization of the tourism sector [56].

3.3. Research Methods

This study uses the entropy method to measure the digital technology development and high-quality development levels of ALSSs. The Equation for this is:
T C D θ i = j m W j · Y θ i j  
D E θ i = j m W j · X θ i j
where TCDθi in Equation (1) represents the high-quality development index of ALSSs, Wj denotes the weight of the j-th scenic spot development indicator, and Yθij is its observed value, Similarly, DEθi in Equation (2) denotes the digital technology development index of province i in year θ; Wj is the weight of the j-th digital technology indicator; and Xθij is the actual value of indicator j in province i in year θ. Both Wj and W’j are determined by the entropy method, which utilizes actual data from each sample, thereby reflecting the utility value of information entropy and minimizing subjectivity in determining the weights.

3.4. Coupling Coordination Degree Model

The coupling coordination degree model (CCDM) is an important method for studying the synergistic relationships between two or more variables and analyzing the degree of interaction and influence among them. It has become a crucial tool for examining the coordinated development of regional socio-economic systems [4]. This study applies the modified coupling coordination degree model proposed by Wang et al. (2021) [57] to measure the coupling coordination degree between digital technologies and the high-quality development of ALSSs. The related equations are as follows:
C = 1 i > j , j = 1 n U i U j 2 m = 1 n 1 m × i = 1 n U i m a x U i 1 n 1
T = i = 1 n a i × U i , i = 1 n a i = 1
D = C × T  
In the Equation, n represents the number of subsystems; Ui and Uj are the normalized values of the i-th and j-th subsystems, with their distribution range being [0,1]; C ∈ [0,1] represents the coupling degree in Equation (3); ai is the weight of the i-th subsystem; T ∈ [0,1] is the comprehensive evaluation index in Equation (4); and CCD ∈ [0,1] represents the coordination development degree (CCD) in Equation (5).
Based on the previous research [30,57], the coupling coordination development stages and relative development levels are divided as follows:
Disordered stages: CCD ∈ [0,0.1) extreme disorder, [0.1,0.2) severe disorder, [0.2,0.3) moderate disorder, [0.3,0.4) mild disorder.
Transitional stages: CCD ∈ [0.4,0.5)near disorder, [0.5,0.6) barely coordinated.
Coordinated stages: CCD ∈ [0.6,0.7) primary coordination, [0.7,0.8) intermediate coordination, [0.8,0.9) good coordination, [0.9,1.0] high-quality coordination.
Relative development degree (RDD) is defined as follows:
0 < RDD ≤ 0.8: digital technology lagging type;
0.8 < RDD ≤ 1.2: synchronous development type;
RDD > 1.2: digital technology leading type.

4. Empirical Analysis

4.1. Spatiotemporal Characteristics of the High-Quality Development Index of ALSSs

Based on Equation (1), the spatiotemporal characteristics of the High-Quality Development Index (HQDI) of A-class scenic areas in 30 Chinese provinces from 2013 to 2020 are illustrated in Figure 1 (blue represents good development levels, green indicates medium, and orange reflects poor performance). From a temporal perspective, between 2013 and 2019, the HQDI of 15 provinces—including Hebei, Shanxi, and Shanghai—exhibited either steady growth or fluctuating upward trends, reflecting continuous improvements in scenic area development quality. In contrast, the HQDI of the remaining 15 provinces remained relatively stable, generally at low to medium levels. In 2020, under the shock of the COVID-19 pandemic, all provinces experienced a significant decline in HQDI [58,59]. The decrease was particularly notable in eastern provinces such as Beijing and Guangdong (15–20%), whereas western provinces such as Qinghai and Ningxia experienced relatively smaller declines (5–8%) due to lower baselines. Nevertheless, the results clearly demonstrate the widespread negative impact of the pandemic on the quality of tourism development nationwide.
From a temporal perspective, between 2013 and 2019, 15 provinces—including Hebei, Shanxi, Shanghai, Zhejiang, Anhui, Shandong, Henan, Hubei, Hunan, Guangdong, Guangxi, Chongqing, Sichuan, Shaanxi, and Gansu—showed a steady or fluctuating increase in their indices, suggesting continuous improvements in development quality. In contrast, other provinces exhibited relatively stable development levels. In 2020, however, the outbreak of COVID-19 led to a sharp decline in the indices across all provinces [60], reflecting a significant reduction in tourism development quality.
From a spatial perspective (Figure 1), among the 10 high-value provinces (HQDI > 0.006)—including Beijing, Shanghai, and Jiangsu—eight are located in the eastern region (Figure 1a), with only Sichuan (west) (Figure 1c) and Hunan (central) (Figure 1b) belonging to non-eastern areas. This highlights the eastern region’s advantages in scenic resource allocation and service quality. Conversely, the seven low-value provinces (HQDI < 0.003), including Inner Mongolia, Jilin, and Heilongjiang, are concentrated in the western (Figure 1c) and northeastern (Figure 1d) regions. These provinces typically face challenges such as low scenic area density (<0.5 sites per 10,000 km2) and a limited proportion of high-grade scenic areas (less than 10%). Collectively, these patterns confirm the intensive and efficient in the east versus extensive and inefficient in the west spatial lock-in effect in the development of A-class scenic areas in China, which logically corresponds to the eastern region’s more advanced tourism infrastructure and stronger visitor consumption capacity. Studies on multi-scale spatial deconstruction and simulation-based evaluation [36], together with analyses of the evolving patterns of high-quality tourism development at the prefectural level [61], have also revealed similar regional differentiation characteristics. These findings further validate the generalizability of this study’s conclusions regarding the spatial distribution of high-quality development in ALSSs.

4.2. Spatiotemporal Characteristics of Digital Technology Development

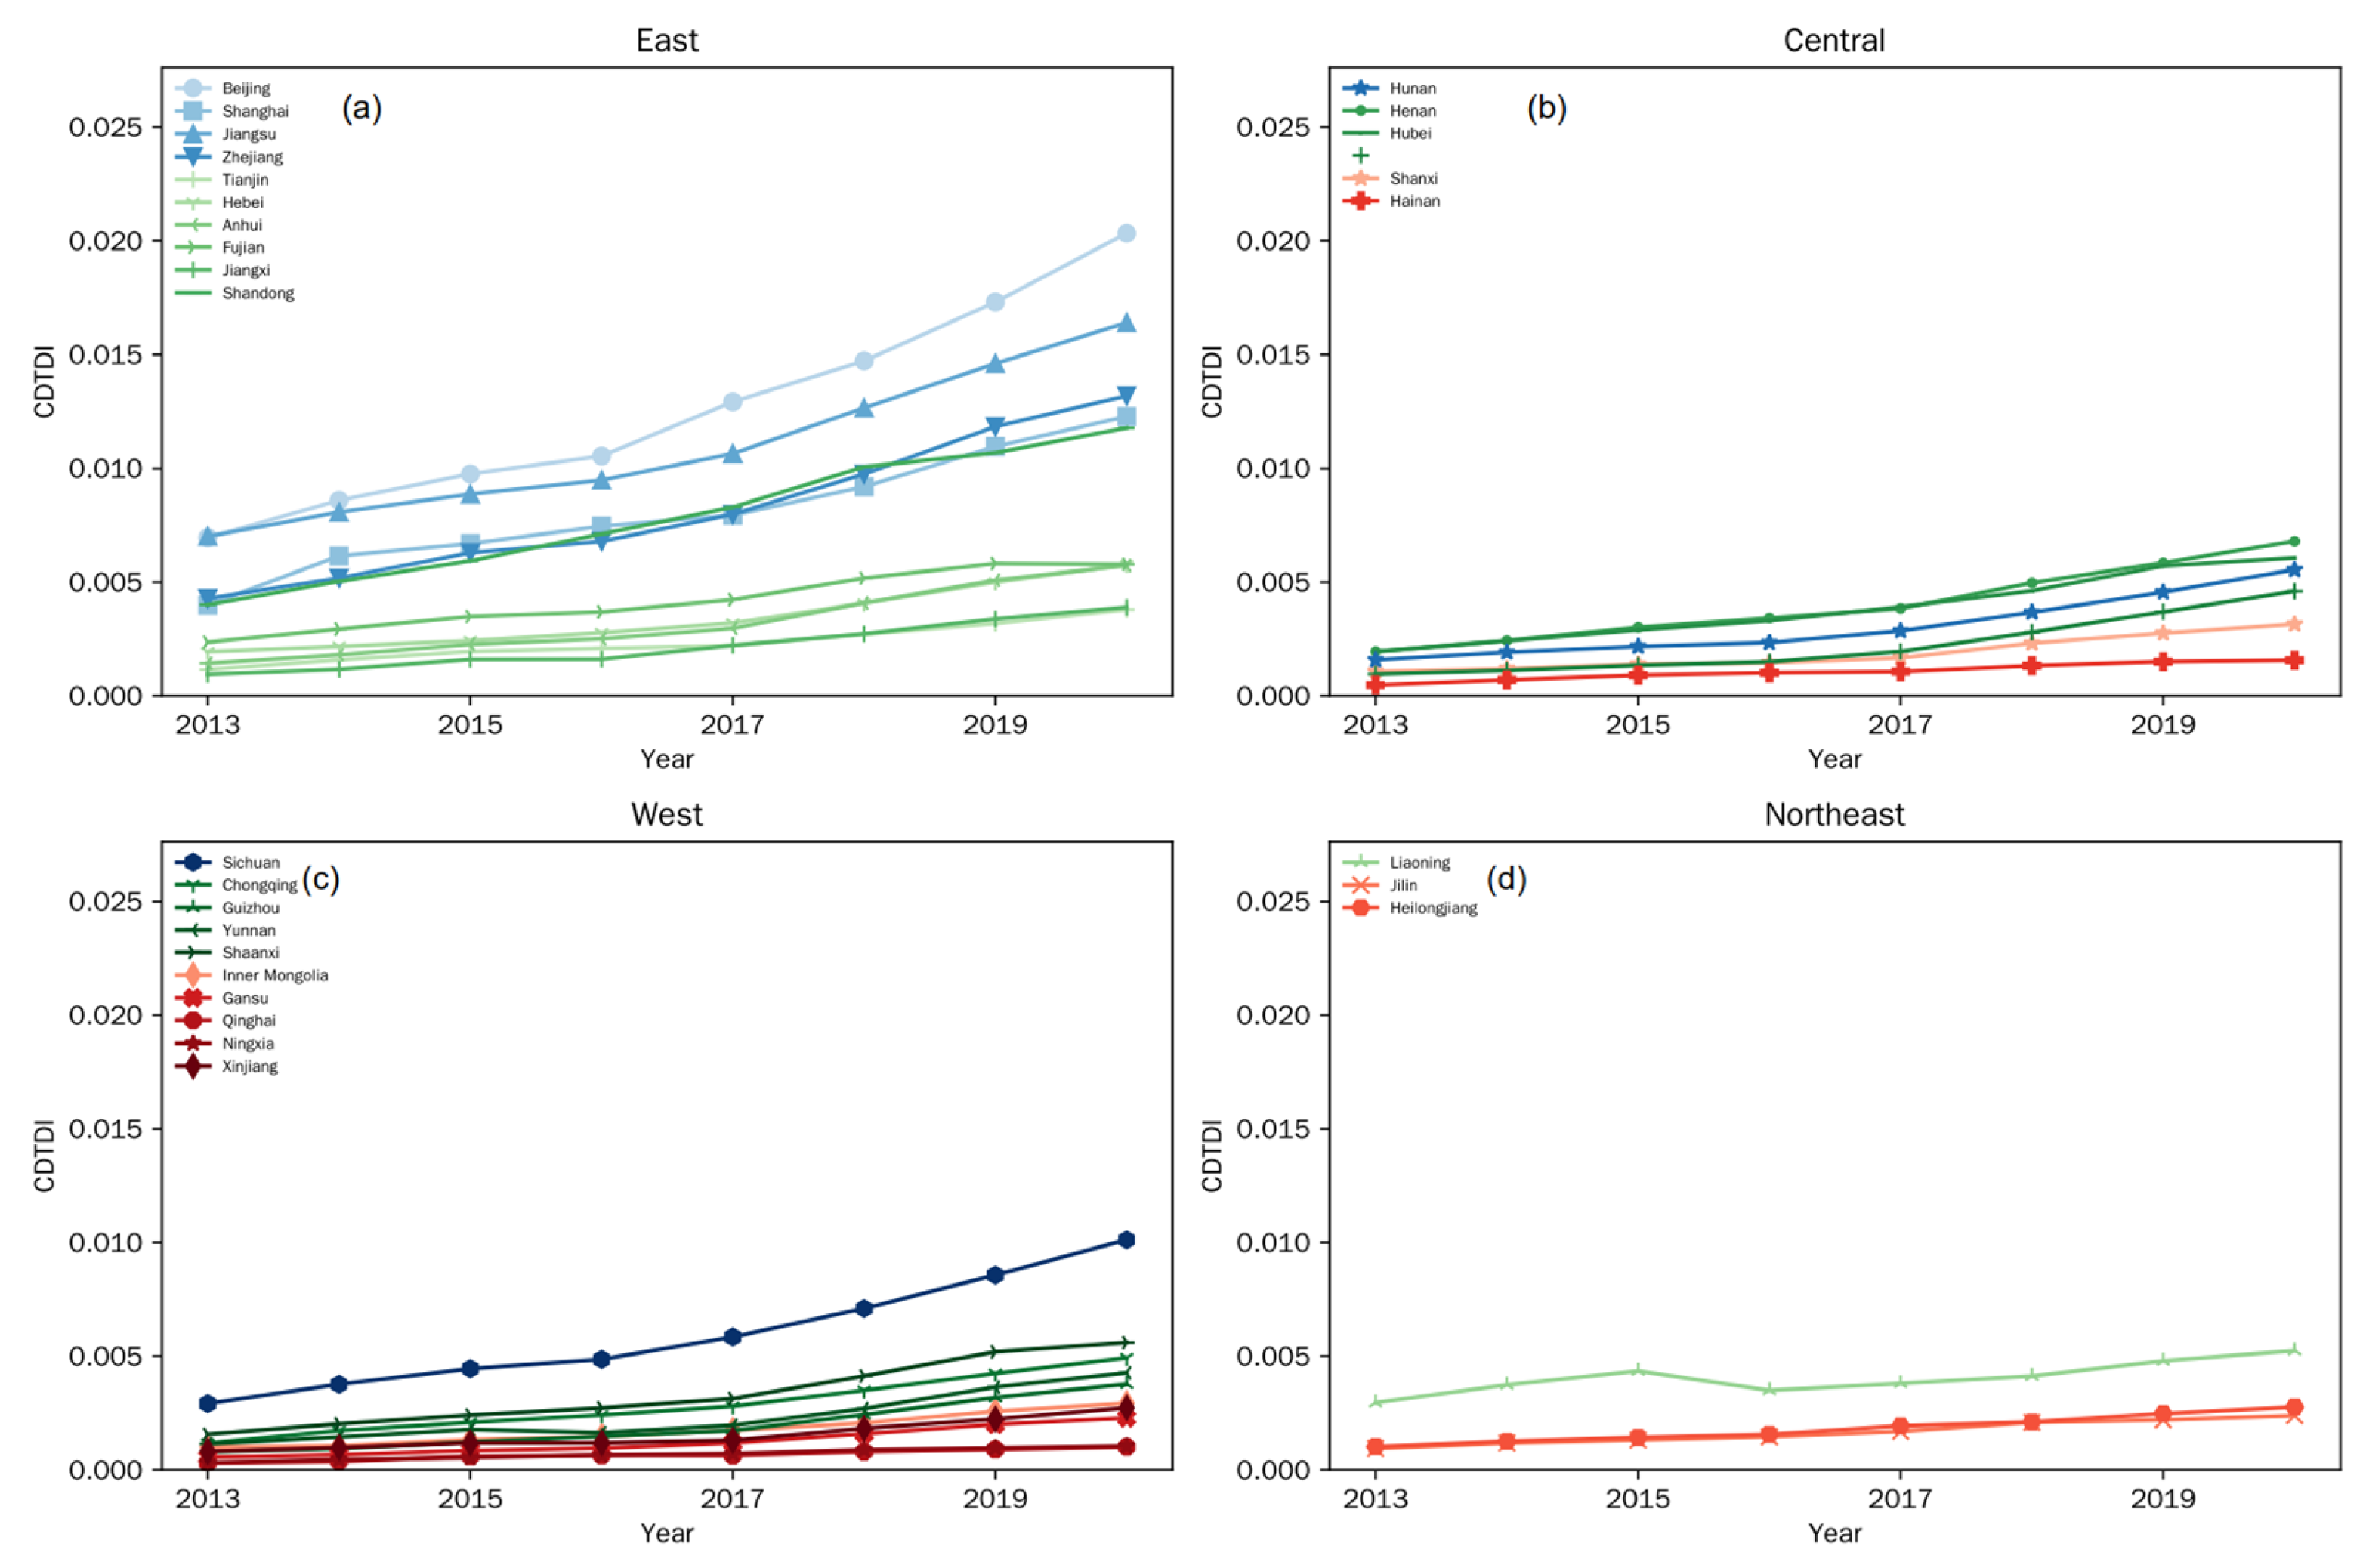
Figure 2 illustrates the change trends and spatial disparities in the Comprehensive Digital Technology Development Index (CDTDI) for 30 provinces from 2013 to 2020, as calculated by Equation (2).
Temporally, the national CDTDI increased steadily from 0.005–0.010 in 2013 to 0.010–0.025 in 2020, with an average annual growth rate of 12.3%. Even during the pandemic in 2020 [18,60], the CDTDI maintained a positive growth of 3.5%, indicating the resilience of China’s digital technology sector. The eastern provinces grew faster (4.2%) than central and western ones (2.8–3.0%), supported by sustained investment in digital infrastructure such as 5G base stations and data centers.
Spatially, the CDTDI showed a pattern of core polarization in the east, with a gradient decline toward the central and western regions (Figure 2). In the east (Figure 2a), six provinces including Beijing, Shanghai, and Jiangsu, consistently remained in the high-value range (CDTDI > 0.020). These provinces had high internet penetration rates (>70%) and strong software and information industries, accounting for over 65% of the national total. In the central region (Figure 2b), provinces such as Hubei, Hunan, and Henan maintained moderate growth, with CDTDI values rising gradually but remaining below 0.015. Their digital expansion mainly focused on e-government platforms and basic e-commerce applications. In the west (Figure 2c), most provinces, such as Gansu, Ningxia, and Xinjiang, remained in the low-value range (CDTDI ≤ 0.010), reflecting limited digital infrastructure and weaker industrial bases. Notably, S Sichuan stood out with CDTDI ≈ 0.018, ranking as the only western province in the medium-to-high range. This advantage was largely driven by the clustering effects of Chengdu’s rapidly growing digital industry, which demonstrated the catalytic role of core cities in regional digital development. In the northeast (Figure 2d), Liaoning showed relatively stable progress, while Jilin and Heilongjiang lagged behind, remaining below 0.008 throughout the study period. The region’s industrial restructuring challenges and limited innovation inputs constrained its digital transformation capacity.
Overall, nine provinces with CDTDI ≤ 0.010, mainly in the northwest and northeast—accounted for nearly 78% of all low-value regions. Their optical cable length (<500,000 km) and IT workforce (<50,000) were only one-fifth to one-third of those in high-value eastern provinces. These gaps underscore how disparities in digital infrastructure remain a major obstacle to balanced regional development. Recent studies [1,19,22,26] on the empowering role of digital technologies in cultural heritage preservation and high-quality tourism development similarly emphasize that regional digital imbalances significantly shape the scale and efficiency of digital empowerment. The spatial divergence observed here therefore reflects a broader structural feature of China’s digital transformation.

5. Coupling Coordination Analysis Between Digital Technology and the High-Quality Development of ALSSs

5.1. Analysis of Coupling Coordination Relationships

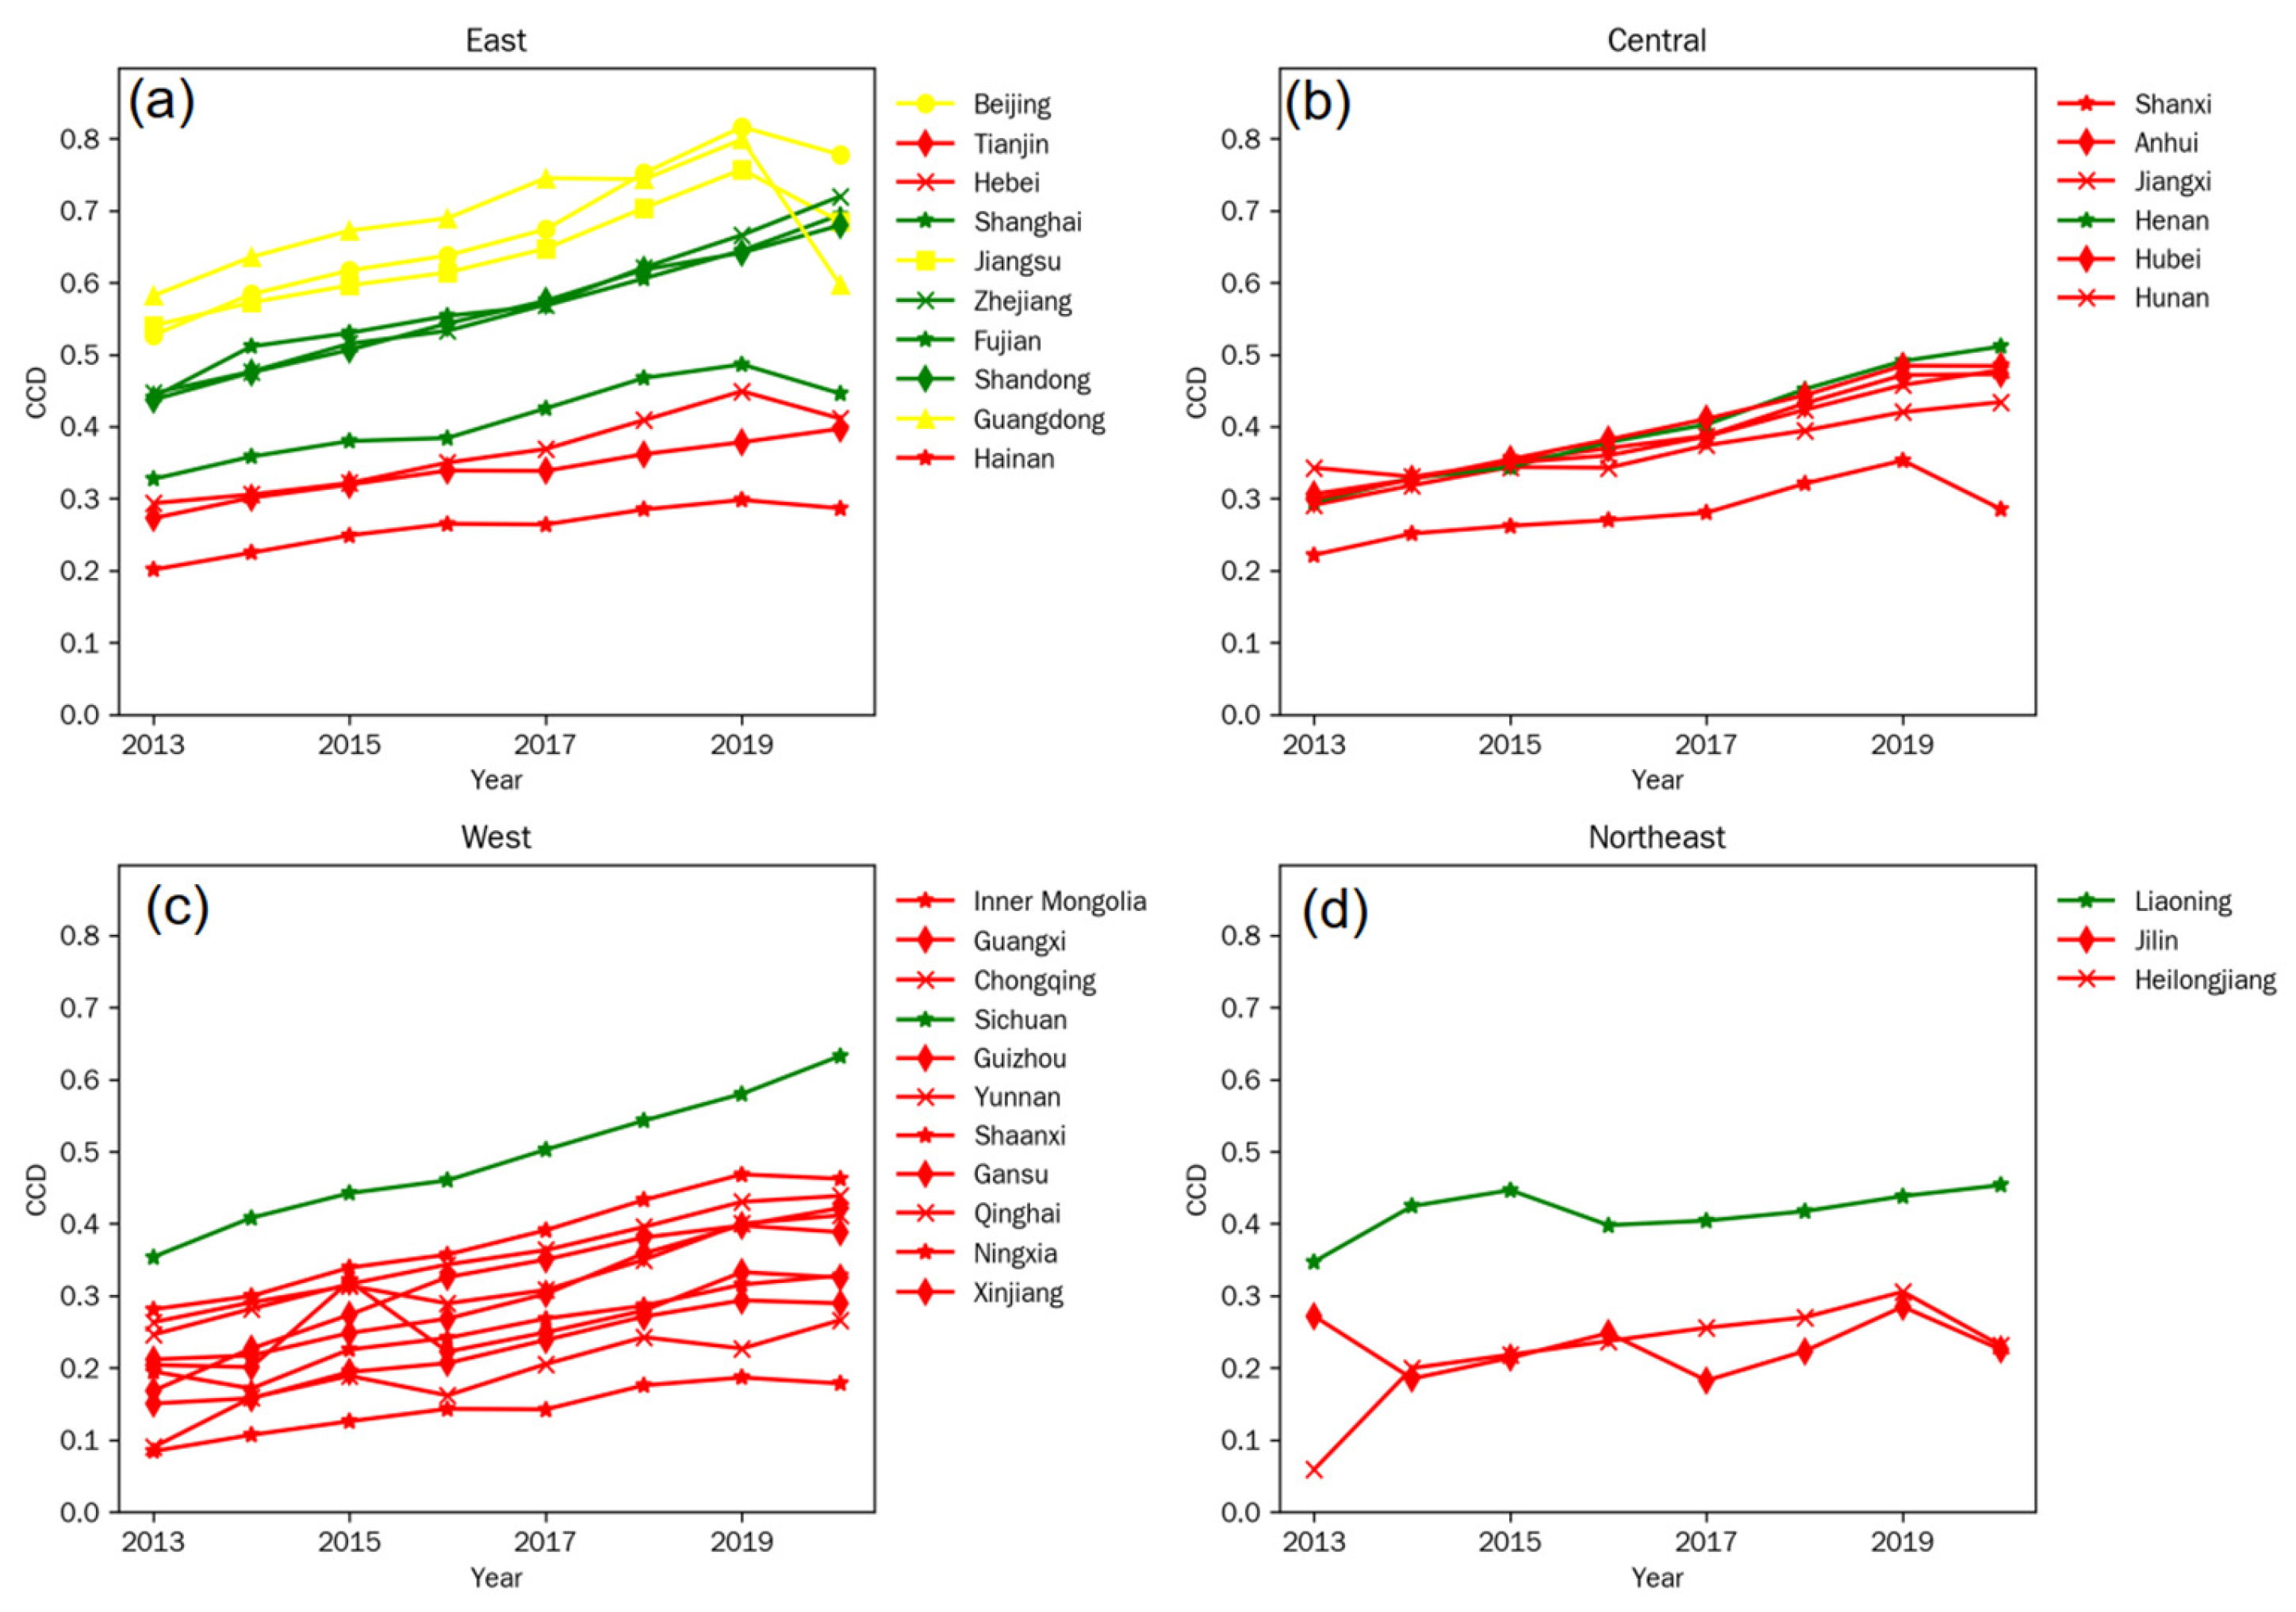
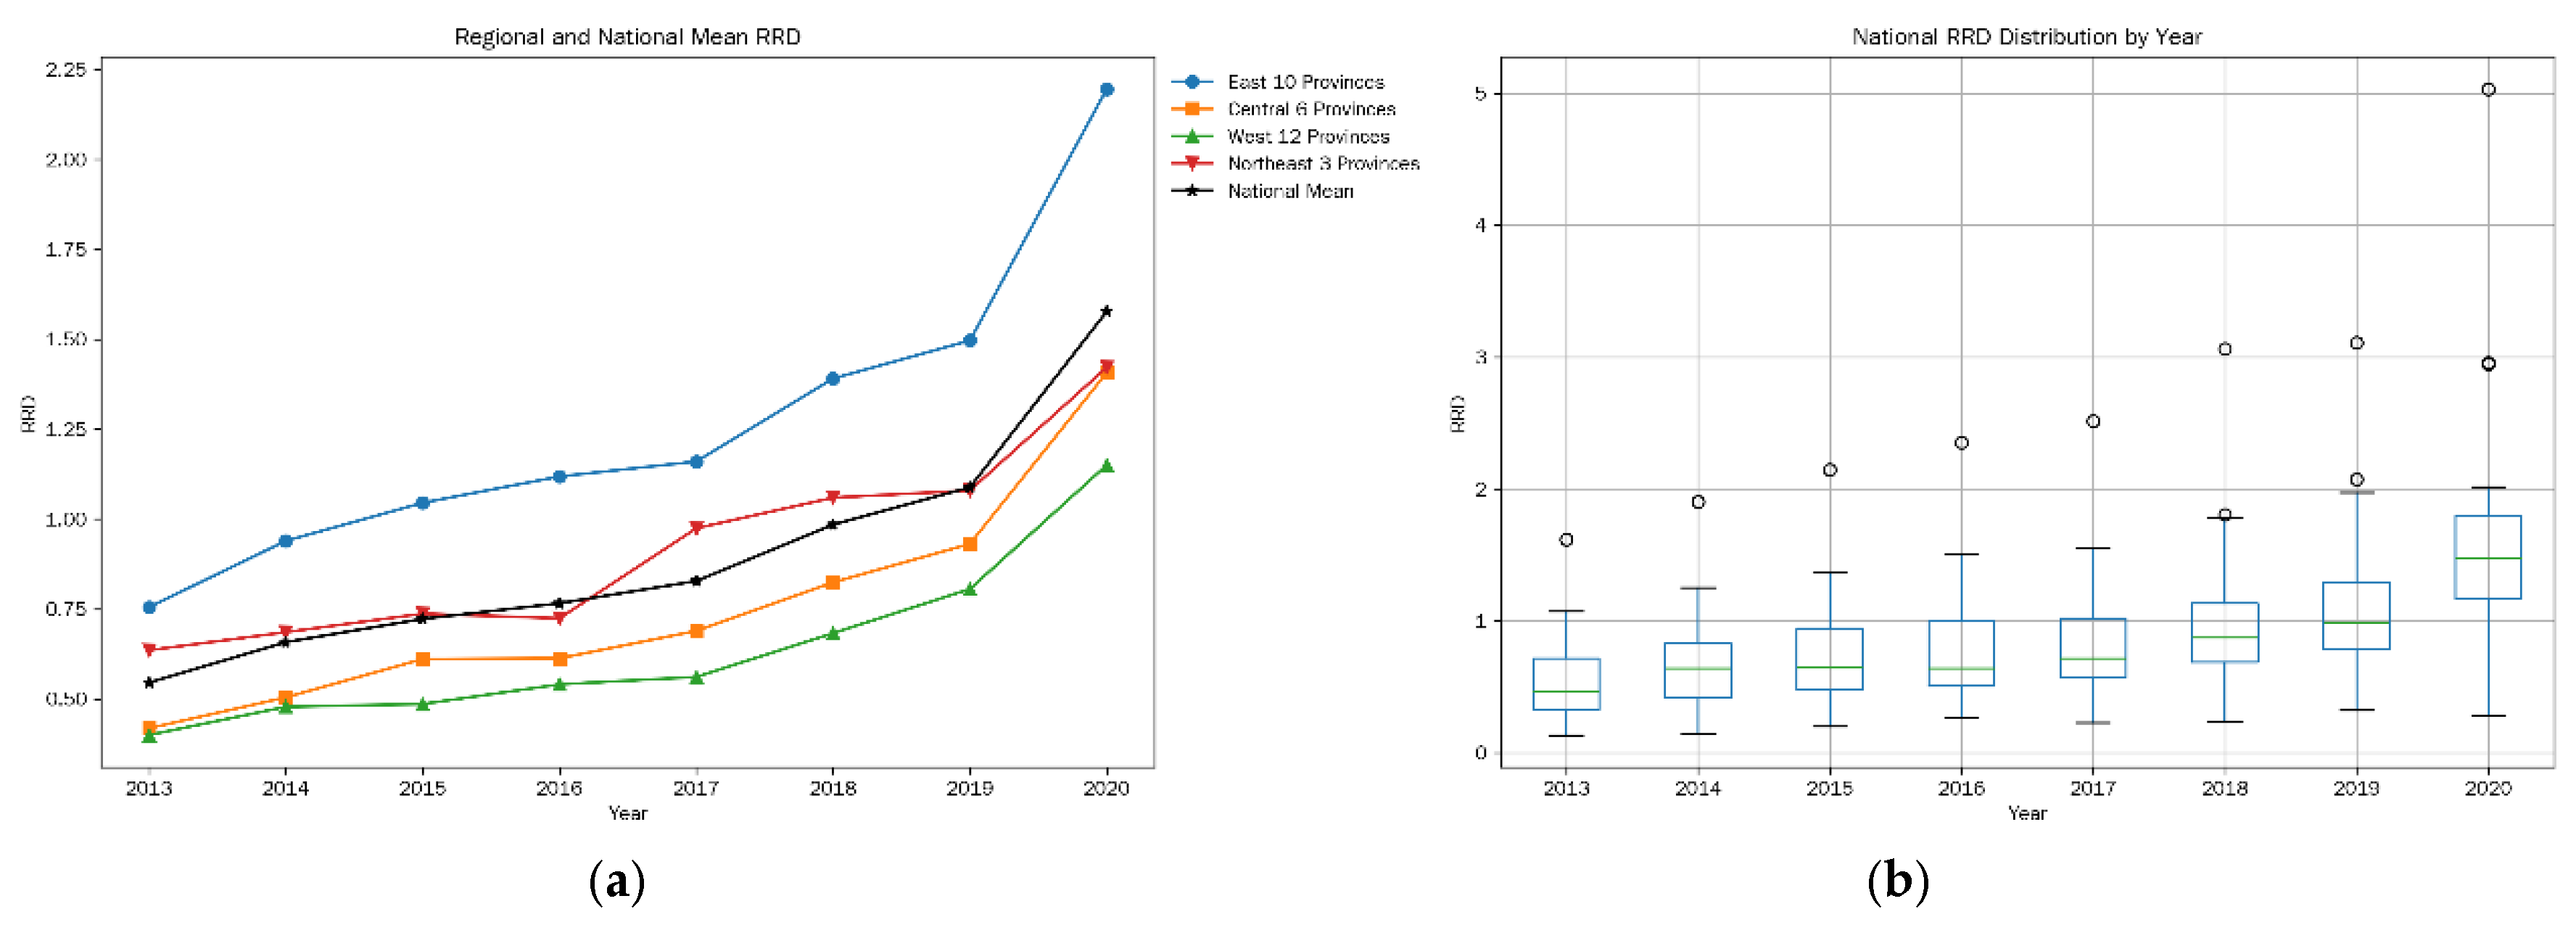
Figure 3 and Figure 4 present the spatiotemporal evolution of the Coupling Coordination Degree (CCD) between digital technology and A-level scenic spot development from 2013 to 2020. Figure 3 compares regional averages and national distribution, while Figure 4 illustrates province-level trends over time. The CCD exhibited a noticeable regional disparities—leading development in the eastern region and a significant growth rate in the western region (Figure 3a)—while the spatial distribution of CCD across the country exhibited a slow but steady upward trend (Figure 3b). The number of provinces in the coordinated stage increased from 0 in 2013 to 6 in 2020, while those in the transitional stage expanded from 6 to 13. Conversely, provinces in the dysfunctional stage decreased from 24 to 11, with severely dysfunctional provinces dropping from 6 (in 2013) to only 1 (in 2020, Ningxia), reflecting an overall improvement in coordination levels. However, the proportion of provinces in the coordinated stage declined from 20% in 2019 to 16.7% in 2020, indicating the short-term impact of the pandemic on coupling coordination.
Regionally, the average CCD of the eastern provinces increased markedly from 0.38 in 2013 to 0.62 in 2020. The eastern region was the first to enter the barely coordinated stage (CCD > 0.5) in 2017 and saw its first instances of good coordination in 2019, notably in Jiangsu and Zhejiang (CCD > 0.8). The central provinces (Figure 4b) followed with a steady rise from 0.32 to 0.51, crossing into the transitional stage in 2018. In contrast, western (Figure 4c) and northeastern (Figure 4d) provinces started from lower baselines (0.28 and 0.30, respectively) and reached only 0.45 and 0.47 by 2020, remaining within the mild dysfunction—near dysfunction range (0.3 < CCD ≤ 0.5). These disparities reveal the persistent regional gap in the integration of digital technology and scenic spot development.
Spatially, coupling coordination displayed a clear East–Central–West gradient (Figure 4). In 2013, several western provinces (such as Ningxia and Qinghai) (Figure 4c) and Heilongjiang in the northeast (Figure 4d) were still in severe dysfunction (CCD < 0.2), while most eastern provinces (e.g., Shanghai, Zhejiang) (Figure 4a) had progressed to the near dysfunction stage (0.4 < CCD ≤ 0.5). Most provinces of Central region changed from disordered to moderate disorder stages (Figure 4b). By 2020, five of the six provinces in the coordinated stage (83.3%) were located in the east. Sichuan was the only western province to achieve primary coordination (0.6 < CCD ≤ 0.7), owing to targeted digital infrastructure investments and smart upgrades of scenic spots. In contrast, Ningxia remained severely dysfunctional (CCD ≈ 0.18). These outcomes largely reflect the technology spillover effect from the east and the absorption lag in the west. The eastern provinces strengthened their coupling performance through deep integration of digital integration (e.g., smart ticketing, VR-guided tours), whereas the west regions still faced funding shortages, insufficient digital infrastructure, and limited technical capacity, constraining their ability to benefit from cross-sector digital synergy.

5.2. Analysis of Relative Development Degree

Figure 5 and Figure 6 show the temporal changes (2013–2020) in the Relative Development Degree (RDD) between digital technology and ALSS development, along with regional comparisons. Here, RDD > 1.2 indicates a digital-technology-led pattern, 0.8 < RDD ≤ 1.2 signifies a synchronous development pattern, and RDD ≤ 0.8 reflects a lagging pattern.
The eastern region consistently maintained the highest RRD values, with an explosive increase from approximately 1.5 to 2.25 between 2019 and 2020. In contrast, the northeastern region initially showed RRD levels close to the national average but experienced a marked acceleration after 2018, gradually approaching the eastern level. The central region exhibited a steady upward trend with relatively moderate growth, while the western region started from the lowest RRD values but showed the most significant increase, eventually reaching levels comparable to the central region (Figure 5a). Nationally, the average RRD value continued to rise over time, with a noticeable acceleration after 2019 (Figure 5b).
Temporally (Figure 6), the number of provinces characterized as digital-technology-led increased from only one (Guangdong) in 2013 to twenty-one in 2020. Conversely, the number of lagging provinces declined sharply from twenty-five to only four (Jiangxi, Hainan, Qinghai, Ningxia), indicating a widening lead of digital technology over scenic spot development. This divergence became especially pronounced in 2020: while scenic spot development stagnated during the COVID-19 pandemic, the counter-cyclical expansion of digital services (e.g., online cultural tourism, virtual tours) enabled several provinces, including Tianjin and Xinjiang, to shift from the synchronous to the technology-led category.
Regionally, the eastern provinces demonstrated the most pronounced and sustained growth in RRD (Figure 6a). Guangdong entered the technology-led stage as early as 2013 (RDD ≈ 1.3), followed by Jiangsu and Beijing in 2014 and 2015, respectively. By 2019, 90% of eastern provinces (9/10) had become technology-led, with a regional average RDD reaching 1.8. The central provinces (Figure 6b), such as Henan, Anhui, exhibited a steady upward trend, with RRD increasing from around 0.8 in 2013 to above 1.1 by 2020. Western provinces (Figure 6c), including Sichuan, Chongqing, and Shaanxi, showed the most rapid catch-up during 2018–2020, when improved digital infrastructure and e-tourism initiatives drove the transition from lagging to synchronous or technology-led stages. In contrast, the northeastern provinces (Liaoning, Jilin, Heilongjiang) (Figure 6d) displayed slower progress. By 2020, 66.7% (2/3) remained in the synchronous category, and their average RDD (1.05) was still below the national average (1.23), reflecting delayed in the digital integration in the regional.
Spatially (Figure 6), the RDD distribution exhibited a clear Eastern-Leads, Central-Synchronous, Western-Lags gradient. Eastern provinces with high RDDs (>1.5), such as Beijing, Jiangsu, and Zhejiang, displayed strong digital coordination but relatively lagging scenic service upgrades. These provinces possess advanced digital capabilities for smart operations (e.g., AI-based visitor flow prediction), not yet matched by on-site service improvements (e.g., catering, accommodation). Synchronous provinces like Hebei and Liaoning (1.0 < RDD ≤ 1.2) showed more balanced growth, exemplified by the Chengde Resort in Hebei, which successfully combined digital navigation tools with optimized offline services. In contrast, lagging provinces such as Qinghai and Ningxia (RRD < 0.8) faced two major challenges. First, their digital infrastructure remained weak—for example, Wi-Fi coverage in scenic areas was below 30%. Second, the shortage of skilled personnel hindered digital operation and management. These limitations created a self-reinforcing cycle of underdevelopment, which slowed scenic spot modernization and reduced regional coordination performance.

5.3. Comparative Discussion with Previous Studies

In comparison with recent studies, our findings are largely consistent with the emerging consensus that digital transformation exerts a significant and positive influence on the quality and resilience of tourism development in China [22,62,63]. Tang (2024) [22] demonstrated that the digital economy enhances tourism economic resilience by improving the adaptability of regional tourism systems to external shocks. Likewise, other scholars [26,62] found that the coupling coordination between the digital economy and HQTD displays a distinct east–west gradient, which is fully aligned with our empirical observations. Furthermore, Shi et al. (2023) [16] and Wang et al. (2022) [55] emphasized the vital role of industrial structure upgrading and infrastructure investment in narrowing regional disparities in tourism performance. Collectively, these studies reinforce the robustness of our conclusion that digital empowerment serves as a structural catalyst for spatially balanced and sustainable tourism transformation. These regional disparities reflect deeper structural inequalities in economic capacity, technological investment, and policy coordination. Provinces with advanced industrial structures and innovation-oriented governance models exhibit stronger digital–tourism integration, while resource-dependent or peripheral regions face institutional constraints that limit coordination efficiency.
Beyond confirming previous conclusions, this study extends existing literature by applying a dual-system coupling framework to capture cross-regional dynamics. While Liu and Tang (2022) [21] examined the Yangtze River Economic Belt, our analysis encompasses 30 provinces nationwide, offering a more comprehensive spatial perspective. Compared with recent studies [15,37], who highlighted the mediating and spillover effects of digital information flows, we focus on coordination efficiency and temporal evolution, providing complementary insights into how digital technology reshapes tourism competitiveness over time. Moreover, other studies [1,49] confirmed the productivity-enhancing effects of digital technology in tourism and agriculture, respectively; our results further substantiate these findings within a unified sustainability-oriented framework. Overall, the integration of comparative evidence enhances the theoretical depth of our analysis and broadens understanding of how digital empowerment drives the coordinated and high-quality development of China’s ALSSs.

5.4. Driving Factors and Mechanisms Underlying the East–West Spatial Differentiation

The spatial pattern of “East-High-West-Low” in China’s digital tourism coupled coordination degree is fundamentally driven by systematic disparities in core regional endowments and exacerbated by heterogeneous institutional environments. This divergence is rooted in the synergistic interplay of four fundamental determinants: economic foundation [64,65], digital infrastructure [66], industrial structure, and innovation capability [37,64,65,66,67,68]. Eastern regions demonstrate a substantial economic advantage with significantly higher per capita GDP and fiscal capacity, exemplified by the wide gap between Zhejiang (CNY 127,000 per capita GDP) and Gansu (CNY 34,000 per capita GDP) in 2020. This economic disparity directly constrains the Western regions’ ability to make the necessary capital investment in digital technologies [2]. Furthermore, the concentration of digital infrastructure is heavily skewed; Jiangsu’s 5G base station density (22 per 10,000 people) far outpaces Qinghai’s (12 per 10,000 people), confirming the infrastructure gap that limits the foundational support for smart tourism in the West, despite the “Eastern Data, Western Computing” initiative. The study of the CCD confirms that the northwest region specifically exhibits the lowest values, indicating an imbalanced status [37].
The structural differences in regional economies [66,67] further contribute to the spatial divergence. The Eastern region has successfully shifted towards a modern industrial system dominated by the service sector and digital creativity, enabling rapid intelligent and digital marketing transformation within tourism. The determinants of differences in China’s tourism development quality have transitioned from reliance on endowment advantages to reliance on innovation capabilities [63]. Conversely, the Western region remains reliant on resource-based and primary industries, resulting in low digital penetration and a prevailing traditional ticket-sales economy in most scenic areas. Simultaneously, innovation capability is highly concentrated in the East, which serves as a powerhouse for R&D and patent generation. The spatial differentiation of the digital economy is largely led by economic conditions and R&D expenditure. The Western region, facing platform scarcity and low talent density, struggles to generate the sustained digital innovation required to catalyze digital tourism development.
Beyond these foundational factors, institutional and policy heterogeneities act as critical mechanisms that amplify the initial development gap. Discrepancies in fiscal capacity are pronounced, with Eastern provinces like Guangdong (over CNY 1.3 trillion general public budget revenue in 2022) possessing the autonomy to fund large-scale “5G + Smart Tourism” projects. Western provinces such as Qinghai are severely reliant on central transfers, leading to chronic underinvestment. Similarly, the higher digital governance efficiency in the East, utilizing integrated government platforms, enables superior policy execution and industry management. Eastern regions like Zhejiang leverage integrated government platforms (e.g., “Zhe Zheng Ding”) to digitize the full process of cultural tourism supervision. Its “Zhe Li Hao Wan” (means fun here in Zhejiang) platform serves millions of users, markedly improving policy implementation and industry management efficiency. This contrasts with the less mature digital governance systems in the West, where limited platform coverage restricts the practical efficacy of digital empowerment [66].
Finally, the supply and flow of human capital reinforce the path dependence of the East–West divide. The East benefits from a dense network of higher education institutions and a continuous net talent inflow [66,68], ensuring a stable professional pipeline for the digital cultural tourism sector. The digital economy can enhance regional coordination by promoting two-way factor flow. However, the West struggles with the net outflow of high-caliber, interdisciplinary professionals, with Gansu’s science and engineering graduates exhibiting a net outflow rate consistently above 15%. Related academic coupling studies confirm a positive influence of education level on digital tourism coordinated development, with the influence coefficient exhibiting a gradient pattern: East > Central> West. This talent disparity, combined with the other mechanisms, emphasizes that the uneven effect of the digital economy on tourism development requires localized strategies to achieve regional equity.
In summary, the East–West spatial differentiation in China’s digital tourism coupling is the ultimate outcome of the joint effect of inherent regional endowment differences and external institutional environments. Economic foundation, digital facilities, industrial structure, and innovation capability constitute the fundamental causes of the spatial divergence, while fiscal support, governance efficiency, and talent reserves act as the critical institutional arrangements that modulate the coordination performance.

6. Conclusions and Implications

6.1. Conclusions

Based on the spatiotemporal analysis using the entropy method and the CCDM, this study examined the interaction between digital technology and the high-quality development of ALSSs in China from 2013 to 2020. This study yields the following primary findings: (1) Digital empowerment and HQTD in China are positively correlated yet regionally unbalanced, tourism development exhibits significant spatial heterogeneity. The analysis confirms a distinct pattern of development levels decreasing from the East and Central regions (leading) to the West and Northeast regions (lagging). (2) Digital technology development demonstrates a trend of national growth but is characterized by pronounced Eastern polarization, and high CDTDI values are concentrated in a few eastern provinces (e.g., Beijing, Shanghai, Jiangsu), which are over twice that of western and northeastern provinces by 2020, highlighting a substantial regional digital divide. (3) The CCD between digital technology and ALSS development followed a nonlinear trajectory of initial decline followed by recovery, culminating in a stable spatial hierarchy. The national CCD improved from 2013 to 2019, with the East being the first to enter the coordinated stage. This established a persistent gradient pattern: East > Central > West/Northeast. The COVID-19 pandemic in 2020 caused a temporary nationwide decline, but regional resilience varied, further validating the influence of pre-existing digital infrastructure gaps. (4) Provinces in the disordered stages are predominantly of the digital-technology-lagging type; the number of technology-lagging provinces decreased sharply from 25 (2013) to 4 (2020), with the remaining ones (e.g., Qinghai, Ningxia) concentrated in the West. This identifies insufficient economic foundation, digital facilities, industrial structure and innovation capability as the key bottlenecks hindering coordination, forming an unbalanced pattern of eastern technological spillover versus western absorption lag.
This study theoretically contributes to digital tourism research by extending the CCDM into a dual-system framework linking digital empowerment and tourism quality, contributes to the understanding of digital–sustainability interaction in tourism. Practically, it provides differentiated policy implications for regions with varying digital readiness. These findings highlight several policy implications. For lagging regions such as Qinghai and Ningxia, a dedicated digital infrastructure fund is needed to accelerate 5G coverage and data center construction. It underscores the need for differentiated policy design and cross-regional collaboration.

6.2. Policy Implications

Based on this study’s spatiotemporal analysis of the coupling coordination between digital technology and high-quality development in China’s ALSSs—particularly the identification of two main regional types, ‘digitally leading’ and ‘digitally lagging’—we recommend that policymakers adopt a tiered and differentiated strategy to ensure regional coordination and the sustainable development of tourism. For leading eastern provinces, digital tourism innovation consortia in the Yangtze River Delta and Pearl River Delta should enhance regional collaboration and technological innovation capacity. Policy priorities should shift from expanding scale to enhancing quality, driving innovation, and fostering green sustainability, while building cross-regional innovation and sharing platforms and promoting comprehensive green and smart transformation. The government should promote tourism digital innovation alliances and data-sharing platforms, encourage cooperation between technological hubs and scenic spots in central and western regions, and foster cross-regional spillovers. By applying IoT and AI to energy, waste, and visitor management, scenic spots can achieve refined, low-carbon operations, turning digital empowerment into sustainable competitiveness and setting a national benchmark.
For central and western provinces, the East-to-West Computing Project should be leveraged to establish cross-regional big data platforms. Policy priorities should focus on strengthening digital infrastructure and stimulating endogenous momentum by increasing specialized investment and implementing composite talent programs. This includes establishing central or provincial funds dedicated to digital infrastructure, with priority given to 5G networks, cloud computing centers, and smart tourism management systems in scenic core areas and surrounding rural tourism zones, thereby narrowing the regional digital divide. Infrastructure development should be complemented by targeted partnerships with eastern universities and tech enterprises to foster ‘tourism + digital’ talent through tailored training programs. In parallel, preferential policies should attract professionals skilled in both tourism operations and digital technologies, while enhancing the digital literacy and application capacity of local staff, ensuring that infrastructure investment translates into tangible operational benefits. Furthermore, the digitalization level should be integrated into the national scenic spot assessment system, supported by compensatory policies for lagging areas. Spatiotemporal effects of digital technologies on provincial-level tourism efficiency provide valuable references for formulating differentiated policies. At the same time, evidence from Europe regarding the digital skills gap in the tourism sector, together with research agendas on digital technologies for sustainable tourism destinations, highlights the importance of prioritizing talent cultivation and aligning with sustainable development goals when advancing the digital transformation of tourist attractions in China.

6.3. Limitations and Future Research

This study has several limitations that should be acknowledged. First, the evaluation framework is constrained by data availability and does not include micro-level indicators such as smart tourism applications or digital marketing practices. Due to the limited comparability of official datasets, the analysis covers the pre-pandemic period up to 2020. Although this provides a reliable baseline, it does not capture the structural transformations that occurred during and after the COVID-19 pandemic. Future research will incorporate post-pandemic data once it becomes fully available to better reflect recent developments.
Second, the selection of indicators and the weighting scheme may influence the robustness of the results. While the entropy weight method objectively determines weights based on data variability, it may remain sensitive to the range and distribution of individual indicators. For example, extreme values in digital infrastructure or tourism revenue could slightly affect the coupling coordination outcomes. To evaluate robustness, alternative normalization schemes were tested, and the overall spatial and temporal patterns remained consistent, confirming the stability of our findings. Nonetheless, future studies should consider hybrid weighting approaches—such as combining entropy and analytic hierarchy process—or machine learning-based weighting models to further reduce methodological bias. Expanding the indicator system to include governance efficiency, innovation capacity, and tourists’ digital engagement would also enhance the explanatory power of the coupling coordination model.
Finally, future research should perform sensitivity tests to further validate the CCDM results and extend the analytical framework by integrating firm-level or scenic-spot-level datasets. Incorporating dynamic models or machine learning approaches could help capture nonlinear feedbacks, especially under external shocks. Intra-provincial heterogeneity also warrants closer examination through city- or spot-level analyses. Moreover, while China provides a representative case of large-scale digital–tourism integration, cross-national comparisons—particularly within the Belt and Road Initiative context—could yield broader insights into how digitalization drives sustainable tourism across diverse institutional and cultural environments.

Author Contributions

H.D. conceived and designed the study, performed data analysis, and drafted the manuscript. J.Z. contributed to data analysis and validation. All authors have read and agreed to the published version of the manuscript.

Funding

This research was funded by the Special Program for Philosophy and Social Sciences Research of Shaanxi Province (No. 2025YB0238), Social Science Foundation Project of Shaanxi Province (No. 2025J027) and Ministry of Culture and Tourism (MCT) of China (No. 16TAAG019). The APC was supported by Xi’an University of Science and Technology (XUST).

Institutional Review Board Statement

Not applicable.

Informed Consent Statement

Not applicable.

Data Availability Statement

The data presented in this study are publicly available in the sources cited within the reference list and text. Specifically, the data used to construct the digital technology and scenic spot high-quality development indices were retrieved from the China Statistical Yearbook, the China Tourism Statistical Yearbook, and the China Information Industry Yearbook (various years, 2014–2021). All source data are publicly available and accessible by citation.

Acknowledgments

The authors are grateful to the School of Management at XUST for providing the necessary administrative and technical support for this research.

Conflicts of Interest

The authors declare no conflicts of interest.

Abbreviations

The following abbreviations are used in this manuscript:
ALSSsA-Level Scenic Spots
CCDComprehensive Coupling Degree
CCDMCoupling Coordination Degree Model
CDTDIComprehensive Digital Technology Development Index
HQDIHigh-Quality Development Index
HQTDHigh-quality Tourism Development
RDDRelative Development Degree
SDGsSustainable Development Goals

References

  1. Zhang, F.; Cheng, Q. Spatio-temporal effects and influence mechanism of digital technology on tourism efficiency in Chinese provinces. Sci. Rep. 2024, 14, 22975. [Google Scholar] [CrossRef]
  2. Du, H.; Liu, J. Exploring Spatial–Temporal Coupling and Its Driving Factors of Cultural and Tourism Industry in the Beijing–Tianjin–Hebei Urban Agglomeration, China. Sustainability 2025, 17, 890. [Google Scholar] [CrossRef]
  3. Weaver, D.B. Asymmetrical Dialectics of Sustainable Tourism: Toward Enlightened Mass Tourism. J. Travel Res. 2014, 53, 131–140. [Google Scholar] [CrossRef]
  4. Ding, H.; Zheng, H. Research on Coordinated Development of Urbanization Based on Provincial Panel Data in China. East China Econ. Manag. 2016, 30, 79–85. [Google Scholar] [CrossRef]
  5. He, H.; Tuo, S. The Mechanism and Coupling Coordination of Digital Economy Driving High-Quality Tourism Development: Evidence from Five Northwestern Provinces. Stat. Decis. 2023, 39, 78–83. [Google Scholar] [CrossRef]
  6. Jin, Y.; Xi, H.; Wang, X.; Ren, X.; Yuan, L. Evaluation of the Integration Policy in China: Does the Integration of Culture and Tourism Promote Tourism Development? Ann. Tour. Res. 2022, 97, 103491. [Google Scholar] [CrossRef]
  7. Happ, É.; Ivancsó-Horváth, Z. Digital tourism is the challenge of future—A new approach to tourism. Knowl. Horiz. Econ. 2018, 10, 9–16. [Google Scholar]
  8. Jiang, L.; Zhang, M.; Hu, S. Digital economy, green innovation and regional resource allocation efficiency: Evidence from 257 cities in China. Front. Environ. Sci. 2025, 13, 1529946. [Google Scholar] [CrossRef]
  9. Hou, M.; Cui, X.; Zhao, X.; Zhang, S.; Jin, Z.; Han, Y.; Xi, Z. Does digital economy assist integration of cultural and tourism industries in China? Evidence from spatial and non-linear perspectives. Sustain. Futures 2025, 10, 100924. [Google Scholar] [CrossRef]
  10. Pencarelli, T. The digital revolution in the travel and tourism industry. Inf. Technol. Tour. 2020, 22, 455–476. [Google Scholar] [CrossRef]
  11. Prasanna, A.; Pushparaj, P.; Kushwaha, B.P. Conversational AI in Tourism: A systematic literature review using TCM and ADO framework. J. Hosp. Tour. Manag. 2025, 64, 101310. [Google Scholar] [CrossRef]
  12. Vaz, R.; de Carvalho, J.V.; Teixeira, S.F.; Castanho, R. Smart tourism destination advances through qualitative research and further research avenues: A systematic literature review. Discov. Sustain. 2025, 6, 682. [Google Scholar] [CrossRef]
  13. Gössling, S. Technology, ICT and tourism: From big data to the big picture. J. Sustain. Tour. 2020, 29, 849–858. [Google Scholar] [CrossRef]
  14. Carlisle, S.; Ivanov, S.; Dijkmans, C. The digital skills divide: Evidence from the European tourism industry. J. Tour. Futures 2023, 9, 240–266. [Google Scholar] [CrossRef]
  15. Liu, Z.; Yang, Y.; Kim, Y.R.; Liu, A. Digital Economy and Regional Tourism Development: The Mediating Role of Information Search from a Spatial Spillover Perspective. J. Hosp. Tour. Res. 2025, 49, 1035–1050. [Google Scholar] [CrossRef]
  16. Shi, P.; Cao, Y.; Long, H.; Tian, Z.; Li, X.; Geng, B. Measurement, Spatial Differentiation and Obstacle Factor Diagnosis of High-Quality Tourism Development in China. Econ. Geogr. 2023, 43, 201–210. [Google Scholar] [CrossRef]
  17. Wang, Q.; Tang, Q.; Guo, Y. Spatial interaction spillover effect of tourism eco-efficiency and economic development. Sustainability 2024, 16, 8012. [Google Scholar] [CrossRef]
  18. Wang, J.; Wang, Q.; Feng, L. Coordination Pattern and Driving Mechanism of China’s Digital Economy and High-Quality Tourism Development. Sci. Geogr. Sin. 2024, 44, 130–139. [Google Scholar] [CrossRef]
  19. Yu, M.; Ma, B.; Liu, D.; Zhang, A. Is the digital economy empowering high-quality tourism development? A theoretical and empirical research from China. PLoS ONE 2024, 19, e0303087. [Google Scholar] [CrossRef]
  20. Bašan, L.; Butković, I.; Črnjar, K. Empowering Gen Z for Engaging in Sustainable Tourism: A ZRETP Model Approach. Sustainability 2025, 17, 8366. [Google Scholar] [CrossRef]
  21. Liu, Y.; Tang, J. Evaluation and Spatio-Temporal Evolution of Tourism Development Quality in the Yangtze River Economic Belt. Econ. Geogr. 2022, 42, 209–219. [Google Scholar] [CrossRef]
  22. Tang, R. Can digital economy improve tourism economic resilience? Evidence from China. Tour. Econ. 2024, 30, 1359–1381. [Google Scholar] [CrossRef]
  23. Yang, X.; Du, C.; Liu, X.; Sun, L. A study on the spatial characteristics and spatial heterogeneity of influencing factors in the tourist market of coastal scenic area: Taking Wanpingkou scenic area in Rizhao City as an example. Curr. Issues Tour. 2025, 28, 1–16. [Google Scholar] [CrossRef]
  24. Yang, L.; Ning, W. Mechanisms and Effects of the Sustainable Integration of Digital-driven Rural Cultural Tourism from the Perspective of Symbiosis. Sustain. Futures 2025, 10, 100867. [Google Scholar] [CrossRef]
  25. Cheng, M.; Zhang, L.; Li, D. Analysis of the coupled and coordinated development of sports and tourism industries and the driving factors. Sci. Rep. 2023, 13, 16725. [Google Scholar] [CrossRef] [PubMed]
  26. Shu, X.; Min, Z.; Guo, X. Coupling Coordination and Driving Factors of Provincial Digital Economy and High-Quality Tourism Development. Econ. Geogr. 2024, 44, 197–208. [Google Scholar] [CrossRef]
  27. Deller, S. Rural poverty, tourism and spatial heterogeneity. Ann. Tour. Res. 2010, 37, 180–205. [Google Scholar] [CrossRef]
  28. Wu, W.; Xu, C.; Zhao, M.; Li, X.; Law, R. Digital Tourism and Smart Development: State-of-the-Art Review. Sustainability 2024, 16, 10382. [Google Scholar] [CrossRef]
  29. Kalia, P.; Mladenović, D.; Acevedo-Duque, Á. Decoding the trends and the emerging research directions of digital tourism in the last three decades: A bibliometric analysis. Sage Open 2022, 12, 21582440221128179. [Google Scholar] [CrossRef]
  30. Wang, K.; Guo, X.; Gan, C.; Sun, J.; Liu, H. Provincial Scientific and Technological Innovation and High-Quality Tourism Development in China: Levels and Interaction. Resour. Sci. 2022, 44, 114–126. [Google Scholar] [CrossRef]
  31. Ma, L.; Ao, Y. Impact and Spatial Spillover Effects of Digital Economy on High-Quality Tourism Development. Prog. Geogr. 2023, 42, 2296–2308. [Google Scholar] [CrossRef]
  32. Wang, K.; Zhao, Y.; Gan, C.; Sun, J.; Liu, H. Coupling Interaction between Provincial Digital Economy and High-Quality Tourism Development in China. J. Nat. Sci. Hunan Norm. Univ. 2024, 47, 1–10. [Google Scholar]
  33. Lu, W.; Ziruo, H.; Le, Y.; Zhizhong, N. Evaluation of the development resilience of tourist attractions under the influence of major public health events. J. Resour. Ecol. 2024, 15, 698–710. [Google Scholar] [CrossRef]
  34. Zhao, L. The Connotation and Dimensions of Digital Economy Enabling High-Quality Development of Tourism. Tour. Trib. 2022, 37, 5–6. [Google Scholar] [CrossRef]
  35. Buhalis, D. Tourism and Information Technologies: Past, Present and Future. Tour. Recreat. Res. 2000, 25, 41–58. [Google Scholar] [CrossRef]
  36. Xu, X.; Wang, M.; Guan, J.; Sun, Z.; Cui, M. Multi-Scale Spatial Deconstruction and Simulation Evaluation of High-Quality Tourism Development. Econ. Geogr. 2024, 44, 196–205. [Google Scholar] [CrossRef]
  37. Luo, Y.; Wang, Y.; Pan, Z.; Li, H.; Lai, B.; Qin, Y. Synergizing high-quality tourism development and digital economy: A coupling coordination analysis in Chinese prefecture-level cities. Entropy 2025, 27, 1061. [Google Scholar] [CrossRef]
  38. Bingöl, S.; Yang, Y. Integrating smart technologies and artificial intelligence to build smart tourism destination ecosystems: A model for smart destination management. Tour. Manag. Perspect. 2025, 58, 101380. [Google Scholar] [CrossRef]
  39. Carvalho, I.; Ivanov, S. ChatGPT for tourism: Applications, benefits and risks. Tour. Rev. 2023, 79, 290–303. [Google Scholar] [CrossRef]
  40. Nautiyal, R.; Albrecht, J.N.; Nautiyal, A. ChatGPT and tourism academia. Ann. Tour. Res. 2023, 99, 103544. [Google Scholar] [CrossRef]
  41. Calisto, M.d.L.; Sarkar, S. A systematic review of virtual reality in tourism and hospitality: The known and the paths to follow. Int. J. Hosp. Manag. 2024, 116, 103623. [Google Scholar] [CrossRef]
  42. Jiang, X.; Fan, X. Examining the effects of presence and authenticity on Visitor’s well-being in CAVE VR museum: A mixed methods study. Tour. Manag. 2026, 113, 105291. [Google Scholar] [CrossRef]
  43. Kong, X.; Wang, H.; Chen, Y.; Luo, J.; Xie, T.; Peng, M.; Ding, M.; Li, X.; Li, H. Innovative application of total quality management in sustainable tourism development: Framework development and empirical analysis. Humanit. Soc. Sci. Commun. 2025, 12, 1055. [Google Scholar] [CrossRef]
  44. Gretzel, U.; Sigala, M.; Xiang, Z.; Koo, C. Smart tourism: Foundations and developments. Electron. Mark. 2015, 25, 179–188. [Google Scholar] [CrossRef]
  45. Gretzel, U. Intelligent systems in tourism: A Social Science Perspective. Ann. Tour. Res. 2011, 38, 757–779. [Google Scholar] [CrossRef]
  46. Tang, R. Digital economy drives tourism development—Empirical evidence based on the UK. Econ. Res. 2023, 36, 2003–2020. [Google Scholar] [CrossRef]
  47. Sun, H. A Review of the Literature on Smart Tourism: A Locational Research Perspective. Tour. Stud. 2022, 28, 1–12. [Google Scholar] [CrossRef]
  48. Liu, L.; Su, J.; Xue, X. Does the Digital Economy Optimize Tourism Industry Structure? Effects and Mechanisms Based on Quantile Regression and Threshold Modeling. J. Resour. Ecol. 2024, 15, 1692–1706. [Google Scholar] [CrossRef]
  49. Zhang, G.; Zhang, C.; Liu, T. How does the digital economy impact the high-quality development of agriculture? An empirical test based on the spatial Durbin model. Digit. Econ. Sustain. Dev. 2025, 3, 18. [Google Scholar] [CrossRef]
  50. Song, H.; Zhang, X.; Wu, X. Research on the Spatial-Temporal Evolution and Driving Mechanism of Coupling Coordination among Digital-Tourism-Environment in the Yellow River Basin. Sustainability 2024, 16, 5339. [Google Scholar] [CrossRef]
  51. Liu, M.; Lu, M.; Li, Z. Coupling coordination analysis on digital economy-tourism development-ecological environment. J. Clean. Prod. 2024, 470, 143320. [Google Scholar] [CrossRef]
  52. Xia, L.; Baghaie, S.; Mohammad Sajadi, S. The digital economy: Challenges and opportunities in the new era of technology and electronic communications. Ain Shams Eng. J. 2024, 15, 102411. [Google Scholar] [CrossRef]
  53. Shen, Y.; Zhou, P. Measurement and Spatio-Temporal Pattern Analysis of China’s Digital Economy Development Level. Stat. Decis. 2023, 39, 5–9. [Google Scholar] [CrossRef]
  54. Tian, F.; Weng, G. The integration and challenges of digital economy with the tourism industry: Evidence from the Yellow River Basin in China. J. Clean. Prod. 2024, 475, 143672. [Google Scholar] [CrossRef]
  55. Wang, Z.; Xie, J.; Wu, W. Changes in High-Quality Tourism Development Level and Influencing Factors in the Chang-Zhu-Tan Urban Agglomeration. Econ. Geogr. 2022, 42, 172–181. [Google Scholar] [CrossRef]
  56. Liu, N.; Song, Q.; Hou, J.; Zhang, H.; Li, M. Structural Change and Spatial Network Evolution of China’s Tourism Industry. Geogr. Geo-Inf. Sci. 2020, 36, 119–127. [Google Scholar] [CrossRef]
  57. Wang, S.; Kong, W.; Ren, L.; Li, J.; Li, S. Misunderstandings and Corrections of Domestic Coupling Coordination Degree Models. J. Nat. Resour. 2021, 36, 793–810. [Google Scholar] [CrossRef]
  58. Wang, L.; Tian, B.; Filimonau, V.; Ning, Z.; Yang, X. The impact of the COVID-19 pandemic on revenues of visitor attractions: An exploratory and preliminary study in China. Tour. Econ. 2022, 28, 153–174. [Google Scholar] [CrossRef]
  59. Wang, C.; Meng, X.; Siriwardana, M.; Pham, T. The impact of COVID-19 on the Chinese tourism industry. Tour. Econ. 2022, 28, 131–152. [Google Scholar] [CrossRef]
  60. Li, X.; Liang, X.; Yu, T.; Ruan, S.; Fan, R. Research on the integration of cultural tourism industry driven by digital economy in the context of COVID-19—Based on the data of 31 Chinese provinces. Front. Public Health 2022, 10, 780476. [Google Scholar] [CrossRef]
  61. Yan, M.; Yan, M.; Zhang, Y.; Zhao, J. Pattern Evolution and Influencing Factors of High-Quality Tourism Development at the Prefecture Level in China. Econ. Geogr. 2024, 44, 206–217. [Google Scholar]
  62. Ma, B.; Dou, Y.; He, S.; Liu, A.; Ming, Q. Spatio-Temporal Characteristics and Driving Mechanism of the Integrated Development of China’s Digital Economy and Tourism Industry. Econ. Geogr. 2023, 43, 192–201. [Google Scholar]
  63. Zhang, H.; Xia, Z.; Wang, J. Spatiotemporal Changes in China’s Tourism Industry Development. Sustainability 2024, 16, 3244. [Google Scholar] [CrossRef]
  64. Wang, Y.; Wei, J.; Shao, M.; Zhou, Q. Measurement of the Development Level of China’s Digital Economy and Analysis of Its Spatial and Temporal Evolution—Based on Panel Data for 30 Provinces from 2013 to 2020. Mod. Manag. 2024, 14, 639–656. [Google Scholar] [CrossRef]
  65. Renmin-University-China. 2024 Report on the Data Factor Marketization Promotion Power Index; Renmin University of China: Beijing, China, 2025; pp. 1–15. [Google Scholar]
  66. Cai, C.; Tang, J.; Liu, Y. Spatial effects of digital economy on tourism development: Empirical research based on 284 cities at the prefecture and higher levels in China. Trop. Geogr. 2023, 43, 720–733. [Google Scholar] [CrossRef]
  67. Luo, R.; Zhou, N. Dynamic Evolution, Spatial Differences, and Driving Factors of China’s Provincial Digital Economy. Sustainability 2022, 14, 9376. [Google Scholar] [CrossRef]
  68. Wang, H.; Hu, X.; Ali, N. Spatial characteristics and driving factors toward the digital economy: Evidence from prefecture-level cities in China. J. Asian Financ. Econ. Bus. 2022, 9, 419–426. [Google Scholar] [CrossRef]
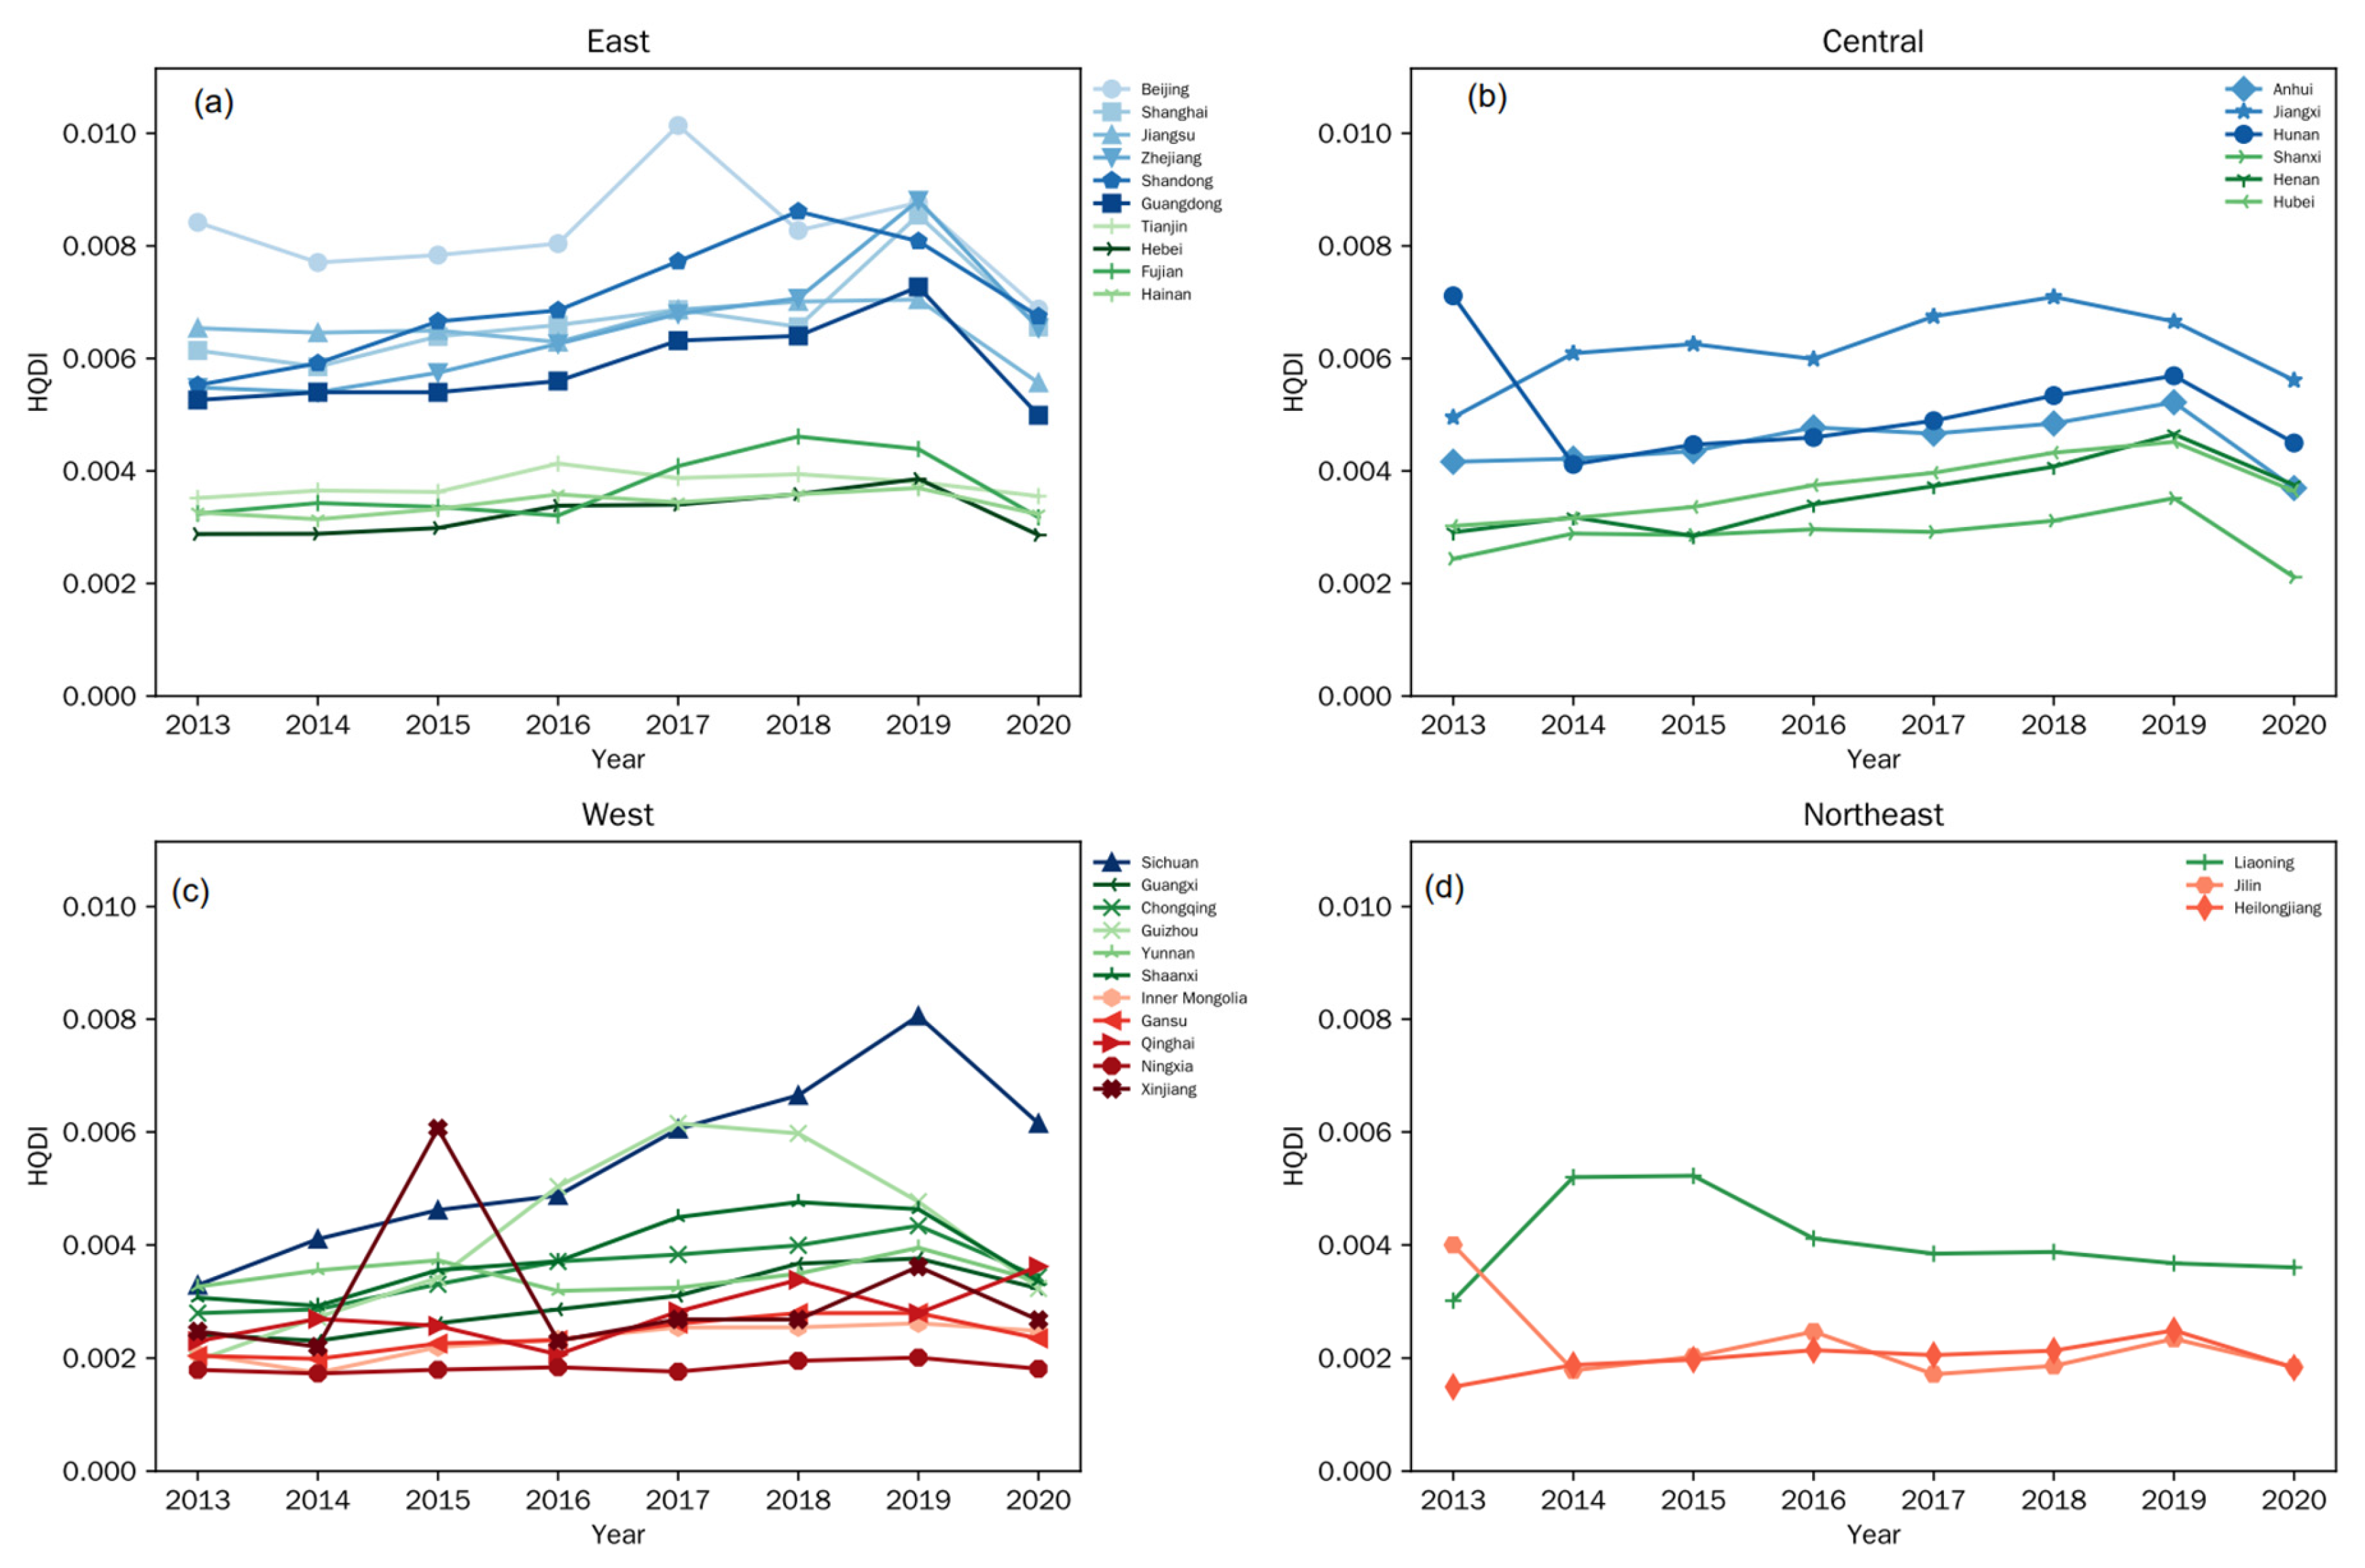
Figure 1. Spatiotemporal Variation in High-Quality Development Index (HQDI) of ALSSs in 30 Chinese Provinces by Four Regions from 2013 to 2020. (a): HQDI of Eastern region; (b): HQDI of central region; (c): HQDI of Western region; (d): HQDI of Northeastern region. (Blue indicates good development, green indicates moderate development, and orange indicates poor development).
Sustainability 17 10293 g001
Figure 2. Spatiotemporal Evolution of the Comprehensive Digital Technology Development Index (CDTDI) across 30 Chinese Provinces by Four Regions, 2013–2020. (a): CDTDI of Eastern region; (b): CDTDI of central region; (c): CDTDI of Western region; (d): CDTDI of Northeastern region. (Blue indicates high level, green indicates medium level, and orange-red indicates low level).
Sustainability 17 10293 g002
Figure 3. Spatiotemporal Evolution of the Comprehensive Coupling Degree (CCD) in China, 2013–2020. (a): Trends of four regional and national mean CCD; (b): Box plots depicting the distribution of CCD across Chinese 30 provinces for each year from 2013 to 2020. The small circles denote individual provinces identified as statistical outliers beyond the main distribution. Disordered stages: CCD ∈ [0,0.3); moderate disorder: [0.3,0.4), transitional stages: CCD ∈ [0.4,0.6); Coordinated stages: [0.6, 1.0).
Sustainability 17 10293 g003
Figure 4. Provincial CCD Variations by Chinese Four Regions, 2013–2020. (a): CCD of Eastern region; (b): CCD of central region; (c): CCD of Western region; (d): CCD of Northeastern region.
Sustainability 17 10293 g004
Figure 5. Spatiotemporal Evolution of the Relative Development Degree (RDD) in China, 2013–2020. (a): Trends in Eastern, Central, Western, Northeastern, and national mean RDD; (b): Box plots depicting the distribution of RDD across 30 Chinese provinces. The small circles denote individual provinces identified as statistical outliers beyond the main distribution.
Sustainability 17 10293 g005
Figure 6. Spatiotemporal Evolution of Provincial RDD between Digital Technology and ALSS Development by Four Regions, 2013–2020. (a): Eastern region; (b): Central region; (c): Western region; (d): Northeastern region.
Sustainability 17 10293 g006
Table 1. Evaluation Indicator System for Digital Technology Development.
Primary IndicatorsSecondary Indicators (Unit)Attribute
Digital InfrastructureMobile phone penetration (per 100 persons)+
Internet penetration (%)+
Optical cable length (km)+
Switching capacity of mobile telephone exchanges (10,000 households)+
Broadband access ports (10,000 units)+
Employees in IT services (10,000 persons)+
Digital ApplicationsEnterprises with websites (per 100 enterprises)+
Enterprises engaged in e-commerce (%)+
E-commerce sales (100 million RMB)+
Total value of telecommunications services (100 million RMB)+
Output value of software and IT services (100 million RMB)+
Table 2. Administrative Composition, regional profile and ALSS numbers of China’s Four Major Regional Divisions.
RegionNumber of Provincial-Level DivisionsSpecific Provinces, Autonomous Regions, and MunicipalitiesRegional ProfileNumber of ALSSs (2024)
Eastern
Region
10Beijing, Tianjin, Hebei, Shanghai, Jiangsu, Zhejiang, Fujian, Shandong, Guangdong, HainanServes as China’s economic core, specializing in high-end manufacturing, modern services, and technological innovation. It features a dense transportation network and a high degree of openness. Its tourism resources center on modern metropolises, theme parks, coastal resorts, and classic cultural heritage. The region boasts well-developed tourism infrastructure, high-quality services, an international tourist market, and high consumption levels, making it a vital domestic tourist destination and source of outbound tourists.5405 ALSSs in total including 135 rated 5A, 1566 rated 4A, and 2898 rated 3A.
Central
Region
6Shanxi, Anhui, Jiangxi, Henan, Hubei, HunanFunctions as a crucial national base for agriculture and energy/resources, as well as a key transport hub. Its economy is growing rapidly and actively absorbing industrial transfer from the Eastern Region. Tourism is characterized by the origins of Chinese civilization, famous mountains and rivers, and “Red Tourism” sites, contributing to a rapidly growing tourism economy.3339 ALSSs in total including 85 rated 5A, 1066 rated 4A, and 1863 rated 3A.
Western
Region
12Inner Mongolia, Guangxi, Chongqing, Sichuan, Guizhou, Yunnan, Tibet, Shaanxi, Gansu, Qinghai, Ningxia, XinjiangEncompasses a vast area with rich natural resources and diverse ecosystems, though its economic development lags behind the east and is uneven. Tourism is defined by pristine natural landscapes, rich ethnic minority cultures, and historical Silk Road routes, making it suitable for special interest and eco-tourism. Improvements in infrastructure are helping tourism become a new driver of economic growth.5547 ALSSs in total including 110 rated 5A, 1814 rated 4A, and 2927 rated 3A.
Northeastern
Region
3Liaoning, Jilin, HeilongjiangTraditional heavy industrial base with extensive plains and forest resources. The region is currently accelerating industrial restructuring and modernization. Its tourism offerings feature ice and snow tourism, summer retreats, industrial heritage sites, and borderland scenery. The tourism economy exhibits significant seasonal variation.1268 ALSSs in total including 19 rated 5A, 346 rated 4A, and 709 rated 3A.
Table 3. Evaluation Indicator System for the High-Quality Development of ALSSs.
Target LayerPrimary
Indicators
Secondary
Indicators
Tertiary Indicators (Unit)Attribute
High-Quality Development of ALSSTourism
Infrastructure Supply
Travel Service
Facilities
Number of travel agencies+
Accommodation & Catering
Facilities
Number of hotels+
Number of guest rooms per 10,000 people +
Number of beds per 10,000 people+
Transportation FacilitiesRailway network density (km/104 km2)+
Highway network density (km/104 km2)+
Civil aviation passenger traffic (104 persons)+
A-Level
Scenic
Spot Supply
Supply ScaleNumber of ALSSs+
Employment in scenic spots (104 persons)+
Scenic spot density (104 km2)+
Scenic spots per 104 people (/104 persons)+
Supply QualityShare of 5A and 4A ALSSs (%)+
Investment in scenic spot construction (100 million RMB)+
Investment per scenic spot (100 million RMB/spot)+
Tourism
Economic Development
Development ScaleTourist arrivals (100 million person-times)+
Tourism revenue (100 million RMB)+
Development
Efficiency
Per capita scenic spot output (104 RMB)+
Tourists per 1A scenic spot equivalent (104 persons)+
Revenue per 1A scenic spot equivalent (104 RMB)+
Industrial
Structure
Index of industrial structure upgrading+
Disclaimer/Publisher’s Note: The statements, opinions and data contained in all publications are solely those of the individual author(s) and contributor(s) and not of MDPI and/or the editor(s). MDPI and/or the editor(s) disclaim responsibility for any injury to people or property resulting from any ideas, methods, instructions or products referred to in the content.