3.1. Performance of Machine Learning and Traditional Regression Models
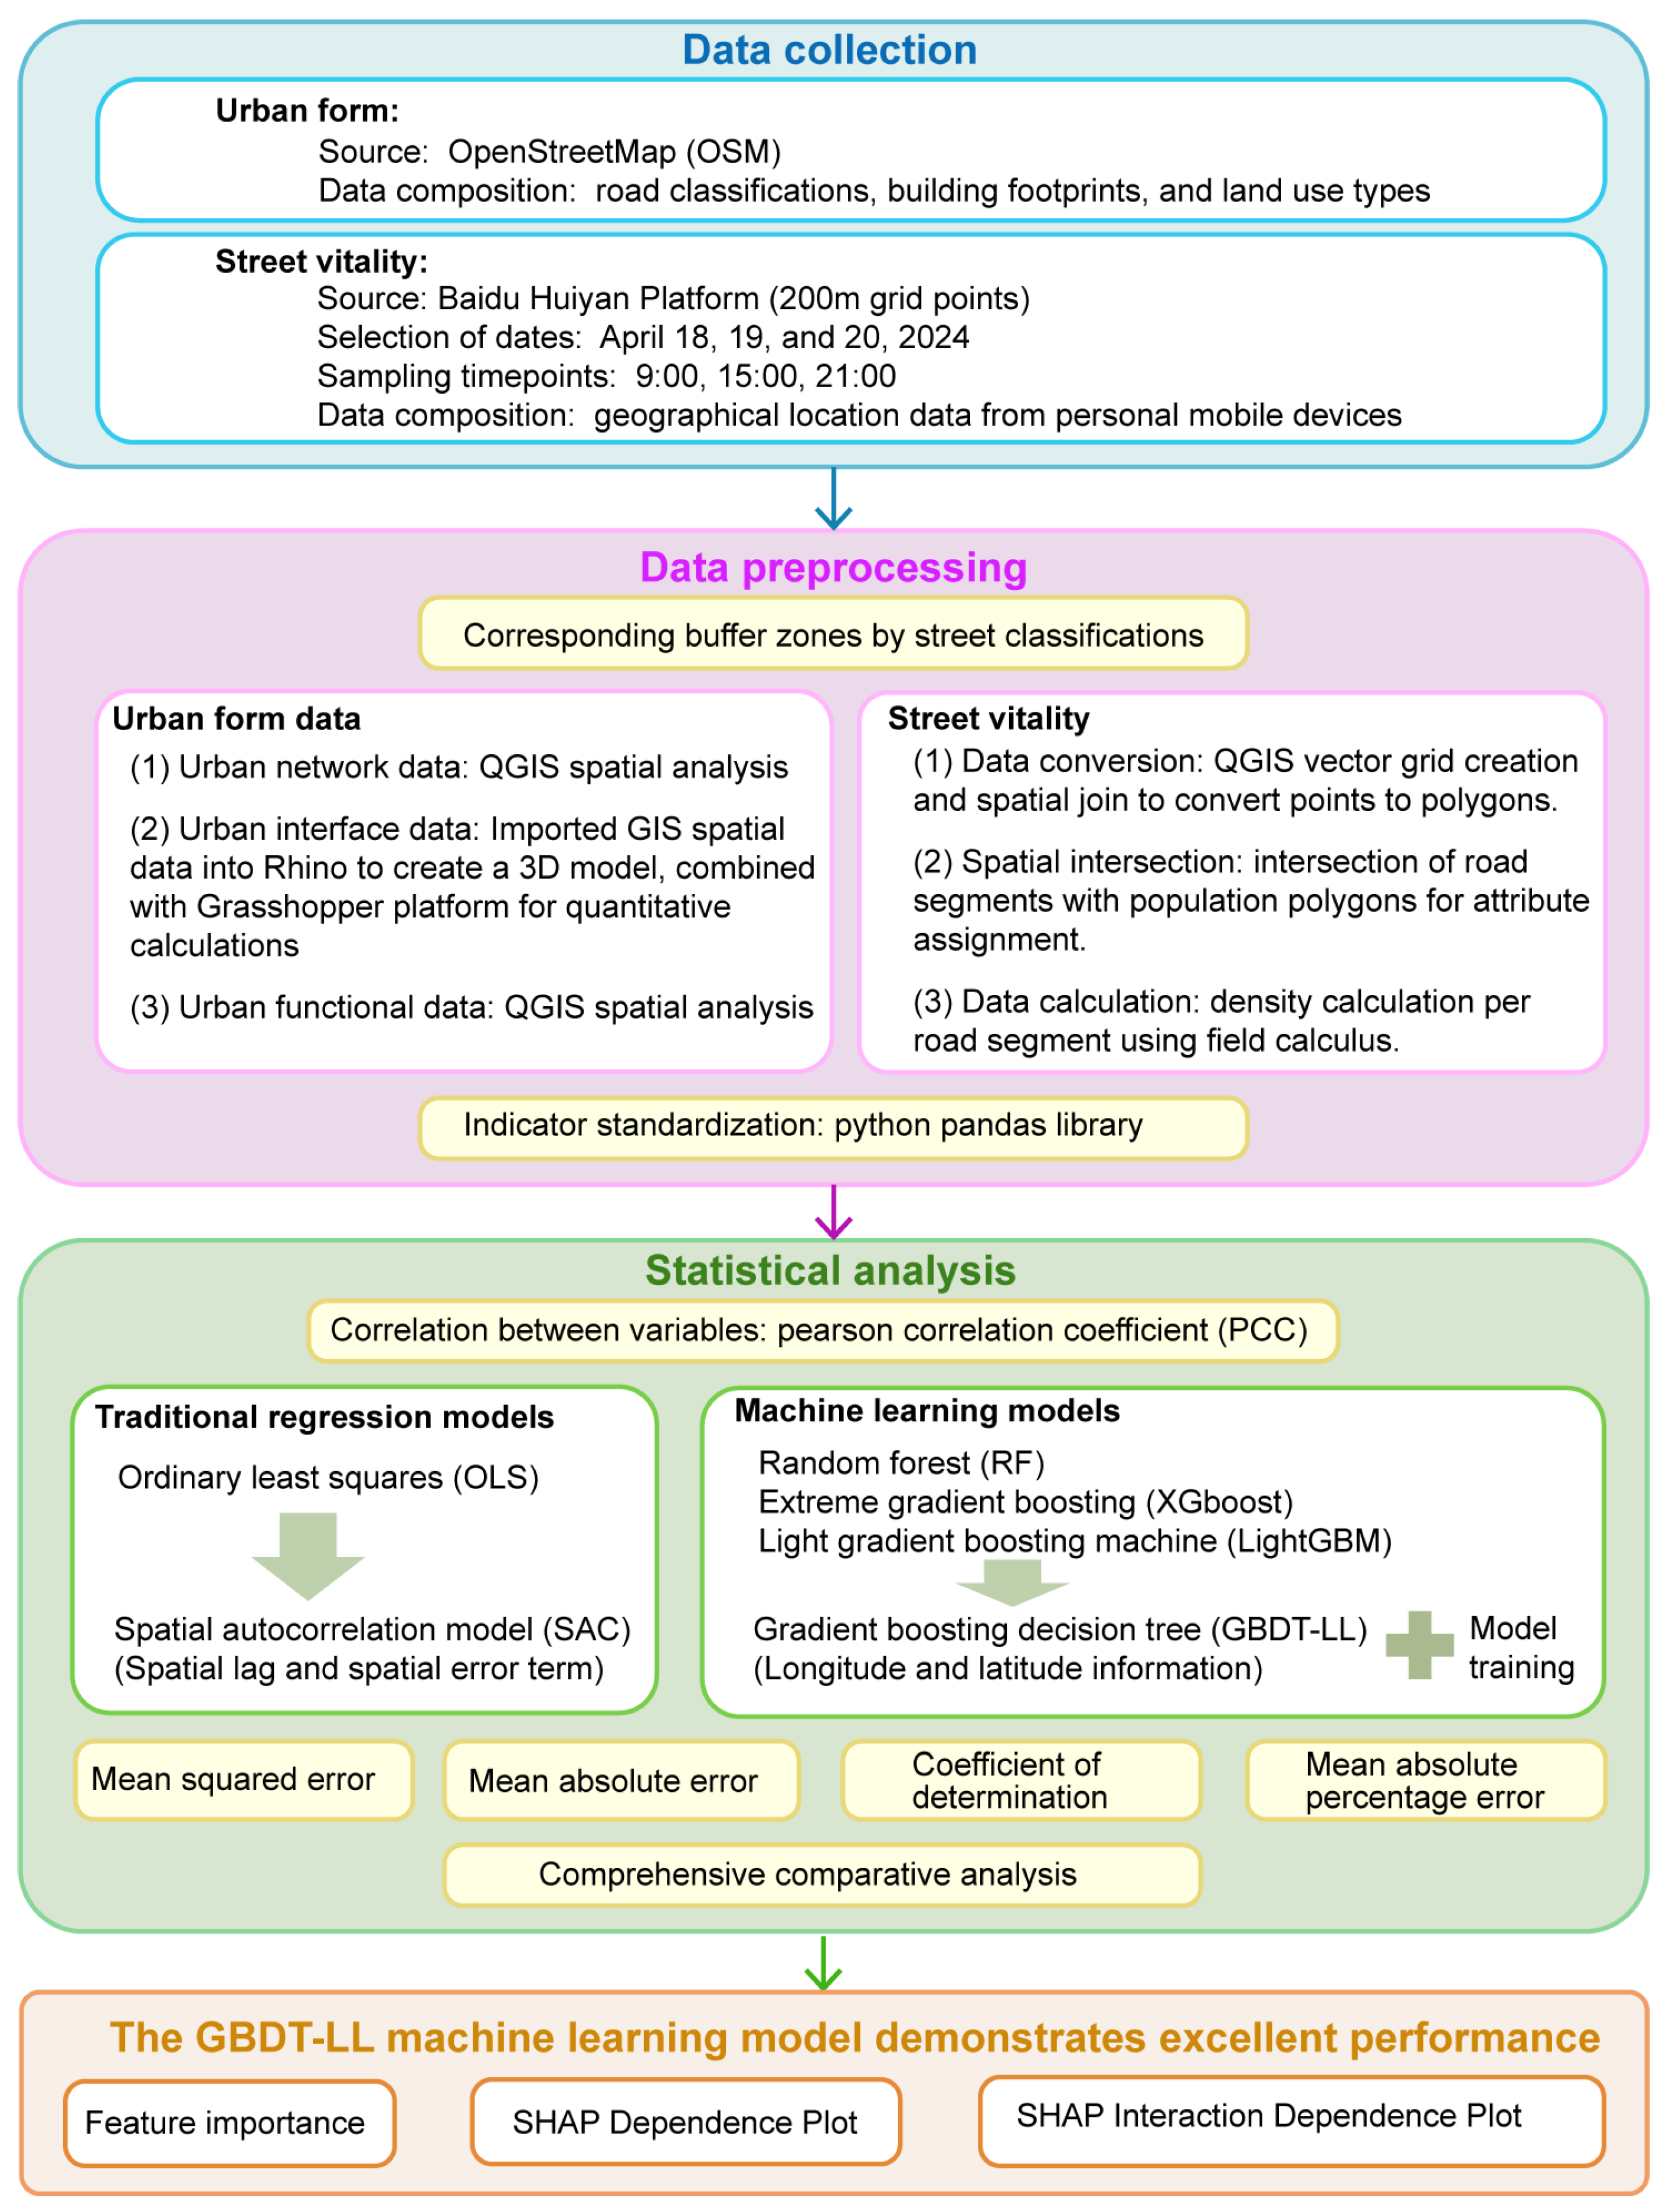
To enable comparisons with the SAC model and control for the spatial factor variable, the study introduced coordinate information (latitude and longitude) as a general variable into the GBDT model, constructing the GBDT-LL model. Specifically, the spatial context of the observations was encapsulated by incorporating the geographic coordinates of the street segment centroids. These centroid locations were algorithmically determined from the street geometry within a GIS environment by utilizing the WGS 84/Pseudo-Mercator (EPSG:3857) coordinate reference system. Latitude and longitude were included as independent variables in the analysis. This setup allows the SAC and GBDT-LL models to be contrasted in terms of their treatment of spatial factors. The introduction of geographic information also improves model accuracy.
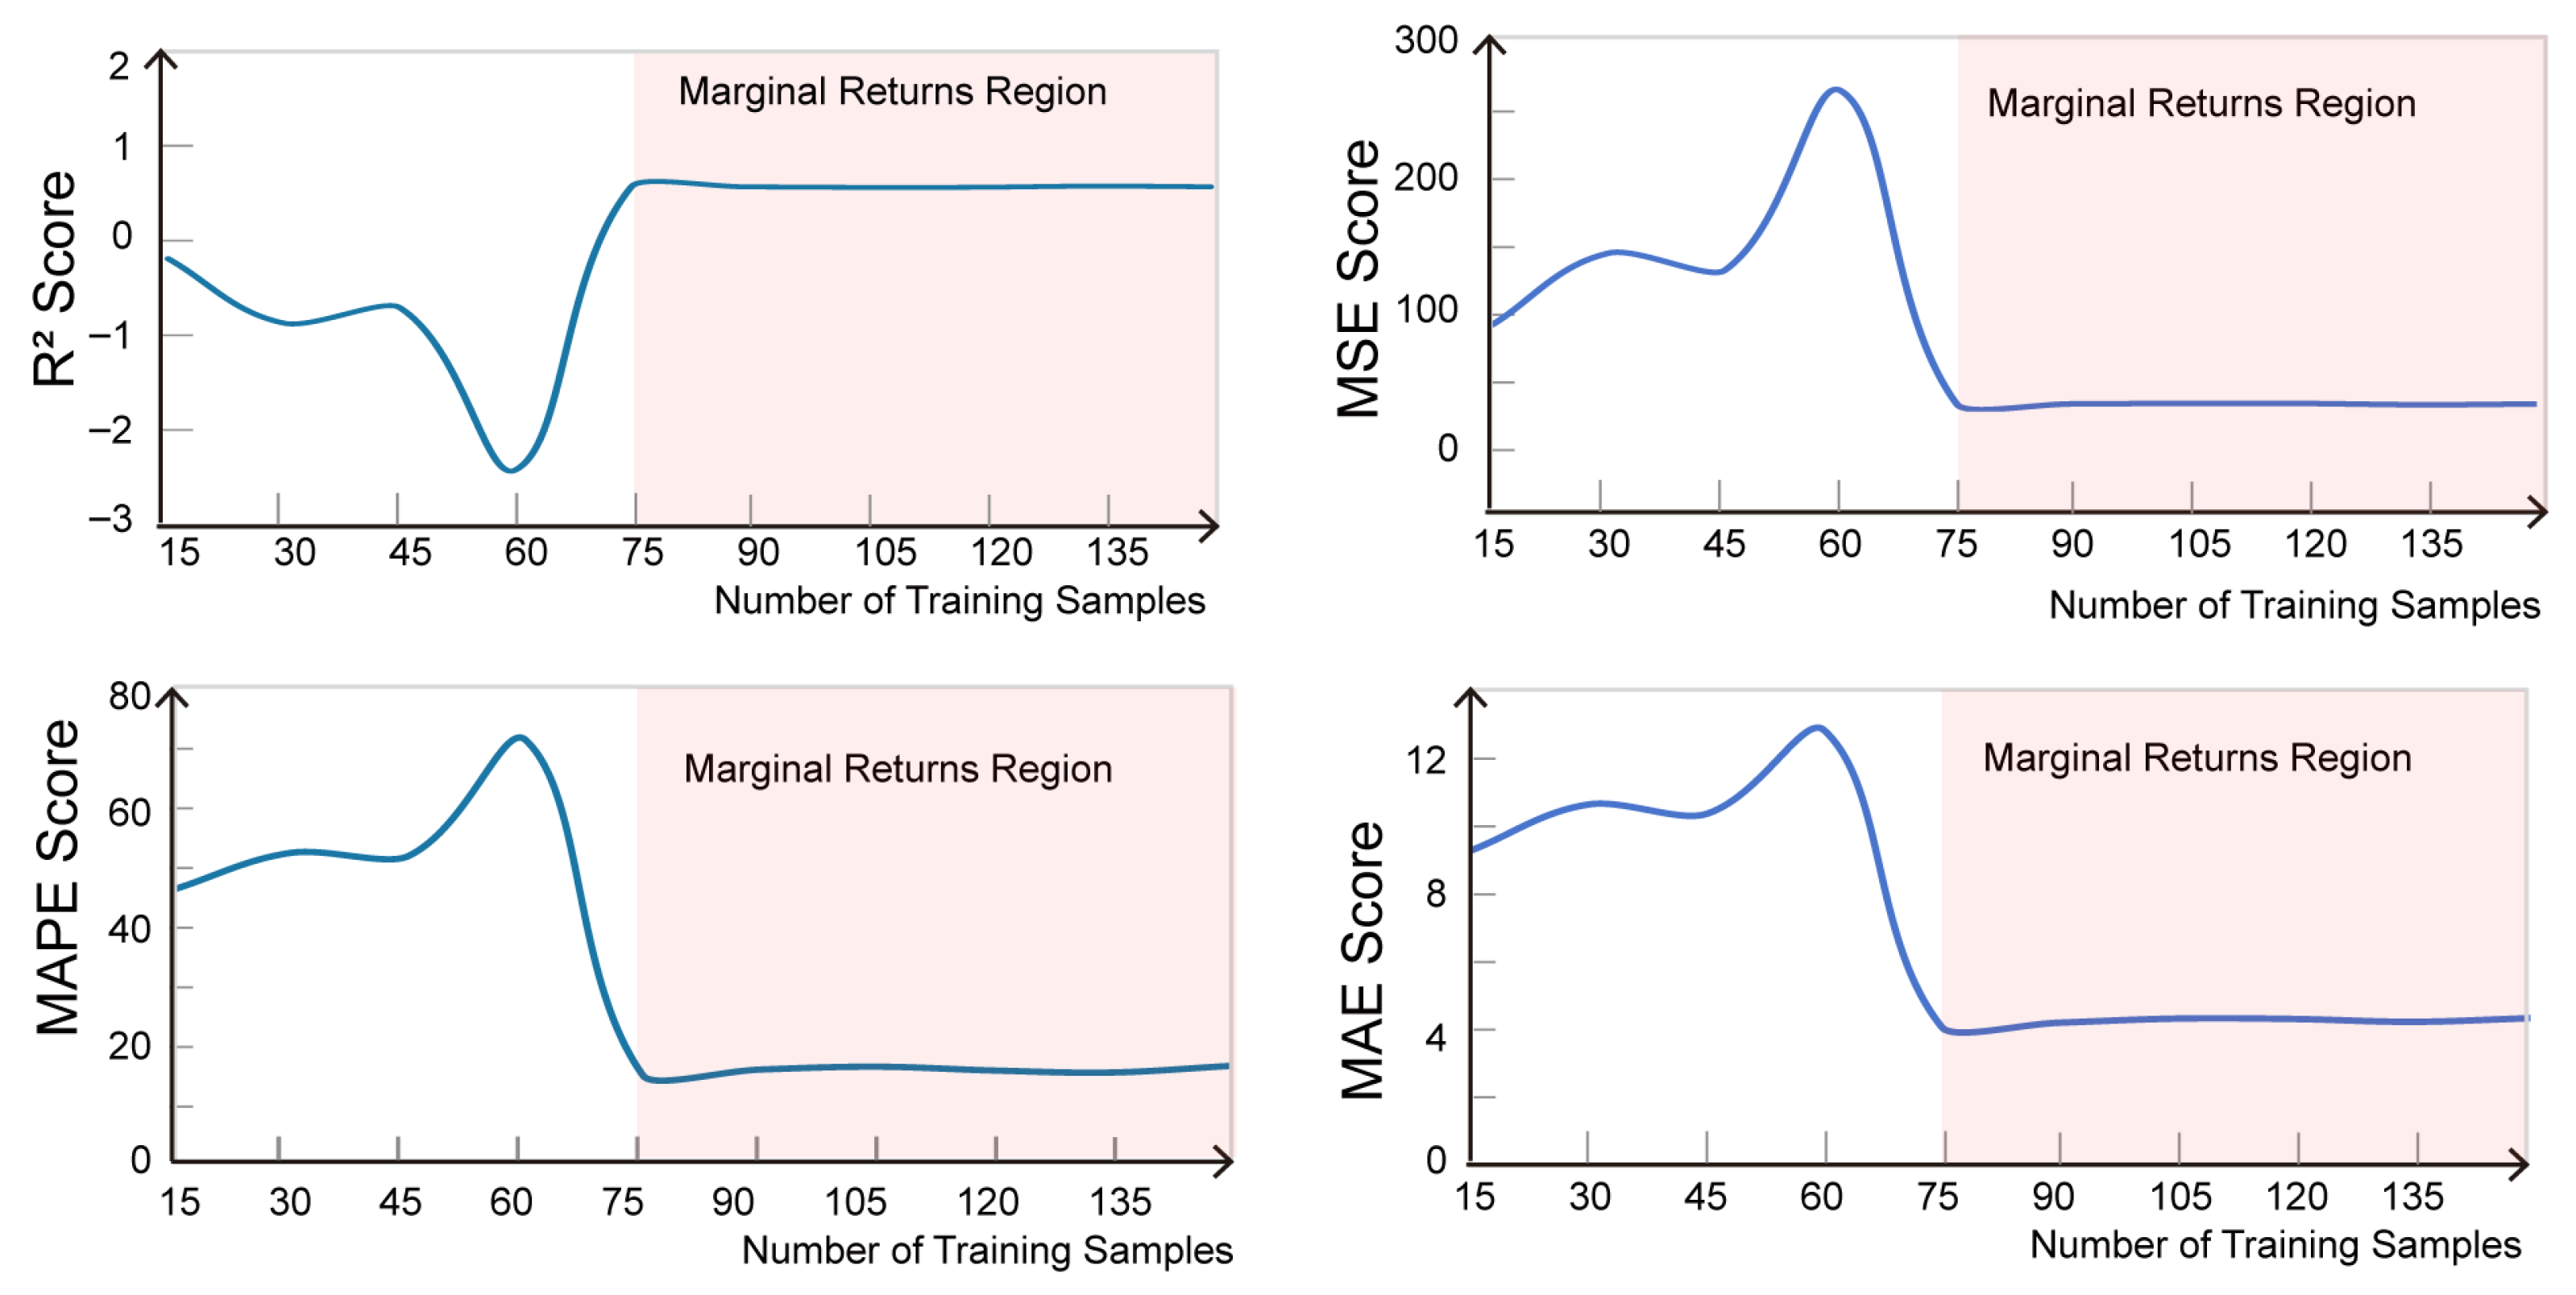
Table 4 presents the predictive performance of six models—OLS, SAC, RF, XGBoost, LightGBM, and GBDT-LL—across different time points. Compared with the OLS baseline, the machine learning models demonstrated an advantage. Although the observed improvements may not meet conventional thresholds for statistical significance, they indicate practical relevance, particularly in the context of urban vitality forecasting, where data volatility is high. These findings suggest that machine learning approaches are better suited to capturing complex, nonlinear relationships in this domain.
3.2. Feature Importance in Machine Learning Models
Feature importance quantifies the contribution of each independent variable to the prediction of the dependent variable within a machine learning model. It highlights the most influential variables in determining model outcomes [
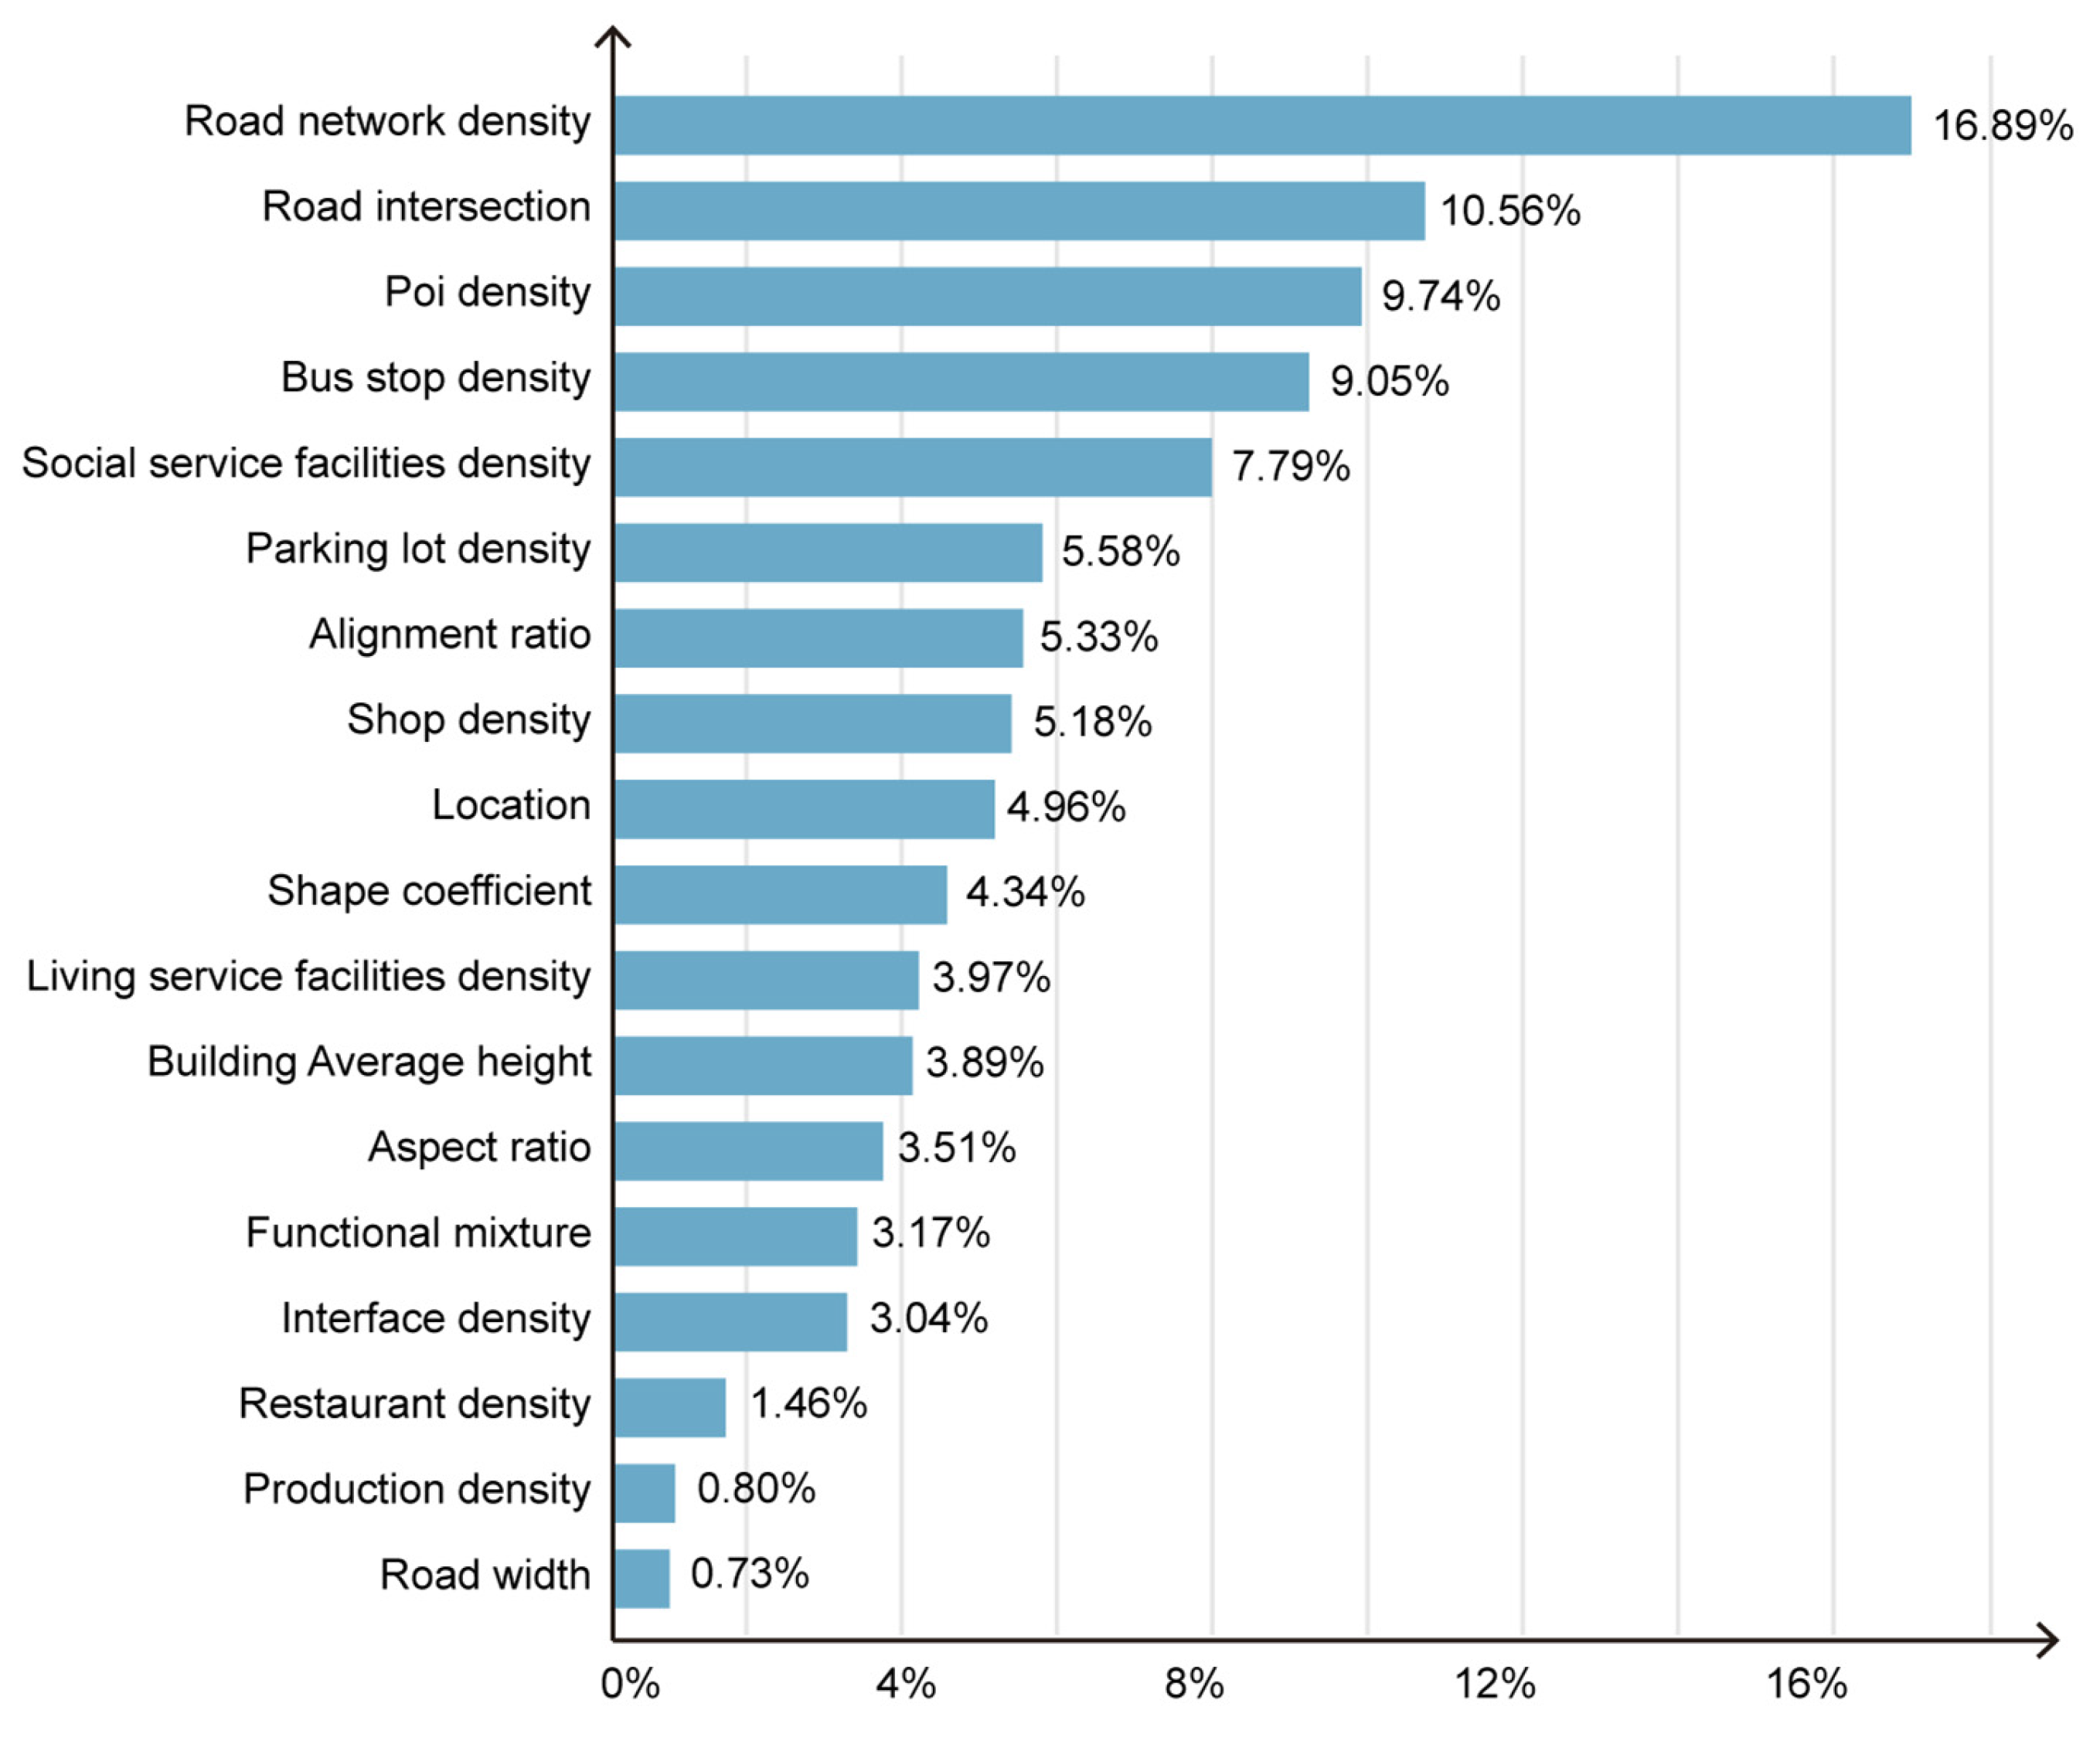
73]. This study assesses the relative importance of 17 street spatial element variables in terms of their contribution to the model’s predictive accuracy (
Figure 11).
Road network density (16.89%), road intersections (10.56%), POI density (9.74%), bus stop density (9.05%), and social service facilities (7.79%) are the dominant contributors to vitality around MSAs.
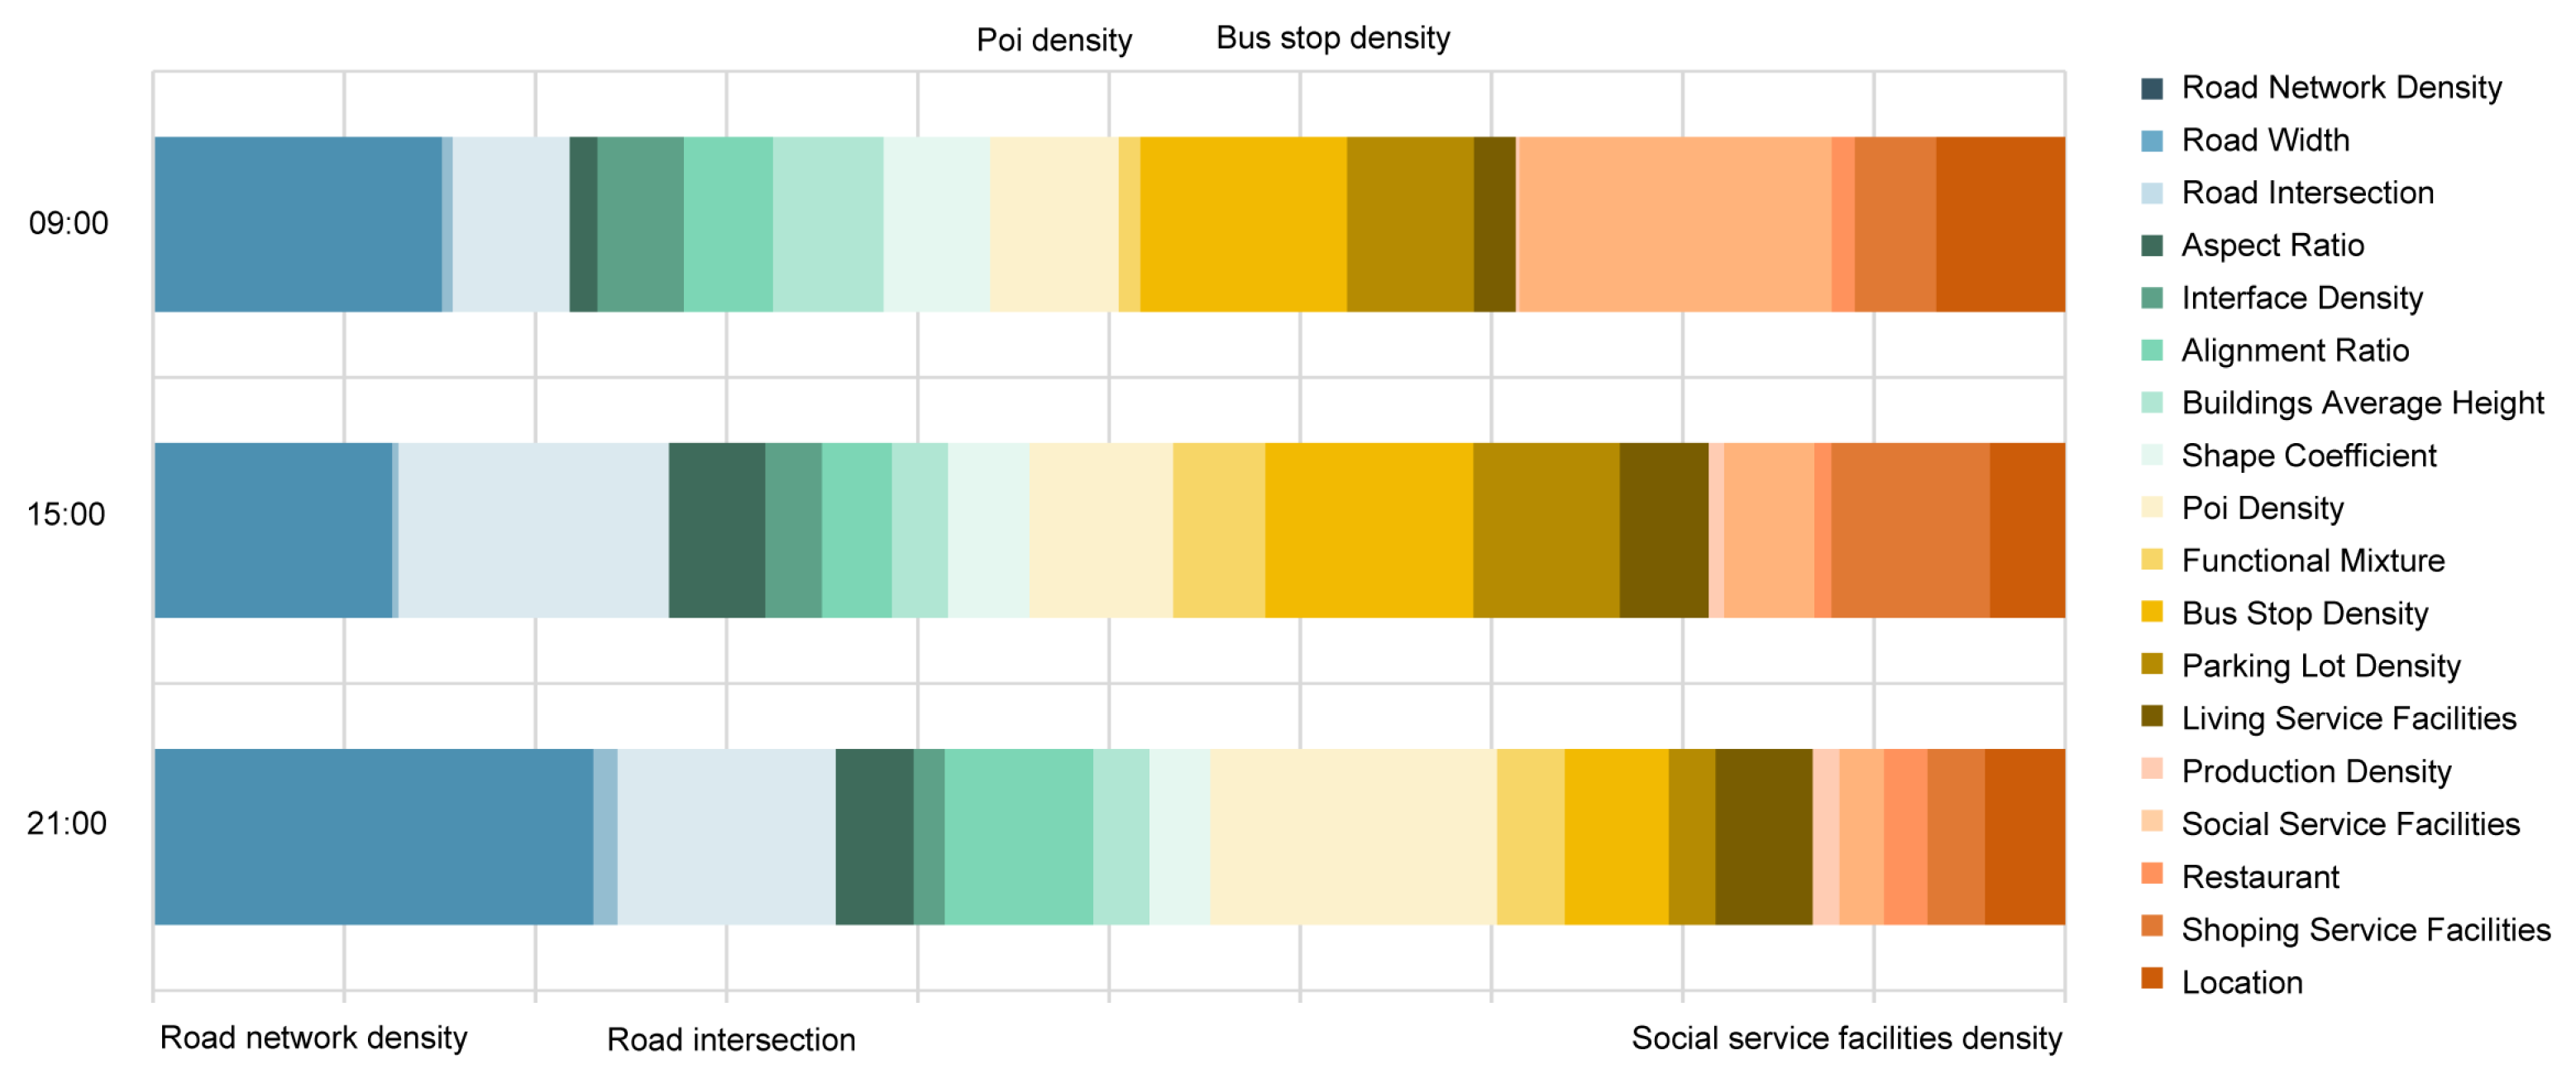
To compare the relative contribution of features across different times of day, we converted the SHAP feature importance values into percentage contributions and visualized them using a stacked bar chart (
Figure 12). This visualization highlights how the influence of each feature shifts in proportion to the total throughout the diurnal cycle.
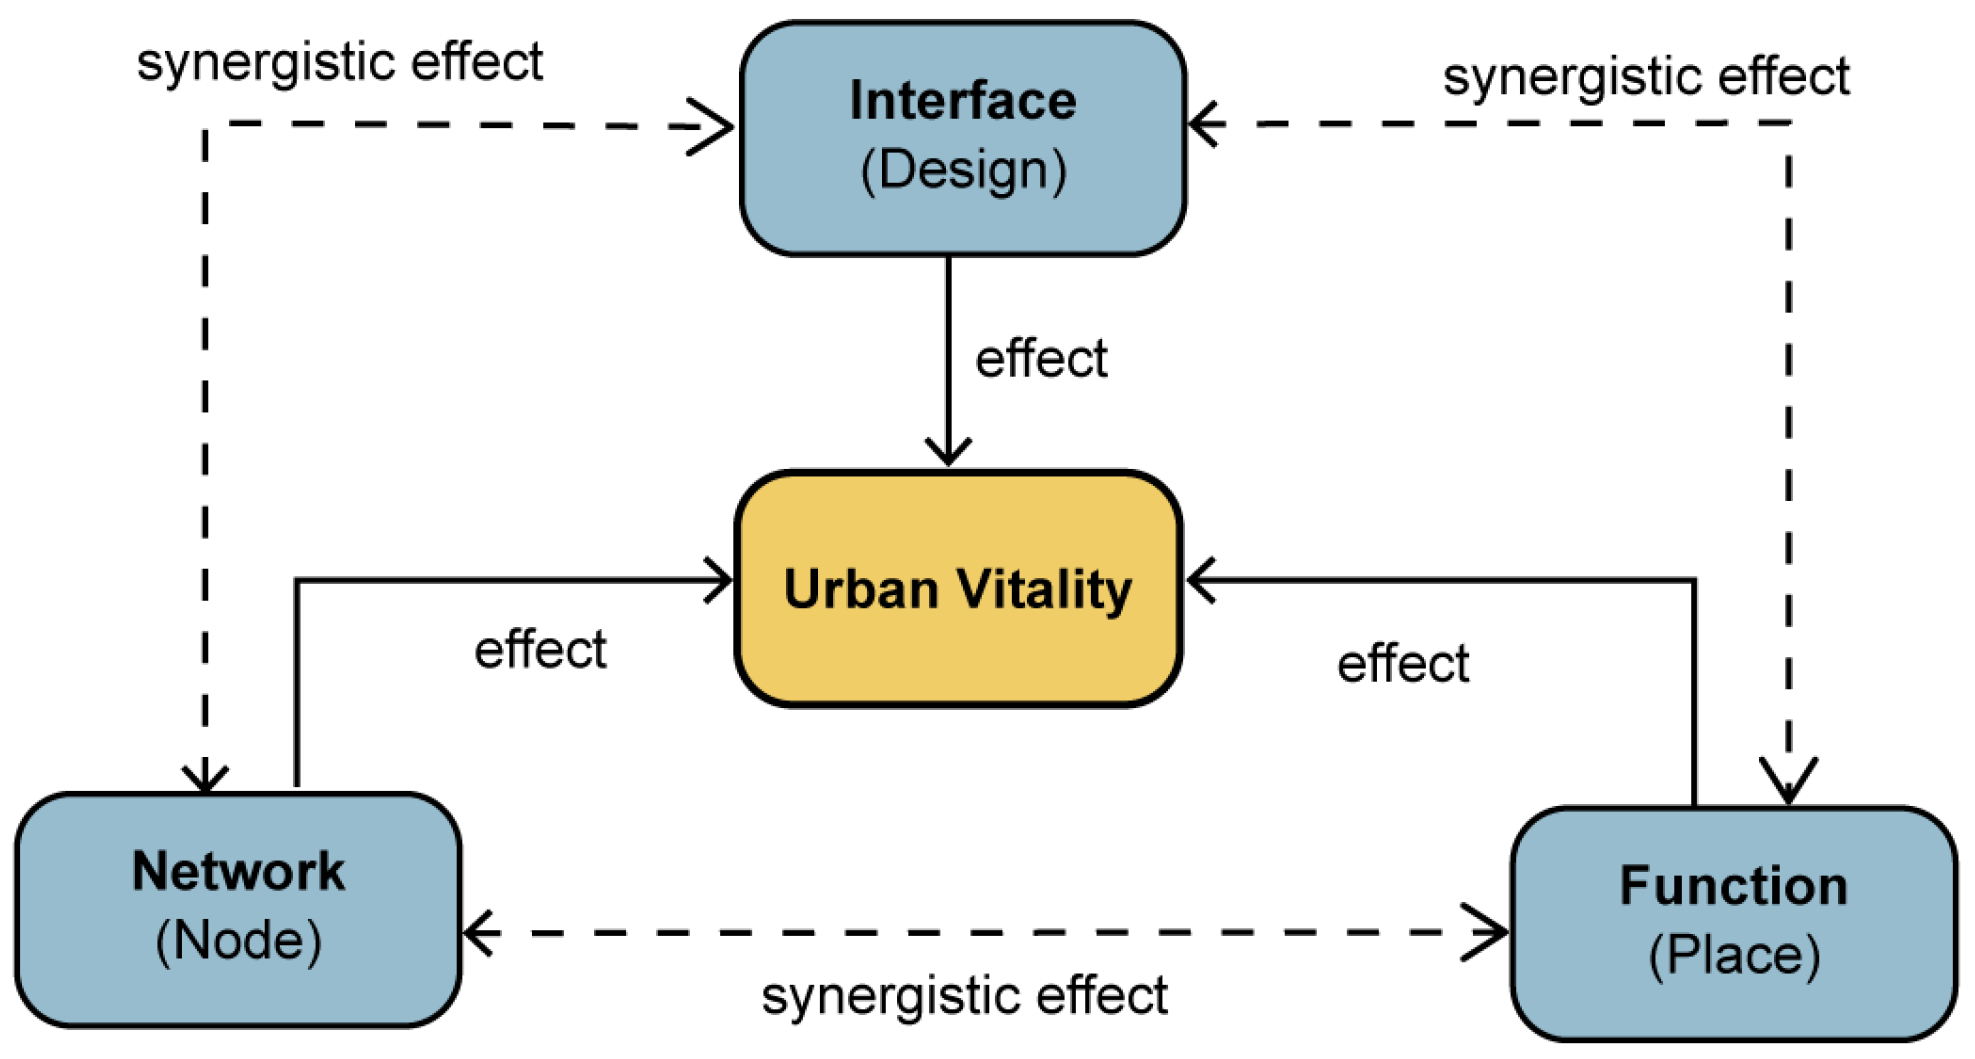
These urban form features serve as the key mediators and essential prerequisites for the generation of high-activity MSAs. The model developed in this study quantifies this synergistic relationship. According to the feature importance analysis derived from the GBDT-LL model, the street spatial form dimensions exert varying levels of influence on vitality depending on different times of the day. In the network form, road density and intersection frequency are critical during peak commuting hours. In the interface form, aspect ratio and building height significantly impact pedestrian comfort and safety during evening hours. In the functional form, functional and service facility density are especially influential during the period between 15:00 and 21:00. These variations in feature importance reflect the dynamic temporal nature of urban spatial configurations, providing empirical support for enhancing urban planning and design.
The subsequent section discusses the top five urban form features with the most significant magnitude of fluctuation. Findings suggest that the influence of network structure indicators on vitality dependency values is strongly demand-driven. At 9:00 and 21:00, the feature importance of network-related variables, such as road network density and the number of intersections, is substantially higher than that of other spatial dimensions. This reflects the heightened demand for transportation accessibility during commuting hours, where dense, well-connected road networks effectively accommodate both pedestrian and vehicular flow, thereby reducing transit times. By 15:00, traffic volume decreases, and the significance of network density diminishes accordingly. However, by 21:00, the importance of density increases once again, likely due to the rise in evening activities in high-density neighborhoods. Bus stop density exhibits peak influence at 9:00, underscoring commuter preference for public transit systems. Its importance diminishes in the afternoon and evening, though it retains moderate influence during nighttime travel.
Functional indicators exhibit temporal variation consistent with an activity gradient, shifting from a focus on accessibility in the morning to an emphasis on functional diversity and spatial concentration in the afternoon and evening. At 9:00, the influence of functional density on behavioral vitality is limited, as the transportation network primarily drives commuting behaviors. However, by 15:00, the role of functional density increases considerably, especially in areas with commercial and recreational facilities, which become more attractive. At 21:00, the influence of functional density reaches its peak, as nighttime activities concentrate in areas with dense functional offerings.
At 9:00, urban vitality is primarily necessity-driven, with social service facilities acting as rigid destinations and thus exhibiting peak feature importance. In contrast, at 15:00 and 21:00, vitality is shaped by discretionary, leisure-oriented activities, which diminish the influence of social services. Conversely, the density of dining and entertainment facilities peaks at night, becoming the dominant factor enhancing neighborhood attractiveness and drawing substantial amounts of activity.
3.3. SHAP Dependence Plots
SHAP dependence plots visualize the influence of urban form factors on street vitality by illustrating the relationship between feature values and their corresponding SHAP values (
Figure 13). The locally weighted scatterplot smoothing (LOWESS) algorithm was employed to elucidate potential threshold effects [
74].
Figure 13a–d provide strong evidence of threshold effects in the relationship between urban form and street vitality within community-oriented MSAs. Due to the large number of urban form features, only variables with significant feature importance are presented. Within their respective effective ranges, the number of road intersections (22–28 per km
2) and road network density (14–16 km per km
2) positively influence crowd activity during peak periods. Beyond these thresholds, the positive impact plateaus. A similar trend is observed for bus stop density (1–7 units per km
2) and POI density (14–100 units per km
2), which maintain a positive correlation before stabilizing.
Figure 13e,f show that variables such as aspect ratio and average building height display different behavior. These features exhibit a noticeable negative correlation beyond certain thresholds. Specifically, the positive impact of aspect ratio stabilizes around 0.5, after which it begins to decline. When the aspect ratio exceeds 2, it has a negative impact on street vitality. A comparable pattern is observed for the average building height, with positive effects increasing beyond 20 m and peaking at approximately 42, followed by a decrease.
In contrast, as for
Figure 13g,h, for street width, vitality increases between 10 m and 15 m, plateaus and turns negative between 15 m and 40 m, and shows a tentative rebound beyond 40 m. When parking density is below 1 unit per km
2, it promotes street vitality but declines steadily. The effect diminishes with increasing density and reverts to negative beyond it, with only a marginal recovery observed after 4.5 units per km
2.
3.4. The Interaction Effects Between Key Urban Form Variables
SHAP is used to visualize how the contribution of one feature depends on the value of another [
75]. Each sample is represented as a point, with one feature’s value plotted on the
x-axis and another feature’s value on the
y-axis. The color of each point indicates the corresponding pure SHAP interaction value. Red points represent positive interaction values, indicating that the joint effect of two variables exceeds the sum of their individual marginal effects—i.e., a synergistic interaction that enhances vitality. Conversely, blue points signify negative interaction values, where the combined effect is less than the sum of individual effects, indicating an antagonistic interaction. The intensity of the color reflects the strength of the interaction, with darker shades indicating stronger effects.
Variables with feature importance exceeding 5% were selected for interaction analysis. Several features displaying significant interaction effects are summarized below.
Based on the variation in pure interaction values, two typical interaction types were identified. Synchronous interactions occur when both variables are at either low or high levels, suggesting that mutual reinforcement is likely when feature values are aligned [
76]. In contrast, asynchronous synergies arise when one variable is high and the other is low, though their combination still yields a cooperative effect [
77].
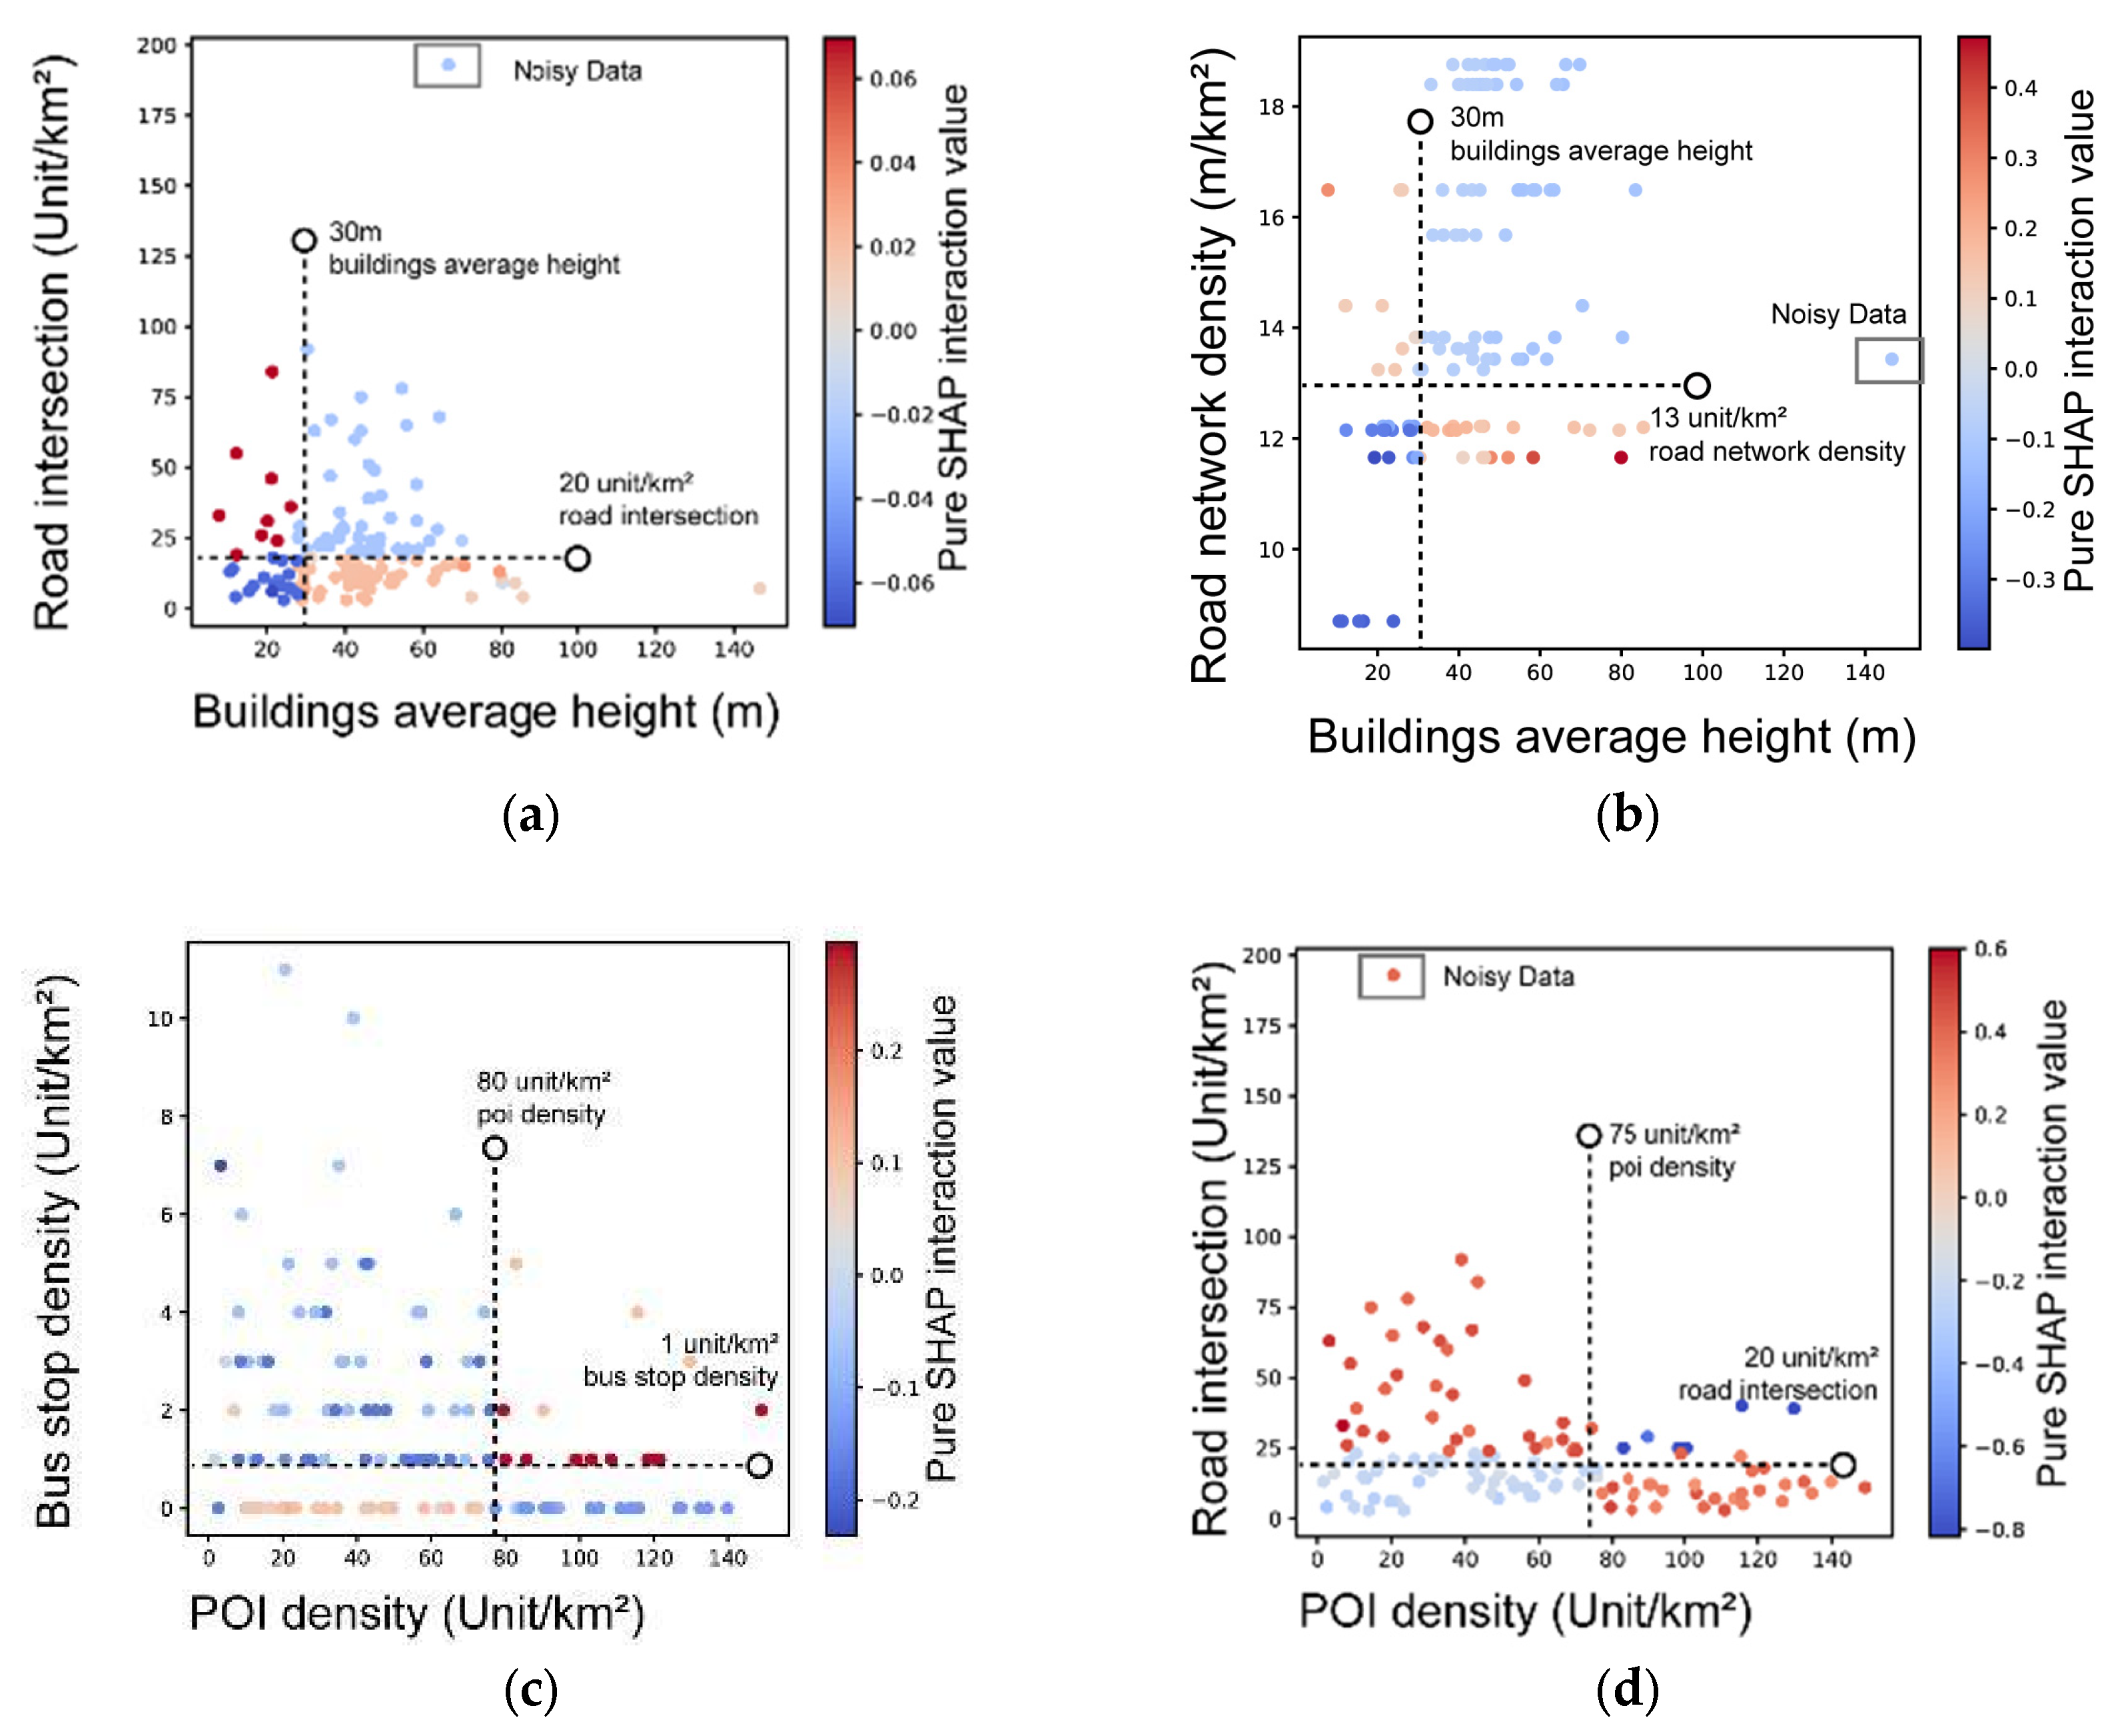
As shown in
Figure 14a, a clear antagonistic interaction is observed between average building height and road intersection density when both values are relatively low. Synergistic effects emerge when building heights exceed 30 m or road intersection density surpasses 20 per km
2, indicating a transition into an optimal state of “high-efficiency coordination.” This observation aligns with the widely recognized urban planning paradigm of “high density, small blocks, and dense road networks” [
78]. However, even a slight increase in one variable beyond this point can result in an antagonistic effect, likely due to congestion-related inefficiencies. A similar pattern is observed in the interaction involving street network density (
Figure 14b). This is attributable to the long-tailed distribution of both variables; excessively high values in either can contribute to overcrowding and reduced commuting efficiency, thereby diminishing the effectiveness of the other. These findings offer practical insights for areas characterized by high development intensity but sparse road networks, a common condition in older urban districts. In such contexts, merely increasing the number of intersections or road density may not be the optimal strategy for enhancing street vitality. Instead, urban design efforts should focus on reducing congestion to improve overall accessibility and livability.
In contrast, the interaction between POI density and the number of bus stops displays an opposite pattern (
Figure 14c). A strong synergistic effect is evident when bus stop density exceeds 1 unit per km
2 and POI density surpasses 80 units per km
2. This indicates that high POI density supports public transit systems by providing a stable and substantial passenger base, which in turn enhances operational efficiency and economic viability. At the same time, accessible and efficient public transit significantly improves connectivity to high-density POI areas, thereby increasing their attractiveness for residential, occupational, and commercial activities. When either indicator falls below these thresholds, a strong antagonistic interaction appears. This dynamic helps explain the self-reinforcing decline seen in certain urban areas, where population loss leads to reduced transit service, diminished accessibility, and further demographic decline.
An antagonistic interaction is also observed when POI density is below 75 units per km
2 and road intersection density is below 25 per km
2 (
Figure 14d). Interestingly, even a marginal increase in one variable under these conditions can exacerbate antagonistic effects. This suggests that simultaneous advancement of all urban form indicators may not be necessary for development. In many cases, identifying a “leverage point” for concentrated and targeted investment can be a more effective strategy, enabling market forces to generate secondary improvements in other indicators.
3.5. Verification of Research Hypotheses
This section evaluates the extent to which the empirical findings support the three hypotheses proposed in
Section 1.3. The analysis draws on results from the GBDT-LL model, including feature importance assessments, SHAP Dependence Plots, and SHAP interaction effects, across three selected time points: 9:00, 15:00, and 21:00.
Hypothesis 1 posits that the relationship between key urban form characteristics—such as road network density, intersection count, and aspect ratio—and street vitality is nonlinear, marked by identifiable thresholds beyond which their influence diminishes, stabilizes, or reverses. This hypothesis is supported by evidence from the SHAP Dependence Plots (
Figure 13). For instance, road network density exerts a positive influence up to a threshold of 14–16 km/km
2, beyond which the effect plateaus, indicating diminishing returns. Similarly, intersection count demonstrates nonlinearity with thresholds at 22–28 per km
2. Average building height stabilizes around 42 m, then decreases due to its positive effect. These findings confirm the presence of nonlinear effects, activation levels, and upper thresholds, supporting the hypothesis and illustrating that urban form influences are not uniformly linear but context-dependent and bounded.
Hypothesis 2 asserts that urban form features interact with one another, producing synergistic or antagonistic effects on vitality. This is supported by SHAP interaction results (
Figure 14), which reveal complex interdependencies among variables. For example, POI density and bus stop density (used as a proxy for transit density) demonstrate strong synergistic effects when both exceed thresholds—80 units/km
2 and 1 unit/km
2, respectively—enhancing vitality through improved accessibility and passenger flow. When either variable is below these thresholds, antagonistic effects emerge, potentially contributing to urban decline. Likewise, average building height and road intersection density exhibit antagonistic effects at lower levels (below 30 m and 20 intersections/km
2, respectively), but transition to synergistic interactions at higher values, supporting the model of “high-efficiency coordination” associated with high-density, small-block planning strategies. These results confirm that interactions between variables can amplify or mitigate individual effects, empirically validating the hypothesis and emphasizing the importance of integrated urban design.
Hypothesis 3 proposes that the magnitude and nature of urban form’s influence on vitality are temporally dynamic, varying throughout the day—network features are expected to peak during commute periods, while functional indicators are more influential during leisure periods. This hypothesis is supported by diurnal variations in feature importance (
Figure 11 and
Figure 12). Network-related variables, such as road network density and intersection count, exert greater influence during commuting hours, reflecting elevated demand for transport connectivity and accessibility. In contrast, functional features—such as POI density and social service facilities—peak during non-peak hours, corresponding to increased leisure and discretionary activities. Standard deviations in feature importance further underscore these fluctuations, confirming that urban form impacts are temporally variable and evolve with daily rhythms.
In summary, all three hypotheses are supported by the empirical findings, offering robust insights into the multifaceted relationships between urban form and street vitality in community-oriented MSAs. These validations reinforce the study’s methodological framework and provide an evidence-based foundation for time-sensitive and targeted urban planning interventions.
