Article

A New Tool for the Sustainable Use of Marine Space

Department of Civil, Chemicals, Environmental and Materials Engineering, Viale del Risorgimento 2, 40136 Bologna, Italy
*
Author to whom correspondence should be addressed.
Sustainability 2025, 17(22), 10182; https://doi.org/10.3390/su172210182
Submission received: 25 September 2025 / Revised: 7 November 2025 / Accepted: 11 November 2025 / Published: 14 November 2025
(This article belongs to the Special Issue Renewable Energy Conversion and Sustainable Power Systems Engineering)

Abstract

In recent years, the sustainable use of marine space has become increasingly important due to the growing number of competing activities. To minimize conflicts and environmental impacts, the co-location of these activities in multi-use marine areas is essential. Several approaches have been proposed to evaluate synergies and incompatibilities among marine uses, but most of them are either complex, case-specific, or lack full automation, which can limit their broader applicability. In this context, the paper presents an enhanced version of a Decision Support Tool for identifying optimal combinations of co-located activities. The tool is based on a multi-criteria analysis integrating technological, environmental, social, and economic factors, and it automatically provides an optimal configuration through a guided, user-friendly procedure. Experts select options for each activity and criterion from drop-down menus, and the tool automatically assigns scores and combines them to rank the different activity combinations. Implemented in an Excel sheet with a wizard interface, it can be easily completed by experts from different fields, who can assign weights to each criterion through discussion. The tool’s general structure also allows its use by policy-makers and consultants, supporting informed decision-making and facilitating science–policy interaction.

1. Introduction

The marine space represents a source of untapped potential for climate change adaptation, mitigation, and sustainable development. Combining actions aimed at enhancing human well-being inevitably leads to an intensification of marine space uses, which may result in competing stakeholder interests, threats to ecosystems, and potential conflicts among user groups [1]. This calls for a sustainable, multi-use, cross-sectoral approach capable of transforming the traditional concept of exclusive resource rights into one based on inclusive resource sharing among multiple users.
Marine spatial planners face the challenge of accommodating emerging “Blue Growth” sectors (energy, aquaculture, biotechnology, tourism, mineral mining) as these increasingly claim space in already crowded seas [2,3]. The main bottleneck is not the absolute amount of available ocean space but rather that most of these sectors seek to operate within restricted marine areas offering favorable conditions, such as limited water depths, proximity to shore and ports, and suitable meteorological and oceanic characteristics.
Consequently, the concept of combining different activities within Multi-Use marine Areas (MUAs) has gained traction. Several conceptual MUA designs were developed during the European Commission’s “FP7 Oceans of Tomorrow” initiative. The H2OCEAN project [4] introduced the concept of a floating offshore maritime transportation hub, an autonomous installation powered by locally produced energy from floating wind turbines and hydrogen conversion. The TROPOS project [5] developed three designs for floating islands dedicated mainly to tourism, maritime transportation, and Renewable Energy (RE) production. The MERMAID project [6] created tools for identifying optimal combinations of economic activities on a given platform or within a specific marine area.
Under the H2020 framework, the SPACE@SEA [7] and The Blue Growth Farm [8] projects, funded by the European Commission, developed detailed designs and tested technologies required to establish two TRL5 pilot floating modules supporting RE and aquaculture. The H2020 MARIBE [9] and MUSES [10] projects explored the potential of various combinations of economic activities in co-location or integrated in platforms [11]. The MARIBE project concluded that multiple barriers continue to hinder multi-use implementation, including regulatory, financial, liability, and insurance issues, as well as environmental concerns, stakeholder perceptions, and a lack of appropriate skills.
Currently, only a few real-world examples of co-location exist in European waters, typically linked to offshore wind farms. The most advanced is the EDULIS pilot project in the North Belgian Sea [12], which produces mussels within a wind park located about 20 km offshore. New pilot projects have been established within recently completed Horizon Europe initiatives such as OLAMUR [13], ULTFARMS [14], UNITED [15], and MUSICA [16].
Despite these advances, permission and policy barriers for MUAs remain difficult to overcome, and industrial stakeholders still lack secure and clearly defined tenure rights necessary to promote long-term investment.
Given the wide range of potential activities within marine MUAs, it is crucial to develop tools capable of evaluating the optimal combination of Uses of the Marine Area (UMA) for a specific location. Such tools should support a fair and sustainable use of marine resources and space while considering economic, social, and environmental dimensions.
To assist Marine Spatial Planning (MSP) and decision-making processes, various spatial Decision Support Tools (DSTs) have been developed. These tools provide marine planners with spatial geographic data analyses, map comparisons, and spatial statistics. Several existing DSTs, such as Symphony [17], MYTILUS [18], Tools4MSP [19], and EcoImpactMapper [20], focus on use–environment interactions through a Cumulative Impact Assessment (CIA) approach [21]. The main output of a CIA is a cumulative impact map that highlights areas where the marine environment is more or less affected by human activities, typically calculated using an additive linear model [18,20,22]. Using such CIA maps, planners and decision-makers can identify multi-use and marine activities that can occur in close spatial and temporal proximity, provided that their combined environmental impact remains acceptably low.
However, existing DSTs have largely neglected the dynamic interactions among different UMA [23]. Some tools do consider use–use interactions but only to a limited extent. For instance, the ADRIPLAN Maritime Use Conflict tool [24] accounts for spatial and temporal overlaps among marine activities [19], but it simplistically treats all overlaps as conflicts, without evaluating the degree or nature of potential conflicts or synergies [23]. Other tools, such as Marxan With Zones [25] and a game-theory-based model by Kyriazi et al. [26], include functionalities to support MUAs within the MSP framework but do not assist users in identifying or exploring multi-use opportunities. Instead, users must already possess prior knowledge of relevant MUAs before applying these tools [23].
In this paper, a DST for selecting sustainable combinations of UMA in MUAs is presented, focusing on the synergies and conflicts arising from the co-location of different UMA. The tool is based on a well-established Multi-Criteria Methodology (MCM). The first version of this MCM was proposed by Zanuttigh et al. [27] and tested in various applications in the Mediterranean Sea [27,28]. The criteria were later revised by Zanuttigh et al. [29] to address the specific case of reusing offshore Oil and Gas platforms.
The scoring methodology was subsequently refined, and a new pre-programmed Excel-based tool was developed to assist experts in the MUA evaluation process. This is the novel Decision Support Tool for Multi-Use Areas (MUA-DST) presented in this paper. The MUA-DST can be used by public or private entities, involving groups of stakeholders regardless of their level of expertise, as a guided wizard procedure simplifies the evaluation process. Different UMA are considered for co-location within MUAs, specifically including Renewable Energy Sources (RES), aquaculture, and tourism. Additionally, users can introduce other UMA beyond the predefined ones and combine them as desired. A comprehensive set of benefits and impacts is considered for each UMA, and compilers are free to choose the preferred methods for calculating scores and assigning weights to different criteria.
The article is developed as follows. In Section 2, an overview of the tool is given and the use of the proposed MUA-DST within a decision-making process is explained. Section 3 describes the application of the tool in the different phases that allow experts to assign objective scores to different MUAs and to select the most promising one. Section 4 presents a sensitivity analysis of the final ranking of the MUA with respect to different score calculation methods and to the composition of the evaluation team. In Section 5, the main advantages are highlighted and the possible limitations of the tool are discussed. Finally, in Section 6, conclusions are drawn.

2. The Decision Support Tool for Multi-Use Areas

This Section provides a general description of the tool (Section 2.1) and illustrates how the proposed MUA-DST can be integrated into a decision-making process (Section 2.2).

2.1. Overview of the Tool

The availability of a framework for designing and optimizing MUAs to support various offshore activities in a sustainable manner is crucial in the context of MSP and Blue Growth. This requires an iterative process involving all stakeholders and investors from the earliest development stages [30]. As reported by Zanuttigh et al. [27,29], the initial phases of this process must focus on a multi-criteria evaluation of potential activities that could be implemented within the same offshore area.
The MUA-DST proposed here supports decision-makers in this ranking phase. The tool consists of a fully automated Excel sheet that enables rapid compilation by stakeholders and can be applied to compare and evaluate different MUAs, regardless of the UMA considered. In addition to the most common pre-set ones (RE production, aquaculture, and tourism), other uses can be freely added, allowing the generation of any number of combinations. MUAs are scored based on a wide variety of environmental, social, and economic benefits and impacts, using specific criteria and sub-criteria. These criteria, described in detail by Zanuttigh et al. [27] and further expanded by Zanuttigh et al. [29], are briefly recalled here (Figure 1).
The two criteria related to the benefits that a UMA can bring to an MUA are the “Innovation” and “Exploitation potential” criteria. The “Innovation” criterion accounts for potential advancements that the UMA may generate for both the market and the environment. These include job creation, patent development, synergies with other uses, and CO2 reduction, which constitute the sub-criteria to be evaluated. The “Exploitation potential” criterion considers energy production and the productivity of the various activities under assessment. In the case of RES, the sub-criteria refer to the reliability and performance of the technologies involved. Regarding the activities, specific sub-criteria are implemented for the two main pre-set activities in the tool (fish farming and tourism), whereas no predefined sub-criteria are included for additional activities.
The three criteria concerning the possible impacts that a given UMA may have on the MUA are “Environmental impact,” “Risks,” and “Costs.” Each includes several relevant sub-criteria. Specifically, the “Environmental impact” criterion evaluates the marine area required by a given use, the potential presence and type of foundations, the materials employed, the likelihood of debris release into the sea, acoustic and visual impacts, and maintenance requirements (in terms of material durability, transport needs, and associated pollution). The “Risks” criterion considers the probability of structural failure (in relation to modularity, geotechnical aspects, and moorings) and electrical failure (both for power take-off systems in RES and for power supply to the various activities, as well as for energy transfer to shore). It also takes into account accident risks related to human health, the probability of collisions between vessels and devices, and the potential for accidental pollution. The “Costs” criterion includes all expenses associated with installation. In particular, the sub-criteria refer to seabed depth, type of installation (complexity and potential need for moorings), costs of energy production, energy storage or transfer, installation and maintenance (in terms of accessibility and materials), and transport during installation and maintenance phases.
In the tool, the scoring process for each sub-criterion is fully automated. For each UMA, the user simply completes a questionnaire by selecting responses from a drop-down menu and choosing a scoring method, as detailed in Section 3. An example of the logic applied in the scoring according to the different criteria is provided by Zanuttigh et al. [29]. Figure 1 and Section 3 reference this example to illustrate how the proposed tool calculates results for different UMA combinations. Among the various combinations, the five most representative MUAs were selected as references for the subsequent analyses (Table 1). For consistency, the MUA numbering corresponds to that used in Zanuttigh et al. [29].
In two of these (MUA16 and MUA17), various RES technologies, including innovative ones (such as wind and wave energy), were combined with different activities to assess the importance of multi-use and co-location concepts. In contrast, the other three alternatives (MUA1, MUA6, and MUA12) combined only the RES with the lowest environmental impact (solar panels, installed in the analyzed case on a decommissioned offshore platform) and economically productive activities (aquaculture and tourism).
The final outcome is a ranking of the different MUAs, supporting the identification of the most suitable combination of UMA for a given site.

2.2. The Use of the Tool for Decision-Making in Facilitation Processes

This Sub-section explains how the proposed MUA-DST could be applied for decision-making concerning MSP, in the context of facilitation processes.
In the first phase, all participants involved in the inquiry meet in a preliminary session to identify the different UMA they consider most promising for co-location at the selected site. These activities are then combined into all possible MUA configurations, which are subsequently entered into the main MUA-DST spreadsheet.
Next, each respondent independently completes an additional Excel sheet of the MUA-DST, where for each evaluation sub-criterion and each activity, options are selected from a drop-down menu. During this phase, based on their personal expertise or experience, each contributor can also choose a calculation method for each sub-criterion (that is, whether to select the highest score assigned to an activity, increase it according to the number of activities included, or calculate the average score). Based on the selected responses and calculation method, the tool automatically computes the scores and transfers them to the main spreadsheet, where the total score for each criterion and for each MUA is then determined.
In the final phase, all participants reconvene to aggregate their individual results and identify the optimal MUA accordingly. During this stage, different weights can be assigned to the various criteria.
The fully guided nature of the procedure offers two distinct advantages, making it both effective and versatile: on one hand, it simplifies the work of experts involved in the process; on the other, it enables the participation of a wide range of contributors without specific expertise. Consequently, the scale of the meeting can vary, ranging from a smaller, more restricted group to a broader pool of participants. For example, the tool can be used internally within a single organization or company, where discussions and final results can be processed directly. Alternatively, it can be implemented on a larger scale through a web-based survey involving diverse stakeholders from different backgrounds, with results subsequently analyzed using statistical methods. In this latter case, it is advisable to request participants to complete an anonymous questionnaire, allowing cumulative responses to be analyzed according to group background (i.e., scientific, social, environmental, or economic) and type (i.e., policy-makers, consultants, the public, researchers, managers, investors), thereby enabling an assessment of result sensitivity.
In fact, the MUA-DST is designed to be used by anyone, regardless of their level of expertise. In this study, no specific guidance is provided regarding the composition of the group of compilers, which does not necessarily need to be balanced in terms of background, experience, role, age, gender, or number. However, it is clear that the composition of this group is highly relevant to the final outcome, as reported by Zanuttigh et al. [27], where a sensitivity analysis of results was performed based on the weights assigned to various criteria by three different groups of decision-makers. The topic will also be further discussed in Section 4.

3. Description of the Tool’s Operational Steps

In this Section, the MUA-DST implemented in Excel is specifically described. In particular, the compilation process of the Excel spreadsheet is carried out in three sequential phases: (1) the preliminary meeting of the participants, during which the possible UMA are selected and combined into MUAs (Section 3.1); (2) the evaluation of the MUAs by each participant individually through the tool, choosing the calculation method and answering the questionnaire (Section 3.2); (3) the final meeting, where weights can be assigned to the criteria and the final output is calculated (Section 3.3). The steps of the procedure are also shown schematically in Figure 2.

3.1. Preliminary Meeting and Input Parameters

In the first phase, the decision-making group convenes for a preliminary meeting to conduct the pre-screening activity. This involves evaluating the activities that can be effectively carried out in the offshore area, considering the technical limitations of the different UMA and the specific characteristics of the site under analysis. Once all possible UMA have been selected, they must be combined into different MUAs. In the MUA-DST, this task can be performed in the main worksheet (Figure 3). This sheet already includes predefined entries for the three main sources of offshore RE production (solar energy, wind energy, and wave energy) and the two most commonly considered activities for multi-use offshore installations (fish farming and tourism). However, it is also possible to add up to two additional RES and three additional activities of choice, allowing for a total of ten possible UMA, including RE production. For example, it is possible to distinguish between fixed and floating wind turbines, treating them as separate sources within the MUA combinations, or to include tidal energy or other economic and scientific activities (i.e., scientific research and monitoring, green hydrogen production, desalination plants, hub for maritime transport, floating greenhouses, etc.). It is important to note that the predefined entry for tourism activities already includes educational tourism, artificial reef creation, diving and recreational fishing, each of which is assigned specific scores in subsequent phases; however, these activities can still be separated and added as distinct entries if greater emphasis is needed on one over another. The same could be done if different aquaculture species were to be considered separately. Thus, differently from the tools previously available, this MUA-DST makes it possible to examine a wide variety of offshore activities in a very general way, in order to identify the best combination of uses for the exploitation of a marine area.
At this stage, the decision-making group must therefore select from the drop-down menu whether each UMA is present (“Yes”) or absent (“No”) in a given MUA, thus creating different combinations, each with its corresponding number of RES (NRES,MUA) and total UMA including RES (NUMA,MUA). The worksheet provides 25 pre-set combinations, although additional columns can be added to extend this number if necessary. The symbol “-” indicates that a particular UMA is never considered in the given application, while a “No” response signifies that the UMA is absent in a specific MUA but present in others. The “-” option can also be applied to the predefined RES and activities in the tool, if they are not relevant to the specific application or cannot be performed at the site under evaluation.
Once this initial section of the worksheet is completed, the tool automatically calculates the total number of RES (NRES,TOT) and the total number of UMA considered across all MUAs, including RES (NUMA,TOT). If the total is less than or equal to five, the maximum score Smax assigned to each use, and consequently to each MUA, will be 5. If the total exceeds five, the maximum score will be 10, to allow for a greater range of variability between different alternatives (Figure 3). Additionally, the maximum score Smax,incr is computed (3, if Smax is equal to 5, or 6, if Smax is equal 10), which will be used in case of incremental score calculations (Section 3.2).
At the end of the preliminary meeting, each decision-maker will have the precompiled table with the MUAs to be evaluated, identical for all participants, and will then proceed with the individual assignment of scores.
As detailed by Zanuttigh et al. [29] and recalled in Section 2.1, the criteria for evaluating MUAs are divided into two categories: industrial benefits and impacts. Specifically, the criteria related to industrial benefits include “Innovation” and “Exploitation potential”, while the impact-related criteria comprise “Environmental impact”, “Risks”, and “Costs”, each further subdivided into specific sub-criteria (see Section 2.1, Figure 1). For each sub-criterion, the compiler must select responses from a guided multiple-choice menu, as described in Section 3.2.

3.2. Compilation of the Worksheet

In addition to the main worksheet, where MUAs are combined during the first phase and where weights are assigned to the different criteria and total scores are calculated in the final phase, the Excel tool includes two additional sheets. One is locked and serves to retrieve the drop-down menu responses, while the other is intended to be individually completed by each participant in the assessment.
In this sheet, for each sub-criterion, participants select from a drop-down menu the option they consider most appropriate for each UMA. Based on the responses provided, the tool automatically computes a score for each UMA under that specific sub-criterion. Participants can also choose the preferred scoring method from three options: maximum (“Maximum value”), average (“Mean value”), or incremental (“Increments”). Selecting the maximum value emphasizes the most impactful UMA for that sub-criterion. In this case, the tool records in the main worksheet the highest score among the different UMA, ranging from 0 to Smax. Conversely, selecting an incremental calculation method accounts for synergies between different UMA. In this case, the tool records in the main worksheet the maximum score assigned among the different UMA for that sub-criterion, ranging from 0 to Smax,incr, and adds an increment for each additional UMA with a non-zero score. The increments are evenly distributed among the different UMA considered, reaching a maximum of Smax. At present, it is not possible to assign different increments based on the specific UMA involved.
By default, the tool applies the calculation method recommended by the developers for each sub-criterion, based on their expertise. For certain sub-criteria, scores are assigned from 0 to Smax depending on the responses, and the suggested calculation method is “Maximum value”, following the expression below:
S M U A = S m a x , M U A
where SMUA is the final score of the MUA for that sub-criterion, assigned in the main worksheet, and Smax,MUA denotes the highest value, within the range from 0 to Smax, attributed to any of the UMA included in the MUA under evaluation for that specific sub-criterion.
However, it is still possible to select the “Increments” method, in which case the scores are automatically rescaled within the range from 0 to Smax,incr to allow for the addition of increments without ever exceeding Smax, according to the following formula:
S M U A = S m a x , M U A S m a x , i n c r S m a x + S m a x S m a x , i n c r Δ δ
with
Δ = N U M A , T O T 0 1                       if   N U M A , T O T 0 1 > 0 1                                                                             if   N U M A , T O T 0 1 0
and
δ = N U M A , M U A 0 1                       if   N U M A , M U A 0 1 0 0                                                                             if   N U M A , M U A 0 1 < 0
where NUMA,TOT≠0 is the total number of UMA that have a non-zero score for that sub-criterion, while NUMA,MUA≠0 is the number of UMA included in the MUA under consideration with a non-zero score for the same sub-criterion.
Conversely, for other sub-criteria, scores are assigned from 0 to Smax,incr based on the responses, and the suggested calculation method is “Increments”, as defined by the following equation:
S M U A = S m a x , i n c r , M U A + S m a x S m a x , i n c r Δ δ
where Smax,incr,MUA represents the peak score, bounded between 0 and Smax,incr, assigned to the UMA listed in the MUA being assessed with respect to the given sub-criterion, whereas Δ and δ are defined as in Equations (3) and (4).
Nonetheless, it is possible to select the “Maximum value” method, in which case the scores are automatically rescaled within the range from 0 to Smax to report only the maximum value in the main worksheet without adding increments, according to the following formula:
S M U A = S m a x , i n c r , M U A S m a x S m a x , i n c r
Analogous formulas are applied when the “Mean value” method is selected, allowing for the calculation of the average score among the different UMA for a given sub-criterion.
In all cases, UMA that are either absent from the MUP or present but assigned a score of zero (because the sub-criterion is not applicable to that UMA, or the UMA has no impact for that sub-criterion), are excluded from the incremental calculation. For sub-criteria involving only RE production (such as “Size of the energy farm”, “Failure of the energy transmission to shore”, and “Local energy storage/use”), only RES are considered for both score calculation and increments, thus NUMA,TOT≠0 and NUMA,MUP≠0 are replaced with NRES,TOT≠0 and NRES,MUP≠0, maintaining the same meaning of the subscripts.
To provide some practical examples, under the “Innovation” criterion, the sub-criterion “Creation of new jobs”, which reflects the potential employment benefits, can be evaluated through a drop-down menu offering three options: “Low,” “Medium,” and “High,” corresponding, respectively, to scores ranging from 1 to Sincr,max. Additionally, a “None” option is available, corresponding to a score of 0, in cases where there is no potential for job creation (Figure 4). The default calculation method is “Increments,” which considers that the integration of multiple uses may require broader interdisciplinary expertise and a larger workforce. However, users can always select a different calculation method, choosing either the maximum or the mean value.
Conversely, under the “Environmental impact” criterion, the sub-criterion “Maintenance—Transportation”, which represents the environmental impact associated with the frequency of transport operations for maintenance purposes, can be evaluated through a drop-down menu offering five options, from “Very low” to “Very high,” corresponding, respectively, to scores ranging from 1 to Smax. A “No impact” option, corresponding to a score of 0, is also available when no transportation-related environmental impact is expected (Figure 5). The default calculation method in this case is “Maximum value,” since maintenance operations for different activities can be performed simultaneously, thus considering only the highest score among the activities requiring the most frequent transport. Nevertheless, users may also select an alternative method, applying either a mean value or the incremental approach when multiple uses are present.
Table 2 presents, as an example, the scores obtained for the five different MUAs in Table 1, with reference to the two illustrative sub-criteria, and compares the results obtained by selecting either the “Maximum value” or “Increments” calculation method. The comparison is based on the individual UMA scores reported in Figure 4 and Figure 5 (taken from Zanuttigh et al. [29]). These results for each MUA are subsequently aggregated to calculate the overall scores for the corresponding sub-criteria and criteria, as further detailed in Section 3.3. As shown in Table 2, assuming identical score assignments for all other sub-criteria, changing the calculation method for a single sub-criterion—from an incremental to a maximum-based approach—leads to higher individual scores that were previously below the maximum. Consequently, the overall MUA score increases if the sub-criterion represents a benefit, or decreases if it represents an impact. An exception is MUA16, whose score remains unchanged, as all UMA are included, thus reaching the maximum score under both methods. The difference is more pronounced for MUA1 and MUA6, where only two UMA are present. Clearly, choosing the “Maximum value” instead of the “Increments” method results in more uniform scores across the different MUAs for that sub-criterion, thereby reducing the relative importance of the multi-use concept. This effect is also reflected in the total MUA scores when the maximum-based approach is consistently applied to all sub-criteria (see the sensitivity analysis in Section 4).
As an example, for the sub-criterion “Creation of new jobs,” the scores for MUP16 and MUP17 (which differ only by the presence or absence of wave energy production, while all other UMA remain the same) are calculated as shown in Table 3, using the “Increments” and “Maximum value” methods according to Equations (5) and (6). Under the two calculation methods, the presence of an additional activity provides an advantage in the incremental case—highlighting the relevance of the multi-use concept—whereas no difference arises when only the maximum score among the existing activities is considered.
Therefore, the suggested calculation settings can be left as default, when the tool is completed by a decision-maker who is not an expert in a specific topic, or can be appropriately modified, when the user has specialized expertise. The only current limitation lies in the inability to select customized increments for different UMA. This feature could be valuable for certain criteria, such as space occupation, where depending on the MUA layout (e.g., with wave energy devices and aquaculture cages placed between wind turbines; with only wave energy devices located between the turbines and the cages positioned separately; or with all devices installed independently), it may be necessary to assign larger, smaller, or even no increments for each UMA. This aspect could thus be considered for future developments of the MUA-DST.
Finally, for some sub-criteria, it is not necessary to select responses from the multiple-choice menu, as the scores are automatically calculated in the main worksheet based on other parameters. For instance, in the sub-criterion “Reduction of CO2”, the score is determined by the number of RES included in the MUA, ranging from 0 to Smax, while for the sub-criterion “Synergy with other uses”, the score depends on the number of UMA within the MUA (from 0, if there is a single use, to Smax, if all RES and activities are included). The score for “Collisions” is directly linked to that of “Use of marine space”; the cost score for “Materials” is tied to the environmental impact of “Material durability”; and the transportation cost for “Operation” is connected to the “Maintenance requirements”. Lastly, the costs associated with the installation depth (selected via the drop-down menu) are identical for all MUAs, and the corresponding score remains unchanged.

3.3. Final Meeting and Output Results

At the final stage of the decision-making process, participants reconvene to integrate their individual assessments and determine the optimal MUA.
The selections made from the guided menu in the previous phase generate a score for each sub-criterion and for each MUA, depending on the combination of UMA. In some cases, the score is derived from the average of multiple responses related to the same sub-criterion (green scores in Figure 1). The overall score for each criterion is then obtained by aggregating the results of the corresponding sub-criteria (red scores in Figure 1). Specifically, the total score for each criterion is calculated as the average of the scores of its related sub-criteria, except for the “Exploitation potential” criterion, for which an incremental calculation method is applied. For this criterion, separate scores are assigned for each RES and for each activity, and these scores are aggregated incrementally to highlight the value of the simultaneous presence of different UMA. If desired, users can easily modify the method used to compute the criterion scores from the sub-criteria—for instance, by taking the maximum instead of the average.
Once the total score for each criterion is obtained, different weights can be assigned to the benefit- and impact-related criteria (see Figure 1). In the main worksheet, two weights can be entered for the criteria “Innovation” and “Exploitation potential,” representing the “Industrial benefits,” such that their total equals 1. Similarly, three weights can be assigned to the “Environmental impact,” “Risks,” and “Costs” criteria, representing the “Impacts,” again summing to 1.
Finally, by summing the weighted criterion scores, the tool automatically computes a total score for “Industrial benefits” and another for “Impacts.” The overall score for each MUA is then obtained by subtracting the latter from the former, allowing identification of the MUA with the highest total score as the optimal one. Each decision-maker can thus determine the best MUA according to their individual scoring and the common criteria applied to all participants for calculating the final results.
The individual outcomes can subsequently be aggregated—either directly by the experts, in the case of an internal assessment within a single institution or a small-scale evaluation, or via a web-based platform for large-scale analyses. In the latter case, it is recommended to also consider the background and expertise of each decision-maker, enabling a sensitivity analysis of the results, as discussed in Section 2.2.

4. Sensitivity Analysis of the Results

The proposed tool, when used with settings different from those recommended, inevitably exhibits some sensitivity in its results. This sensitivity is influenced by two main factors: the calculation methods selected for the sub-criteria by each individual compiler (Section 4.1) and the weights assigned to the criteria by the evaluation team (Section 4.2). This Section aims to provide an indication of the maximum deviations that may occur in the results—and consequently in the ranking of the MUA—due to modifications of these default settings.
The initial scores assigned to the various UMA for each sub-criterion are derived from the application example of the tool presented by Zanuttigh et al. [29], and were defined by an expert evaluator with specific domain knowledge. As described in Section 2.1 (Table 1), 5 representative MUAs out of the 17 alternatives proposed by Zanuttigh et al. [29] were considered, using the same numbering as in the previous work: solar energy and fish farming (MUA1); solar energy and tourism (MUA6); solar energy, fish farming, and tourism (MUA12); solar energy, wind energy, wave energy, fish farming, and tourism (MUA16); solar energy, wind energy, fish farming, and tourism (MUA17).

4.1. Criteria Scoring Methods

To illustrate the effects on the final score—and consequently on the selection of the best MUA—resulting from changes in the calculation method for individual sub-criteria, a sensitivity analysis was performed on the results generated by the tool under different scoring schemes.
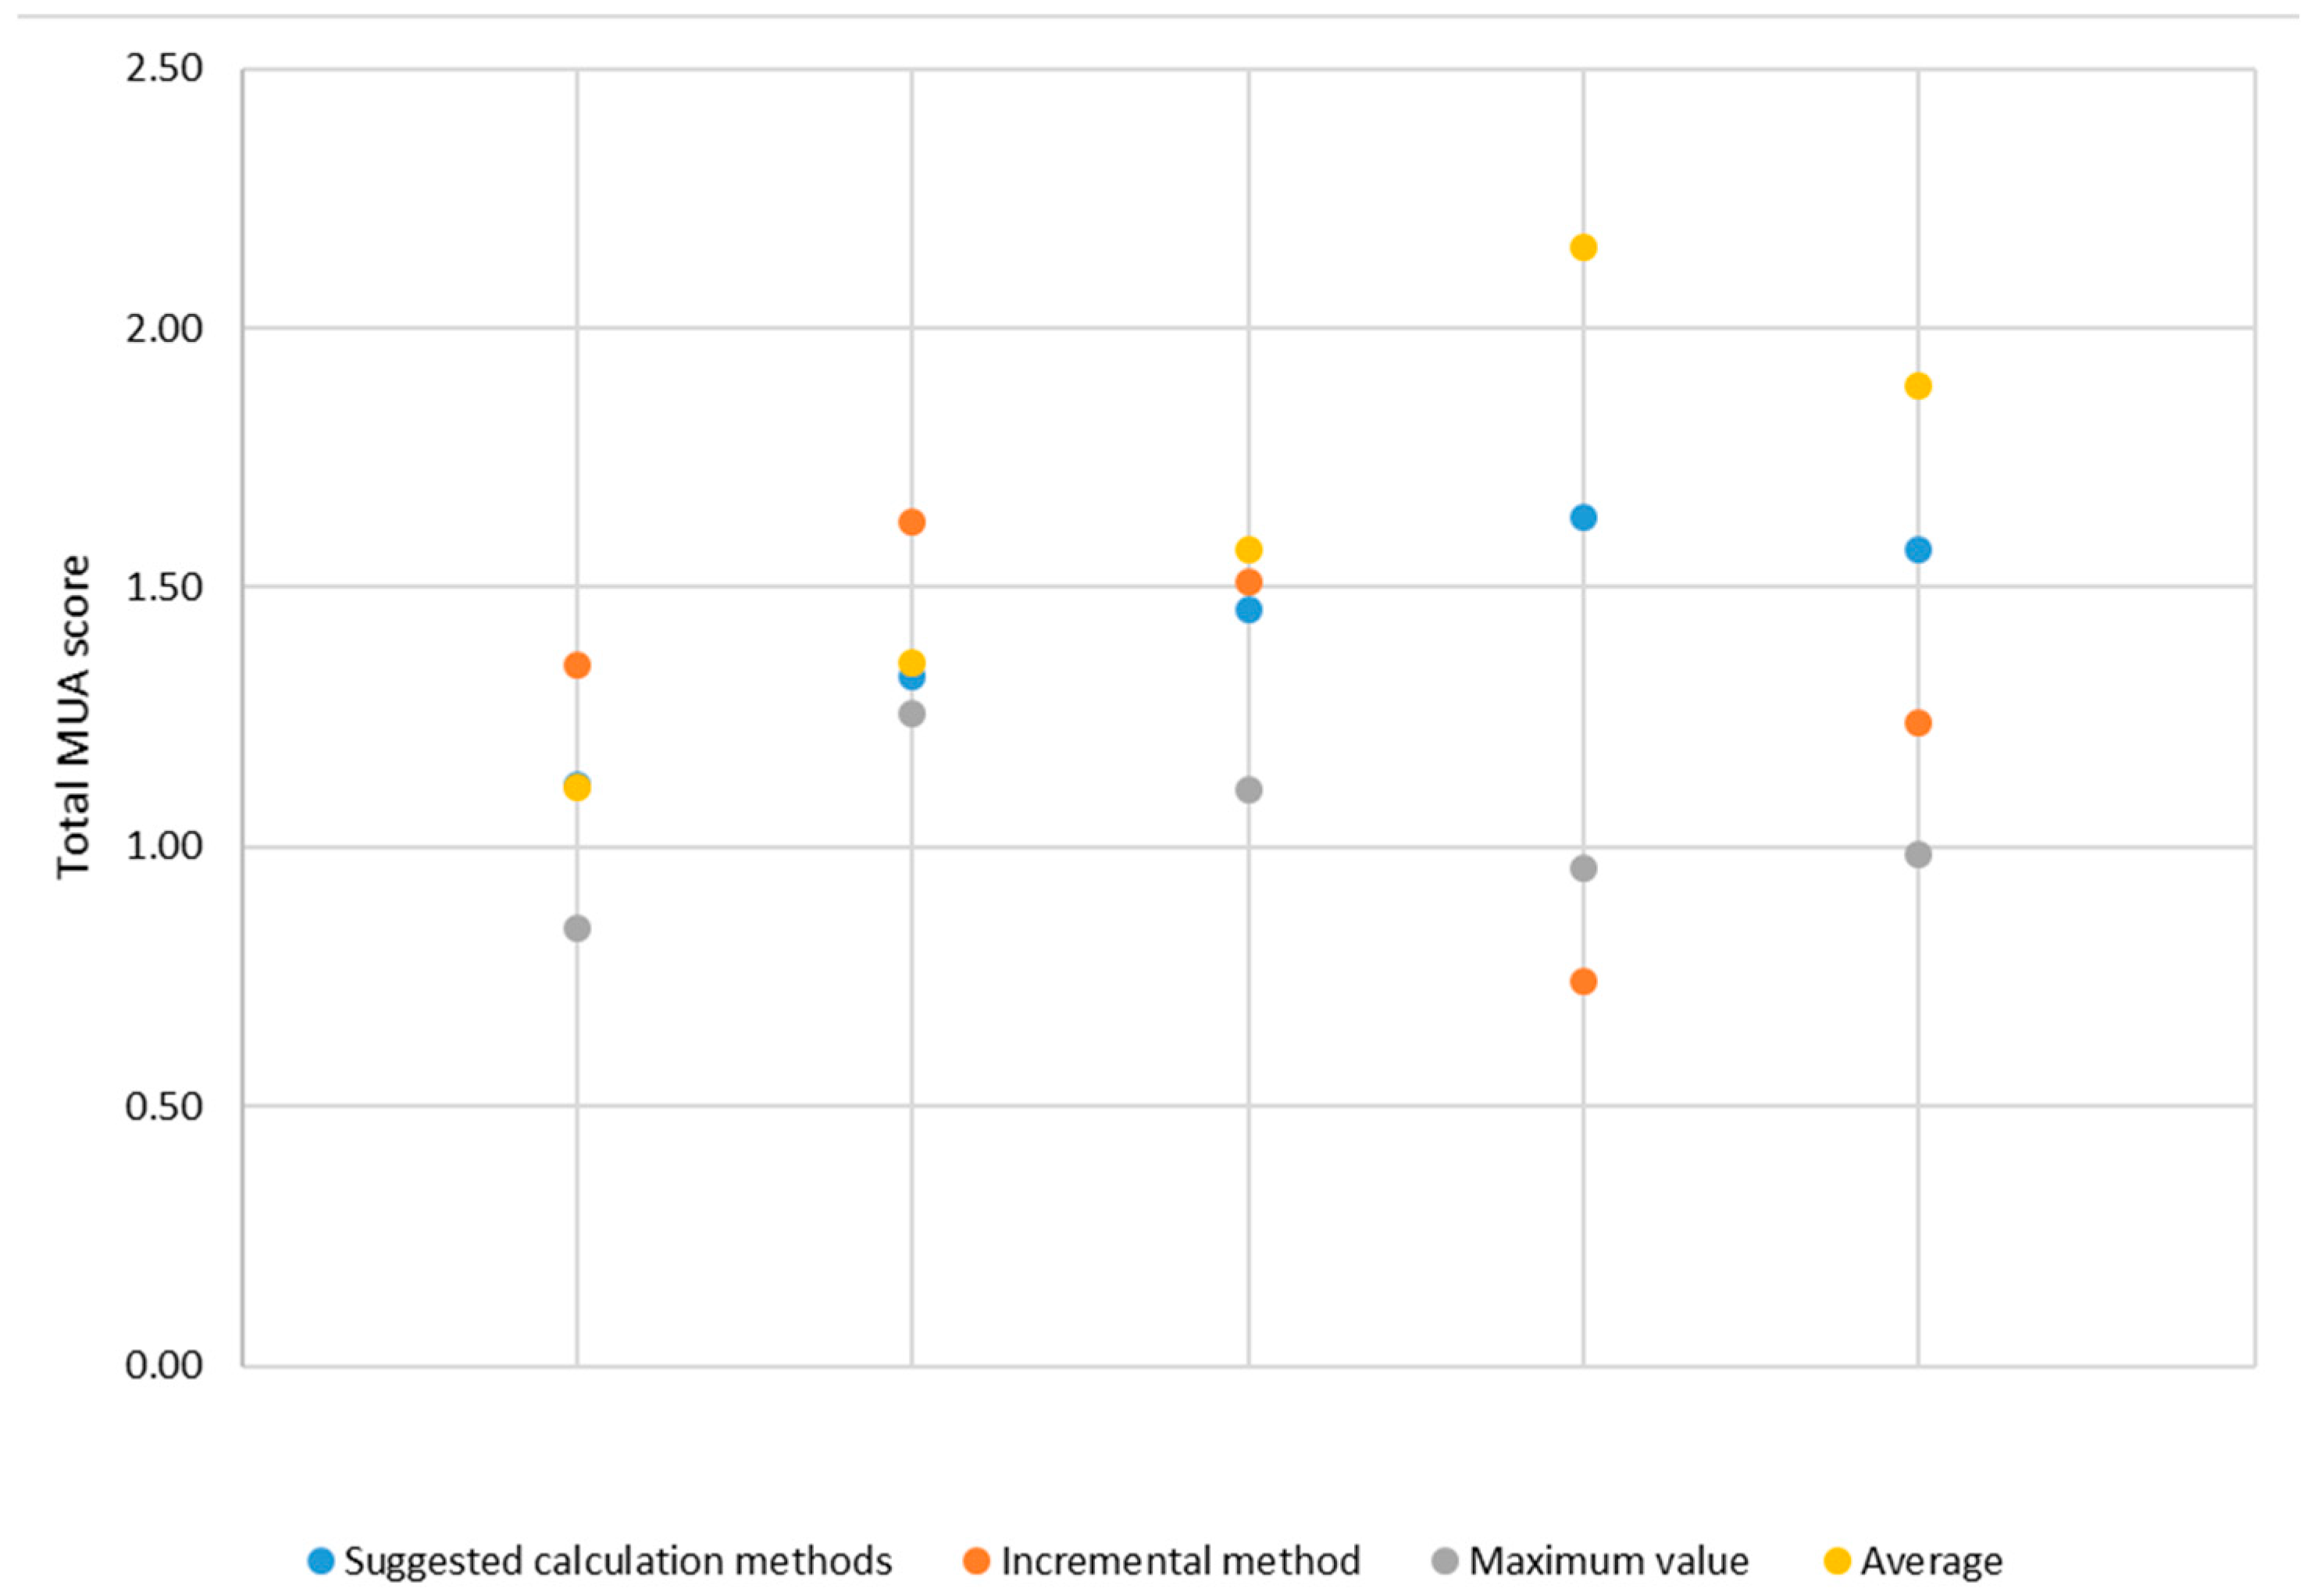
While keeping the individual UMA scores unchanged, all sub-criteria score calculation methods were modified by replacing the suggested settings, implemented in the tool by default, with one of three uniform approaches: always taking the average, always taking the maximum, or always applying the incremental method (Figure 6).
As shown in Figure 6, when sub-criteria scores are calculated using the tool’s suggested methods, the outcome is an overall balanced ranking that highlights alternatives combining multiple activities—therefore aligning with the multi-use MSP approach. A comparable, and even more favorable, effect toward multi-use alternatives is observed when sub-criteria scores are consistently averaged across the different activities. Conversely, applying either the maximum or the incremental method to all sub-criteria tends to give greater weight to impacts; as a result, the final ranking shifts toward alternatives featuring fewer and less impactful activities.
Taking the suggested calculation methods as the reference, the scores for each MUA show percentage differences ranging from −55% to +32%, with a sample standard deviation between 0.16 and 0.65, indicating low variability and limited dispersion in the results.
These deviations provide insight into the potential variability of results when the tool is used by compilers lacking specific subject-matter expertise. It is important to emphasize that these outcomes represent the evaluation of a single compiler and must be interpreted together with the assessments of the remaining evaluation team. Therefore, beyond individual preferences, it is essential to account for the diverse knowledge backgrounds of the evaluators.

4.2. Criteria Weights

As is evident, the composition of the evaluation team has a significant influence on the final results produced by the tool. This influence arises not only from the individual ways in which evaluators assign scores but also from collective, majority-based decisions regarding the weights attributed to the different criteria, which are defined before calculating the final outcome.
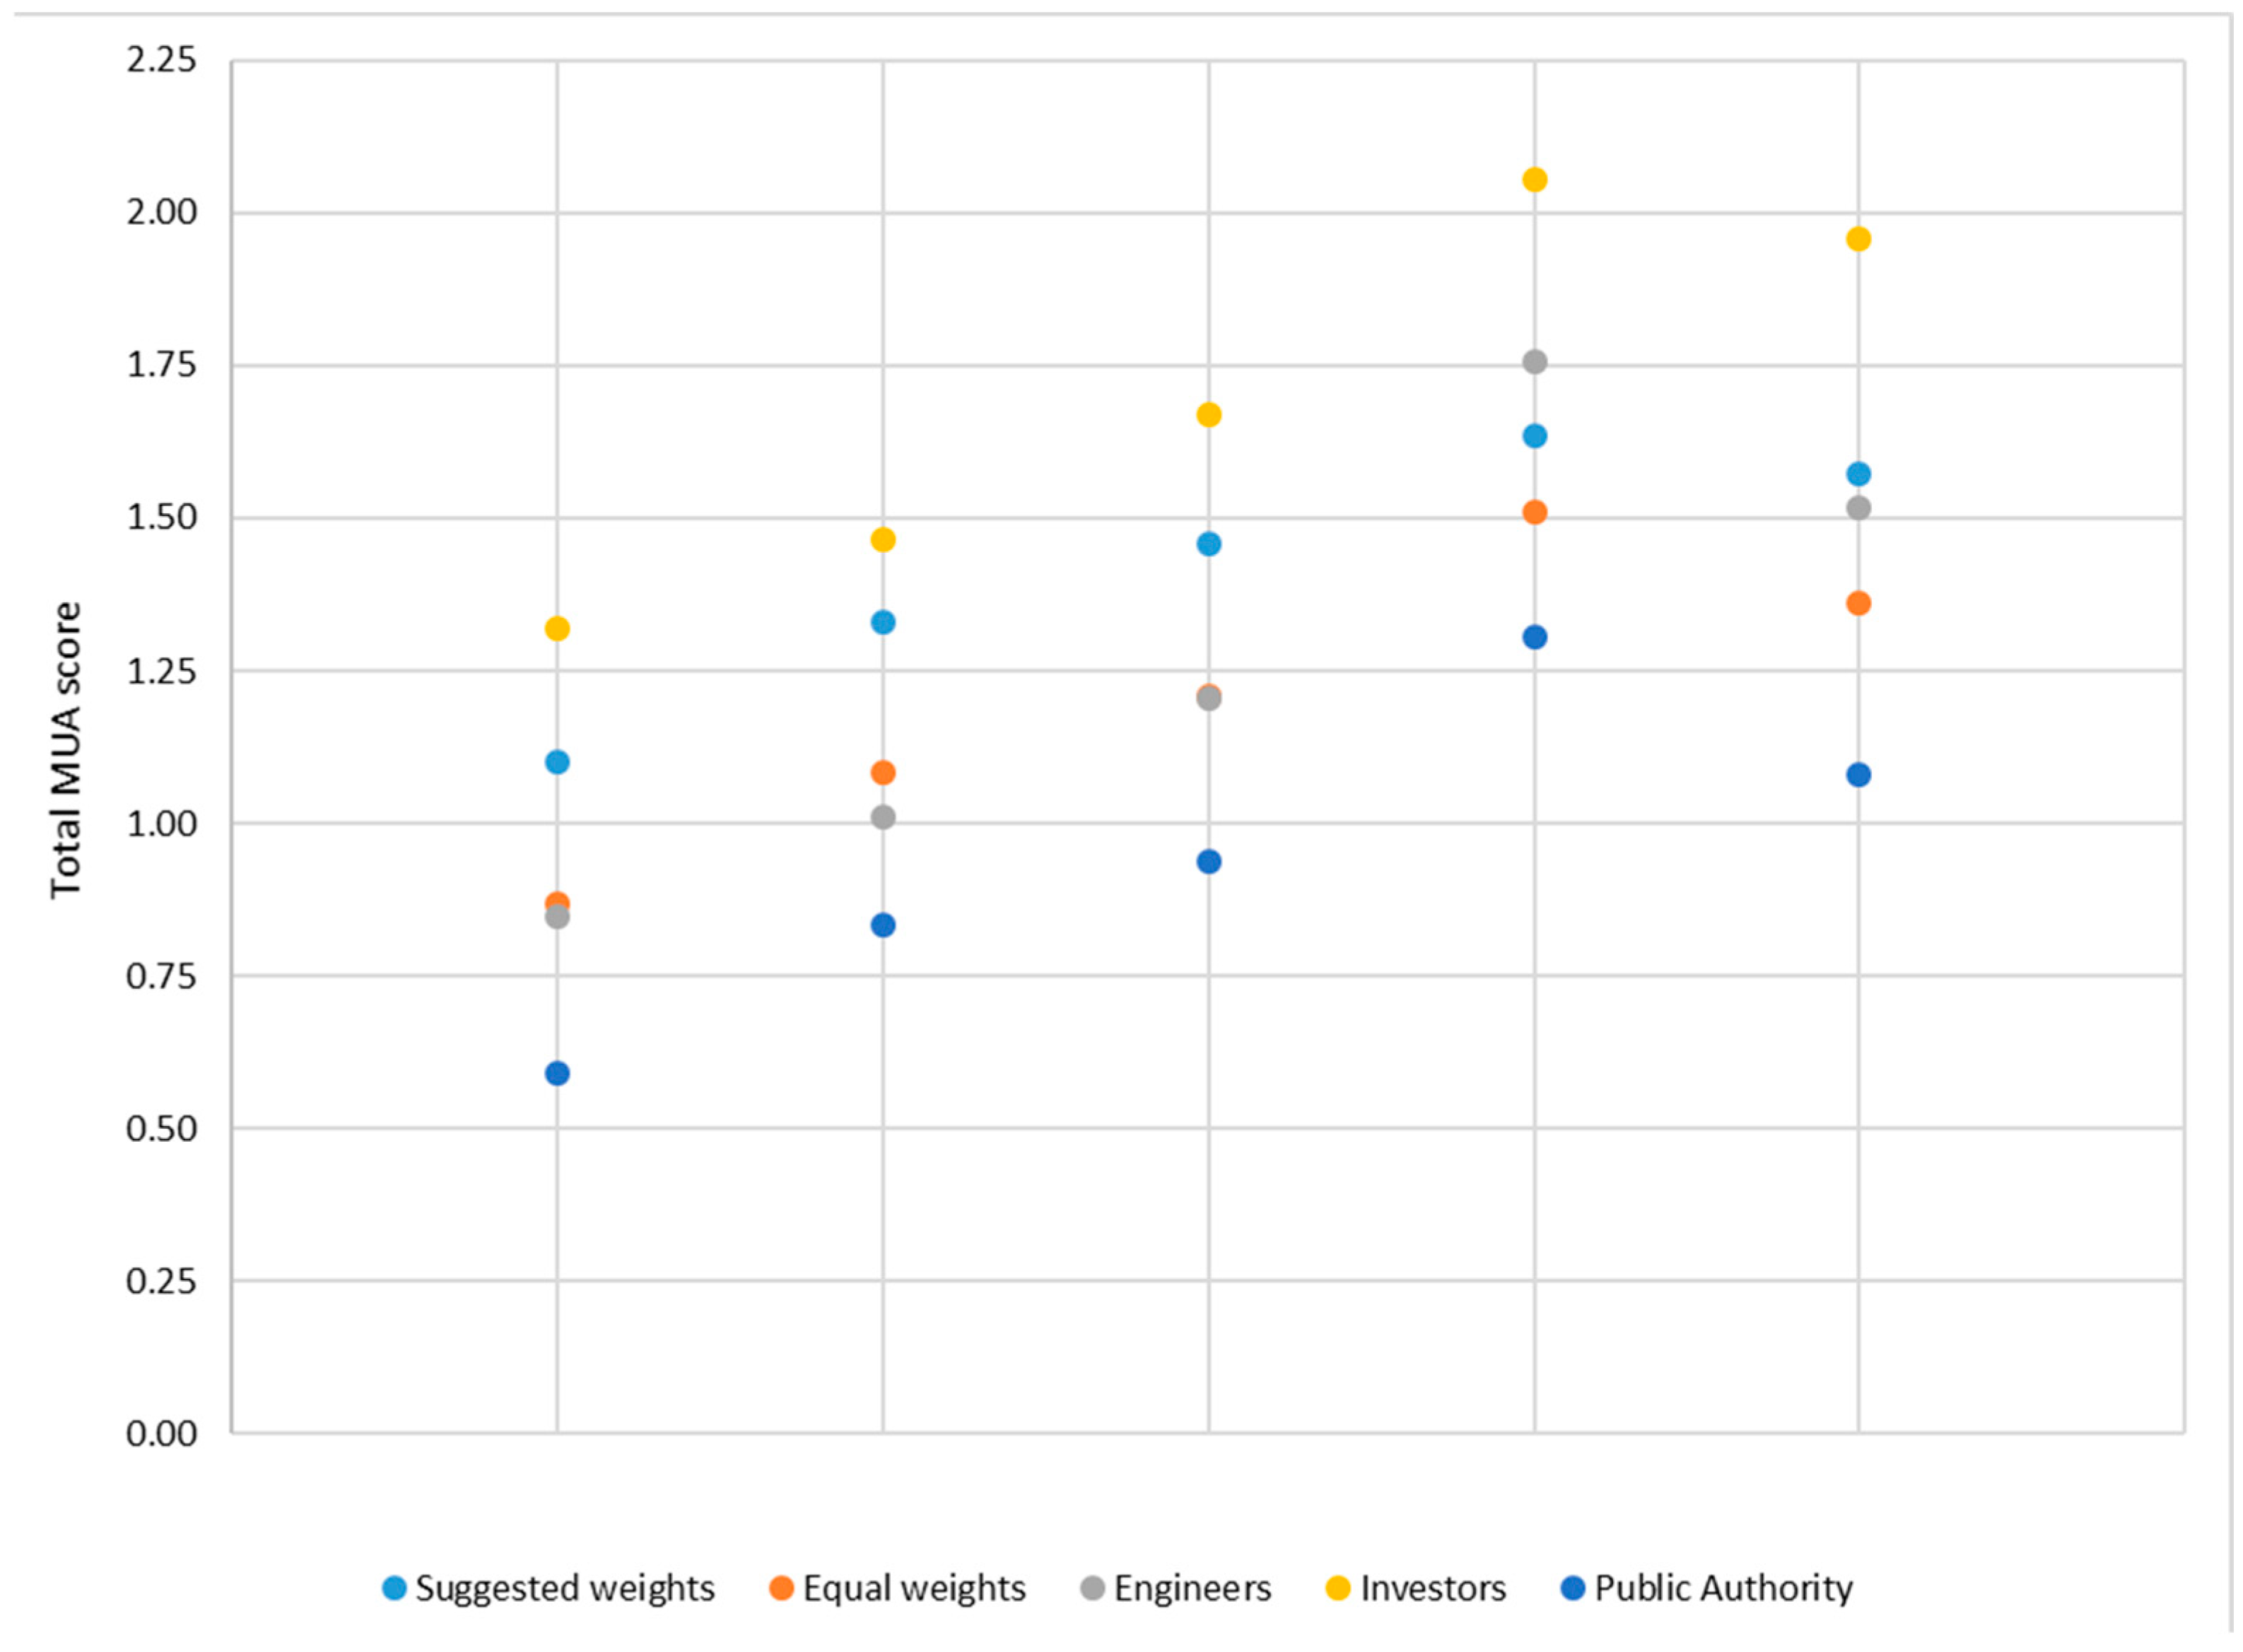
The following example illustrates the possible deviations in the results depending on the background of the evaluation team members. Specifically, the outcomes are compared across five different scenarios: (i) weights suggested by the tool developers (almost evenly distributed, with a slight predominance of “Exploitation potential” among the benefits and “Costs” among the impacts); (ii) equal weighting assigned to all criteria (equivalent to using no weights); (iii) a team composed predominantly of engineers; (iv) a team composed predominantly of investors; and (v) a team composed predominantly of politicians and managers.
For engineers, investors, and public authorities, the criteria expected to be prioritized from their respective professional perspectives were identified. The assigned weights are listed in Table 4, while the corresponding final results are shown in Figure 7.
It can be observed that the standard deviation of the final scores for each MUA—resulting from modifications to the criteria weights by the evaluation team compared with the proposed ones—ranges between 0.25 and 0.32, with maximum percentage differences from −46% to +26%. Therefore, the dispersion of the results is comparable in magnitude to that obtained when individual compilers modify the calculation methods for the sub-criteria. However, changes in the weights do not appear to affect the overall ranking of the MUAs.

5. Discussion

The proposed MUA-DST has numerous advantages, improvements, and additional features compared to the tools previously available in the literature, in particular:
  • It is fully general: all the RES and activities traditionally considered for the development of offshore MUA are already implemented in the tool with a corresponding set of specific criteria. However, it also allows users to add other RES and additional activities as desired, thus enabling a wide variety of combinations to be compared.
  • It is a guided, automatic, and user-friendly tool implemented in Microsoft Excel—a standard software available to most users and widely familiar. It is sufficient to select the desired options from the drop-down menus by following the provided instructions; therefore, no special knowledge or technical expertise is required.
  • It is highly customizable at different levels, particularly in the method used for calculating individual scores and in the selection of the weights assigned to the different criteria.
  • It aims to simultaneously consider, as comprehensively as possible, the economic, social, and environmental benefits and impacts traditionally assessed in the literature, without influencing the user’s choices and ensuring the objectivity of the final result.
Given the preceding discussion, the presented MUA-DST facilitates large-scale participation by automating calculations according to predefined settings, while also allowing experts to customize the computation process based on their specific knowledge and preferences.
However, a few limitations remain that could be improved:
  • When used by a group of experts opting for an incremental scoring method, the increments are evenly distributed, based on the number of UMA included. It is currently not possible to assign a higher or lower weight to the increment associated with a specific UMA according to expert judgment.
  • When applied on a large scale for broad consultations, the Excel sheet does not directly include a built-in questionnaire to account for the participants’ backgrounds. Thus, sensitivity analysis concerning individual backgrounds must be conducted separately after data collection.
From the preliminary sensitivity analysis conducted, it was observed that the maximum dispersion of the results remains limited. While changes in the scoring methods for the criteria may affect the ranking of the MUAs, the final weighting choices made by the evaluation team primarily influence the absolute values of the MUAs’ scores rather than their relative order. Consequently, the personal sensitivity and knowledge background of individual evaluators—who define both the scores and the calculation methods—must always be taken into account.

6. Conclusions

This paper presented a new DST designed to assist in selecting the most suitable combination of activities within MUA, with a focus on identifying synergies and conflicts between co-located uses in the context of MSP. The tool is based on a well-established MCM that integrates a comprehensive framework of potential benefits and impacts of offshore activities from environmental, economic, and social perspectives.
The MUA-DST is implemented in a fully automated Excel sheet to facilitate the evaluation of different MUAs, supported by multiple-choice menus and pre-programmed calculation methods. Users can freely select their preferred methods for assigning scores and weighting criteria, ensuring both generality and objectivity in the final outcome. The tool is designed for use by both public and private stakeholders and is accessible to users with varying levels of expertise, thanks to its intuitive, step-by-step guided interface.
The tool supports the assessment of multiple UMA for potential co-location. The main UMA typically considered in the context of MSP (RE, aquaculture, and tourism) are already implemented in the tool. Moreover, the system allows for the addition of custom UMA and their combination in any configuration.
Overall, the presented tool offers a highly powerful and innovative solution for MSP-related assessments. Its greatest advantage lies in its versatility: developed by engineers with specific expertise in MSP, it is designed to support experts by integrating all relevant aspects of the problem into a single spreadsheet. At the same time, it provides significant flexibility in selecting calculation methods and assigning weights to different criteria. Recognizing the importance of involving not only technical experts but also policy-makers, managers, environmentalists, and sociologists in decision-making processes, the guided and simplified menu structure also promotes broader participation. This feature enables a wider range of stakeholders to contribute by completing the spreadsheet while maintaining the suggested default settings. In such cases, however, it is advisable to perform a sensitivity analysis considering the participants’ individual backgrounds.
As a result, the MUA-DST demonstrates broad applicability and general validity: it can be used by any group of participants regardless of experience level, any type of UMA can be included and combined in any configuration, and it can be applied to any geographic area or case study.
It is therefore an automatic, innovative, and versatile tool—easily usable even by non-experts—made available for the first time to facilitate decision-making in the context of MSP.

Author Contributions

Conceptualization, E.D. and B.Z.; Methodology, E.D. and B.Z.; Software, E.D.; Validation, E.D.; Formal analysis, E.D.; Investigation, E.D.; Resources, E.D.; Data curation, E.D.; Writing—original draft, E.D.; Writing—review and editing, E.D. and B.Z.; Visualization, E.D.; Supervision, B.Z.; Project administration, I.D. and B.Z.; Funding acquisition, I.D. and B.Z. All authors have read and agreed to the published version of the manuscript.

Funding

This research received no external funding.

Data Availability Statement

The original contributions presented in this study are included in the article. Further inquiries can be directed to the corresponding author.

Conflicts of Interest

The authors declare no conflicts of interest.

Abbreviations

CIACumulative Impact Assessment
DSTDecision Support Tool
MCMMulti-Criteria Methodology
MSPMarine Spatial Planning
MUAMulti-Use Area
MUA-DSTDecision Support Tool for Multi-Use Areas
RERenewable Energy
RESRenewable Energy Sources
UMAUses of the Marine Area

References

  1. Ehler, C.; Douvere, F. Marine Spatial Planning: A Step-By-Step Approach Toward Ecosystem-Based Management. In Intergovernmental Oceanographic Commission and Man and the Biosphere Programme; IOC Manual and Guides No. 53; ICAM Dossier No. 6 Paris; UNESCO, 2009. Available online: https://unesdoc.unesco.org/ark:/48223/pf0000186559 (accessed on 1 November 2025).
  2. European Union. Directive 2014/89/EU “Establishing a Framework for Maritime Spatial Planning”. In Offshore Journal of the European Union; European Union: Brussels, Belgium, 2014; L257/135; Available online: https://eur-lex.europa.eu/legal-content/EN/TXT/?uri=celex%3A32014L0089 (accessed on 1 April 2025).
  3. European Union. Annex III Table 2b in Directive 2017/845/EU, Amending Directive 2008/56/EU “Establishing a Framework for Community Action in the Field of Marine Environmental Policy (Marine Strategy Framework Directive)”. In Offshore Journal of the European Union; European Union: Brussels, Belgium, 2017; L125/27; Available online: https://eur-lex.europa.eu/legal-content/EN/TXT/?uri=CELEX:02008L0056-20170607 (accessed on 1 April 2025).
  4. CORDIS EU. H2OCEAN Project (2012–2014)—Development of a Wind-Wave Power Open-Sea Platform Equipped for Hydrogen Generation with Support for Multiple Users of Energy. 2025. Available online: https://cordis.europa.eu/project/id/288145/reporting (accessed on 1 April 2025).
  5. CORDIS EU. TROPOS Project (2012–2015)—Modular Multi-Use Deep Water Offshore Platform Harnessing and Servicing Mediterranean, Subtropical and Tropical Marine and Maritime Resources. 2025. Available online: https://cordis.europa.eu/project/id/288192/reporting (accessed on 1 April 2025).
  6. CORDIS EU. MERMAID Project (2012–2015)—Innovative Multi-Purpose Offshore Platforms: Planning, Design & Operation. 2025. Available online: https://cordis.europa.eu/project/id/288710/reporting (accessed on 1 April 2025).
  7. SPACE@SEA. Space at Sea Project. 2017. Available online: https://spaceatsea-project.eu/ (accessed on 1 May 2025).
  8. The Blue Growth Farm. The Blue Growth Farm Project—Empowering Offshore Aquaculture. 2023. Available online: https://thebluegrowthfarm.eu/ (accessed on 1 May 2025).
  9. CORDIS EU. MARIBE Project (2015–2017)—Marine Investment for the Blue Economy. 2025. Available online: https://cordis.europa.eu/project/id/652629 (accessed on 1 May 2025).
  10. MUSES. MUSES Project—Multi-Use in European Seas. 2025. Available online: https://muses-project.com/ (accessed on 1 May 2025).
  11. Schupp, M.F.; Bocci, M.; Depellegrin, D.; Kafas, A.; Kyriazi, Z.; Lukic, I.; Schultz-Zehden, A.; Krause, G.; Onyango, V.; Buck, B. Toward a Common Understanding of Ocean Multi-Use. Front. Mar. Sci. 2019, 6, 165. [Google Scholar] [CrossRef]
  12. BLUEGent. Edulis Project—Offshore Mussel Culture in Wind Farms. 2025. Available online: https://www.aqua.ugent.be/edulis (accessed on 1 April 2025).
  13. OLAMUR. OLAMUR Project—Offshore Low-Trophic Aquaculture in Multi-Use Scenario Realisation in North and Baltic Seas. 2025. Available online: https://olamur.eu/ (accessed on 1 May 2025).
  14. ULTFARMS. ULTFARMS Project—Circular Low Trophic Offshore Aquaculture in Wind Farms and Restoration of Marine Space. 2025. Available online: https://ultfarms.eu/ (accessed on 1 May 2025).
  15. UNITED. UNITED Project—Multi-Use Offshore Platforms DemoNstrators for BoostIng Cost-EffecTive and Eco-Friendly ProDuction in Sustainable Marine Activities. 2025. Available online: https://www.h2020united.eu/ (accessed on 1 May 2025).
  16. MUSICA. MUSICA Project—Multiple Use of Space for Island Clean Autonomy. 2020. Available online: https://musica-project.eu/ (accessed on 1 May 2025).
  17. Hammar, L.; Molander, S.; Palsson, J.; Crona, J.S.; Carneiro, G.; Johansson, T.; Hume, D.; Kagesten, G.; Mattson, D.; Tornqvist, O.; et al. Cumulative impact assessment for ecosystem-based marine spatial planning. Sci. Total Environ. 2020, 734, 139024. [Google Scholar] [CrossRef] [PubMed]
  18. Hansen, H.S. Cumulative Impact of Societal Activities on Marine Ecosystems and Their Services. In Computational Science and Its Applications—ICCSA 2019; ICCSA 2019. Lecture Notes in Computer Science; Misra, S., Gervasi, O., Murgante, B., Stankova, E., Korkhov, V., Torre, C., Rocha, A.M.A.C., Taniar, D., Apduhan, B.O., Tarantino, E., Eds.; Springer: Cham, Switzerland, 2019; Volume 11621. [Google Scholar] [CrossRef]
  19. Menegon, S.; Depellegrin, D.; Farella, G.; Sarretta, A.; Venier, C.; Barbanti, A. Addressing cumulative effects, maritime conflicts and ecosystem services threats through MSP-oriented geospatial webtools. Ocean Coast. Manag. 2018, 163, 417–436. [Google Scholar] [CrossRef]
  20. Stock, A. Open source software for mapping human impacts on marine ecosystems with an additive model. J. Open Res. Softw. 2016, 4, 21. [Google Scholar] [CrossRef]
  21. Halpern, B.S.; Walbridge, S.; Selkoe, K.A.; Kappel, C.V.; Micheli, F.; D’Agrosa, C.; Bruno, J.F.; Casey, K.S.; Ebert, C.; Fox, H.E.; et al. A global map of human impact on marine ecosystems. Science 2008, 319, 948–952. [Google Scholar] [CrossRef] [PubMed]
  22. Bonnevie, I.M.; Hansen, H.S.; Schroder, L. SEANERGY—A spatial tool to facilitate the increase of synergies and to minimise conflicts between human uses at sea. Environ. Model. Softw. 2020, 132, 104808. [Google Scholar] [CrossRef]
  23. Bonnevie, I.M.; Hansen, H.S.; Schroder, L. Assessing use-use interactions at sea: A theoretical framework for spatial decision support tools facilitating co-location in maritime spatial planning. Mar. Pol. 2019, 106, 103533. [Google Scholar] [CrossRef]
  24. European MSP Platform. ADRIPLAN Conflict Score Tool. 2025. Available online: https://msp-platform.eu/practices/adriplan-conflict-score-tool (accessed on 1 April 2025).
  25. Watts, M.E.; Ball, I.R.; Stewart, R.S.; Klein, C.J.; Wilson, K.; Steinback, C.; Lourival, R.; Kircher, L.; Possingham, H.P. Marxan with zones: Software for optimal conservation-based land and sea-use zoning. Environ. Model. Softw. 2009, 24, 1513–1521. [Google Scholar] [CrossRef]
  26. Kyriazi, Z.; Lejano, R.; Maes, F.; Degraer, S. A cooperative game-theoretic framework for negotiating marine spatial allocation agreements among heterogeneous players. J. Environ. Manag. 2017, 187, 444–455. [Google Scholar] [CrossRef] [PubMed]
  27. Zanuttigh, B.; Angelelli, E.; Kortenhaus, A.; Koca, K.; Krontira, Y.; Koundouri, P. Methodology for multi-criteria design of multi-use offshore platforms for marine renewable energy harvesting. Renew. Energy 2016, 85, 1271–1289. [Google Scholar] [CrossRef]
  28. Zanuttigh, B.; Palma, G.; Brizzi, G.; Bellotti, G.; Romano, A.; Suffredini, R. Design of a multi-use marine area off-shore the Mediterranean Sea. Ocean Eng. 2021, 221, 108515. [Google Scholar] [CrossRef]
  29. Zanuttigh, B.; Dallavalle, E.; Zagonari, F. A novel framework for sustainable decision-making on reusing Oil & Gas offshore platforms with application to the Adriatic Sea. Renew. Sustain. Energy Rev. 2025, 211, 115252. [Google Scholar] [CrossRef]
  30. Stuiver, M.; Soma, K.; Koundouri, P.; Van den Burg, S.; Gerritsen, A.; Harkamp, T.; Dalsgaard, N.; Zagonari, F.; Guanche, R.; Schouten, J.J.; et al. The Governance of Multi-Use Platforms at Sea for Energy Production and Aquaculture: Challenges for Policy Makers in European Seas. Sustainability 2016, 8, 333. [Google Scholar] [CrossRef]
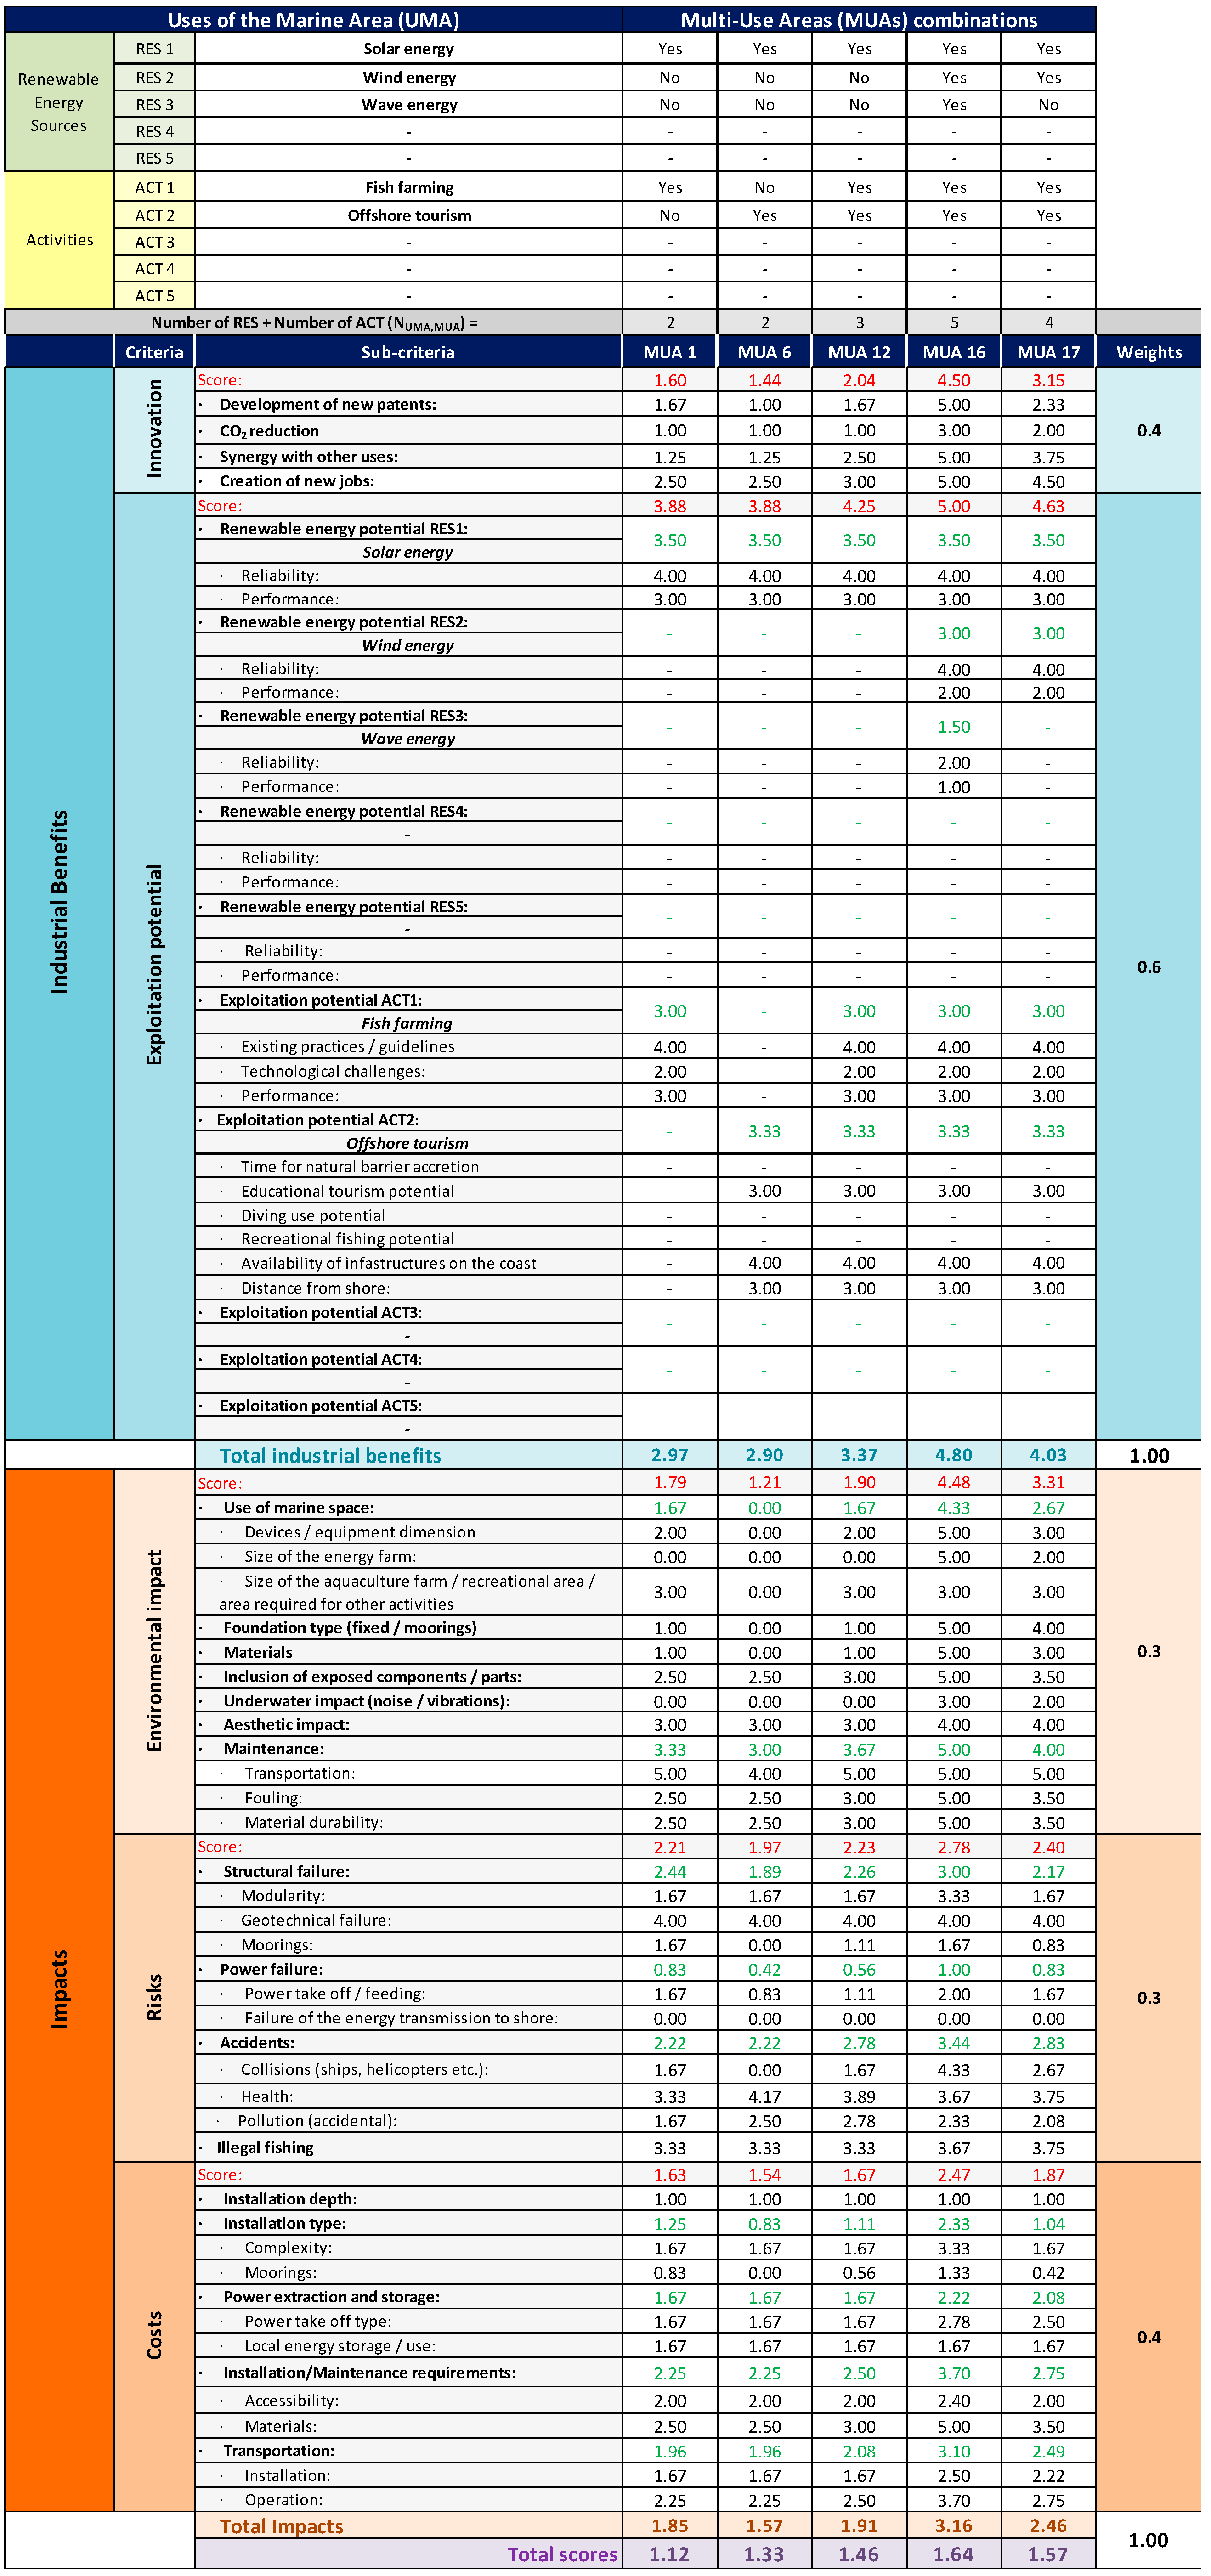
Figure 1. The main worksheet of the tool, showing all the criteria and sub-criteria considered and the scores obtained for five representative MUAs (Table 1).
Sustainability 17 10182 g001
Figure 2. Schematic diagram of the procedure workflow.
Sustainability 17 10182 g002
Figure 3. Detail of the MUA-DST main menu for the combination of different UMA in MUAs (Table 1) and calculation of the total number of RES and activities and of the maximum scoring range.
Sustainability 17 10182 g003
Figure 4. The drop-down menu for the sub-criteria “Creation of new jobs”, with a scoring example and the suggestion of the incremental calculation method.
Sustainability 17 10182 g004
Figure 5. The drop-down menu for the sub-criteria “Maintenance—Transportation”, with a scoring example and the suggestion of the calculation method based on the maximum value.
Sustainability 17 10182 g005
Figure 6. Effect on the final score due to the change in the calculation method for individual sub-criteria.
Sustainability 17 10182 g006
Figure 7. Effect on the final score due to the weights assigned to the criteria by the different groups in Table 4.
Sustainability 17 10182 g007
Table 1. The five representative MUA combinations used as a reference in the analysis.
MUA 1MUA 6MUA 12MUA 16MUA 17
Solar energyxxxxx
Wind energy xx
Wave energy x
Fish farmingx xxx
Tourism xxxx
Table 2. Scores obtained, for the five different MUAs in Table 1, for the sub-criteria “Creation of new jobs” and “Maintenance—Transportation”, based on the single UMA scores reported in Figure 4 and Figure 5, by selecting either the “Increments” or the “Maximum value” calculation method and the effect on the variation Δ in total MUA score.
Sub-CriterionCalculation MethodMUA1MUA6MUA12MUA16MUA17
Creation of new jobs
(Benefit)
Increments2.502.503.005.004.50
Maximum value3.333.333.335.005.00
Δ Total MUA score7.45%6.27%2.29%0.00%3.18%
Maintenance—Transportation
(Impact)
Increments3.502.904.005.004.50
Maximum value5.004.005.005.005.00
Δ Total MUA score−1.88%−1.17%−0.97%0.00%−0.45%
Table 3. Example of score calculation for two different MUPs with two different calculation methods.
MUA16
(All UMA Including Wave Energy)
MUA17
(All UMA Except Wave Energy)
Increments (Equation (5)) S M U A = 3 + 5 3 4 4 = 5 S M U A = 3 + 5 3 4 3 = 4.5
Maximum value (Equation (6)) S M U A = 3 + 5 3 = 5 S M U A = 3 + 5 3 = 5
Table 4. Different possible combinations of weights assigned to the criteria.
CriteriaWeights
Suggested WeightsEqual WeightsEngineersInvestorsPublic Authority
Industrial benefitInnovation0.40.50.50.30.6
Exploitation potential0.60.50.50.70.4
ImpactsEnvironmental impact0.30.330.20.10.4
Risks0.30.330.40.40.4
Costs0.40.330.40.50.2
Disclaimer/Publisher’s Note: The statements, opinions and data contained in all publications are solely those of the individual author(s) and contributor(s) and not of MDPI and/or the editor(s). MDPI and/or the editor(s) disclaim responsibility for any injury to people or property resulting from any ideas, methods, instructions or products referred to in the content.