Article

Assessment of Ventilation Control Methods for Energy Efficiency and Indoor Climate Stability: A Case Study of a Zoo Exhibition Room

by
Sylwia Szczęśniak
*,
Michał Karpuk
and
Juliusz Walaszczyk
Department of Air-Conditioning, Heating, Gas Engineering and Air Protection, Faculty of Environmental Engineering, Wroclaw University of Science and Technology, 50-377 Wroclaw, Poland
*
Author to whom correspondence should be addressed.
Sustainability 2025, 17(21), 9912; https://doi.org/10.3390/su17219912 (registering DOI)
Submission received: 23 September 2025 / Revised: 27 October 2025 / Accepted: 30 October 2025 / Published: 6 November 2025

Abstract

This study evaluates indoor thermal comfort and the energy performance of HVAC control strategies in the Congo Zone of a zoological facility located in Poland. The main objective in this zone is to maintain adequate relative humidity, which is more critical for plants and animals than the indoor air temperature range. Long-term measurements were carried out to determine the variation of air system heat transfer as a function of outdoor air temperature. To determine the energy demand for heating, cooling, and air transport, eight control algorithms were analysed, each differing in a single detail but potentially affecting overall energy use and thermal comfort. The algorithms combined the following features: maintaining a constant supply or indoor air temperature; operating with a constant or modulated recirculation damper position; maintaining a constant or variable airflow (CAV or VAV); operating within the normal setpoint range or with an extended range of 1 °C; controlling temperature only or both temperature and humidity; and utilising or not utilising free cooling. The control algorithm operating in the facility maintained indoor humidity within acceptable limits for 98% of the year but failed to meet temperature requirements for 28% of the time. Refined strategies achieved energy savings of up to 74% in fan power and 80% in cooling demand, though often at the cost of reduced humidity control.

1. Introduction

1.1. General

Climate change remains one of the most urgent global challenges, largely driven by greenhouse gas emissions from fossil fuel use in energy production and consumption [1]. Since the Industrial Revolution, energy demand has steadily increased, particularly for electricity, and despite various reduction efforts, the trend continues [2,3].
Recent years have further highlighted the vulnerability of the energy sector. The COVID-19 pandemic triggered sharp increases in energy prices, followed by an energy crisis intensified by geopolitical conflicts. In Europe, wholesale electricity prices rose by over 300% compared to 2016, before partially stabilising in 2023 [4].
According to the International Energy Agency (IEA) and to the United Nations Environment Programme (UNEP), the building and construction sector accounts for 30% of global final energy use and 26% of energy-related emissions [2,5]. Buildings alone are responsible for approx. 21% of residential and 9% of non-residential energy consumption. Around 8% of emissions are direct, while 18% result from electricity and heat generation. This indicates that energy savings in buildings are crucial, not only to mitigate climate change but also to enhance energy security and reduce costs. Even small-scale reductions in demand contribute to lowering emissions, alleviating supply pressures, and addressing energy poverty [6,7,8].
Consider the following facts: (1) people spend over 90% of their time indoors [9]; (2) non-residential buildings, such as zoos and aquariums, attract more than 700 million visitors annually—equivalent to approximately one-tenth of the global population [10]; and (3) the air quality requirements of humans and also animals in zoological gardens are closely linked to the energy demand for heating, cooling, and air transportation. It becomes evident that rational energy use is essential for building maintenance while maintaining proper indoor comfort conditions to support health, work efficiency, productivity, and overall well-being [11,12].
Furthermore, many specialised buildings, including botanical gardens, archives, and museums, require strict thermal and humidity control to protect living organisms or sensitive materials [13,14,15]. These requirements must be maintained year round, often resulting in energy demands comparable to industrial facilities, where final energy use exceeded 31% in 2021 [2,3]. Sustainability at the building level is therefore closely connected with the efficient operation of HVAC systems, which cover heating, cooling, humidification, dehumidification, and ventilation [8,16,17]. In the EU, approximately half of building energy is used for heating and cooling, with growing demand for cooling due to rising outdoor temperatures [18]. While modern insulation reduces heating demand, internal heat gains and climate change increasingly drive cooling needs. Optimising HVAC energy use is thus central to sustainable building operation.
HVAC systems account for 38% of the energy consumption in buildings, equivalent to 12% of the total final energy use [19]. This share includes non-standard facilities such as zoos and botanical gardens [20,21,22]. Improving efficiency while maintaining indoor air quality requires advanced ventilation strategies [11,23,24]. Building orientation, system selection, and technology integration significantly influence performance. However, improving energy efficiency in existing buildings is often more complex, as it involves adjusting control systems or structural renovations. Control strategies play a decisive role; however, the impact of changes to them is difficult to predict, requiring seasonal testing to ensure efficient energy management and optimal HVAC performance [25]. On the other hand, poorly managed systems can waste up to 20% of energy [26].
Any modifications to ventilation, heating, or cooling systems should be supported by a thorough analysis of indoor air quality and energy consumption. This comprehensive approach ensures sustainable improvements. In high-performance buildings, the relationship between indoor thermal comfort and energy use must be well understood [27], as reducing energy demand should never come at the expense of occupant well-being [28,29].
Creating a balance between minimising energy demand and ensuring thermal comfort in the room where relative humidity is critical for plants and animals is a critical challenge. Numerical analyses have demonstrated that energy consumption can be significantly reduced by carefully selecting appropriate set points for HVAC systems [30,31,32]. Furthermore, substantial improvements in energy efficiency can be achieved by optimising the control strategies of air handling units. Key measures include the implementation of optimal start–stop schedules, the utilisation of free cooling using outdoor air, and the application of night purge techniques [25].
In specialised environments, such as zoological buildings, it is crucial to ensure that efforts to reduce energy demand do not compromise the required thermal and humidity conditions. Consequently, HVAC systems in these facilities play a pivotal role in reducing energy consumption and associated CO 2 emissions [33,34].
As existing buildings dominate the building stock, enhancing their operational efficiency is essential to achieving significant reductions in overall energy consumption [35,36,37].

1.2. The Purpose of This Article

This article aims to highlight the potential to reduce energy consumption in a large room in an existing building in a zoological garden by controlling the ventilation system through different control strategies. It is particularly important to note that neither the HVAC system nor the room itself includes any controllable mechanism for air humidification, even though maintaining adequate relative humidity is critical for the plants and animals accommodated in this space.
The control system used in the facility is simple, like many others in such facilities in Poland. This is due to the huge investment costs associated with the implementation of more complex and complicated solutions at the stage of construction and start-up. Especially for existing and simple systems, opportunities to reduce energy consumption and thus reduce CO 2 emissions should be sought. If the reduction in energy does not affect the deterioration of the thermal conditions of indoor air and does not involve large financial outlays, then the changes resulting in this reduction should be strongly recommended. The aim of this article is to assess whether and to what extent a change in the control of a simple system can improve the energy efficiency of the system serving the simulated climate.

2. Materials and Methods

2.1. Research Facility

This research considers the Congo zone in the Africarium building in the Wroclaw Zoo, Poland (Figure 1a).
The facility is available to tourists all year round. The total dimensions of the room are W × L × H = 41.5 × 41.5 × 14.5 m, giving a floor area of 1722 m 2 , and an approximate volume of 25,000 m 3 . There are two levels in this space. Two large water reservoirs occupy the lower level with an area of approximately 157 m 2 and 144 m 2 . The floor space dedicated to tourists is approximately 580 m 2 (both lower and higher level). The vegetative surface equals 1700 m 2 . Exotic birds fill the room. The simple layouts of the first and second floors are shown in Figure 1b,c. According to the requirements of zoologists and botanists, the indoor air temperature should be maintained between 22 °C and 33 °C during the day, and 20 °C and 30 °C at night, and the indoor air relative humidity should always be above 60%. The pictures of the research space are shown in Figure 2.
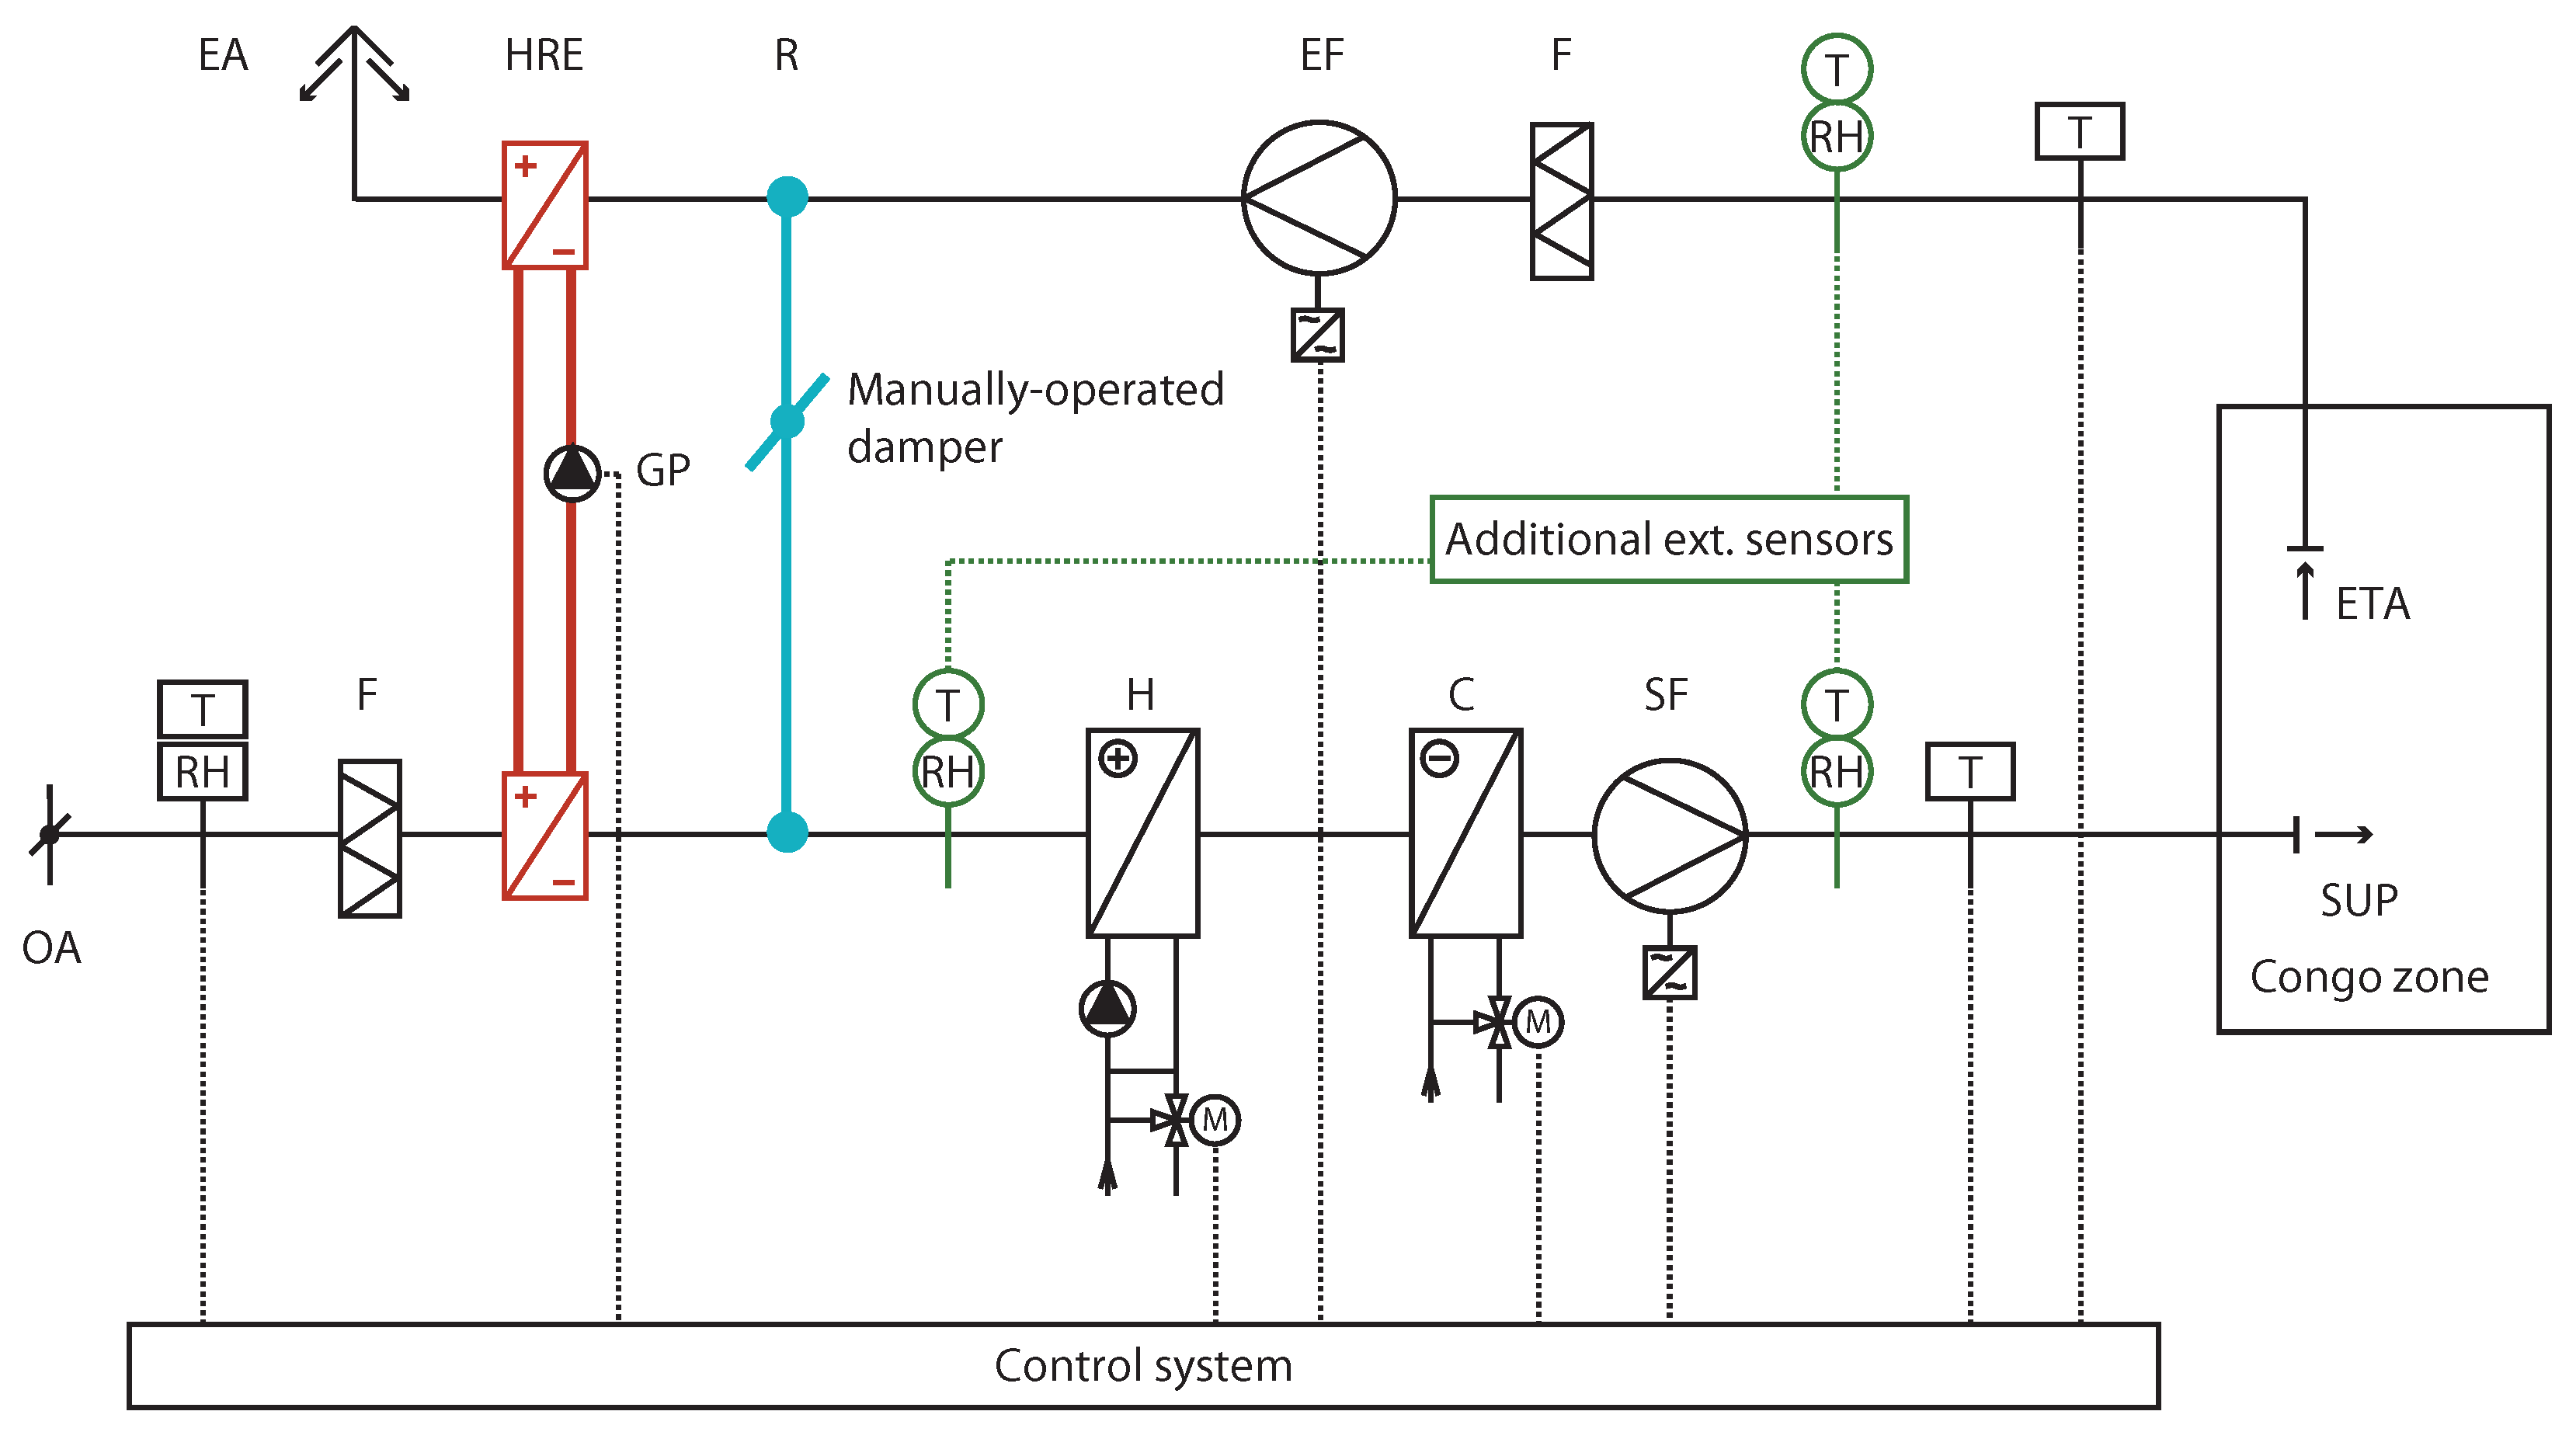
The required climatic conditions for the exhibition space are maintained by a centralised all-air HVAC system operating with a simple control mode (Figure 3), which was named the current control algorithm (CCA). The mixing ventilation system is used in the space and only the air temperature is actively controlled. Relative humidity is maintained through water evaporation from reservoirs and the plant irrigation system, with measurements taken exclusively in the occupied zone, without integration with the ventilation system.
The airflow volume for both the supply and the exhaust systems is balanced at 45,000 m 3 / h . Air recirculation in the air handling unit (AHU) is managed via a manually controlled damper. In its current configuration, the share of outdoor air in the supply air is approximately 34%.
The absence of an actuator prevents smooth adjustments to the damper’s position. However, the efficiency of the glycol heat recovery exchanger is adjustable, which allows a certain degree of flexibility in the energy recovery and ventilation performance.

2.2. Methodological Framework

Measurements taken at the actual facility were used to determine the air system heat transfer characteristics. The facility operated under the control of Algorithm 1, also referred to in the article as CCA. After establishing the relationship between the heat transfer of the air system and the outdoor air temperature, simulations were conducted in MATLAB R2018b for each control algorithm (from Algorithm No. 1 to Algorithm No. 8). The simulation results included air parameters within the room and at individual installation points. The power and energy required for cooling, heating, and air transport were subsequently calculated. Figure 4 presents a diagram illustrating the processing of measurement data and the procedure used to obtain the simulation results.
Building heat balance and air system heat transfer are closely related, as the latter represents the dynamic component of heat exchange responsible for maintaining indoor thermal conditions. Because the heat transfer of the air system determines the rate at which thermal energy is supplied to or removed from the indoor environment, it therefore depends on the control algorithm applied. Different control strategies (e.g., constant supply air temperature, adaptive, or demand-based control) modify the instantaneous values of air system heat transfer; however, the overall heat balance of the building remains governed by the same physical principles. Therefore, in all analyses, the calculated air system heat transfer served as the basis for evaluating and comparing the performance of the various control algorithms.

2.3. Measurement Data

To analyse the energy demand using the CCA and other algorithms, it was necessary to obtain accurate the net heat flow for the room under study. For existing buildings, they can be calculated as air system sensible and total heat transfer [38]. The air system sensible and total heat transfer were calculated using data collected from the existing Building Management System (BMS). The BMS archived the following parameters: outdoor air temperature and relative humidity, supply air temperature, extract air temperature, percentage control of the supply and exhaust fans, percentage control of the heater and cooler, and percentage control of the glycol pump in the heat recovery exchanger. However, the BMS system lacked sensors for the relative humidity of the supply air and the extract air.
To calculate the air system sensible and total heat transfer, air temperature (T) and relative humidity (RH) were additionally measured in the main supply and exhaust air ducts, as well as in the mixing chamber of the AHU. These measurements were made with TESTO 174H recorders at 10 min intervals. The technical data for the recorders are presented in Table 1. Based on the percentages of fan operation control provided by the BMS system, fan performance characteristics were determined using the TESTO 400 recording device and a Prandtl tube. Measurements were carried out over two periods: from 13 March 2016 to 6 July 2016, and from 14 September 2016 to 19 September 2016.

2.4. Air System Sensible and Total Heat Transfer

For newly constructed or newly designed buildings, where structural characteristics, thermal parameters, and occupant behaviour are well defined and well known, energy simulations are already widely used to analyse the net heat load. However, in the case of existing buildings, this method is subject to additional limitations, including the determination of actual heat transfer and its coefficients, thermal radiation, and related factors, which may lead to inaccurate estimation of thermal loads. Consequently, it is evident that, whenever possible, the thermal loads of a building should be determined experimentally [11].
In order to determine the actual thermal properties of the room, which have a direct impact on the operation of the ventilation system, data obtained from measurements were used. The air system sensible and total heat transfer were calculated for every 10 min interval of the analysed period. The values obtained in this way were subjected to statistical analysis, and the results were used for further calculations.
Air system total heat transfer based on the measurements was calculated from Equation (1):
Q t = ρ V ( h s u p h e t a )
where V [ m 3 / s ] is air flow volume, ρ [kg/ m 3 ] is air density, h s u p , and h e t a [ kJ / kg da ] is the specific air supply and extract enthalpy.
The air system sensible heat transfer was calculated with Equation (2):
Q s = ρ V c p ( t s u p t e t a )
where V [ m 3 / s ] is air flow volume, ρ [kg/ m 3 ] is air density, c p [kJ/kg °C] is the specific heat of air at a constant pressure, t s u p , and t e t a [°C] is the temperature of supply and extract air.

2.5. Regression Analysis

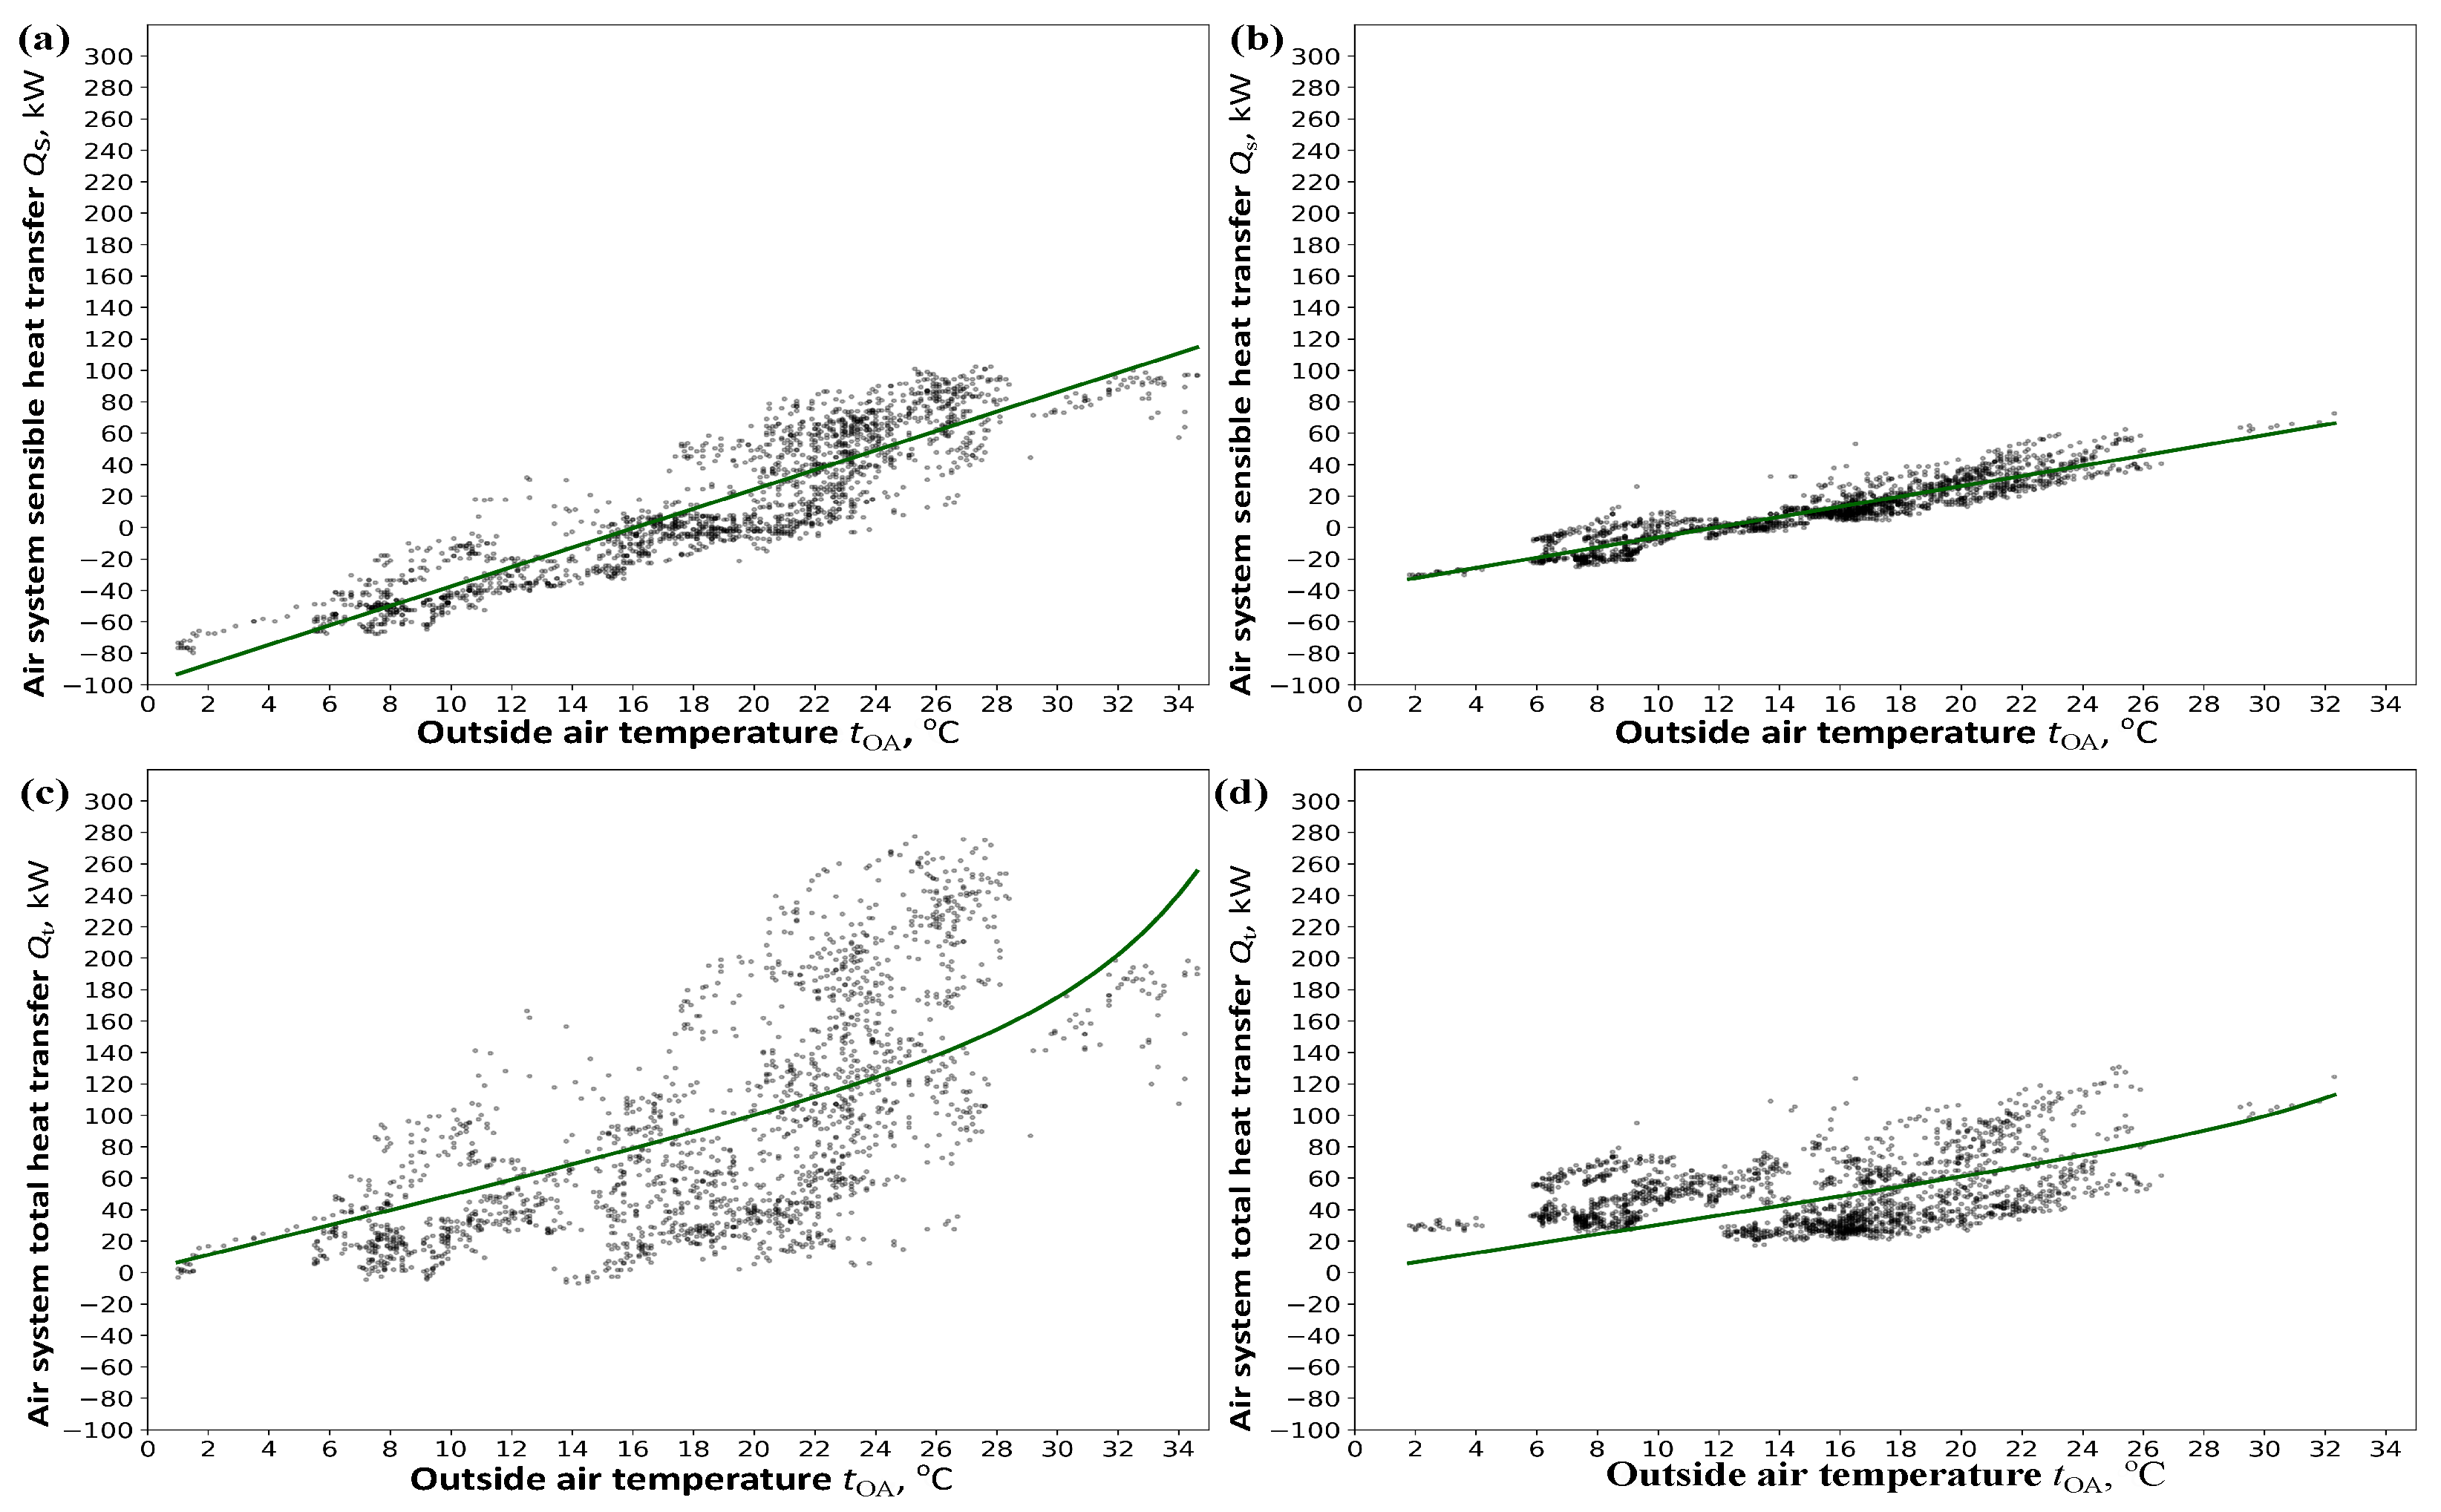
Due to the available measurement capabilities and the limited information on the building’s construction, regression analysis was employed in this study rather than dynamic building performance simulation. Regression analysis was applied to examine the dependence of air system sensible and total heat transfer on the outdoor air temperature t O A , and the parameters of these relationships were analysed. The literature suggests that the dependence of air system sensible air transfer on outdoor air temperature can be approximated as linear [39,40,41,42,43]. Air total heat transfer is influenced by factors such as indoor moisture gains and outside air moisture content, which makes their dependence on outdoor air temperature generally nonlinear. Analysis of experimental data from the building under study (Figure 5) indicated that air system sensible heat transfer varies linearly with outdoor air temperature, whereas air system total heat transfer exhibits a nonlinear relationship. For the purpose of determining control strategies, adopting the variability of air system total heat transfer as a function is a simplification, as it does not explicitly account for the variability of outdoor air moisture content. Nevertheless, for a given state of outdoor air, temperature is always related to its moisture content, and among these parameters, air temperature varies more rapidly.
Due to the fundamental differences in room usage between daytime and nighttime, as well as the evident impact of solar radiation and artificial lighting, the variability of air system heat transfer was analysed separately for day (2398 measurements) and night periods (2591 measurements). They differ in the parameters of the models. For air system sensible heat heat transfer, the linear model was created (Equation (3)):
Q s = a t O A + b
where t O A [°C] is the outside air temperature.
For air system total heat transfer, a nonlinear model was created, which was the best fit in terms of thermodynamics (Equation (4)):
Q t = a exp t O A t 0 2 + b t O A
where t O A [°C] is the outside air temperature.
The quality of the model and the structural parameters a and b of the model were estimated using the least squares method (OLS function of the statsmodels library of the Python programming language).
The values of the coefficients a, b and t 0 are shown in Table 2. The parameters a and b are statistically significant because empirical t a and t b are higher than critical t α 2 value in t-Distribution with significance level of 0.05. The determination coefficients R 2 range from 0.809 to 0.862; therefore, the proposed models explain more than 80% of the variability in the heat loads in the examined building.

2.6. Control Algorithms

In the article, eight possible control algorithms were analysed. All are listed in Table 3. For all control algorithms analysed, according to the guidelines of zoologists and botanists, regardless of the time of day, an acceptable indoor air temperature range assumed 22–33 °C. If a particular control algorithm was unable to maintain indoor air temperature in the acceptable range, this was reported as discomfort conditions.
In most of the analysed control algorithms, the indoor air temperature was maintained within the range of 23–32 °C (Table 3). Lower air temperatures were assumed during the winter period, while higher values were set during the summer, with priority given to energy demand. However, according to the project specifications, it was possible to assume the full range of air temperatures regardless of the time of year. Only in Algorithm No. 5 (Standard eco) was the acceptable indoor temperature range set as original requirements 22–33 °C (Table 3).
Taking into account the user recommendation for each algorithm, a limitation of supply air temperature was assumed as ±7 °C relative to acceptable indoor air temperature. Therefore, the supply air temperature limit was fixed at 25 °C for cooling and 30 °C for heating.
Furthermore, after a long discussion with zoologists and botanists, the acceptable range of relative humidity of the indoor air was defined as 50–80%. It should be noted that they drew attention to frequent and long-term failure to maintain RH conditions, which was noticeable in the conditions of the plants. What must be taken into account is the fact that in the system there was a lack of a RH sensor both in the room and ducts. It was evident that, given the absence of a humidifier within the ventilation system and the lack of relative humidity sensors, it was impossible to regulate the relative humidity of supply and indoor air.
Algorithm No. 1 (CCA) current control algorithm enables regulation of the supply air temperature (SAT) and two-step control of the supply and return airflow. The SAT is maintained at fixed set points of 27 °C during the day and 24 °C at night. Airflow regulation operates in two distinct modes: night mode, with fan control signals in 70%, and day mode, with fan control signals in 100%. The control algorithm used in the building operated during the measurements and remained in use throughout the system’s operation. In the event that the indoor room temperature exceeds the designated limits, the setpoint can be manually adjusted. However, the regulation of indoor humidity through ventilation systems is not possible. It is crucial to acknowledge the limitations of the CCA, which is unable to accommodate short-term fluctuations in the net heat flow.
Algorithm No. 2 (T control) handles the indoor air temperature at a predetermined level. This is achieved by using an adjustable SAT. Fans’ schedule is the same as in CCA, and fans operate in day and night mode with airflow of 100% and 70%, respectively. The recirculation damper is at a fixed level as in CCA.
Algorithm No. 3 (Recirc. control) maintains indoor air temperature control in accordance with Algorithm No. 2, and the existing fan schedule is maintained. However, the algorithm assumes variable air recirculation, for which an additional damper actuator is required.
Algorithm No. 4 (Standard) manages indoor air temperature control in accordance with Algorithm No. 2. The airflow is variable and is within 50–100% of the maximum value.
Algorithm No. 5 (Standard eco) assumes control in accordance with Algorithm No. 4. However, it widens the range of air temperatures in the room.
Algorithm No. 6 (Standard low) is predicated on the control strategy defined in Algorithm No. 4 but excludes the capability for variable adjustment of the recirculation damper.
Algorithm No. 7 (Standard freecool) operates according to the control strategy of Algorithm No. 4 but incorporates free cooling on the air side. Specifically, as long as conditions allow, only purified outdoor air is supplied to the room. In practice, it is very difficult to precisely determine how to balance the airflow with the cooler’s performance to achieve optimal energy-efficient operation. Therefore, in this study, fan efficiency is first increased to its maximum value, after which the cooling coil is activated.
Algorithm No. 8 (Standard+RH) incorporates an additional relative humidity sensor and supplementary control sequences that modulate the recirculation damper based on the indoor relative humidity setpoint.

2.7. Climate Data

To evaluate the annual energy demand of the system operating under the adopted control algorithms for calculated air system heat transfer, taking into account the climate change, system performance calculations were conducted using global meteorological data specified for the Wrocław weather station (51°06’12” N, 16°54’00” E) from the Typical Meteorological Year (TMY) datasets for the period 2000–2022 [44] and 1971–2000 [45]. The former dataset is referred to as TMY-2022, and the latter as TMY-2000. The historical TMY-2000 dataset was used exclusively to compare the potential for energy savings and the capability to maintain the required indoor air temperature and relative humidity in the context of ongoing climate change. The duration of the temperature of the outside air is shown in Figure 6.

3. Results and Discussion

The simulation results for the supply and indoor air temperature and relative humidity are presented as a function of the outdoor air temperature in Figure 7, Figure 8, Figure 9, Figure 10 and Figure 11 and Figure A1, Figure A2 and Figure A3 (Appendix A). Part (a) of Figure 12, Figure 13, Figure 14 and Figure 15 and Figure A4, Figure A5, Figure A6 and Figure A7 present the heat recovery efficiency, recirculation ratio, and the operation of the supply and extract fans for all algorithms. The corresponding energy demand for heating, cooling, and air transport is shown in part (b). The significant differences between the individual algorithms are demonstrated using only selected charts, and for that reason, the remaining figures are placed in Appendix A. All charts present the results obtained under the assumption that the AHU operated with setpoints in the day mode based on TMY-2022.
Algorithm No. 1 (CCA) maintains a constant supply air temperature. As a result, the indoor air temperature drops below the minimum limit once the outdoor temperature falls below +4 °C (Figure 7a) and exceeds the upper limit when it rises above 30 °C. Relative humidity remains acceptable almost year-round, but at temperatures below −5 °C it also surpasses the allowable range (Figure 7b). Overall, indoor temperature stayed within the limits for 71.7% of the year, while relative humidity achieved 98.4% compliance (Table 4)—a level otherwise reached only by Algorithm No. 8 with an additional RH sensor. In practice, operators in the studied building adjust the supply air temperature manually whenever limits are exceeded, which also affects humidity. Although the CCA is considered suitable mainly for restricted applications [46]. These findings indicate that simple algorithms can deliver reliable outcomes but require proper tuning by experienced users.
In Algorithm No. 2, the supply air temperature is variable but limited to a maximum of 30 °C for heating at low outdoor temperatures (Figure 8a). Indoor air temperature and relative humidity depend on the instantaneous heat load and supply air parameters. With this control strategy, indoor air temperature remained within the setpoint range for 97.9% of the year, while relative humidity met the limits for 79.3%. However, the temperature setpoint could not be achieved when the outdoor air temperature dropped below −1 °C due to the 30 °C supply air limit. Moreover, relative humidity exceeded the permissible range more frequently than in the case of Algorithm No. 1 (Figure 8b) which is undoubtedly reflected in the condition of the plants within the room. Changing the control strategy from a constant supply air temperature (CCA) to a variable supply air temperature did not generate additional heating demand but reduced cooling demand by approximately 25% (Figure 16). Since the fan operation schedule remained identical, annual fan energy consumption did not differ from the CCA scenario. Thus, improved cooling efficiency was achieved compared with the CCA, albeit at the cost of deteriorated indoor humidity conditions.
The implementation of recirculation damper control in Algorithm No. 3, which stabilised the air temperature downstream of the recirculation section, did not significantly improve the system’s ability to maintain indoor air temperature setpoints. However, compared with Algorithm No. 2, it slightly reduced the percentage of time during which indoor air relative humidity remained within the required range (Table 4). In terms of energy efficiency, Algorithm No. 3 led to a substantial decrease in cooling energy demand—about 80%, resulting in the lowest cooling consumption among all scenarios. An even greater reduction of 84% was observed when using climate data with a lower degree of warming impact. However, it should be noted that the duration of acceptable indoor relative humidity was shorter than in the CCA case, although still higher than that recorded for Algorithm No. 4. Zhao et al. [47] demonstrated that the smooth control of outdoor air supply enhances system stability and energy efficiency while maintaining adequate indoor air quality. Their findings indicate substantial energy savings compared to conventional methods, underscoring the importance of advanced ventilation control strategies. In HVAC systems where indoor air recirculation is allowed, most research has focused on damper control sequences [48,49,50,51]. However, little of the literature addresses a fixed return air damper position as applied in the CCA. Existing studies mainly emphasise the maintenance of a minimum outdoor air fraction in mixed air [52,53,54]. In practice, outdoor and return air dampers should be regulated to achieve the desired supply air temperature. In Poland, cooling coils are typically controlled in summer to reduce supply air moisture content, while additional humidifiers are operated in winter to increase relative humidity [55]. However, in the analysed case, relative humidity was controlled solely through the operation of the return air damper. This confirms that each building or zone has unique characteristics, and therefore the guidebook guidelines must be applied with caution as also noted by Felker [54].
The results for Algorithm No. 4 showed that maximum air flow was rarely required (Figure 12a). Nevertheless, the share of time during which relative humidity met the setpoints was lower than expected. Algorithm No. 4 maintained indoor air temperature within the required range for 98.1% of the year (Figure 9a), representing the best performance among all tested strategies. However, due to the absence of a relative humidity sensor, acceptable indoor humidity levels were achieved during only 54.9% of the year (Figure 9b). By implementing Algorithm No. 4, the energy demand for air transport was reduced by 69%, highlighting its effectiveness in improving energy efficiency (Figure 16 and Figure 17). In addition, the energy demand for air heating and cooling decreased by approximately 10% and 64%, respectively. Thus, although significant fan energy savings were achieved together with excellent temperature control, the performance in maintaining indoor relative humidity was very poor.
Indoor air relative humidity reached extremely high levels (up to 100%) during the mid-season. The energy-efficient Algorithm No. 4 maintained the temperature setpoint while operating with an air flow between 50% and 100% (Figure 9b and Figure 12), whereas Algorithm No. 3 required maximum air flow throughout the year. The higher flow in Algorithm No. 3 enhanced moisture removal, resulting in better control of relative humidity.
Algorithm No. 5 applied a control strategy similar to Algorithm No. 4 but with a wider range of indoor temperature setpoints. Consequently, indoor temperature remained within acceptable limits for 98.1% of the year. However, extending the temperature range without humidity control (no sensor or dedicated equipment) further reduced the share of time within relative humidity limits—from 54.9% for Algorithm No. 4 to only 44.5%. This represents the poorest humidity control among all tested algorithms (Table 4). Algorithm No. 5 achieved additional energy savings, reducing the annual fan energy consumption by approximately 15% compared with Algorithm No. 4, and lowering the heating and cooling energy demands by about 3% and 12%, respectively. As a result, in terms of energy efficiency, this control strategy proved to be the most effective; however, it came at the greatest cost in terms of failure to maintain indoor air relative humidity within the acceptable range. Similar trends have been reported in the literature. Hoyt et al. [56] demonstrated that raising the cooling setpoint by 1 °C resulted in annual energy savings of 7–15%, depending on building location, while lowering the heating setpoint by 1 °C yielded 7–14% savings. Comparable results were also presented in [57]. Likewise, Cao and Deng [58] found that decreasing room temperature by 1 °C during the heating period produced an 8.3% reduction in energy use.
Algorithm No. 6 was based on the control strategy of Algorithm No. 4, but without the capability for continuous adjustment of the recirculation air damper position. This limitation stemmed from the assumption that no additional costs would be allocated for purchasing and installing a damper actuator. Importantly, Algorithm No. 6 maintained indoor air temperature within the required setpoints with the same effectiveness as Algorithm No. 4. Relative humidity control was slightly better, with setpoints met for 57.8% of the year compared to 54.9% for Algorithm No. 4. However, in both cases, performance in terms of relative humidity remained markedly lower than that achieved by Algorithms No. 1 and No. 8 (Table 4). The results for Algorithm No. 6 showed a marked increase in cooling energy demand—36% higher than in the CCA case and nearly six times greater than in Algorithms No. 3 and No. 7 (Figure 16b). This highlights the crucial role of motorised recirculation damper control, as the unregulated damper (Figure 13a) led to considerably higher cooling demand (Figure 12b and Figure 13b). Comparable results were reported by Dharmasena and Nassif [59], who showed that DCV combined with optimised damper control significantly reduced cooling and heating demand, and by Kuen-Tyng Yu [60], who confirmed the energy-saving potential of effective return air recirculation.
Algorithm No. 7 is an extension of Algorithm No. 4 that incorporates free cooling. Consequently, its performance in maintaining indoor air temperature and relative humidity setpoints (Figure 10a,b) was comparable to that of Algorithm No. 4, namely 98.1% and 54.9% of the year, respectively (Table 4). In the performance graph (Figure 14a), a distinct increase in airflow is observed at an outdoor air temperature of around 25 °C. When the fan speed reached its maximum, the cooling coil efficiency began to increase. In Algorithm No. 7, the activation point of the cooling coil operation was shifted from 26 °C (as in Algorithm No. 4, Figure 12a) to 28 °C. This strategy yielded very good energy savings for cooling and equal performance for heating due to identical heating control loops as in Algorithm No. 4 (Figure 14b). Compared to the CCA strategy, the energy savings for heating, cooling and air transport were approximately 10%, 80%, and 68%, respectively. A similar approach was discussed by Li, Wild, and Rowe [61], who showed that in many Canadian regions, cooling demand can be fully met by free cooling, with available potential ranging from 50% to 325% of the building’s cooling demand. In contrast, Algorithm No. 7 applied full free cooling by maximising load shift, which resulted in the highest supply air temperature (SAT) values. Ke et al. [62] noted that increased fan power can offset cooling energy savings from such an approach, and Engdahl et al. [63] similarly warned that although the risk is minor at lower than optimal SAT, higher than optimal SAT can significantly increase power use. Therefore, the present study confirms that, compared with configurations without free cooling, free cooling does not constitute an energy-efficient solution.
Algorithm No. 8, which enabled comprehensive control of both indoor air temperature and relative humidity through variable air flow and continuous adjustment of the recirculation damper, achieved the best performance in maintaining relative humidity (98.9%) and a comparable performance to Algorithms No. 4–7 in maintaining indoor temperature (98.1%) (Table 4, Figure 11a,b). The algorithm with the extra RH sensor (Algorithm No. 8) gave the best results for the indoor air temperature and relative humidity. However, in this case, the energy (Figure 15b) required for cooling was 44% lower compared to CCA but as much as 179% higher compared to Algorithm No. 3. The energy requirement for air heating was only 6% lower than in CCA, which results from the efficiency of the individual parts of the installation (Figure 15a). However, the energy for air transport was comparable to that obtained for Algorithm No. 4 and Algorithm No. 6 and was 69% of the maximum value obtained by CCA. What is very important is that this algorithm undoubtedly maintained the required parameters of the air in the room the longest. However, the main limitation of the existing building is the absence of a relative humidity sensor and the lack of any feasible option for its proper installation, which fundamentally restricts the implementation of this control strategy in practice.
Although many of the analysed algorithms demonstrated higher energy efficiency than the CCA, none—except Algorithm No. 8—was able to maintain indoor air relative humidity within the acceptable range more effectively (Table 4). The choice to favour higher energy efficiency despite poorer indoor humidity control should rest with the building users or those responsible for ensuring indoor comfort, as they are the only ones capable of assessing the practical and economic implications of such deviations.
All algorithms from No. 2 to No. 8 maintained indoor air temperature within the required limits, while the original CCA caused significant deviations, with indoor values dropping to 14.2 °C for 1 h per year and rising to 33.9 °C for 6 h per year. Although such extremes may be tolerable in practice when short in duration [64], they highlight the clear shortcomings of the CCA compared with the alternative control strategies.
Variable air flow volume systems (VAVs) were firstly used to reduce energy demands [55,65,66]. Due to part-load conditions, as an annual average, fans and pumps operate at 60% to 100% of capacity [55]. The annual average fan energy consumption decreased from 100% in CCA to 31% in Algorithm No. 4. The results confirmed significant energy savings when switching from CAV to VAV as was mentioned in several research works [67,68,69,70]. However constant air volume systems (CAVs) are also still widely used due to their simple design and low primary costs [71]. Furthermore, VAV systems are also considered inappropriate for exhibition spaces, especially due to their poor ability to control the moisture content [65].
When switching from a CAV to a VAV system, indoor relative humidity remained within the acceptable range for only 54.9% of the year (Algorithm No. 4) and 57.8% (Algorithm No. 6 with a fixed recirculation damper position). By contrast, the analysed CAV systems met humidity setpoints for 77.2–98.4% of the year (Algorithms No. 1–3). These findings confirm that VAV systems may lead to inappropriate indoor humidity levels, consistent with the results reported by [65] in a museum environment. However, this issue can be addressed through improved control algorithms as demonstrated in Algorithm No. 8, which successfully maintained the desired moisture content.
Energy savings potential is strictly connected to building location, especially to climate zones. Morgan et al. showed results, where maximum pre-cooling energy savings potential varied between 30 and 48% depending on city location in the US [72]. Engdahl et al. [63] obtained results based on calculations between two cities from north and south Sweden in the representative year of 1977. The results presented that HVAC energy for the optimally controlled identical single zone at equal internal loads differed by more than a factor of two [63]. Hoyt et al. showed results where a wider thermostat setpoint range can save from 32% to 73% of HVAC energy consumption depending on seven ASHRAE climate zones [57].
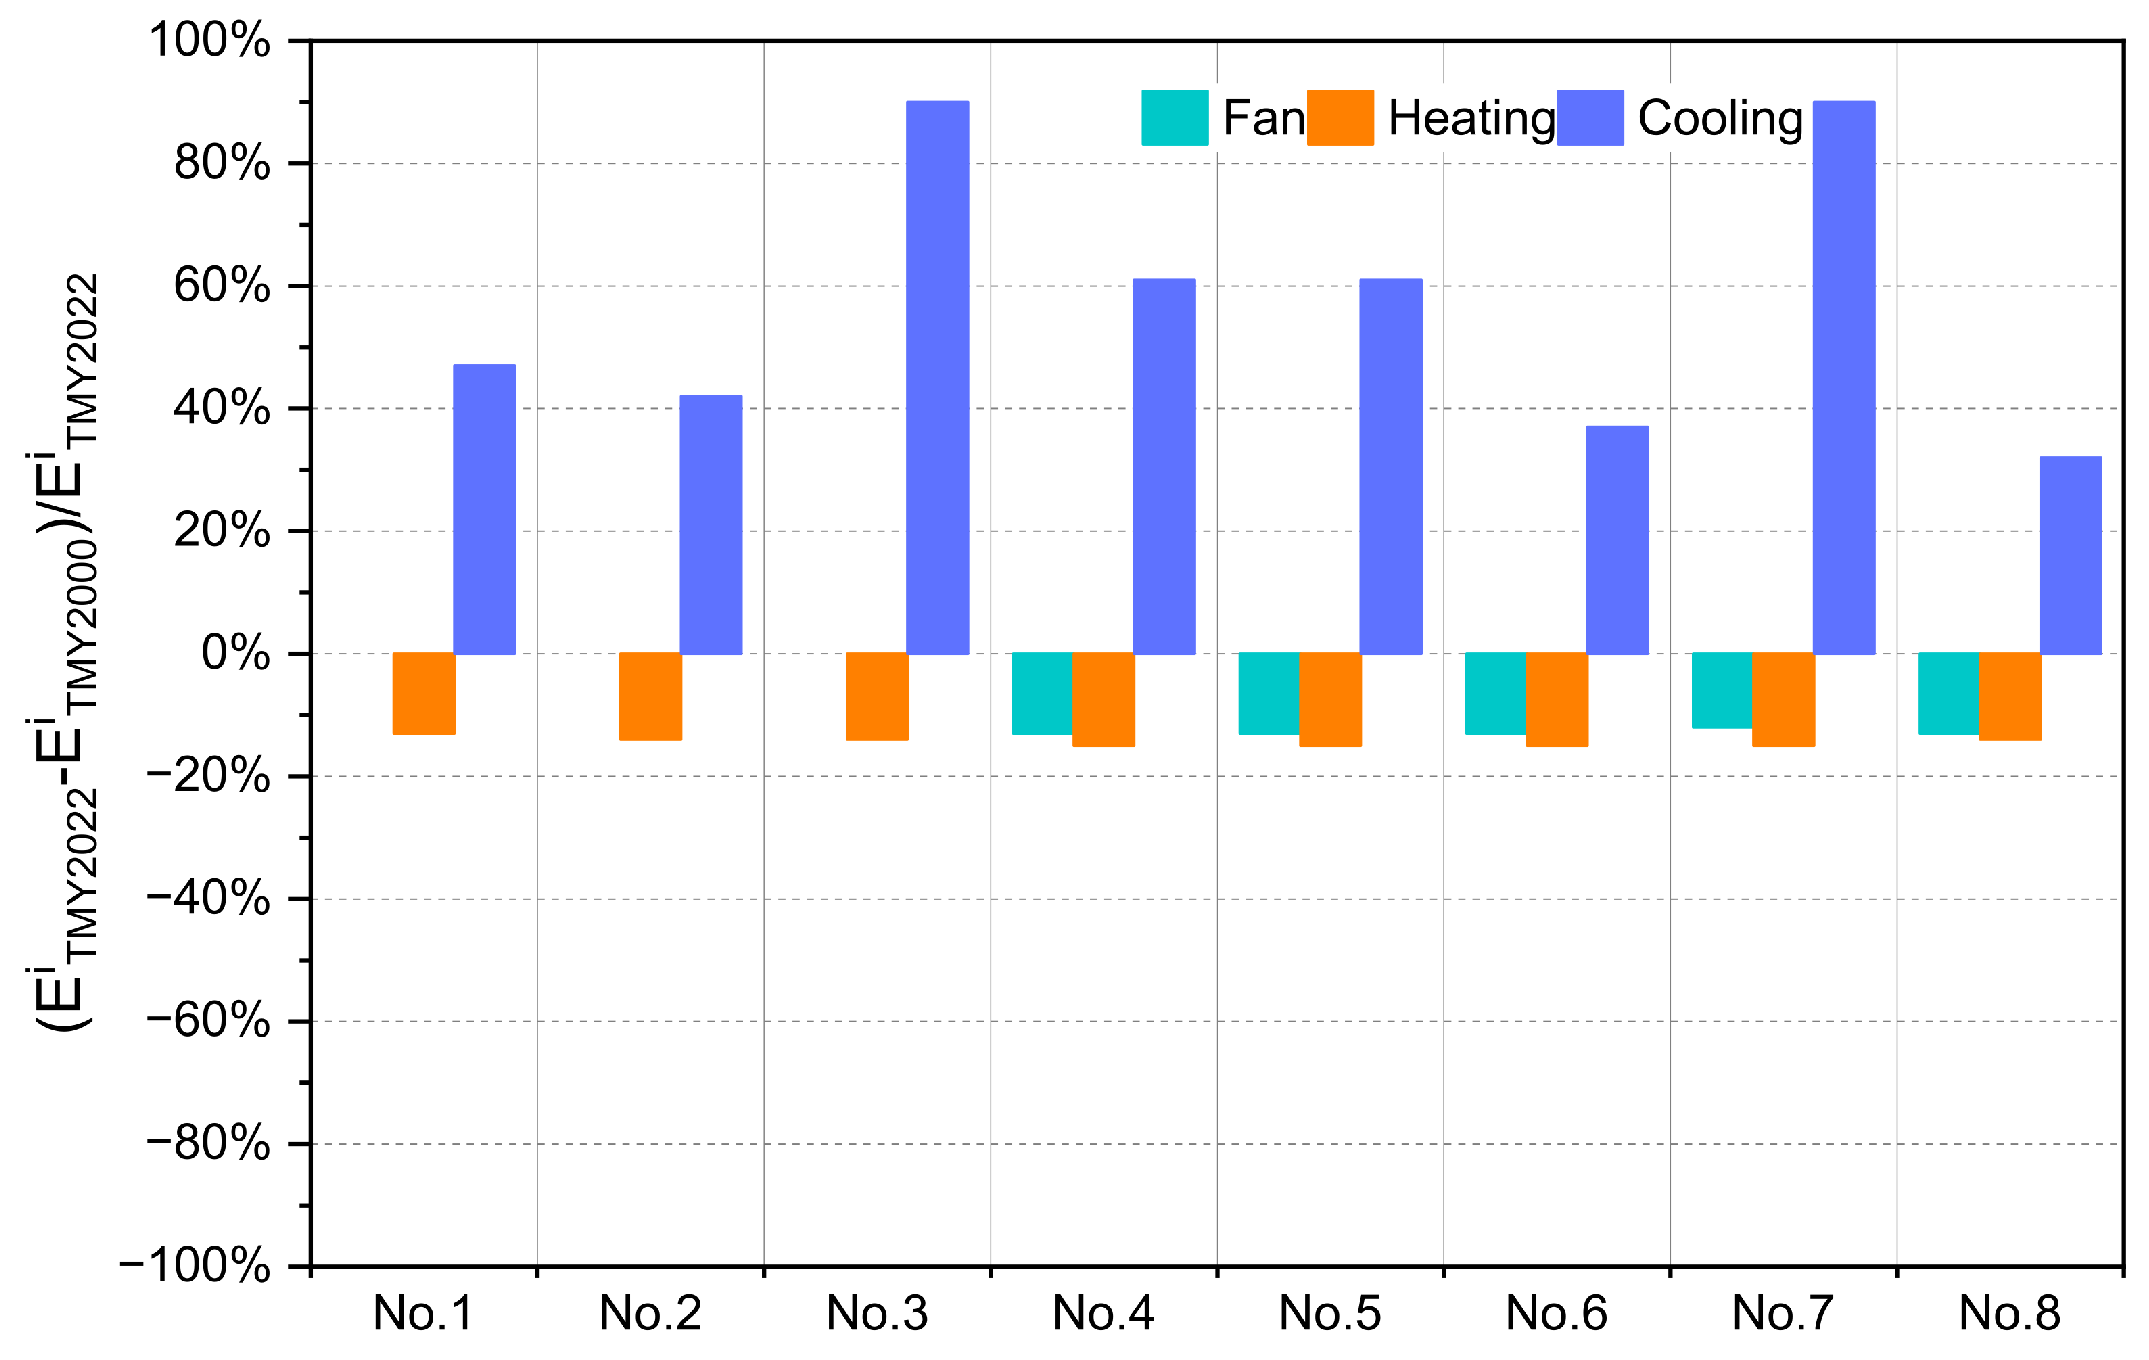
This study compared the same climate zone using TMY-2000 and TMY-2022 datasets to assess the impact of climate change on energy demand. The results (Figure 16 and Figure 17) show that rising outdoor temperatures reduced heating demand, with annual savings above 14% under TMY-2022 conditions compared with TMY-2000. In contrast, cooling demand increased significantly, by 32–88% (Table 4 and Table A1), confirming earlier reports that global warming leads to higher cooling energy use [73], regardless of the adopted control strategy.

4. Limitation

In the analysed building, the actual net heat load was influenced by multiple factors, including occupancy, weather conditions, lighting, and other internal gains. Nevertheless, a statistically significant relationship between outdoor air temperature and air system heat transfer was established and subsequently applied in the energy calculations. It should be emphasised that, under conditions differing from the measurement period, the actual air system heat transfer may deviate from the calculated values, particularly due to variations in outdoor air moisture content. Moreover, all calculations in this study were based on statistical outdoor air data (TMY), which do not fully reflect extreme weather events. Finally, since the research was conducted in an existing building, the results may not be directly transferable to newly constructed or other existing buildings, even those with similar functions and purposes.

5. Conclusions

This study assessed eight ventilation control algorithms in an existing zoo facility, where maintaining a simulated climate is essential for the welfare of animals, the health of plants, and visitor comfort. The results demonstrate that all variable air volume (VAV) strategies (Algorithms No. 4–8) ensured very good indoor air temperature control (>97% of the year), while the original constant control algorithm (CCA) showed significantly poorer performance. However, only Algorithm No. 8, which integrated variable air flow, recirculation control, and humidity feedback, maintained indoor relative humidity within the required range (98.9%), whereas the other VAV strategies performed considerably worse (44.5–57.8%). The insufficient control of indoor relative humidity was reflected in difficulties in maintaining the plants in a healthy condition.
In terms of energy demand, substantial savings were achieved: controlled recirculation (Algorithm No. 3) reduced cooling energy use by about 80%, and free cooling (Algorithm No. 7) achieved similar results. Widening the setpoint range (Algorithm No. 5) further decreased fan and cooling demand but at the cost of very poor humidity control. The analysis also confirmed that climate change reduces heating demand (>14%) but significantly increases cooling demand (32–88%), regardless of the adopted control strategy.
Overall, the findings show that advanced algorithms, especially Algorithm No. 8, provide the most balanced solution between energy efficiency and indoor climate stability. Nevertheless, in the analysed zoo building, Algorithm No. 8 cannot be practically implemented due to the absence of a humidity sensor. Given the feasibility constraints associated with implementing Algorithm No. 8 and the necessity of maintaining both indoor air temperature and relative humidity while minimising the required energy input, Algorithm No. 3 appears to be the most effective control strategy in this case. Algorithm No. 2, although slightly less energy efficient, proved to be more consistent in maintaining both temperature and humidity conditions within acceptable limits. However, the most effective solution would be a system with variable air volume and adjustable recirculation of return air, equipped with temperature and relative humidity sensors in the room, which would serve as control elements. Future work should include verification of the analytical results with experimental data, if an upgrade of the control system becomes possible.
These conclusions are particularly relevant for existing zoo facilities, where the indoor environment must be carefully controlled to maintain appropriate thermal and humidity conditions, primarily for the well-being of exotic plants and animals.
The study emphasises that even simple control strategies can be highly effective when properly tuned. However, ensuring system reliability and incorporating feedback control based on conditions in occupied spaces remain key challenges for future research. This is particularly relevant for existing buildings equipped with operating control algorithms, where modifications must be implemented without disrupting ongoing operation. Addressing these issues will require close collaboration with facility operators to implement the most appropriate algorithm rather than relying solely on a constant SAT.

Author Contributions

Conceptualisation, S.S. and J.W.; Methodology, S.S.; Software, S.S.; Validation, S.S. and J.W.; Formal analysis, M.K.; Investigation, S.S.; Resources, S.S. and J.W.; Data curation, J.W.; Writing—original draft preparation, S.S. and J.W.; Writing—review and editing, S.S. and J.W.; Supervision, S.S. All authors have read and agreed to the published version of the manuscript.

Funding

This research received no external funding.

Data Availability Statement

Dataset available on request from the authors.

Conflicts of Interest

The authors declare no conflicts of interest.

Appendix A

All results presented in the article, except explicitly indicated as TMY-2000, were obtained under the assumption that the AHU operated according to TMY-2022 climate data. Table 4 also contains the results based on TMY-2022. The comparison between trends in energy consumption in relation to climate change was made based on the climate data from TMY-2000, which is presented in Table A1.
In the main content of the article, the figures are presented and described, showing the most important issues. Repeated elements are not placed twice, and as a result, not all algorithms have four corresponding graphs. For that reason, the absent graphs are placed in Figure A1, Figure A2, Figure A3, Figure A4, Figure A5, Figure A6 and Figure A7 in the Appendix A.
Figure A1. Air parameters during year-round operation of the AHU controlled by Algorithm No. 3.: (a) Temperature. (b) Relative humidity.
Sustainability 17 09912 g0a1
Figure A2. Air parameters during year-round operation of the AHU controlled by Algorithm No. 5.: (a) Temperature. (b) Relative humidity.
Sustainability 17 09912 g0a2
Table A1. Energy consumption per one year based on TMY-2000 climate data.
AlgorithmFanHeatingCoolingT. HoldRH. Hold
MWh GJ (MWh) GJ (MWh) % %
(1) CCA357.71755.8 (487.7)49.1 (13.6)63.597.4
(2) T control357.71763.9 (490.0)38.1 (10.6)96.679.8
(3) Recirc. control357.71763.9 (490.0)7.7 (2.2)96.678.2
(4) Standard125.71615.5 (448.7)16 (4.4)96.658.5
(5) Standard eco106.51573.7 (437.1)14 (3.9)96.648.3
(6) Standard low125.71615.5 (448.7)71.7 (19.9)96.660.9
(7) Standard freecool128.61615.5 (448.7)7.7 (2.2)96.658.5
(8) Standard+RH125.71662.3 (461.8)31 (8.6)96.697.8
Figure A3. Air parameters during year-round operation of the AHU controlled by Algorithm No. 6.: (a) Temperature. (b) Relative humidity.
Sustainability 17 09912 g0a3
Figure A4. Equipment efficiency and energy consumption under Algorithm No. 1 control as a function of outdoor air temperature: (a) Efficiency. (b) Energy.
Sustainability 17 09912 g0a4
Figure A5. Equipment efficiency and energy consumption under Algorithm No. 2 control as a function of outdoor air temperature: (a) Efficiency. (b) Energy.
Sustainability 17 09912 g0a5
Figure A6. Equipment efficiency and energy consumption under Algorithm No. 3 control as a function of outdoor air temperature: (a) Efficiency. (b) Energy.
Sustainability 17 09912 g0a6
Figure A7. Equipment efficiency and energy consumption under Algorithm No. 5 control as a function of outdoor air temperature: (a) Efficiency. (b) Energy.
Sustainability 17 09912 g0a7

References

  1. IPCC. Climate Change 2023: Synthesis Report. Contribution of Working Groups I, II and III to the Sixth Assessment Report of the Intergovernmental Panel on Climate Change. 2023. Available online: https://www.ipcc.ch/report/ar6/syr/ (accessed on 8 April 2025).
  2. IEA. Electricity Market Raport. 2022. Available online: https://www.iea.org/reports/electricity-market-report-july-2022 (accessed on 29 April 2025).
  3. Forster, P.M.; Smith, C.J.; Walsh, T.; Lamb, W.F.; Lamboll, R.; Hauser, M.; Ribes, A.; Rosen, D.; Gillett, N.; Palmer, M.D.; et al. Indicators of Global Climate Change 2022: Annual update of large-scale indicators of the state of the climate system and human influence. Earth Syst. Sci. Data 2023, 15, 2295–2327. [Google Scholar] [CrossRef]
  4. European Commission. Report from the Commission to the European Parliament, the Council, the European Economic and Social Committee and the Committee of the Regions, State of the Energy Union 2021—Contributing to the European Green Deal and the Union’s Recovery. Pursuant to Regulation (EU) 2018/1999 on the Governance of the Energy Union and Climate Action; Technical Report; Publications Office of the European Union: Brussels, Belgium, 2021. [Google Scholar]
  5. United Nations Environment Programme. Global Status Report for Buildings and Construction: Beyond Foundations: Mainstreaming Sustainable Solutions to Cut Emissions from the Buildings Sector; Technical Report; United Nations Environment Programme (UNEP) and Global Alliance for Buildings and Construction (GlobalABC): Nairobi, Kenya, 2024. [Google Scholar] [CrossRef]
  6. Jol, A.; Füssel, H.M.; Isoard, S.; Kurnik, B.; Hildén, M.; Marx, A.; Reker, J.; Vanneuville, W.; Kristensen, P.; Erhard, M.; et al. Climate Change, Impacts and Vulnerability in Europe 2016 an Indicator-Based Report; Technical Report; Publications Office of the European Union: Luxembourg, 2017. [Google Scholar]
  7. Doherty, R.M.; Heal, M.R.; O’Connor, F.M. Climate change impacts on human health over Europe through its effect on air quality. Environ. Health 2017, 16, 33–44. [Google Scholar] [CrossRef]
  8. Thomson, H.; Simcock, N.; Bouzarovski, S.; Petrova, S. Energy poverty and indoor cooling: An overlooked issue in Europe. Energy Build. 2019, 196, 21–29. [Google Scholar] [CrossRef]
  9. Klepeis, N.; Nelson, W.; Ott, W.; Robinson, J.; Tsang, A.; Switzer, P.; Behar, J.; Hern, S.; Engelmann, W. The National Human Activity Pattern Survey (NHAPS): A resource for assessing exposure to environmental pollutants. J. Expo. Sci. Environ. Epidemiol. 2001, 11, 231–252. [Google Scholar] [CrossRef]
  10. WAZA. Committing to Conservation: The World Zoo and Aquarium Conservation Strategy. 2015. Available online: https://www.waza.org/wp-content/uploads/2019/03/WAZA-Conservation-Strategy-2015_Portrait.pdf (accessed on 29 April 2025).
  11. Cao, S.J.; Ren, C. Ventilation control strategy using low-dimensional linear ventilation models and artificial neural network. Build. Environ. 2018, 144, 316–333. [Google Scholar] [CrossRef]
  12. Yang, L.; Yan, H.; Lam, J.C. Thermal comfort and building energy consumption implications—A review. Appl. Energy 2014, 115, 164–173. [Google Scholar] [CrossRef]
  13. Kowalski, P.; Kwiecień, D. Evaluation of simple evaporative cooling systems in an industrial building in Poland. J. Build. Eng. 2020, 32, 101555. [Google Scholar] [CrossRef]
  14. De Angelis, A.; Saro, O.; Truant, M. Evaporative cooling systems to improve internal comfort in industrial buildings. Energy Procedia 2017, 126, 313–320. [Google Scholar] [CrossRef]
  15. Elhadary, M.I.; Alzahrani, A.M.Y.; Aly, R.M.H.; Elboshy, B. A Comparative Study for Forced Ventilation Systems in Industrial Buildings to Improve the Workers’ Thermal Comfort. Sustainability 2021, 13, 10267. [Google Scholar] [CrossRef]
  16. Sayegh, M.A.; Danielewicz, J.; Nannou, T.; Miniewicz, M.; Jadwiszczak, P.; Piekarska, K.; Jouhara, H. Trends of European research and development in district heating technologies. Renew. Sustain. Energy Rev. 2017, 68, 1183–1192. [Google Scholar] [CrossRef]
  17. World Commission on Environment and Development. Our Common Future; Technical Report; Oxford University: New York, NY, USA, 1987.
  18. Petrie, M.D.; Bradford, J.B.; Lauenroth, W.K.; Schlaepfer, D.R.; Andrews, C.M.; Bell, D.M. Non-analog increases to air, surface, and belowground temperature extreme events due to climate change. Clim. Change 2020, 163, 2233–2256. [Google Scholar] [CrossRef]
  19. González-Torres, M.; Pérez-Lombard, L.; Coronel, J.F.; Maestre, I.R.; Yan, D. A review on buildings energy information: Trends, end-uses, fuels and drivers. Energy Rep. 2022, 8, 626–637. [Google Scholar] [CrossRef]
  20. Zoo, N. Building a Sustainable NEW Zoo. 2013. Available online: https://newzoo.org/wp-content/uploads/2013/08/building-a-sustainable-new-zoo.pdf (accessed on 29 April 2025).
  21. Siemann, M. Performance and Applications of Residential Building Energy Grey-Box Models. Ph.D. Thesis, University of Maryland, College Park, MD, USA, 2013. [Google Scholar]
  22. Sticklen, M. The Creation of a Sustainability Internship Guidebook for the Cincinnati Zoo and Botanical Garden. Ph.D. Thesis, Miami University, Oxford, OH, USA, 2015. [Google Scholar]
  23. Phuong, N.L.; Ito, K. Investigation of flow pattern in upper human airway including oral and nasal inhalation by PIV and CFD. Build. Environ. 2015, 94, 504–515. [Google Scholar] [CrossRef]
  24. Hesaraki, A.; Holmberg, S. Demand-controlled ventilation in new residential buildings: Consequences on indoor air quality and energy savings. Indoor Built Environ. 2015, 24, 162–173. [Google Scholar] [CrossRef]
  25. Canbay, C.S.; Hepbasli, A.; Gokcen, G. Evaluating performance indices of a shopping centre and implementing HVAC control principles to minimize energy usage. Energy Build. 2004, 36, 587–598. [Google Scholar] [CrossRef]
  26. Fang, X.; Gong, G.; Li, G.; Chun, L.; Peng, P.; Li, W.; Shi, X.; Chen, X. Deep reinforcement learning optimal control strategy for temperature setpoint real-time reset in multi-zone building HVAC system. Appl. Therm. Eng. 2022, 212, 118552. [Google Scholar] [CrossRef]
  27. Chen, Y.; Lin, G.; Crowe, E.; Granderson, J. Development of a Unified Taxonomy for HVAC System Faults. Energies 2021, 14, 5581. [Google Scholar] [CrossRef]
  28. De Masi, R.F.; Gigante, A.; Festa, V.; Ruggiero, S.; Vanoli, G.P. Effect of HVAC’s Management on Indoor Thermo-Hygrometric Comfort and Energy Balance: In Situ Assessments on a Real nZEB. Energies 2021, 14, 7187. [Google Scholar] [CrossRef]
  29. Ortiz, M.A.; Kurvers, S.R.; Bluyssen, P.M. A review of comfort, health, and energy use: Understanding daily energy use and wellbeing for the development of a new approach to study comfort. Energy Build. 2017, 152, 323–335. [Google Scholar] [CrossRef]
  30. Moon, J.W.; Han, S.H. Thermostat strategies impact on energy consumption in residential buildings. Energy Build. 2011, 43, 338–346. [Google Scholar] [CrossRef]
  31. Turley, C.; Jacoby, M.; Pavlak, G.; Henze, G. Development and Evaluation of Occupancy-Aware HVAC Control for Residential Building Energy Efficiency and Occupant Comfort. Energies 2020, 13, 5396. [Google Scholar] [CrossRef]
  32. Mor, G.; Cipriano, J.; Gabaldon, E.; Grillone, B.; Tur, M.; Chemisana, D. Data-Driven Virtual Replication of Thermostatically Controlled Domestic Heating Systems. Energies 2021, 14, 5430. [Google Scholar] [CrossRef]
  33. Ürge Vorsatz, D.; Khosla, R.; Bernhardt, R.; Chan, Y.C.; Vérez, D.; Hu, S.; Cabeza, L.F. Advances Toward a Net-Zero Global Building Sector. Annu. Rev. Environ. Resour. 2020, 45, 227–269. [Google Scholar] [CrossRef]
  34. Vérez, D.; Cabeza, L.F. Which Building Services Are Considered to Have Impact on Climate Change? Energies 2021, 14, 3917. [Google Scholar] [CrossRef]
  35. Zhang, R.; Hong, T. Modeling of HVAC operational faults in building performance simulation. Appl. Energy 2017, 202, 178–188. [Google Scholar] [CrossRef]
  36. Michailidis, I.T.; Schild, T.; Sangi, R.; Michailidis, P.; Korkas, C.; Fütterer, J.; Müller, D.; Kosmatopoulos, E.B. Energy-efficient HVAC management using cooperative, self-trained, control agents: A real-life German building case study. Appl. Energy 2018, 211, 113–125. [Google Scholar] [CrossRef]
  37. Marta, M.; Belinda, L.M. Simplified model to determine the energy demand of existing buildings. Case study of social housing in Zaragoza, Spain. Energy Build. 2017, 149, 483–493. [Google Scholar] [CrossRef]
  38. Sugarman, S.C. HVAC Fundamentals, 3rd ed.; River Publishers: Roma, Italy, 2016. [Google Scholar]
  39. Lumbreras, M.; Garay-Martinez, R.; Arregi, B.; Martin-Escudero, K.; Diarce, G.; Raud, M.; Hagu, I. Data driven model for heat load prediction in buildings connected to District Heating by using smart heat meters. Energy 2022, 239, 122318. [Google Scholar] [CrossRef]
  40. Hao, Z.; Xie, J.; Zhang, X.; Liu, J. Simplified Model of Heat Load Prediction and Its Application in Estimation of Building Envelope Thermal Performance. Buildings 2023, 13, 1076. [Google Scholar] [CrossRef]
  41. Zeller, M. Zellers Handbuch Klimatisierung; Zeller Consulting Suisse: Ittigen, Switzerland, 1997. [Google Scholar]
  42. Pełech, A. Wentylacja i Klimatyzacja—Podstawy; Oficyna Wydawnicza Politechniki Wrocławskiej: Wrocław, Poland, 2008. [Google Scholar]
  43. Przydróżny, S.; Ferencowicz, J. Klimatyzacja; Wydawnictwo Politechniki Wrocławskiej: Wrocław, Poland, 1988. [Google Scholar]
  44. Narowski, P. Typical Meteorological Year for Poland Based on Meteorological and Climatic Data from the Year 2000 to 2022. 2022. Available online: http://fizyka-budowli.pl/projekt-tlm2000/projekt-tlm2000-download/ (accessed on 13 January 2025).
  45. i Klimat, P. Historyczne Dane Pomiarowe—Dane Meteorologiczne. Available online: https://meteomodel.pl/dane/historyczne-dane-pomiarowe/ (accessed on 13 January 2025).
  46. Zawada, B. Układy Sterowania w Systemach Wentylacji i Klimatyzacji; Wydanie, I., Ed.; Oficyna Wydawnicza Politechniki Warszawskiej: Warszawa, Poland, 2006. [Google Scholar]
  47. Zhao, T.; Hua, P.; Dai, W.; Zhang, J.; Ma, L. An optimal control method for discrete variable outdoor air volume setpoint determination in variable air volume systems. Build. Environ. 2020, 167, 106444. [Google Scholar] [CrossRef]
  48. ASHRAE. 90.1 User’s Manual; ASHRAE: Atlanta, GA, USA, 2004; ISBN 1-931862-63-x. [Google Scholar]
  49. ASHRAE. High Performance Sequences of Operation for HVAC Systems; Guideline 36p; ASHRAE: Atlanta, GA, USA, 2015. [Google Scholar]
  50. ASHRAE. ASHRAE Handbook—HVAC Applications; ASHRAE: Atlanta, GA, USA, 2011. [Google Scholar]
  51. Resources, E.D. The Advanced Variable Air Volume (VAV) System Design Guide; Technical Report; Pacific Gas and Electric Company: Fair Oaks, CA, USA, 2009. [Google Scholar]
  52. Phalak, K.; Wang, G. Minimum Outdoor Air Control and Building Pressurization with Lack of Airflow and Pressure Sensors in Air-Handling Units. J. Archit. Eng. 2016, 22, 04015017. [Google Scholar] [CrossRef]
  53. Cohen, T. Providing constant ventilation in variable air volume systems. ASHRAE J. 1994, 36, 38–40. [Google Scholar]
  54. Felker, L. Minimum Outside Air Damper Control. ASHRAE J. 2002, 44, 30–36. [Google Scholar]
  55. Grondzik, W. Air-Conditioning System Design Manual, 2nd ed.; ASHRAE Press: Atlanta, GA, USA, 2007. [Google Scholar]
  56. Hoyt, T.; Lee, K.H.; Zhang, H. Energy savings from extended air temperature setpoints and reductions in room air mixing. UC Berkeley Cent. Built Environ. 2005. Available online: https://api.semanticscholar.org/CorpusID:107651529 (accessed on 13 January 2025).
  57. Hoyt, T.; Arens, E.; Zhang, H. Extending air temperature setpoints: Simulated energy savings and design considerations for new and retrofit buildings. Build. Environ. 2015, 88, 89–96. [Google Scholar] [CrossRef]
  58. Cao, S.J.; Deng, H.Y. Investigation of temperature regulation effects on indoor thermal comfort, air quality, and energy savings toward green residential buildings. Sci. Technol. Built Environ. 2019, 25, 309–321. [Google Scholar] [CrossRef]
  59. Dharmasena, P.; Nassif, N. Development and Optimization of a Novel Damper Control Strategy Integrating DCV and Duct Static Pressure Setpoint Reset for Energy-Efficient VAV Systems. Buildings 2025, 15, 518. [Google Scholar] [CrossRef]
  60. Yu, K.T.; Su, C.L.; Kuo, J.L. Variable recycled air controls of HVAC systems for energy savings in high-tech industries. In Proceedings of the 2016 IEEE International Conference on Industrial Technology (ICIT), Taipei, Taiwan, 14–17 March 2016; pp. 215–220. [Google Scholar] [CrossRef]
  61. Li, B.; Wild, P.; Rowe, A. Free cooling potential of air economizer in residential houses in Canada. Build. Environ. 2020, 167, 106460. [Google Scholar] [CrossRef]
  62. Ke, Y.; Mumma, S. Optimized supply-air temperature (SAT) in variable-air-volume (VAV) systems. Energy 1997, 22, 601–614. [Google Scholar] [CrossRef]
  63. Engdahl, F.; Johansson, D. Optimal supply air temperature with respect to energy use in a variable air volume system. Energy Build. 2004, 36, 205–218. [Google Scholar] [CrossRef]
  64. Ferdyn-Grygierek, J. Indoor environment quality in the museum building and its effect on heating and cooling demand. Energy Build. 2014, 85, 32–44. [Google Scholar] [CrossRef]
  65. Neuhaus, E.; Pernot, C.; Schellen, H. Displacement ventilation in the museum environment: A case study. In Proceedings of the Clima World Congress Sustainable Energy Use in Buildings, Lausanne, Switzerland, 9–12 October 2006. [Google Scholar]
  66. Rismanchi, B.; Zambrano, J.M.; Saxby, B.; Tuck, R.; Stenning, M. Control Strategies in Multi-Zone Air Conditioning Systems. Energies 2019, 12, 347. [Google Scholar] [CrossRef]
  67. Kalaiselvam, S.; Vidhya, S.V.; Iniyan, S.; Samuel, A.A. Comparative Energy Analysis of a Constant Air Volume (CAV) System and a Variable Air Volume (VAV) System for a Software Laboratory. Int. J. Vent. 2006, 5, 229–237. [Google Scholar] [CrossRef]
  68. Sørensen, B.R. Applications and Energy Consumption of Demand Controlled Ventilation Systems: Modelling, Simulation and Implementation of Modular Builtdynamical VAV Systems and Control Strategies. Ph.D. Thesis, Norges Teknisk-Naturvitenskapelige Universitet, Trondheim, Norway, 2002. [Google Scholar]
  69. Anand, P.; Sekhar, C.; Cheong, D.K.W.; Santamouris, M.; Kondepudi, S. Occupancy-based zone-level VAV system control implications on thermal comfort, ventilation, indoor air quality and building energy efficiency. Energy Build. 2019, 204, 109473. [Google Scholar] [CrossRef]
  70. Lu, D.B.; Warsinger, D.M. Energy savings of retrofitting residential buildings with variable air volume systems across different climates. J. Build. Eng. 2020, 30, 101223. [Google Scholar] [CrossRef]
  71. Gao, J.; Xu, X.; Li, X.; Zhang, J.; Zhang, Y.; Wei, G. Model-based space temperature cascade control for constant air volume air-conditioning system. Build. Environ. 2018, 145, 308–318. [Google Scholar] [CrossRef]
  72. Morgan, S.; Krarti, M. Impact of electricity rate structures on energy cost savings of pre-cooling controls for office buildings. Build. Environ. 2007, 42, 2810–2818. [Google Scholar] [CrossRef]
  73. Chua, K.; Chou, S.; Yang, W.; Yan, J. Achieving better energy-efficient air conditioning—A review of technologies and strategies. Appl. Energy 2013, 104, 87–104. [Google Scholar] [CrossRef]
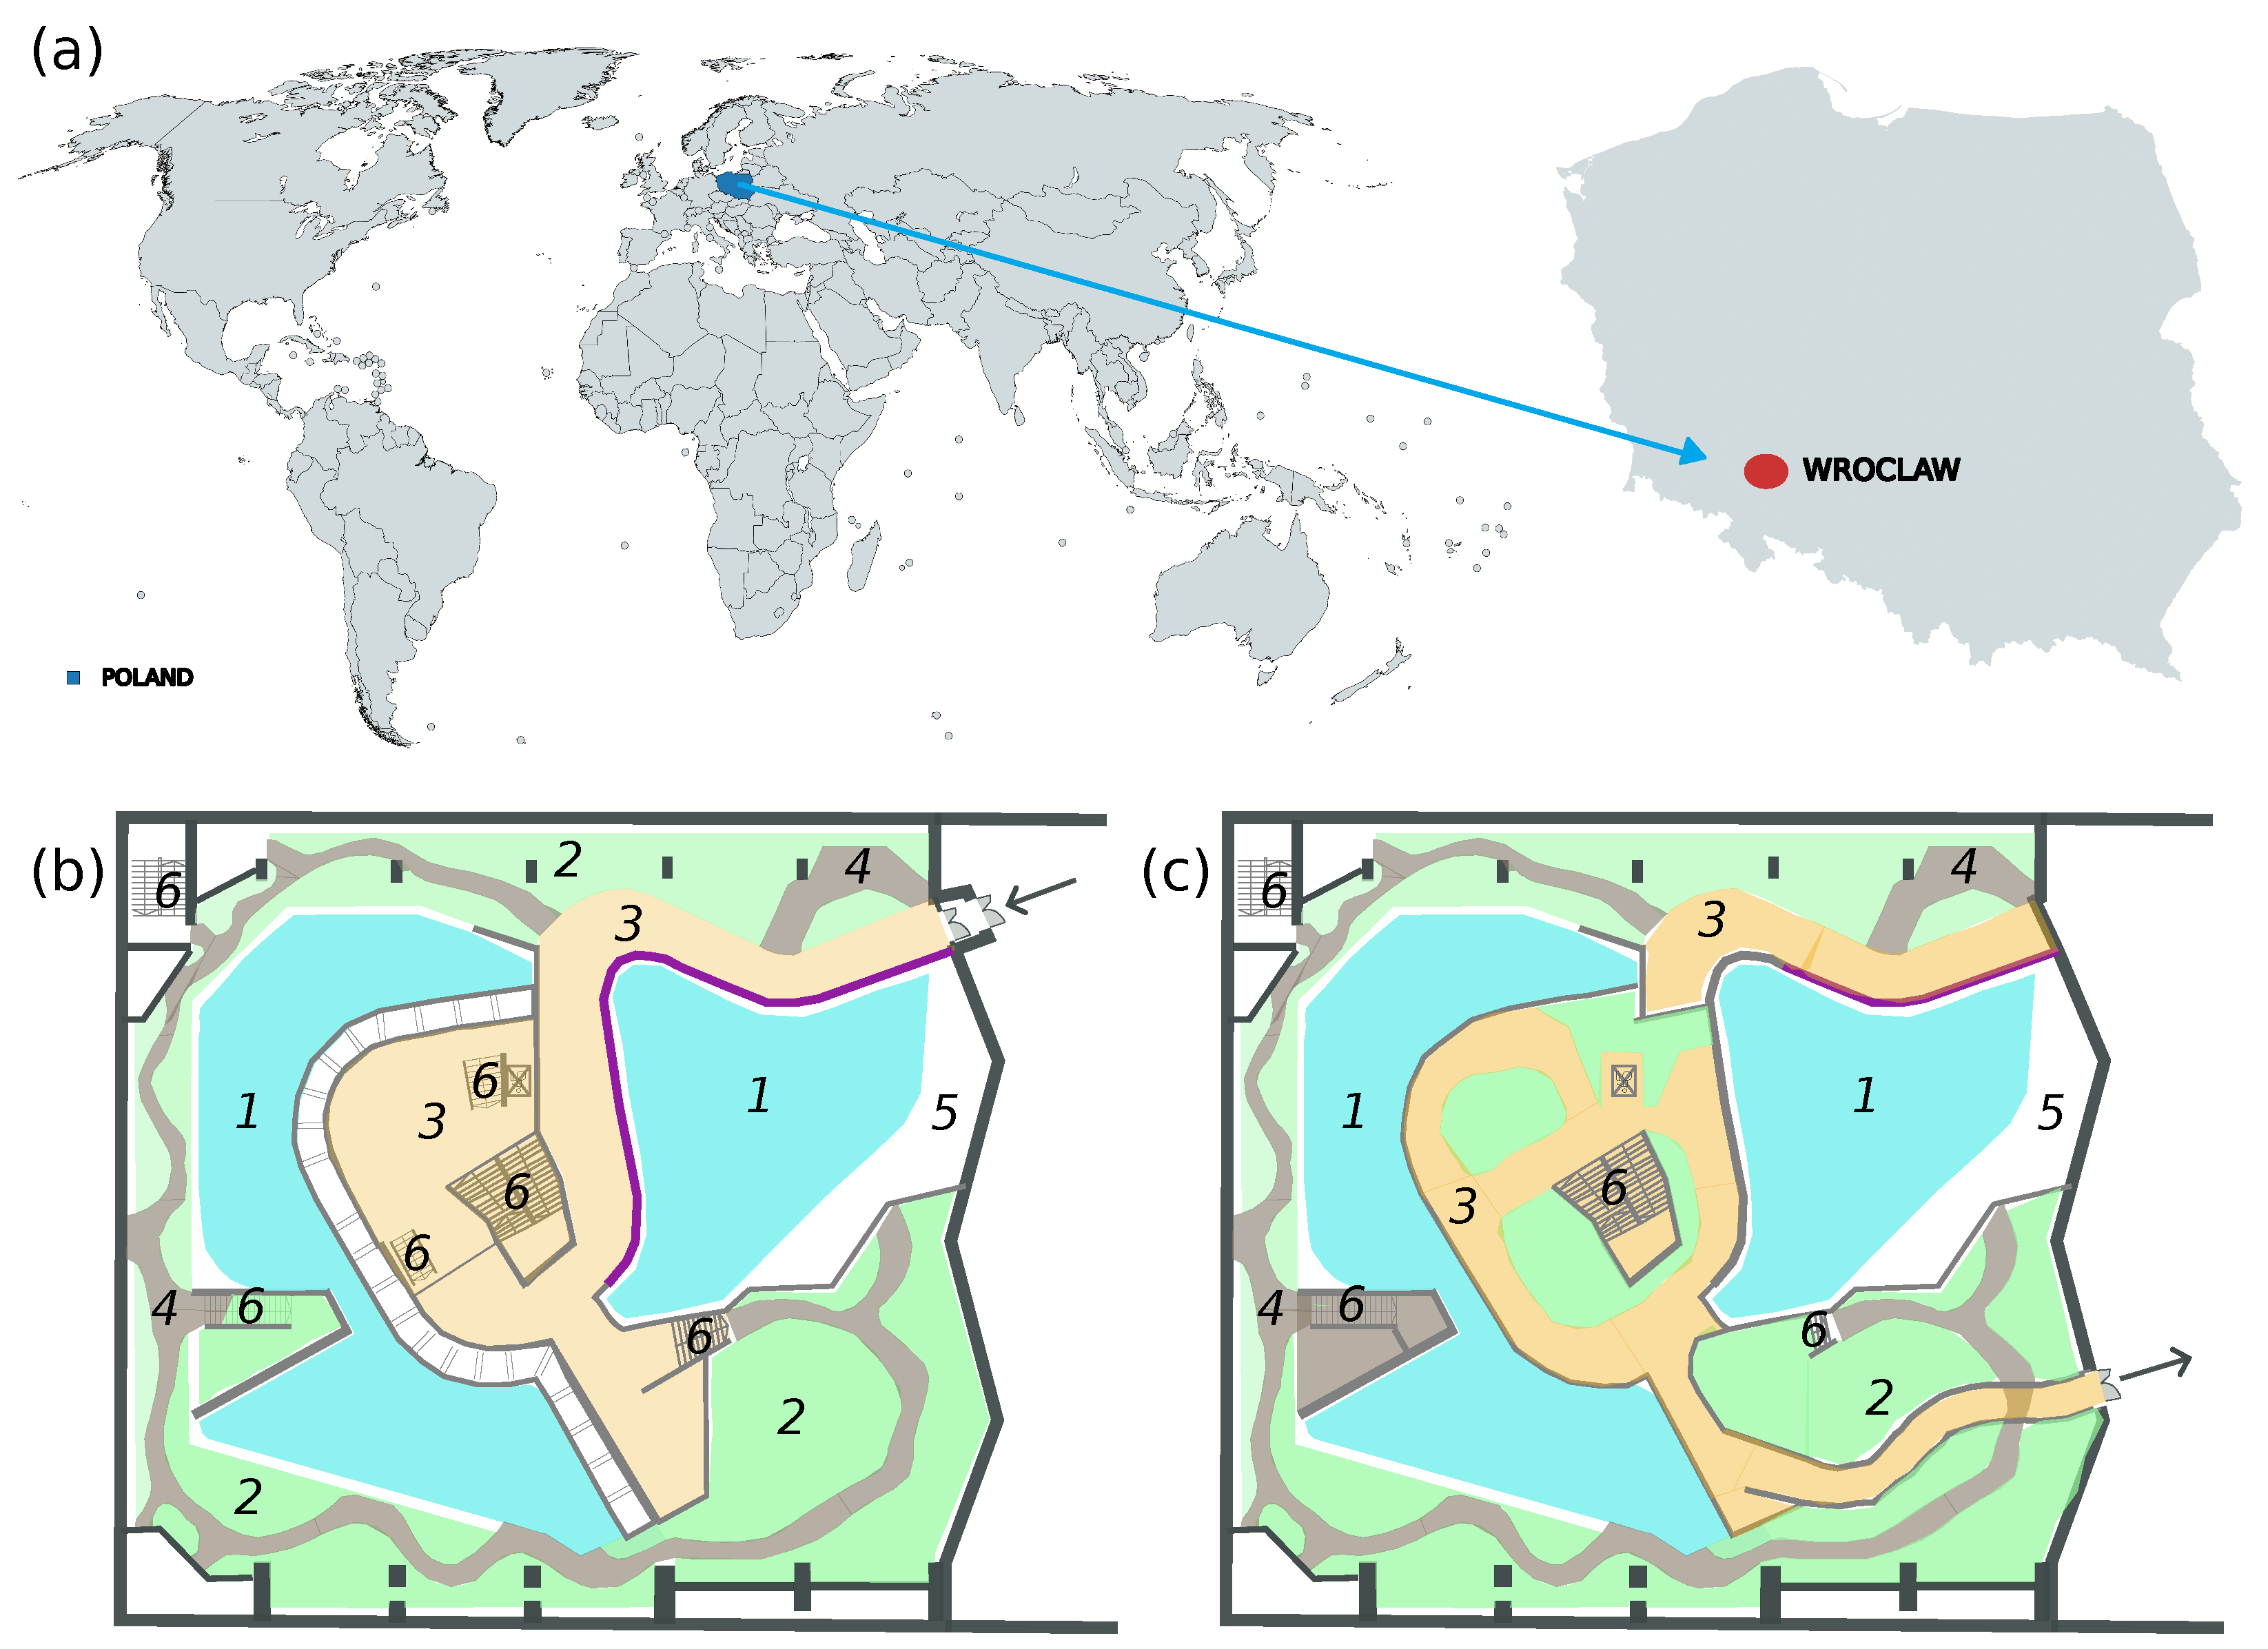
Figure 1. Location of Wrocław and floor plans of the analysed building: (a) location of Wrocław city; (b) first-floor plan; (c) second-floor plan. The numbered areas in the plans indicate the following: 1—water tanks with manatees, 2—plants area, 3—visitors area, 4—workers area, 5—alligators area, 6—stairs.
Sustainability 17 09912 g001
Figure 2. Pictures of research space.
Sustainability 17 09912 g002
Figure 3. Scheme of ventilation system which serves Congo zone. Abbreviation: OA—Outdoor Air, T—Temperature sensor, RH—Relative Humidity sensor, F—Air Filter, HRE—Heat Recovery Exchanger, R—Recirculation, H—Heating Coil, C—Cooling Coil, SF—Supply fan, EF—Extract fan, SUP—Supply Air, ETA—Extract Air, EA—Exhaust Air, GP—Glycol Pump, M—Motorised valve.
Sustainability 17 09912 g003
Figure 4. Methodological framework of the article.
Sustainability 17 09912 g004
Figure 5. The charts of the obtained from measurements of Africa Congo zone air system heat transfer depending on the outside air temperature. Air system sensible heat transfer during the (a) day and (b) night. Air system total heat transfer during the (c) day and (d) night.
Sustainability 17 09912 g005
Figure 6. Duration of outdoor air temperature for the TMY-2000 and TMY-2022 climatic datasets.
Sustainability 17 09912 g006
Figure 7. Air parameters during year-round operation of the AHU controlled by Algorithm No. 1.: (a) Temperature. (b) Relative humidity.
Sustainability 17 09912 g007
Figure 8. Air parameters during year-round operation of the AHU controlled by Algorithm No. 2.: (a) Temperature. (b) Relative humidity.
Sustainability 17 09912 g008
Figure 9. Air parameters during year-round operation of the AHU controlled by Algorithm No. 4.: (a) Temperature. (b) Relative humidity.
Sustainability 17 09912 g009
Figure 10. Air parameters during year-round operation of the AHU controlled by Algorithm No. 7.: (a) Temperature. (b) Relative humidity.
Sustainability 17 09912 g010
Figure 11. Air parameters during year-round operation of the AHU controlled by Algorithm No. 8.: (a) Temperature. (b) Relative humidity.
Sustainability 17 09912 g011
Figure 12. Equipment efficiency and energy consumption underAlgorithm No. 4 control as a function of outdoor air temperature: (a) Efficiency. (b) Energy.
Sustainability 17 09912 g012
Figure 13. Equipment efficiency and energy consumption under Algorithm No. 6 control as a function of outdoor air temperature: (a) Efficiency. (b) Energy.
Sustainability 17 09912 g013
Figure 14. Equipment efficiency and energy consumption under Algorithm No. 7 control as a function of outdoor air temperature: (a) Efficiency. (b) Energy.
Sustainability 17 09912 g014
Figure 15. Equipment efficiency and energy consumption under Algorithm No. 8 control as a function of outdoor air temperature: (a) Efficiency. (b) Energy.
Sustainability 17 09912 g015
Figure 16. Percentage change in annual energy demand relative to the baseline scenario: (a) Heating. (b) Cooling. (c) Air transport (fan).
Sustainability 17 09912 g016
Figure 17. Relative percentage change in energy demand for heating, cooling and air transport for climate data TMY-2000 and TMY-2022. Designations: i—type of air treatment or transport, E—energy required for heating, cooling or air transport.
Sustainability 17 09912 g017
Table 1. Technical data of sensors used in the work.
SensorMeasuring RangeAccuracyResolution
Air temperature−20 °C to +70 °C±0.5 °C ±0.03 %RH/K ±1 Digit0.1 °C
Relative humidity0 to 100 %RH±3 %RH (2 to
98 %RH) at +25 °C ± 0.03 %RH/K
±1 Digit
0.1 %RH
Differential pressure0 hPa to +200 hPa±(0.3 Pa + 1 % of mv 1) ± 1 Digit (0 to 25 hPa)0.1 hPa
1 mv—measured value
Table 2. Results obtained from statistical analysis of linear and nonlinear regression.
Air Heat Transferab t 0 R 2 p-Value ap-Value b t a t b
Sensible at night3.263 ± 0.026−39.005 ± 0.423-0.8620.000.00125.592.2
Sensible at day6.817 ± 0.060−100.043 ± 1.221-0.8160.000.00113.681.9
Total at night1.293 ± 0.3022.725 ± 0.06417.30.8510.000.004.2842.6
Total at day1.923 ± 0.244.587 ± 0.09117.30.8090.000.008.050.4
Table 3. Analysed control algorithms.
AlgorithmIndoor AirSupply AirRecirculationAirflow
(1) CCAno control27 °C (day)66%100% (day)
24 °C (night) 70% (night)
(2) T control23–32 °Cmin 25 °C for cooling66%100% (day)
max 30 °C for heating 70% (night)
(3) Recirc. control23–32 °Cmin 25 °C for cooling0–66%100% (day)
max 30 °C for heating 70% (night)
(4) Standard23–32 °Cmin 25 °C for cooling0–66%50–100%
max 30 °C for heating
(5) Standard eco22–33 °Cmin 25 °C for cooling0–66%50–100%
max 30 °C for heating
(6) Standard low23–32 °Cmin 25 °C for cooling66%50–100%
max 30 °C for heating
(7) Standard freecool23–32 °Cmin 25 °C for cooling0–66%50–100%
max 30 °C for heating
(8) Standard+RH23–32 °Cmin 25 °C for cooling0–66%50–100%
max 30 °C for heating
Table 4. Energy consumption per one year based on the TMY-2022 climate data and assessment of each system’s ability to maintain the required indoor air temperature and relative humidity conditions.
AlgorithmFanHeatingCoolingT. HoldRH. Hold
MWh GJ (MWh) GJ (MWh) % %
(1) CCA357.71524.7 (423.5)72.3 (20.1)71.798.4
(2) T control357.71521.7 (422.7)54.1 (15.0)97.979.3
(3) Recirc. control357.71521.7 (422.7)14.6 (4.0)97.977.2
(4) Standard109.31375.4 (382.1)25.7 (7.1)98.154.9
(5) Standard eco92.71337.7 (371.6)22.6 (6.3)98.144.5
(6) Standard low109.31375.4 (382.1)98.4 (27.3)98.157.8
(7) Standard freecool113.31375.4 (382.1)14.6 (4.0)98.154.9
(8) Standard+RH109.31430 (397.2)40.8 (11.3)98.198.9
Disclaimer/Publisher’s Note: The statements, opinions and data contained in all publications are solely those of the individual author(s) and contributor(s) and not of MDPI and/or the editor(s). MDPI and/or the editor(s) disclaim responsibility for any injury to people or property resulting from any ideas, methods, instructions or products referred to in the content.