Abstract
This study investigates the effectiveness of climate-adaptive pedestrian design through greening strategies by integrating microclimate simulations in central Seoul. Utilizing ENVI-met 5.0, five pedestrian street typologies along the “Cultural Complex Axis” in central Seoul were analyzed for their thermal environments before and after greening interventions. Results indicate that pedestrian greening improves thermal comfort across all sites, though cooling effects vary significantly with site-specific urban morphology and microclimatic factors such as wind flow. Notably, Hyehwa-ro exhibited the greatest reduction in Physiological Equivalent Temperature (PET) despite a modest increase in greenery, underscoring that cooling efficiency depends on more than vegetation quantity alone. Conversely, Jangchungdan-ro, with greater green coverage, observed diminished thermal improvements, which were mainly attributed to reduced wind velocity. The findings emphasize the need for context-sensitive, tailored greening approaches that particularly emphasize securing wind corridors and avoiding dense planting in narrow urban canyons to maximize cooling impacts. This study contributes by providing insights into both the research process and its outcomes through the exploration of thermal comfort simulations applied to a practical pedestrian renovation case.
1. Introduction
According to the “Climate Change Analysis Report of South Korea over 109 Years (1912–2020)”, the average temperature in South Korea has steadily increased by 0.2 °C every decade over the past 109 years. As a result, the average temperature rose from 12 °C during the 1910s (1912–2010) to 13.9 °C in the 2010s (2011–2020), an increase of approximately 1.9 °C. Compared to the global average temperature increase of 1.09 °C from the pre-industrial period (1850–1900) to the 2010s, it is evident that the temperature rise in South Korea exceeds the global average. Seoul, a densely populated city in South Korea, recorded an average temperature of 13.0 °C in the last decade (2011–2020), which is a rise of 2.3 °C compared to the previous decade (1911–1920). This increase is higher than both the global average rise of 1.09 °C and South Korea’s average increase of 1.9 °C. Moreover, the frequency of extreme climate events such as heatwaves and tropical nights has also been increasing recently; in 2005, there were 6 days of heatwaves and 11 tropical nights, while in 2018, these numbers surged to 35 days and 29 nights, respectively.
To address these climate changes, the city of Seoul has established a comprehensive plan for “Green Transportation Zone within the Four Great Gates of Seoul”. This plan includes various initiatives aimed at reducing greenhouse gas emissions, such as restrictions on vehicle idling, emissions testing, support for eco-friendly vehicles, the Eco-Mileage program, and the operation of green transportation zones. The Green Transportation Zone encompasses the area within the Hanyang Fortress, including the four gates of Sujkungmun, Donuimun, Sungnyemun, and Heunginjimun. The plan aims to create a “people-first, safe, and pleasant urban environment” without the use of private vehicles. By 2030, Seoul intends to reduce private vehicle traffic by 30% compared to 2017 and to more than double the space allocated for green transportation options, including walking, cycling, and public transit. Furthermore, there is a robust enforcement of restrictions on the operation of vehicles classified as grade 5 in terms of emissions, showcasing proactive efforts to mitigate climate change.
This study examines the effectiveness of climate-adaptive pedestrian design through greening strategies by integrating microclimate simulations in central Seoul. Using ENVI-met 5.0 version, five pedestrian street typologies along one of the major axes in the city downtown were analyzed to assess thermal conditions before and after greening interventions. This research contributes to the design of pedestrian streets in dense urban areas by testing a range of practical, scalable greening strategies—such as road reduce, incentive-based public open spaces, rooftop and wall greening, and the integration of existing waterways—within real-world renovation contexts. Through iterative design and simulation processes, the study offers a framework for balancing greenery with wind flow, providing actionable insights for improving outdoor thermal comfort in compact city environments. By incorporating microclimate simulations into the early stages of urban design, this research underscores the potential for more informed and spatially responsive planning decisions.
2. Literature Review
2.1. Climate-Adaptive Urban Regeneration
Given the spatial constraints inherent in densely populated cities, well-connected green infrastructure (GI) and the regeneration of existing urban grey spaces with nature-based solutions (NBS) become critical [1]. Numerous studies have emphasized the significance of NBS and GI in reducing heatwave mortality, enhancing human thermal comfort, and mitigating climate change effects in urban areas [2,3,4]. The declining urban regeneration sites have been recognized as highly vulnerable to climate change [5,6,7,8]. To address this, research focusing on urban regeneration aimed at supporting safer and more climate-friendly mobility is needed [9]. In this context, Valente et al. (2021) proposed a process of evaluating and designing the regeneration of surrounding urban corridors as a green infrastructure network [10], while Nardino et al. (2021) conducted modeling research for urban services and regeneration by conducting microclimate classification [11].
Street trees are a notable component of urban green spaces, and are often viewed as valuable natural resources that enhance the liveability of cities [12,13,14,15]. In this regard, numerous analyses have been conducted on the impact of urban form and structure, such as changes in tree and building heights [16,17], variations in types of roadside greenery [18], and aspect ratios of street canyons [19], in relation to reducing fine dust along roadsides.
Based on the literature review, we focused on applying scientific knowledge to dense urban pedestrian design by integrating thermal comfort simulations. While numerous studies have been conducted through scientific experiments, there is still a lack of research that simulates the application of green space design in complex regeneration projects, where existing conditions are often highly complicated to deal with [20]. In this study, we explored a simulation-integrated pedestrian renovation design process and highlighted its potential as well as its limitations.
2.2. Adaptive Design Parameters for Pedestrian Thermal Comfort in Urban Microclimates
Pedestrian-level microclimates within urban environments are strongly influenced by both urban morphology and landscape context. Key urban design parameters affecting outdoor thermal comfort are generally categorized into two groups: urban geometry and urban landscape elements. Urban geometry—defined by the spatial arrangement of streets, open spaces, and building massing—modulates microclimatic conditions by altering patterns of solar access, shading, and heat retention. In contrast, non-geometrical landscape elements such as vegetation and water features significantly impact surface temperatures and humidity through evapotranspiration and shading [21].
Among these factors, solar radiation is widely recognized as the most influential determinant of thermal conditions at street level. Numerous studies have analyzed the impact of urban geometry, particularly street canyon orientation and aspect ratio (height-to-width ratio), on thermal comfort across diverse climatic zones [22,23,24,25,26]. The role of aspect ratio is also significant, as higher ratios enhance shading during the day, reducing surface and air temperatures [27]. This pattern correlates with the sky view factor (SVF), a metric representing the portion of visible sky from ground level, which has been used to quantify solar and radiative exposure [28,29].
Wind flow is another critical variable in the thermal comfort equation. Urban geometry dictates wind patterns, with street canyon orientation relative to prevailing winds (parallel, perpendicular, or oblique) influencing wind speed at the pedestrian level [30]. Furthermore, studies have shown a positive relationship between SVF and wind speed—open urban forms allow higher wind penetration, while compact forms suppress it [31,32]. However, compactness may offer thermal benefits via increased shading, which can outweigh the negative impact of reduced airflow.
Urban landscape elements, such as vegetation and water bodies, also play a substantial role in moderating urban thermal environments. Trees reduce incoming solar radiation and can alter local wind flow [33]. Tree shading and evapotranspiration significantly reduce both air and surface temperatures in summer, particularly in E–W streets with low aspect ratios—typically the most heat-exposed configurations [34]. Additional landscape-based cooling strategies include green roofs, which have shown localized cooling effects at the pedestrian level in buildings under 10 m tall [35] and high-albedo materials, pervious pavements, and open water features, all of which enhance thermal comfort by reducing surface heat absorption and promoting evaporative cooling [23].
In summary, literature underscores the critical influence of both urban geometry and landscape elements on pedestrian-level thermal comfort in urban environments. While urban form determines patterns of solar exposure, shading, and wind flow, landscape features like vegetation and water bodies offer substantial cooling effects through shading and evapotranspiration, highlighting the need for an integrated approach in climate-responsive urban design.
3. Methodology
3.1. Study Area
Toward achieving a climate-adaptive, carbon-neutral city regeneration, the Seoul city government is transforming the traditional city center, defined by the old city wall boundary, into a “greened, ecological downtown.” (2040 Seoul City Basic Planning Report, https://urban.seoul.go.kr/view/html/PMNU3030000001, accessed on 24 March 2022). This government plan emphasizes green transportation and urban public area design, specifically aiming to reduce vehicular roads and traffic while expanding green and pedestrian spaces. Within this ecological downtown plan, four major routes have been designated along the heavily trafficked roads running north-south through Seoul’s city center. These routes have been themed according to their surrounding land uses, historical assets, and landmark buildings; the “National Central Axis” centered on Gwanghwamun to City Hall, the “Historical and Cultural Tourism Axis” centered on Insadong to Myeongdong, the “North-South Green Axis” centered on the Sewoon District, and the “Complex Cultural Axis” centered on the Dongdaemun Design Plaza (DDP), along with a “Global Industrial Axis” that runs east-west, making a total of 4 + 1 axes (Figure 1).
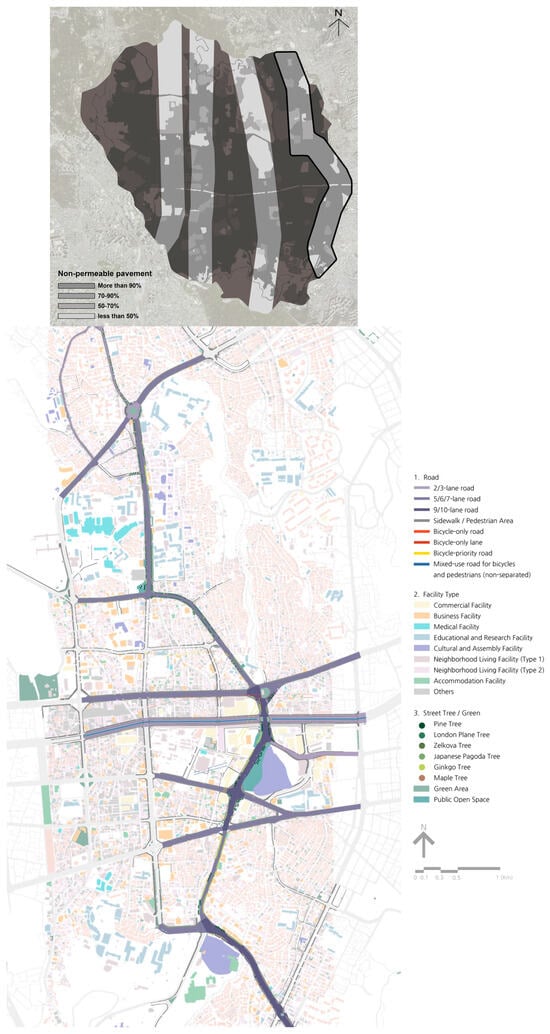
Figure 1.
Four themed way developments in the central district, Seoul, South Korea.
Among these four routes, the Gwanghwamun Square, as part of the National Central Axis, is undergoing extensive reconstruction, which includes widening the road on the east side to 7 to 9 lanes and removing the lanes on the west side to significantly enhance the square. The percentage of impervious surfaces is 16% for the National Central Axis, 20% for the Historical and Cultural Tourism Axis, 14% for the North-South Green Axis, and 50% for the Complex Cultural Axis. Based on an analysis of existing conditions (i.e., road lanes, green space, surrounding building heights, building functions, and impervious pavement percentage), we have selected the Complex Cultural Axis as our target area for transformation and experiment, as it has not yet begun development, has a relatively low green coverage, and a high percentage of impervious surfaces (Figure 1), suggesting significant potential for thermal condition improvements through diverse greening strategies. Additionally, a large portion of this area is designated as a redevelopment district, increasing the likelihood of significant changes in adjacent private lands, such as the addition of green spaces in front of buildings. The Complex Cultural Axis spans a total of 4 km, connecting Hyehwa-ro, Daehak-ro, Yulgok-ro, and Jangchungdan-ro. Contrary to its theme, there are no representative areas that showcase cultural characteristics, and while there are generally connected street trees, they consist mostly of a single tree species. However, there are usable public spaces and greenery available, with roads varying from 2 to 10 lanes. Depending on the designated land use, there are both low-rise and high-rise buildings, enabling a comprehensive investigation of various urban built form factors, and with its designation as a redevelopment area, plans have been established for changes in building forms or conversion into parks.
3.2. Research Flow
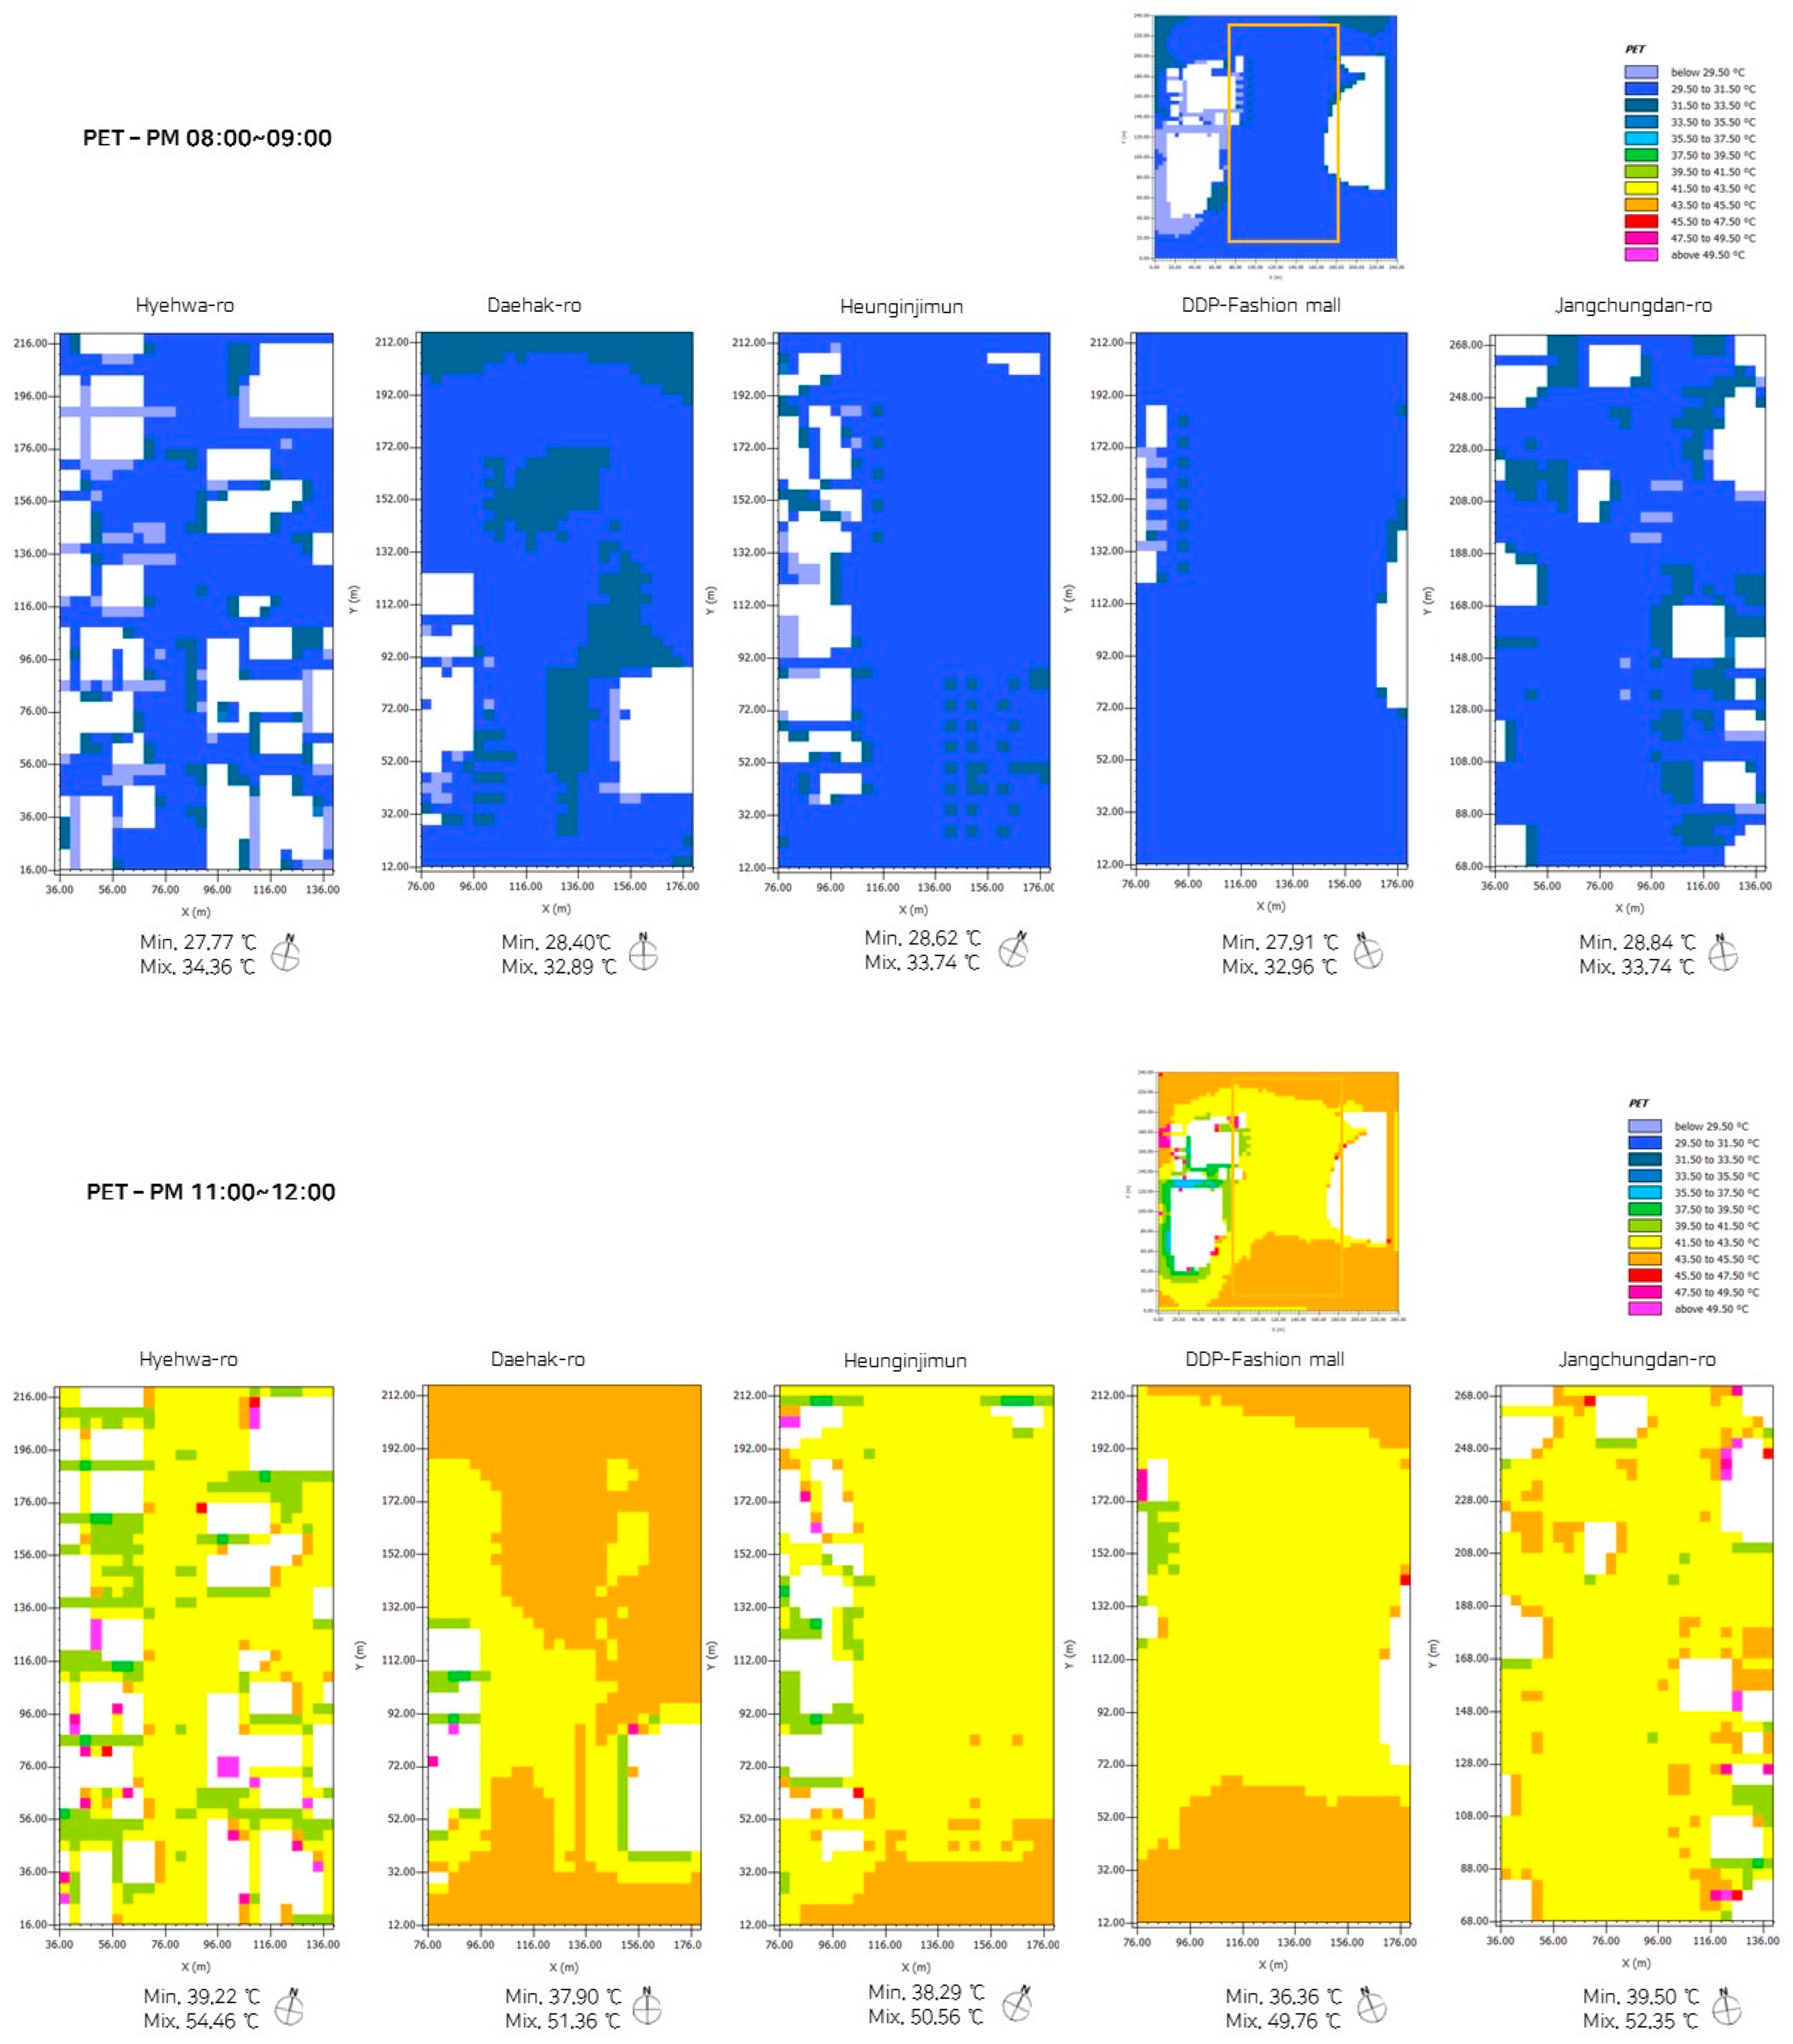
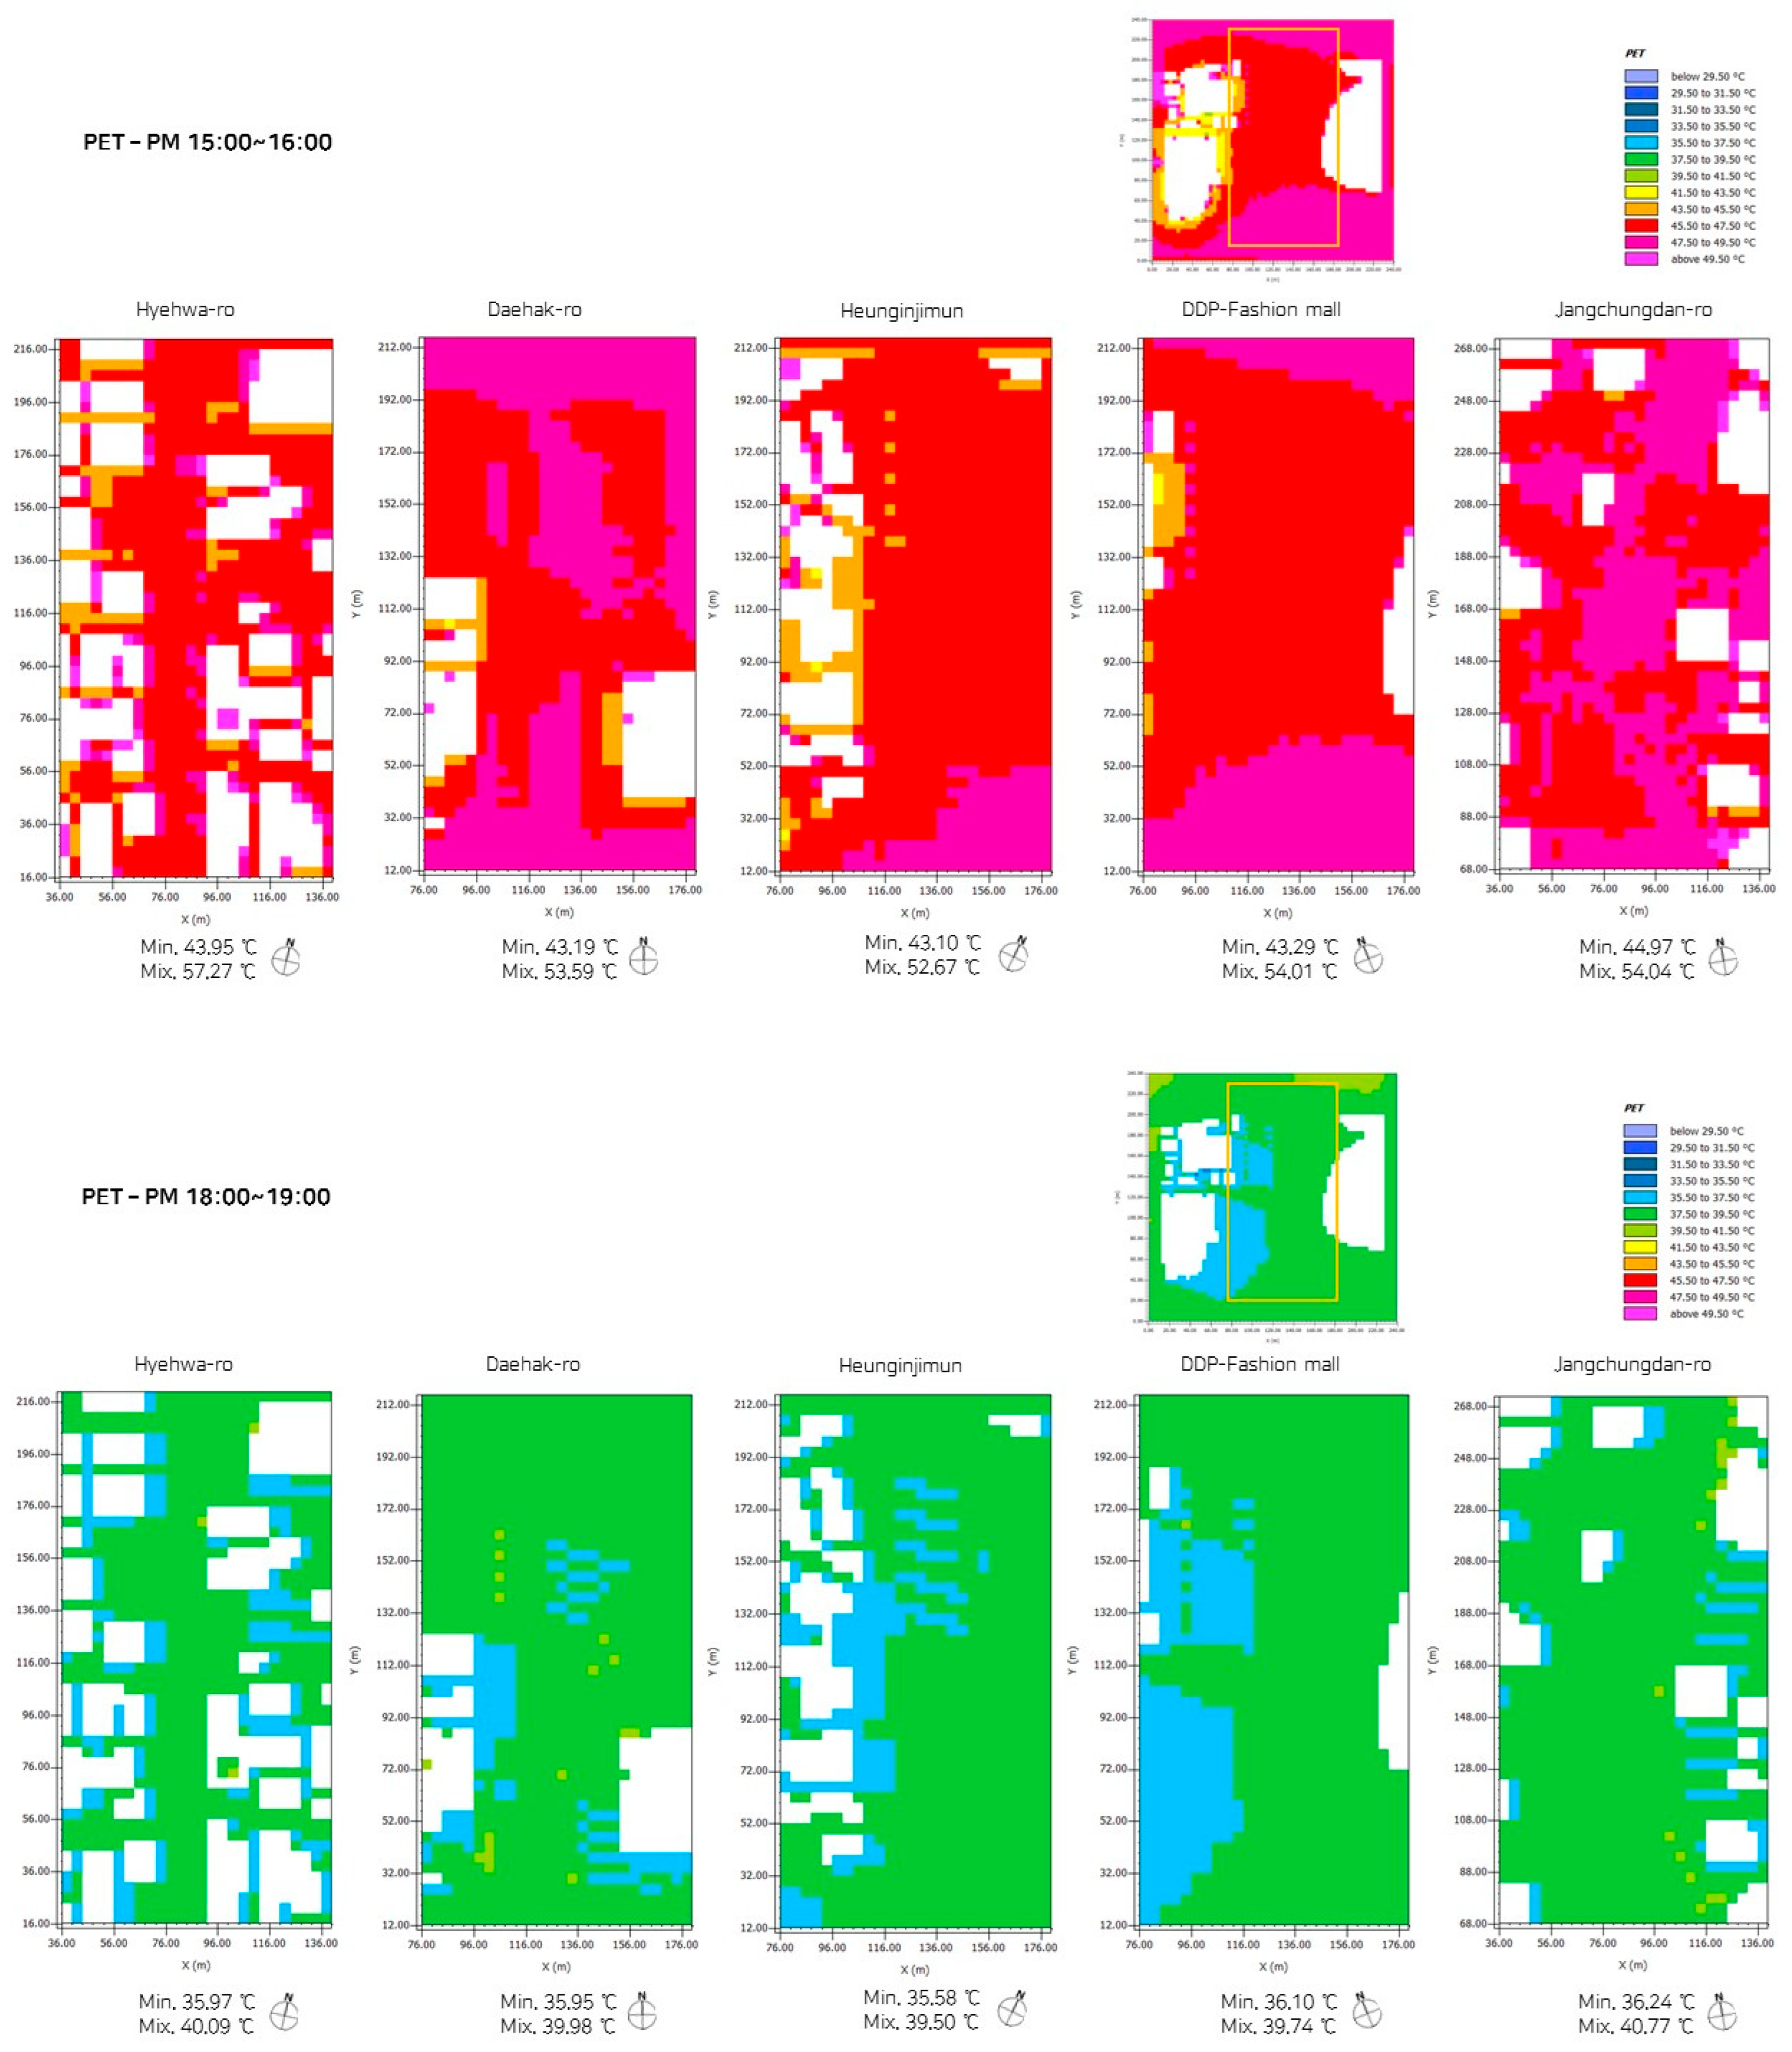
Based on a comprehensive literature review of thermal comfort factors ([21,22,23,24,25,26,27,28,29,30,31,32,33,34,35]), we identified key variables relevant to the urban pedestrian context. These variables include road width, surrounding building heights and density, adjacent green and open spaces, and street trees. We selected five different pedestrian sections along an axis, each characterized by distinct conditions regarding the studied parameters, potential design strategies focused on greening interventions, and themed open space programs based on adjacent land uses. Initially, we simulated the microclimate of the precondition of each section and evaluated the outdoor thermal comfort (OTC). Using the preliminary simulation results as a reference (see Appendix A), we developed specific site designs incorporating strategies such as road narrowing, greening interventions for surrounding buildings, expansion of green and open spaces, and the addition and rearrangement of street trees. The detailed greening designs for each section are described in the results section. We then simulated the post-design conditions of the sites, evaluated the OTC, and adjusted the site designs accordingly (Figure 2).
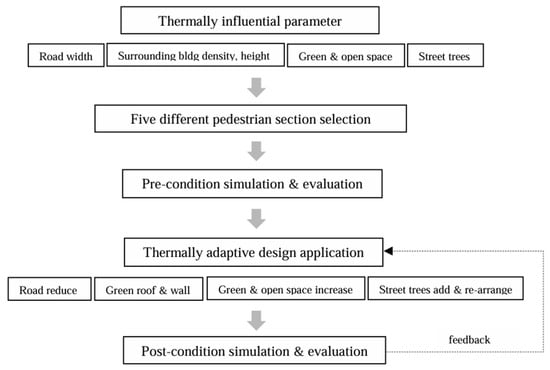
Figure 2.
OTC simulation-integrated pedestrian design procedure.
3.3. ENVI-Met Modeling for OTC Simulation
Figure 3 illustrates the three-dimensional modeling of the five pedestrian redesign plans, showcasing both the before and after conditions. It also includes an enlarged example of one section where various interventions were applied, such as road reduction, greening space expansion, the addition and rearrangement of street trees and plantings, and the implementation of green walls and roofs. To simulate existing vegetation, including major street trees (Platanus occidentalis L., Ginko biloba L., Zelkova serrata, Pinus densiflora) and shrubs (Euonymus alatus, Euonymus japonica), we conducted field measurements and collected data on their heights, crown dimensions, leaf types, and arrangements. Due to the limitations of the vegetation modeling library (Albero) in ENVI-met, based on existing trees, we adjusted tree sizes and forms using coding procedures in the L-system rules within the Albero tree settings.
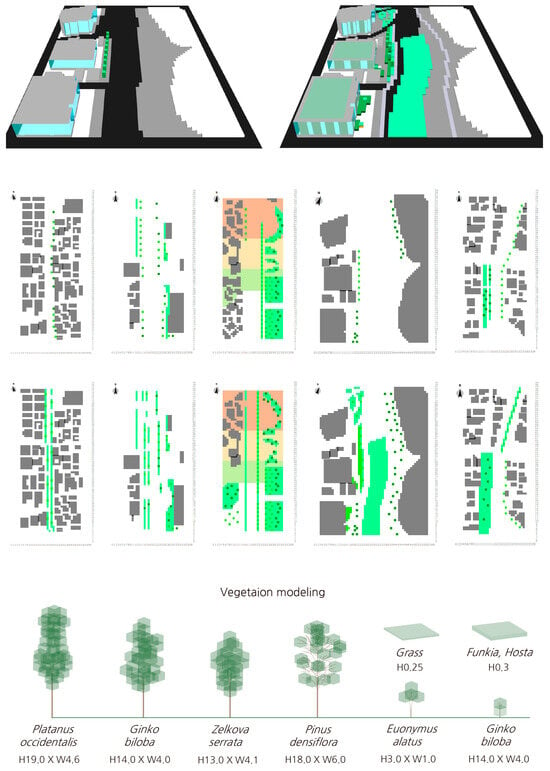
Figure 3.
Three-dimensional site and vegetation modeling in ENVI-met.
For the thermal comfort simulation, we utilized the ENVI-met 4.3.4 program. ENVI-met is a three-dimensional microclimate CFD-based model widely employed in microclimate simulation studies. Notably, over half of the vegetation thermal effect simulations have used ENVI-met, unlike other models, it excels in simulating surface–plant–air interactions (i.e., evapotranspiration), offering detailed vegetation representation with high resolution [36]. The accuracy of ENVI-met simulations has been validated under various conditions, and most research conducted in different urban contexts shows high agreement between simulation results and field measurements [37,38,39,40].
Table 1 shows the local climate data of the studied area found from a meteorological observatory, located at Seoul City University, 90 Jeonnong-dong, Dongdaemun-gu, Seoul, Republic of Korea, which is approximately 3.7 km distant from the study site. According to the collected data, July was identified as the hottest month of 2021, with an average air temperature of 28.1 °C. Over the past three years, the average temperatures recorded for July were 28.1 °C in 2021, 24.1 °C in 2020, and 25.9 °C in 2022. During this period, the average relative humidity fluctuated between 69% and 77%, while the average air velocity measured at 10 m above ground ranged from 1.8 to 2.4 m/s. For this research, the meteorological conditions observed during the hottest days, specifically 23–24 July 2021, were analyzed. For local climate data input, hourly data of air temperature, humidity, and wind velocity were utilized.

Table 1.
Initial atmospheric input and simulation configuration settings.
For built forms, most building materials were set as lightweight concrete. For roads and streets, asphalt and granite stone paving was used. For landscape elements, tree type, height, and density were described in Figure 3.
3.4. Thermal Comfort Evaluation
Several thermal comfort indices have been developed to quantify thermal stress. Initially tailored for specific climates, universal indices like the Standard Effective Temperature (SET), Physiological Equivalent Temperature (PET), and Universal Thermal Climate Index (UTCI) have emerged [41]. These indices generally utilize a two-node model to assess thermal comfort based on heat science principles. In contrast, the Predicted Mean Vote (PMV) employs a one-node model derived from thermal sensation data from over 1300 subjects (Fanger 1970) [42]. The Wet Bulb Globe Temperature (WBGT), designed for the U.S. Army, relies solely on environmental variables. While PMV and SET are suited for indoor settings, PET is primarily for outdoor use, allowing users to compare their thermal experiences in different environments [43,44]. UTCI combines advanced thermophysiological models and clothing considerations [45,46]. For our study, we chose PET due to its widespread applicability, proven accuracy, and positive correlations with field data, enhancing reliability [41,47]. Additionally, PET’s expression in degrees Celsius makes it accessible for urban planners and policymakers [48].
4. Results and Discussion
4.1. Precondition Simulation for Five Street Types
Before proceeding with the full design, buildings and trees that reflect the actual conditions for each street type at the target site were modeled and analyzed using ENVI-met, a microclimate simulation program. The simulation was conducted for a 24-h period on 23 July 2021, when a heat wave was recorded. The cell size used was 4 m × 4 m × 4 m (x, y, z), with a target area of 100 m × 200 m. Results were extracted for the period between 15:00 and 16:00, which was the hottest hour of the day.
- First Street Type: Hyehwa-ro
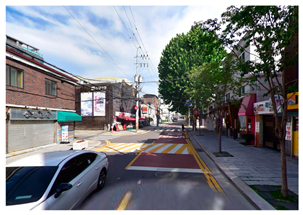
Hyehwa-ro features a two-lane road with low-rise buildings ranging from 3 to 20 m in height on both sides. Surrounding facilities include theaters, workshops, and café streets. The pavement composition consists of 20.9% asphalt, 67.9% concrete, 4.8% granite, 5.3% macadam, and 0.8% trees, with ginkgo and hybrid poplar planted. As a result of the simulation, wind flows between the buildings, but is blocked by trees and structures, resulting in an uncomfortable thermal sensation of 44.56 to 57.40 °C in pedestrian areas, making it the least pleasant among the five street types.
- Second Street Type: Daehak-ro
This street features a six-lane road with low to mid-rise buildings ranging from 15 to 45 m. It is densely surrounded by educational facilities such as Seoul National University’s Yeongon Campus, an elementary school, a girls’ middle school, and Seoul Open University. The pavement composition is 28.5% asphalt, 58.0% concrete, 18.6% granite, 12.7% blocks, 0.7% trees, and 0.2% ground cover. Ginkgo trees are predominant, with zelkova and ground cover found in Marronnier Park. As a result of the simulation, the wind flows along the six-lane road, and cool air spreads from the flower beds next to the school, with thermal comfort recorded at 43.19 to 54.33 °C.
- Third Street Type: Heunginjimun
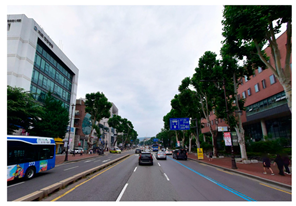
This street has a seven-lane road with low-rise buildings from 3 to 25 m on the left and Heunginjimun Park on the right. The pavement composition includes 25.9% asphalt, 36.6% concrete, 18.6% granite, 6.7% trees, 2.3% shrubs, and 9.9% ground cover. As a result of the simulation, the cool breeze from Heunginjimun Park flows along the road, resulting in a thermal comfort level of 43.10 to 52.67 °C, making it the coolest of the five street types.
- Fourth Street Type: Yulgok-ro (DDP)
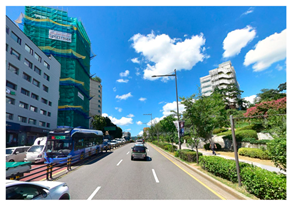
This street features a ten-lane road with high-rise shopping malls ranging from 45 to 60 m on the left, and Dongdaemun Design Plaza, a 9-m height building, on the right. The pavement composition consists of 37.0% asphalt, 16.5% concrete, 45.4% granite, and 1.1% trees along the road. As a result of the simulation, hot air from the wide asphalt road is blocked and circulated by the high-rise buildings. Consequently, thermal comfort ranges from 43.29 to 51.01 °C.
- Fifth Street Type: Jangchungdan-ro
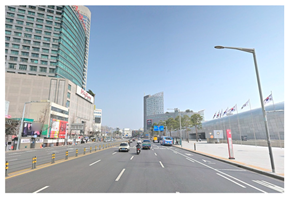
This street features a six-lane road with low to mid-rise buildings ranging from 3 to 30 m on both sides. To the left is the Namsoyeonggil Plaza, comprised of grass and trees. The area is famous for its many restaurants, attracting office workers who take lunch breaks in the plaza. The pavement composition is 37.5% asphalt, 51.4% concrete, 6.4% granite, 1.6% trees, and 3.2% ground cover. As a result of the simulation, wind flows along the road and between the buildings. Although it was expected that the temperature would be lower in the plaza, thermal comfort was generally recorded between 45.36 and 53.84 °C, making it the second hottest of the five street types.
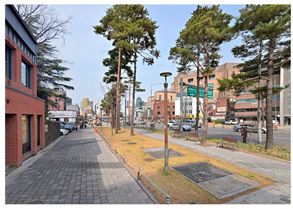
This analysis highlights considerations for design, such as the strategic placement of trees that do not obstruct wind, the selection of appropriate tree species, the utilization of cooling green spaces, the reduction of hot asphalt roads, and the expansion of pedestrian paths and greenery to facilitate cooler breezes, thereby lowering temperatures and enhancing thermal comfort. Notably, Heunginjimun Gate street demonstrated improved temperature and thermal comfort due to the presence of multi-layered vegetation in addition to the park. This will be considered in the design. Based on the analysis of the results, it is advisable to utilize the values from 1 to 2 pm, as this is when the boundary between the hot and cool areas is most clearly defined (Figure 4).
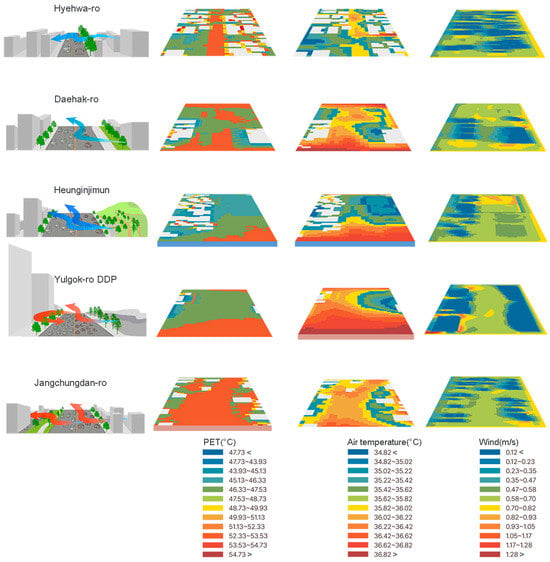
Figure 4.
PET, air temperature, and wind velocity of the current site condition (initial simulation at 3 pm).
4.2. Design Application and Thermal Comfort Comparison Before and After Pedestrian Design
Considering the precondition simulation results and utilizing the space gained through vehicular road reduce the most, design schemes of each street have been developed in line with the existing designation of “Cultural Complex Axis.” This design commonly incorporates linear green spaces and bicycle paths that connect the whole axis, with each themed street featuring a distinct green space and programs. This approach aims at not only providing diverse experiences but also helping lower temperatures, creating a more pleasant walking environment.
4.2.1. Hyehwa-Ro
Figure 5a presents the PET and air temperature maps before and after the design application in the Hyehwa-ro area (right). The figure also includes the average PET values, the percentage distribution of PET-classified pixels, and the changes in green area ratio following the design application (left). Hyehwa-ro has been transformed into an art street connecting theaters, workshops, and cafés, enhancing artistic experiences through performances and workshops. The proposal narrows the road from 7 m to 5.5 m, creating a planting zone for low-growing ground cover and plane trees. The section is particularly characterized by a dense concentration of low-rise buildings. Additionally, street trees such as ginkgo, hybrid poplar, and pine are planted at narrow intervals, resulting in poor airflow between the buildings and the trees. To address this issue, low-growing ground cover and herbaceous plants were primarily planted, while trees were spaced at a minimum of 5 m apart to avoid obstructing the lateral alleys and allowing wind to flow through. The design also incorporated extensive rooftop and wall greening. The simulation results indicate that with a 1.1% increase in the green ratio, the average PET value decreased by 2.1 °C, dropping from 49.3 °C to 47.2 °C. Notably, the area with PET values below 48 °C saw a significant increase of 67.9%, rising from 14.5% to 82.4% following the implementation of pedestrian greening strategies.
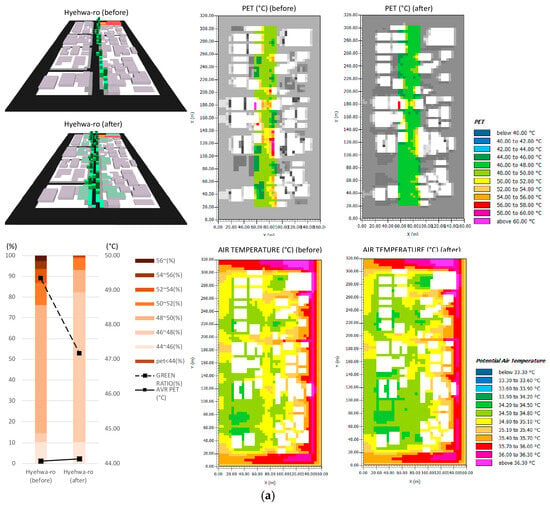
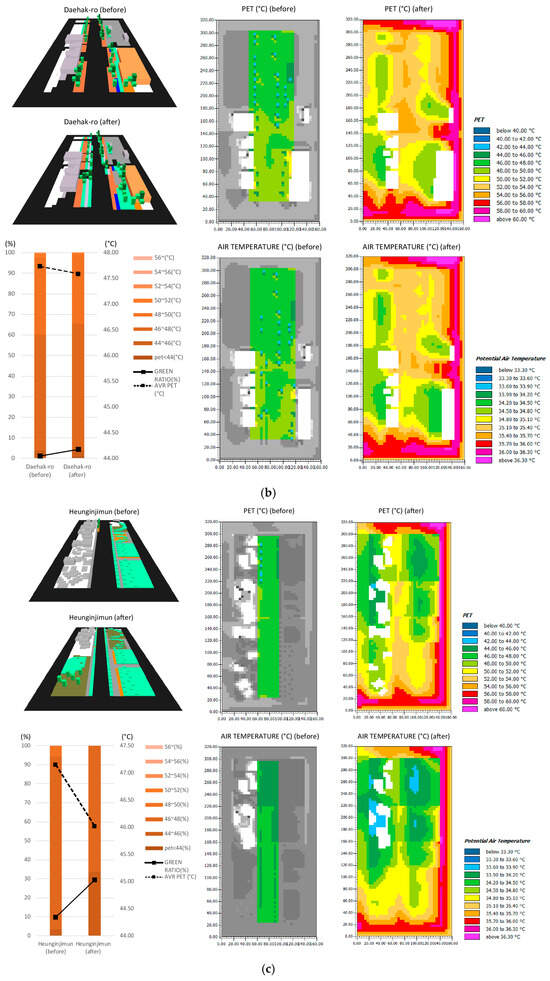
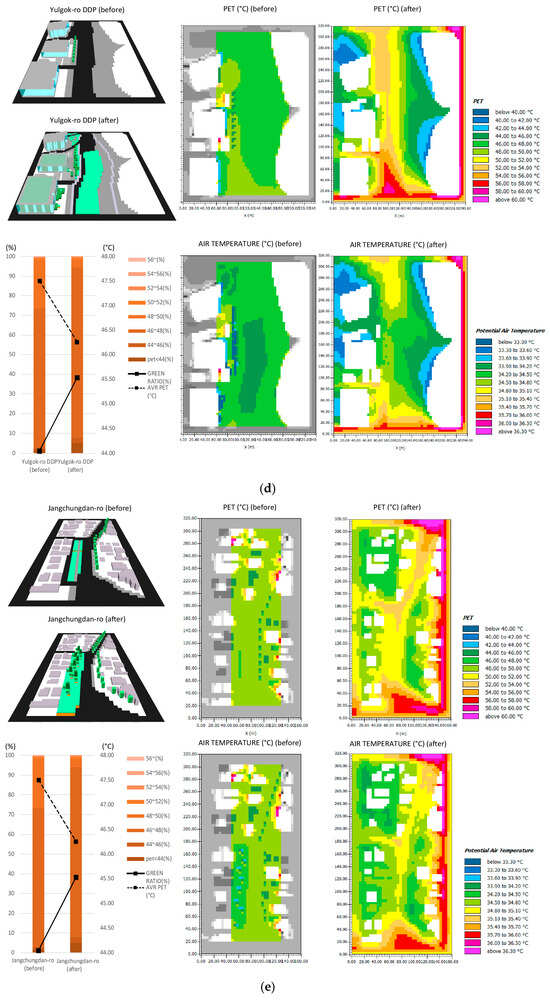
Figure 5.
(a) PET comparison of Hyehwa Road sections (top: before, bottom: after) (1 pm). (b) PET comparison of Daehak Road sections (top: before, bottom: after) (1 pm). (c) PET comparison of Yulgok Road—Heunginjimun sections (top: before, bottom: after) (1 pm). (d) PET comparison of Yulgok Road—DDP sections (top: before, bottom: after) (1 pm). (e) PET comparison of Jangchungdan Road sections (top: before, bottom: after) (1 pm).
4.2.2. Daehak-Ro
Figure 5b presents the PET and air temperature maps before and after the design application in the Daehak-ro area (right). The figure also includes the average PET values, the percentage distribution of PET-classified pixels, and the changes in green area ratio following the design application (left). Daehak-ro has been planned as a learning street, centered around educational themes, featuring institutions such as Seoul National University’s College of Medicine and its affiliated elementary and girls’ middle schools, as well as Marronnier urban park. The design proposal reduces the road width from 20–24 m to 15–18 m and secures planting space by reducing the area of buildings within the redevelopment zone by 10% considering the Floor Area Ratio (FAR) incentive regulation. Additionally, the green space of the existing resting facilities is expanded, and planting areas were added on both sides centered around a bicycle path. A small stream near the school was preserved, and air ventilation was maximized around the stream, while additional trees, shrubs, and ground cover were planted in a manner that does not obstruct ventilation. The simulation results indicate that with a 3.4% increase in the green ratio, the average PET value decreased by 0.2 °C, dropping from 47.7 °C to 47.5 °C. Notably, the area with PET values below 48 °C shows a slight increase of 5.4%, rising from 60.2% to 65.6% following the implementation of pedestrian greening strategies.
4.2.3. Yulgok-Ro—Heunginjimun
Figure 5c presents the PET and air temperature maps before and after the design application in the Yulgok-ro Heunginjimun area (right). The figure also includes the average PET values, the percentage distribution of PET-classified pixels, and the changes in green area ratio following the design application (left). Yulgok-ro, which features Heunginjimun Park, has been planned to preserve the existing greenery while also incorporating a Jongno 4 and 5 redevelopment zone designated for future park connection. Since Heunginjimun Park is a sloped linear park, the design connects it to the adjacent walkway. The first level will function like a plaza, while the second to fourth levels will utilize a variety of trees and shrubs, such as pine, arrowwood, and hostas, to reflect the unique character of Heungin Street. Additionally, the previously narrow walkway, which was further constricted by the addition of a bicycle lane, has been improved through a road reduce that created an extra 4 m of space for smoother pedestrian movement. To harmonize with the current appearance of Heunginjimun Park, a traditional-style marstone pavement and a pine tree-centric park layout were designed. The simulation results indicate that with a 19.5% increase in the green ratio, the average PET value decreased by 1.1 °C, dropping from 47.1 °C to 46.0 °C. Notably, the area with PET values below 46 °C shows a slight increase of 29.8%, rising from 3.6% to 33.4% following the implementation of pedestrian greening strategies.
4.2.4. Yulgok-Ro—DDP
Figure 5d presents the PET and air temperature maps before and after the design application in the Yulgok-ro DDP area (right). The figure also includes the average PET values, the percentage distribution of PET-classified pixels, and the changes in green area ratio following the design application (left). The DDP (Dongdaemun Design Plaza) on Yulgok Road has been transformed by burying the wide ten-lane road underground and utilizing the grassy plaza and public spaces in front of the shopping mall. The green space has been significantly expanded, and the newly freed space has been converted to be used for events such as flea markets hosted by nearby fashion malls, Fashion Week at DDP, and the Night Market. Additionally, emergency and bus lanes have been maintained on both sides of the grassy plaza to ensure accessibility for emergencies and public transportation. The public space in front of the shopping mall will feature bike paths running through a forest and several small gardens. Climbing plants will be planted on the walls of the high-rise shopping mall. The simulation results indicate that with a 37.0% increase in the green ratio, the average PET value decreased by 1.3 °C, dropping from 47.5 °C to 46.2 °C. Notably, the area with PET values below 48 °C shows a slight increase of 20.7%, rising from 73.5% to 94.2% following the implementation of pedestrian greening strategies.
4.2.5. Jangchungdan—Ro
Figure 5e presents the PET and air temperature maps before and after the design application in the Jangchungdan-ro area (right). The figure also includes the average PET values, the percentage distribution of PET-classified pixels, and the changes in green area ratio following the design application (left). Jangchungdan Road is planned as a food-themed street, taking advantage of its fame as a popular eating alley where office workers often enjoy coffee and stroll through Namsoyeonggil Park after lunch and dinner. The design proposal reduces the road width from 6–10 lanes to 4–8 lanes and expands the existing greenery in Namsoyoung-gil Park, and includes the installation of a green median along the road. In the park, a grassy plaza is created, and tall plane trees are additionally planted to provide shade and facilitate wind flow. The simulation results indicate that with a 22.0% increase in the green ratio, the average PET value decreased by 0.4 °C, dropping from 48.9 °C to 48.5 °C. Notably, the area with PET values below 48 °C shows a slight increase of 14.6%, rising from 2.2% to 16.8% following the implementation of pedestrian greening strategies.
4.3. Temporal Thermal Comfort Comparison Before and After Pedestrian Design
To more accurately assess the cooling effectiveness of various pedestrian greening conditions, we calculated the differences in Physiological Equivalent Temperature (PET) between the post-design and pre-design scenarios during daytime hours. Figure 6 illustrates the PET differences across five pedestrian types before and after the greening interventions over time.
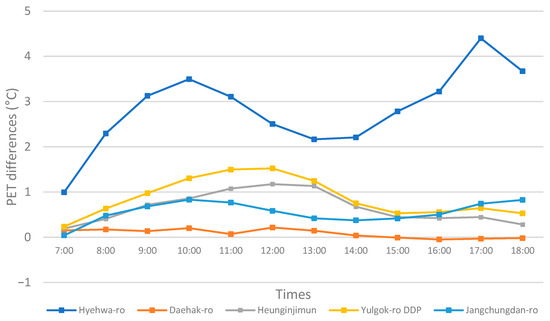
Figure 6.
Averaged PET difference before–after the greening design of five streets from 7 am to 6 pm.
Overall, the cooling effect increased gradually until around noon and then declined in the late afternoon. The magnitude of cooling varied significantly across locations, with the most noticeable variation observed on Hyehwa-ro Street. There, PET reductions ranged from 1.0 °C to 4.4 °C, with the greatest cooling effect occurring at 5 pm. In contrast, Daehak-ro exhibited the smallest change, with cooling magnitudes ranging from −0.05 °C to 0.22 °C. All streets, except Daehak-ro at 4 pm, demonstrated improved thermal comfort levels, with PET reductions ranging from 0 °C to 4.4 °C.
Following the previous analysis, PET values during daytime hours were extracted from the models of the five pedestrian types of pre- and post-design application to evaluate the cooling impact of pedestrian greening. Figure 7 presents boxplot comparisons of pre- and post-design for each of the five pedestrian types. Based on the first-phase precondition simulation results, we decided to use the values from 1:00 to 2:00 pm, as the boundary between hot and cool areas is most clearly defined during this period.
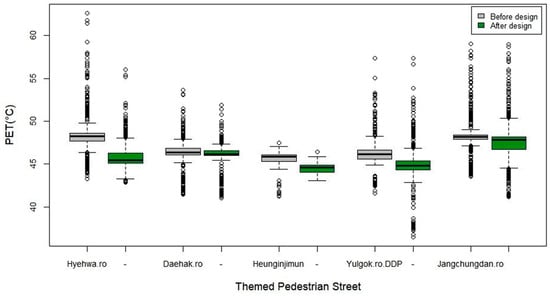
Figure 7.
Box plots of 1 pm PET before and after pedestrian design for five themed streets.
Based on the results, the locations can be broadly categorized into three groups. The first group includes only Hyehwa-ro, which exhibited the most significant differences in PET values before and after the greening intervention. The second group comprises Heunginjimun and Yulgok-ro, where PET reductions were moderate but still clearly noticeable. The third group includes Daehak-ro and Jangchungdan-ro, where the differences in PET values were minimal and largely negligible.
4.4. Overall Comparison and the Influence of Landscape Parameters
To examine the relationship between PET and greening ratio changes, Figure 8 simultaneously presents the average PET values at 1 pm and the corresponding changes in greening ratios before and after the pedestrian greening interventions. Overall, the results suggest that increases in greening ratio do not consistently correspond to proportional decreases in PET. This highlights the importance of incorporating simulation in the early design stage and adjusting design strategies according to the site’s microclimatic conditions in order to maximize the cooling effect.
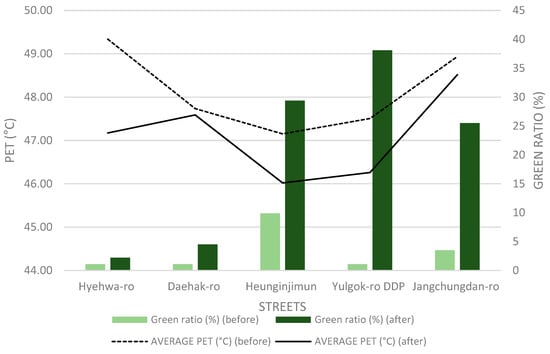
Figure 8.
Five pedestrian comparisons of green space ratio and 1 pm average PET changes before–after the greening design.
For example, although Hyehwa-ro experienced the smallest increase in greening ratio, it exhibited the greatest reduction in PET. Conversely, Jangchungdan-ro showed the second-largest increase in greening ratio, yet the associated cooling effect, as indicated by PET, was comparatively minimal.
Overall, for most streets, an increase in green ratio was associated with a decrease in the thermal comfort index, demonstrating the cooling effect of greening across various urban street conditions. However, the magnitude of cooling did not increase proportionally with the extent of greening.
Notably, a significantly greater cooling effect was observed on Hyehwa-ro—a street characterized by shallow width, higher density, and lower building heights—where trees were proven to weaken the existing wind corridor in precondition simulation. Figure 9 illustrates that, in most street segments, the presence of trees reduces wind velocity. Consequently, achieving a balance between incorporating greenery and maintaining adequate wind flow became a key consideration in multiple design iterations. For Hyehwa-ro Street, the greening was carefully implemented without reducing wind velocity. Despite having the smallest increase in green area, this location exhibited a distinctively high cooling efficiency. Conversely, Jangchungdan-ro, which shares similar spatial characteristics with Hyehwa-ro, showed the lowest cooling efficiency. In this case, even a slight reduction in wind velocity from an initially high level appeared to diminish the cooling effect. These findings highlight the critical role of maintaining and managing wind flow in densely built, narrow urban environments to maximize the benefits of greening strategies.
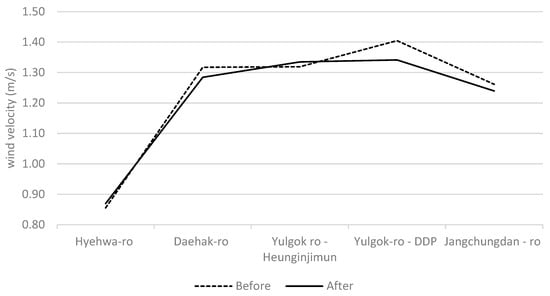
Figure 9.
1 pm average wind velocity comparisons before–after the greening design.
This study provides insights into pedestrian streets, showing that the amount of added greenery often corresponded to the reduction in road space, resulting in relatively similar levels of thermal comfort improvement across sites. However, the key differentiator was how the design interacted with existing wind flow. The study revealed that preserving and enhancing natural airflow had a greater impact on thermal comfort than simply increasing vegetation.
This research contributes by testing a range of practical design strategies—such as the use of road-reduced area, incentive-based public open spaces, feasible rooftop and wall greening, and the integration of existing waterways—within real-world pedestrian renovation contexts. Through multiple rounds of simulation and design iteration, the findings emphasize that maintaining unobstructed wind flow is crucial for achieving meaningful improvements in outdoor thermal comfort in dense urban environments.
Since this study aims to explore the application of simulation across the entire design process, it has limitations in fully revealing all the scientific and technical factors that influence thermal comfort. In particular, aspects such as building density, height, and overall urban morphology are critical variables that require further investigation beyond the current scope.
Although solar exposure related to sky view factor (SVF) conditions was different in streets, in general, the introduction of trees produced relatively similar cooling effects across pedestrian spaces through shading and evapotranspiration. Among these, wind flow may have emerged as the decisive factor, particularly how existing building-induced wind corridors were preserved or obstructed by plantings, and how flows generated by such river corridors with planting additions could be maximized. Therefore, in the pedestrian conditions where building contexts are nearly fixed factors and road reduce patterns among streets are similar, the role of wind flow becomes particularly critical.
Further investigation may be required to account for the solar radiation changes related to building and tree shadows across an expanded temporal scale, as well as plant evapotranspiration with wind dynamics. In addition, the limitations of ENVI-met in simulating wind flow were recognized, highlighting the need for complementary studies employing computational fluid dynamics (CFD) models to better explain wind dynamics.
5. Conclusions
This study explored the effectiveness of climate-adaptive pedestrian design with greening strategies through the integration of microclimate simulations in central Seoul. Using ENVI-met, five different pedestrian street types along the “Cultural Complex Axis” were analyzed in terms of their pre- and post-intervention thermal environments.
Simulation results showed that pedestrian greening generally improved thermal comfort across all five sites, though the magnitude of cooling varied considerably depending on site-specific characteristics. Hyehwa-ro, despite the smallest increase in green ratio, achieved the most significant PET reduction, highlighting that cooling efficiency is not solely dependent on the quantity of greenery but also on urban form and microclimatic conditions such as wind flow, as revealed in precedent studies ([30,31,32]). In contrast, Jangchungdan-ro—with a much higher increase in green coverage—yielded a comparatively modest thermal improvement, largely attributed to a slight decrease in wind velocity. Although SVF and solar exposure varied according to streets, tree planting seems to produce broadly similar cooling through shading and evapotranspiration, making wind corridors the decisive influence. Preserving or enhancing flows, particularly those linked to building form or river corridors, proved essential. Future work should address shadow–wind interactions over longer time spans and incorporate CFD to complement ENVI-met’s limits in wind simulation. In addition, the simple forcing based on relatively basic weather data inputs used in this study has limitations in capturing the varied local microclimates across the large study site, implying further investigation is needed to improve representativeness by introducing multi-sensor field observations [49]. While much research emphasizes the evaluation of pedestrian thermal comfort [50,51,52], there are few studies integrating simulation and design process based on practical urban design cases. This study underscores the importance of a context-sensitive approach to pedestrian climate-adaptive design by introducing simulation in the early stage. Specifically, maintaining effective wind corridors and avoiding overly dense vegetation in narrow, high-density areas are crucial for maximizing the cooling benefits of urban greening. Moreover, greening strategies should be tailored to local urban morphology rather than relying on a one-size-fits-all increase in vegetation.
This study supports previous research demonstrating the greening intervention cooling effect [53]. In this study, greening interventions resulted in a PET reduction of 0–4.4 °C. While this cooling effect is somewhat lower than the findings of a recent pedestrian greening simulation study in Glasgow—where the addition of street trees reduced thermal sensation from “hot” to “slightly warm” or “warm” (approximately 5–10 °C)—the decrease observed here remains meaningful. Given the varied street conditions analyzed, a reduction of even one PET class represents a significant improvement in outdoor thermal comfort. It also supports urban wind corridor formation importance under various pedestrian conditions [54,55], and further connects the discussion by exploring the impact of greening strategies at a practical urban landscape design scale.
Despite its contributions, the study recognizes limitations related to several confounding variables, including the combined effects of greening with specific building forms and densities, as well as the types of greening, such as vertical greenery require further detailed investigation. A more sensitive, controlled study is needed to isolate and quantify these factors, helping to clarify design priorities for pedestrian environments.
This study demonstrates the potential of utilizing a simulation-integrated process to enhance the effectiveness of pedestrian renovation design and serves as a baseline dataset, laying the groundwork for subsequent experimental research aimed at optimizing climate-adaptive pedestrian greening strategies.
Author Contributions
Conceptualization, E.J.K. and K.H.; methodology, G.B. and E.J.K.; software, G.B.; validation, E.J.K. and K.H.; data curation, G.B.; writing—original draft preparation, G.B. and E.J.K.; writing—review and editing, E.J.K. and K.H. All authors have read and agreed to the published version of the manuscript.
Funding
This work was supported by the National Research Foundation of Korea (NRF) grant funded by the Korea government (MSIT) (grant number: RS-2025-00555206).
Institutional Review Board Statement
Not applicable.
Informed Consent Statement
Not applicable.
Data Availability Statement
The datasets generated or analyzed in the current study are available from the corresponding author upon reasonable request.
Conflicts of Interest
Gawon Bae was employed by Eospace. The remaining authors declare that the research was conducted in the absence of any commercial or financial relationships that could be construed as a potential conflict of interest.
Appendix A. Example of Preliminary Simulation Result of PET (Based on a Wider Range of Legend Class)
References
- Pourya, T.; Alessio, R. Assessing the Benefits of Climate-Sensitive Design with Nature-Based Solutions for Climate Change Adaptation in Urban Regeneration: A Case Study in Cheltenham, UK. Sustainability 2023, 15, 15855. [Google Scholar] [CrossRef]
- Russo, A.; Cirella, G.T. Urban Sustainability: Integrating Ecology in City Design and Planning. In Sustainable Human–Nature Relations: Environmental Scholarship, Economic Evaluation, Urban Strategies; Cirella, G.T., Ed.; Springer: Singapore, 2020; pp. 187–204. [Google Scholar] [CrossRef]
- Marvuglia, A.; Koppelaar, R.; Rugani, B. The effect of green roofs on the reduction of mortality due to heatwaves: Results from the application of a spatial microsimulation model to four European cities. Ecol. Modell. 2020, 438, 109351. [Google Scholar] [CrossRef]
- Iungman, T.; Cirach, M.; Marando, F.; Pereira Barboza, E.; Khomenko, S.; Masselot, P.; Quijal-Zamorano, M.; Mueller, N.; Gasparrini, A.; Urquiza, J.; et al. Cooling cities through urban green infrastructure: A health impact assessment of European cities. Lancet 2023, 401, 577–589. [Google Scholar] [CrossRef] [PubMed]
- Yu, S.; Yeo, G. A Study on the Development of Indicators and Activate about Urban Regeneration Corresponding Climate Change: Focusing on the Seoul Metropolitan City. KRUMA 2015, 28, 77–99. [Google Scholar]
- Wang, G.; Lee, B.; Jung, Y.; Lee, J.; Yu, S.; Noh, G.; Min, G.; Ha, T. A Study on the Regulation Establishment Plan and Policy Issue for Climate Change Corresponding Urban Regeneration; KRIHS: Sejong, Republic of Korea, 2013. [Google Scholar]
- Han, S. Disaster prevention urban planning for Busan urban regeneration area. Busan Dev. Forum 2015, 156, 107–111. [Google Scholar]
- Rosa, D.L.; Privitera, R.; Barbarossa, L.; Greca, P.L. Assessing spatial benefits of urban regeneration programs in a highly vulnerable urban context: A case study in Catania, Italy. Landsc. Urban Plan. 2017, 157, 180–192. [Google Scholar] [CrossRef]
- Michela, T.; Silvia, R.; David, V.; Vincenza, T.; Francesco, B.; Marco, D.S. Urban Policies and Planning Approaches for a Safer and Climate Friendlier Mobility in Cities: Strategies, Initiatives and Some Analysis. Sustainability 2021, 13, 1778. [Google Scholar] [CrossRef]
- Renata, V.; Louise, M.; Roberto, B.; Eduardo, C.; Carlo, D. Environmental Regeneration Integrating Soft Mobility and Green Street Networks: A Case Study in the Metropolitan Periphery of Naples. Sustainability 2021, 13, 8195. [Google Scholar] [CrossRef]
- Marianna, N.; Letizia, C.; Teodoro, G.; Emanuele, M.; Gabriele, B. Microclimate Classification of Bologna (Italy) as a Support Tool for Urban Services and Regeneration. Int. J. Environ. Res. Public Health 2021, 18, 4898. [Google Scholar] [CrossRef]
- Endreny, T.A. Strategically Growing the Urban Forest Will Improve Our World. Nat. Commun. 2018, 9, 1160. [Google Scholar] [CrossRef]
- Parker, J.; Simpson, G.D. Public Green Infrastructure Contributes to City Livability: A Systematic Quantitative Review. Land 2018, 7, 161. [Google Scholar] [CrossRef]
- State of the Environment Australia Urban Livability. Available online: https://soe.dcceew.gov.au/urban/environment/livability (accessed on 16 June 2023).
- Alistair, W.; Andrea, H.; Daniel, B.; Brenton, G.; Sotiris, V.; Neha, L.; Katrina, L.; Carmel, W. Trees, Climate Change, and Health: An Urban Planning, Greening and Implementation Perspective. Int. J. Environ. Res. Public Health 2023, 20, 6798. [Google Scholar] [CrossRef]
- Hang, J.; Li, Y.; Sandberg, M.; Buccolieri, R.; DiSabatino, S. The influence of building height variability on pollutant dispersion and pedestrian ventilation in idealized high-rise urban areas. Build. Environ. 2012, 56, 346–360. [Google Scholar] [CrossRef]
- Hong, S. The effect of the green space in roadside and building height on the mitigation of concentration of particulate matters. Korean J. Environ. Ecol. 2020, 34, 466–482. [Google Scholar] [CrossRef]
- Kim, S.; Lee, D.; Bae, C. Analysis of the effect of street green structure on PM2.5 in the walk space: Using micro climate simulation. J. Korean Environ. Res. Tech. 2021, 24, 61–75. [Google Scholar] [CrossRef]
- Barlow, J.F.; Harman, I.N.; Belcher, S.E. Scalar fluxes from urban street canyons. Part I: Laboratory simulation. Bound.-Layer Meteorol. 2004, 113, 369–385. [Google Scholar] [CrossRef]
- Kang, Y.; Kim, K.; Jung, J.; Son, S.; Kim, E. How Vulnerable Are Urban Regeneration Sites to Climate Change in Busan, South Korea. Sustainability 2020, 12, 4032. [Google Scholar] [CrossRef]
- Lai, D.; Liu, W.; Gan, T.; Liu, K.; Chen, Q. A review of mitigating strategies to improve the thermal environment and thermal comfort in urban outdoor spaces. Sci. Total Environ. 2019, 661, 337–353. [Google Scholar] [CrossRef]
- Ali-Toudert, F.; Mayer, H. Numerical study on the effects of aspect ratio and orientation of an urban street canyon on outdoor thermal comfort in hot and dry climate. Build. Environ. 2006, 41, 94–108. [Google Scholar] [CrossRef]
- Chatzidimitriou, A.; Yannas, S. Microclimate development in open urban spaces: The influence of form and materials. Energy Build. 2015, 108, 156–174. [Google Scholar] [CrossRef]
- Jamei, E.; Rajagopalan, P.; Seyedmahmoudian, M.; Jamei, Y. Review on the impact of urban geometry and pedestrian level greening on outdoor thermal comfort. Renew. Sustain. Energy Rev. 2016, 54, 1002–1017. [Google Scholar] [CrossRef]
- Krüger, E.; Pearlmutter, D.; Rasia, F. Evaluating the impact of canyon geometry and orientation on cooling loads in a high-mass building in a hot dry environment. Appl. Energy 2010, 87, 2068–2078. [Google Scholar] [CrossRef]
- Lau, K.K.-L.; Ren, C.; Ho, J.; Ng, E. Numerical modelling of mean radiant temperature in high-density sub-tropical urban environment. Energy Build. 2016, 114, 80–86. [Google Scholar] [CrossRef]
- Arnfield, A.J. Two decades of urban climate research: A review of turbulence, exchanges of energy and water, and the urban heat island. Int. J. Climatol. A J. R. Meteorol. Soc. 2003, 23, 1–26. [Google Scholar] [CrossRef]
- Oke, T.R. Canyon geometry and the nocturnal urban heat island: Comparison of scale model and field observations. J. Climatol. 1981, 1, 237–254. [Google Scholar] [CrossRef]
- Charalampopoulos, I.; Tsiros, I.; Chronopoulou-Sereli, A.; Matzarakis, A. Analysis of thermal bioclimate in various urban configurations in Athens, Greece. Urban Ecosyst. 2013, 16, 217–233. [Google Scholar] [CrossRef]
- Ahmad, K.; Khare, M.; Chaudhry, K. Wind tunnel simulation studies on dispersion at urban street canyons and intersections—A review. J. Wind Eng. Ind. Aerodyn. 2005, 93, 697–717. [Google Scholar] [CrossRef]
- Yang, F.; Qian, F.; Lau, S.S. Urban form and density as indicators for summertime outdoor ventilation potential: A case study on high-rise housing in Shanghai. Build. Environ. 2013, 70, 122–137. [Google Scholar] [CrossRef]
- Wang, Y.; Akbari, H. Effect of sky view factor on outdoor temperature and comfort in Montreal. Environ. Eng. Sci. 2014, 31, 272–287. [Google Scholar] [CrossRef]
- Oke, T.R.; Mills, G.; Christen, A.; Voogt, J.A. Urban Climates; Cambridge University Press: Cambridge, UK, 2017. [Google Scholar]
- Ali-Toudert, F.; Mayer, H. Effects of asymmetry, galleries, overhanging facades and vegetation on thermal comfort in urban street canyons. Sol. Energy 2007, 81, 742–754. [Google Scholar] [CrossRef]
- Ouldboukhitine, S.-E.; Belarbi, R.; Sailor, D.J. Experimental and numerical investigation of urban street canyons to evaluate the impact of green roof inside and outside buildings. Appl. Energy 2014, 114, 273–282. [Google Scholar] [CrossRef]
- Liu, Z.; Cheng, W.; Jim, C.Y.; Morakinyo, T.E.; Shi, Y.; Ng, E. Heat mitigation benefits of urban green and blue infrastructures: A systematic review of modeling techniques, validation and scenario simulation in ENVI-met V4. Build. Environ. 2021, 200, 107939. [Google Scholar] [CrossRef]
- Salata, F.; Golasi, I.; de Lieto Vollaro, R.; de Lieto Vollaro, A. Outdoor thermal comfort in the Mediterranean area. A transversal study in Rome, Italy. Build. Environ. 2016, 96, 46–61. [Google Scholar] [CrossRef]
- Morakinyo, T.E.; Dahanayake, K.K.C.; Ng, E.; Chow, C.L. Temperature and cooling demand reduction by green-roof types in different climates and urban densities: A co-simulation parametric study. Energy Build. 2017, 145, 226–237. [Google Scholar] [CrossRef]
- Forouzandeh, A. Prediction of surface temperature of building surrounding envelopes using holistic microclimate ENVI-met model. Sustain. Cities Soc. 2021, 70, 102878. [Google Scholar] [CrossRef]
- Yang, J.; Hu, X.; Feng, H.; Marvin, S. Verifying an ENVI-met simulation of the thermal environment of Yanzhong Square Park in Shanghai. Urban For. Urban Green. 2021, 66, 127384. [Google Scholar] [CrossRef]
- Taleghani, M.; Kleerekoper, L.; Tenpierik, M.; Van Den Dobbelsteen, A. Outdoor thermal comfort within five different urban forms in the Netherlands. Build. Environ. 2015, 83, 65–78. [Google Scholar] [CrossRef]
- Fanger, P.O. Thermal Comfort. Analysis and Applications in Environmental Engineering; Danish Technical Press: Vanloese, Denmark, 1970. [Google Scholar]
- Höppe, P. A universal index for the assessment of the thermal environment–the physiological equivalent temperature PET. In Proceedings of the 15th International Congress of Biometeorology and International Conference on Urban Climatology, Sydney, Australia, 8–12 November 1999. [Google Scholar]
- Lin, T.P.; Matzarakis, A.; Hwang, R.L. Shading effect on long-term outdoor thermal comfort. Build. Environ. 2010, 45, 213–221. [Google Scholar] [CrossRef]
- Blazejczyk, K.; Epstein, Y.; Jendritzky, G.; Staiger, H.; Tinz, B. Comparison of UTCI to selected thermal indices. Int. J. Biometeorol. 2012, 56, 515–535. [Google Scholar] [CrossRef]
- Jendritzky, G.; De Dear, R.; Havenith, G. UTCI—Why another thermal index? Int. J. Biometeorol. 2012, 56, 421–428. [Google Scholar] [CrossRef]
- Binarti, F.; Pranowo, P.; Leksono, S.B. Microclimate models to predict the contribution of facade materials to the canopy layer heat island in hot-humid areas. Geogr. Tech. 2020, 15, 42–52. [Google Scholar] [CrossRef]
- Sharmin, T.; Steemers, K.; Humphreys, M. Outdoor thermal comfort and summer PET range: A field study in tropical city Dhaka. Energy Build. 2019, 198, 149–159. [Google Scholar] [CrossRef]
- Saladié, Ò.; Boqué-Ciurana, A.; Sevil, J.; Olano Pozo, J.X. Summer Thermal Comfort in Urban Squares: The Case of Human Tower Exhibitions in Catalonia. Atmosphere 2025, 16, 666. [Google Scholar] [CrossRef]
- Qin, J.; Feng, Y.; Sheng, Y.; Huang, Y.; Zhang, F.; Zhang, K. Evaluation of pedestrian-perceived comfort on urban streets using multi-source data: A case study in Nanjing, China. ISPRS Int. J. Geo-Inf. 2025, 14, 63. [Google Scholar] [CrossRef]
- Zhang, T.; Fu, X.; Qi, F.; Shen, Y.; Xu, P.; Tao, Y.; Liu, T.; Song, Y. Optimizing pedestrian thermal comfort in urban street canyons for summer and winter: Tree planting or low-albedo pavements? Sustain. Cities Soc. 2025, 120, 106143. [Google Scholar] [CrossRef]
- Lai, B.; Fu, J.M.; Guo, C.K.; Zhang, D.Y.; Wu, Z.G. Street Geometry Factors Influencing Outdoor Pedestrian Thermal Comfort in a Historic District. Buildings 2025, 15, 613. [Google Scholar] [CrossRef]
- Wang, W.; Yang, T.; Li, Y.; Xu, Y.; Chang, M.; Wang, X. Identification of pedestrian-level ventilation corridors in downtown Beijing using large-eddy simulations. Build. Environ. 2020, 182, 107169. [Google Scholar] [CrossRef]
- Baş, H.; Andrianne, T.; Reiter, S. City configurations to optimise pedestrian level ventilation and wind comfort. Sustain. Cities Soc. 2024, 114, 105745. [Google Scholar] [CrossRef]
- Zielonko-Jung, K.; Poćwierz, M.; Idem, R. Wind Conditions at Pedestrian Level in Different Types of Residential Urban Development for a High Degree of Land Use Efficiency. Sustainability 2021, 13, 13612. [Google Scholar] [CrossRef]
Disclaimer/Publisher’s Note: The statements, opinions and data contained in all publications are solely those of the individual author(s) and contributor(s) and not of MDPI and/or the editor(s). MDPI and/or the editor(s) disclaim responsibility for any injury to people or property resulting from any ideas, methods, instructions or products referred to in the content. |
© 2025 by the authors. Licensee MDPI, Basel, Switzerland. This article is an open access article distributed under the terms and conditions of the Creative Commons Attribution (CC BY) license (https://creativecommons.org/licenses/by/4.0/).