


Abstract
Automated vehicle (AV) technology is expected to alter travel behavior and residential location choices, yet the psychological motivations behind relocation decisions under current partial automation (Level 2) remain underexplored, as most studies focus on fully autonomous scenarios. This study explores why individuals might relocate in response to AV availability in both short-term and long-term contexts and predicts how willingness to relocate changes as automation levels advance. In a survey of Kentucky residents, data were collected on demographic and economic characteristics, travel needs, built environment attributes, AV familiarity, comfort with different automation levels, and willingness to relocate if AVs were available. Multiple machine learning models with Shapley Additive Explanations (SHAP) were used to predict and interpret changes in relocation willingness. Results indicate that greater comfort with high-level automation and higher AV familiarity increase relocation intentions, particularly among men, older adults with higher incomes, and urban residents. SHAP analysis reveals that built environment, age, and comfort with fully autonomous driving are the most influential predictors of changes in relocation willingness. Findings inform land use and housing policy by identifying where perception-driven relocation pressures are likely to emerge and by outlining adaptive tools to guide spatial growth as AV technology advances.
1. Introduction
Automated vehicle (AV) technology is on the brink of transforming not only transportation systems but also the behavioral patterns of the general public [1,2,3]. A particularly intriguing dimension of this transformation lies in its potential impact on residential choices [4]. In the past, individuals have prioritized minimizing commuting times to reduce the burden of daily travel to work [5,6]. However, as AV technology evolves to revolutionize transportation by both improving efficiency and granting human drivers with greater freedom [4,7,8]. This prompts a series of pivotal questions:
- Will the adoption of AV technology encourage people to rethink their residential choices, potentially opting to live farther from their workplaces?
- If such shifts in residential patterns contribute to urban sprawl, how might this reshape urban planning, land use strategies, and the design of transportation networks?
Past studies have identified younger generations [9,10,11] and men [10,12] as groups more likely to exhibit a strong willingness to relocate with the implementation of AV technology. Additionally, factors such as income [12,13,14], education degree [12,14,15], and characteristics of the existing built environment [11,16] have been shown to influence future residential choices in an AV-driven landscape. While studies such as [10,11,12] have highlighted the significant influence of gender and age on housing choices in the context of AV technology, the underlying mechanisms driving these relationships remain insufficiently explored. For instance, are men more likely to move further from their workplaces because they have greater trust in AV technology for commuting? This raises the possibility that factors such as trust or acceptance of AV may mediate the relationship between demographic variables and residential decisions. However, these mediating factors remain largely unrevealed in the current practice. Addressing this gap can provide a more comprehensive understanding of how demographic characteristics shape residential choices in an AV-driven future.
As automation levels increase, human drivers gain greater freedom in vehicle operation. Currently, AV technology at Levels 2 and 3 is commercially available [14], while Levels 4 and 5 remain in testing phases or beginning ride-hailing services in limited-area operations [17,18]. This distinction emphasizes the necessity of considering both short-term (Levels 2 and 3) and long-term (Levels 4 and 5) impacts of AV adoption on residential relocation. While existing studies have largely focused on the potential for residential relocation from a long-term perspective [12,19,20,21], the short-term implications remain underexplored. In the near term, with SAE Levels 2 and 3 commercially available, deployment remains driver-in-the-loop: the human driver is responsible for the dynamic driving task. Federal guidance sets the overall safety and performance parameters, while state rules govern on-road operation, insurance, and liability. Progress to higher automation (Levels 4–5) depends on regulatory approvals or waivers, safety reporting and data-sharing requirements, and local operating permissions (e.g., geo-fenced service areas). Therefore, this gap presents a critical challenge for urban planners, who must balance addressing the immediate effects of AV technology on residential choices with forecasting potential urban sprawl as higher levels of automation become widely available. As Levels 2 and 3 AVs increasingly improve commuting convenience and efficiency, understanding how these advancements influence short-term commuting patterns and residential decisions is essential for developing informed, forward-looking urban policies.
To address the aforementioned research gaps, this study aims to reveal the mechanism of residential relocation and further predict the individuals’ willingness to relocate in the context of AV technology being implemented from both short- and long-term perspectives.
The remainder of this paper is structured as follows. Section 2 presents a literature review, summarizing existing studies on the impacts of AV on residential choices and commuting behaviors, as well as identifying key influencing factors. Section 3 details the data collection process and modeling methods employed in this study. Section 4 provides a summary of the study’s findings along with an in-depth discussion. Finally, Section 5 concludes the paper and proposes potential avenues for future research.
2. Literature Review
2.1. Factors Influencing Residential Relocation Impacted by AV Technology
Previous research explored the factors influencing residential choices in the context of AV technology while considering the comprehension of its impacts on travel behavior and land use [9,21,22,23,24]. These studies indicate that in an era of widespread AVs, people’s residential choices are influenced by a variety of factors, including demographics (i.e., age, gender), affordability, travel demand, and familiarity with AV technology. The main findings of the relevant studies on factors influencing residential choice are summarized in Table 1.
Demographic factors, such as gender and age, play a significant role in shaping residential choices. Women, in general, exhibit greater resistance to relocation and prefer shorter commutes. This is likely attributed to a heightened aversion to change, increased risk perception, and family-related responsibilities, especially among mothers [12,25,26,27,28]. Additionally, younger individuals tend to show a more positive attitude toward relocation, perceiving it as an opportunity to improve living conditions and advance their careers, even at the expense of longer commuting times [10,11,14]. Individuals’ education degree and income level also significantly influence relocation behaviors. Higher education levels are positively correlated with a greater willingness to relocate, as individuals with a bachelor’s degree or higher often perceive more extensive job market opportunities and enhanced earning potential in more distant areas [12,14,15]. In contrast, higher-income individuals tend to exhibit lower mobility, likely due to their current residence in desirable locations. Conversely, lower-income households may be more inclined to accept longer commutes in exchange for the affordability of housing in less central areas [14].
Familiarity with AV technology also influences relocation decisions. Although it does not directly impact the willingness to change workplaces or accept longer commutes, individuals familiar with AVs tend to be more hesitant to relocate, possibly due to concerns about potential disruptions to their lifestyle [12].
The built environment critically shapes an individual’s residential choices, influencing service accessibility, transportation options, and the overall quality of life [9,29]. A more comfortable commuting experience, along with reduced travel costs, can incentivize individuals to relocate further from urban centers [30,31,32]. With the widespread adoption of AVs, travel has been simplified, enhancing accessibility to suburban areas and influencing residential and workplace choices. Such changes may lead to urban sprawl and population growth in the suburbs [21,33]. Consequently, the choice of location for homes and workplaces impacts not only the built environment but also transportation, land use, and urban form [12,34].
Table 1.
Summary of main findings of relevant studies on factors influencing residential choice.
2.2. Current Practices of How AV Technology Is Shaping Residential Relocation at Specific Levels of Automation
Existing research examining the impact of AV technology on residential choices primarily focuses on Level 4 and Level 5 automation. Ref. [38] employed a stated preference survey technique to ascertain whether the introduction of fully autonomation vehicles lead to residential relocation from the city center to the suburbs due to different time perception of people. Ref. [39] examined the effects of high and full automation on population concentration and dispersion in the Netherlands. Additionally, Ref. [40] explored the potential impact of Level 4 AVs on urban sprawl, with a specific focused on comparing the knowledge of AV technology and the willingness to relocate between car-derivers in China and the US. Ref. [20] focused on the impact of Level 4 and Level 5 AVs and connected-autonomous vehicles (CAVs) on residential location, commuting patterns, and spatial distribution within North Carolina’s Triangle area. In another study, Ref. [21] explored people’s preferences for residential locations and commuting options in the context of Level 5 AVs. Based on a survey of Georgia residents from 2017 to 2018, Ref. [22] explored respondents’ expectations about two significant long-term decisions in a hypothetical era of full automation. These decisions pertain to residential choices, such as whether to relocate closer to frequently visited places, move farther away in pursuit of more appealing living conditions, or maintain their current residence.
2.3. Summary
The extensive review of current state-of-the-art research has revealed several research gaps that have not been addressed:
- Existing studies have highlighted several demographic factors, such as age, gender, and income, that influence the likelihood of residential relocation in response to AV technology adoption. However, the underlying mechanisms driving these relationships remain insufficiently explored. This gap limits policymakers’ ability to fully understand the motivating forces behind relocation decisions and design targeted interventions.
- Existing studies have predominantly examined residential relocation from a long-term perspective, focusing on scenarios where Levels 4 and 5 AV technology are widely available. In contrast, there is a notable lack of discussion on the short-term impacts associated with the adoption of AV technology at the current form (e.g., Levels 2 or 3). This oversight constrains urban planners’ ability to assess and forecast the immediate effects of AV technology on commuting patterns and residential choices, which are critical for developing adaptive urban policies.
3. Materials and Methods
3.1. Analytical Framework
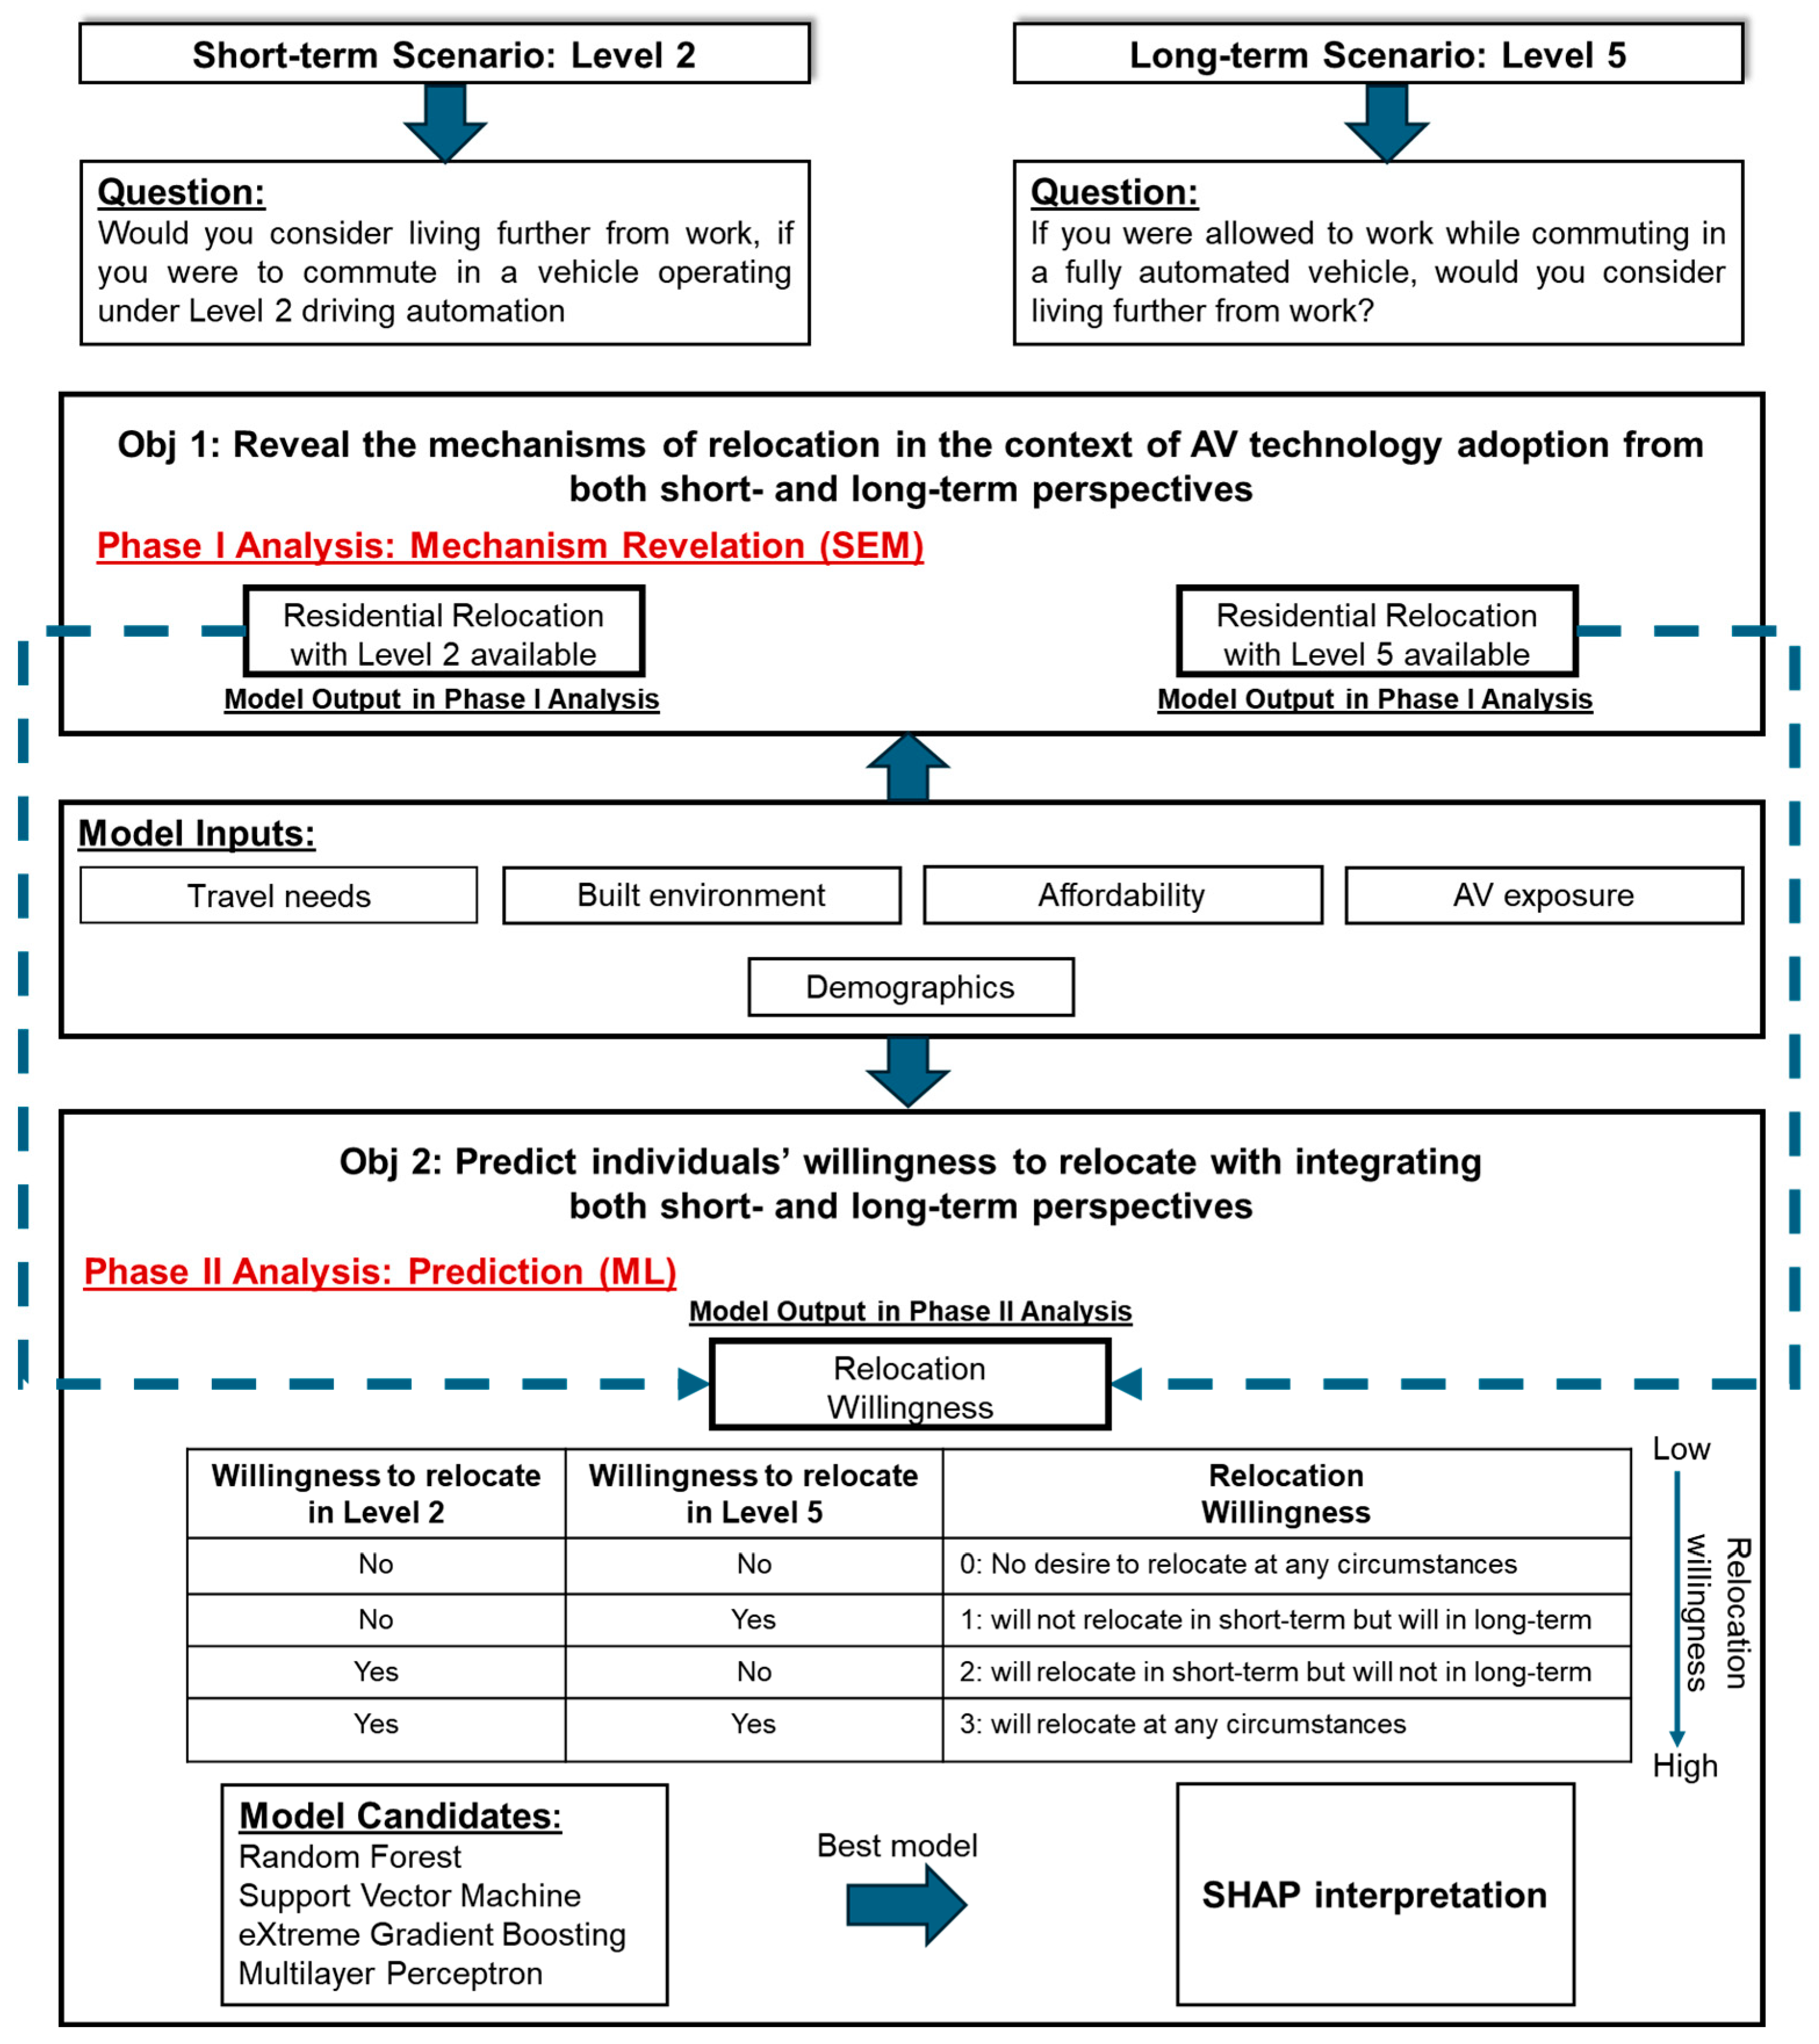
The objectives of this research are twofold: to uncover the underlying mechanisms driving residential relocation in the context of AV technology adoption and to predict individuals’ willingness to relocate from both short- and long-term perspectives. To achieve these objectives, this study is structured into two distinct phases of analysis: Phase I Mechanism Revelation and Phase II Prediction.
To support the two-phase analysis, a comprehensive public survey was designed and disseminated to collect data. This study examines both the short- and long-term impacts of AV technology on residential relocation, focusing specifically on Levels 2 and 5 automation. Level 2 represents the current phase of AV adoption, while Level 5 symbolizes its anticipated future state. Respondents were asked two key survey questions, each probing their willingness to relocate farther from work under the conditions of Levels 2 and 5 AV technology, respectively. These responses constitute the model outputs for Phase I analysis, aimed at revealing the mechanisms underlying relocation decisions.
In addition to these two primary outputs, this study constructs a third output variable, relocation willingness, by combining respondents’ answers to both survey questions. Relocation willingness is treated as an ordered variable, capturing individuals’ willingness to relocate across both short- and long-term perspectives. For instance, respondents who express no intention to relocate under either Level 2 or Level 5 conditions are categorized as having “no desire to relocate under any circumstances”. Conversely, those expressing willingness to relocate under both scenarios fall into the category of “will relocate under any circumstances”. This variable serves as the output for Phase II analysis, focused on predicting relocation behaviors.
The survey also gathered comprehensive data on model inputs, including demographic characteristics, travel needs, perceptions of the built environment, affordability, and familiarity with AV technology. These factors, as demonstrated in the literature review, are well-documented determinants of residential relocation decisions.
Following the construction of model inputs and outputs, appropriate modeling techniques were selected for each phase of analysis. In Phase I, Structural Equation Modeling (SEM) was applied to uncover the significant factors influencing residential relocation and their interrelationships. The identified key factors were then integrated into Phase II prediction models using multiple machine learning algorithms. The most optimal predictive model was further interpreted using SHAP (SHapley Additive exPlanations) to enhance transparency and provide insights into the contribution of each factor.
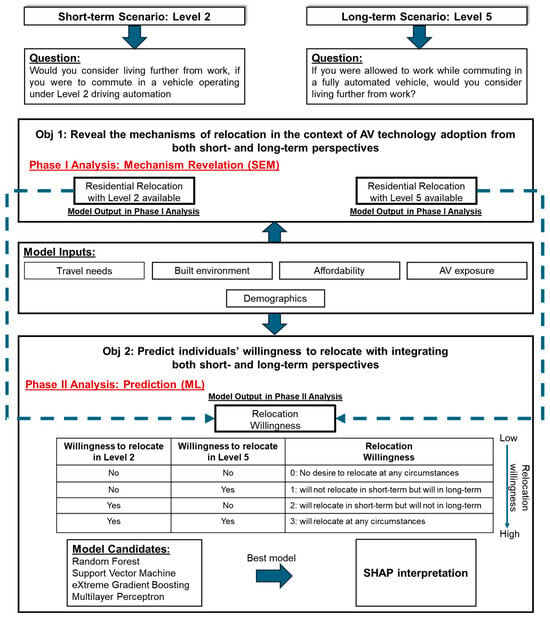
Figure 1 illustrates the analytical framework of this study. Detailed descriptions of the survey design and modeling techniques are provided in Section 3.2 and Section 3.4, respectively.
Figure 1.
Analytical framework.
3.2. Data Collection
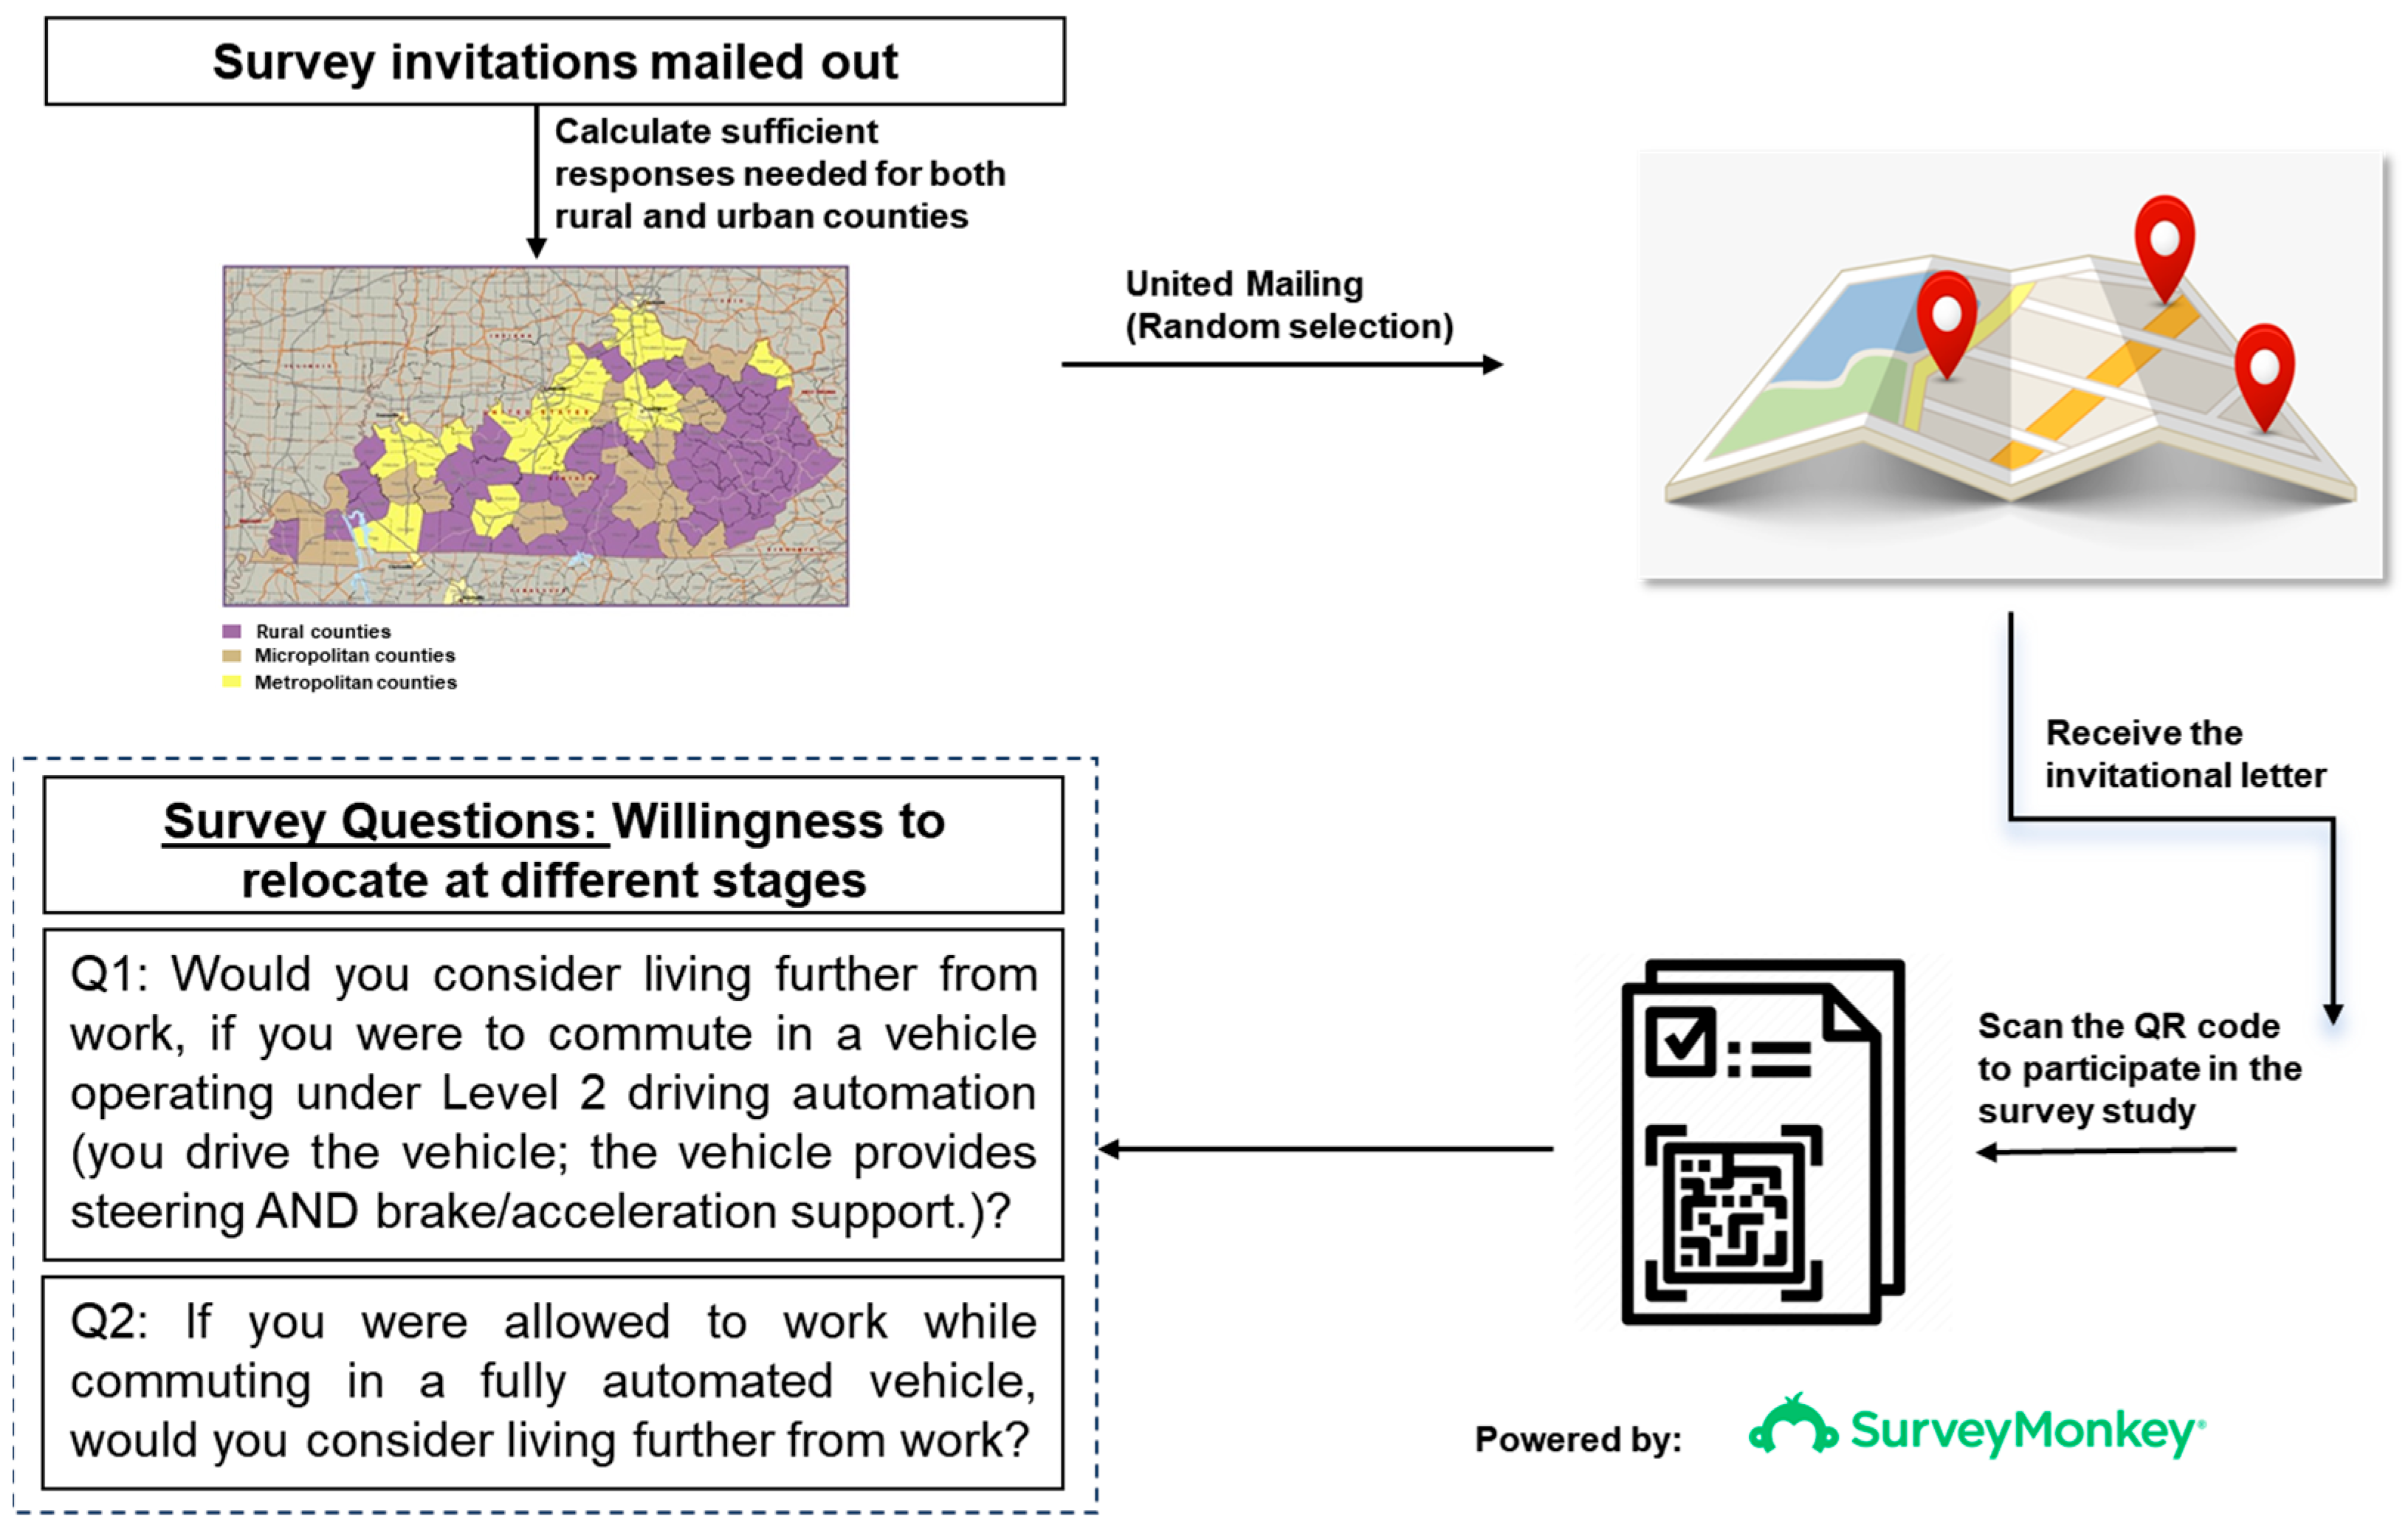
A public survey was designed to collect information on residents’ demographics, affordability, travel needs, the built environment, AV familiarity, and Levels 2 and 5 comfort. Figure 2 presents an example of the question. In addition, it illustrates how survey invitations were sent and how survey was constructed. The survey was conducted in Kentucky, USA, which includes both urban and rural populations. Specifically, residents from all 120 counties were involved in the survey to provide insights into their possible residential relocation behavior with AV technology. The specific number of survey invitations that were sent to each county was determined by the county’s population size and its urban or rural categorization. Therefore, the very first step was to define urban and rural counties in Kentucky. The rural ratio threshold for each county was calculated based on the proportion of urban and rural populations [41]. Equation (1) demonstrates how a rural ratio is computed for county , where denotes the set of all counties. The rural ratio of county can be calculated as follows:
where
- : the rural population of .
- : the total population of .
Figure 2.
The framework of data collection.
Let and denote the sets of rural and urban counties, respectively. A county’s classification as either rural or urban can be defined as follows:
Survey invitations were distributed to residents using a saturation mailing service, which has been demonstrated an effective method for selecting potential survey respondents [42,43]. The invitation letter described the purpose of this study and provided both a web link and a QR code to participate in the survey. Participants were encouraged to share the link with other residents of Kentucky, who could participate by either clicking the link or scanning the QR code. Additionally, for individuals unable to access the survey via computer or mobile devices, a mail-in questionnaire option was made available for response. A total of 673 responses with valid zip codes were received from 105 counties in Kentucky by August 2019, including 418 from urban counties and 255 from rural counties.
According to the population data from the U.S. Census Bureau, Kentucky has an urban population of 2,533,343 and a rural population of 1,806,024. This results in a sample margin of error of 4% at a 95% confidence level, confirming the statistical validity of the responses. The urban-to-rural population ratio in Kentucky is 1.40, while the ratio of received survey responses is slightly higher at 1.64, suggesting that the sample included in this study is a modest over-representation of the urban population. Additionally, there are some biases in the sample, with a higher proportion of male respondents (58.1% compared to the Census figure of 48.9%) and individuals with a bachelor’s degree or higher (66.7% compared to 24.2% from the Census). Contributing to the discrepancies between the sample and the Kentucky population is the fact that the main topic of the survey research, AV technology, may appeal more to men and individuals with higher educational attainment. However, the invitation letters were randomly distributed to all counties in Kentucky without any restrictions on demographics (i.e., age, gender). Therefore, despite some sample skews, there is no reason to believe that the sample received in this research cannot be generalized and applied to Kentucky’s entire population.
3.3. Territorial and Regulatory Context
The study area exhibits a mixed urban–rural profile, with employment concentrated in a limited number of metropolitan counties and extensive low-density rural townships. Kentucky’s overall economic performance is around the national average in Gross Domestic Product (GDP), and the state has a larger rural population relative to urban areas. This structure is salient for relocation behavior because perceived commute burden, AV familiarity and exposure, and housing affordability differ systematically across settlement types. Land use authority is largely exercised at the municipal/county level, with metropolitan planning organizations (MPOs) coordinating transportation investment and corridor planning.
In the near term with SAE Levels 2 and 3 being technological available in the market, deployment is characterized by driver-in-the-loop systems where the human retains responsibility for the dynamic driving task. Federal vehicle standards and guidance define the safety/performance envelope, while state provisions govern on-road operation, insurance, and liability. Higher automation (i.e., Levels 4 and 5) is contingent on type-approval/waivers, safety reporting/data sharing, and local permissions (e.g., geo-fenced service areas).
3.4. Modeling Approaches
3.4.1. Structural Equation Model
We conducted an SEM-based path analysis using Mplus 7.11 software to explore the relationship between demographic characteristics and relocation willingness. SEM methods are suitable for many studies because of their suitability for dealing with latent variables and for assessing the causal analysis aspects of complex mediating relationships in many studies. Similarly, SEM techniques allow for causal inference and model evaluation using only observed variables [44,45,46]. In this study, we use a structural model due to the exclusive use of observed variables. The SEM formulation with only observed variables can be expressed as follows [43,47]:
where
- : a column vector of endogenous variables;
- : a column vector of exogenous variables;
- : a matrix of coefficients for direct effects between endogenous variables;
- : a matrix of coefficients reflecting the direct effect of exogenous variables on endogenous variables;
- : a vector of random error terms for the observed endogenous variables.
A distinctive characteristic of SEM is its capacity to deconstruct relationships, enabling the identification of both direct and indirect effects of observed variables [48]. According to [49], SEM is employed to capture the causal influences exerted by exogenous variables on endogenous variables, as well as the interrelationships among endogenous variables. In path model diagrams, the relationships between variables are typically represented by single-headed arrows, which indicate the directional influence of one variable on another [43,50].
To assess the adequacy of the model in fitting the observed data, several metrics are commonly applied. These metrics include the Standardized Root Mean Square Residual (), Root Mean Square Error of Approximation (), and Comparative Fit Index () [51,52]. Each of these metrics evaluates model fit from a distinct perspective.
The measures the average discrepancy between observed and model-implied covariances. A lower value indicates a better fit, with values below 0.08 generally considered acceptable [51,53]. The formula for its calculation is given as follows [54]:
where
- : model-implied covariance;
- : the observed covariance;
- : the number of observed variables.
The considers both the model complexity and sample size, providing a measure of fit per degree of freedom. values below 0.05 indicate a close fit, while values up to 0.08 are reasonable [55,56]. The calculation formula is presented as follows [54]:
where
- : the chi-square statistic;
- : the degrees of freedom;
- : the sample size.
The evaluates the improvement in fit by comparing the specified model to a null or baseline mode. A value exceeding 0.90 indicates a good model fit, with a value closer to 1 suggesting a better fit [51,55]. The formula for this metrics is given as follows [54]:
where
- : the chi-square statistic of the specified model;
- : the degrees of freedom for the specified model;
- : the chi-square statistic for the baseline (null) model;
- : the degrees of freedom for the baseline (null) model.
In this study, the modeling approach involves iteratively adding direct paths to the path model until the final model satisfies the established goodness-of-fit criteria. If the fit indices do not meet the desired thresholds, the model undergoes modifications, and alternative models are tested iteratively until the optimal model is achieved.
3.4.2. Machine Learning Model
Compared to traditional models, machine learning (ML) models demonstrate a high degree of flexibility, allowing them to identify complex, nonlinear relationships within the data without the constraints of fixed assumptions, which is crucial for achieving high predictive accuracy in dynamic, multifactor scenarios like residential relocation [57]. Typically, machine learning problems can be categorized into two categories: classification (where the output is a discrete categorical variable) and regression (where the output is a continuous variable). Predicting residential relocation willingness is a classification problem. By accurately predicting the categories of relocation willingness, policymakers and urban planners can develop targeted interventions, such as adjusting housing policies or optimizing transportation infrastructure, to more effectively address anticipated changes in short- and long-term housing demand and preferences. To predict changes in residents’ willingness to relocate, four machine learning models were employed in Python 3.12: random forest (RF), support vector machine (SVM), extreme gradient boosting (XGBoost), and multilayer perceptron (MLP).
RF [58] is an ensemble machine learning algorithm extensively employed in classification and prediction tasks. The method constructs multiple decision trees during training and aggregates their outputs to generate the final prediction. Compared to a single decision tree, RF generally provides enhanced accuracy and improved robustness.
SVM [59,60] is a versatile machine learning algorithm that can be applied to both classification and regression tasks. Its primary goal is to establish an optimal decision boundary, or hyperplane, that separates an n-dimensional space into distinct classes. By maximizing this margin, SVM seeks to minimize classification error and enhance generalization performance.
XGBoost [61] is a machine learning technique commonly used for building supervised regression models. It is known for its efficiency and computational strength, with prediction accuracy significantly surpassing traditional decision tree models. The algorithm relies on base learners and enhances overall predictive performance by continually training and adding new base learners to form an ensemble learning model.
MLP [62,63] is a widely used artificial neural network model that consists of an input layer, one or more hidden layers, and an output layer. As a typical structure of feedforward neural networks, it receives signals through the input layer and processes them through computations performed by neurons in the hidden layers, passing the results layer by layer. The complexity of the MLP depends on the number of layers and the number of neurons in each layer. Ultimately, the signal reaches the output layer after passing through the hidden layers, generating the final output of the model, which represents the result of processing the input signals.
3.4.3. Resampling Methods
The imbalanced distribution of relocation willingness categories requires addressing the skewed dataset. This imbalance causes models to favor the majority class, as they tend to prioritize the class with more instances, leading to an over-prediction of these categories. To address this issue and balance the representation of classes within the dataset, this study applies the Synthetic Minority Over-sampling Technique (SMOTE) [64]. Rather than merely replicating existing instances, SMOTE generates synthetic minority class samples by interpolating between randomly selected instances of the minority class. This approach effectively addresses class imbalance without duplicating data, thereby reducing the risk of overfitting [65,66].
3.4.4. Model Interpretation
Complex ML models excel at capturing nonlinear relationships between features and targets, but they are limited by their lack of interpretability, often referred to as the black-box nature. The SHAP method, proposed by Lundberg and Lee (2017) [67], is a game-theory-based approach that assigns a significance value to each feature to represent its contribution to the model’s output. The core idea of SHAP is to compute the marginal contribution of each feature to the model’s predicted result. The method calculates the contribution of each feature, which can either be positive or negative, and then sums these contributions to derive the final prediction [68]. Assuming that the sample is denoted as , and the jth feature of the sample is , SHAP’s main contribution lies in generating locally additive feature attribution [69], as described in Equation (7).
where
- : the predicted value of the model for sample
- : the mean of the predicted values of the model for all samples;
- : total number of features used in the prediction;
- : the SHAP value of the jth feature for sample , representing the marginal contribution of the feature to the prediction.
Thus, the sum of all SHAP values for a sample equals the difference between the actual prediction and the mean prediction. When , the jth feature contributes positively to the model’s prediction; and vice versa, it indicates a negative contribution. Additionally, the absolute SHAP value reflects the magnitude of the feature’s effect on the prediction, therefore it can be used as a feature importance score in the model [70]. Features with larger absolute SHAP values are considered more influential in shaping the model’s predictions [71].
4. Results and Discussions
4.1. Revealing the Mechanism of Willing to Relocate with AV Technology at Disposal
4.1.1. General Statistics of Relocation in the Context of Levels 2 and 5
Since the mechanisms underlying relocation decisions under Levels 2 and 5 automation are modeled separately, Table 2 and Table 3 summarize the descriptive statistics of the samples used for analyzing residential relocation in each scenario. Notably, the dataset for the Level 2 scenario contains 425 observations, one fewer than the Level 5 dataset (426 observations) due to a single missing record.
Table 2.
Descriptive statistics of SEM samples from Level 2 scenarios (N = 425).
Table 3.
Descriptive statistics of SEM samples from Level 5 scenarios (N = 426).
Table 2 presents the descriptive statistics for respondents’ willingness to relocate under Level 2 automation. The results reveal that 82.4% of respondents would not consider relocating farther from their workplace when relying on Level 2 automated driving technology. This finding suggests a limited influence of current AV capabilities on individuals’ residential relocation decisions.
In contrast, Table 3 summarizes respondents’ willingness to relocate under the Level 5 scenario, where fully automated driving allows individuals to engage in other tasks while commuting. The dataset comprises 426 observations, and the results indicate that 44.4% of respondents would consider relocating farther from their workplace if Level 5 automation were available. Compared to the Level 2 scenario, a notably higher proportion of respondents expressed a willingness to relocate under Level 5 conditions, highlighting the potential transformative impact of advanced AV technology on residential choices.
4.1.2. Results of SEM-Based Path Analysis
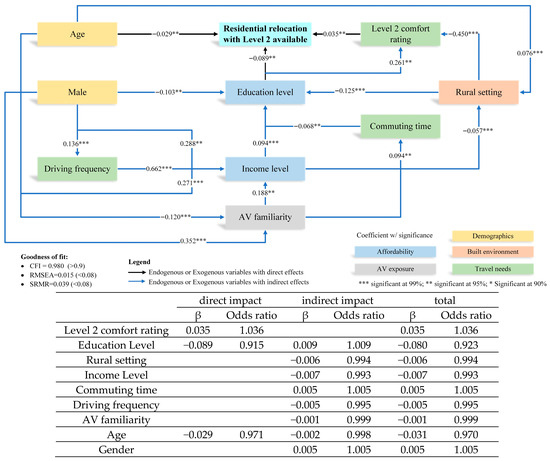
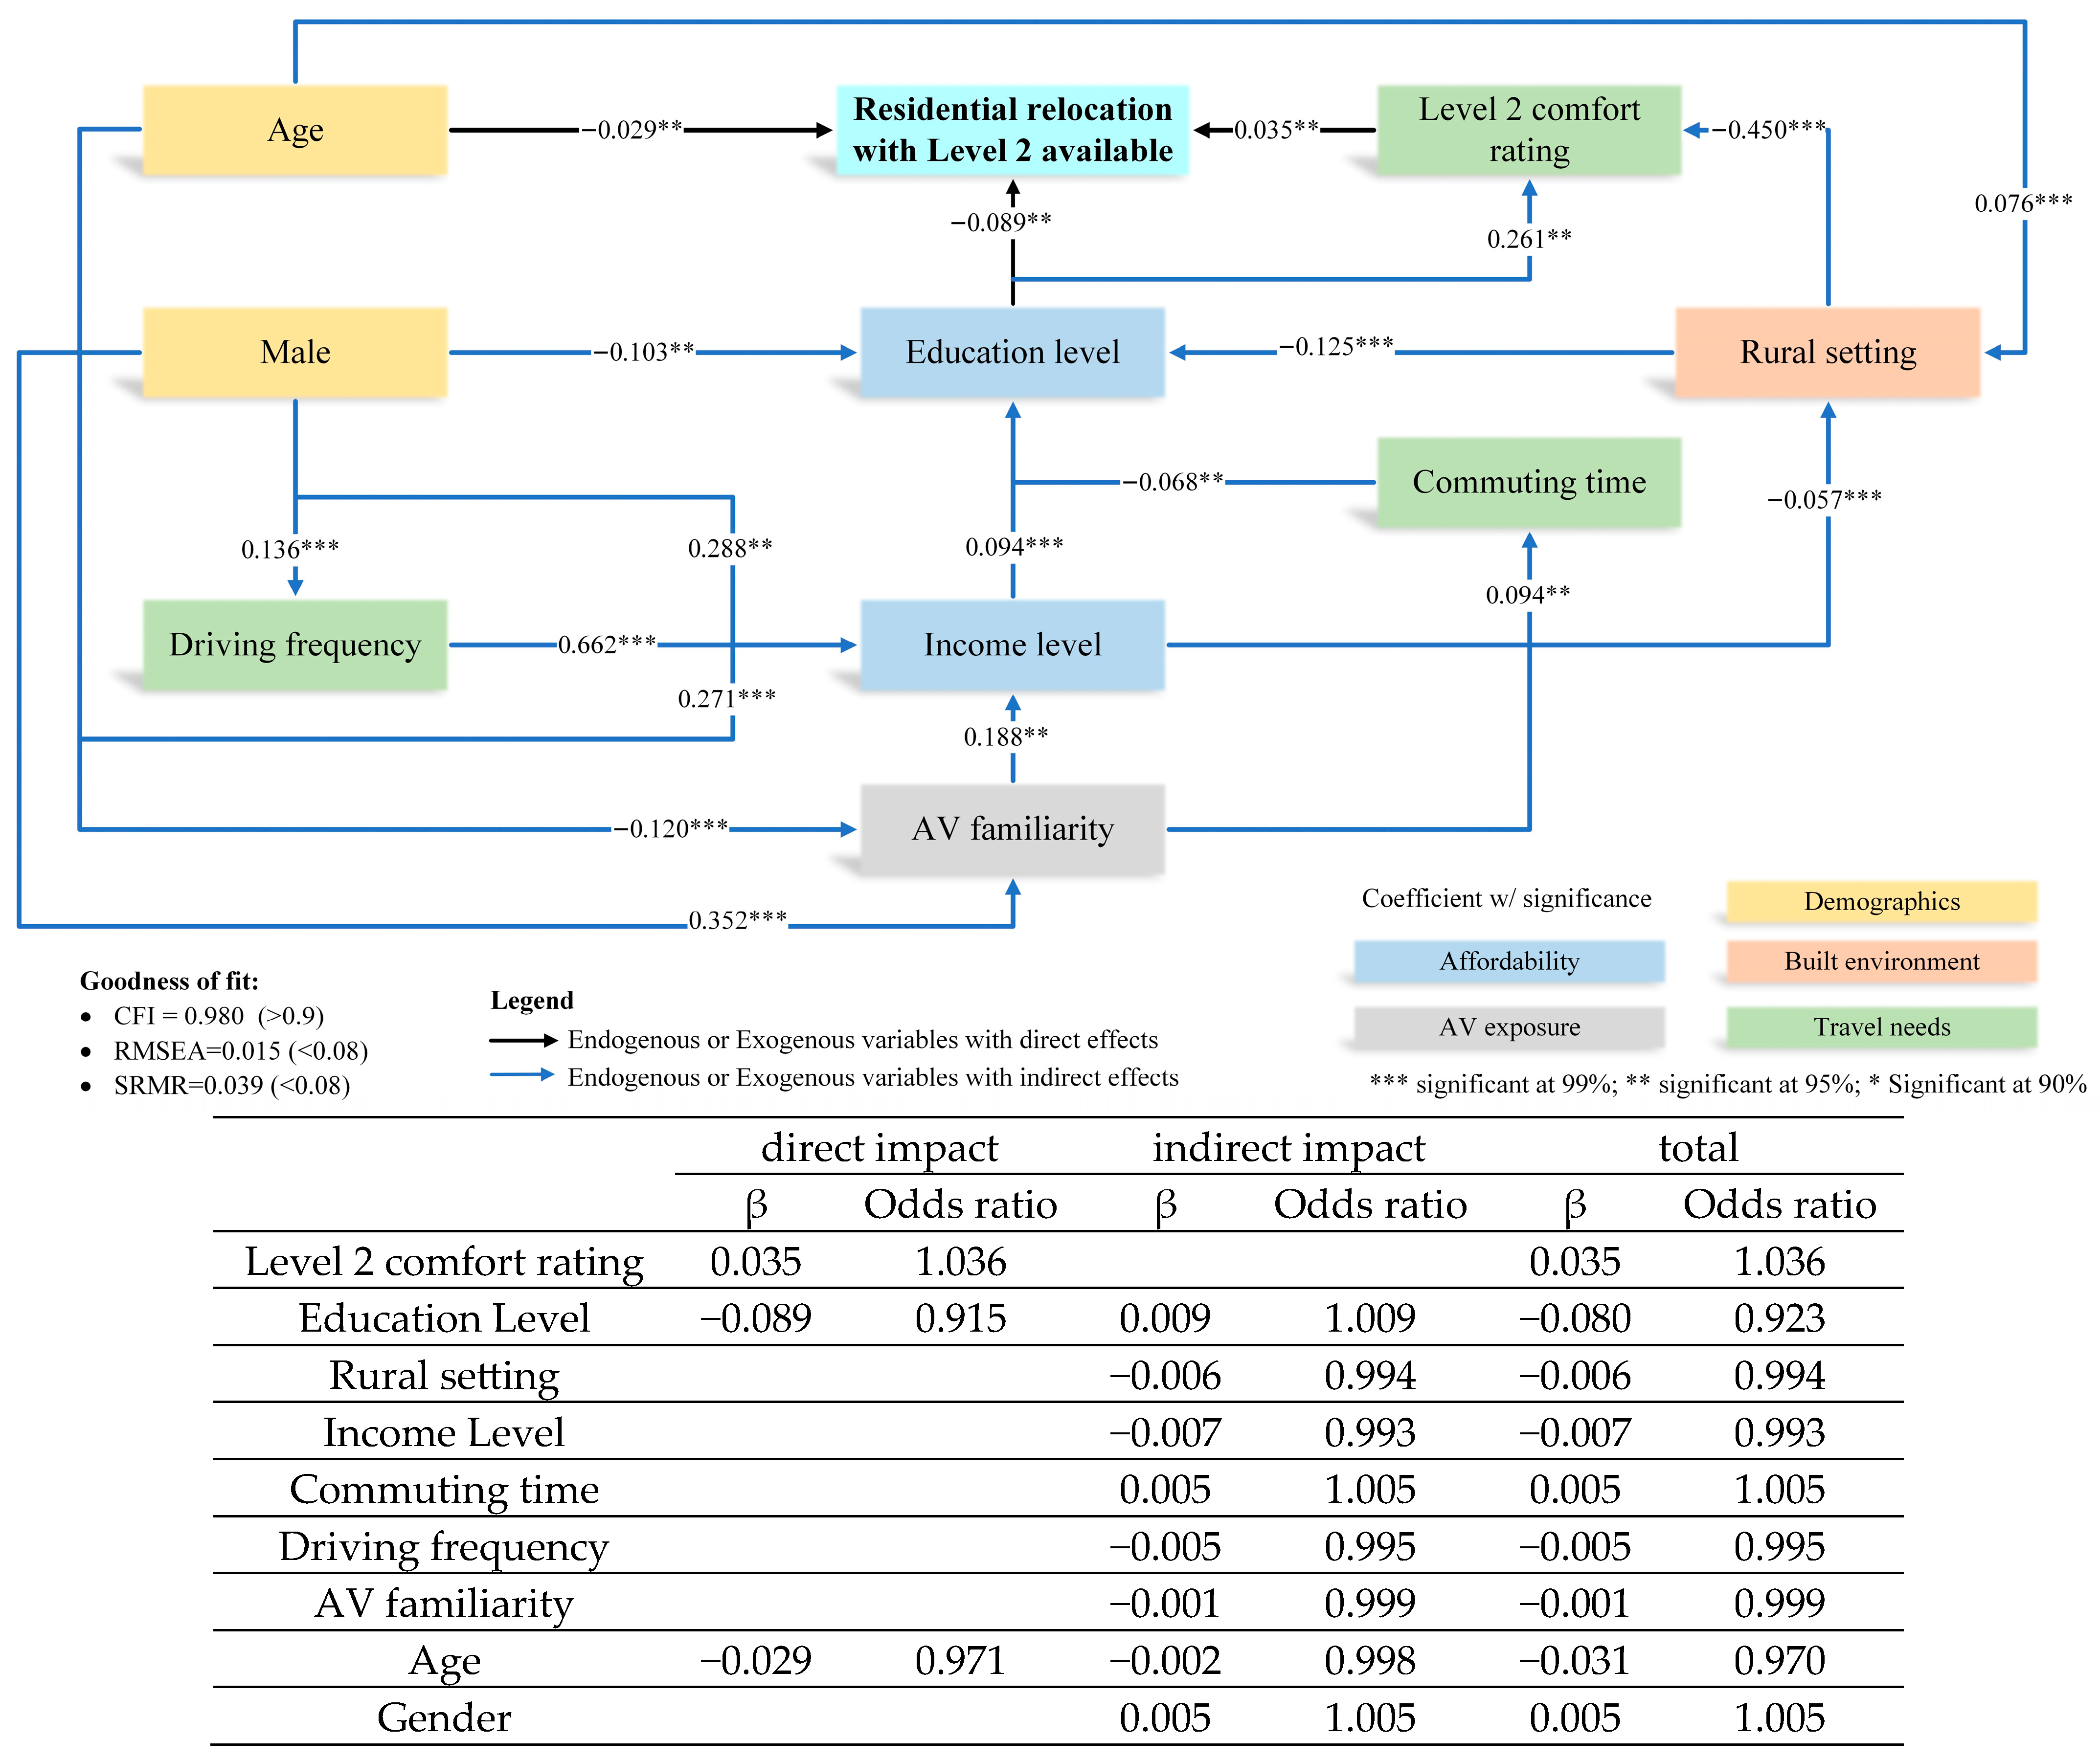
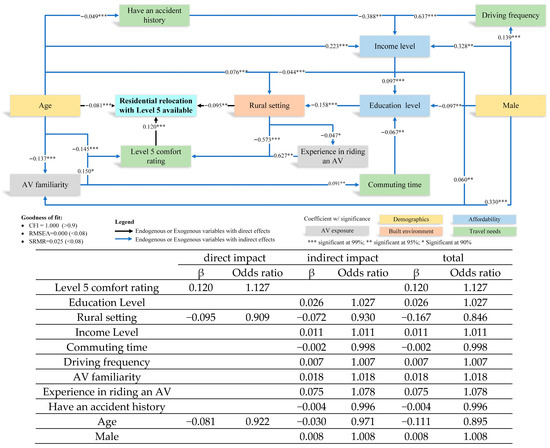
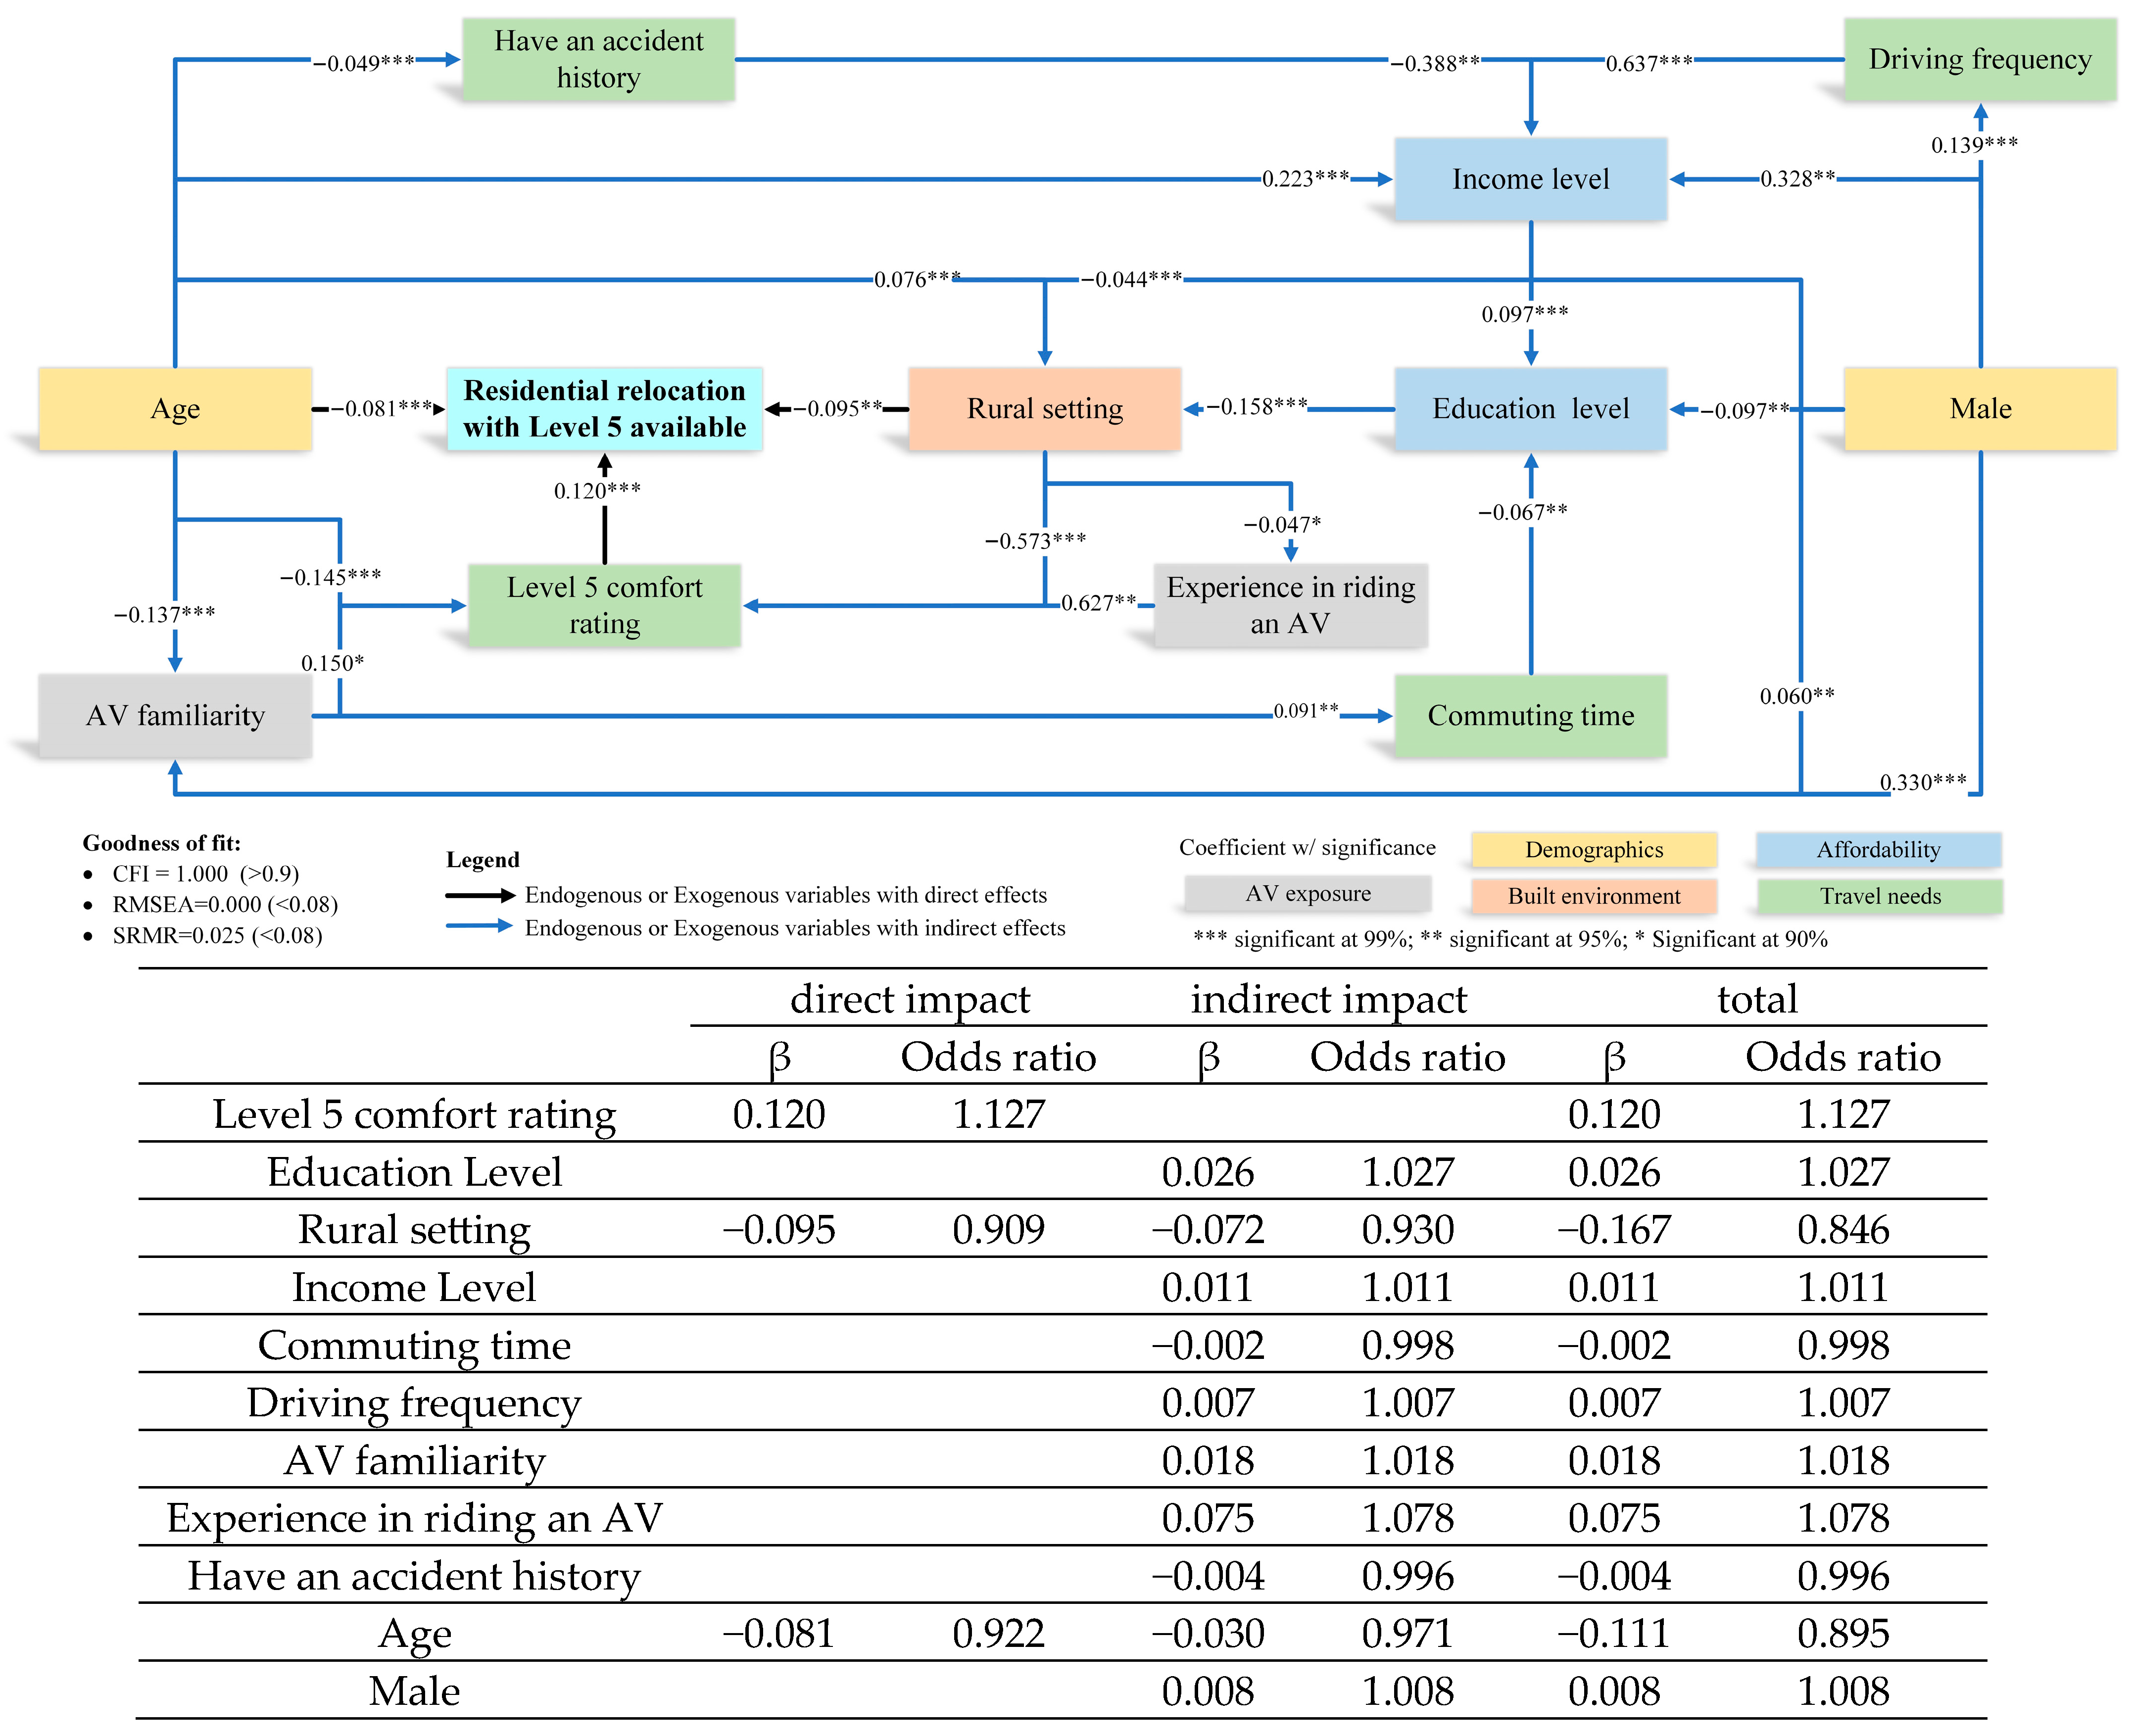
Figure 3 and Figure 4 illustrate the finalized SEM developed to reveal the mechanisms underlying individuals’ willingness to relocate under Levels 2 and 5 AV scenarios, respectively. Both models adequately fit the observed data through the goodness-of-fit metrics (i.e., in Level 2 model: , , ; in Level 5 model: , , ).
Figure 3.
Mechanism of relocation with Level 2 automation available.
Figure 4.
Mechanism of relocation with Level 5 automation available.
When analyzing the modeling results for why individuals consider living further from their workplace under different levels of automation, both similarities and differences emerge across the two scenarios.
From the perspective of demographic characteristics, age and gender are consistently identified as significant factors influencing the likelihood of residential relocation under both Level 2 and Level 5 automation scenarios. It is important to note that age and gender are treated as exogenous variables in this analysis, meaning they are not influenced by other variables within the model [43,72,73]. This study assumes that the effects of these exogenous variables on relocation willingness are indirect and must be mediated through one or more endogenous variables. These mediating factors are drawn from categories including affordability, travel needs, built environment, and AV exposure.
In particular, age demonstrates a significant negative association with the probability of relocation in both contexts. As shown in Figure 3 and Figure 4, the probit coefficient for age is −0.031 under Level 2 automation and −0.111 under Level 5 automation. These results indicate that the likelihood of residential relocation decreases with increasing age, regardless of the automation level. This consistent trend across both scenarios suggests that older individuals are generally less inclined to consider relocation, even as automation technology advances. Existing studies have also supported this conclusion [9,11,12,35].
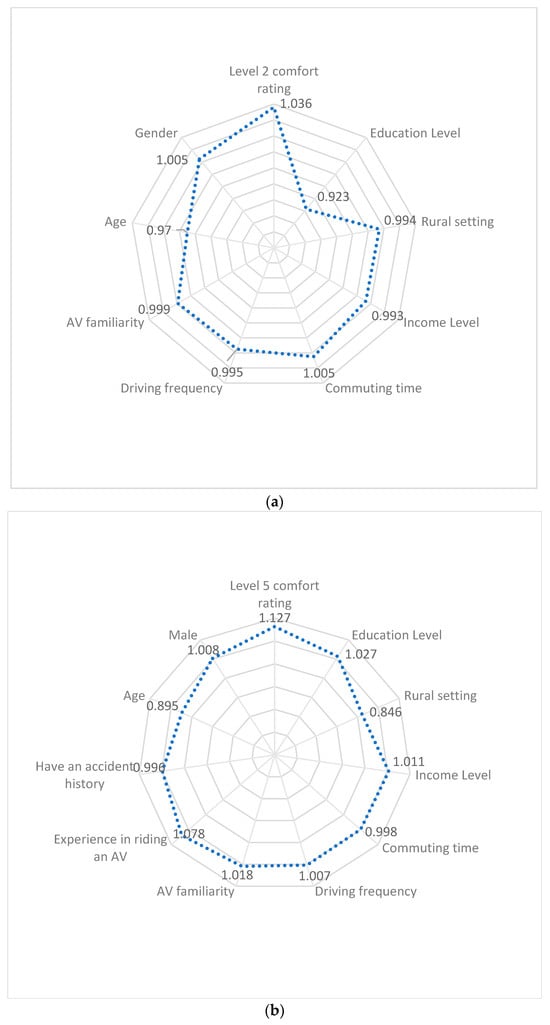
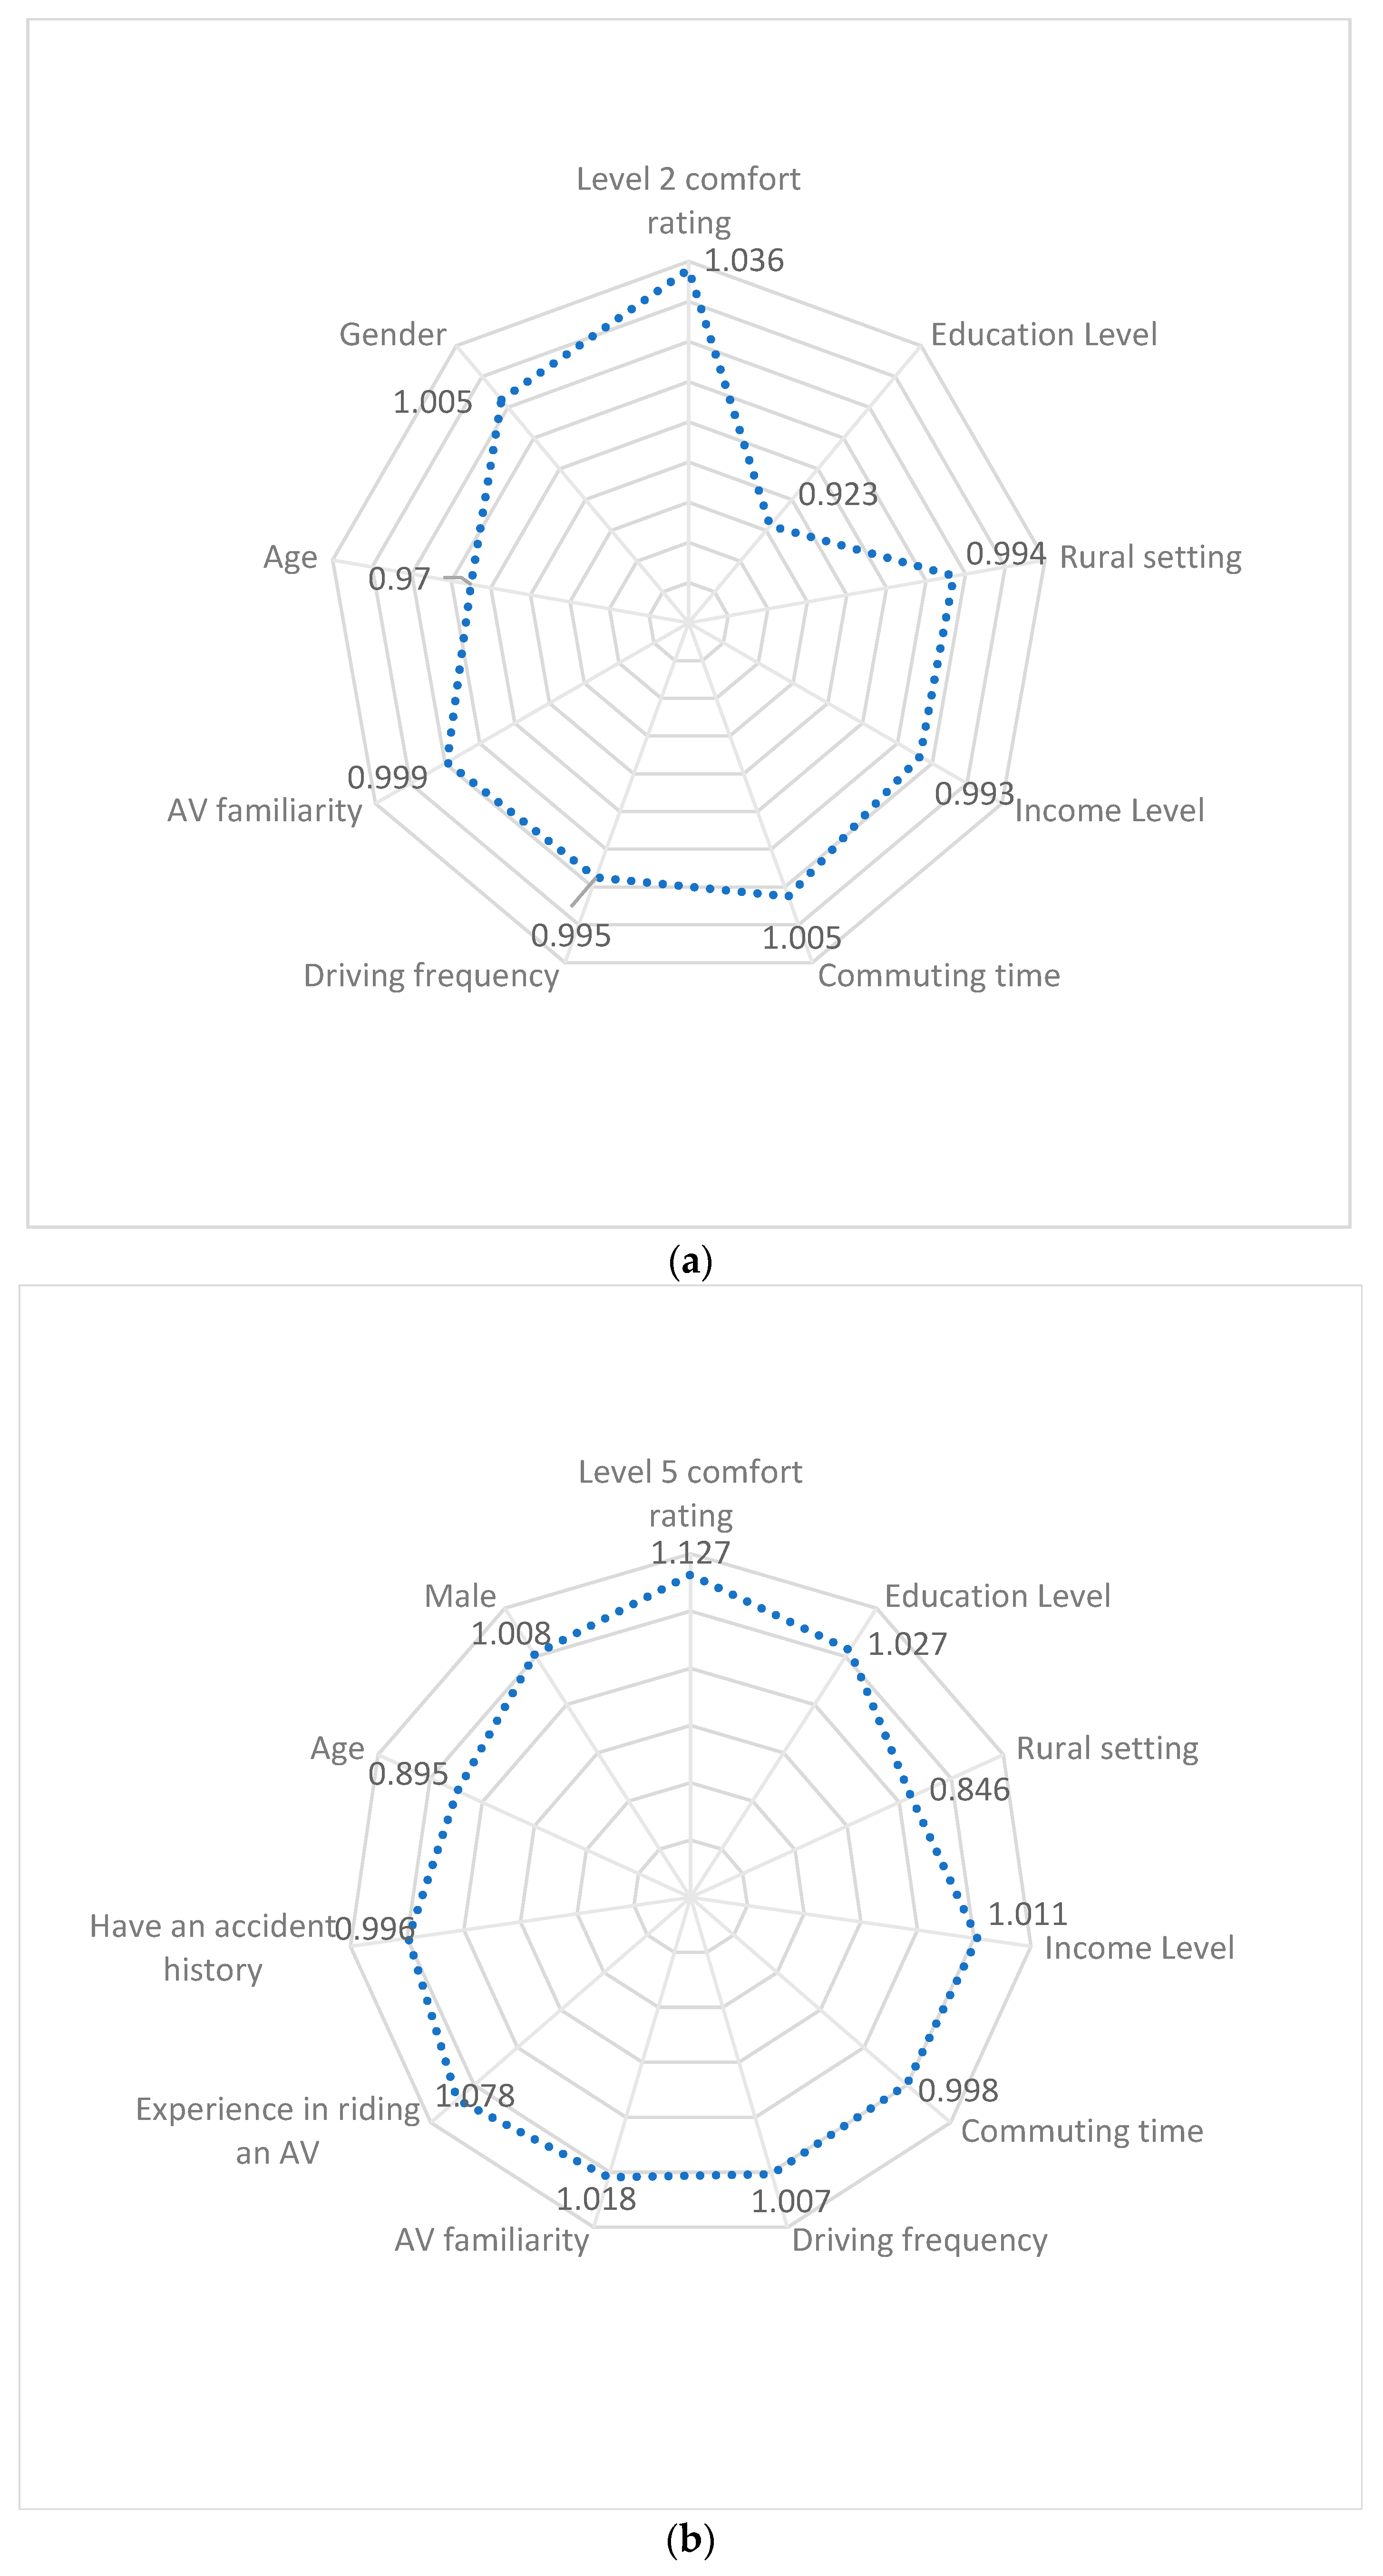
Contributing factors were ranked based on their total effects on relocation willingness regarding the sum of both the indirect and direct effects. Figure 5 illustrates the identified factors’ total odds ratio (i.e., odds ratio of direct impact plus odds ratio of indirect impact) on Relocation willingness under Levels 2 and 5.
Figure 5.
Total impacts of identified factors on relocation willingness under (a) Level 2 and (b) Level 5 automation ranked by overall odds ratios.
Moreover, this research extends the current literature by identifying the specific pathways through which age influences the likelihood of relocation under varying levels of automation. These pathways are outlined as follows:
The influential paths through which age impacts the likelihood of relocation are different between Level 2 and Level 5 automation, as detailed in Table 4. Under Level 2 automation, age primarily exerts its influence indirectly through mediating factors such as rural settings, Level 2 comfort rating, income level, education level, AV familiarity, and commuting times. For instance, older individuals living in rural areas and with lower comfort ratings for Level 2 automation are less likely to relocate, as indicated by a β value of −0.001 for the path “Age-Rural setting-Level 2 comfort rating-Residential relocation with Level 2 available”. Similarly, older individuals with higher levels of affordability are less likely to relocate in the Level 2 scenario, as seen in the path “Age-Income level-Education level-Residential relocation with Level 2 available (β = −0.002)”. Also, according to the path “Age-AV familiarity-Commuting time-Education level-Residential relocation with Level 2 available (β = −0.0001)”, older adults with low AV familiarity and shorter commuting times are generally less inclined to relocate.
Table 4.
Identified paths through which the exogenous variable “age” affects the likelihood of relocation.
Under Level 5 automation, the indirect paths reveal a stronger influence of comfort rating and rural setting. For example, the path “Age-Level 5 comfort rating-Residential relocation with Level 5 available” exhibits the strongest negative influence (β = −0.017), followed by “Age-Rural setting-Residential relocation with Level 5 available (β = −0.007)”. These results suggest that older adults may be less inclined to relocate, even with access to full automation, due to their living in rural areas or lower comfort with Level 5 AV technology. Additionally, lower familiarity with AV technology among older adults may reduce their willingness to relocate, as evidenced by the indirect path “Age-AV familiarity-Level 5 comfort rating-Residential relocation with Level 5 available (β = −0.002)”. Conversely, positive effects are observed through paths such as “Age-Income level-Education level-Rural setting-Residential relocation with Level 5 available (β = 0.0003)”, suggesting that older individuals with higher affordability levels are more likely to relocate, potentially to locations farther from their workplace.
As summarized in Table 5, gender exhibits a significant positive association with the likelihood of relocation in both Level 2 and Level 5 automation contexts. As illustrated in Figure 3 and Figure 4, the probit coefficient for gender is 0.005 under Level 2 automation and 0.008 under Level 5 automation. These results suggest that males are more likely to consider residential relocation, regardless of the level of automation. The observed pattern in both scenarios indicates that men are generally more inclined to relocate as automation technology advances. This result is consistent with existing studies [10,12]. Moreover, this study adds to the literature by not only confirming the influence of gender on relocation decisions but also revealing the underlying mechanisms driving these decisions. They are as follows:
Table 5.
Identified paths through which the exogenous variable “gender” affects the likelihood of relocation.
Table 5 details the specific paths through which gender influences the likelihood of relocation under both Level 2 and Level 5 automation scenarios. For Level 2 automation, men with higher levels of affordability may demonstrate reluctance to relocate, potentially due to satisfaction with their current living conditions, as indicated by the path “Male-Income level-Education level-Residential relocation with Level 2 available (β = −0.002)”. However, the path “Male-Income level-Education level-Level 2 comfort rating-Residential relocation with Level 2 available (β = 0.0002)” suggests that a higher Level 2 comfort rating could motivate them to consider relocation. Moreover, as seen in path “Male-AV familiarity-Commuting-Education level-Residential relocation with Level 2 available (β = 0.0002)”, men with higher AV proficiency and longer commutes, who tend to have lower education levels, are more likely to consider relocation.
For Level 5 automation, men with higher income levels are more inclined to relocate farther from their workplace, as indicated by the path “Male-Income level-Rural setting-Residential relocation with Level 5 available (β = 0.001)”. In contrast, the path “Male-Education level-Rural setting-Residential relocation with Level 5 available (β = −0.001)” suggests that men with lower education levels are often reluctant to relocation. In addition, the path “Male-Driving frequency-Income level-Rural setting-Residential relocation with Level 5 available (β = 0.0003)” indicates that men with higher driving frequency are more likely to consider relocation. Also, the path “Male-AV familiarity-Level 5 comfort rating-Residential relocation with Level 5 available (β = 0.006)” demonstrates that higher familiarity with AV technology increases relocation likelihood, primarily through improved comfort with Level 5 automation.
4.1.3. Summary
The results of the SEM analysis reveal important findings regarding demographic factors and their impact on residential relocation in Levels 2 and 5 AV scenarios. Specifically, for age, the analysis shows a consistent negative association with relocation likelihood across both automation levels. This may be attributed to older adults being more likely to live in rural areas, having less familiarity with AVs, and being lower comfort with AV technology. Gender also has an impact on residential relocation, with men generally leading to a higher likelihood of relocation under both automation levels. For Level 2 automation, men with higher affordability are less inclined to move farther from urban centers, while those with lower education levels are more likely to relocate. Interestingly, this trend reverses under Level 5 automation, where men with greater affordability are more willing to relocate and those with lower education levels are less likely to relocate. Additionally, men with higher comfort ratings, greater familiarity with AV technology, and more frequent driving behavior generally likely to consider relocate.
Comparable evidence from other regions suggests that these demographic effects are filtered through distinct market and built-environment contexts. Studies in East Asia emphasize accessibility and housing prices as central to location choice; lower-income households place greater weight on transit access, while higher-educated households more readily trade distance for amenity and price [74,75]. Work from Vietnam similarly highlights that income, ownership status, housing type, and commuting conditions are primary contributing factors. European findings point to strong roles for price, safety/quiet neighborhoods [76], and the possibility that AV could induce outward relocation depending on current residential location [38]. In summary, these comparisons reinforce our core result that built-environment, affordability, and education level preferences shape how comfort and familiarity with AV influence relocation intentions, and the effect sizes will vary with each region’s density, transit supply, and housing systems.
The mechanisms influencing individuals’ willingness to relocate under the Levels 2 and 5 AV impact scenarios are revealed. Building on the age, gender, and other mediating variables identified in the previous sections as influential factors affecting the willingness to relocate farther from work, Section 4.2 will focus on predicting changes in residents’ relocation willingness under varying levels of automation.
4.2. Predicting the Relocation Willingness with AV Technology at Disposal
This section presents the results of the four models used to predict changes in residents’ willingness to relocate. The input variables for all the models include age, gender, and other factors affecting willingness to relocate as mentioned in Section 4.1. A total of 420 samples were used for model training after excluding cases with missing responses. The model output represents the changes in residents’ willingness to relocate between Levels 2 and 5. Specifically, the model categorizes this willingness into four distinct classes, labeled as [0, 1, 2, 3], corresponding to the following cases:
- Category 0 (label: 0): Residents are not willing to relocate in either the short or long term.
- Category 1 (label: 1): Residents are unwilling to relocate in the short term but are willing to relocate in the long term.
- Category 2 (label: 2): Residents are willing to relocate in the short term but unwilling to relocate in the long term.
- Category 3 (label: 3): Residents are willing to relocate in both the short and long term.
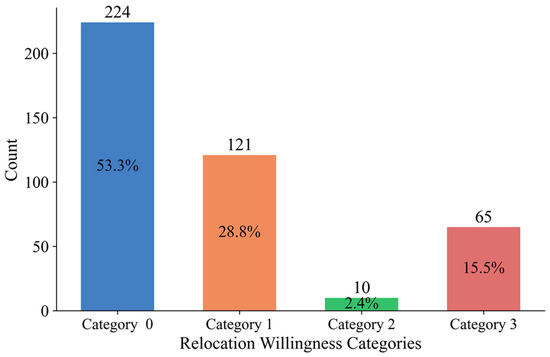
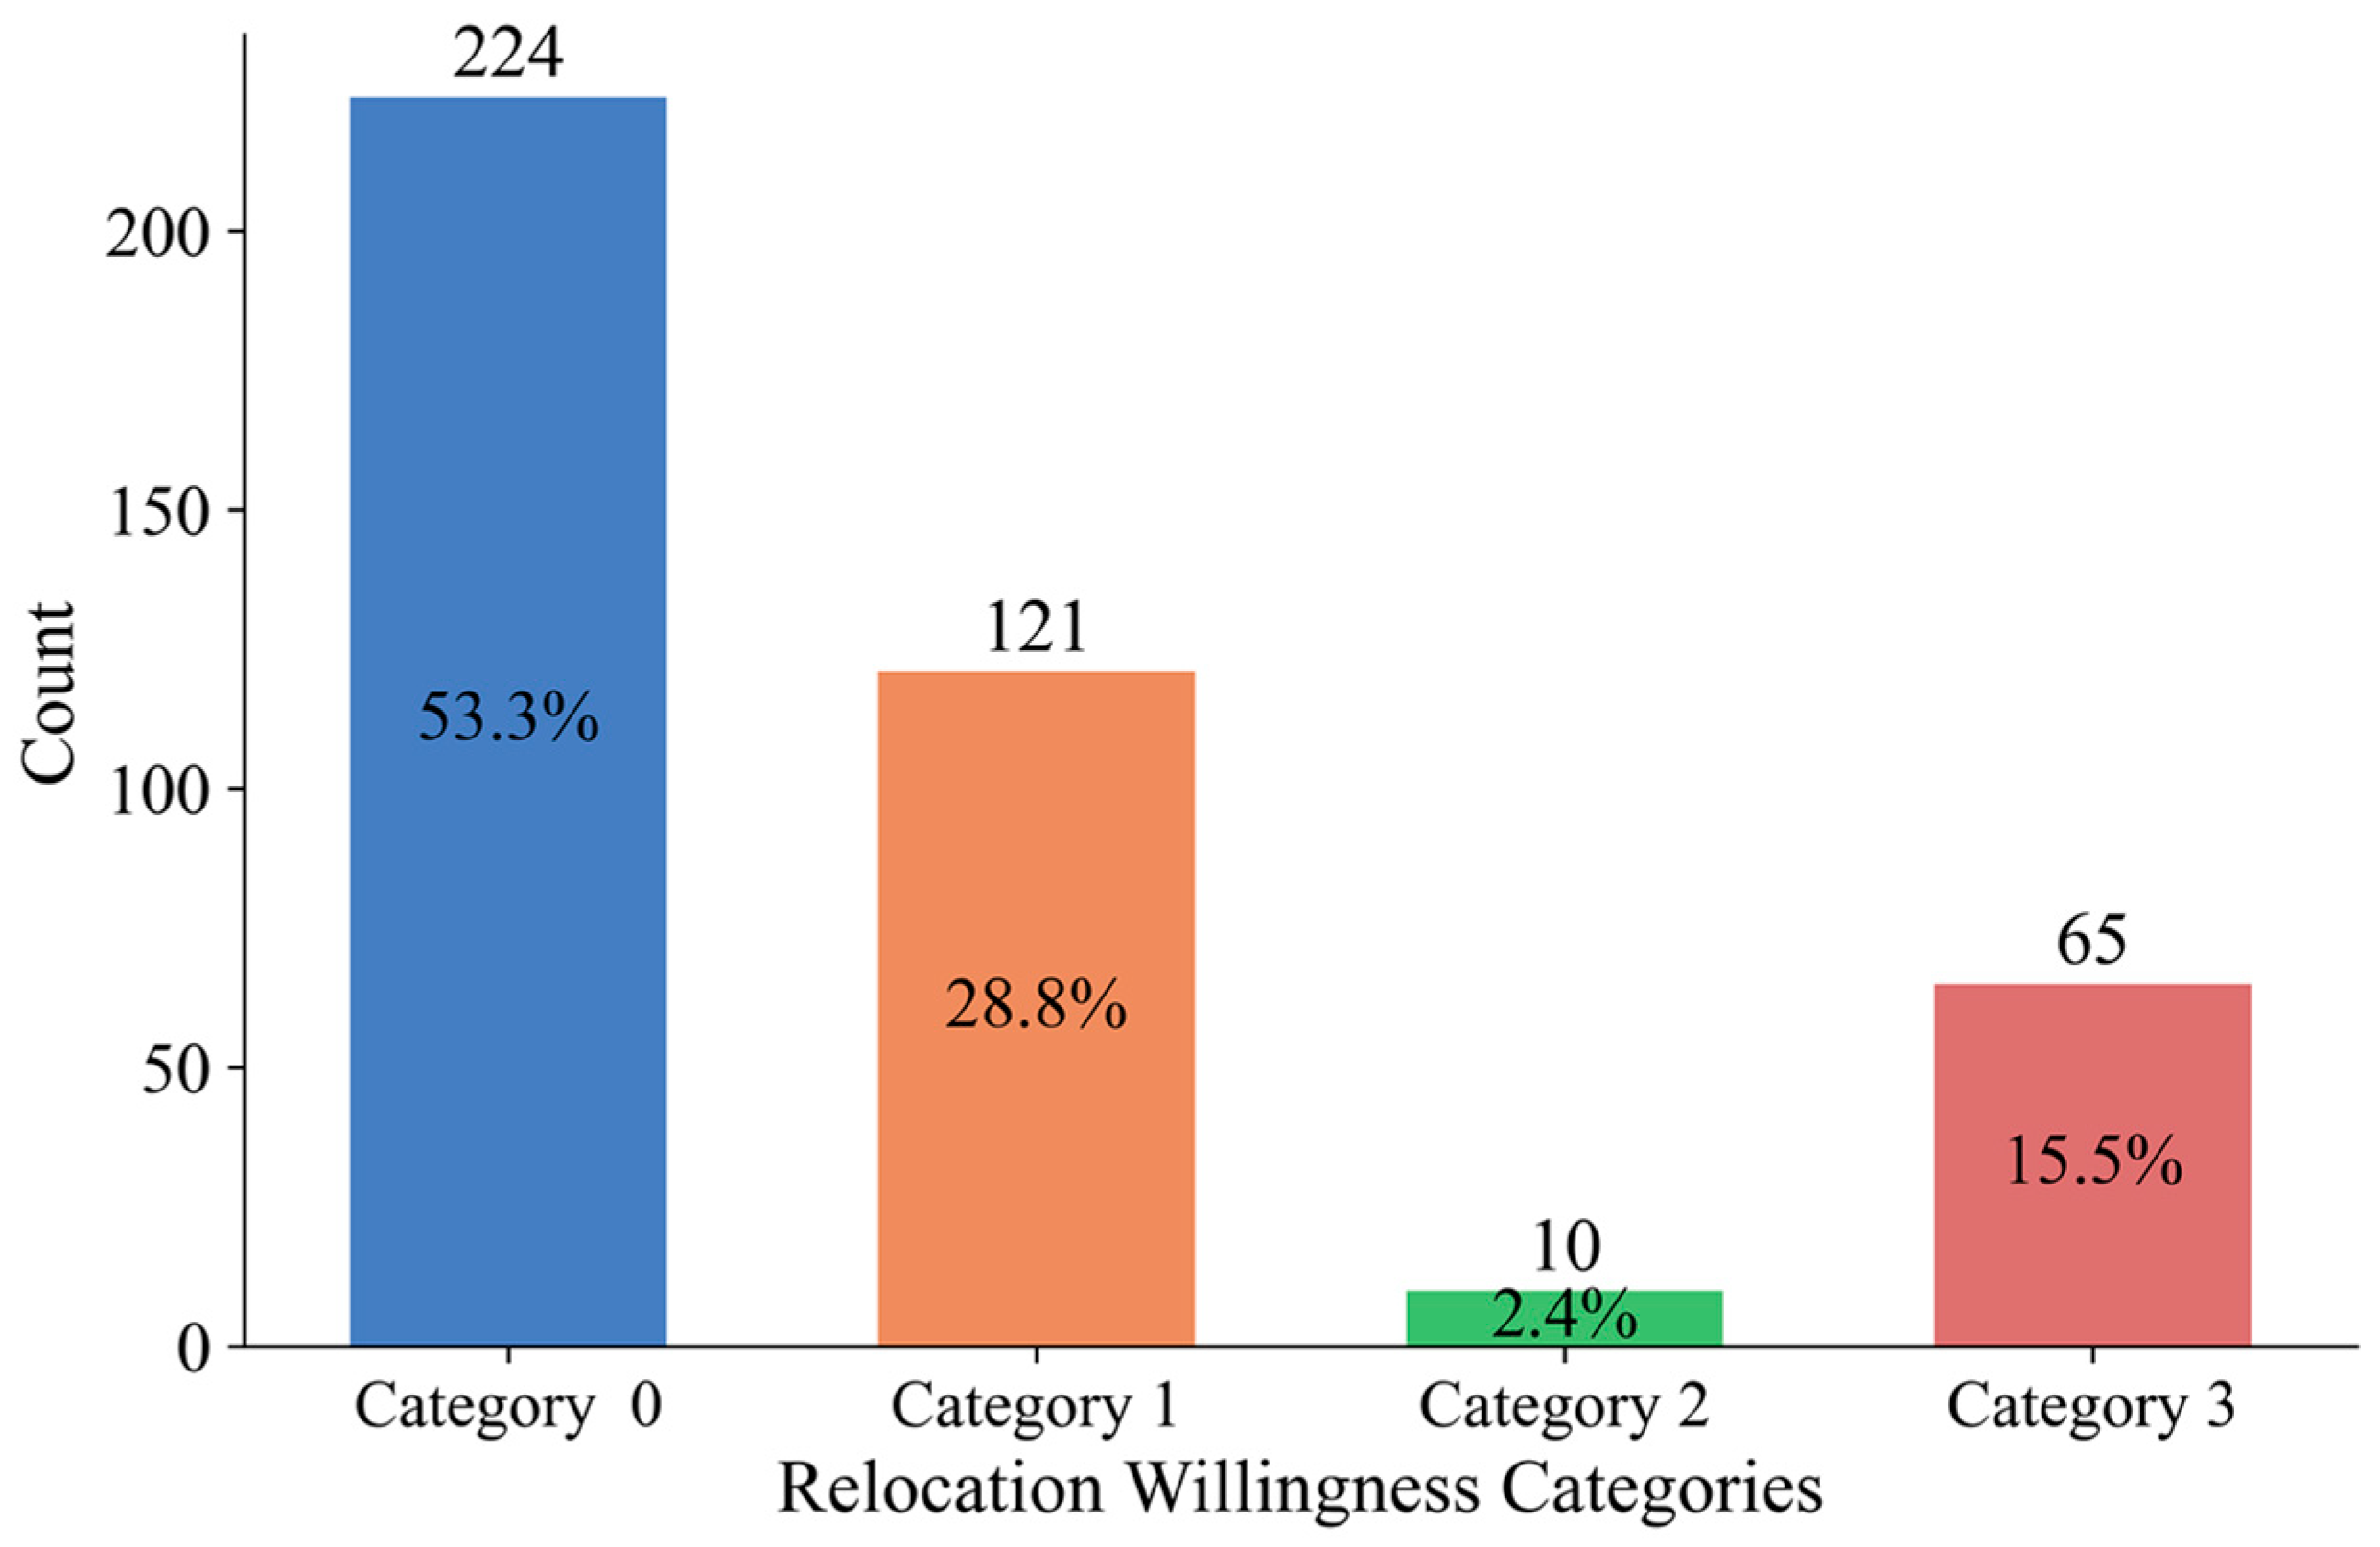
Figure 6 illustrates the distribution of the four relocation willingness categories. As shown, the largest proportion of the sample, 53.3%, consists of individuals who are unwilling to relocate both in the short and long term. In contrast, the smallest proportion, only 2.4%, is made up of individuals willing to relocate in the short term but unwilling in the long term.
Figure 6.
Distribution of the four categories regarding relocation willingness.
For all machine learning models, the dataset was randomly split into training and test sets, with 80% of the data used for training and the remaining 20% used for testing. To ensure model robustness, SMOTE was applied exclusively to the training set, leaving the test set unchanged to prevent introducing synthetic samples during evaluation. The details of the original and SMOTE-oversampled datasets are presented in Table 6.
Table 6.
Number of samples in the training set before and after applying SMOTE.
Performance metrics, including accuracy, precision, recall, and F1 score, were used to evaluate the effectiveness of the models. Table 7 demonstrates the performance comparison of different machine learning models in predicting changes in relocation willingness on the test set, both with and without the application of SMOTE. In Table 7a, which shows the results without SMOTE, MLP achieved the highest accuracy (0.667), followed by RF with an accuracy of 0.619. The precision, recall, and F1 scores varied across the models, with MLP outperforming the other models in terms of weighted F1-score (0.635). However, none of the models performed well in predicting Category 2, as indicated by the low precision, recall, and F1 scores for this category.
Table 7.
Performance of different models in predicting changes in relocation willingness on the test set (a) without SMOTE and (b) with SMOTE.
In Table 7b, where SMOTE was applied to oversample the training data, the accuracy of all models improved, with MLP again leading with an accuracy of 0.679. Notably, SMOTE enhanced the precision of most models, particularly for Category 2, with SVM and MLP showing improvements in both weighted precision (0.641 and 0.666, respectively) and weighted recall (0.643 and 0.679, respectively). The weighted F1-scores also improved across all models, with MLP achieving the highest value (0.669). Compared to the results without SMOTE, the performance for Category 2 improved for all models, highlighting the effectiveness of SMOTE in addressing category imbalance.
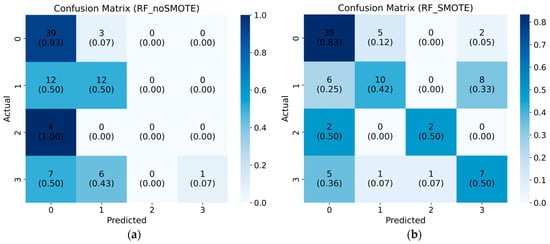
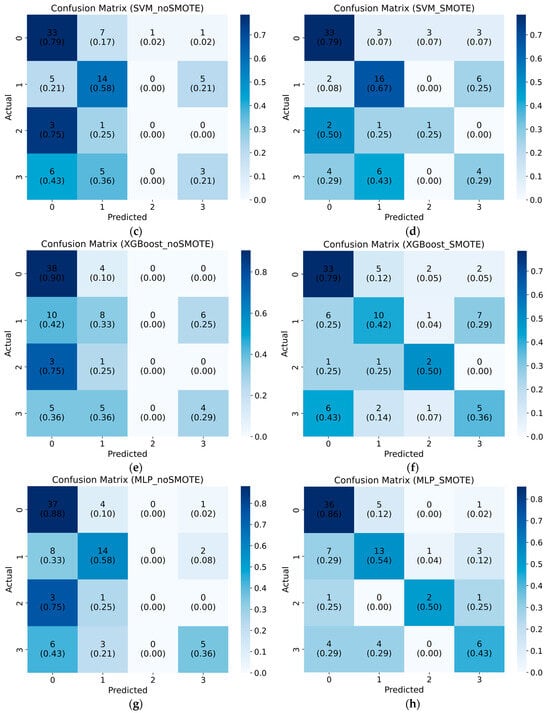
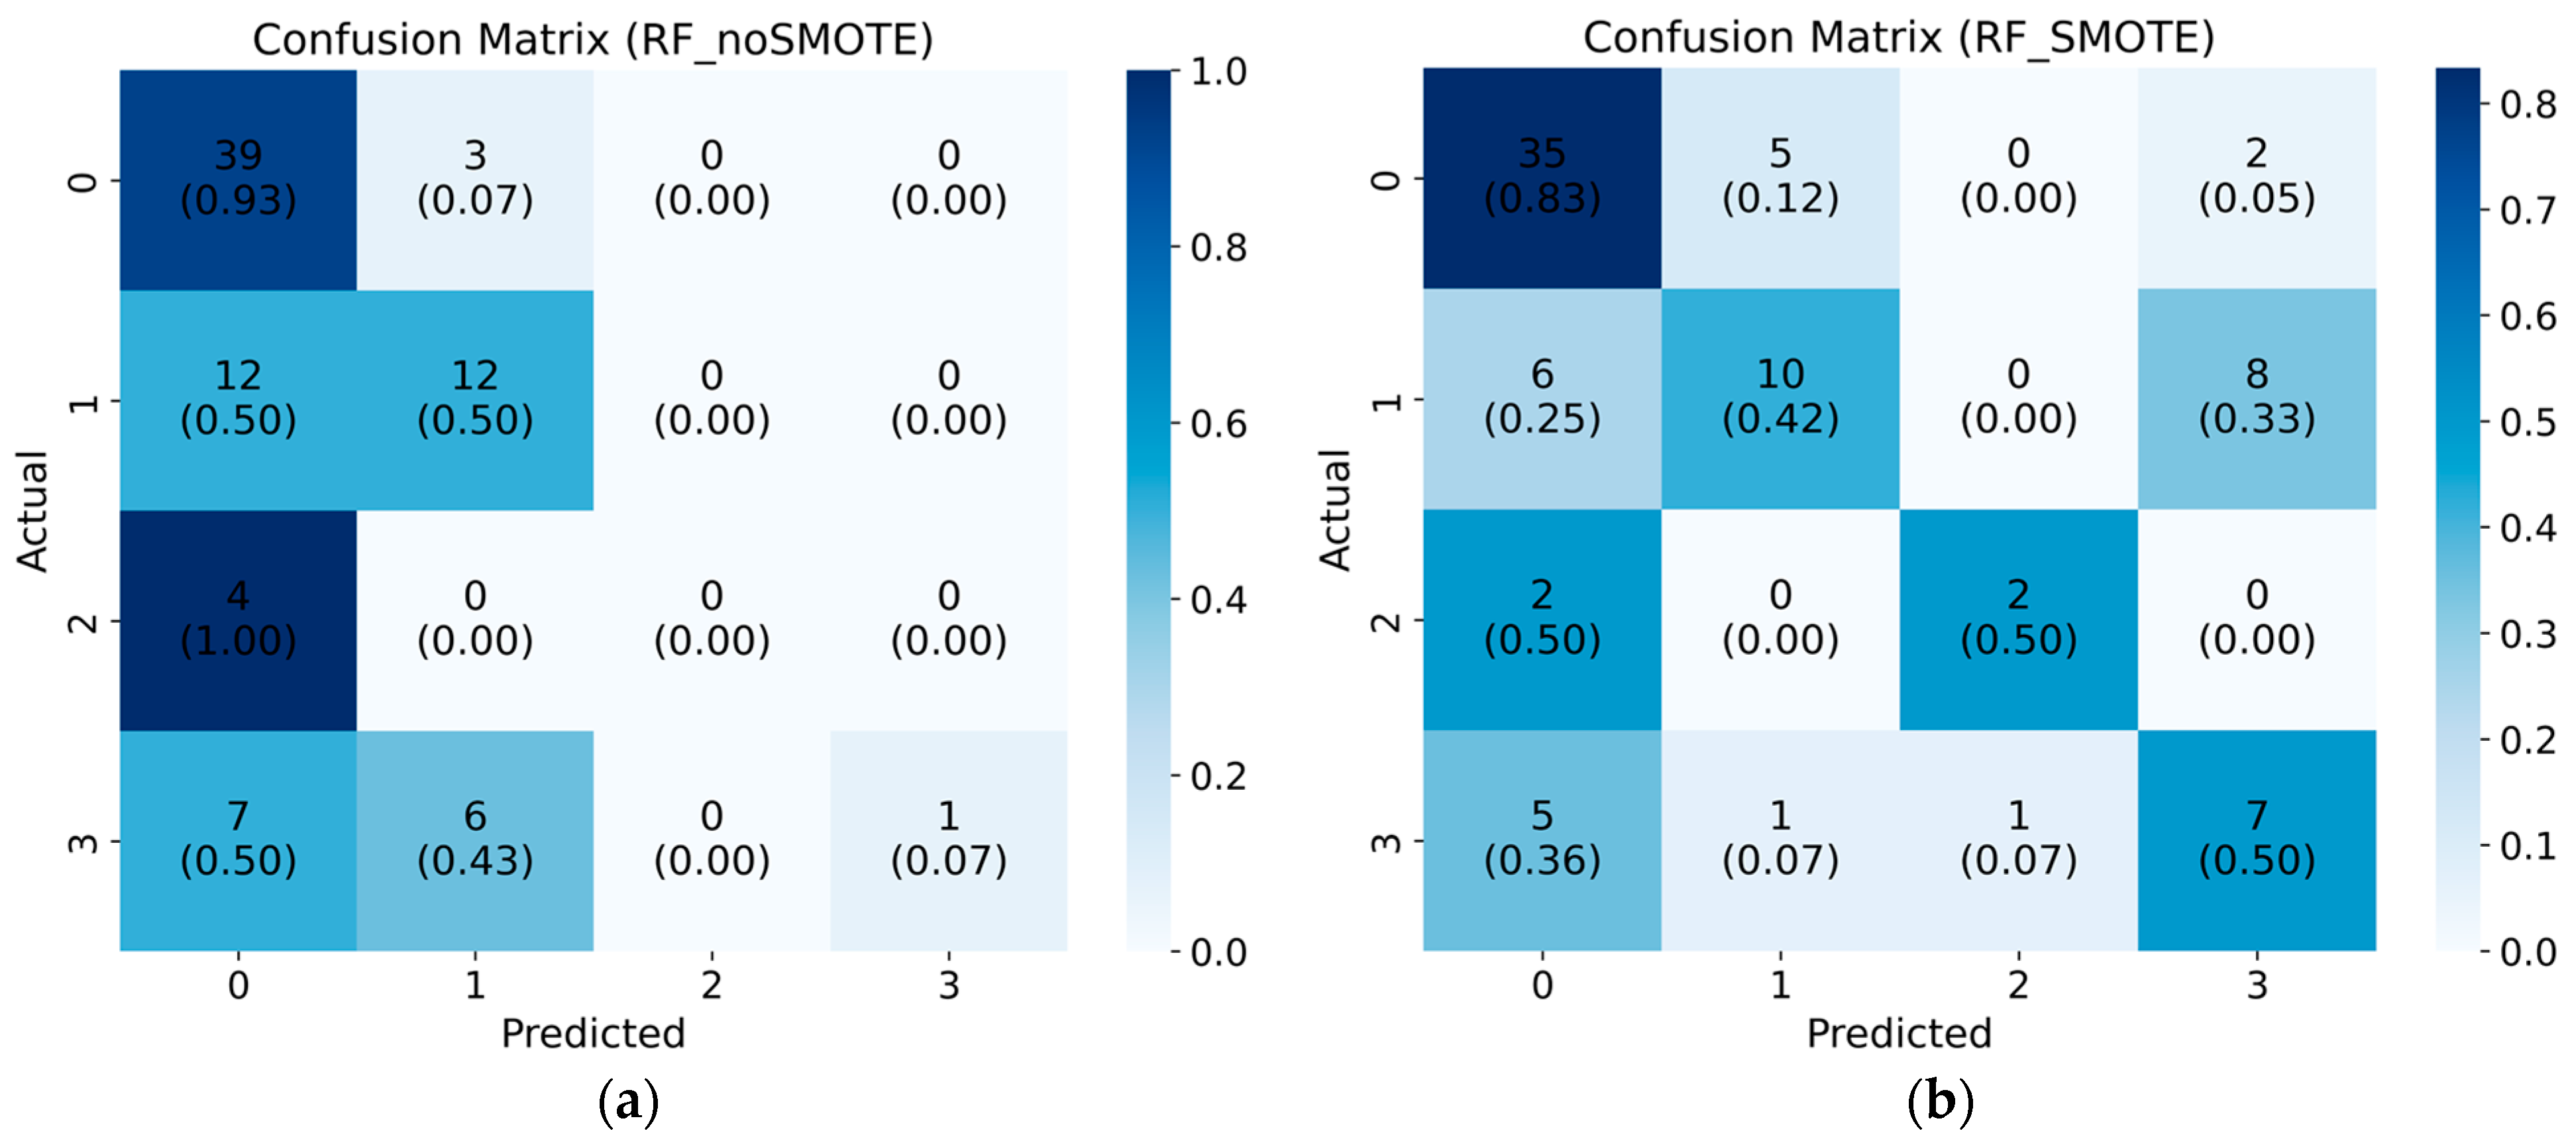
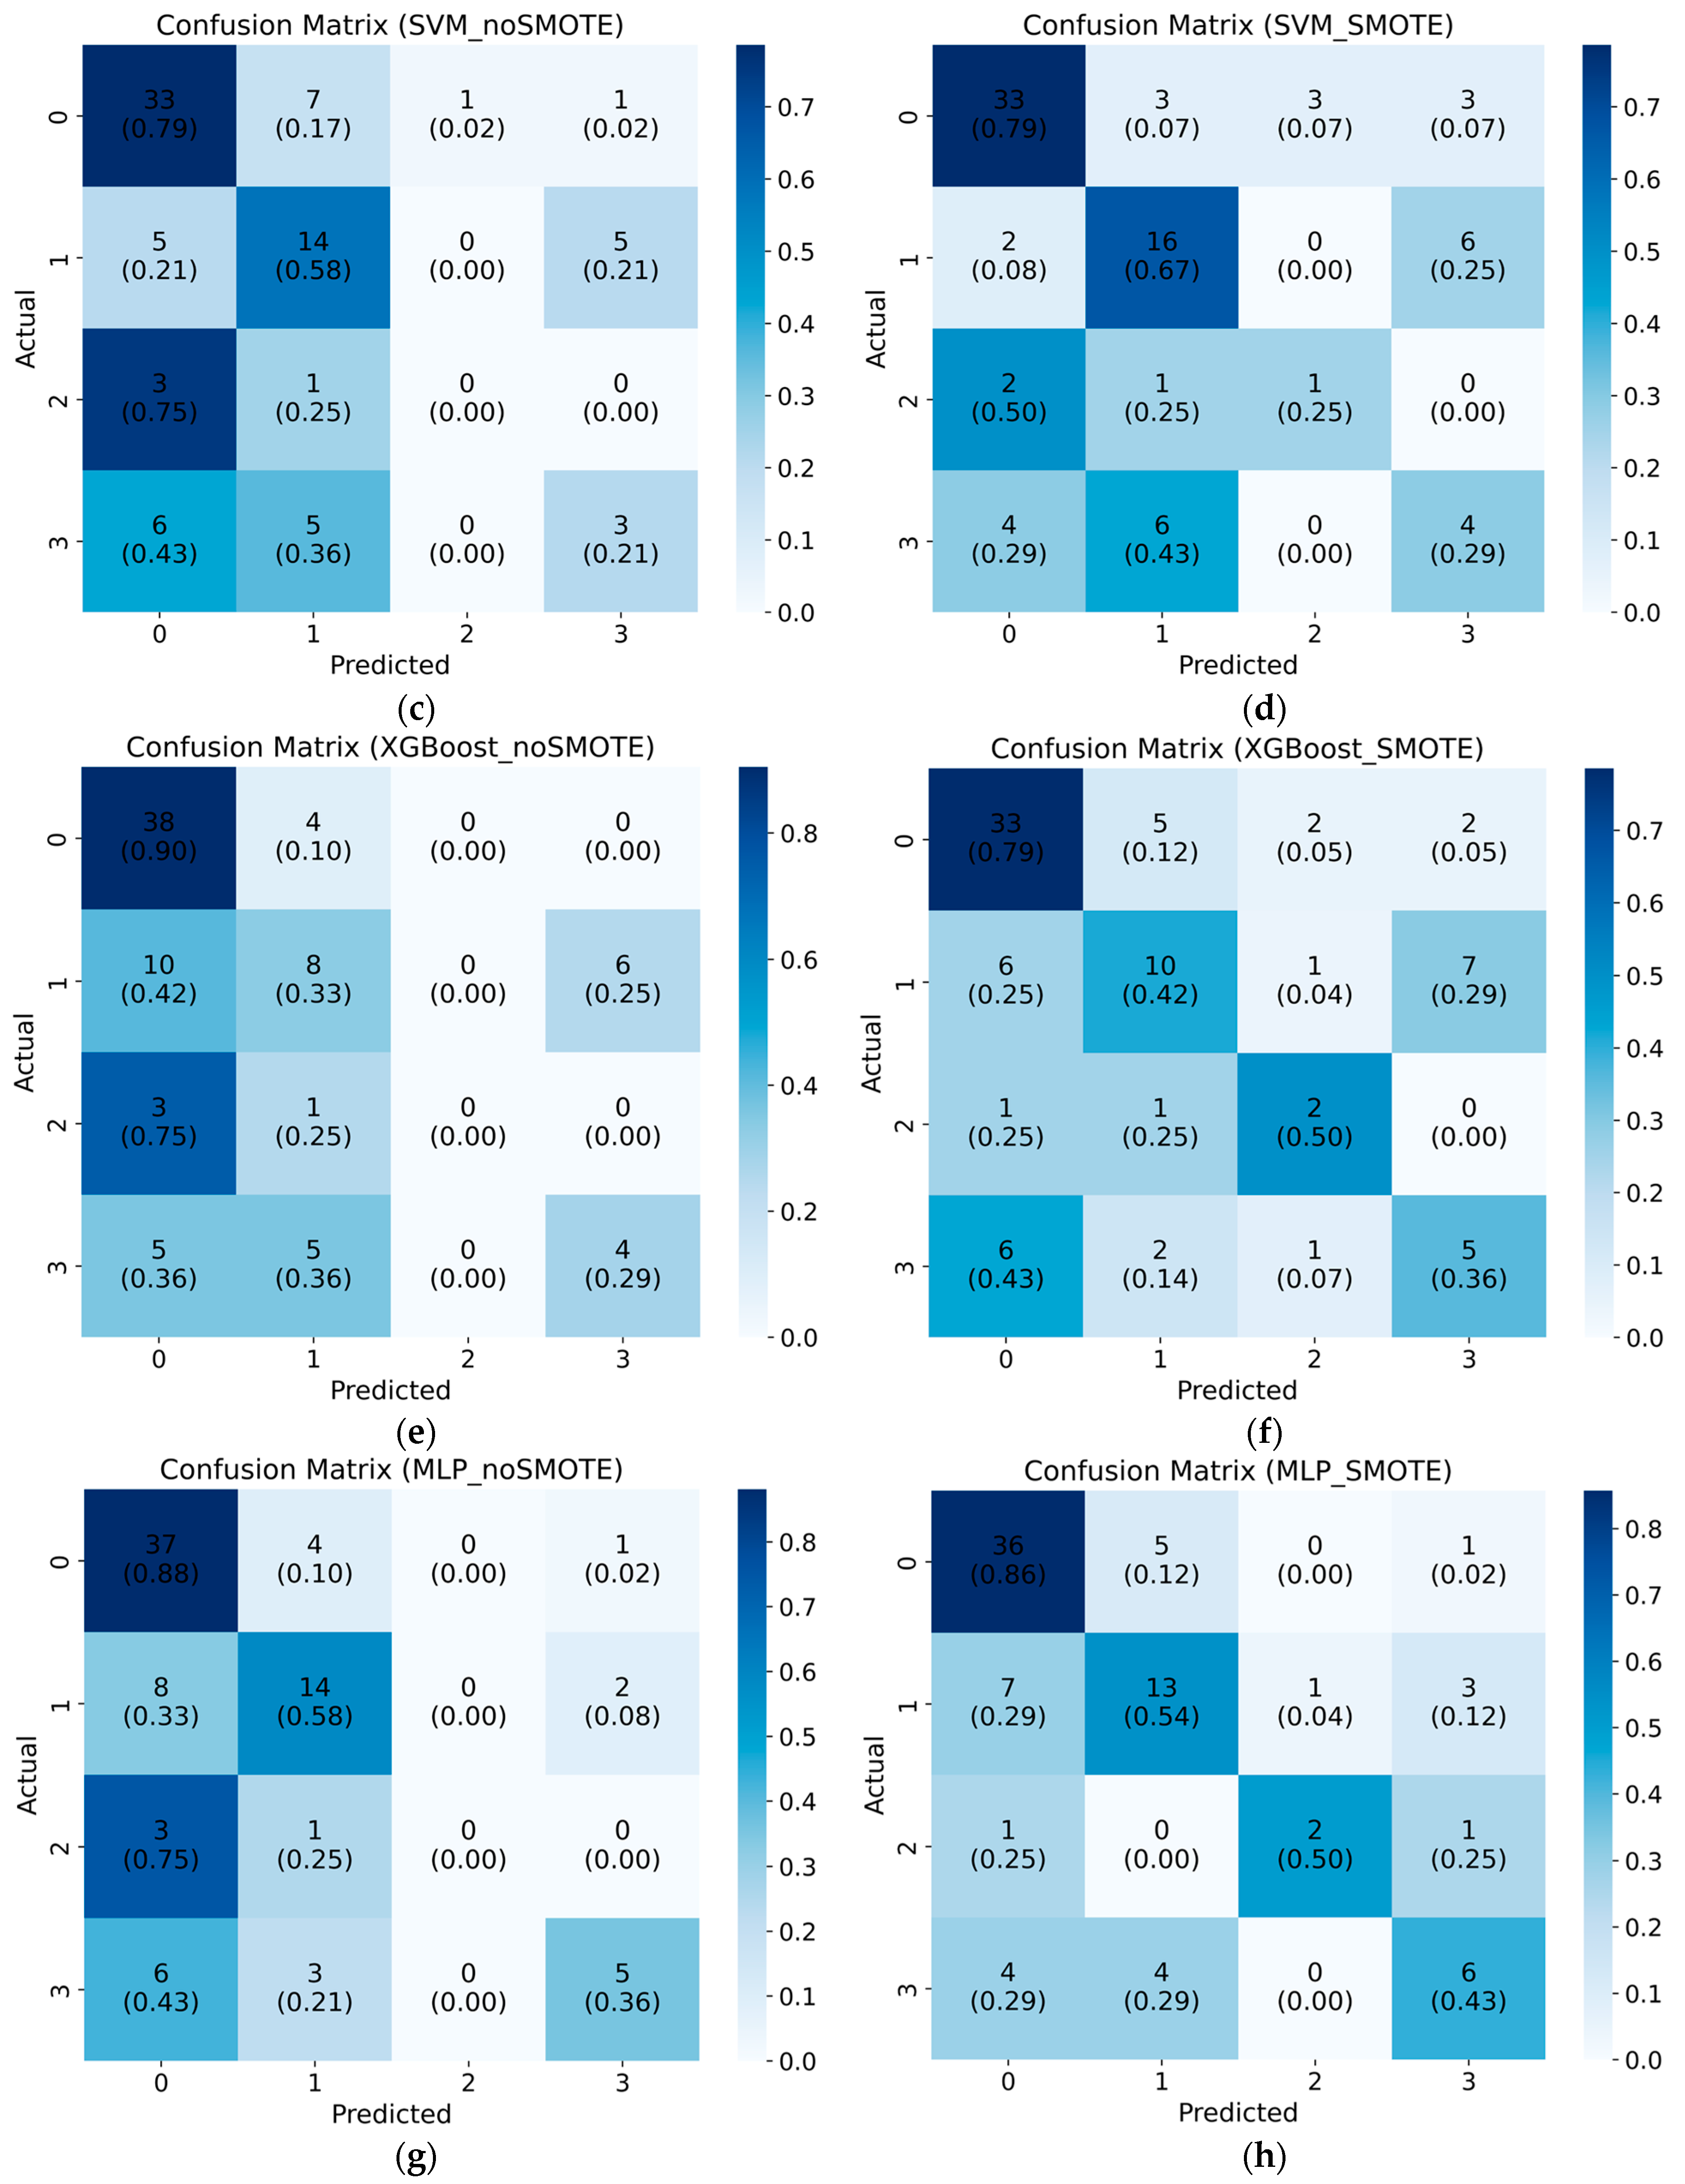
The confusion matrices in Figure 7 illustrate the performance of the four machine learning models on the test set before and after the application of SMOTE. Note that the number outside the parentheses in each cell indicates the number of samples classified into a particular prediction category, while the number in the parentheses indicates the normalized proportion of samples relative to the total number of samples in the corresponding actual category.
Figure 7.
Test set normalized confusion matrices for different models before and after applying SMOTE: (a) RF without SMOTE, (b) RF with SMOTE, (c) SVM without SMOTE, (d) SVM with SMOTE, (e) XGBoost without SMOTE, (f) XGBoost with SMOTE, (g) MLP without SMOTE, and (h) MLP with SMOTE.
As observed in Figure 7a,c,e,g, Category 0 consistently achieved high normalized values, reflecting strong prediction accuracy, likely due to its dominance in the dataset. However, the performance for Category 2 was significantly worse, with normalized values of 0 across all models, underscoring the challenges in predicting underrepresented categories. After applying SMOTE to balance the training data, as shown in Figure 7b,d,f,h, the classification performance for Category 2 improved across all models. The MLP model showed the greatest improvement, with an increase in the normalized values for Category 2 while the performance for the other categories remained strong.
Given the current state of AV technology, which predominantly remains at Level 3 or lower, accurately predicting cases with short-term relocation willingness but no long-term relocation willingness (i.e., Category 2) is particularly critical for short-term land use planning. The performance of each model is visually represented in the confusion matrices of Figure 8, where columns correspond to actual categories and rows denote predicted categories. From the diagonal values, it is evident that the SVM model with SMOTE performs slightly worse than the other three models in predicting Category 2, making it a less favorable choice. Although the RF, XGBoost, and MLP models are all capable of predicting Category 2 to some extent after SMOTE, the MLP model outperforms the others in overall evaluation metrics on the test set.
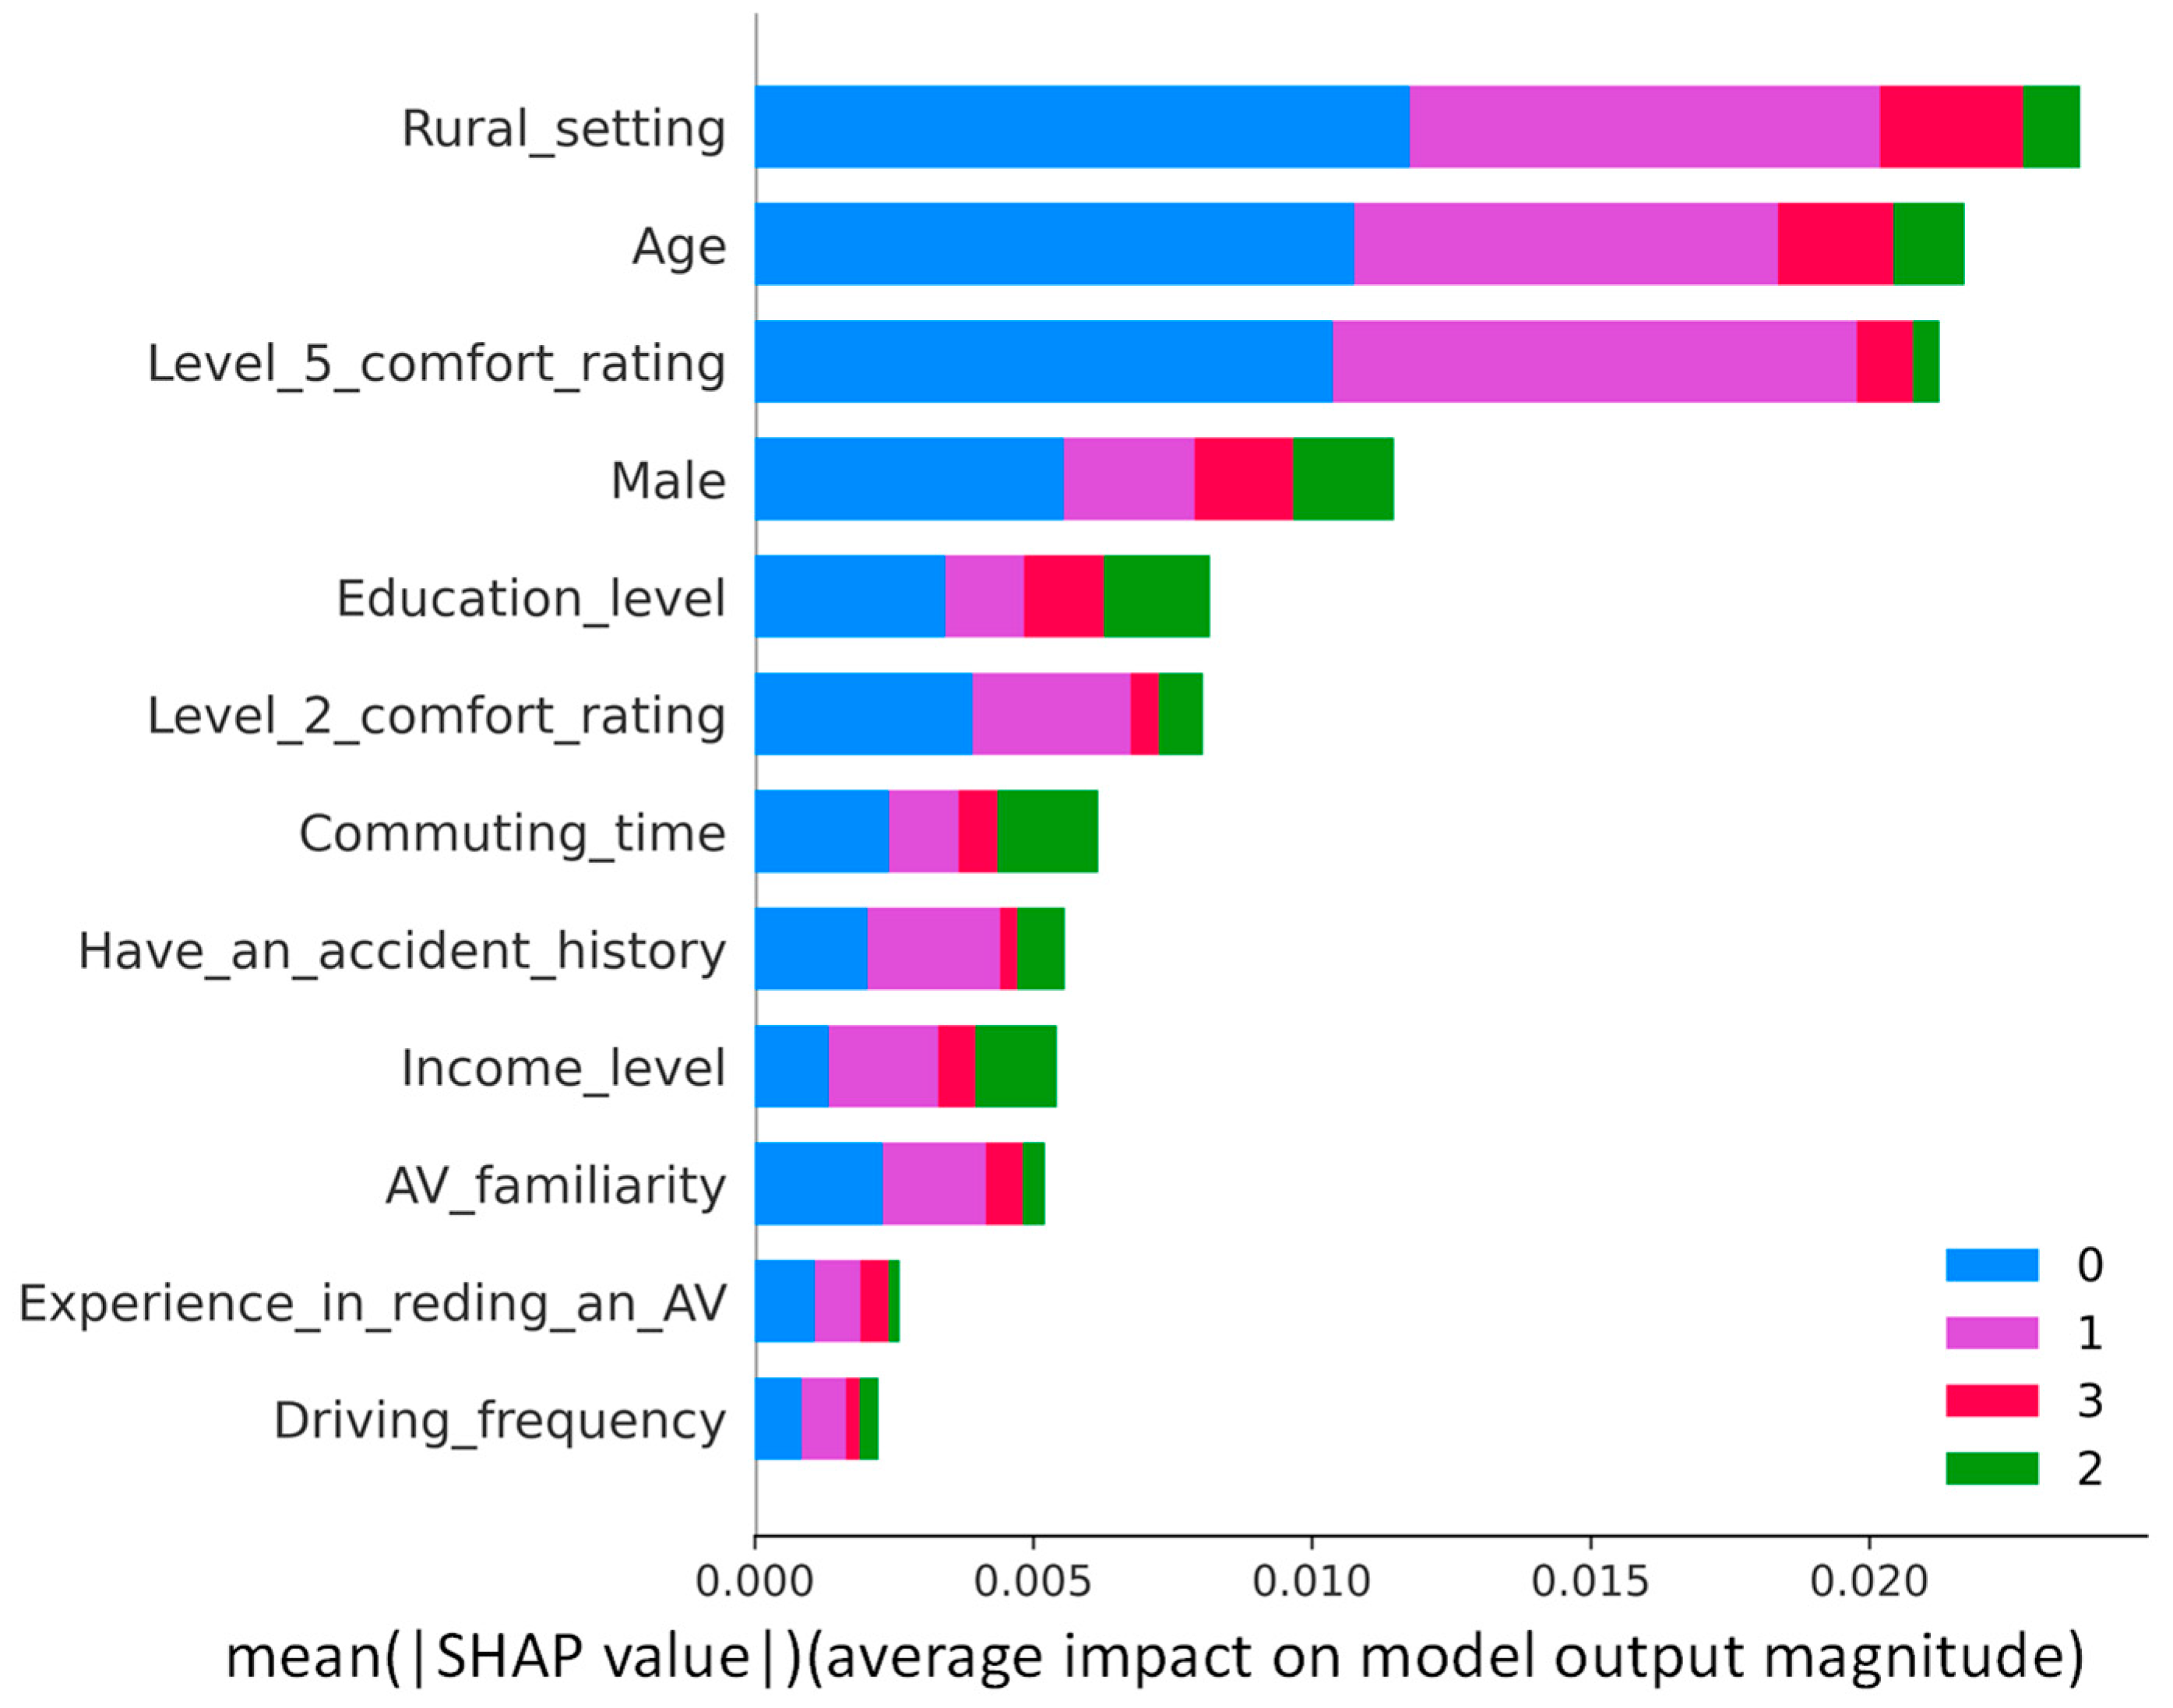
Figure 8.
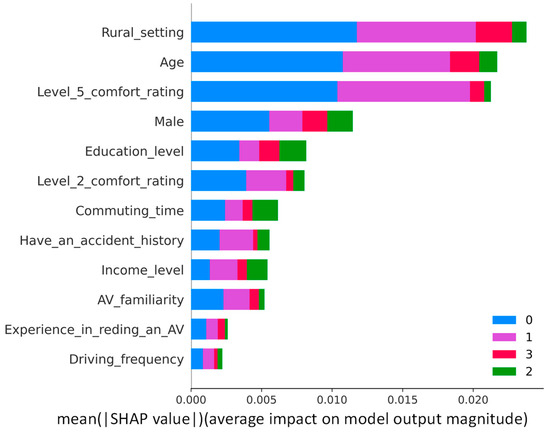
SHAP mean absolute values of the importance of the variables.
Considering the overall modeling performance and the ability to effectively predict Category 2, the MLP model was selected as the optimal method for predicting changes in relocation willingness and serving as the basis for further analysis.
4.3. Model Interpretability
The SHAP analysis technique is employed to interpret the predictions made by the MLP method and to analyze the impact of key features on residential relocation. Figure 8 presents a summary of the importance of the variables based on the mean absolute values of SHAP. Each bar in the figure represents a feature, and the length of the bar reflects the average magnitude of its SHAP values, indicating the overall contribution of the feature to the model’s predictions. The distribution of SHAP values shows that there are differences in the mean absolute SHAP values of all influencing variables across the different categories of willingness to relocate.
Overall, built environment, age, and Level 5 comfort ratings were identified as the main explanatory factors when constructing a general model of change in willingness to relocate. Gender also had a significant effect on willingness to relocate. According to the absolute mean of SHAP values, the relative importance of variables varied across categories: for Category 0, the most important variables were ranked as Rural_setting > Age > Level_5_comfort_rating > Male; for Category 1, the order of importance of the variables was Level_5_comfort_rating > Rural_setting > Age; for Category 2, the main explanatory factors did not become importance variables, suggesting that these primary variables may have limited effectiveness in identifying this category. For Category 3, the key variables were ranked as Rural_setting > Age > Male.
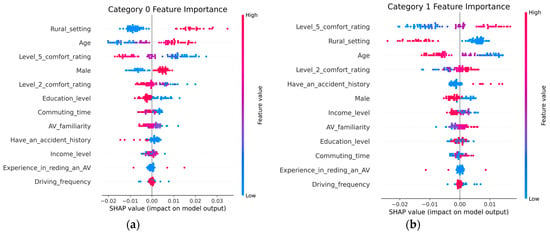
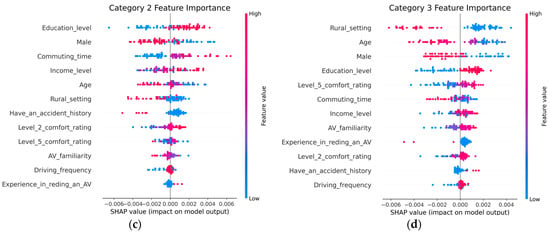
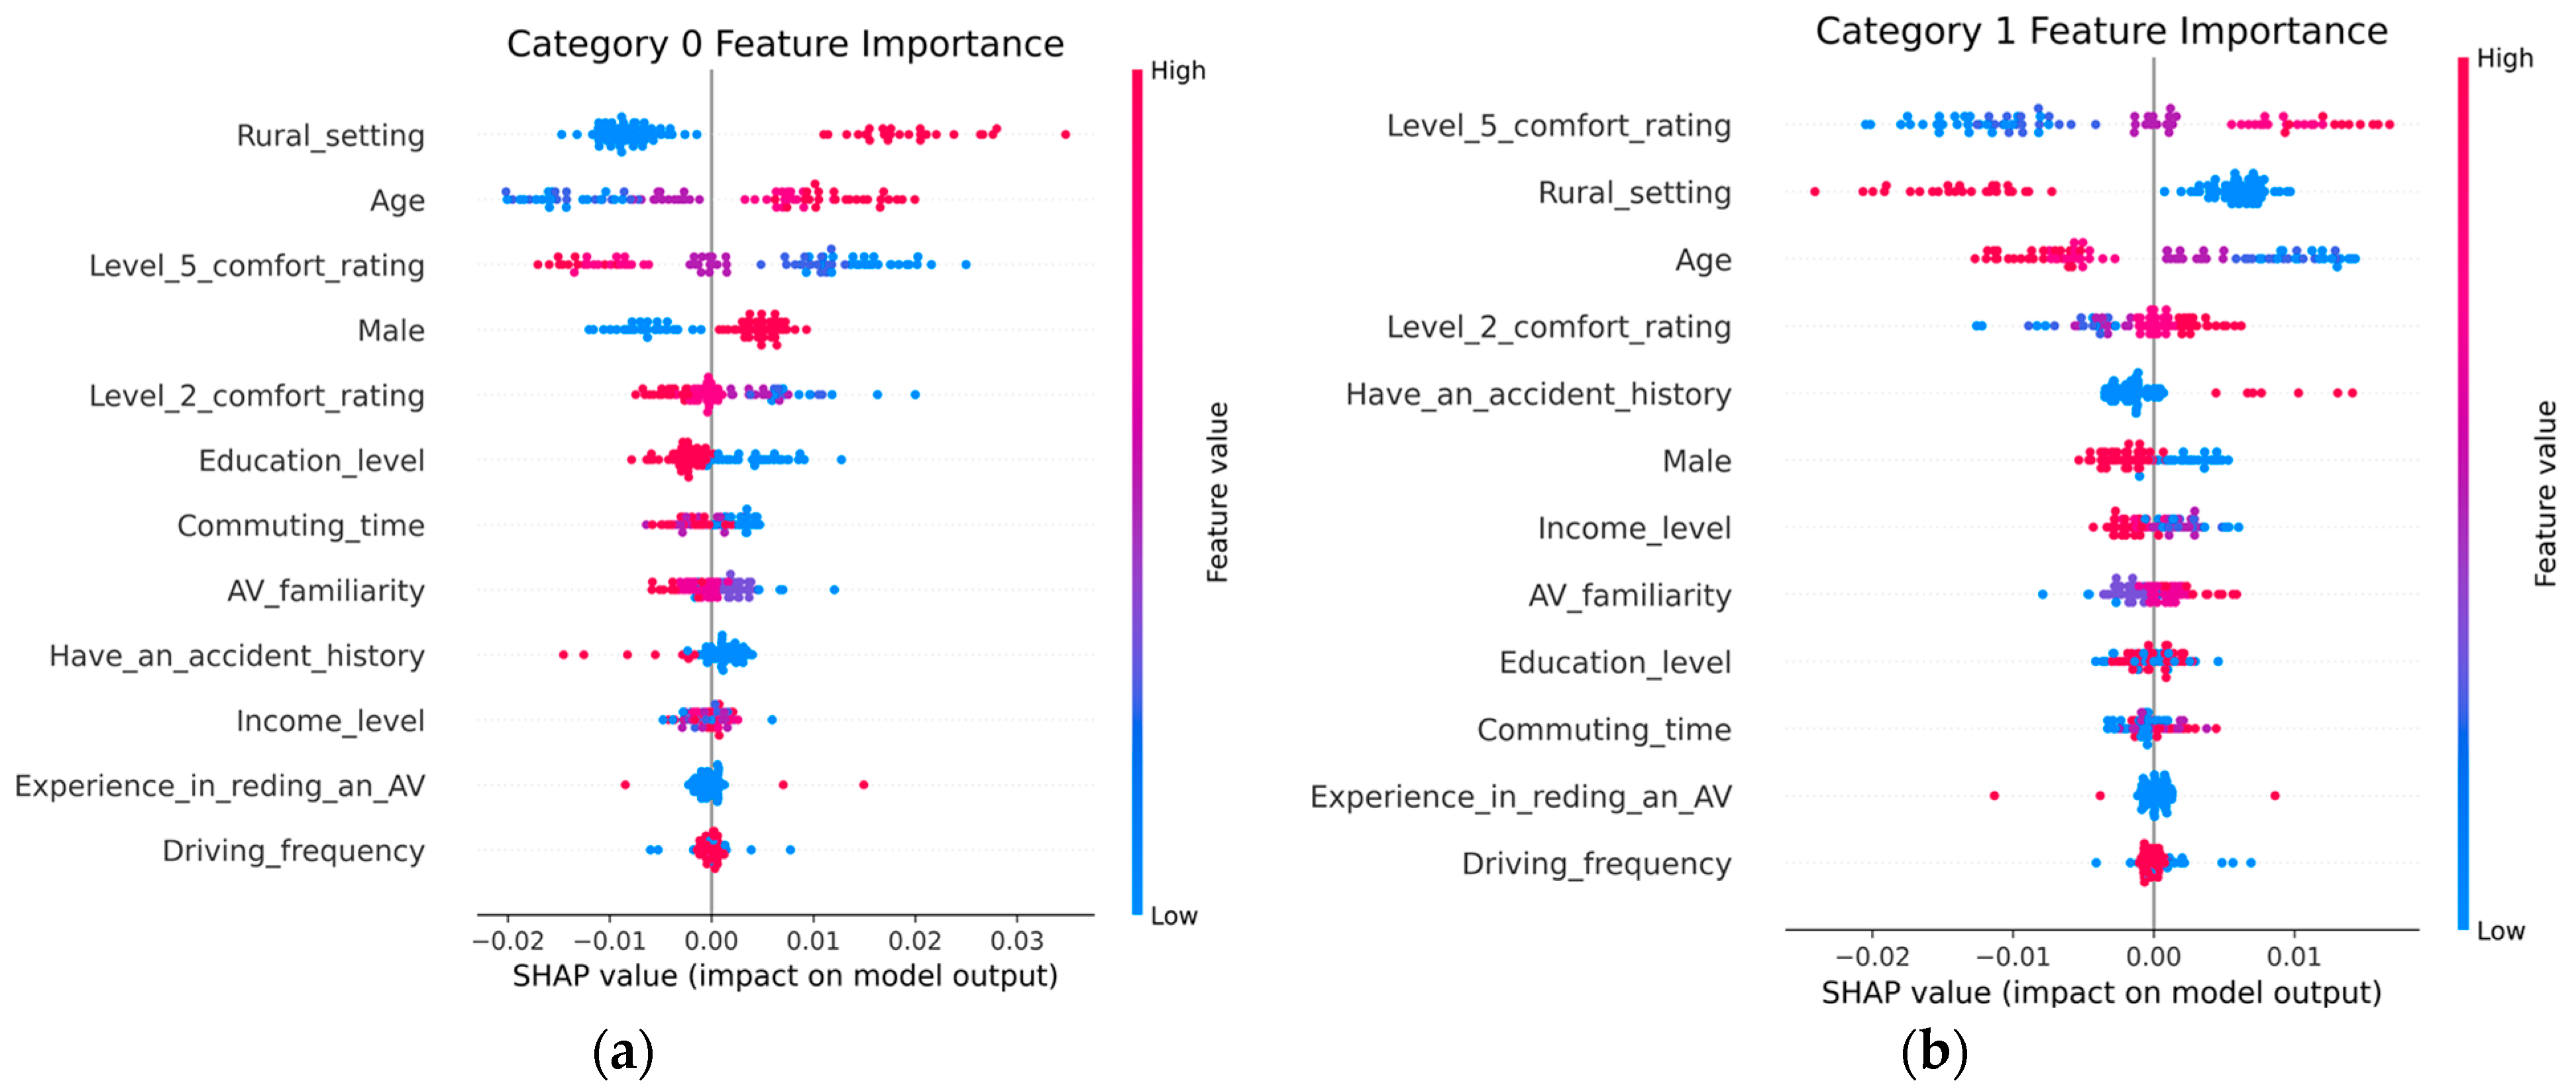
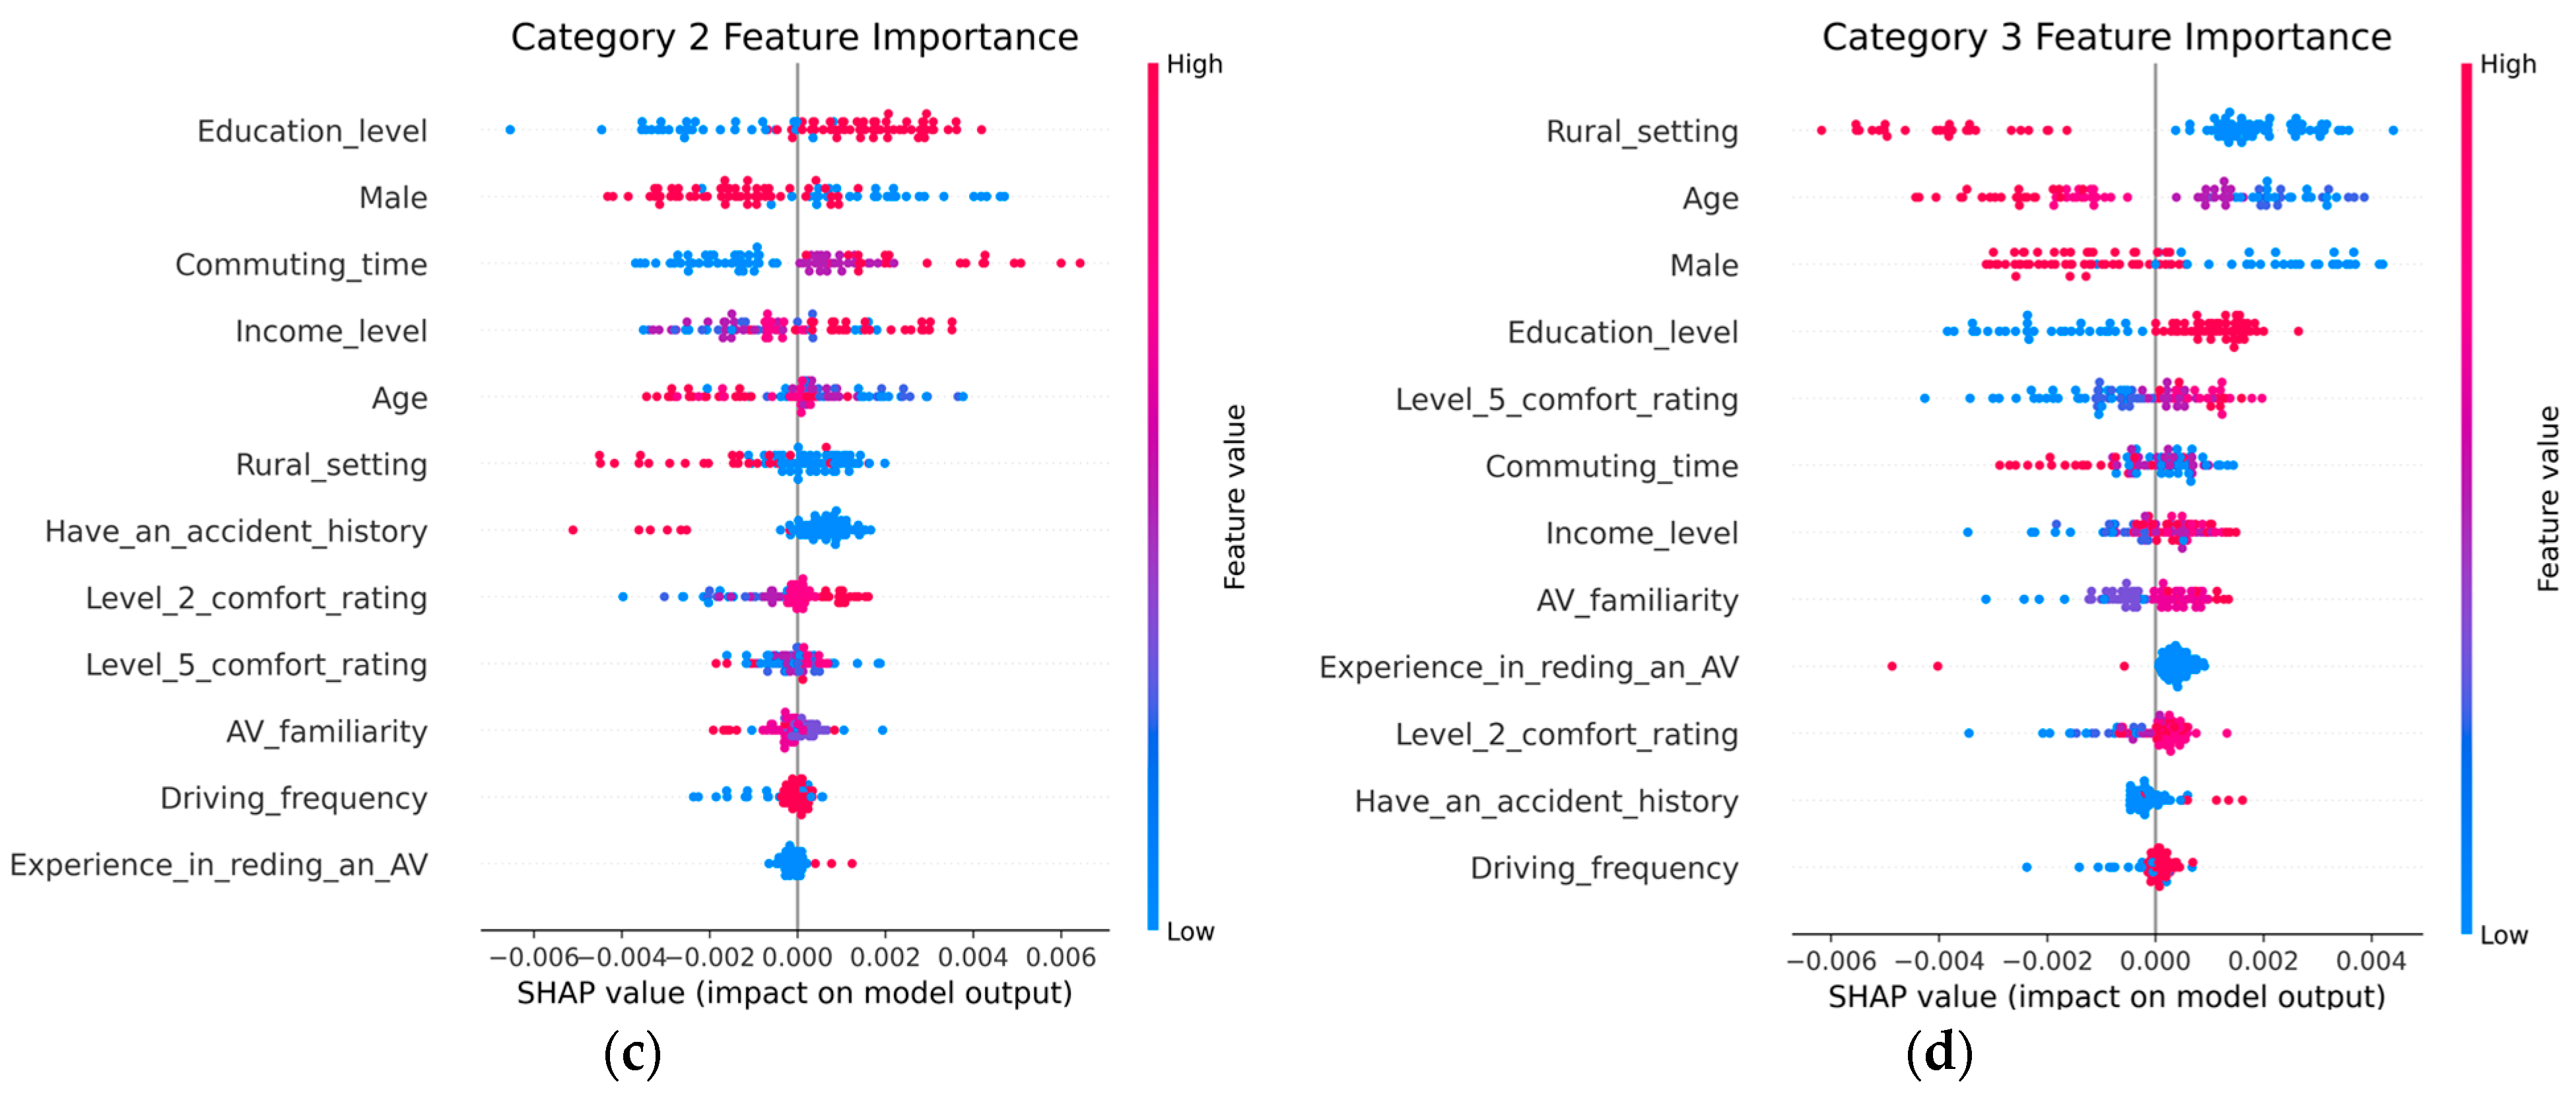
Figure 9 shows the distribution of SHAP values for each feature in the test sample for different relocation intention change categories. The dots on each feature represent an instance of relocation change in the test data, and the color changes from blue (low values) to red (high values), reflecting the range of feature values. In the figure, features on the Y-axis are ordered by the average absolute value of their SHAP values. The location of the points on the X-axis is determined by the feature’s SHAP value, which indicates the probability that the sample is predicted to be a specific relocation intention change, with higher SHAP values resulting in a higher probability.
Figure 9.
SHAP summary plots of test set samples for different changes in willingness to relocate: (a) Category 0, (b) Category 1, (c) Category 2, and (d) Category 3.
From the four subplots, it can be observed that the variable points of lower importance are mostly vertically stacked near the bottom of the y-axis (SHAP values close to 0), indicating that they have less impact on willingness to relocate. On the other hand, the variable points with higher importance tend to have a wider distribution along the x-axis, indicating that they have a greater impact on willingness to relocate. For example, rural serves as a key predictor of Category 0 and Category 3. People living in rural areas (red) are more likely to fall into Category 0 (positive SHAP value), while urban residents (blue) are more likely to fall into Category 3 (positive SHAP value). This suggests that most people living in rural areas are generally reluctant to move in the short term and reluctant to move in the long term, whereas people living in urban areas are willing to move. Level_5_comfort_rating is a valid characteristic for distinguishing between Category 0 and Category 1. High ratings increase the propensity to relocate in the long term, while low ratings decrease this propensity. It is interesting to note that some samples with the same eigenvalues are distributed on both sides of the y-axis, e.g., income has both positive and negative effects on Category 2. This may reflect individual differences between different observers, who may have opposite judgments about willingness to relocate even at the same income Level. This phenomenon is not inconsistent with the mean SHAP values in Figure 8, as differences in sample sizes and localized densities may cause the overall impact to be skewed in the predicted direction.
In summary, the built environment, age, and Level 5 comfort level are the three most influential factors in predicting changes in residents’ willingness to relocate. Specifically, residents living in rural areas tend to have lower relocation willingness in both the short and long term, whereas urban residents demonstrate a stronger inclination to relocate. In terms of age, older individuals generally exhibit a more conservative attitude toward relocation, while younger individuals are more likely to consider relocating in the short or long term. Regarding Level 5 comfort level, those with higher comfort scores are more inclined to relocate, whereas those with lower scores tend to prefer maintaining the status quo. Although gender, education level, and Level 2 comfort rating contribute less to predicting relocation willingness, their effects should not be overlooked.
5. Conclusions
5.1. Revealing the Mechanisms and Forecasting Willingness to Relocate with the Advancements of AV Technology
This research advances the existing literature by examining the mechanisms influencing individuals’ willingness to relocate farther from their workplace under both short-term (Level 2 automation) and long-term (Level 5 automation) scenarios. Furthermore, it contributes to the field by forecasting relocation probabilities using input variables from demographic characteristics, affordability levels, the built environment, travel needs, and AV familiarity. The findings offer valuable insights for policymakers and urban planners, enabling them to better understand relocation motivations, anticipate the effects of AV technology on residential choices, and develop adaptive strategies for managing urban sprawl. The key conclusions are summarized as follows:
- Short-term impacts of AV technology (Level 2 automation): Young, urban-dwelling, low-affordability individuals who rate Level 2 automation as high-comfort show a higher likelihood of relocating farther from their workplace in the context of Level 2 AV adoption.
- Long-term impacts of AV technology (Level 5 automation): High-comfort, urban-dwelling younger adults demonstrate a strong inclination to relocate under Level 5 AV adoption. Similarly, high-affordability, urban-proximate elderly individuals and men with high-comfort ratings for Level 5 automation also exhibit an increased likelihood of relocation in fully autonomous commuting scenarios.
- Predicting willingness to relocate across short- and long-term perspectives: Using a comparative analysis of four machine learning models, this study assessed predictive accuracy and identified key contributing factors using the SHAP (SHapley Additive exPlanations) method. The MLP (Multi-Layer Perceptron) model outperformed other modeling techniques in predicting relocation willingness. The built environment, age, and Level 5 comfort ratings emerged as the most influential predictors of changes in relocation willingness.
5.2. Implications for Policy Recommendation
The findings of this research provide critical insights for policymakers and urban planners seeking to understand and manage the impacts of AV technology on residential relocation and changing spatial development patterns. Over the past decades, transportation-related technological advancements have played a significant role in driving more dispersed development patterns [77,78]. The continued evolution of AV technology is reshaping urban mobility and land use. Specifically, near-term shifts (i.e., Level 2) are sensitive to how people feel about AV technology. Allowing up-zoning near transit with extensive housing, implementing parking reforms (e.g., shared use, demand pricing), and prioritizing charging and daily services so people do not feel pushed to move farther out. As full automation scales and relocation intensions rise, a larger share of households may consider living at greater distances from work. To guide this shift, it is imperative for cities to establish clear growth guardrails by using urban growth boundaries and phasing extensions of infrastructures (e.g., roads, utilities) to discourage leap-frog development.
While this research identifies key motivations for residential relocation in the context of AV technology, ensuring that the resulting spatial development patterns remain sustainable will require preparedness across multiple dimensions. From a population perspective, this study reveals that younger adults who exhibit high comfort with AV technology, frequent exposure to AVs, and proximity to urban centers are the most likely to relocate. Policymakers should focus on these cohorts by implementing urban development initiatives tailored to their preferences. Furthermore, relocation behavior is likely to evolve over time as individuals’ financial circumstances improve and their familiarity with AV technology grows. By understanding the pathways through which demographic factors (such as age and gender) shape relocation decisions, this research offers a foundation for formulating policies that address these evolving dynamics. Moreover, since affordability and age interact with the possibilities of relocation, housing policy should better evaluate supply and demand to avoid inequitable outcomes where only higher-income or tech-savvy groups capitalize on AV-enabled relocation. It is necessary for cities to create equity screens for any types of AV-related land use decision.
Another key dimension is the varying levels of vehicle automation and their implications for relocation decisions. In this study, two levels of automation are considered: Level 2 (partial automation) and Level 5 (full automation). For Level 2 automation, which offers partial driving autonomy, policymakers should examine how this intermediate phase of AV technology influences daily life, commuting patterns, and residential choices. In contrast, Level 5 automation (full autonomy) demands consideration of far-reaching impacts—for example, how its widespread adoption could reshape lifestyles, commuting habits, and the spatial distribution of residences. Proactive preparation for these different levels of automation will be critical in managing the transition to an AV-dominated future.
Last but not least, the successful realization of AV-driven changes in spatial development depends on the availability of supporting infrastructure and essential services. For instance, the strategic placement of charging stations, the accessibility of grocery stores, and the provision of other critical services should be planned proactively to ensure that such relocation is feasible and sustainable. Policymakers and urban planners must anticipate the infrastructure needs of communities transitioning to AV-enabled lifestyles, ensuring that these communities can effectively support changing commuting patterns and residential preferences.
Together, these dimensions highlight the multifaceted nature of AV-induced changes in spatial development. Policymakers and urban planners must adopt a comprehensive approach that integrates insights from demographic behaviors, automation levels, and infrastructure readiness to develop sustainable and adaptive urban strategies.
5.3. Study Limitations
The sample collected in this research achieves a ±4% margin of error at the 95% confidence level, with modestly over-representing urban residents and including higher shares of men as well as college-educated respondents than the Census. These skews likely reflect self-selection toward AV-related topics. Although invitations were randomly distributed statewide without demographic restrictions, future research is recommended to verify it through weighting or replication in more diverse settings.
While this study collected data at the individual level, offering a detailed perspective on how AV technology influences personal relocation decisions, there is a limitation of collecting aggregated data. This level of detail lays a strong foundation for the application of Agent-Based Modeling (ABM) in future research. ABM, with its ability to simulate the interactions between individual agents and their environment, can be used to model and forecast the scale and patterns of urban sprawl under different scenarios of AV adoption. By simulating these dynamics, ABM can provide insights into how individual relocation decisions contribute to macro-level urban expansion, revealing the emergent spatial patterns that policymakers must address.
To effectively manage the implications of AV-driven urban sprawl, it is also crucial to quantify its extent and characteristics. Policymaking requires accurate and reliable measurements of urban sprawl to ensure interventions are appropriately designed and targeted. By quantifying the scale and distribution of urban sprawl, future research can provide policymakers with the tools needed to align policy responses with the realities of an AV-driven future. Such analyses could support the development of evidence-based strategies, including zoning regulations, infrastructure planning, and incentives for compact urban growth.
Author Contributions
Conceptualization, S.W. and X.T.; methodology, S.W. software, X.T.; validation, S.J. and W.Z.; formal analysis, X.T.; investigation, S.W.; resources, Z.L.; data curation, X.T.; writing—original draft preparation, S.W. and X.T.; writing—review and editing, S.Z., H.Y., and G.Z.; visualization, X.T.; supervision, Z.L.; project administration, Z.L.; funding acquisition, Z.L. All authors have read and agreed to the published version of the manuscript.
Funding
This work was funded by a Kentucky Transportation Cabinet (KYTC) research grant.
Institutional Review Board Statement
Approval of all ethical and experimental procedures and protocols was granted by the Human Subjects Research and Institutional Review Board at the University of Louisville under Application No. 18.0484, approval from 18 May 2018 through 17 May 2019.
Informed Consent Statement
Informed consent was obtained from all subjects involved in the study.
Data Availability Statement
The data presented in this study are available on request from the corresponding author.
Conflicts of Interest
The authors declare no conflicts of interest.
References
- Tan, H.; Liu, J.; Chen, C.; Zhao, X.; Yang, J.; Tang, C. Knowledge as a key determinant of public support for autonomous vehicles. Sci. Rep. 2024, 14, 2156. [Google Scholar] [CrossRef] [Scilit]
- Waldrop, M.M. Autonomous vehicles: No drivers required. Nature 2015, 518, 20–23. [Google Scholar] [CrossRef] [Scilit] [PubMed]
- McAslan, D.; Arevalo, F.N.; King, D.A.; Miller, T.R. Pilot project purgatory? Assessing automated vehicle pilot projects in U.S. cities. Humanit. Soc. Sci. Commun. 2021, 8, 325. [Google Scholar] [CrossRef] [Scilit]
- Zhong, S.; Liu, A.; Jiang, Y.; Hu, S.; Xiao, F.; Huang, H.-J.; Song, Y. Energy and environmental impacts of shared autonomous vehicles under different pricing strategies. Npj Urban. Sustain. 2023, 3, 8. [Google Scholar] [CrossRef] [Scilit]
- Cui, Y.; Zhao, P.; Li, L.; Li, J.; Gong, M.; Deng, Y.; Si, Z.; Yan, S.; Dang, X. A new model for residential location choice using residential trajectory data. Humanit. Soc. Sci. Commun. 2024, 11, 255. [Google Scholar] [CrossRef] [Scilit]
- Wang, Y.; Li, Y. Revisiting jobs-housing balance: Unveiling the impact of housing subsidy policy on residential locations across different income groups. Humanit. Soc. Sci. Commun. 2024, 11, 1586. [Google Scholar] [CrossRef] [Scilit]
- Harb, M.; Xiao, Y.; Circella, G.; Mokhtarian, P.L.; Walker, J.L. Projecting travelers into a world of self-driving vehicles: Estimating travel behavior implications via a naturalistic experiment. Transportation 2018, 45, 1671–1685. [Google Scholar] [CrossRef] [Scilit]
- Mirzahossein, H.; Mashhadloo, M. Modeling the effect of autonomous vehicles (AVs) on the accessibility of the transportation network. Sci. Rep. 2024, 14, 9292. [Google Scholar] [CrossRef] [Scilit] [PubMed]
- Nodjomian, A.T.; Kockelman, K. How does the built environment affect interest in the ownership and use of self-driving vehicles? J. Transp. Geogr. 2019, 78, 115–134. [Google Scholar] [CrossRef] [Scilit]
- Dannemiller, K.A.; Mondal, A.; Asmussen, K.E.; Bhat, C.R. Investigating autonomous vehicle impacts on individual activity-travel behavior. Transp. Res. Part A Policy 2021, 148, 402–422. [Google Scholar] [CrossRef] [Scilit]
- Zhang, W.; Guhathakurta, S. Residential location choice in the era of shared autonomous vehicles. J. Plan. Educ. Res. 2018, 41, 135–148. [Google Scholar] [CrossRef] [Scilit]
- Moore, M.A.; Lavieri, P.S.; Dias, F.F.; Bhat, C.R. On investigating the potential effects of private autonomous vehicle use on home/work relocations and commute times. Transp. Res. Part C Emerg. Technol. 2020, 110, 166–185. [Google Scholar] [CrossRef] [Scilit]
- Jia, W.; Chen, T.D.; Zhang, W. Willingness-to-relocate: Examining preferences for parking relocation of privately-owned automated vehicles. Transp. Res. D Transp. Environ. 2022, 108, 103318. [Google Scholar] [CrossRef] [Scilit]
- Olsen, T.; Sweet, M.N. Who’s driving change? Potential to commute further using automated vehicles among existing drivers in southern Ontario. Canada. Transp. Res. Rec. 2019, 2673, 50–61. [Google Scholar] [CrossRef] [Scilit]
- Bansal, P.; Kockelman, K.M.; Singh, A. Assessing public opinions of and interest in new vehicle technologies: An Austin perspective. Transp. Res. Part C Emerg. Technol. 2016, 67, 1–14. [Google Scholar] [CrossRef] [Scilit]
- Zhong, H.; Li, W.; Burris, M.W.; Talebpour, A.; Sinha, K.C. Will autonomous vehicles change auto commuters’ value of travel time? Transp. Res. D Transp. Environ. 2020, 83, 102303. [Google Scholar] [CrossRef] [Scilit]
- Martin, R. AV futures or futures with AVs? Bridging sociotechnical imaginaries and a multi-level perspective of autonomous vehicle visualisations in praxis. Humanit. Soc. Sci. Commun. 2021, 8, 68. [Google Scholar] [CrossRef] [Scilit]
- Di Lillo, L.; Gode, T.; Zhou, X.; Atzei, M.; Chen, R.; Victor, T. Comparative safety performance of autonomous- and human drivers: A real-world case study of the Waymo Driver. Heliyon 2024, 10, e34379. [Google Scholar] [CrossRef] [Scilit]
- SAE On-Road Automated Driving (ORAD) Committee. Taxonomy and Definitions for Terms Related to Driving Automation Systems for on-Road Motor Vehicles, J3016_202104; SAE International: Warrendale, PA, USA, 2021. [Google Scholar]
- Hasnat, M.; Bardaka, E.; Samandar, M.S. Differential impacts of autonomous and connected-autonomous vehicles on household residential location. Travel. Behav. Soc. 2023, 32, 100570. [Google Scholar] [CrossRef] [Scilit]
- Krueger, R.; Rashidi, T.H.; Dixit, V.V. Autonomous driving and residential location preferences: Evidence from a stated choice survey. Transp. Res. Part C Emerg. Technol. 2019, 108, 255–268. [Google Scholar] [CrossRef] [Scilit]
- Kim, S.H.; Mokhtarian, P.L.; Circella, G. How, and for whom, will activity patterns be modified by self-driving cars? Expectations from the state of Georgia. Transp. Res. Part F Traffic Psychol. Behav. 2020, 70, 68–80. [Google Scholar] [CrossRef] [Scilit]
- Kroesen, M. Residential self-selection and the reverse causation hypothesis: Assessing the endogeneity of stated reasons for residential choice. Travel. Behav. Soc. 2019, 16, 108–117. [Google Scholar] [CrossRef] [Scilit]
- Llorca, C.; Moreno, A.; Ammar, G.; Moeckel, R. Impact of autonomous vehicles on household relocation: An agent-based simulation. Cities 2022, 126, 103692. [Google Scholar] [CrossRef] [Scilit]
- Bielby, W.T.; Bielby, D.D. I will follow him: Family ties, gender-role beliefs, and reluctance to relocate for a better job. Am. J. Sociol. 1992, 97, 1241–1267. [Google Scholar] [CrossRef] [Scilit]
- Sweet, M.; Kanaroglou, P. Gender differences: The role of travel and time use in subjective well-being. Transp. Res. Part F Traffic Psychol. Behav. 2016, 40, 23–34. [Google Scholar] [CrossRef] [Scilit]
- Sánchez, M.I.O.; González, E.M. Gender differences in commuting behavior: Women’s greater sensitivity. Transp. Res. Procedia 2016, 18, 66–72. [Google Scholar] [CrossRef] [Scilit]
- Croson, R.; Gneezy, U. Gender differences in preferences. J. Econ. Lit. 2009, 47, 448–474. [Google Scholar] [CrossRef] [Scilit]
- Hook, H.; De Vos, J.; Van Acker, V.; Witlox, F. Do travel options influence how commute time satisfaction relates to the residential built environment? J. Transp. Geogr. 2021, 92, 103021. [Google Scholar] [CrossRef] [Scilit]
- Heinrichs, D. Autonomous driving and urban land use. In Autonomous Driving: Technical, Legal and Social Aspects; Springer: Berlin/Heidelberg, Germany, 2016; pp. 213–231. [Google Scholar]
- Malokin, A.; Circella, G.; Mokhtarian, P.L. How do activities conducted while commuting influence mode choice? Using revealed preference models to inform public transportation advantage and autonomous vehicle scenarios. Transp. Res. Part A Policy 2019, 124, 82–114. [Google Scholar] [CrossRef] [Scilit]
- Singleton, P.A. Discussing the “positive utilities” of autonomous vehicles: Will travellers really use their time productively? Transp. Rev. 2019, 39, 50–65. [Google Scholar] [CrossRef] [Scilit]
- Larson, W.; Zhao, W. Self-driving cars and the city: Effects on sprawl, energy consumption, and housing affordability. Reg. Sci. Urban. Econ. 2020, 81, 103484. [Google Scholar] [CrossRef] [Scilit]
- Milakis, D.; Kroesen, M.; van Wee, B. Implications of automated vehicles for accessibility and location choices: Evidence from an expert-based experiment. J. Transp. Geogr. 2018, 68, 142–148. [Google Scholar] [CrossRef] [Scilit]
- Kim, S.H.; Mokhtarian, P.L.; Circella, G. Will autonomous vehicles change residential location and vehicle ownership? Glimpses from Georgia. Transp. Res. D Transp. Environ. 2020, 82, 102291. [Google Scholar] [CrossRef] [Scilit]
- Kakujo, R.; Chikaraishi, M.; Fujiwara, A. Effects of autonomous driving on residential location choice behavior: A travel-based multitasking perspective. Travel. Behav. Soc. 2024, 36, 100790. [Google Scholar] [CrossRef] [Scilit]
- Pudāne, B.; Molin, E.J.; Arentze, T.A.; Maknoon, Y.; Chorus, C.G. A time-use model for the automated vehicle-era. Transp. Res. Part C Emerg. Technol. 2018, 93, 102–114. [Google Scholar] [CrossRef] [Scilit]
- Carrese, S.; Nigro, M.; Patella, S.M.; Toniolo, E. A preliminary study of the potential impact of autonomous vehicles on residential location in Rome. Res. Transp. Econ. 2019, 75, 55–61. [Google Scholar] [CrossRef] [Scilit]
- Gelauff, G.; Ossokina, I.; Teulings, C. Spatial and welfare effects of automated driving: Will cities grow, decline or both? Transp. Res. Part A Policy 2019, 121, 277–294. [Google Scholar] [CrossRef] [Scilit]
- Guan, J.; Zhang, S.; D’ambrosio, L.A.; Zhang, K.; Coughlin, J.F. Potential impacts of autonomous vehicles on urban sprawl: A comparison of Chinese and US car-oriented adults. Sustainability 2021, 13, 7632. [Google Scholar] [CrossRef] [Scilit]
- Ratcliffe, M.; Burd, C.; Holder, K.; Fields, A. Defining rural at the US Census Bureau. Am. Community Surv. Geogr. Brief. 2016, 1, 1–8. [Google Scholar]
- Williams, D.; Edwards, S.; Giambo, P.; Kena, G. Cost effective mail survey design. In Proceedings of the Federal Committee on Statistical Methodology Research and Policy Conference, Washington, DC, USA, 7–9 March 2018. [Google Scholar]
- Wang, S.; Li, Z.; Wang, Y.; Wyatt, D.A. How do age and gender influence the acceptance of automated vehicles?–Revealing the hidden mediating effects from the built environment and personal factors. Transp. Res. Part A Policy 2022, 165, 376–394. [Google Scholar] [CrossRef] [Scilit]
- Gunzler, D.D.; Morris, N. A tutorial on structural equation modeling for analysis of overlapping symptoms in co-occurring conditions using MPlus. Stat. Med. 2015, 34, 3246–3280. [Google Scholar] [CrossRef] [Scilit]
- Wang, S.; Qiao, S.; Li, Z.; Zhao, W.; Yang, H.F.; Zhang, G.; Xu, Y. Do people believe that automated vehicle is the solution to impaired driving? insights from a statewide survey study. Transp. Res. Part F Traffic Psychol. Behav. 2026, 116, 103411. [Google Scholar] [CrossRef] [Scilit]
- Wang, S.; Li, Z.; Wang, Y.; Zhao, W.; Gu, Y.; Wei, H. Public preferences and concerns regarding automated vehicle-based transportation services: A mechanism analysis from a Kentucky survey. Transp. Lett. 2025, 17, 502–511. [Google Scholar] [CrossRef] [Scilit]
- Blalock, H.M., Jr. Causal Inferences in Nonexperimental Research; UNC Press Books: Chapel Hill, NC, USA, 2018. [Google Scholar]
- Yuen, K.F.; Wong, Y.D.; Ma, F.; Wang, X. The determinants of public acceptance of autonomous vehicles: An innovation diffusion perspective. J. Clean. Prod. 2020, 270, 121904. [Google Scholar] [CrossRef] [Scilit]
- Golob, T.F. Structural equation modeling for travel behavior research. Transp. Res. Part B Methodol. 2003, 37, 1–25. [Google Scholar] [CrossRef] [Scilit]
- Wang, S.; Li, Z.; Wei, H.; Cui, Y.; Yang, H. Revealing inherent interrelationships of direct and indirect factors impacting Driver’s stop-or-go behaviors at Yellow-Light. Transp. Res. Part F Traffic Psychol. Behav. 2024, 102, 294–315. [Google Scholar] [CrossRef] [Scilit]
- Hooper, D.; Coughlan, J.; Mullen, M. Evaluating model fit: A synthesis of the structural equation modelling literature. In Proceedings of the 7th European Conference on Research Methodology for Business and Management Studies, London, UK, 19–20 June 2008; pp. 195–200. [Google Scholar]
- Shi, D.; Maydeu-Olivares, A. The effect of estimation methods on SEM fit indices. Educ. Psychol. Meas. 2020, 80, 421–445. [Google Scholar] [CrossRef] [Scilit]
- Byrne, B.M. Structural Equation Modeling with LISREL, PRELIS, and SIMPLIS: Basic Concepts, Applications, and Programming; Psychology Press: London, UK, 2013. [Google Scholar]
- Hu, L.T.; Bentler, P.M. Cutoff criteria for fit indexes in covariance structure analysis: Conventional criteria versus new alternatives. Struct. Equ. Model. 1999, 6, 1–55. [Google Scholar] [CrossRef] [Scilit]
- Chen, X.; Dong, Q.; Zhu, H.; Huang, B. Development of distress condition index of asphalt pavements using LTPP data through structural equation modeling. Transp. Res. Part C Emerg. Technol. 2016, 68, 58–69. [Google Scholar] [CrossRef] [Scilit]
- Wang, J.; Wang, X. Structural Equation Modeling: Applications Using Mplus; John Wiley & Sons: Hoboken, NJ, USA, 2019. [Google Scholar]
- Ruiz, E.; Yushimito, W.F.; Aburto, L.; de la Cruz, R. Predicting passenger satisfaction in public transportation using machine learning models. Transp. Res. Part A Policy 2024, 181, 103995. [Google Scholar] [CrossRef] [Scilit]
- Breiman, L. Random forests. Mach. Learn. 2001, 45, 5–32. [Google Scholar] [CrossRef] [Scilit]
- Hearst, M.A.; Dumais, S.T.; Osuna, E.; Platt, J.; Scholkopf, B. Support vector machines. IEEE Intell. Syst. Their Appl. 1998, 13, 18–28. [Google Scholar] [CrossRef] [Scilit]
- Awad, M.; Khanna, R.; Awad, M.; Khanna, R. Support Vector Machines for Classification. In Efficient Learning Machines: Theories, Concepts, and Applications for Engineers and System Designers; Springer Nature: Berlin/Heidelberg, Germany, 2015; pp. 39–66. [Google Scholar]
- Chen, T.; Guestrin, C. Xgboost: A scalable tree boosting system. In Proceedings of the 22nd Acm Sigkdd International Conference on Knowledge Discovery and Data Mining, San Francisco, CA, USA, 13–17 August 2016; pp. 785–794. [Google Scholar]
- Omrani, H. Predicting travel mode of individuals by machine learning. Transp. Res. Procedia 2015, 10, 840–849. [Google Scholar] [CrossRef] [Scilit]
- Wang, S.; Li, Z.; Hu, J.; Xu, J.; Jiang, S. Traffic Conflict Forecasting and Avoidance System Under Automated Driving System Disengagement: A Non-Intrusive Prototype Design. IEEE Trans. Intell. Transp. Syst. 2023, 25, 2394–2412. [Google Scholar] [CrossRef] [Scilit]
- Chawla, N.V.; Bowyer, K.W.; Hall, L.O.; Kegelmeyer, W.P. SMOTE: Synthetic minority over-sampling technique. J. Artif. Intell. Res. 2002, 16, 321–357. [Google Scholar] [CrossRef] [Scilit]
- Elassad, Z.E.A.; Mousannif, H.; Al Moatassime, H. A real-time crash prediction fusion framework: An imbalance-aware strategy for collision avoidance systems. Transp. Res. Part C Emerg. Technol. 2020, 118, 102708. [Google Scholar] [CrossRef] [Scilit]
- Sarkar, S.; Pramanik, A.; Maiti, J.; Reniers, G. Predicting and analyzing injury severity: A machine learning-based approach using class-imbalanced proactive and reactive data. Saf. Sci. 2020, 125, 104616. [Google Scholar] [CrossRef] [Scilit]
- Lundberg, S.M.; Lee, S.-I. A unified approach to interpreting model predictions. Adv. Neural Inf. Process. Syst. 2017, 30. [Google Scholar]
- Li, J.S. Diabetes prediction and SHAP feature analysis based on machine learning. Intellient Comput. Appl. 2023, 13, 153–157. [Google Scholar]
- Li, Z. Extracting spatial effects from machine learning model using local interpretation method: An example of SHAP and XGBoost. Comput. Environ. Urban. Syst. 2022, 96, 101845. [Google Scholar] [CrossRef] [Scilit]
- Molnar, C. Interpretable Machine Learning; Lulu.com: Morrisville, NC, USA, 2020. [Google Scholar]
- Baptista, M.L.; Goebel, K.; Henriques, E.M. Relation between prognostics predictor evaluation metrics and local interpretability SHAP values. Artif. Intell. 2022, 306, 103667. [Google Scholar] [CrossRef] [Scilit]
- Muthén, L.K.; Muthén, B.O. Mplus User’s Guide; Muthén & Muthén: Los Angeles, CA, USA, 2017; Available online: http://www.statmodel.com/ugexcerpts.shtml (accessed on 11 April 2024).
- Wang, S.; Li, Z.; Wang, Y.; Wyatt, D.A. How effective is automated vehicle education?–A Kentucky case study revealing the dynamic nature of education effectiveness. Transp. Policy 2024, 147, 140–157. [Google Scholar] [CrossRef] [Scilit]
- Yi, C.; Lee, S. An empirical analysis of the characteristics of residential location choice in the rapidly changing Korean housing market. Cities 2014, 39, 156–163. [Google Scholar] [CrossRef] [Scilit]
- Zhang, L.; Jin, Y.; Shen, R.; Hui, E. Impact of Accessibility on Residential Location Choice: A Case Study of Hangzhou China. J. Urban Plan Dev. 2025, 151, 04024054. [Google Scholar] [CrossRef] [Scilit]
- Źróbek, S.; Trojanek, M.; Źróbek-Sokolnik, A.; Trojanek, R. The influence of environmental factors on property buyers’ choice of residential location in Poland. J. Int. Stud. 2015, 7, 163–173. [Google Scholar]
- Wei, Y.D.; Ewing, R. Urban expansion, sprawl and inequality. Landsc. Urban. Plan. 2018, 177, 259–265. [Google Scholar] [CrossRef] [Scilit]
- Zhao, P. Sustainable urban expansion and transportation in a growing megacity: Consequences of urban sprawl for mobility on the urban fringe of Beijing. Habitat. Int. 2010, 34, 236–243. [Google Scholar] [CrossRef] [Scilit]

Disclaimer/Publisher’s Note: The statements, opinions and data contained in all publications are solely those of the individual author(s) and contributor(s) and not of MDPI and/or the editor(s). MDPI and/or the editor(s) disclaim responsibility for any injury to people or property resulting from any ideas, methods, instructions or products referred to in the content. |
© 2025 by the authors. Licensee MDPI, Basel, Switzerland. This article is an open access article distributed under the terms and conditions of the Creative Commons Attribution (CC BY) license (https://creativecommons.org/licenses/by/4.0/).