Abstract
This study analyzes how socio-demographic factors influence the sustainable consumption of organic vegetables in Romania. Following behavioral theories such as the Theory of Planned Behavior and Value-Belief-Norm models, the study explores how attitudes, trust, and socio-demographic characteristics shape individual purchasing decisions. The main objective was to analyze the frequency of consumption of organic vegetables, the reasons for action, the level of trust in organic certification and preferences regarding distribution channels in relation to socio-demographic variables. The research was based on a structured questionnaire applied to a sample of 533 respondents, selected from various regions of the country. The statistical analysis included descriptive and inferential methods, namely the Chi-square test for the association between variables, the Spearman coefficient for ordinal correlations and the Mann–Whitney U test for the comparison of independent groups. Results show that the frequency of organic vegetable consumption decreases as income and education rise, a pattern influenced by Romania’s market structure and cultural context, where higher-income consumers often prefer imported or internationally certified products, while middle-income groups sustain local purchases. Health is the main motivation for the purchase, while aspects related to environmental protection and support for local producers are mentioned secondarily. Price perception is significantly associated with age, income, and education, and the preference for purchasing channels especially depends on educational level. Trust in producers correlates with gender and income, while trust in certification labels shows no significant associations. These findings provide insight into how socio-demographic characteristics shape sustainable consumption behaviors and build a solid foundation for the development of the organic products market in Romania.
1. Introduction
Globally, food systems exert major pressures on the environment and public health. The EAT-Lancet report highlights that current patterns of food production and consumption require a profound transformation to ensure healthy and sustainable diets [1]. Within this framework, Sustainable Development Goal no. 12 of the 2030 Agenda promotes responsible consumption and production patterns, with direct implications for people’s food choices [2].
Although numerous international studies have examined consumer behavior regarding organic products, most of them focus on Western European or North American markets. Research dedicated to Eastern Europe, and particularly to Romania, remains scarce and fragmented. The Romanian market is still in a stage of structural formation, with differences in purchasing power, information levels, and consumer awareness compared to more mature organic sectors. Understanding how socio-demographic factors shape sustainable food choices is therefore essential for both academic research and the development of evidence-based public policies [3].
Romania represents an illustrative case for emerging organic markets in Central and Eastern Europe. Despite being classified as a high-income economy [4], the country continues to face structural disparities in food consumption, with limited organic demand and dietary patterns dominated by animal-based products [5]. At the same time, Eurostat data indicate that vegetable production remains among the lowest in the European Union [6]. These characteristics make Romania a relevant case for understanding the behavioral determinants of sustainable food choices and for deriving insights applicable to other countries with similar market dynamics.
Studies indicate that health and environmental protection are the main reasons for purchasing organic products. High prices, limited availability, and low trust in labeling still discourage many consumers [7]. During the past decade, the organic market has expanded steadily, supported by public policies promoting sustainable agriculture and by growing demand for food perceived as natural, safe, and of high quality [8,9].
European and international strategies, including the European Green Deal and the Farm to Fork Strategy, establish the policy framework for the transition to sustainable food systems [6,10,11,12,13]. These initiatives aim to reduce environmental pressures, promote resource efficiency, and expand organic farming to at least 25% of total farmland by 2030, in line with Sustainable Development Goal 12 on responsible consumption and production. This policy context underscores the relevance of investigating the socio-demographic determinants of organic vegetable consumption in Romania, where the organic sector is still emerging. The COVID-19 pandemic further reinforced consumer awareness regarding food origin, safety, and certification practices [14].
The literature highlights food waste, which affects about one-third (≈30%) of global food production and harms natural resources and the environment [15]. In this context, plant by-products resulting from fruit and vegetable processing can be recovered through green technologies to obtain functional ingredients. Such approaches contribute to reducing the ecological footprint while generating value-added products that are increasingly accepted by consumers [16].
The interest of the scientific community in sustainable consumption has increased markedly in recent years. Since 2019, the number of studies addressing this topic has grown substantially, covering subjects such as household sustainable practices, circular economy models, and consumer attitudes toward organic products [17]. Recent European studies have also highlighted a strong connection between sustainability awareness and local organic food consumption, particularly in Southern countries such as Spain and Portugal [18]. Organic farming is therefore emerging not only as an alternative production system but also as a rural development strategy that generates added value for farmers and local communities. International research confirms the expansion of the organic market and indicates that socio-demographic factors, including education and income, influence both the willingness to pay higher prices and the level of trust in organic certification [19].
However, financial availability does not fully explain purchasing behaviors. Critical perceptions of price differences and the degree of information provided through labelling are key factors. The label is a central tool, as consumers mainly relate to the listed ingredients, shelf life, product origin, and organic certification, which directly influence their level of trust and the purchase decision [16]. Thus, the literature highlights that health and environmental concerns, education and income levels, and trust in certification are determinants of purchasing behavior [20]. The link between climate change, food security, and organic farming is recognized as a key component of sustainability strategies [12].
International studies show that socio-demographic characteristics such as age, gender, education, and income are significant predictors of organic food consumption [21,22].
Based on the literature and the context of the study, the main hypothesis is that consumers’ perceptions and behaviors towards organic vegetables are significantly influenced by socio-demographic characteristics, such as gender, age, net monthly household income, and education level.
These factors determine both the frequency and reasons for consumption, as well as preferences for purchasing channels and the level of trust placed on organic certifications. It should be noted that these findings are based on the Romanian market, which may limit their generalizability to other contexts.
In addition, individual motivations related to health, taste, and environmental concern, together with perceptions of price and trust in organic certification, are important determinants of sustainable purchasing behavior [23,24].
In Romania, although the organic sector is still in an early development stage compared with Western European countries, it has shown steady progress in cultivated area and product diversification [25]. However, domestic consumption of organic products remains low, well below the European average, raising questions about the factors influencing Romanian consumers’ purchasing decisions [26]. At the global level, organic product consumption exceeded €120 billion in 2020 [27], placing Europe in second position after the United States. Romania remains far below this threshold, with an average expenditure of only €2 per capita per year [20]. Recent research nevertheless shows a positive attitude among Romanian consumers towards sustainable eating behaviors, influenced primarily by age and education [28].
These contextual aspects highlight the need to review existing studies and behavioral models that explain consumers’ choices regarding organic and sustainable food.
2. Literature Review
Previous studies have extensively examined the determinants of organic food consumption, identifying factors such as health awareness, environmental concern, income, education, and trust in certification as central influences on consumer behavior [7,22]. Research conducted across Europe—particularly in Poland, Hungary, Spain, and Germany—shows that socio-demographic variables play a significant role in shaping both purchase frequency and willingness to pay for organic products [18,29]. Health-related motivations and perceived quality are among the most frequently cited drivers, while high prices, limited availability, and skepticism toward labeling remain major barriers [30].
However, evidence from Eastern and Southeastern Europe remains limited, and the Romanian context is still underrepresented in comparative studies. Few analyses have investigated how socio-demographic and perceptual factors jointly determine the consumption of organic vegetables [12,31]. To address this gap, the study builds on behavioral and value-based theoretical perspectives to explore how attitudes, trust, and individual resources contribute to sustainable food choices [32].
The literature on sustainable and organic food consumption highlights several recurrent determinants of consumer behavior. Prior studies emphasize health consciousness, environmental concern, income, education, and trust in certification systems as the main factors shaping attitudes toward organic products [7,9,22]. Research from developed markets, such as Germany or the United Kingdom, indicates that perceived product quality and safety, along with ethical motivations, strongly predict purchase intention [33]. Conversely, barriers including higher prices, limited availability, and mistrust in labeling frequently hinder adoption [29,30].
Comparative studies conducted in Central and Eastern Europe suggest that consumers are driven primarily by personal health and food safety concerns rather than ecological or social values [29,34]. In Poland and Hungary, income and education have been shown to influence both willingness to pay and trust in eco-certification schemes. Nevertheless, despite the gradual expansion of organic markets, trust deficits and inconsistent information remain obstacles, particularly in emerging markets where certification systems are still consolidating [31,35].
In the context of Romania and neighboring countries, only a limited number of empirical studies have examined the relationship between socio-demographic characteristics and sustainable food choices [3,12]. These analyzes reveal that consumer awareness of organic products is growing, yet purchasing frequency remains low due to price sensitivity, limited education, and variable levels of trust in producers and certification labels [31,36]. This evidence supports the need for further research into how socio-economic and perceptual variables jointly shape sustainable food consumption behavior [34].
Although the international literature provides extensive evidence on the determinants of organic consumption, research specific to the Romanian market remains scarce, especially regarding the organic vegetable segment [12,29]. This scarcity constrains the understanding of how socio-demographic characteristics and consumer perceptions influence the frequency and mode of consumption, in a context where the shift towards sustainable diets is becoming a policy priority [3].
In this context, the present study aims to analyze the relationship between socio-demographic variables—age, gender, income, education level, and geographic location—and the consumption of organic vegetables in Romania. The analysis also explores motivations and barriers, as well as decision criteria related to price, quality, environmental protection, and eco-certification, with a particular focus on trust and purchasing channels [3,7]. The results are relevant for both producers and policymakers, supporting market adaptation and the reinforcement of sustainable consumption practices [36]. From a theoretical standpoint, the study draws on behavioral and value-based approaches to sustainable consumption, namely the Theory of Planned Behavior and the Value–Belief–Norm (VBN) model, which explain how attitudes, subjective norms, perceived behavioral control, and moral responsibility shape consumers’ intentions to purchase organic food [7,9,37]. Integrating these frameworks provides a consistent basis for the empirical analysis, helping to explain how socio-demographic characteristics and individual perceptions influence organic vegetable consumption in Romania.
3. Materials and Methods
3.1. Research Purpose and Specific Objectives
The main objective of this research is to investigate the relationship between consumers’ socio-demographic characteristics and their consumption of organic vegetables in Romania, as well as their perceptions and preferences regarding organic products. Based on this aim, the following specific objectives (SO) were established:
SO1: To analyze the frequency of organic vegetable consumption according to socio-demographic characteristics (age, gender, income, education level, and area of residence).
SO2: To identify the main reasons for consuming organic vegetables (health, taste, environmental protection, support for local producers) and how these vary across different socio-demographic groups.
SO3: To evaluate the perception of the price of organic vegetables compared to conventional products and its impact on consumption frequency.
SO4: To analyze the level of consumer trust in organic products and certifications, as well as preferences for different purchasing channels.
Based on these directions, the following hypothesis was formulated: consumers’ perceptions and behaviors towards organic vegetables are significantly influenced by socio-demographic characteristics such as gender, age, net monthly household income, and education level. These factors determine both the frequency and reasons for consumption, as well as preferences for purchasing channels and the level of trust placed on organic certifications. It should be noted that these findings are based on the Romanian market, which may limit their generalizability to other contexts.
3.2. Research Design and Instrumentation
For the conduct of this research, a quantitative investigation was applied, with the objective of directly collecting data from organic vegetable consumers in Romania through structured, self-administered questionnaires. Before the actual application, the questionnaire was tested through a pilot study, sent by e-mail to 20 people from different backgrounds (research, education, etc.), in order to validate the relevance and clarity of the questions. Based on the comments received, the final form of the questionnaire was made, which was subsequently distributed online through the Google Forms platform, between February and May 2025.
The questionnaire was structured into four main sections to collect relevant data regarding the consumption of organic vegetables. The first section addressed demographic data, including questions on gender, age, education level, monthly household income, household size, and area of residence (urban/rural). This allowed for detailed socio-demographic profiling of respondents. The second section focused on consumption behavior. It examined the frequency of organic vegetable consumption, the proportion of organic vegetables in the total vegetable consumption, reasons for consumption or non-consumption, purchase location, and types of products bought. The third section explored respondents’ perceptions and preferences regarding trust in organic products, purchasing criteria, motivations, and willingness to pay. The fourth section collected respondents’ suggestions and opinions on certification importance, price perception, and potential improvements in the organic vegetable offer.
The questionnaire was adapted based on previous studies on vegetable consumption in Romania [36], ensuring its relevance and alignment with existing literature. Most of the questions were closed-ended, with multiple-choice options or Likert scales (1–5), facilitating quantitative analysis and comparison across population segments. Although the full questionnaire contained 24 questions, only a subset relevant to the study objectives was used in the main analysis.
3.3. Sample and Target Population
The sampling strategy used was convenience sampling [38,39], supplemented by the ‘snowball’ method [40]. The optimal sample size was determined according to the Taro Yamane method [41], using the formula:
where n represents the sample size, N represents the studied population (17,681,021 people over 18 years of age), and e is the margin of error (5%) at a 95% confidence level. According to this method, the minimum size required was 400 people. In practice, the research validated 533 responses, exceeding the minimum threshold and ensuring a solid basis of analysis.
n = N/(1 + N × e2),
The territorial distribution of respondents (Figure 1) shows a high concentration in Olt County (64%), followed by the Bucharest Ilfov region (13.7%). The rest of the counties were poorly represented (1–30 respondents), which is specific to studies based on the participants availability and accessibility of the questionnaire distribution channels.
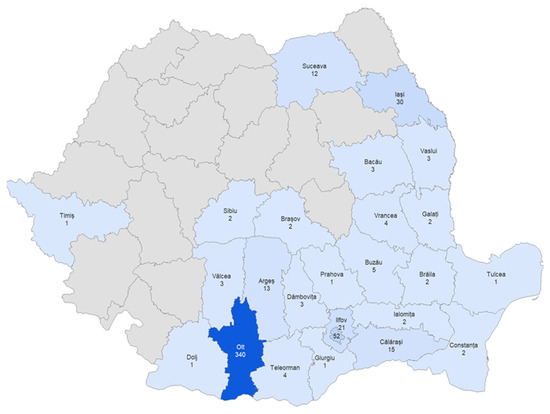
Figure 1.
Distribution of respondents included in the research by counties, Source: Authors’ own processing in CorelDRAW ver.16.
Descriptive statistics were used to characterize the sample. The structure of the respondents is shown in Figure 2, where the distributions on the main socio-demographic variables are presented. The general questions focused on information related to age, gender, education level and income, factors considered essential for shaping the profile of the participants.
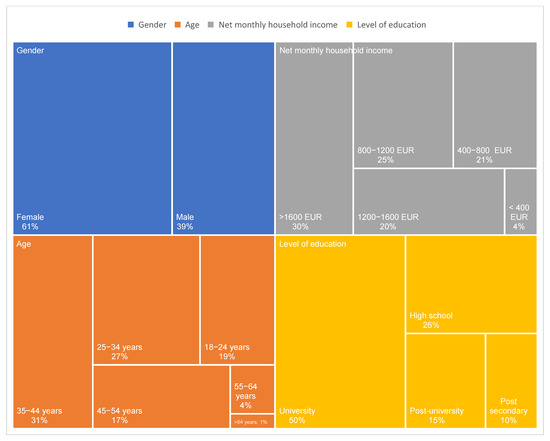
Figure 2.
Socio-demographic structure of the sample, Source: Authors’ own processing in Excel. Note: All monetary values are presented in Euros (EUR), converted from Romanian Lei (RON) using the average exchange rate published by the National Bank of Romania (NBR) for the survey period (February–May 2025, 1 EUR = 5.00 RON) [42].
The centralization of the data shows that the gender distribution highlights a higher share of females (60.79%) compared to males (39.21%). The examination of the structure by age categories indicates that the 18–44 age interval accounts for over 77% of the sample, followed by the 45–54 age segment (17.3%), while people over 55 years old represent only 5.6%. As for the net monthly household income, most of them fall into the medium and high categories: the 800–1600 EUR range concentrates 44.8% of the participants, and 29.8% declare incomes of over 1600 EUR, more frequent in the 25–44 age group. People with incomes below 400 EUR represent only 4.3%. From an educational perspective, 49.72% of respondents have university studies, 15.01% postgraduate studies, 25.52% high school studies, and 9.76% post-secondary studies, which suggests an above-average educational level of the sample.
3.4. Research Variables
The independent variables analyzed were gender, age, income and level of education. Dependent variables included: frequency of consumption of organic vegetable products, reasons for consumption, perception of price compared to conventional vegetable products, place of purchase and level of trust in producers and organic certification.
3.5. Data Processing
IBM SPSS Statistics v.20 software was used for data processing [43,44]. The study included both descriptive analysis and evaluation of the relationships between the variables analyzed, using statistical tests appropriate to the type of data. The Chi-square test (χ2) was applied when both variables were nominal or when ordinal variables were reduced to categories, assuming independence of observations and nominal measurement level, providing an assessment of the presence of association [45]. To estimate the intensity of this association, Cramer’s V was used [46]. For the comparison of a binary nominal variable with an ordinal variable, the Mann–Whitney U test was used, assuming independent observations, ordinal or continuous measurement of the dependent variable, and similar distribution shapes in the group. For the identification of monotonic relationships between ordinal variables, the Spearman coefficient (ρ) was applied, assuming ordinal measurement level, independence of observations, and a monotonic relationship between variables, which evaluation of both the direction and the intensity of the correlation [47].
4. Results
4.1. Organic Vegetable Sector in the European Union
The consumption of organic food products has been growing steadily up to 2023. In the European Union (EU), average expenditure per person reached €104, double the level recorded in 2014, with Denmark (362 EUR) and Austria (292 EUR), reporting the highest values. In Romania, average expenditure remained low, around 2.06 EUR per person on organic agri-food products, 0.8 EUR more than in 2014, while in Portugal consumption remains at 2 EUR per person [48].
Globally, the organic market is expected to grow at an annual rate of 10.1% until 2031, driven not only by health concerns but also by sustainability objectives, in line with the 2030 Agenda and the European Commission’s Green Deal [49]. This growth influences marketing strategies, distribution, and farmers’ adoption of sustainable cultivation methods [50].
Organic vegetable production in the EU has steadily increased, both in cultivated areas and yields. Financial support through the Common Agricultural Policy (CAP) has promoted sustainable farming practices, while investments in digitalization, efficient irrigation, and biotechnological innovations have further improved yields and sector sustainability [51].
In 2023, EU member states showed significant differences in area and yield for organic vegetables (including melons) (Figure 3 and Figure 4). Italy leads in cultivated area and production, followed by France and Poland, while Spain and Germany rank next in production. Countries with smaller areas, such as Belgium (3625 ha) and Sweden (1875 ha), achieve high yields of 21–22 t/ha, reflecting advanced technologies and efficient management [52]. Poland, despite a large area (28,232 ha), has a modest yield of 5.0 t/ha, indicating structural constraints related to infrastructure, technology, and market organization. Adoption of sustainable practices largely depends on financial resources, policy support, and farmers’ openness to innovation [53,54]. Western European countries, including Germany and Spain, report yields of 26–27 t/ha, while the Netherlands achieves 29.3 t/ha due to technological intensification and high-performance logistics, supported by precision agriculture and digital tools [55]. Although data for France and Portugal are incomplete, the available information confirms their relevance within the European organic vegetable sector.
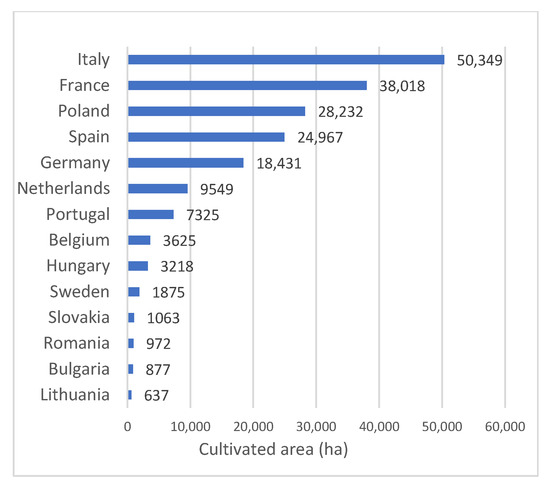
Figure 3.
Organic vegetable areas (including melons) in major EU member states, 2023 (ha). Source: Eurostat; data browser: organic crop area by agricultural production methods and crops [56].
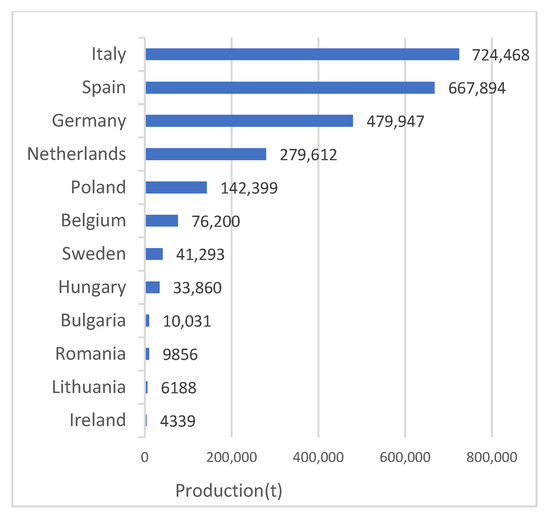
Figure 4.
Organic vegetable productions (including melons) in major EU member states, 2023 (t). Source: Eurostat; data browser: organic crop production by crops [57].
Romania, with 972 ha and a production of 9856 t in 2023, records a yield of 10.1 t/ha (Figure 5). These values place Romania on the 12th place in the European Union in terms of cultivated area and on the 10th place in terms of production. Although the levels are lower compared to Western European markets, yields exceed the performance of countries such as Slovakia (1.0 t/ha) or Poland (5.0 t/ha). The evolution indicates a growing interest in organic farming, the adaptation of sustainable practices and advances in organic crop management [58,59,60].

Figure 5.
Evolution of organic vegetable areas and production (including melons) in Romania, 2014–2023. Source: Eurostat; data browser: organic crop area by agricultural production methods and crops; organic crop production by crops [52,53].
4.2. Socio-Demographic Profile of Organic Vegetable Consumers in Romania
Following the application of the questionnaire, 533 responses were obtained, and their analysis highlighted relevant trends regarding the profile of consumers of organic vegetable products in Romania. The results show that socio-demographic factors—gender, age, income and level of education—influence both the frequency of consumption and the perceptions associated with it (Table 1).

Table 1.
Self-Rated Frequency of Consumption of Organic Vegetables by Gender, Age, Income and Educational Level (%).
The results in Table 1 show 23% of women report a daily consumption and 43% a consumption several times a week, compared to 19% and 40% of men, respectively.
The distribution by age groups shows that the 18–24 years old category stands out with the highest levels, with 24% declaring daily consumption and 43% consuming several times a week. Among respondents aged 25–34 years, 9% consume daily and 44% several times a week, while for the 35–44 age group the values are 11% and 40%, respectively. After the age of 55, the frequency of consumption decreases, with only 1–9% reporting daily consumption and 2–35% consumption several times a week.
The analysis of monthly household income shows that respondents with incomes below 400 EUR reported the highest frequency of daily consumption (48%), along with 39% consuming several times a week. In the 400–800 EUR range, 17% reported daily consumption and 53% several times a week. For households earning 800–1200 EUR, 26% consumed daily and 35% several times a week. In the higher income categories (1200–1600 EUR and above 1600 EUR), the proportion of daily consumers decreased to 20% and 17%, respectively, while weekly consumption remained relatively stable at 47% and 38%.
Regarding education level, respondents with high school and post-secondary education reported the highest frequencies of organic vegetable consumption, 46% and 54%, daily, and 23% and 15% several times a week, respectively. Respondents with higher education reported lower values: in the case of those with university studies, 41% daily and 23% several times a week among university graduates, and 33% and 15% among those with postgraduate studies.
In order to assess the influence of socio-demographic variables on the frequency of consumption of organic vegetables, non-parametric statistical tests were used, appropriate to the type of data analyzed (Table 2).
Table 2.
Associations between Socio-Demographic Characteristics and Frequency of Consumption of Organic Vegetables.
The association between the gender and the frequency of consumption, was tested using the Mann–Whitney U test. The results (U = 31,498.5; Z = −1.44; p = 0.15) indicate no statistically significant differences between men and women regarding consumption frequency. The relationship between age and frequency of consumption, analyzed using Spearman rank correlation, was also no significant (ρ = −0.04; p = 0.37).
Regarding the association between monthly household income and the level of education of respondents with frequency of consumption, the Spearman correlation was used. The results (ρ = −0.12; p = 0.005 for income and ρ = −0.11; p = 0.01 for education level) indicate a statistically significant negative correlation. However, the effect size is weak, suggesting that higher-income and more educated households tend to report less frequent consumption of organic vegetables, but the practical impact of these factors is limited.
The study also investigated the relationship between socio-demographic factors and the main reasons why respondents consume organic vegetable products (Table 3).
Table 3.
Distribution of the Main Reasons for Consuming Organic Vegetable Products According to Socio-Demographic Characteristics of Respondents (%).
The percentage analysis highlighted that the majority of respondents indicate health as the main reason (70% of the total). This aspect is mentioned by 68–74% of women and men, and in terms of age, the share increases with age, reaching 78–89% among people aged 45 to 64.
The second most frequently mentioned reason was taste (26% of the total), especially among young adults (25–28% in the 18–34 age groups) and among respondents with lower income levels (<400 EUR), where 47% identified taste as the main reason.
Environmental protection and support for local producers were mentioned much less frequently, each accounting for approximately 2% of the total responses, with values ranging 0% and 11% across socio-demographic categories. Among respondents aged 18–24, 6% cited environmental protection and up to 4% mentioned support for local producers (Table 3).
To assess the influence of socio-demographic factors on the reasons stated by the participants, Chi-Square tests with Monte Carlo significance estimation, Fisher Exact tests, and additional Linear by Linear Association tests were conducted (Table 4). Fisher’s Exact test with Monte Carlo simulation was used to account for categories with small expected frequencies, ensuring valid statistical inference where standard Chi-Square assumptions might be compromised.
Table 4.
Associations between Socio-Demographic Factors and the Reasons for Consuming Organic Vegetables.
The results indicate that gender does not have a significant effect on the reported reasons for consuming (χ2 = 5.60; df = 3; p = 0.13; Cramer’s V = 0.11), suggesting minor differences between females and males.
Age shows significant association with reasons for consumption reported using Chi Square (χ2 = 25.90, df = 15) along with Monte Carlo p = 0.06 and Fisher Exact p = 0.03 to account for small expected frequencies. The Linear-by-Linear Association test (χ2 = 4.18, p = 0.04) further indicates systematic trend across age groups, although the effect appears modest, suggesting a small effect size.
No significant associations were found between income and education level and the reasons for consumption. For income, χ2 = 19.39 (df = 12; Monte Carlo sig. = 0.08/Fisher Exact p = 0.06) and Linear-by-Linear χ2 = 2.54 (p = 0.11). For education, χ2 = 9.04 (df = 9; Monte Carlo p = 0.43/Fisher Exact p = 0.35) and Linear-by-Linear χ2 = 0.16 (p = 0.69). These results suggest that neither income nor educational attainment strongly influences participants’ motivations (Table 4).
The data in Table 5 highlight consumers’ perception of the price of organic products compared to conventional ones, depending on gender, age, income and level of education. Overall, the majority of respondents consider organic vegetable products to be “slightly more expensive” (53%) or “much more expensive” (39%), while only 7% consider that they are “approximately the same” price. The perception that these products are “cheaper” is almost completely absent, being reported by only 2 respondents (0.4%).
Table 5.
Perception of the Price of Organic Products Compared to Conventional Products by Socio-Demographic Categories (%).
Regarding gender, there are no significant differences between women and men. However, there are important variations depending on age, income and level of education. Young respondents (18–24 years old) more frequently consider prices to be similar, while respondents over 35 emphasize that organic products are “much more expensive”. Household income has a smaller effect on price perception, although higher-income households tend to perceive prices as more expensive. Respondents with incomes below 400 EUR report 17% “approximately the same” and 61% “slightly more expensive,” while in the over 1600 EUR category, only 4% consider prices similar, and 46% perceive them as “much more expensive.”
Educational level shows clearer differences: respondents with higher or postgraduate education often report that organic products are “much more expensive” (41% and 56%, respectively), compared to those with secondary education, where the “slightly more expensive” perception predominates (63%).
To assess the relationship between socio-demographic variables and the perception of the price of organic vegetable products, nonparametric tests were applied (Table 6). The results show that gender does not significantly influence price perception (U = 32,158.5; p = 0.47), confirming that women and men have similar opinions.
Table 6.
Associations between Socio-Demographic Factors and the Perception of the Price of Organic Products Compared to Conventional Products.
Age, however, is significantly associated with price perception (ρ = 0.19; p < 0.01), indicating that, older respondents are more likely to consider products “much more expensive”.
Income also shows a positive and significant correlation (ρ = 0.15; p < 0.01), suggesting that respondents with higher incomes perceive price differences more acutely, possibly reflecting greater attention to value for money.
In the case of education level, the correlation is significant but negative (ρ = −0.17; p < 0.01), which shows that as the educational level increases, respondents tend to consider organic products as “much more expensive” more frequently (Table 6).
Although these correlations are statistically significant, the effect sizes are weak, indicating that the practical influence of age, income, and education level on price perception is modest.
The analysis of the data reflects participants’ preferences regarding the place of purchase of organic vegetable products, and since multiple options could be selected, the percentages indicate the frequency of responses for each category. Most respondents buy products from supermarkets (55%) and local markets (44%), while direct purchases from producers are reported by 28% of participants. Specialized stores and online purchases are less frequently used, at 7% and 2%, respectively (Table 7).
Table 7.
Distribution of Preferences Regarding the Place of Purchase of Organic Vegetable Products by Gender, Age, Income, and Educational Level (%).
Gender did not significantly affect purchase preferences, as both women and men favored supermarkets and local markets in similar proportions. Age showed analysis minor variation: respondents aged 18–24 bought more frequently from supermarkets (56%) and local markets (44%), whereas the 45–54 age group showed a slightly higher orientation towards specialized stores (13%).
Household income also influenced purchase patterns. Respondents with incomes below 400 EUR had relatively balanced preferences across supermarkets, local markets and direct purchases from producers (approx. 39% each), while households with incomes over 1600 EUR favored supermarkets (61%) and local markets (38%), with greater interest in specialized stores (33%).
Education level influenced purchasing decisions: consumers with high school or post-secondary education more frequently chose local markets (49% and 60%, respectively), whereas university and postgraduate respondents primarily purchased from supermarkets (57–61%) and directly from producers (25–38%) (Table 7).
The results of the association tests (Table 8) show that gender, age and household income are not significantly associated with the preference for the place of purchase of organic products (p > 0.05 for all channels).
Table 8.
Associations between Socio-Demographic Factors and the Place of Purchase of Organic Vegetable Products.
The only significant association was identified between education level and purchases in local markets (χ2 = 11.48; p = 0.009), suggesting that respondents with different educational levels exhibit distinct behaviors regarding purchases local markets. However, the effect size was modest, indicating that although education level influences purchases in local markets, its practical impact is limited. For other purchasing channels (supermarkets, directly from manufacturers, specialized stores and e-commerce) no significant associations were found with level of education.
The data analysis reflects consumers’ preferences regarding the level of trust in organic products, both purchased directly from producers and certified. Table 9 presents the proportions for each category (%) of trust (“Not at all”, “Low”, “Moderate”, “High”) for both types of products.
Table 9.
Level of Trust in Organic Products Purchased Directly from the Manufacturer or Certified Organic Products by Socio-Demographic Categories (%).
Overall, trust in products purchased directly from producers is higher than in the case of certified products: most respondents reported a “Moderate” (55%) or “High” (31%) level for direct products and “Moderate” (53%) or “High” (24%) for certified products. From a gender perspective, women showed a higher percentage of “High” trust in both types of products compared to men.
Analysis by age group shows that 18–24 and 45–54 year olds reported the highest percentage of “High” trust for direct products (34% and 39%), while people over 64 years old reported predominantly “Moderate” level (71%). For certified products, people over 64 years old had the lowest proportion of “High” (17%) and the highest of “Low” (33%).
By income, households with incomes below EUR 400 reported a notable percentage of “High” trust for direct products (39%), but only 19% for certified ones, and households with incomes between EUR 1200 and 1600 were predominantly in the “Moderate” category (64% direct, 58% certified).
From an education level perspective, the distribution of trust is relatively balanced, except for respondents with post-secondary education, who reported more “High” (28%) for certified products and less “Moderate” (42%).
To evaluate whether trust in organic products, both those purchased directly from the manufacturer and certified organic products, is influenced by socio-demographic factors, non-parametric tests were applied (Table 10).
Table 10.
Associations between Socio-Demographic Variables and the Level of Trust in Organic Products (Directly from Producers and Certified Organic Products).
The analysis shows that gender significantly influences the level of trust in organic products purchased directly from producers (Mann–Whitney U = 29,028, p = 0.04), with women reporting higher trust level than men.
Age does not have a significant correlation with confidence (Spearman ρ = −0.05, p = 0.29). Income and education level show negative but significant correlations with trust (income ρ = −0.09, p = 0.04; education ρ = −0.10, p = 0.02).
In the case of certified organic products, no socio-demographic variable shows a significant correlation with the level of trust. Gender (U = 23,940, p = 0.59), age, income, and education level (ρ between −0.06 and −0.03; p > 0.05), do not significantly influence trust certified products.
5. Discussion
This study sheds light on how socio-demographic characteristics, consumer motivations, price perception, purchasing channels, and trust interplay in shaping the behavior of Romanian organic vegetable consumers. While the hypothesis that gender, age, income, and education significantly influence consumption frequency, reasons, channel preference, and trust, is only partially confirmed, the patterns identified provide useful comparative insights.
The analysis indicates that women and younger consumers tend to purchase organic products more frequently, a pattern also observed in previous research [36,61,62,63,64]. Respondents aged 18–24 reported the highest frequency of organic vegetable consumption, which gradually decreases in older age groups. This trend likely reflects greater openness to new dietary trends, higher exposure to sustainability-focused campaigns, and stronger receptivity to innovation among younger consumers. Similar age-related patterns have been reported in Poland, where younger and more educated individuals are more likely to adopt organic foods [65]. Previous studies also suggest correlations between a healthy and sustainable lifestyle, age, and gender, reinforcing the observation that younger groups exhibit distinct, sustainability-oriented consumption behaviors [66].
However, statistical tests did not indicate strong significance for sex and age variables, suggesting that although women may show greater health concern and younger individuals are more receptive to food innovations, these differences are not decisive in determining consumption frequency. This outcome may be related to the sample structure, which included a higher proportion of female and younger respondents, reducing variance across groups and the statistical power of the tests. Moreover, gender and age may influence consumer perceptions and motivations indirectly rather than directly affecting purchase frequency. This discrepancy may be explained by cultural and educational differences, similar to observations from Hungary and Serbia, where young, well-educated consumers with higher incomes are more receptive to innovation and responsible consumption [67,68]. In contrast, income and education show negative but significant associations, suggesting that households with higher resources report less frequent consumption of organic vegetables, often preferring traditional or local products. This tendency is supported by international literature [18,24,33,66,67,69], yet contrasts with studies in Poland, where higher economic status is associated with a higher probability of consuming organic products [19,65], and in Serbia, where income positively influences willingness to pay for local and organic products [67]. In Romania, wealthier and more educated consumers appear to value authenticity and direct relationships with producers over formal certification.
Health remains the dominant consumption motivation, mentioned by approximately 70% of respondents, followed by taste, particularly among younger consumers and lower-income households. Environmental protection and support for local producers are rarely mentioned. These results align with the literature, which consistently identifies health as the main determinant of organic product consumption [23,29,31,32,36,37,64,70,71,72], but contrast with studies in Poland and Hungary, where environmental and personal well-being concerns are more prominent [65,68]. International studies also show that motivations vary according to age and income: older or wealthier consumers are more likely to cite health and food safety, whereas younger consumers prioritize taste [62,63,64,73,74]. Our results confirm this pattern while highlighting the very low emphasis on environmental concerns or support for local organic producers, unlike other European studies reporting higher importance of these factors [29,66,67,71,75,76].
Price perception remains a significant barrier to organic vegetable consumption. Most respondents consider these products either “slightly more expensive” (53%) or “much more expensive” (39%) than conventional alternatives, consistent with other international studies [19,29,30,63,67,77]. Analyzes indicate that price perception is significantly influenced by age, income, and education: older consumers and lower-income households more frequently perceive organic vegetables as “much more expensive,” while respondents with higher education report larger perceived price differences than those with secondary education. These findings are consistent with Romanian and international studies [28,67,78], highlighting that price perception and willingness to pay for organic products depend on income and consumer awareness. These perceptions may also be connected to trust issues, as older consumers tend to rely more on personal relationships with producers than on certification systems.
Purchasing channels show a clear preference for supermarkets (55%) and local markets (44%), followed by direct purchases from producers (28%). Education is a significant determinant of this choice, as higher-educated consumers tend to favor local markets, reflecting patterns also observed in other European studies [33,62,68,78,79].
Regarding trust, respondents exhibited higher confidence in products purchased directly from producers compared with certified organic products, reflecting the “trust paradox,” whereby personal relationships and direct experience prevail over institutional mechanisms. Lack of trust in certification is documented in other studies [12,24,28,33,79] and represents a major barrier to the development of the organic market in Romania. Gender significantly influences trust, with women reporting higher values, whereas income and education are negatively correlated; for certified products, socio-demographic differences were not significant. The study by Park-Poaps & Han [80] complements this perspective, showing that trust in organic certification positively influences consumer attitudes and behaviors, and that perceptions of certification efficacy and belief that individual actions contribute to environmental protection are crucial for adopting organic products. Thus, strengthening trust in official certifications alongside maintaining and developing direct producer relationships emerges as a key strategy to stimulate organic vegetable consumption in Romania.
This apparent trust paradox reflects the coexistence of two distinct forms of confidence: relational trust, based on personal contact and perceived authenticity, and institutional trust, related to certification systems and formal control mechanisms. Romanian consumers tend to rely more on relational trust, associated with direct interaction and local origin, than on institutional mechanisms perceived as bureaucratic or distant. Building on this distinction, the trust paradox also provides an important theoretical insight. While institutional trust, based on certifications and formal control mechanisms, is intended to guarantee product quality and safety, it often plays a limited role in shaping consumer confidence on its own. In contrast, relational trust, rooted in personal interactions, repeated experiences, and perceived authenticity, exerts a stronger influence on consumer behavior. This differentiation clarifies why Romanian consumers tend to prefer direct purchases from producers despite the existence of formal certification systems. From a theoretical perspective, explicitly separating these two forms of trust strengthens the conceptual framework for understanding consumer decision-making in the organic food market. It also suggests that strategies to encourage organic consumption should simultaneously reinforce institutional credibility and maintain relational networks, highlighting the multidimensional nature of trust in post-transition economies.
Compared with other Central and Eastern European countries, the Romanian organic food market remains at a modest stage of development, with relatively low per capita expenditure and limited domestic demand [13]. Similar economic and behavioral constraints have been noted in Bulgaria, Croatia, and Hungary, where organic products are still perceived as expensive and less accessible. By contrast, research conducted in Poland and Slovenia indicates a gradual consolidation of consumer awareness and market consolidation, and a growing preference for locally certified organic products. These findings place Romania within the broader regional pattern of post-transition economies, yet also underline national particularities shaped by income disparities, institutional maturity, and the level of consumer trust in certification systems.
The study’s findings have multiple implications. First of all, marketing strategies and public policies dedicated to organic products can be optimized by emphasizing the health benefits and by developing education and information campaigns that increase consumer confidence in certifications. Second, market segmentation and product adaptation to the needs of different categories of consumers can help increase the adoption rate of organic products. Third, the findings suggest strategies for developing new products based on organic products, catering to consumer preferences and market trends. Last but not least, the study highlights the need for a better developed distribution infrastructure and strategies to reduce price perception, including supportive policies and financial incentives for consumers.
Although the study provides valuable insights into the consumption behavior of organic vegetable products in Romania, it has certain limitations. A major limitation is the geographic concentration of respondents, 64% are from Olt County, which may introduce sampling bias and reduce the representativeness of the sample. To mitigate this, regional differences were accounted for using a dummy variable for region (Olt = 1, others = 0) in the analyses. Results show significant differences for frequency of consumption, price perception, and supermarket purchases, while other measures, such as trust in producers or certified products, did not differ significantly across regions. This approach partially addresses the overrepresentation of Olt respondents, but findings may still not be fully generalizable to other regions of Romania, where socio-demographic profiles and consumption patterns may differ. Future research could address these limitations by including a more geographically diverse sample and exploring regional differences in consumption behavior.
6. Conclusions
The results obtained in this study highlight several essential aspects regarding the influence of socio-demographic factors on the consumption of organic vegetables in Romania. Statistical analysis and comparative interpretations with the literature made it possible to outline a consumer profile and to identify the main barriers and motivations, providing directions for increasing the consumption of organic products by adapting interventions to the characteristics of different population segments and implementing targeted promotion and education campaigns, aligned with Romania’s agro-food market through promotion of short supply chains, farmers’ markets, and local production.
The results suggest that the decision to consume organic vegetables is determined both by material resources and by perceptions, attitudes, and the level of trust. Understanding these determinants is essential for developing measures that stimulate demand and strengthen responsible purchasing behaviors, and increase trust in certification systems, while policies such as affordable pricing, financial incentives, and clear communication on certification can directly address consumer barriers. Young people and women show greater openness to this type of consumption, which can be leveraged through promotion and food education campaigns aimed at increasing interest in organic products. Income and education, although often associated with more responsible behaviors, show a negative relationship with consumption frequency, indicating the presence of cultural and symbolic barriers that are difficult to explain solely in terms of financial resources, which in Romania can be mitigated through support for local producers and improved access to locally certified products.
This result, which differs from patterns observed in Western European markets, can be explained by Romania’s specific socio-economic and cultural context. Consumers with higher income and education levels tend to prefer imported or internationally certified organic products, perceived as safer or of superior quality. Middle-income groups, however, consume locally produced organic vegetables more frequently, influenced by price accessibility, proximity to producers, and familiarity with traditional foods. These findings suggest that cultural preferences, market trust, and product origin have a stronger impact on consumption behavior than financial resources alone, highlighting the need for distribution strategies such as farm-to-fork initiatives and partnerships with local markets and supermarkets.
Health is the dominant motivation for consumption, while taste is mainly mentioned by low-income youth. Arguments related to environmental protection or support for local producers have a marginal weight, suggesting that collective motivations remain secondary to individual concerns. At the same time, the high price and lack of trust in certification are major barriers to the expansion of organic consumption of organic products. Addressing these obstacles through affordable pricing policies, transparent communication, and credible certification is essential for increasing the organic products market.
Regarding purchasing channels, supermarkets and local markets remain preferred, while online and specialized store purchases are marginal. The level of education significantly influences the choice of channel, and trust is higher for products purchased directly from producers than for certified ones. This underlines the need for greater transparency and more effective communication in the green market, as key factors for strengthening trust and increasing domestic consumption of organic products, which can be implemented through regional educational campaigns and consumer information programs.
From an economic and rural development perspective, the results indicate that supporting small producers and strengthening short supply chains can help reduce the gap between consumers and producers. Public policies aimed at supporting organic farmers in rural areas, facilitating their market access, and promoting certification as a sustainability tool can play a decisive role in stimulating demand and the consumption of organic products. In addition, educational campaigns adapted to the regional context can support both the increased trust and the economic development of rural communities, strengthening the link between production and sustainable consumption. To translate these recommendations into action, several practical directions can be considered. One is to extend existing rural development initiatives that promote cooperation within short supply chains and direct sales. Another is to integrate consumer information and education components into these programs, in order to increase awareness and confidence in organic certification, while government and cooperative programs can provide subsidies, tax incentives, and labeling initiatives to further stimulate the domestic organic market.
Overall, the study confirms the significant association between socio-demographic characteristics and consumption behavior among respondents from Romania, especially in relation to income and education. These findings support the need for public policies and market strategies that increase the accessibility and credibility of organic products but also stimulate the sustainable development of rural areas. By integrating these directions, the results can directly contribute to the growth of organic product consumption and to the consolidation of a sustainable dietary model in Romania.
The research has certain limitations related to the composition and geographical distribution of respondents, as well as to the predominantly declarative nature of the collected data. These aspects reflect the subjective dimension of consumer perceptions and attitudes, which may not always translate directly into actual purchasing behavior. Future research could address these aspects by using larger and more regionally balanced samples. It could also apply mixed quantitative and qualitative methods to capture more precisely the motivational and symbolic dimensions of organic consumption. Longitudinal analyses that track changes in consumer behavior and motivations over time would further improve the understanding of how income, education, and trust shape sustainable purchasing decisions. Together, these approaches can provide a deeper perspective on the relationship between individual motivations, local context, and sustainable consumption practices in rural economies.
Author Contributions
Conceptualization, D.M.I. and R.L.B.; methodology, D.M.I. and R.L.B.; software, D.M.I.; validation, V.C.T. and M.M.M.; formal analysis, D.M.I. and R.L.B.; investigation, D.M.I. and V.C.T.; writing—original draft preparation, D.M.I. and R.L.B.; writing—review and editing, R.L.B., V.D. and S.R.; visualization, D.M.I. and R.L.B.; supervision, M.M.M., V.D. and S.R.; project administration, R.L.B. All authors have read and agreed to the published version of the manuscript.
Funding
This research was funded by the Ministry of Agriculture and Rural Development (Romania), under contract ADER 22.1.3/21.07.2023.
Institutional Review Board Statement
Ethical review and approval were waived for this study by Institution Committee due to Legal Regulations (Ethical review and approval were waived for this study, as it involved an anonymous questionnaire and no directly identifiable personal data were collected. The only personal information gathered were age, gender, education level, income, and area of residence. Participants were informed that data collection was anonymous, that confidentiality would be maintained, and that data processing complies with the EU General Data Protection Regulation (GDPR, Regulation (EU) 2016/679)).
Informed Consent Statement
Informed consent for participation was obtained from all subjects involved in the study.
Data Availability Statement
The original contributions presented in this study are included in the article. Further inquiries can be directed to the corresponding author.
Conflicts of Interest
The authors declare no conflicts of interest.
References
- Willett, W.; Rockström, J.; Loken, B.; Springmann, M.; Lang, T.; Vermeulen, S.; Garnett, T.; Tilman, D.; DeClerck, F.; Wood, A.; et al. Food in the Anthropocene: The EAT-Lancet Commission on healthy diets from sustainable food systems. Lancet 2019, 393, 447–492. [Google Scholar] [CrossRef] [PubMed]
- United Nations. Sustainable Development Goal 12: Ensure Sustainable Consumption and Production Patterns. 2025. Available online: https://sdgs.un.org/goals/goal12 (accessed on 2 August 2025).
- Moroșan, E.; Popovici, V.; Popescu, I.A.; Daraban, A. Perception, trust, and motivation in consumer behavior for organic food acquisition: An exploratory study. Foods 2025, 14, 293. [Google Scholar] [CrossRef] [PubMed]
- World Bank. World Bank Country and Lending Groups. 2024. Available online: https://datahelpdesk.worldbank.org/knowledgebase/articles/906519-world-bank-country-and-lending-groups (accessed on 22 October 2025).
- U.S. Department of Agriculture (USDA). Romania—Exporter Guide: Market Overview and Consumer Trends 2024; Foreign Agricultural Service, Bucharest Office: Bucharest, Romania, 2024. Available online: https://www.fas.usda.gov/data/romania-exporter-guide-4 (accessed on 22 October 2025).
- Eurostat. Organic Farming in the European Union: Statistics on Area and Production; Publication Office of the European Union: Gare, Luxembourg, 2024; Available online: https://ec.europa.eu/eurostat/web/products-eurostat-news/w/ddn-20240619-3 (accessed on 16 October 2025).
- Kushwah, S.; Dhir, A.; Sagar, M.; Gupta, B. Determinants of organic food consumption: A systematic literature review on motives and barriers. Appetite 2019, 143, 104402. [Google Scholar] [CrossRef]
- Schlatter, B.; Trávníček, J.; Helbing, M.; Willer, H. Current statistics on Organic Agriculture Worldwide: Area, Operators, International Trade and Retail Sales. In The World of Organic Agriculture: Statistics and Emerging Trends 2025; Willer, H., Trávníček, J., Schlatter, B., Eds.; FiBL: Frick, Switzerland; IFOAM—Organics International: Bonn, Germany, 2025; pp. 31–61. Available online: https://www.fibl.org/fileadmin/documents/shop/1797-organic-world-2025.pdf (accessed on 17 October 2025).
- Yadav, R.; Pathak, G.S. Determinants of consumers’ green purchase behavior in a developing nation: Applying and extending the theory of planned behavior. Ecol. Econ. 2017, 134, 114–122. [Google Scholar] [CrossRef]
- European Commission. The European Green Deal: Striving to Be the First Climate-Neutral Continent. 2019. Available online: https://ec.europa.eu/info/strategy/priorities-2019-2024/european-green-deal_en (accessed on 20 July 2025).
- European Commission. Farm to Fork Strategy: For a Fair, Healthy and Environmentally-Friendly Food System. 2020. Available online: https://food.ec.europa.eu/horizontal-topics/farm-fork-strategy_en (accessed on 2 August 2025).
- Dan, I.S.; Jitea, I.M. Barriers and levers in the development of the value chain of organic vegetables in Romania. Sustainability 2023, 15, 12321. [Google Scholar] [CrossRef]
- Lampkin, N.; Jahrl, I.; Reinecke, S. Achieving the EU Farm-to-Fork 25% Organic Target: How Can Policy Support This Goal? In The World of Organic Agriculture: Statistics and Emerging Trends 2025; Willer, H., Trávníček, J., Schlatter, B., Eds.; FiBL: Frick, Switzerland; IFOAM—Organics International: Bonn, Germany, 2025; pp. 213–219. Available online: https://www.fibl.org/fileadmin/documents/shop/1797-organic-world-2025.pdf (accessed on 16 October 2025).
- Skalkos, D.; Tsakiridou, E. Exploring the impact of COVID-19 pandemic on food choice motives: A systematic review. Sustainability 2023, 15, 1606. [Google Scholar] [CrossRef]
- FAO. Global Food Losses and Food Waste—Extent, Causes and Prevention; Food and Agriculture Organization of the United Nations: Rome, Italy, 2011; Available online: https://www.fao.org/4/mb060e/mb060e.pdf (accessed on 22 October 2025).
- Draghici, M.C.; Mitelut, A.C.; Popa, E.E.; Popescu, A.P.; Popa, V.I.; Barbu, A.; Popa, M.A. Study on consumers’ perception and knowledge on vegetal organic by-products used as functional ingredients. Sci. Pap. Ser. Manag. Econ. Eng. Agric. Rural. Dev. 2021, 21, 203–209. Available online: https://orgprints.org/id/eprint/44244/1/DRAGHICI%20et%20al.2021.pdf (accessed on 2 September 2025).
- Sesini, G.; Castiglioni, C.; Lozza, E. New trends and patterns in sustainable consumption: A systematic review and research agenda. Sustainability 2020, 12, 5935. [Google Scholar] [CrossRef]
- Sandri, E.; Broccolo, A.; Piredda, M. Analysis of the importance of food sustainability and the consumption of organic and local products in the Spanish population. Sustainability 2025, 17, 991. [Google Scholar] [CrossRef]
- Mazur-Wlodarczyk, K.; Gruszecka-Kosowska, A. Conventional or organic? motives and trends in Polish vegetable consumption. Int. J. Environ. Res. Public Health 2022, 19, 4667. [Google Scholar] [CrossRef]
- Morna, A.A.; Brata, A.M.; Țirpe, O.P.; Mureșan, I.; Arion, F.H.; Foră, A.F.; Popa, D.; Chereji, A.I.; Milin, I.A.; Bacter, R.V. Analysis of the factors and barriers influencing the consumption of organic products. Case of Bihor County, Romania. Sci. Pap. Ser. Manag. Econ. Eng. Agric. Rural. Dev. 2023, 23, 605–615. Available online: https://managementjournal.usamv.ro/pdf/vol.23_3/Art63.pdf (accessed on 20 September 2025).
- Grankvist, G.; Biel, A. The importance of beliefs and purchase criteria in the choice of eco-labeled food products. J. Environ. Psychol. 2001, 21, 405–410. [Google Scholar] [CrossRef]
- Rana, J.; Paul, J. Consumer behavior and purchase intention for organic food: A review and research agenda. J. Retail. Consum. Serv. 2017, 38, 157–165. [Google Scholar] [CrossRef]
- Aertsens, J.; Verbeke, W.; Mondelaers, K.; Van Huylenbroeck, G. Personal determinants of organic food consumption: A review. Br. Food J. 2009, 111, 1140–1167. [Google Scholar] [CrossRef]
- Hughner, R.S.; McDonagh, P.; Prothero, A.; Shultz, C.J.; Stanton, J. Who are organic food consumers? A compilation and review of why people purchase organic food. J. Consum. Behav. 2007, 6, 94–110. [Google Scholar] [CrossRef]
- MADR. Report on Organic Agriculture in Romania; Ministry of Agriculture and Rural Development: Bucharest, Romania, 2023. Available online: https://www.madr.ro/docs/agricultura/agricultura-ecologica/2023/plan-nat-actiune-agri-eco-10.05.2023.pdf (accessed on 22 August 2025).
- FIBL. Organic Market Report Europe 2024; Research Institute of Organic Agriculture: Frick, Switzerland, 2024; Available online: https://www.fibl.org/fileadmin/documents/shop/1747-organic-world-2024_light.pdf (accessed on 20 August 2025).
- FiBL; IFOAM—Organics International. The World of Organic Agriculture: Statistics and Emerging Trends 2022; Research Institute of Organic Agriculture (FiBL): Frick, Switzerland; IFOAM—Organics International: Bonn, Germany, 2022; Available online: https://www.fibl.org/fileadmin/documents/shop/1344-organic-world-2022.pdf (accessed on 22 October 2025).
- Mureșan, I.C.; Harun, R.; Arion, F.H.; Brata, A.M.; Chereches, I.A.; Chiciudean, G.O.; Dumitras, D.E.; Oroian, C.F.; Tirpe, O.P. Consumers’ attitudes towards sustainable food consumption during the COVID-19 pandemic in Romania. Agriculture 2021, 11, 1050. [Google Scholar] [CrossRef]
- Bryła, P. Organic food consumption in Poland: Motives and barriers. Appetite 2016, 105, 737–746. [Google Scholar] [CrossRef]
- Aschemann-Witzel, J.; Zielke, S. Can’t buy me green? A review of consumer perceptions of and behavior toward the price of organic food. J. Consum. Aff. 2017, 51, 211–251. [Google Scholar] [CrossRef]
- Stoleru, V.; Munteanu, N.; Istrate, A. Perception towards organic vs. conventional products in Romania. Sustainability 2019, 11, 2394. [Google Scholar] [CrossRef]
- Yadav, R. Altruistic or egoistic: Which value promotes organic food consumption among young consumers? A study in the Indian context. J. Retail. Consum. Serv. 2016, 33, 92–97. [Google Scholar] [CrossRef]
- Grunert, K.G.; Hieke, S.; Wills, J. Sustainability labels on food products: Consumer motivation, understanding and use. Food Policy 2014, 44, 177–189. [Google Scholar] [CrossRef]
- Kovács, I.; Balázsné Lendvai, M.; Beke, J. The importance of food attributes and motivational factors for purchasing local food products: Segmentation of young local food consumers in Hungary. Sustainability 2022, 14, 3224. [Google Scholar] [CrossRef]
- Tandon, A.; Dhir, A.; Kaur, P.; Kushwah, S.; Salo, J. Why do people buy organic food? The moderating role of environmental concerns and trust. J. Retail. Consum. Serv. 2020, 57, 102247. [Google Scholar] [CrossRef]
- Ladaru, G.R.; Ilie, D.M.; Diaconeasa, M.C.; Petre, I.L.; Marin, F.; Lazar, V. Influencing Factors of a Sustainable Vegetable Choice. The Romanian Consumers’ Case. Sustainability 2020, 12, 9991. [Google Scholar] [CrossRef]
- Stern, P.C. Toward a coherent theory of environmentally significant behavior. J. Soc. Issues 2000, 56, 407–424. [Google Scholar] [CrossRef]
- Stratton, S.J. Population research: Convenience sampling strategies. Prehospital Disaster Med. 2021, 36, 373–374. [Google Scholar] [CrossRef]
- Golzar, J.; Noor, S.; Tajik, O. Convenience sampling. Int. J. Educ. Lang. Stud. 2022, 1, 72–77. [Google Scholar] [CrossRef]
- Ting, H.; Memon, M.A.; Thurasamy, R.; Cheah, J.-H. Snowball sampling: A review and guidelines for survey research. Asian J. Bus. Res. 2025, 15, 1–15. [Google Scholar] [CrossRef]
- Oluigbo, C.U.; Ngozi, E.C.; Ohaegbu, P.M.N.I. Determination of Sample Sizes in Research Using Taro Yamane Formula: An Overview. In Proceedings of the 1st Annual Faculty of Science International Conference, Niger Delta University, Amassoma, Nigeria, 14–16 April 2024; Volume 1, pp. 76–84. Available online: https://www.researchgate.net/publication/390947646_DETERMINATION_OF_SAMPLE_SIZES_IN_RESEARCH_USING_TARO_YAMANE_FORMULA_AN_OVERVIEW (accessed on 20 April 2025).
- National Bank of Romania (NBR). Average Exchange Rate (Monthly and Yearly). Available online: https://www.cursbnr.ro/curs-valutar-mediu (accessed on 13 October 2025).
- Rosada, R.; Syahputra, Y.; Haryanto, H. Self-confidence and hedonism: Identifying the social behavior of junior high school student. J. Keilmuan Pendidik. 2025, 1, 1–12. [Google Scholar] [CrossRef]
- IMB SPSS Statistics Brief Guide, Version 28.0.0; IBM: Armonk, NY, USA, 2025; Available online: https://www.ibm.com/docs/en/SSLVMB_28.0.0/pdf/IBM_SPSS_Statistics_Brief_Guide.pdf (accessed on 25 June 2025).
- Statistics Online Computational Resource (SOCR). Available online: https://www.socr.umich.edu/Applets/ChoiceOfTest.html (accessed on 25 June 2025).
- SPSS Tutorials. Cramér’s V-What and Way? Available online: https://www.spss-tutorials.com/cramers-v-what-and-why/ (accessed on 28 June 2025).
- Ali, M.G.; Yousef, A.M.; Sarhan, M.A.M.; Alwhaibi, R.M.; Zakaria, H.M.; Mohammed, A.A.; Ragab, W.M.; Mamoon, R.S.; Auais, M. Testing the Association Between Low Back Pain Intensity and Core Muscle Strength in Postpartum Women with Different Delivery Modes: An Analytical Cross-Sectional Study. J. Clin. Med. 2025, 14, 6505. [Google Scholar] [CrossRef]
- FIBL. Organic Retail Sales. Statistics. 2025. Available online: https://statistics.fibl.org/world/retail-sales.html (accessed on 12 September 2025).
- Pop, R. Study Regarding the Romanian Consumers Behavior on the Forest Fruit Market. In Agriculture Economy and Rural Development—Trends and Challenges; The Research Institute for Agricultural Economy and Rural Development (ICEADR): Bucharest, Romania, 2024; Volume 15, pp. 115–123. Available online: https://www.econstor.eu/bitstream/10419/319513/1/ICEADR-2024-p115-123.pdf (accessed on 12 September 2025).
- Berevoianu, R.L. Comparative Analysis of the Economic Efficiency of Eggplant Cultivation in Greenhouses: Organic and Conventional Agriculture System—Forecasts 2024/2025. In Agriculture Economy and Rural Development—Trends and Challenges; The Research Institute for Agricultural Economy and Rural Development (ICEADR): Bucharest, Romania, 2024; Volume 15, pp. 32–39. Available online: https://www.econstor.eu/bitstream/10419/319503/1/ICEADR-2024-p032-039.pdf (accessed on 12 September 2025).
- European Commission. Organic Action Plan. Available online: https://agriculture.ec.europa.eu/farming/organic-farming/organic-action-plan_en (accessed on 12 September 2025).
- Petrović, B.; Kononeț, E.; Csambalik, L. Adoption of drone, sensor, and robotic technologies in organic farming systems of Visegrad countries. Heliyon 2025, 11, e41408. [Google Scholar] [CrossRef]
- Serebrennikov, D.; Thorne, F.; Kallas, Z.; McCarthy, S.N. Factors influencing adoption of sustainable farming practices in Europe: A systemic review of empirical literature. Sustainability 2020, 12, 9719. [Google Scholar] [CrossRef]
- Sapbamrer, R.; Thammachai, A. A systematic review of factors influencing farmers’ adoption of organic farming. Sustainability 2021, 13, 3842. [Google Scholar] [CrossRef]
- Castellini, G.; Romanò, S.; Merlino, V.M.; Barbera, F.; Costamagna, C.; Brun, F.; Graffigna, G. Determinants of consumer and farmer acceptance of new production technologies: A systematic review. Front. Sustain. Food Syst. 2025, 9, 1557974. [Google Scholar] [CrossRef]
- Eurostat. Organic Crop Area by Agricultural Production Methods and Crops. Available online: https://ec.europa.eu/eurostat/databrowser/view/org_cropar/default/table?lang=en&category=agr.org (accessed on 15 September 2025).
- Eurostat. Organic Crop Production by Crops. Available online: https://ec.europa.eu/eurostat/databrowser/view/org_croppro/default/table?lang=en&category=agr.org (accessed on 15 September 2025).
- Toncea, I.; Enuţă, S.; Ioniţă Niţu, G.; Alexandrescu, D.; Toncea, V.A. Manual of Organic Agriculture (Course Support). 2013. Available online: https://agriculturadurabila.ro/sdm_downloads/manual-de-agricultura-ecologica (accessed on 14 September 2025).
- Ursu, A.; Petre, I.L. Forecasting the optimal sustainable development of the Romanian ecological agriculture. Sustainability 2022, 14, 14192. [Google Scholar] [CrossRef]
- Bioferma Niculesti. Guide of Organic Best Practices. 2024. Available online: https://bioferma-niculesti.ro/wp-content/uploads/2024/03/Ghidul-de-bune-practici-2024.pdf (accessed on 14 September 2025).
- Thøgersen, J. Sustainable food consumption in the nexus between national context and private lifestyle: A multi-level study. Food Qual. Prefer. 2017, 55, 16–25. [Google Scholar] [CrossRef]
- Roitner-Schobesberger, B.; Darnhofer, I.; Somsook, S.; Vogl, C.R. Consumer perceptions of organic foods in Bangkok, Thailand. Food Policy. 2008, 33, 112–121. [Google Scholar] [CrossRef]
- Popa, I.D.; Dabija, D.-C. Developing the Romanian organic market: A producer’s perspective. Sustainability 2019, 11, 467. [Google Scholar] [CrossRef]
- Dangi, N.; Gupta, S.K.; Narula, S.A. Consumer buying behavior and purchase intention of organic food: A conceptual framework. Manag. Environ. Qual. Int. J. 2020, 31, 1515–1530. [Google Scholar] [CrossRef]
- Jakubowska, D.; Grzywińska-Rąpca, M.; Grzybowska-Brzezińska, M. Why Do Consumers Buy Organic? Exploring Motivations and Socio-Economic Patterns. Agriculture 2025, 15, 50. [Google Scholar] [CrossRef]
- Pícha, K.; Navrátil, J. The factors of Lifestyle of Health and Sustainability influencing pro-environmental buying behaviour. J. Clean. Prod. 2019, 234, 233–241. [Google Scholar] [CrossRef]
- Vapa-Tankosić, J.; Ignjatijević, S.; Kiurski, J.; Milenković, J.; Milojević, I. Analysis of Consumers’ Willingness to Pay for Organic and Local Honey in Serbia. Sustainability 2020, 12, 4686. [Google Scholar] [CrossRef]
- Fogarassy, C.; Nagy-Pércsi, K.; Ajibade, S.; Gyuricza, C.; Ymeri, P. Relations between Circular Economic “Principles” and Organic Food Purchasing Behavior in Hungary. Agronomy 2020, 10, 616. [Google Scholar] [CrossRef]
- Torjusen, H.; Lieblein, G.; Wandel, M.; Francis, C.A. Food system orientation and quality perception among consumers and producers of organic food in Hedmark County, Norway. Food Qual. Prefer. 2001, 12, 207–222. [Google Scholar] [CrossRef]
- Radulescu, V.; Cetina, I.; Cruceru, A.F.; Goldbach, D. Consumers’ attitude and intention towards organic fruits and vegetables: Empirical study on Romanian consumers. Sustainability 2021, 13, 9440. [Google Scholar] [CrossRef]
- Nguyen, H.V.; Nguyen, N.; Nguyen, B.K.; Lobo, A.; Vu, P.A. Organic food purchases in an emerging market: The influence of consumers’ personal factors and green marketing practices of food stores. Int. J. Environ. Res. Public Health 2019, 16, 1037. [Google Scholar] [CrossRef] [PubMed]
- Zanoli, R.; Naspetti, S. Consumer motivations in the purchase of organic food: A means-end approach. Br. Food J. 2002, 104, 643–653. [Google Scholar] [CrossRef]
- Padel, S.; Foster, C. Exploring the gap between attitudes and behaviour: Understanding why consumers buy or do not buy organic food. Br. Food J. 2005, 107, 606–625. [Google Scholar] [CrossRef]
- Hilverda, F.; Jurgens, M.; Kuttschreuter, M. Word associations with “organic”: What do consumers think of? Br. Food J. 2016, 118, 2931–2948. [Google Scholar] [CrossRef]
- Balcioglu, Y.S.; Altindağ, E. Social media sentiment analysis: Understanding consumer perceptions of organic food. Food Hum. 2025, 5, 100732. [Google Scholar] [CrossRef]
- Sirieix, L.; Delanchy, M.; Remaud, H.; Zepeda, L.; Gurviez, P. Consumers’ perceptions of individual and combined sustainable food labels: A UK pilot investigation. Int. J. Consum. Stud. 2012, 37, 143–151. [Google Scholar] [CrossRef]
- D’Amico, M.; Di Vita, G.; Monaco, L. Exploring environmental consciousness and consumer preferences for organic wines without sulfites. J. Clean. Prod. 2016, 120, 64–71. [Google Scholar] [CrossRef]
- Chiciudean, G.O.; Harun, R.; Ilea, M.; Chiciudean, D.I.; Arion, F.H.; Elias, G.; Muresan, I.C. Organic Food Consumers and Purchase Intention: A Case Study in Romania. Agronomy 2019, 9, 145. [Google Scholar] [CrossRef]
- Janssen, M.; Hamm, U. Product labelling in the market for organic food: Consumer preferences and willingness-to-pay for different organic certification logos. Food Qual. Prefer. 2012, 25, 9–22. [Google Scholar] [CrossRef]
- Park-Poaps, H.; Han, T.-I. The Roles of Perceived Threat, Organic Trust, and Consumer Effectiveness in Organic Consumption Across Different Organic Products. Sustainability 2025, 17, 2821. [Google Scholar] [CrossRef]
Disclaimer/Publisher’s Note: The statements, opinions and data contained in all publications are solely those of the individual author(s) and contributor(s) and not of MDPI and/or the editor(s). MDPI and/or the editor(s) disclaim responsibility for any injury to people or property resulting from any ideas, methods, instructions or products referred to in the content. |
© 2025 by the authors. Licensee MDPI, Basel, Switzerland. This article is an open access article distributed under the terms and conditions of the Creative Commons Attribution (CC BY) license (https://creativecommons.org/licenses/by/4.0/).