Abstract
Indoor air quality (IAQ) and thermal comfort influence the health and cognitive performance of school occupants. This study investigated carbon dioxide (CO2), nitrogen dioxide (NO2), thermal comfort, and ventilation rates (VRs) in eight naturally ventilated (NV) primary school classrooms in Ireland during October 2024, combining environmental monitoring with teacher surveys. Mean CO2 concentrations ranged from 796 ppm to 2469 ppm, exceeding national guidelines in seven of the eight classrooms. NO2 levels ranged from 3.4 µg/m3 to 7.2 µg/m3, with indoor/outdoor ratios increasing with VRs and influenced by window orientation and road proximity. Indoor temperatures remained within recommended limits, while relative humidity ranged from 53% to 78% mirroring CO2 trends and exceeding guideline levels in classrooms with lower VRs and temperatures. Occupied VRs ranged from 1.2 L/p/s to 4.1 L/p/s with window opening behaviours, reliant on teachers’ perceptions of thermal comfort, accounting for 84% to 96% of VRs. Ventilation in NV classrooms is often insufficient, yet increasing VRs can compromise thermal comfort and increase ingress of outdoor pollutants and noise. The findings highlight the ineffectiveness of current school ventilation standards, which rely heavily on user operation. Integrating occupant-led strategies, including scheduled purging, awareness campaigns, and pre-emptive air quality alerting, into policy offers practical, immediate pathways to improving IAQ, fostering healthy, sustainable learning environments.
1. Introduction
Providing adequate indoor air quality (IAQ) in schools is critical for protecting the health [1,2] and cognitive performance [3,4] of children, a population particularly vulnerable to air pollutants due to their developing lungs and higher respiratory rates [5]. IAQ is primarily influenced by ventilation rates (VRs), which are essential for diluting indoor pollutants, reducing airborne virus transmission, and ensuring occupant health, comfort and performance [6,7,8]. Schools in mild temperate climates commonly rely on natural ventilation (NV) due to its simplicity, cost-effectiveness, and alignment with design guidelines [9,10,11,12]. VRs in NV classrooms depend on occupant behaviour, building design, and outdoor conditions, making IAQ highly variable [12,13,14]. This variability is especially significant when schools are located near outdoor air pollution sources, where infiltration of air pollutants can pose additional health risks [7]. While carbon dioxide (CO2) is commonly used as an indicator of ventilation adequacy and the cautious assessment of IAQ, its interplay with thermal conditions and outdoor pollutant infiltration is complex and impacted by local conditions [6,7,15].
CO2 concentrations above 1000 parts per million (ppm) indicate inadequate ventilation [7]. The current European standard (EN 16798-1:2019) [16] sets the Category I limit for indoor CO2 at 1000 ppm (assuming an outdoor level of 450 ppm) [16]. The Health and Safety Authority (HSA) of Ireland [17] defines 1000 ppm and 1400 ppm as action thresholds for indoor CO2, serving as key benchmarks for assessing ventilation adequacy in Irish classrooms. National school design guidelines require that window systems must provide VRs capable of delivering 8 litres per person per second (L/p/s), which typically maintains classroom CO2 concentrations below 1000 ppm at design occupancy levels [9,11]. Internationally, a universal standard for IAQ does not exist [18]. Many international guidelines refer to the 1000 ppm threshold; the United Kingdom (UK) Building Bulletin (BB)101 school guidelines set a higher mean CO2 limit of 1500 ppm for NV classrooms [18]. Although published data on IAQ in Irish schools remains limited [19], international evidence suggests that NV schools frequently experience significant IAQ challenges. A systematic review involving 2444 NV classrooms across 1264 primary schools in mild climates revealed a median CO2 concentration of 1487 ppm, with 81% of classrooms exceeding the 1000 ppm threshold [18].
CO2 levels in NV schools have been linked to a range of indoor pollutants, including particulate matter, volatile organic compounds, bioeffluents, microbial agents, bacteria, and fungi, all of which can negatively affect occupant health [18,20]. Elevated CO2 concentrations have been associated with increases in health symptoms such as fatigue and headaches (odds ratio: 1.1) [21], with each 100 ppm increase associated with a 5% rise in the incidence of dry cough and rhinitis [22]. In Scottish schools, Gaihre et al. [23] reported a 0.2% improvement in annual student attendance for every 100 ppm reduction in CO2, while Shendell et al. [24] found that a 1000 ppm increase corresponded to a 0.5–0.9% decline in attendance in U.S. schools. Wargocki et al. [4] synthesised evidence linking CO2 levels to academic performance, concluding that reducing concentrations from 2300 ppm to 900 ppm could improve test scores by approximately 5%.
While increased VRs can reduce indoor CO2 and associated pollutants, they may also raise exposure to outdoor contaminants [18,25]. CO2 is a limited proxy for outdoor pollutant ingress, particularly from traffic and industrial sources, for which nitrogen dioxide (NO2) serves as a more reliable indicator [7,26]. NO2 is primarily produced by fossil fuel combustion in transport, power generation, and industry [27]. Ireland’s ambient air quality standards, based on the Clean Air For Europe (CAFE) Directive (2008/50/EC), align with World Health Organisation (WHO) guidelines that set an annual average limit of 40 μg/m3 [28,29]; however, no specific regulatory limits exist for indoor NO2. In schools, NO2 exposure has been associated with eye and throat irritation, fatigue [30], and exacerbation of asthma symptoms in children at concentrations as low as 19 micrograms per cubic metre (μg/m3) [31].
VRs in NV spaces exhibit high variability, with occupant behaviours (window and door opening) reported to account for 63 to 87% of total VRs [32,33]. No consistent CO2 threshold has been identified as a trigger for window operation; instead, indoor temperature, relative humidity (RH), draft sensation and external noise play a more significant role in influencing ventilation behaviour [11,34,35,36,37]. Studies have consistently reported higher CO2 levels during the heating season, with VRs showing strong correlations with both indoor and outdoor temperatures [18]. In UK schools, Korsavi et al. [38] reported a 66% reduction in window opening area during the heating season compared to non-heating periods. Similarly, Santamouris et al. [11] observed that higher outdoor temperatures increase the likelihood of window opening, resulting in higher VRs.
EN 16798-1:2019 recommends an operative temperature range of 20 degrees Celsius (°C) to 24 °C for classrooms, extendable by ±2 °C [16]. In Ireland, the HSA mandates that workplaces involving limited physical activity must reach a minimum indoor temperature of 16 °C within the first hour of occupancy [17]. National school design guidelines (TGD-020) further specify that classroom temperatures should not exceed 25 °C for more than 5% of the school year [9]. For RH, the HSA advises a range of 40% to 70% to ensure comfort and reduce health risks, with the 70% upper limit also reflected in school guidelines to mitigate mould growth [9,17].
Elevated temperatures (≥25 °C) have been linked to lower arousal, increased distraction, and reduced cognitive performance, whereas cold conditions can have negative effects on manual dexterity [39]. Lowering indoor temperatures from 25 °C to 20 °C has been shown to improve task performance by 4% to 5%, with optimal performance typically observed below 22 °C in temperate climates [40]. Jiang et al. [41] found that learning performance peaked when students reported feeling slightly cool, approximately 1 °C below thermal neutrality. Notably, thermal neutrality differs between children and adults. Primary school children have a 15% to 20% higher metabolic rate due to increased activity levels, and they tend to prefer classroom temperatures 2 °C to 3 °C lower than those favoured by adults [40,42].
Maintaining adequate VRs is essential not only for IAQ but also for regulating classroom temperature and RH, both of which significantly affect thermal comfort, well-being and performance in NV classrooms [43,44,45]. However, excessive VRs through open windows and doors can lead to draft sensation and unwanted cooling effects, especially problematic during colder months [46]. These thermal discomforts can prompt occupants to close windows, reducing VRs and exacerbating indoor pollutant accumulation [47].
Improved VRs in existing NV classrooms can be achieved through design enhancements and behavioural interventions. Cross-ventilation can accelerate air exchange, reducing CO2 concentrations up to three times faster than single-sided ventilation [48]. Vasella et al. [49] found that promoting ventilation awareness lowered median CO2 levels from 1600 ppm to 1097 ppm and increased the proportion of teaching time with CO2 below 1400 ppm from 40% to 70% in 100 NV classrooms. Wargocki and Da Silva [50] reported that CO2 monitors with alerts led to more frequent window opening, maintaining average CO2 levels at or below 1000 ppm. Avella et al. [51] observed CO2 reductions of up to 42% in classrooms equipped with low-cost alerting systems. Similarly, Geelan et al. [52] recorded a 24% drop in the duration CO2 exceeded 1000 ppm, concluding that such alerting systems are effective and affordable solutions, especially in settings where ventilation upgrades are not feasible. In addition, Griffiths and Eftekhari [12] demonstrated that a ventilation strategy involving a 10-min purge could lower CO2 by approximately 1000 ppm without compromising thermal comfort, although two daily purges were required to sustain adequate average levels in their study involving UK classrooms.
VRs in NV classrooms are often inadequate [11,18]; however, increasing VRs can compromise thermal comfort [12] and introduce external pollutants [27] and street noise [53]. Therefore, the design of ventilation enhancement strategies must strike a careful balance between IAQ, thermal comfort, and the risks associated with outdoor pollutant and noise ingress [54].
This study evaluates IAQ (CO2 and NO2), thermal comfort (temperature and RH), and ventilation parameters in a sample of NV primary school classrooms in Ireland, using objective environmental measurements and teacher survey responses collected during a field campaign in October 2024. It aims to (i) assess compliance with relevant national and international standards, (ii) explore relationships between environmental parameters and classroom characteristics, and (iii) examine the alignment between measured IAQ data and teacher perceptions. The findings aim to inform the development of targeted, evidence-based ventilation strategies that specifically support Irish conditions for improving IAQ in NV classrooms.
2. Methodology
2.1. Sample Selection
A sample of four Irish primary schools were invited to participate in this study through the Environmental Protection Agency of Ireland (EPA) Clean Air Together (CAT) citizen science project in collaboration with Limerick City and County Council [55]. Sampling was conducted across the schools (A to D), which were anonymised, with two classrooms selected per school. Within each school, classroom selection was undertaken collaboratively by the primary researcher and school representatives. In schools with multiple buildings, classrooms were chosen from different buildings to capture a broader range of characteristics. Distance to the nearest main road (one classroom near, one further away) was also considered to assess the potential influence of classroom proximity to local traffic-related pollution. The characteristics of each classroom are provided in Table 1 and include: the year the room was built, its distance from the nearest roads, ventilation provisions, window orientations, floor area, room height, and occupancy details.

Table 1.
Summary of Building, Ventilation, and Occupancy Characteristics of Monitored Classrooms.
The school buildings varied in age, enhancing the samples’ representativeness of the Irish national primary school building stock. All classrooms relied on NV, with a variety of window configurations, including single-sided and two-sided layouts, with differing window orientations. Classrooms were heated via wall-mounted radiators supplied with hot water from centralised oil or gas-fired boilers. Heating controls ranged from individual room temperature control via wall-mounted thermostats in School A to no individual room control in Schools B, C, and D. The participating schools also reflected a diversity of socio-economic and geographic contexts within Limerick city and its surrounding suburbs. Weather data (wind speed and outside temperature) were obtained from the nearest meteorological station at Shannon Airport, located an average of 20 kilometres (km) from the four schools.
2.2. Data Acquisition
The four-week NO2 sampling campaign aligned with the EPA CAT project, between the 2 and 25 October 2024. Preliminary site visits were conducted at each school to review the experimental design, complete consent forms, collect building-related data, agree NO2 sampling locations, and deliver the NO2 diffusion tubes.
Follow-up visits occurred at the end of week three to install CO2 sensors for the final week of the campaign, and equipment was removed at the end of week 4. Further data was gathered on these visits, including sampling of external CO2 levels and a field assessment of classroom characteristics. During the monitoring period, it was determined that Classroom A1 was unoccupied on Day 3 due to teacher absence, and therefore, data for this day were excluded from the statistical analysis. Consequently, a total of 2530 measurements, recorded at 5-min intervals across the eight classrooms over 39 school days, were retained for formal analysis.
In addition to the measured air quality data, teachers from each classroom completed a seven-question online anonymous survey (see Supplementary Materials, S.M.) to provide feedback relating to perceived IAQ and thermal satisfaction in the respective classroom. Student numbers and ages were anonymously obtained from the teachers based on enrolment figures during the sampling period.
2.2.1. CO2 & Hygrothermal Monitoring
CO2, temperature, and RH were measured using Aranet4 (SAF Tehnika, Riga, Latvia) [56] sensors, strategically positioned at a height of 1.5 metres (m) centrally on an internal wall at least 2 m from occupant breathing zones. This positioning was chosen based on best practice, e.g., Zhang et al. [57], aligning with the EN ISO 16000-26 standard for indoor CO2 sampling [58]. Outdoor CO2 measurements were also taken on the school grounds at a height of 1.5 m.
CO2 levels were recorded at 5-min intervals using Non-Dispersive Infra-Red (NDIR) technology, providing good levels of accuracy and precision (±30 ppm plus 3% of reading), as per the manufacturer’s statements [56] and meeting pre-deployment calibration guidelines [59]. In addition, temperature and RH data were measured at the same 5-min intervals using these sensors, which operate within reasonable accuracy ranges for these parameters [56]. The data was stored in the internal memory of the device and exported via Bluetooth at the end of the campaign.
A post-monitoring co-location exercise was conducted over a 3-day period to observe any drift or errors in CO2 measurement. Table 2 presents each sensor’s mean absolute error (MAE) relative to the overall group average, as well as the number of measurements (n = 93) exceeding the sensor’s stated accuracy range out of the total sample count (n = 3294). A correlation matrix was generated from the sensor readings, including regression plots, R-values, and MAE between sensor pairs. The R-values were consistently high, averaging 0.997 (range 0.995 to 0.998), with MAE values between sensor pairs averaging 16 ppm (range 9 ppm to 38 ppm).
Table 2.
Co-location Analysis of CO2 Sensors: Mean Absolute Error Relative to Group Average and Frequency of Measurements Outside Manufacturer-Specified Accuracy (n = 3294).
Similar to findings by previous studies adopting CO2 sensors for air quality monitoring (e.g., Villanueva et al. [60]), only 2.8% of measurements (93 of 3924 data points) fell outside the manufacturer’s stated accuracy range (±30 ppm + 3% of reading), the majority for one sensor (A2), with five of the eight sensors recording all measurement values within this threshold.
2.2.2. NO2 Monitoring
NO2 concentrations were measured using passive diffusion tubes supplied by Gradko International [61], with the results analysed by their accredited laboratory. This method carries an associated uncertainty of ±25% [62]. One diffusion tube was mounted outdoors at a height of approximately 2 m above the ground in an area with unrestricted air circulation, following best practice guidelines [62,63]. Two diffusion tubes were positioned indoors, centrally located on an internal wall of each designated classroom, at a similar height of 2 m. All classrooms were verified to be free of potential contaminants, including fuel-burning appliances, photocopiers, and air fresheners.
2.2.3. Participant Surveys
A seven-question online survey was administered to teachers in each classroom to capture their level of satisfaction with temperature, RH, and air quality in comparison to the monitored conditions. The survey also gathered information on window opening operations, including influencing factors, frequency and responsibility.
2.3. Data Cleaning
Before statistical analysis, the data underwent a rigorous manual cleaning and quality control process to ensure the reliability of findings. The following systematic approach was adopted: (i) sensor recordings were analysed to verify the stated occupancy periods of the school day; (ii) teachers were consulted to confirm whether the classroom was fully occupied, partially occupied, or empty, during periods when CO2 trends suggested deviations occurred; (iii) data screening to identify outliers, defined as CO2 increases exceeding 500 ppm compared to the preceding and subsequent values, due to localised exhalations close to sensors [64]; and (iv) data screening for erroneous readings due to sensor malfunction, defined as CO2 values below 400 ppm.
2.4. Statistical Analysis
The data analysis incorporated a hierarchical structure with multiple temporal resolutions, including continuous classroom-specific characteristics at 5-min (n = 2530), daily (n = 39), and weekly (n = 8) intervals.
2.4.1. Descriptive
The data was analysed for each classroom to determine the daily and weekly mean, maximum, and minimum values using the 5-min interval readings collected during the occupied period. Daily CO2 build-up and decay rates were calculated, along with occupied and unoccupied VRs for each classroom. To fully characterise the continuous CO2 data, the standard deviation (St. Dev.), and interquartile range (IQR) were also reported. Indoor–Outdoor (I/O) NO2 ratios were calculated to account for variations in ambient concentrations at each school site, enabling a standardised comparison of infiltration levels across classrooms [65].
2.4.2. Inferential and Statistical Analysis
Given the potential for misleading results when applying multilevel analysis to non-interval scale variables [66], separate databases were created for daily and weekly parameters. These databases were used for the inferential analysis to examine the determinants and relationships between CO2, NO2, temperature, RH, VRs, classroom characteristics, and occupancy factors.
A series of correlation matrices (see S.M.) were generated using Microsoft Excel (Microsoft Corporation, 2022) to examine the relationships between measured, observed, reported, and calculated parameters for each temporal resolution. Spearman’s rank correlation coefficient (ρ) was used to evaluate monotonic associations between variables, due to the non-normal distribution that typically occurs for CO2 distribution in classroom settings [67]. Correlations with |ρ| ≥ 0.5 were considered moderate to strong, based on established guidelines [68], and were further tested for statistical significance (p < 0.05).
2.5. Calculation of Ventilation Rates
2.5.1. Occupied Period Ventilation Rates
The daily average occupied period VRs (VRocc), in litres per second (L/s), were determined for each classroom using CO2 measurements and occupant-averaged individual CO2 generation rates, following the method developed by Finneran and Burridge [69]. This approach enables reliable estimation of VRocc, expressed in L/p/s, using Equation (1):
where
- ;
- Tocc = Total occupied time;
- T1 = End time;
- T0 = Start time;
- = Occupant averaged individual CO2 generation rate;
- Cx = measured mean excess CO2.
Occupant-averaged CO2 generation rates were calculated based on the number and age of occupants in each classroom, using age-specific emission values from Batterman [70], developed in accordance with the Standard Guide for Using Indoor CO2 Concentrations to Evaluate IAQ and VRs [71]. The corresponding CO2 generation rates from Batterman’s [70] table were applied to each class group and weighted according to age and occupancy counts to obtain a classroom average. Teachers were assigned a metabolic equivalent of task (MET) level of 1.7 MET, and pupils 1.4 MET, reflecting light physical activity and post-exercise recovery periods typical in primary classrooms [70]. Batterman’s values are consistent with estimates from several comparable studies, as highlighted in a UK-based investigation by Korsavi [66], reinforcing their suitability for estimating VRs in primary school environments. Mean excess CO2 levels (Cx) were obtained by subtracting external CO2 concentrations from internal CO2 measurements in ppm. Following the approach used by Korsavi et al. [72], the CO2 concentration (Cx) in ppm was converted to grams per litre (g/L) using Equation (2):
where
- W = Density of CO2 levels (kg/m3);
- MW = Molecular weight;
- t = Temperature.
The total supply air flow rate during the occupied period was calculated by multiplying the occupant-specific supply air flow rate (VRocc, Equation (1)) by the number of occupants in each classroom (Table 1).
2.5.2. Unoccupied Period Ventilation Rate
The unoccupied period air exchange rate (AER) was determined for each classroom using the concentration-decay method, with metabolic CO2 as a tracer gas [70]. The decay period was selected based on a visual inspection of the CO2 decay curve. The time interval for decay was chosen to align with the period displaying exponential behaviour (Figure 1), typically starting at the end of the school day (when occupants leave the classroom) and ending when indoor and outdoor CO2 concentrations nearly equalise or when the classroom is reoccupied, whichever occurs first. The AER was determined using Equation (3) [70].
where
- T = Decay period (in seconds);
- C0 = CO2 inside initial;
- CR0 = CO2 outside initial;
- C1 = CO2 inside final;
- CR1 = CO2 outside final.
The unoccupied period VR (VRun) in L/s was obtained by multiplying the AER (Equation (1)) by the room volume (V) in m3 as shown in Equation (4):

Figure 1.
Profile of CO2 Concentration in the eight classrooms during the campaign (amber and red dashed lines indicate 1000 ppm and 1400 ppm action thresholds set by Health & Safety Authority [17].
2.5.3. Estimation of User-Influenced Ventilation Rates
To estimate the user-influenced VRs (VRUI), a comparative method adapted from Kvisgaard et al. [32] was employed. As direct measurement of ventilation induced by user actions (e.g., window and door opening) was not feasible, VRUI was calculated as the difference between the weekly average VR during the occupied period and the unoccupied period. This approach assumes that VRun represents the baseline air exchange attributable to background ventilation and infiltration, where windows and doors remained closed, while VRocc reflect the combined influence of both baseline and user-influenced VRs. The proportion of VRUI was then derived and expressed as a percentage of total occupied ventilation using Equation (5):
3. Results
3.1. CO2 Levels
3.1.1. CO2 Concentration Profiles in Classrooms
Figure 1 presents time series plots of CO2 concentration profiles observed in each classroom. CO2 levels fluctuated throughout the day, with classrooms exhibiting broadly similar build-up and decay profiles. CO2 levels increased rapidly during occupied periods, decreased during breaks, and gradually declined toward ambient levels overnight. The slow CO2 decay rates observed during unoccupied periods are due to the reduction in VRs when windows and doors are closed. In some classrooms (e.g., D2), after-school activities resulted in additional late-day CO2 peaks (e.g., 1443 ppm at 15:42), further extending the decay period.
3.1.2. Descriptive Statistics & Compliance with HSA Guidelines
A summary of CO2 levels during the five-day occupied period is presented in Table 3. The mean CO2 concentration across the eight classrooms during occupied hours was 1632 ppm, ranging from 796 ppm (C1) to 2469 ppm (B1). Table S1 in S.M. provides the daily range of CO2 values for each classroom.
Table 3.
Summary of weekly CO2 concentrations (ppm) in each classroom during occupied periods.
Mean CO2 levels exceeded the HSA guideline of 1000 ppm in all but one classroom (C1) during periods of full occupancy. On average, CO2 levels surpassed the 1000 ppm and 1400 ppm action thresholds 72% and 52% of the time, respectively. These exceedances varied from 18% and 0% in C1 to 89% and 81% in B2.
Peak CO2 concentrations across classrooms ranged from 1401 ppm to 5414 ppm. The highest concentration was recorded in Classroom B1 shortly before the lunch break on Day 3. In this classroom, CO2 levels exceeded the upper HSA action [17] threshold for 81% of the occupied period. Notably, CO2 concentrations surpassed 3000 ppm for 34% of the occupied time, a level exceeded only in two other classrooms, B2 (5%) and D2 (3%).
3.1.3. CO2 Build-Up Rates
Table S2 in S.M. presents daily CO2 build-up times from the start of class, along with CO2 accumulation gradients, intercepts, and R2 values for each classroom. CO2 build-up rates varied in response to VRs and occupancy levels. A moderate correlation was observed between CO2 build-up time and VRs (ρ = 0.68, p < 0.001), while a strong correlation was found between the rate of change of CO2 build-up and occupancy-related CO2 generation rates (ρ = 0.76, p = 0.028).
Classroom C1 showed the greatest variability in CO2 build-up times, exceeding 1000 ppm on four of the five days. On days when this threshold was exceeded, the time to reach 1000 ppm ranged from 55 min to 260 min on the coldest (22 October) and warmest (24 October) days of the sampling period, respectively. In contrast, classrooms A1 and B1 consistently exceeded 1000 ppm within 30–40 min and 5 min, respectively, on the days of full occupancy. Across all classrooms, the time to reach 1000 ppm showed strong negative correlations with mean daily CO2 concentrations (ρ = −0.81, p < 0.001), maximum daily CO2 levels (ρ = −0.84, p < 0.001), and the percentage of occupied period time that CO2 concentrations remained above the 1000 ppm (ρ = −0.78, p < 0.001) and 1400 ppm (ρ = −0.77, p < 0.001) thresholds.
3.1.4. CO2 Decay Rates
Unoccupied period (end-of-day) CO2 decay rates were much slower than occupied period build-up and decay rates. End-of-day decay rates exhibited a moderate correlation with average CO2 levels (ρ = 0.54, p < 0.001) and the percentage of occupied period time that CO2 concentrations remained above the 1400 ppm threshold (ρ = 0.60, p < 0.001) across all classrooms. Table S3 in S.M. presents daily CO2 decay times from the end of the scheduled class time for each classroom. Where CO2 levels exceeded 1000 ppm at the end of scheduled class time, the time required for concentrations to return to 1000 ppm ranged from 1672 min (B1) to 5 min (A1 and C1), with a median decay time of 90.5 min across all classrooms.
Classroom C1 recorded the lowest CO2 levels and fastest decay times, returning to 1000 ppm in an average of 10 min on the three days when CO2 levels exceeded 1000 ppm at the end of the occupied period, while in Classroom B1, CO2 concentrations remained above 1000 ppm overnight following the day on which the highest occupied-period CO2 levels were recorded.
Over the weekend, CO2 levels in all classrooms approached ambient concentrations (approximately 430 ppm). However, mid-week measurements often showed incomplete overnight decay, as illustrated in the time series plots in Figure 1.
3.2. Determinants of Classroom CO2 Levels
3.2.1. Ventilation Rates
Table 4 presents the mean daily VRs for each classroom during both occupied and unoccupied periods. VRocc across classrooms ranged from 15.1 L/s in Classroom B1 to 153.4 L/s in Classroom C1. When averaged over the week, VRocc ranged from 27.9 L/s (B1) to 102.8 L/s (C1). The daily VRs for each day of the sampling period are presented in Table S4 in S.M. During the occupied period, the per-person VRs ranged from 0.6 L/p/s in Classroom B1 (Day 3) to 6.1 L/p/s in Classroom C1 (Day 4). Weekly average per-person VRs were highest in Classroom C1 at 4.1 L/p/s (range: 3.0–6.1 L/p/s) and lowest in Classroom B1 at 1.2 L/p/s (range: 0.6–2.2 L/p/s).
Table 4.
Average, maximum, and minimum ventilation rates (L/s) during occupied and unoccupied periods, along with the average per-person ventilation rates and the proportion of ventilation attributable to user-influenced actions for each classroom.
The daily VRocc showed no correlation with VRun, but exhibited a very strong correlation with overall 24 h ventilation rates (ρ = 0.91, p < 0.001). VRun ranged from 0.8 L/s in classroom B2 to 12.8 L/s in classroom A2, with weekly averages ranging from 3.3 L/s (Classroom A1) to 9.8 L/s (Classroom A2).
A strong negative correlation was found between mean daily VRocc and mean CO2 concentrations (ρ = −0.88, p < 0.001). A very strong negative correlation was found between the weekly means of per-person VRs and CO2 levels (ρ = −0.93, p < 0.001). VRocc also showed a strong positive correlation with daily CO2 build-up times (ρ = 0.68, p < 0.001).
Weather conditions did not strongly influence VRs during the measurement period. VRocc did not correlate with the I/O temperature ratio and showed only a weak correlation with daily wind speed (ρ = 0.33, p = 0.04).
3.2.2. User-Influenced Ventilation Rates
Table 4 presents the weekly mean percentage VRui for each classroom. VRui accounted for an average of 89% of classroom VRs, ranging from 84% in classroom A2 to 96% in classroom C1. VRui exhibited strong negative correlations with classroom volume (ρ = −0.82, p = 0.01) and the weekly average rate of CO2 build-up for each classroom (ρ = −0.7, p = 0.05). Additionally, a statistically significant positive correlation was observed between VRui and teacher-reported draft sensation (ρ = 0.72, p = 0.04).
3.2.3. Occupancy Generation Rates & Class Duration
Total occupancy CO2 generation rates for each classroom correlated moderately with mean daily CO2 levels (ρ = 0.51, p = 0.001). The duration of the school day varied across schools. All classes began at 09:00, both infant class groups A1 & C1 finished at 13:40, and the other class groups finished between 14:30 and 14:45. The duration of the school day presented strong correlations with mean weekly CO2 levels across all classrooms (ρ = 0.71, p = 0.05) and the percentage of time that CO2 exceeded the HSA guideline thresholds of 1000 ppm (ρ = 0.76, p < 0.028) and 1400 ppm (ρ = 0.67, p = 0.046).
3.2.4. Self-Reported Window Opening
Teachers were asked to report the approximate duration that windows remained open during the occupied period on a five-point scale of never (0%) to always (100%). Classroom B2 reported the lowest duration of window open time (approximately 25%), which aligns with the resulting highest value across all classrooms for duration of time CO2 spent above 1000 ppm. Classroom C1, which recorded the lowest mean CO2 levels, had windows open for 100% of the occupied period. Teachers were responsible for window opening behaviours in all classrooms, with pupils allowed to perform window opening operations in three of the classrooms B1, D1 & D2. The reported percentage of window open duration of the school day presented a strong correlation with mean weekly VRs (ρ = 0.70, p = 0.05) and the percentage of time that CO2 remained below 1000 ppm (ρ = 0.68, p = 0.066).
3.3. Thermal Comfort Parameters
3.3.1. Temperature
Table 5 presents classroom temperatures recorded during the week-long sampling period 18 to 25 October 2024. Mean occupied period temperatures ranged from 17.6 °C in Classroom B2 to 21.4 °C in Classroom C2, remaining within regulatory and comfort guideline thresholds. Overall temperature values ranged from 15.1 °C (B2) to 22.8 °C (C2) during the occupied period. Temperature variation between classrooms within the same school averaged 1.2 °C, with differences ranging from 0.2 °C in School A to 2.8 °C in School C. The larger variation observed in School C corresponded with differences in OD, VRs, CO2 and temperature levels. Classroom C1 had a 28% lower OD, 101% higher VRs, 48% lower CO2 levels, and 13% lower temperatures than C2.
Table 5.
Mean, maximum, and minimum temperature and relative humidity during occupied periods, along with the percentage of time these values fell outside the national guideline thresholds.
While not in breach of the HSA guidelines, the temperature in Classroom B2 fell below 16 °C for 15 to 20 min at the start of classes on the three coldest days. Outdoor temperatures during the week, ranged from 10.3 °C on Tuesday, 22 October, to 16.9 °C on Thursday, 24 October. All classrooms recorded their lowest pre-class temperatures on Monday, 21 October, (the second coldest day), due to heating inactivity over the preceding weekend.
Mean daily classroom temperatures moderately correlated with the I/O temperature differential (ρ = 0.49, p = 0.002), and weakly correlated with CO2 build-up gradients (ρ = 0.31, p = 0.05) and CO2 decay times (ρ = 0.32, p = 0.05). Mean occupied temperatures correlated strongly with class duration (ρ = 0.73, p = 0.039), and presented a moderate negative correlation with occupancy density (OD) measured in m3 per person (ρ = −0.6, p = 0.12).
3.3.2. Relative Humidity
Table 5 presents a summary of the weekly classroom RH levels during the occupied period. Across all classrooms, RH averaged 67%, ranging from 53% in classroom C1 to 78% in classrooms B1, B2, and D1. The mean RH across all classrooms exceeded the EN 16798 standard’s upper threshold, and two of the eight classrooms surpassed the HSA’s 70% guideline [17]. In classroom B1, RH exceeded the 70% threshold for 98% of the occupied period.
Mean daily RH values showed moderate negative correlations with occupied-period VRs (ρ = −0.48, p = 0.002) and the I/O temperature difference (ρ = −0.56, p < 0.001). RH also had moderate correlations with maximum daily occupied CO2 levels (ρ = 0.45, p = 0.004), external temperature (ρ = 0.46, p = 0.003), and wind speed (ρ = 0.51, p < 0.001).
Mean weekly RH values exhibited strong negative correlations with VRs (ρ = −0.86, p = 0.007), the percentage of time CO2 levels were below 1000 ppm (ρ = −0.90, p = 0.002), and the percentage of time windows were reported open (ρ = −0.80, p = 0.017).
3.4. Nitrogen Dioxide (NO2) Levels
Table 6 presents the indoor and outdoor NO2 concentrations recorded at each school. The average outdoor NO2 levels ranged from 7.1 µg/m3 at School A to 13.6 µg/m3 at School D. Indoor NO2 concentrations ranged from 3.4 µg/m3 (D2) to 7.2 µg/m3 (C1). I/O ratios are presented to mitigate the confounding influence of ambient NO2 variability, allowing a more meaningful comparison of NO2 infiltration across each classroom.
Table 6.
Outdoor and Indoor NO2 levels, I/O ratios, distance (m) and orientation to the nearest main road.
In three of the four schools, classrooms located further from the road had lower I/O ratios. The average I/O ratio across the classrooms was 0.48, with the lowest in D2 (0.25, 65 m from the road, windows facing north and west, opposite to the main road and prevailing wind direction) and the highest in C1 (0.72, 26 m from the road, windows facing southeast, facing the road and prevailing wind direction).
Classrooms with higher VRs exhibited higher NO2 I/O ratios. Classroom C1, which had the highest VRs and the lowest CO2 levels during both occupied and unoccupied periods, also recorded the highest NO2 I/O ratio. NO2 I/O ratios showed a positive correlation with VRs (ρ = 0.67, p = 0.07) and the percentage of time CO2 levels remained below 1000 ppm (ρ = 0.76, p = 0.03). In contrast, NO2 I/O ratios negatively correlated with mean occupied CO2 levels (ρ = −0.71, p < 0.05), mean RH (ρ = −0.79, p = 0.02), and classroom floor area (ρ = −0.69, p = 0.058).
3.5. Alignment of Teacher Perceptions with Measured Data
Table 7 presents the teacher survey responses on thermal comfort, IAQ, external noise ingress and window opening frequency. Figure 2 shows a Spearman correlation matrix illustrating statistically significant associations between measured environmental variables and teacher-reported perceptions.
Table 7.
Teacher Self-Reported Perceptions of Thermal Comfort, Air Quality, External Noise Ingress and Window Opening Frequency.
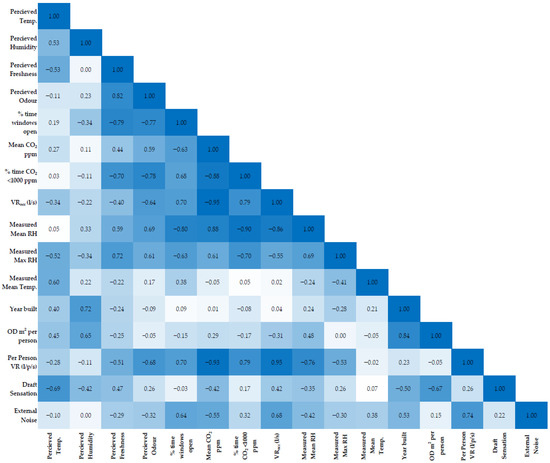
Figure 2.
Spearman Correlation Matrix of Teacher Perceptions and their Significant Correlates.
Teachers’ perceptions of temperature averaged 3.6 (median = 4) on a five-point scale (1 = too cold, 5 = too hot), ranging from 2 in classroom C1 to 5 in classroom D2. The teacher in C1, who perceived the room as cold (rating 2), kept windows open 100% of the time. This classroom had the highest VRs and lowest CO2 levels, yet the teacher reported the lowest ratings for perception of odour (1) and stuffiness (2). Conversely, in B2, the room with the lowest VR and highest percentage of time CO2 exceeded 1000 ppm, the teacher perceived the air as fresh (4), odour-free (4), and thermally neutral (3), despite limited window opening (25%).
In classroom D2, the teacher rated the temperature as too warm (5). This classroom, with north and west-facing windows, recorded the second-highest weekly average temperature (20.5 °C, range 18.3 °C to 22.3 °C) and spent 85% of the occupied period above 20 °C.
Teacher-reported temperature perceptions had a negative correlation with draft sensation (ρ = −0.69, p = 0.06). RH perceptions averaged 2.9 (1 = too dry, 5 = too humid), ranging from 2 to 4. Teachers’ perceptions of RH did not correlate with measured RH values but showed associations with occupant density per m2 (ρ = 0.65, p = 0.08) and school building age (ρ = 0.72, p = 0.04).
Perceptions of stuffiness averaged 2.6 (1 = stuffy, 5 = fresh), ranging from 1 in D2 to 4 in B2 and D1. Despite reporting the air as fresh, B2 recorded the second-highest mean CO2 levels, the highest RH levels, and the lowest mean temperature. Stuffiness perception correlated with maximum weekly RH levels (ρ = 0.72, p = 0.04) and negatively with the percentage of time CO2 was below 1000 ppm (ρ = −0.70, p = 0.05) and the reported percentage of time that windows were opened (ρ = −0.79, p = 0.02).
Teacher perceptions of odour averaged 2.6 (1 = strong odour, 5 = no odour), ranging from 1 in A2 and C1 to 4 in B2, C2, and D1. Perceived odour strongly correlated with teacher perceptions of stuffiness (ρ = 0.82, p = 0.01). It also correlated with mean weekly RH levels (ρ = 0.69, p = 0.06) and negatively with the percentage of time CO2 was below 1000 ppm (ρ = −0.78, p = 0.03), per-person VRs (ρ = −0.68, p = 0.06), and window opening times (ρ = −0.77, p = 0.03).
Draft sensation ratings averaged 2.25 (1 = no draft, 5 = excessive draft), ranging from 1 to 3. While not correlated with VRs, draft sensation showed moderate negative correlations with occupant density per m2 (ρ = −0.67, p = 0.07), perceived temperature (ρ = −0.69, p = 0.06) and a strong correlation with VRui (ρ = 0.72, p = 0.04).
Perceptions of external noise averaged 2.5 (1 = minimal, 5 = high), ranging from 1 in B1 and B2 (where windows were open 50% and 25% of the time, respectively) to 4 in D1, which was closer to a main road and had windows open 75% of the time. External noise perception correlated with reported window opening times (ρ = 0.64, p = 0.08) and per-person VRs (ρ = 0.74, p = 0.04).
4. Discussion
4.1. CO2 Concentrations and Determinants
Elevated indoor CO2 concentrations were prevalent across all classrooms, with weekly averages exceeding the 1000 ppm HSA lower action threshold [17] in all but one classroom. Moreover, exceedances of the 1400 ppm upper action threshold occurred 52% of the time these classrooms were occupied, aligning with previous research findings [18,73].
The per-person VR was the strongest predictor of indoor CO2 concentrations. VRs varied considerably across classrooms, with none achieving the Irish school design guideline minimum of 8 L/p/s [9] or the European standard of 7 L/p/s [16]. However, classroom C1 maintained a mean weekly CO2 concentration of 796 ppm with a corresponding per-person VR of 4.1 L/p/s. In this case, CO2 levels exceeded 1000 ppm for only 18% of the occupied period and never surpassed the HSA’s [17] upper threshold of 1400 ppm. The results from this classroom suggest that single-sided NV can yield adequate VRs under the monitored conditions.
Peak CO2 concentrations across classrooms further highlight the extent of the issue with inadequate VRs during occupied periods. Peak CO2 concentrations in the majority of classrooms were observed on Day 3 (22 October 2024), which coincided with the lowest recorded mean outdoor temperature (10.8 °C) during the monitoring period. Similarly, Day 3 also registered the highest mean CO2 levels in six out of seven classrooms (Classroom A1 was excluded from this observation as it was unoccupied on Day 3) and the fastest CO2 build-up rate in Classroom C1. This pattern suggests a likely reduction in ventilation behaviours, such as window opening, in response to colder outdoor conditions, an effect widely reported in previous studies [11,38].
Daily CO2 profiles closely followed occupancy patterns, characterised by sharp increases during classroom use, rapid declines during breaks, and slower decay rates after the end of the school day. The steep rises at the onset of occupancy indicate inadequate VRs, which could be addressed through pre-emptive increases in ventilation provision, potentially guided by alerting systems based on CO2 build-up rates. Notably, CO2 build-up rates correlated with mean and peak CO2 levels, %VRui, temperature, RH, and duration above guideline CO2 thresholds, further supporting their utility as real-time indicators for pre-emptive ventilation management. The rapid reductions observed during breaks demonstrate the effectiveness of short unoccupied periods in resetting indoor CO2 concentrations, a benefit that could be further enhanced through targeted purging strategies, as demonstrated by Griffiths and Eftekhari [12]. In contrast, the slow CO2 decay rates observed after school hours resulted in elevated baseline levels the following morning in some classrooms. CO2 decay dynamics were influenced by building airtightness, peak CO2 levels, and the adequacy of background ventilation provision. This issue may be addressed structurally by increasing background ventilation provision or behaviourally through the implementation of an end-of-day purge ventilation regime. Given the extended overnight period, such purging is unlikely to compromise thermal comfort due to adequate time for thermal rebalancing before occupancy resumes. Additionally, noise infiltration is not a concern when implementing purge regimes during teaching breaks or after school hours.
While OD was not directly assessed due to the use of weekly average figures, it correlated strongly with school age, with newer schools hosting larger rooms. However, no consistent association was found between school age and indoor environmental conditions, suggesting that ventilation efficacy is driven more by behavioural and operational factors than by building age. Room volume was a stronger predictor of CO2 concentration than floor area, as floor area alone does not account for the third dimension, room height, which influences the total air volume available for dilution. CO2 generation rates, accounting for occupant age and activity, moderately correlated with mean CO2 concentrations, reinforcing the need to consider contextual and temporal factors, including OD, pupil age, activity levels, and occupancy schedules when designing ventilation strategies.
Estimated VRui values emphasise the substantial influence of occupant behaviours on NV classroom VRs consistent with the findings of Iwashita and Akasaka [33]. The highest VRui was observed in Classroom C1, which also recorded the highest VRocc and lowest CO2 levels, aligning with the teacher-reported 100% window opening frequency during occupancy. While the calculation of VRui did not account for external variables such as I/O temperature differentials or wind speed, these conditions did not strongly influence VRs during the measurement period. Correlation analysis further indicates that smaller classrooms with greater occupant-driven ventilation exhibited more effective CO2 removal, albeit with an associated increase in teacher-reported draft sensation.
As with the findings of [11,34,35,38], window opening operations emerged as a key behavioural factor influencing VRs. In classrooms B1, D1, and D2, pupils were permitted to open windows, likely a function of their older age (10 to 12 years), which may influence observed ventilation patterns. The teacher reported window opening durations correlated positively with VRs and negatively with CO2 levels, further reinforcing the importance of occupant behaviour in maintaining adequate VRs. Lower self-reported window opening durations alongside elevated CO2 and RH levels coincided with lower-than-average mean temperatures in classrooms B1 and B2, suggesting that thermal discomfort may discourage occupant-driven ventilation. However, the teacher in classroom C1 appears to prioritise ventilation over thermal comfort, resulting in a classroom environment that complied with CO2, temperature, and RH recommendations.
4.2. Relationship Between Teacher Perceptions and Measured Data
Teacher perceptions of classroom temperature averaged on the warm side of thermal neutrality. However, measured temperatures were generally at the lower end of both national and EU guideline ranges. When considered alongside previous research showing that children experience optimal thermal comfort at temperatures 2 °C to 3 °C lower than those preferred by adults [40,42], and demonstrate peak cognitive performance at temperatures approximately 1 °C cooler still [41], these findings reinforce the need for the development of thermal comfort guidelines that are specifically tailored to classroom environments.
Teacher-reported perceptions of air quality and thermal comfort often diverged from objective measurements, reflecting the subjectivity of occupant feedback. Some teachers reported acceptable conditions despite high CO2 and RH levels, while others noted discomfort in objectively compliant spaces. Although these perceptions showed weak and inconsistent correlations with measured parameters, they aligned in some instances with VRs, RH, and noise levels. The teachers in classrooms B1 and B2, with the lowest VRs and highest CO2 and RH levels, reported relatively positive air quality perceptions, while the teacher in classroom C1, with the highest recorded VRs and lowest CO2 levels, reported more negative ratings. This divergence highlights the influence of personal sensitivity, expectations, and perhaps awareness of IAQ issues. In effect, teachers who are more sensitive to air stuffiness and odour may be more proactive in managing ventilation. These findings align with previous research [73], and support the need to integrate sensor data with occupant perceptions, which may encourage more responsive ventilation strategies, i.e., window opening management, particularly when thermal comfort conflicts arise.
4.3. Outdoor Pollutants and Ventilation Trade-Offs
While NO2 measurements provide valuable insight into outdoor pollutant infiltration, the uncertainty associated with passive sampling necessitates cautious interpretation of results. Additionally, factors such as local wind patterns and infiltration pathways may significantly influence NO2 levels indoors, potentially confounding the relationship with ventilation rates. The results indicate that increased VRs and lower CO2 levels were associated with greater infiltration of outdoor NO2, highlighting a potential trade-off between indoor and outdoor air quality. Classroom C1, which recorded the highest VRs, also exhibited the highest I/O NO2 ratio of 0.72, compared to a ratio of 0.40 in classroom B1, which had the lowest VRs. Additionally, classrooms located further from traffic sources and upstream of the prevailing wind direction exhibited lower I/O ratios.
Although both ambient and indoor NO2 concentrations remained well below WHO guideline thresholds [29], in areas where outdoor air pollution is a concern, balancing CO2 reduction with the exclusion of outdoor pollutants may require targeted interventions. Potential measures include scheduling ventilation during periods of lower traffic intensity, implementing local strategies such as staggered drop-offs, anti-idling policies, and installing air filtration systems [74], or adopting nature-based solutions like green barriers [18].
4.4. Effects on Thermal Comfort
Thermal comfort indicators varied between classrooms but remained within national guidelines. Classroom temperatures increased with occupancy and class duration, showing a moderate correlation with the I/O temperature differential, and a weak but statistically significant correlation with CO2 build-up gradients and decay times, affirming the inverse relationship between VRs and heat retention. Classroom C1, with the highest VRs, recorded weekly average temperatures 1.1 °C below the sample average on a week when the external temperature averaged 12.6 °C, illustrating the potential challenge of maintaining both optimal VRs and thermal comfort during colder periods in NV classrooms that are not equipped with thermostatic heating control. Nevertheless, teacher-rated thermal comfort in C1 was only slightly below neutral (2), which aligns more closely with the student preferences reported in prior studies [40,42].
RH levels exceeded EN 16798-1 guideline limits in all classrooms, with some exceeding the HSA’s and school design guidelines upper limit of 70% for most of the occupied period [16,17]. RH fluctuations mirrored CO2 patterns, as occupant respiration and perspiration are key contributors to elevated indoor RH levels [75]. Higher RH levels moderately correlated with elevated CO2 levels and lower VRs, reinforcing the association between inadequate VRs and excess indoor moisture. Confounding factors such as rising damp or moisture ingress to the building were not a factor in this sample of classrooms. These findings emphasise the importance of maintaining adequate VRs in mitigating IAQ issues associated with elevated RH levels.
4.5. Implications for Ventilation Management and Policy
This study highlights the limitations of relying on background and occupant-controlled ventilation to maintain acceptable VRs in NV classrooms. While none of the monitored classrooms achieved the school design guidelines VR capacity of 8 L/p/s [9], this does not necessarily indicate non-compliance with design standards. Rather, it highlights a gap within the standards themselves, in which ventilation performance is largely dependent on user operation, often without adequate awareness, guidance, or alerting regarding the specific ventilation needs of their classroom. The frequency and extent of CO2 and RH threshold exceedances suggest that current NV strategies are insufficient to ensure healthy classroom environments. Weak overnight decay rates emphasise the need for additional background or end-of-day purge ventilation, especially in classrooms that are used for after-school activities. The findings support the development of evidence-based ventilation enhancement measures that integrate the following behavioural, technological, architectural, and policy measures:
- Enhanced teacher training on IAQ, thermal comfort and ventilation principles with a specific focus on the physiological needs of primary school children.
- CO2 and hygrothermal monitoring and alerting systems for real-time pre-emptive ventilation management.
- Provision of adequate background ventilation.
- Implementation of ventilation protocols, including break-time and end-of-day purge ventilation, supported by schedules that take cognisance of local noise and outdoor air quality variations.
- Occupancy management to prevent sustained overcapacity.
4.6. Limitations
Sample size, measurement duration, use of average occupancy figures, and unmeasured variables like activity levels should be considered when interpreting these findings. The diversity of classrooms within the sample further complicates direct comparisons of IAQ across similar settings and conditions. Teacher perceptions and behavioural data were self-reported and susceptible to individual sensitivities and biases. It is also recognised that correlating ordinal Likert-scale perceptual data with continuous environmental measurements may affect the strength and interpretability of observed associations. The modest sample size limits generalisability, and the potential for overinterpretation in some areas cannot be discounted due to the complexity of correlating multiple environmental and behavioural parameters. Therefore, findings should be interpreted with caution and viewed as indicative rather than definitive, pending validation with larger, more diverse school samples. CO2 and NO2 do not account for the full range of indoor or outdoor pollutants that may affect classroom air quality, but are considered a proxy only for a range of other potential contaminants.
4.7. Considerations for Future Research
Future research should involve a larger and more diverse school sample, capturing a broader range of building types, locations, and socio-environmental contexts to improve generalisability. Longitudinal monitoring across heating and non-heating seasons would clarify seasonal variations in VRs, IAQ, and thermal comfort. Using psychometrically validated tools or alternative analytical approaches to align subjective perceptions with objective measurements could inform an integrated IAQ and thermal comfort standard for NV schools.
Assessments should also incorporate local wind patterns, infiltration pathways, and continuous measurement techniques to refine our understanding of NO2 dynamics, alongside the testing of targeted interventions to mitigate outdoor air pollutant ingress. Expanding pollutant monitoring to include particulate matter (PM2.5, PM10), volatile organic compounds (VOCs), and allergens would broaden the evaluation of classroom environmental health risks.
Finally, while this study did not quantify the impact of VRs on heating demand, the influence of ventilation on classroom temperatures, particularly in colder climates, warrants detailed evaluation. Future work should assess the combined effects of VR adjustments, occupancy, and building characteristics on energy use, costs, and comfort to inform balanced, sustainable ventilation strategies.
5. Conclusions and Recommendations
CO2 concentrations reveal inadequate classroom VRs during typical occupancy. Combining the data set for the eight classrooms, occupied period CO2 levels averaged 1632 ppm, exceeding the HSA 1000 ppm and 1400 ppm action thresholds 73% and 52% of the time, respectively. CO2 levels were strongly correlated with VRs, which in turn were closely linked to self-reported window opening durations. In the classroom (C1) with the highest mean occupied-period VR (4.1 L/p/s), windows were reported open 100% of the time, resulting in an average CO2 concentration of 796 ppm, with exceedances above 1000 ppm during 18% of occupied hours and none above 1400 ppm. In contrast, the classroom (B1) with the lowest VR (1.2 L/p/s), where windows were reported open 50% of the time, recorded an average CO2 level of 2469 ppm, exceeding 1000 ppm and 1400 ppm during 89% and 73% of occupied hours, respectively. These findings demonstrate that providing adequate VRs with current ventilation design standards is achievable but heavily depends on occupant window opening behaviour, an operational practice that, in seven of eight classrooms, was insufficient to maintain CO2 within recommended limits.
Classroom NO2 levels remained well below CAFE directive limits, with I/O ratios correlating strongly with VRs, as illustrated by the high I/O ratio of 0.72 in classroom C1. Beyond VRs, I/O ratios were influenced by classroom location relative to pollution sources, proximity to roads, and orientation in relation to the prevailing wind direction. The findings emphasise the importance of accounting for outdoor pollutant ingress when designing classroom ventilation enhancement measures. Effective solutions must consider the type, source, and concentration of outdoor air pollutants, spatial context, wind direction, and temporal patterns to align ventilation periods with times of lower outdoor pollution.
Teachers across all classrooms reported broad satisfaction with indoor temperatures, which were consistently at the lower end of regulatory and comfort guideline thresholds. Given that children experience optimal thermal comfort at temperatures 2 °C to 3 °C lower than adults, these findings emphasise the need for thermal comfort guidelines tailored specifically to the needs of primary school classrooms.
RH levels were closely linked to VRs, with temporal RH patterns mirroring those of CO2 across classrooms. RH levels ranged from 53% to 78% in the classrooms with the highest and lowest VRs, respectively. Mean RH levels in all classrooms exceeded the 60% EN limit, and two surpassed the 70% national threshold, further highlighting the inadequacy of classroom VRs and the associated risk to occupant comfort and health, including increased potential exposure to mould growth.
Occupied-period CO2 patterns were consistent across classrooms, shaped by occupant generation rates and occupancy dynamics, with window opening behaviours playing a key role in elevating VRs and moderating CO2 levels. Rapid CO2 declines during class breaks in all classrooms highlight the effectiveness of temporary classroom vacancies in resetting pollutant concentrations. For example, a 58% CO2 reduction was observed during the first class break on day two in Classroom A1, highlighting the impact of vacating classrooms during breaks. The implementation of a purge ventilation regime during scheduled class breaks could effectively reset CO2 levels while minimising the effects of noise intrusion and thermal discomfort associated with fully opening all windows during the occupied period.
Classroom VRs were largely driven by occupant window and door opening behaviours, with user influence accounting for 84% to 96% of VRs. However, these behaviours are primarily guided by teachers’ thermal comfort preferences rather than air quality considerations. Given that adults’ thermal preferences differ from the optimal thermal conditions for young children, this misalignment may exacerbate inadequate VRs. Furthermore, teacher-reported perceptions of IAQ and comfort were found to diverge from objective measurements, highlighting the limitations of relying solely on subjective assessments. Together, these findings emphasise the importance of increasing teacher awareness regarding both ventilation and thermal comfort needs for all classroom occupants. They also highlight the value of supporting teacher decision-making through the provision of real-time CO2 and hygrothermal monitoring systems that offer proactive ventilation guidance.
The strong correlation between CO2 build-up rates and metrics such as mean and peak CO2 levels, as well as the percentage of time CO2 exceeded guideline thresholds, suggests that CO2 alerting based on rates of change of CO2 could offer a proactive alternative to traditional threshold-based alerts. This approach would enable pre-emptive ventilation management, allowing for timely adjustments to VRs before guideline exceedances occur.
Background ventilation (windows and doors closed) accounted for just 4% to 16% of overall classroom VRs. Background ventilation alone is insufficient for maintaining classroom CO2 levels within recommended guideline limits, as demonstrated by slow end-of-day CO2 decay rates across all classrooms. In some cases, CO2 levels failed to reset overnight, a problem further exacerbated in classrooms that are used for afterschool activities. The findings reinforce the need for increased background VRs and support the implementation of an end-of-day ventilation purge regime to remove accumulated indoor air pollutants after classrooms are vacated. This simple regime would enable effective resetting of CO2 levels without impacting occupant comfort from noise or thermal discomfort.
Although the modest sample size limits the generalisability of the findings and some risk of overinterpretation remains, this study contributes valuable evidence to inform ventilation design standards and occupant-led ventilation management in the pursuit of healthy, sustainable learning environments. The results emphasise the importance of targeted ventilation strategies that maintain IAQ without compromising thermal comfort or increasing exposure to outdoor pollutants and noise. Practical, low-cost measures such as scheduled purging, real-time air quality monitoring and alerting, and occupant awareness offer immediate pathways to improving environmental conditions for health and learning in NV classrooms in Ireland.
Supplementary Materials
The following supporting information can be downloaded at: https://www.mdpi.com/article/10.3390/su17219873/s1, Teacher Survey; Correlation Matrices; Table S1: Daily CO2 Values; Table S2: Daily CO2 build-up rates; Table S3: CO2 Decay rates; Table S4: Daily VRs.
Author Contributions
Conceptualisation, D.H., J.G. (John Gallagher), J.G. (John Garvey) and J.L.; methodology, D.H., J.G. (John Gallagher), J.L. and M.H.; software, D.H. and M.H.; validation, D.H., J.G. (John Gallagher) and M.H.; formal analysis, D.H., J.G. (John Gallagher) and M.H.; investigation, D.H.; resources, D.H. and J.G. (John Garvey); data curation, D.H.; writing—original draft preparation, D.H. and J.G. (John Gallagher); writing—review and editing, D.H., J.G. (John Gallagher), J.G. (John Garvey), J.L. and M.H.; visualisation, D.H., J.G. (John Gallagher) and M.H.; supervision, J.G. (John Gallagher), J.G. (John Garvey) and J.L.; project administration, D.H. All authors have read and agreed to the published version of the manuscript.
Funding
This research is funded by the Department of the Built Environment at the Technological University of the Shannon: Midwest, Ireland.
Institutional Review Board Statement
The study was conducted according to the guidelines of the Declaration of Helsinki, and approved by the Institutional Review Board (or Ethics Committee) of Trinity College Faculty of Science, Technology, Engineering and Mathematics (STEM) Research Ethics Committee (REC) (protocol code 4905 and date of approval is 24 September 2025).
Informed Consent Statement
Informed consent for participation was obtained from all subjects involved in the study.
Data Availability Statement
The original contributions presented in this study are included in the article/Supplementary Material. Further inquiries can be directed to the corresponding author.
Acknowledgments
The authors gratefully acknowledge the Estates Department at TUS for providing CO2 monitors, and thank the EPA, An Taisce, and Biofin Europe for their collaboration in supplying and analysing NO2 diffusion tubes. Sincere thanks are also extended to the participating teachers and principals for their time, valuable input, and generous cooperation in facilitating the data collection at their schools.
Conflicts of Interest
The authors declare no conflicts of interest.
References
- Daisey, J.M.; Angell, W.J.; Apte, M.G. Indoor air quality, ventilation and health symptoms in schools: An analysis of existing information. Indoor Air 2003, 13, 53–64. [Google Scholar] [CrossRef]
- Sadrizadeh, S.; Yao, R.; Yuan, F.; Awbi, H.; Bahnfleth, W.; Bi, Y.; Cao, G.; Croitoru, C.; de Dear, R.; Haghighat, F.; et al. Indoor air quality and health in schools: A critical review for developing the roadmap for the future school environment. J. Build. Eng. 2022, 57, 104908. [Google Scholar] [CrossRef]
- Mendell, M.J.; Heath, G.A. Do indoor pollutants and thermal conditions in schools influence student performance? A critical review of the literature. Indoor Air 2005, 15, 27–52. [Google Scholar] [CrossRef]
- Wargocki, P.; Porras-Salazar, J.A.; Contreras-Espinoza, S.; Bahnfleth, W. The relationships between classroom air quality and children’s performance in school. Build. Environ. 2020, 173, 106749. [Google Scholar] [CrossRef]
- Salvi, S. Health effects of ambient air pollution in children. Paediatr. Respir. Rev. 2007, 8, 275–280. [Google Scholar] [CrossRef]
- Pollozhani, F.; McLeod, R.S.; Schwarzbauer, C.; Hopfe, C.J. Assessing school ventilation strategies from the perspective of health, environment, and energy. Appl. Energy 2024, 353, 121961. [Google Scholar] [CrossRef]
- Chatzidiakou, L.; Mumovic, D.; Summerfield, A. Is CO2 a good proxy for indoor air quality in classrooms? Part 1: The interrelationships between thermal conditions, CO2 levels, ventilation rates and selected indoor pollutants. Build. Serv. Eng. Res. Technol. 2015, 36, 129–161. [Google Scholar] [CrossRef]
- Chatzidiakou, L.; Mumovic, D.; Summerfield, A. Is CO2 a good proxy for indoor air quality in classrooms? Part 2: Health outcomes and perceived indoor air quality in relation to classroom exposure and building characteristics. Build. Serv. Eng. Res. Technol. 2015, 36, 162–181. [Google Scholar] [CrossRef]
- Department of Education and Skills. TGD-020 General Design Guidelines for Schools (Primary & Post Primary), 1st ed.; Planning & Building Unit Department of Education and Skills: Dublin, Ireland, 2017.
- Gil-Baez, M.; Barrios-Padura, Á.; Molina-Huelva, M.; Chacartegui, R. Natural ventilation systems in 21st-century for near zero energy school buildings. Energy 2017, 137, 1186–1200. [Google Scholar] [CrossRef]
- Santamouris, M.; Synnefa, A.; Asssimakopoulos, M.; Livada, I.; Pavlou, K.; Papaglastra, M.; Gaitani, N.; Kolokotsa, D.; Assimakopoulos, V. Experimental investigation of the air flow and indoor carbon dioxide concentration in classrooms with intermittent natural ventilation. Energy Build. 2008, 40, 1833–1843. [Google Scholar] [CrossRef]
- Griffiths, M.; Eftekhari, M. Control of CO2 in a naturally ventilated classroom. Energy Build. 2008, 40, 556–560. [Google Scholar] [CrossRef]
- Chatzidiakou LMumovic, D.; Summerfield, A.J. What do we know about indoor air quality in school classrooms? A critical review of the literature. Intell. Build. Int. 2012, 4, 228–259. [Google Scholar] [CrossRef]
- Mohamed, S.; Rodrigues, L.; Omer, S.; Calautit, J. Overheating and indoor air quality in primary schools in the UK. Energy Build. 2021, 250, 111291. [Google Scholar] [CrossRef]
- Canha, N.; Canha, N.; Mandin, C.; Ramalho, O.; Wyart, G.; Ribéron, J.; Dassonville, C.; Hänninen, O.; Almeida, S.; Derbez, M. Assessment of ventilation and indoor air pollutants in nursery and elementary schools in France. Indoor Air 2016, 26, 350–365. [Google Scholar] [CrossRef] [PubMed]
- EN 16798-1:2019; Energy Performance of Buildings—Ventilation for Buildings—Part 1: Indoor Environmental Input Parameters for Design and Assessment of Energy Performance of Buildings Addressing Indoor Air Quality, Thermal Environment, Lighting and Acoustics. CEN: Brussels, Belgium, 2019.
- HSA Code of Practice for IAQ published in Iris Oifigiúil on 6th June 2023. Available online: https://www.hsa.ie/eng/publications_and_forms/publications/codes_of_practice/code_of_practice_for_indoor_air_quality.pdf (accessed on 6 March 2024).
- Honan, D.; Gallagher, J.; Garvey, J.; Littlewood, J. Indoor Air Quality in Naturally Ventilated Primary Schools: A Systematic Review of the Assessment & Impacts of CO2 Levels. Buildings 2024, 14, 4003. [Google Scholar] [CrossRef]
- Honan, D.; Littlewood, J.R.; Garvey, J. Enhancing Indoor Air Quality in Naturally Ventilated Classrooms in Ireland: A Systematic Review Protocol and Future Research Agenda. In International Conference on Sustainability in Energy and Buildings; Springer Nature: Singapore, 2024; pp. 23–33. [Google Scholar]
- Ramalho, O.; Wyart, G.; Mandin, C.; Blondeau, P.; Cabanes, P.-A.; Leclerc, N.; Mullot, J.-U.; Boulanger, G.; Redaelli, M. Association of carbon dioxide with indoor air pollutants and exceedance of health guideline values. Build. Environ. 2015, 93, 115–124. [Google Scholar] [CrossRef]
- Chatzidiakou, L.; Mumovic, D.; Summerfield, A.J.; Hong, S.M.; Altamirano-Medina, H. A Victorian school and a low carbon designed school: Comparison of indoor air quality, energy performance, and student health. Indoor Built Environ. 2014, 23, 417–432. [Google Scholar] [CrossRef]
- Simoni, M.; Annesi-Maesano, I.; Sigsgaard, T.; Norback, D.; Wieslander, G.; Nystad, W.; Canciani, M.; Sestini, P.; Viegi, G. School air quality related to dry cough, rhinitis and nasal patency in children. Eur. Respir. J. 2010, 35, 742. [Google Scholar] [CrossRef]
- Gaihre, S.; Semple, S.; Miller, J.; Fielding, S.; Turner, S. Classroom carbon dioxide concentration, school attendance, and educational attainment. J. Sch. Health 2014, 84, 569–574. [Google Scholar] [CrossRef]
- Shendell, D.G.; Prill, R.; Fisk, W.J.; Apte, M.G.; Blake, D.; Faulkner, D. Associations between classroom CO2 concentrations and student attendance in Washington and Idaho. Indoor Air 2004, 14, 333–341. [Google Scholar] [CrossRef]
- Pegas, P.N.; Alves, C.A.; Evtyugina, M.G.; Nunes, T.; Cerqueira, M.; Franchi, M.; Pio, C.A.; Almeida, S.M.; Freitas, M.C. Indoor air quality in elementary schools of Lisbon in spring. Environ. Geochem. Health 2011, 33, 455. [Google Scholar] [CrossRef]
- Moshammer, H.; Poteser, M.; Kundi, M.; Lemmerer, K.; Weitensfelder, L.; Wallner, P.; Hutter, H.P. Nitrogen-dioxide remains a valid air quality indicator. Int. J. Environ. Res. Public Health 2020, 17, 3733. [Google Scholar] [CrossRef]
- Demirel, G.; Özden, Ö.; Döğeroğlu, T.; Gaga, E.O. Personal exposure of primary school children to BTEX, NO2 and ozone in Eskişehir, Turkey: Relationship with indoor/outdoor concentrations and risk assessment. Sci. Total Environ. 2014, 473, 537–548. [Google Scholar] [CrossRef] [PubMed]
- Department of the Environment Climate and Communications. Clean Air Strategy for Ireland; Government of Ireland: Dublin, Ireland, 2023.
- World Health Organization. WHO Global Air Quality Guidelines: Particulate Matter (PM2.5 and PM10), Ozone, Nitrogen Dioxide, Sulfur Dioxide and Carbon Monoxide; World Health Organization: Washington, DC, USA, 2021. [Google Scholar]
- Norbäck, D.; Hashim, J.H.; Hashim, Z.; Ali, F. Volatile organic compounds (VOC), formaldehyde and nitrogen dioxide (NO2) in schools in Johor Bahru, Malaysia: Associations with rhinitis, ocular, throat and dermal symptoms, headache and fatigue. Sci. Total Environ. 2017, 592, 153. [Google Scholar] [CrossRef] [PubMed]
- Belanger, K.; Holford, T.R.; Gent, J.F.; Hill, M.E.; Kezik, J.M.; Leaderer, B.P. Household levels of nitrogen dioxide and pediatric asthma severity. Epidemiology 2013, 24, 320. [Google Scholar] [CrossRef] [PubMed]
- Kvisgaard, B.; Collet, P.F. The User’s Influence on Air Change. Air Change Rate and Airtightness in Buildings; ASTM International: West Conshohocken, PA, USA, 1990. [Google Scholar]
- Iwashita, G.; Akasaka, H. The effects of human behavior on natural ventilation rate and indoor air environment in summer—A field study in southern Japan. Energy Build. 1997, 25, 195. [Google Scholar] [CrossRef]
- Dutton, S.; Shao, L. Window opening behaviour in a naturally ventilated school. Proc. SimBuild 2010, 4, 260–268. [Google Scholar]
- Stazi, F.; Naspi, F.; D’Orazio, M. Modelling window status in school classrooms. Results from a case study in Italy. Build. Environ. 2017, 111, 24. [Google Scholar] [CrossRef]
- Montazami, A.; Wilson, M.; Nicol, F. Aircraft noise, overheating and poor air quality in classrooms in London primary schools. Build. Environ. 2012, 52, 129. [Google Scholar] [CrossRef]
- Fabi, V.; Andersen, R.V.; Corgnati, S.; Olesen, B.W. Occupants’ window opening behaviour: A literature review of factors influencing occupant behaviour and models. Build. Environ. 2012, 58, 188. [Google Scholar] [CrossRef]
- Korsavi, S.S.; Jones, R.V.; Fuertes, A. Operations on windows and external doors in UK primary schools and their effects on indoor environmental quality. Build. Environ. 2022, 207, 108416. [Google Scholar] [CrossRef]
- Wargocki, P.; Wyon, D.P. Ten questions concerning thermal and indoor air quality effects on the performance of office work and schoolwork. Build. Environ. 2017, 112, 359. [Google Scholar] [CrossRef]
- Wargocki, P.; Porras-Salazar, J.A.; Contreras-Espinoza, S. The relationship between classroom temperature and children’s performance in school. Build. Environ. 2019, 157, 197. [Google Scholar] [CrossRef]
- Jiang, J.; Wang, D.; Liu, Y.; Xu, Y.; Liu, J. A study on pupils’ learning performance and thermal comfort of primary schools in China. Build. Environ. 2018, 134, 102. [Google Scholar] [CrossRef]
- Korsavi, S.S.; Montazami, A. Children’s thermal comfort and adaptive behaviours; UK primary schools during non-heating and heating seasons. Energy Build. 2020, 214, 109857. [Google Scholar]
- Arundel, A.V.; Sterling, E.M.; Biggin, J.H.; Sterling, T.D. Indirect health effects of relative humidity in indoor environments. Environ. Health Perspect. 1986, 65, 351. [Google Scholar] [PubMed]
- Fischer, J.C.; Bayer, C.W. Humidity control in school facilities. Energy 2003, 30, 606. [Google Scholar]
- Fisk, W.J.; Eliseeva, E.A.; Mendell, M.J. Association of residential dampness and mold with respiratory tract infections and bronchitis: A meta-analysis. Environ. Health 2010, 9, 72. [Google Scholar] [CrossRef] [PubMed]
- Fanger, P.; Melikov, A.; Hanzawa, H.; Ring, J. Air turbulence and sensation of draught. Energy Build. 1988, 12, 21–39. [Google Scholar] [CrossRef]
- Miao, S.; Gangolells, M.; Tejedor, B. A Comprehensive Assessment of Indoor Air Quality and Thermal Comfort in Educational Buildings in the Mediterranean Climate. Indoor Air 2023, 2023, 6649829. [Google Scholar] [CrossRef]
- Sánchez-Fernández, A.; Coll-Aliaga, E.; Lerma-Arce, V.; Lorenzo-Sáez, E. Evaluation of Different Natural Ventilation Strategies by Monitoring the Indoor Air Quality Using CO2 Sensors. Int. J. Environ. Res. Public Health 2023, 20, 6757. [Google Scholar] [CrossRef]
- Vassella, C.C.; Koch, J.; Henzi, A.; Jordan, A.; Waeber, R.; Iannaccone, R.; Charrière, R. From spontaneous to strategic natural window ventilation: Improving indoor air quality in Swiss schools. Int. J. Hyg. Environ. Health 2021, 234, 113746. [Google Scholar]
- Wargocki, P.; Silva, N. Use of visual CO2 feedback as a retrofit solution for improving classroom air quality. Indoor Air 2015, 25, 105–114. [Google Scholar] [CrossRef]
- Avella, F.; Gupta, A.; Peretti, C.; Fulici, G.; Verdi, L.; Belleri, A.; Babich, F. Low-Invasive CO2-based visual alerting systems to manage natural ventilation and improve IAQ in historic school buildings. Heritage 2021, 4, 3442–3468. [Google Scholar] [CrossRef]
- Geelen, L.M.J.; Huijbregts, M.A.J.; Ragas, A.M.J.; Bretveld, R.W.; Jans, H.W.A.; van Doorn, W.J.; Evertz, S.J.C.J.; van der Zijden, A. Comparing the effectiveness of interventions to improve ventilation behavior in primary schools. Indoor Air 2008, 18, 416–424. [Google Scholar] [CrossRef]
- Aguilar, A.J.; de la Hoz-Torres, M.L.; Oltra-Nieto, L.; Ruiz, D.P.; Martínez-Aires, M.D. Impact of COVID-19 protocols on IEQ and students’ perception within educational buildings in Southern Spain. Build. Res. Inf. 2022, 50, 755–770. [Google Scholar] [CrossRef]
- Quang, T.N.; He, C.; Knibbs, L.D.; De Dear, R.; Morawska, L. Co-optimisation of indoor environmental quality and energy consumption within urban office buildings. Energy Build. 2014, 85, 225–234. [Google Scholar] [CrossRef]
- Clean Ari Together. Available online: https://www.cleanairtogether.ie (accessed on 5 June 2025).
- Aranet. Aranet4 Datasheet. Downloads: Aranet4 Datasheet. [Online]. 2024. Available online: https://aranet.com/attachment/46/Aranet4_datasheet_WEB.pdf (accessed on 26 November 2024).
- Zhang, D.; Ding, E.; Bluyssen, P.M. Guidance to assess ventilation performance of a classroom based on CO2 monitoring. Indoor Built Environ. 2022, 31, 1107–1126. [Google Scholar] [CrossRef]
- EN ISO 16000-26:2012; Part 26: Sampling Strategy for Carbon Dioxide (CO2). International Organization for Standardization: Geneva, Switzerland, 2012.
- Aranet. Aranet4 User Manual. Downloads: Aranet4 User Manual. [Online]. 2024. Available online: https://pro.aranet.com/uploads/2022/04/aranet4_user_manual_v25_web.pdf (accessed on 26 November 2024).
- Villanueva, F.; Jiménez, E.; Felisi, J.M.; Garrido, T.; Jiménez, J.L.; Ródenas, M.; Muñoz, A. Guide about Affordable CO2 detectors for COVID-19 Prevention [Internet]. 2021. Available online: https://docs.google.com/document/d/1K6gqMH4UXl6ljObtWooTJSyFskCkQFx3CXFtkNGBsDs/edit?tab=t.0 (accessed on 15 October 2025).
- Gradko International. Nitrogen Dioxide Diffusion Tubes. Downloads: Nitrogen Dioxide Technical Data Sheet. [Online]. 2024. Available online: https://www.gradko.com/environmental/environmental-resources/technical-resources/technicaldata-sheets/nitrogen-dioxide-technical-data-sheet.pdf (accessed on 26 November 2024).
- Department for Environment Food and Rural Affairs, Defra. Diffusion Tubes for Ambient NO2 Monitoring: Practical Guidance for Laboratories and Users; AEA Energy & Environment: Didcot, UK, 2008. [Google Scholar]
- Gradko International. Nitrogen Dioxide Diffusion Tubes. Downloads: Nitrogen Dioxide Instruction Sheet. [Online]. 2024. Available online: https://www.gradko.com/environmental/environmental-resources/technical-resources/samplinginstructions/nitrogen-dioxide-instruction-sheet.pdf (accessed on 26 November 2024).
- Subirana, M.; Sunyer, J.; Colom-Cadena, A.; Bordas, A.; Casabona, J.; Gascon, M. Monitoring and assessment of CO2 and NO2 in schools within the Sentinel Schools Network of Catalonia during the COVID-19 era. Chemosphere 2024, 362, 142575. [Google Scholar] [CrossRef]
- Kalimeri, K.K.; Bartzis, J.G.; Sakellaris, I.A.; de Oliveira Fernandes, E. Investigation of the PM2.5, NO2 and O3 I/O ratios for office and school microenvironments. Environ. Res. 2019, 179, 108791. [Google Scholar] [CrossRef] [PubMed]
- Peugh, J.L. A practical guide to multilevel modeling. J. Sch. Psychol. 2010, 48, 85–112. [Google Scholar] [CrossRef]
- Korsavi, S.S.; Montazami, A.; Mumovic, D. Indoor air quality (IAQ) in naturally-ventilated primary schools in the UK: Occu-pant-related factors. Build. Environ. 2020, 180, 106992. [Google Scholar] [CrossRef]
- Mukaka, M.M. A guide to appropriate use of correlation coefficient in medical research. Malawi Med. J. 2012, 24, 69. [Google Scholar]
- Finneran, J.; Burridge, H.C. Inferring ventilation rates with quantified uncertainty in operational rooms using point measurements of carbon dioxide: Classrooms as a case study. Build. Environ. 2024, 254, 111309. [Google Scholar] [CrossRef]
- Batterman, S. Review and extension of CO2-based methods to determine ventilation rates with application to school classrooms. Int. J. Environ. Res. Public Health 2017, 14, 145. [Google Scholar] [CrossRef] [PubMed]
- ASTM. Standard Guide for Using Indoor Carbon Dioxide Concentrations to Evaluate Indoor Air Quality and Ventilation; ASTM International: West Conshohocken, PA, USA, 2012. [Google Scholar]
- Korsavi, S.S.; Montazami, A.; Mumovic, D. Ventilation rates in naturally ventilated primary schools in the UK.; Contextual, Occupant and Building-related (COB) factors. Build. Environ. 2020, 181, 107061. [Google Scholar] [CrossRef]
- Tahsildoost, M.; Zomorodian, Z.S. Indoor environment quality assessment in classrooms: An integrated approach. J. Build. Phys. 2018, 42, 336. [Google Scholar] [CrossRef]
- van der Zee, S.C.; Strak, M.; Dijkema, M.B.; Brunekreef, B.; Janssen, N.A. The impact of particle filtration on indoor air quality in a classroom near a highway. Indoor Air 2017, 27, 291. [Google Scholar] [PubMed]
- Ghita, S.A.; Catalina, T. Energy Efficiency versus Indoor Environmental Quality in Different Romanian Countryside Schools. Energy Build. 2015, 92, 140–154. [Google Scholar] [CrossRef]
Disclaimer/Publisher’s Note: The statements, opinions and data contained in all publications are solely those of the individual author(s) and contributor(s) and not of MDPI and/or the editor(s). MDPI and/or the editor(s) disclaim responsibility for any injury to people or property resulting from any ideas, methods, instructions or products referred to in the content. |
© 2025 by the authors. Licensee MDPI, Basel, Switzerland. This article is an open access article distributed under the terms and conditions of the Creative Commons Attribution (CC BY) license (https://creativecommons.org/licenses/by/4.0/).