Abstract
Industrial chain modernization is vital for driving the development of a modern country, boosting national competitiveness and upholding economic security. This study examines the impact of coordinated two-way FDI development on industrial chain modernization from the perspective of factor allocation, using panel data from 30 Chinese provinces from 2013 to 2023. The empirical results show that coordinated two-way FDI development significantly boosts industrial chain modernization. This finding holds across multiple robustness tests. Mechanism analysis confirms that the alleviation of capital-labor factor misallocation serves as a key transmission channel. Furthermore, heterogeneity analysis reveals significant heterogeneous effects across regions, ownership structures, investment types, and industry sectors. Notably, the synergistic interaction between downward-gradient inward FDI and reverse-gradient outward FDI, along with coordinated two-way FDI development in the manufacturing sector, has the highest gray correlation degree with industrial chain modernization. These findings provide a solid theoretical basis and practical policy insights for advancing industrial chain modernization.
1. Introduction
In a rapidly changing global economy and competitive industrial environment, industrial chain modernization has become a top strategic priority and a key driver of high-quality development. In October 2020, the Fifth Plenary Session of the 19th Central Committee of the Communist Party of China proposed the goals of “advancing the modernization of industrial and supply chains” and “promoting the upgrading of industrial foundations and industrial chain modernization to enhance economic quality, efficiency, and core competitiveness.” This strategy has clearly guided China’s modern industrial system development during the 14th Five-Year Plan period, with significant implications for both domestic growth and the global economy. As a major player in the global economy, China can strengthen its position in the global industrial chain by advancing industrial chain modernization, thereby enhancing the resilience and vitality of the global industrial system. During his inspection tour of Guangdong in April 2023, General Secretary Xi Jinping emphasized the necessity of “promoting the enhancement of industrial foundations and the modernization of industrial chains, cultivating strategic emerging industries, and establishing a contemporary industrial system with enhanced international competitiveness.” This significant exposition clearly highlights the central role of industrial chain modernization in China’s development strategy.
Currently, China has established an industrial system marked by large scale, comprehensive coverage, and strong competitiveness, with substantial advances in industrial chain modernization [1]. However, as a major participant in the global industrial chain, its development still faces significant challenges. While China possesses an independent and complete industrial system and a well-developed industrial chain, these chains remain “large but not strong, broad but not deep.” Specifically, self-sufficiency in key core technologies is low, and critical sectors exhibit high import dependency for core materials and equipment [2]. Moreover, amid complex and volatile internal and external environments, the security and resilience of China’s industrial chains are increasingly challenged. In this context, proactive policy responses are essential. Advancing industrial chain modernization is not only crucial for overcoming current constraints but also foundational to achieving high-quality economic growth. To this end, China must prioritize high-level self-reliance by accelerating upgrades in key weak links and securing autonomous access to core technologies. Simultaneously, it should strategically integrate domestic and international resources, leveraging global trade networks to shape the direction of industrial upgrading.
The Outline of the 14th Five-Year Plan for National Economic and Social Development of the People’s Republic of China and the Long-Range Objectives Through the Year 2035 explicitly establishes the new requirement to “coordinate the development of inward foreign direct investment (IFDI) and outward foreign direct investment (OFDI).” It identifies the key focus as “giving equal emphasis to attracting foreign investment and expanding outward investment, leveraging high-level two-way investment to efficiently utilize global resources and market space, improving industrial and supply chain safeguard mechanisms, and enhancing industrial competitiveness.” This shows that coordinated IFDI and OFDI development helps link domestic and international markets and integrate resources from both. In light of this, in the new phase of balanced emphasis on both “bringing in” and “going global,” understanding the mechanisms through which coordinated two-way FDI enhances industrial chain modernization is crucial for accelerating the development of a modern industrial system and advancing China’s path to modernization.
2. Literature Review
2.1. Research on Industrial Chain Modernization
Industrial chain modernization, a central theme in contemporary economic development, has attracted substantial scholarly attention. Research primarily centers on three dimensions: conceptual definitions, measurement methodologies, and driving forces. Regarding conceptualization, scholars have examined the concept through multiple analytical lenses. The element synergy perspective emphasizes the efficient allocation of capital, technology, and talent [3]; the global value chain perspective highlights a nation’s position within the global division of labor and its capacity for self-reliance and control [4]; the industrial development perspective underscores the transition from low-end manufacturing to high-value-added activities [5]; and the comprehensive perspective frames industrial chain modernization as the holistic enhancement of capabilities, innovation, resilience, and collaborative performance [6].
With respect to measurement methodologies, building a multi-dimensional index system is now the main approach in research, with key studies focusing on different dimensions. For instance, some existing studies have focused on assessing the level of industrial chain modernization at the provincial level through systematic evaluations across five dimensions: innovation, high-end development, sustainability, synergy, and autonomous controllability [7]. Other studies have examined the comprehensive development level of agricultural modernization by constructing evaluation frameworks focused on key dimensions, including agricultural costs, efficiency, sustainable development, and social progress [8]. Additional studies have conducted in-depth analyses on China’s overall level of industrial chain modernization and its dynamic evolution based on six dimensions: foundation, digitalization, innovation, resilience, synergy, and sustainability [6]. More recently, a study assessing China’s industrial chain modernization through five dimensions: structure, management, economy, synergy, and green development has contributed to refining the evaluative framework for this domain [9].
With respect to driving factors, existing literature primarily focuses on four core dimensions: cross-border trade, industrial policies, resource elements, and digitalization and intelligence. In the realm of cross-border trade, both OFDI and IFDI have a significant positive impact on industrial chain modernization: they enhance the division of labor and collaborative capabilities within industries, promote the coordinated development of domestic and international economic circulations, and thereby strengthen the stability and structural optimization of industrial chains [10,11].
Regarding industrial policies, well-designed policy frameworks have positive effects on industrial chain modernization, although these impacts vary significantly across industries and regions [12]. Specifically, the “Chain Chief System” boosts regional industrial chain modernization by improving resource allocation and strengthening innovation links between upstream and downstream firms [13]. With respect to resource elements, traditional human capital and emerging data elements together constitute a fundamental support for industrial chain modernization. Innovative human capital significantly enhances the industrial chain modernization of the manufacturing sector [14]; meanwhile, the effectiveness of talent policies varies in this process [15]. Furthermore, data aggregation and flow speed up industrial chain restructuring, providing key inputs and unlocking value to support modernization [16]. In digital intelligence, artificial intelligence, digital transformation, and the digital economy all support industrial chain modernization. Artificial intelligence drives industrial chain modernization via three mechanisms: improving the quality of human capital, facilitating the upgrading of high-tech-intensive industries, and driving the transformation of consumer demand [17]. Digital transformation drives industrial and supply chain diversification and modernization through trust building, stabilization, extension, and innovation [18]. The digital economy supports modernization through expanded factors, transformed platforms, and new drivers [19].
2.2. Research on Coordinated Two-Way FDI Development
Research on two-way FDI has shifted from parallel analysis to studying coordinated relationships. Early and mid-phase studies moved beyond one-dimensional views by integrating IFDI and OFDI into a single framework, moving away from isolated assessments. Yet these works mainly examined the separate drivers, impacts, and national differences in each flow, without systematically explaining their synergies and interactions. For instance, research has revealed the knowledge structure and research gaps in two-way FDI within emerging economies from 1994 to 2019, thereby establishing a theoretical foundation for subsequent studies [20]. Some studies have addressed the underrepresentation of research on two-way FDI in developed countries by focusing on a sample of 14 EU nations, showing that sustainable development and renewable energy are common drivers across these countries [21]. At the level of social equity, studies examining the impact of two-way FDI on poverty and income inequality in middle-income countries have found that it negatively affects income growth among the poorest populations. Moreover, its effects on income inequality vary significantly across geographical regions and economic systems [22,23]. In terms of economic linkages, studies have examined the impact of two-way FDI on domestic investment across industry, regional, and national levels, confirming its “crowding-out effect” and revealing the moderating role of institutional quality [24,25,26]. Research has also analyzed how institutional and policy environments shape Russia’s two-way FDI patterns [27] and validated the complementary relationship between inward FDI and foreign trade in Malaysia [28]. Furthermore, comparative studies have identified differences between developed and developing countries in how two-way FDI affects employment structures [29]. Together, these studies confirm the coexistence of two-way FDI and reveal its diverse economic, social, and institutional impacts, offering strong evidence and a foundation for future research on coordinated development.
As research deepens, scholars have increasingly recognized the theoretical and practical value of studying two-way FDI interaction and coordination. The focus has shifted to coordinated development, forming a clear paradigm that includes measuring frameworks, identifying drivers, assessing coordination levels, and expanding impact analyses. A research team has pioneered the measurement of coordinated two-way FDI development. Using a panel vector autoregression (PVAR) model, the study confirms an endogenous interactive relationship between OFDI and IFDI. Inspired by the capacity coupling model from physics, it quantitatively assesses, for the first time, the coordination levels of coordinated two-way FDI development across China’s manufacturing sub-sectors, establishing a practical analytical framework for future research [30]. Subsequent studies have further explored the intrinsic mechanisms underlying coordinated two-way FDI development, identifying macroeconomic and institutional drivers and constructing a multidimensional explanatory framework. One study found that economic growth, industrial upgrading, and technological progress are key drivers [31]. Another study further showed that institutional quality, innovation capacity, industrial structure, and economic development level exert positive effects on coordinated two-way FDI development [32].
Building on this foundation, scholars have adopted the coupled coordination paradigm. They have moved beyond measuring coordination levels and identifying drivers to empirically verify how coordinated two-way FDI development supports economic and social goals. Key findings have emerged across research domains. In the field of environmental governance, studies confirmed that coordinated two-way FDI development significantly enhances pollution control [33,34]. Regarding efficiency and quality improvements, research emphasized its role in increasing green total factor productivity [35] and verified its positive impact on export product quality upgrading [36]. In the realm of global competitiveness, evidence showed that coordinated two-way FDI development improves a country’s position within global value chains [37]. With regard to innovation capacity, existing studies found that it substantially contributes to innovation at both national and enterprise levels [38,39]. Collectively, these studies have established a closed-loop research framework covering “measurement, influencing factors, coordination levels, and effect verification.” This framework not only addresses the long-standing research gap concerning the interaction mechanisms of two-way FDI and their operational conditions but also underscores the pivotal role of coordinated development in promoting high-quality economic growth.
A review of the existing literature reveals that the current body of research still faces several notable limitations. First, cross-disciplinary research on coordinated two-way FDI development and industrial chain modernization remains limited. The underlying transmission mechanisms between the two are not yet well understood, and both theoretical development and empirical validation remain inadequate. Research on the drivers of industrial chain modernization has examined multiple dimensions, including transnational trade [10,11], industrial policy [12], resource factors [14,15], and digitalization and intelligent transformation [17,18,19]. However, studies most closely related to this research primarily focus on the impact of either OFDI or IFDI on industrial chain modernization, without fully integrating coordinated two-way FDI development as a holistic phenomenon. Meanwhile, although existing research on coordinated two-way FDI development has established a comprehensive system encompassing measurement method design, identification of influencing factors, assessment of coordination levels, and expansion of effect testing, its impact analysis remains largely focused on areas such as environmental governance [33], green total factor productivity [35], and positioning within the global value chain [37], with limited systematic exploration of industrial chain modernization as the core dependent variable. Moreover, the academic community has not yet established a systematic theoretical framework for analyzing the relationship between coordinated two-way FDI development and industrial chain modernization. As a result, the functional positioning and role boundaries of coordinated two-way FDI development in promoting industrial chain modernization remain unclear. Second, existing research insufficiently explores the correlation mechanisms between coordinated two-way FDI development and industrial chain modernization across different investment categories and sub-industries. In particular, systematic analysis of industry heterogeneity characteristics and policy guidance effects remains limited. While studies on coordinated two-way FDI development heterogeneity have primarily focused on the national level [29], regional disparities, or economic system types [23,24], systematic examination of investment category attributes and specific sub-sector dynamics is still lacking. There is not only a lack of differentiated assessment of the impacts across investment categories, but also an absence of clarity regarding the intrinsic mechanisms linking coordinated two-way FDI development to industrial chain modernization in specific industries.
Based on the aforementioned research gaps, this study makes three potential marginal contributions. First, it constructs a scientific and systematic comprehensive evaluation index system for industrial chain modernization and calculates the level of coordinated two-way FDI development using the coupling coordination degree model, thereby providing a more robust and topic-specific quantitative foundation for subsequent empirical analysis. Second, it establishes a theoretical framework to examine how coordinated two-way FDI development drives industrial chain modernization. From a factor allocation perspective, this framework clarifies the mechanism by which coordinated development enhances modernization through resource allocation dynamics, deepening understanding of the transmission channels between these two dimensions. Third, using the gray relational analysis model, this study systematically compares the correlation between coordinated two-way FDI development and industrial chain modernization across investment categories and key sub-sectors. It identifies variations due to different investment orientations and industry-specific characteristics, providing empirical support for differentiated foreign investment policies and targeted industrial upgrading strategies.
3. Theoretical Analysis and Research Hypotheses
3.1. Direct Impact
Before assessing the impact of coordinated two-way FDI development on industrial chain modernization, it is important to clarify these two core concepts. Drawing on existing research, coordinated two-way FDI development refers to a state of mutual empowerment and dynamic adaptation between IFDI and OFDI, as well as an evolutionary process [40]. It has two key dimensions: first, a mutually reinforcing, symbiotic relationship—rather than isolated capital flows, IFDI and OFDI create synergies through resource complementarity and cumulative advantages; second, dynamic evolution—from imbalance due to scale mismatches and structural inconsistencies toward balance marked by alignment and coordination [31]. Industrial chain modernization represents an upgrading paradigm aligned with high-quality economic development. It can be understood through two dimensions: “goal orientation” and “fundamental characteristics.” From a goal orientation perspective, it leverages the ongoing information technology revolution and industrial transformation to pursue six objectives: stronger foundations, higher digitalization, greater innovation capacity, enhanced resilience, improved synergy efficiency, and increased sustainability [6]. In terms of fundamental characteristics, its core lies in realizing the organic integration of industrial chain entity modernization and structural modernization [41].
The six goals of industrial chain modernization are not isolated but form an integrated system with chain-like progression, networked interactions, and hierarchical division of labor. Logically, a causal pathway runs from development foundation to digitalization, innovation, resilience, synergy, and finally sustainability. The development foundation provides the infrastructure for digitalization, which enables innovation through technological penetration. Innovative outcomes strengthen resilience, and stable resilience supports upstream-downstream collaboration, enabling efficient synergy that promotes economic and social sustainability. Beyond this linear path, these dimensions interact in a multi-dimensional network: digitalization directly enhances synergy, and innovation directly contributes to sustainability, reflecting cross-level dynamics. Functionally, the six elements form a hierarchy: the development foundation is the base layer; digitalization, innovation, and resilience make up the intermediate capability layer—driving technology, innovation, and risk mitigation; synergy and sustainability constitute the top goal layer, where integration, efficiency, and long-term value are realized.
Investment Development Path (IDP) theory explains the endogenous relationship between IFDI and OFDI [42]. It holds that IFDI and OFDI are dynamically intertwined in a mutually reinforcing cycle. This relationship forms a closed loop through the “two-way technology spillover” mechanism: IFDI transfers advanced technologies and global operational capabilities to domestic firms via positive spillovers—such as technology transfer and managerial expertise diffusion—enabling them to build competitive advantages for outward investment, thus driving OFDI expansion and upgrading. Conversely, domestic firms gain reverse spillovers through OFDI by absorbing foreign technologies and integrating into high-end global networks, enhancing domestic competitiveness and in turn attracting higher-quality IFDI. In this context, two-way FDI forms a virtuous cycle structured as “IFDI–OFDI–IFDI–OFDI…” [40]. At its core, this cycle is a dynamic process of global resource optimization. It represents China’s main pathway for continuously acquiring key production factors—international capital, advanced technologies, and market access—and provides foundational support for industrial chain modernization through three channels: factor supply, technological innovation, and global strategic positioning, making it a critical enabler of modernization.
Building on the prior definition of industrial chain modernization, the coordinated development of two-way FDI can affect it through six aspects, as shown in Figure 1. First, it strengthens the industrial chain foundation. IFDI plays a “proactive supporting role”: its strong economic impact provides capital to close infrastructure funding gaps, while its technology spillovers enable direct transfer of advanced technologies, driving modernization and intelligent upgrading of traditional infrastructure (e.g., transportation and energy). OFDI, in contrast, serves a “reverse upgrading function”: through overseas investment, domestic firms integrate into high-end industrial networks abroad and use reverse spillovers to absorb cutting-edge technologies and expertise in digital infrastructure (e.g., communication networks and data centers), transforming them into drivers for domestic upgrades—accelerating digital infrastructure development. The IFDI-OFDI synergy thus improves traditional infrastructure quality and enhances digital infrastructure capacity, jointly strengthening the hardware foundation for industrial chain development.
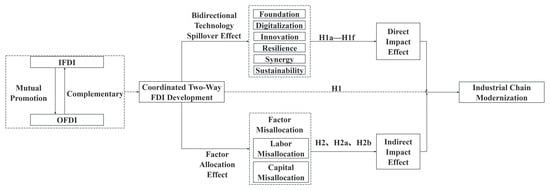
Figure 1.
Theoretical Framework Diagram.
Second, it enhances the overall digitalization of industrial chains. From the IFDI perspective, digital technology spillovers drive industrial digitalization. Existing study found that foreign-invested firms, using advanced digital technologies and management expertise, generate spillovers to domestic firms through horizontal channels—such as peer demonstration and competition—and vertical channels, including upstream-downstream collaboration and technology transfer [43]. Demonstration provides replicable models for digital transformation, while competition motivates local firms to adopt advanced digital technologies. Together, these mechanisms narrow the technology gap and accelerate digital adoption. From the OFDI perspective, its core lies in “reverse experience spillovers”: through overseas investment, domestic firms gain access to global markets and, by collaborating with or competing against leading digital firms, accumulate cutting-edge knowledge in intelligent manufacturing, data management, and digital operations abroad—supported by the “learning-by-doing” mechanism in human capital development. When this knowledge is brought back, firms advance digital transformation in traditional industries and speed up the application and diffusion of digital technologies, creating a self-reinforcing cycle of digital development. Coordinated two-way FDI development thus progressively raises the overall digitalization level of industrial chains.
Third, it enhances the innovation capacity of industrial chains. From the IFDI perspective, its impact is twofold. Existing study found that IFDI influences host-country firms’ innovation mainly through technology spillovers [44]. On the one hand, it provides “positive empowerment”: foreign investors’ advanced R&D models, innovation management expertise, and technological outcomes offer local firms benchmarks and resource access, reducing trial-and-error costs and supporting independent R&D and upgrading. On the other hand, it may cause “innovation constraints” due to adverse competition—foreign firms’ dominance in high-end segments can crowd out domestic firms by limiting their access to key resources and markets, potentially trapping them in “low-end lock-in.” In contrast, OFDI helps overcome these constraints through a “reverse support mechanism.” Based on comparative advantage theory, domestic firms use OFDI to enter global innovation networks, reposition their innovation strategies, and break free from dependency on low-end activities. Moreover, reverse innovation spillovers from OFDI improve innovation quality: through overseas mergers and acquisitions (M&As) and foreign R&D centers, firms absorb core technologies and cutting-edge R&D outcomes, internalize them, and transform them into domestic innovation momentum. Coordinated two-way FDI development thus progressively strengthens the overall innovation capacity of industrial chains.
Fourth, it strengthens industrial chain resilience. Existing study has showed that coordinated two-way FDI development involves the formation of transnational strategic alliances, characterized by deep cooperation and cross-border, cross-regional resource integration [45]. These alliances enhance resilience through two main channels. First, they boost response capacity via internal collaboration: by leveraging economies of scale, they enable resource complementarity and integration of competitive advantages among firms [46], significantly improving the speed and efficiency with which participating countries or regions respond to unexpected events like “black swan” and “gray rhino” incidents—forming an “active defense” mechanism. Second, they reduce risks through a networked spatial structure. Alliance relationships foster multidimensional risk-sharing across political, economic, and legal domains, accelerating the networked restructuring of global value, industrial, and supply chains. This multi-node, multi-path structure reduces “chain disruption risk” from single-point failures, creating a “passive buffering” safeguard. Together, these effects—enhanced capacity and diversified risk—complement each other and strengthen resilience.
Fifth, it enhances industrial chain synergy efficiency. Existing study has showed that long-term, large-scale OFDI may trigger manufacturing “delocalization” and “deindustrialization,” potentially causing industrial hollowing-out in the home country [47]. In contrast, coordinated two-way FDI development promotes cross-border flows of physical capital and allocation of production factors—such as technology, knowledge, and managerial expertise. This strengthens positive interactions within the domestic and international dual circulation system and improves overall industrial chain efficiency. By enhancing connectivity among chain segments through dual circulation synergy, it enables highly efficient collaboration.
Sixth, it advances industrial chains toward greater sustainability. From the IFDI perspective, its impact on host-country industrial chain sustainability follows a dynamic trajectory. Initially, IFDI may expand pollution-intensive sectors, causing excessive resource use and non-compliant emissions—undermining sustainability. However, as marginal returns diminish and environmental awareness rises, this trend reverses: host countries raise environmental entry standards for IFDI, and capital shifts toward strategic emerging industries. This reduces environmental harm and lays the foundation for OFDI growth. Regarding OFDI, home countries can relocate underperforming “marginal industries”—such as high-pollution and energy-intensive sectors—abroad through outbound investment. This helps phase out outdated capacity and eases domestic environmental pressure, directly promoting green and sustainable industrial upgrading. Ultimately, IFDI-driven green transformation complements OFDI-led structural optimization, jointly advancing industrial chains toward higher-quality, sustainable development.
Based on the above analysis, this study proposes the following hypothesis:
H1:
Coordinated two-way FDI development significantly enhances the level of industrial chain modernization.
H1a:
Coordinated two-way FDI development significantly strengthens the foundation for industrial chain development.
H1b:
Coordinated two-way FDI development significantly increases the digitalization level of industrial chains.
H1c:
Coordinated two-way FDI development significantly enhances the innovation capacity of industrial chains.
H1d:
Coordinated two-way FDI development significantly strengthens the resilience of industrial chains.
H1e:
Coordinated two-way FDI development significantly improves the synergistic efficiency of industrial chains.
H1f:
Coordinated two-way FDI development significantly promotes the sustainable development of industrial chains.
3.2. Indirect Impact
Efficient factor allocation maximizes overall social output and represents the optimal goal of resource deployment. In contrast, factor misallocation occurs when resources deviate from this optimal state. It is widespread in practice, constrained by institutional deficiencies such as weak regulatory frameworks, and directly hinders industrial chain modernization. Existing study found that efficient factor flow is essential to mitigating factor misallocation [48]. By linking domestic and international markets and integrating cross-border resources, coordinated two-way FDI development drives free factor mobility and optimal allocation, serving as a key pathway to correcting misallocation [49]. The specific mechanism of action is illustrated in Figure 1. From the IFDI perspective, foreign capital inflows improve the host country’s capital market structure, creating positive financial spillovers for domestic firms. This reduces their financing costs and promotes more rational capital use, ultimately enhancing capital allocation efficiency. Moreover, the entry of foreign-invested enterprises expands the labor market by increasing employment opportunities and improving job-matching efficiency through precise job design and specialized talent-matching mechanisms, directly reducing labor misallocation. From the OFDI perspective, home countries relocate “marginal industries”—such as high-pollution and energy-intensive sectors—to overseas markets through outbound investment. This releases capital, labor, and other production factors previously tied up in low-efficiency sectors. Guided by market competition, these factors shift from low-return, less competitive industries to high-productivity, strategically advantageous ones, reducing factor misallocation in an orderly manner. Moreover, international market competition incentivizes OFDI firms to optimize internal factor allocation more efficiently, further improving overall allocation efficiency.
Based on the above analysis, this study proposes the following hypothesis:
H2:
Coordinated two-way FDI development enhances industrial chain modernization by alleviating factor misallocation.
H2a:
Coordinated two-way FDI development enhances industrial chain modernization by alleviating capital misallocation.
H2b:
Coordinated two-way FDI development enhances the level of industrial chain modernization by alleviating labor misallocation.
4. Research Design
4.1. Variable Measurement
4.1.1. Dependent Variable
Industrial Chain Modernization Level (ICM). Building on existing study, this study constructs a comprehensive evaluation index system for industrial chain modernization, as shown in Table 1 [6]. The system is assessed using both the entropy value method and the linear weighting method.

Table 1.
Comprehensive evaluation index system for industrial chain modernization.
The construction process of the indicator system is as follows:
First, the preliminary indicators undergo dimensionless processing and directional alignment. Given that the indicator system includes both absolute and relative indicators, as well as positive and negative ones, their dimensions and magnitudes vary considerably. Direct integration may lead to weight imbalances or biased results. Therefore, standardization is essential to eliminate dimensional disparities and enhance comparability across indicators. Simultaneously, directional alignment ensures a uniform optimization direction for all indicators, thereby avoiding distortion in the comprehensive evaluation. Following the principle of applying a unified normalization formula to indicators of the same attribute and maintaining a consistent mapping range across different indicator types, all indicators are scaled to the [0, 1] interval to ensure scientific rigor in the integration process. The standardization procedure is as follows:
The first category includes positive indicators, where higher values mean better outcomes. Min-Max normalization is applied to all such indicators—absolute or relative—to ensure comparability and consistency.
According to Equation (1), positive relative and absolute indicators are normalized using their extreme value ranges and scaled to the [0, 1] interval, eliminating dimensional differences and ensuring comparability.
The second category includes negative indicators, where lower values mean better outcomes. Reverse Min-Max normalization is applied to all such indicators—absolute or relative—to ensure consistent directional alignment and evaluation consistency.
According to Equation (2), negative relative and absolute indicators are standardized using their extreme values and scaled to the [0, 1] interval. This reverse Min-Max method removes dimensional differences, normalizes values, and aligns negative indicators in the same direction, preventing evaluation bias from conflicting directions.
Second, this study conducts correlation analysis and indicator screening. To mitigate information redundancy caused by high intercorrelations among indicators within the same criterion layer, Spearman correlation analysis is performed on the primary indicators standardized using the Min-Max method, with an absolute correlation coefficient threshold of 0.8. Indicators exceeding this threshold are excluded. Correlation coefficients for selected indicators are shown in Table 2. The analysis shows that the correlation coefficients between V10 and V11, V12 and V13, V12 and V14, V15 and V16, and V19 and V21 are 0.837, 0.899, 0.979, 0.823, and 0.936, respectively—all above the threshold—indicating substantial multicollinearity that necessitates further indicator screening. V10, an absolute measure of electronic information industry scale, has limited capacity to reflect technological integration, whereas V11, a relative indicator, better captures digital empowerment; thus, V11 is retained and V10 excluded. V12 reflects R&D personnel density, collaboration efficiency, and sustained innovation, showing stronger links to innovation outputs than funding-based indicators. V13 and V14, though measuring capital investment, are affected by management efficiency and equipment procurement, weakening their accuracy in representing innovation input; therefore, V12 is retained. V15, with standardized criteria and rigorous review, accurately captures core technological value and global deployment, closely aligning with high-quality innovation outputs. V16 is distorted by transaction authenticity issues and policy subsidies, leading to inaccurate measurement of technological value; hence, V15 is retained and V16 excluded. V21 covers China’s high R&D, technology-intensive industries, reflecting high-tech development comprehensively and aligning with OECD standards for strong international comparability. V19 reflects China-specific statistical definitions, limiting global comparability; therefore, V21 is retained and V19 excluded.
Table 2.
Partial Spearman correlation matrix.
Third, this study conducts discriminant ability analysis and indicator screening. This analysis assesses each indicator’s contribution to measuring industrial chain modernization over time, with effectiveness evaluated by calculating the internal consistency coefficient. Following established research standards, indicators with a coefficient above 2 are excluded; others are retained [50]. The results show that thirteen indicators—V4, V7, V8, V20, V23, V30, V31, V33, V36, V37, V38, V39, and V40—exceed this threshold and are therefore removed during screening.
Fourth, this study conducts rational screening and analysis of the indicators. Based on correlation and internal consistency coefficient analyses, redundant or poorly discriminative indicators are removed, and an initial evaluation index system for industrial chain modernization is established. However, relying solely on statistical criteria may overlook the economic meaning of indicators, risking the exclusion of key variables with practical significance. Therefore, building on the quantitative screening results, this study integrates theoretical logic with practical representativeness to rigorously assess the indicators and reintroduces seven critically important ones: V23, V31, V36, V37, V38, V39, and V40. The reasons for re-including the above indicators are detailed in the Supplementary Materials.
It is worth noting that the specific industry classifications for productive services and strategic emerging industries in the indicator system are based on existing relevant studies [51,52]. Moreover, the measurement approaches for industrial structure rationalization [53], industrial structure upgrading [54], and industrial synergy and agglomeration [55] have been derived from well-established models in the extant studies.
4.1.2. Independent Variable
Coordinated two-way FDI development Level (OICit). Existing research confirms that there are interactive and synergistic effects between IFDI and OFDI [30,34]. Concurrently, given that both IFDI and OFDI may exhibit low values coupled with high coupling degrees, the coordination level between the two is further considered based on the coupling degree. The following equations are used to compute the coupling degree between two-way FDI and the level of coordinated two-way FDI development:
In Equation (3), Cit(IO) denotes the degree of coupling between two-way FDI, while OICit indicates the level of coordinated development. A higher OICit value signifies a stronger coordination between the inward and outward components of FDI, and conversely, a lower value indicates weaker coordination. To ensure data consistency, all values have been adjusted using annual exchange rates. Moreover, given that IFDI and OFDI are considered equally important in this study, their respective weights, and , are both set to 0.5. The moderating coefficient , informed by established scholarly research, is assigned a value of 2.
4.1.3. Mechanism Variables
Consistent with the preceding theoretical analysis, coordinated two-way FDI development enhances the level of industrial chain modernization through the following channel: it improves factor allocation—specifically capital and labor—which in turn promotes industrial chain modernization. The capital misallocation index (CMit) and the labor misallocation index (LMit) are constructed based on established research [48,56]. The specific calculation formulas are as follows:
In Equation (4), and denote the price distortion coefficients for capital and labor, respectively. Si represents the proportion of total output accounted for by regional output. From the above equation, the key to estimating the capital misallocation index (CMit) and labor misallocation index (LMit) lies in estimating separately the capital output elasticity () and labor output elasticity (). To estimate the output elasticities, this study applies the Cobb–Douglas production function under the assumption of constant returns to scale. After taking the natural logarithm of both sides of the production function and incorporating controls for individual and time effects, the resulting model is specified as follows:
In Equation (5), the output variable (Yit) is denoted by the GDP of each region, using 2013 as the base year. GDP deflators are used to adjust GDP figures for other years to constant 2013 prices. Labor input (Lit) is measured by the average annual employment in each region. Capital input (Kit) follows existing research [56]. Given significant regional socioeconomic disparities, a varying-coefficient panel model is used to estimate Equation (5) using relevant data from China’s 30 provinces from 2013 to 2023 [48]. After obtaining regional factor output elasticities, the capital misallocation index (CMit) and labor misallocation index (LMit) are calculated using Equation (4), and the factor misallocation index (FMit) is derived as their arithmetic mean. A higher FMit value indicates more severe misallocation, whereas a lower value indicates less severe misallocation.
4.1.4. Control Variables
Population density (densityit) is measured as the natural logarithm of the total population at year-end relative to the region’s administrative area. Government support (govit) is defined as the ratio of science and technology expenditure to total general budget expenditures. Resident income (incomeit) is represented by the natural logarithm of per capita disposable income. Labor costs (wageit) are captured by the natural logarithm of average wages in urban employment. The structure of enterprise property rights (prsit) is calculated as the ratio of total assets held by state-controlled industrial enterprises to those of all industrial enterprises above the designated size. Aging (agingit) is measured as the percentage of the population aged 65 and over relative to the total population.
4.2. Data Description
Based on the principles of data availability and consistency, this study selected data from 30 provinces (municipalities and autonomous regions) in China from 2013 to 2023 as the research sample. The sample excludes the Tibet Autonomous Region, the Hong Kong and Macao Special Administrative Regions, and the Taiwan region. The rationale for excluding the aforementioned regions is as follows: for the Tibet Autonomous Region, some industrial chain-related statistical indicators have periodic gaps, and its statistical definitions are inconsistent with those adopted by other provinces. Including this region in the sample would compromise the temporal continuity and cross-regional comparability of the panel data, which in turn would undermine the validity of the model’s estimates. As for the Hong Kong and Macao Special Administrative Regions, they operate with independent economic systems and statistical frameworks. Compared with mainland China, there are systematic discrepancies in their GDP calculation methods and industrial classification standards, making them incompatible with the sample’s research framework. Incorporating them directly into the sample would undermine the consistency of variable definitions, measurement units and statistical standards, thereby compromising the robustness of the model. As an inseparable part of China, Taiwan’s industrial chain data has yet to achieve uniformity with the mainland in terms of statistical definitions, update frequency, and classification methods. This results in low data availability and comparability, making it difficult to meet the basic requirements for panel data analysis.
Research data were obtained from the following four sources: (1) Official platforms and government authorities, including the Information Network of the Development Research Center of the State Council, the National Intellectual Property Administration, the China Enterprise Confederation, the World Brand Lab, and the National Administrative Division Information Inquiry Platform; (2) Statistical yearbooks, such as the China Environmental Statistical Yearbook, China Environmental Yearbook, China Industrial Statistical Yearbook, China High-Tech Industry Statistical Yearbook, China Science and Technology Statistical Yearbook, China Labor Statistical Yearbook, China Electronic Information Industry Statistical Yearbook, China Information Industry Yearbook, China Statistical Yearbook, and provincial-level statistical yearbooks; (3) Specialized bulletins, specifically the Statistical Bulletin of China’s Outward Direct Investment; (4) Additional sources, including geographic coordinates of provincial capitals extracted from Baidu Maps. Given the temporal proximity of 2022 and 2023, a stable macroeconomic environment, minimal fluctuations in indicators of industrial chain modernization, and strong temporal continuity, this study uses data from the previous year to impute a small number of missing values for 2023. Key variable descriptive statistics are presented in Table 3.
Table 3.
Descriptive statistics.
4.3. Model Setting
4.3.1. Benchmark Regression Model
The present empirical study seeks to examine the impact mechanism through which coordinated two-way FDI development acts on industrial chain modernization. To address this core research question and empirically test the previously proposed research hypotheses, this study constructs the following baseline regression model:
In Equation (6), i = 1, 2, …, 30 denotes the cross-sectional unit of the sample; t = 2013, 2012, …, 2023 denotes the temporal unit of the sample. ICMit represents an indicator of the industrial chain modernization level, while OICit represents an indicator of the coordinated two-way FDI development. Xijt is a set of control variables. ui represents the fixed effects for provinces, while vt signifies time fixed effects. is a stochastic disturbance term.
4.3.2. Mechanism Test Model
To verify the mechanism through which coordinated two-way FDI development improves factor allocation (capital and labor) and thereby boosts industrial chain modernization, we adopt a mediating effect model based on existing research [57].
In Equation (7), Mit denotes the mediating variable, which specifically encompasses factor misallocation (FMit), labor misallocation (LMit), and capital misallocation (CMit). All other variables are defined consistently with Equation (6).
4.3.3. Gray Correlation Model
To further examine the heterogeneous effects of coordinated two-way FDI development across different investment types and industry sectors on industrial chain modernization, this study applies a gray correlation model for the analysis. The steps involved in the gray correlation model are as follows.
Identify the reference sequence and the comparative sequence. The present study employs the national industrial chain modernization level from 2013 to 2023 as the reference series, and the coordinated two-way FDI development across different investment types (SS, SN, NN, NS) and 18 sub-sectors as the comparison series.
Dimensionless processing. Perform dimensionless processing by averaging the reference sequence and comparison sequence, then calculate the two-level minimum difference and two-level maximum difference for each sequence, namely:
In Equation (8), a is the minimum difference between the two levels and b is the maximum difference between the two levels.
Compute the correlation coefficient. Based on the correlation coefficient formula, the correlation coefficient matrix is derived, and the gray relational degrees for different investment types and industry subsectors are subsequently calculated as follows:
In Equation (9), represents the gray correlation coefficient that exists between the reference sequence and the comparison sequence. is the resolution coefficient, which is generally 0.5, and is the gray relation degree.
Gray correlation degree classification. Following established research, the gray correlation degree is categorized into four levels: weak, moderate, strong, and extremely strong [58].
5. Empirical Results
5.1. Benchmark Regression
Column (2) of Table 4 presents the regression results after incorporating control variables and accounting for both provincial and time fixed effects. The results show that the regression coefficient of OIC is statistically significant and positive, indicating that OIC exerts a significant positive impact on ICM. As shown in Table 5, we further report the regression results of OIC on the various sub-dimensions of industrial chain modernization. The results in each column of the table demonstrate that the regression coefficients of OIC are all significantly positive, proving that OIC exerts a significant promoting effect on each sub-dimension of industrial chain modernization. Combining the benchmark regression results in Table 4 with the dimension-specific results in Table 5, we find that coordinated two-way FDI development significantly promotes not only the overall level of industrial chain modernization but also each of its sub-dimensions. This offers direct empirical support for the main hypothesis H1 and its sub-hypotheses H1a to H1f.
Table 4.
Benchmark regression results.
Table 5.
Regression analysis results across dimensions.
5.2. Robustness Test
Building upon the aforementioned benchmark regression, to validate the robustness of the conclusion that coordinated two-way FDI development significantly improves industrial chain modernization, this study conducts robustness tests using the following approaches. First, the dependent variable is replaced. Principal component analysis is employed to re-measure the level of industrial chain modernization across provinces. To facilitate intuitive comparisons of differences in industrial chain modernization levels across years and regions, the results of the principal component analysis are standardized following established research methodologies and used as a substitute indicator for measuring industrial chain modernization [59]. Second, an alternative estimation method is employed. Given that industrial chain modernization is valued within the range [0, 1], a panel Tobit model is employed to rerun the regression, thus ensuring the reliability of the research results. Third, a 1% tail trimming is applied. Fourth, samples of two types of special administrative divisions are excluded. Given their unique institutional and administrative characteristics, separate regression analyses are conducted by excluding each type of region individually. The results in Table 6 show that the robustness checks are largely consistent with the benchmark regression results, further confirming the reliability and robustness of the findings.
Table 6.
Robustness test results.
5.3. Endogeneity Test
Taking into account potential endogeneity issues in the benchmark regression, such as omitted variables or bidirectional causality, this study employs the two-stage least squares (2SLS) approach to re-estimate the model. For this purpose, two instrumental variables are selected: the degree of terrain undulation (IV1) and the degree of proximity to overseas markets (IV2). As a natural geographic variable, terrain undulation (IV1) is exogenous; meanwhile, it acts indirectly on the coordinated development of two-way FDI by influencing transportation costs and infrastructure development, thereby satisfying the correlation condition. Overseas market proximity (IV2), on the other hand, reflects a region’s ease of access to overseas markets—this ease of access constitutes a natural advantage for attracting IFDI and promoting OFDI, thereby satisfying the correlation condition. Furthermore, overseas market proximity is mainly determined by geographic factors, and thus also satisfies the exogeneity condition. Following established research, this study calculates overseas market proximity as follows [60]:
In Equation (10), Q denotes the set of coastal provinces. disii denotes the distance from the coastal provinces to the coastline, areai represents the area of the administrative region of province i, and disij is the straight-line distance from the inland province to the nearest coastal province, which is calculated based on the latitude and longitude of the location of the people’s government of each province. Given that terrain undulation (IV1) and overseas market proximity (IV2) are both time-invariant indicators, existing literature suggests that exchange rates are closely correlated with regional openness. Therefore, this study constructs the product terms of terrain undulation and exchange rates, and of overseas market proximity and exchange rates, as the final instrumental variables used in this study.
As shown in column (1) of Table 7, the impact of terrain undulation (IV1) and overseas market proximity (IV2) on OIC aligns with expectations, with statistical significance at the 10% and 1% levels, respectively. This indicates that the instrumental variables selected in this study possess strong explanatory power for OIC and satisfy the correlation condition. Meanwhile, Column (2) of Table 7 shows that the Kleibergen-Paap rk Wald F statistic exceeds the Stock-Yogo critical value at the 10% significance level, indicating that the instrumental variables are not subject to weak identification. The Kleibergen-Paap rk LM statistic is significant at the 5% level, confirming that the model is identified and passes the underidentification test. The Hansen J-test statistic is 1.3510 (p-value = 0.2451), which fails to reject the null hypothesis of joint exogeneity of the instrumental variables at conventional significance levels, thereby satisfying the overidentification restriction. Together, these results confirm that the selected instrumental variables meet the exogeneity requirement. Further analysis of Table 7 shows that the regression coefficient of OIC is significantly positive. These endogeneity test results are consistent with the benchmark regression findings, thereby reaffirming H1.
Table 7.
Endogeneity test results.
5.4. Heterogeneity Test
5.4.1. Regional Heterogeneity
The impact of coordinated two-way FDI development on industrial chain modernization varies regionally due to differences in soft environments and hard infrastructure. This study examines whether geographical heterogeneity leads to heterogeneous effects. The sample is divided into coastal/border and inland regions based on China’s geography and resource endowments, using an empirically validated classification scheme [61]. Given the Belt and Road Initiative’s advancement, the study also assesses whether its dividends generate differential impacts on coordinated FDI development and industrial chain modernization. Based on official policies and an established academic framework [62], the sample is further split into Belt and Road and non-Belt and Road regions. Columns (1) and (2) of Table 8 show larger OIC regression coefficients on ICM in coastal and border regions, indicating a stronger effect. Fisher’s Permutation Test confirms these coefficient differences are significant at the 10% level. Columns (3) and (4) reveal that OIC has a more pronounced effect on ICM in Belt and Road regions, with inter-group differences significant at the 10% level. This is because coastal, border, and Belt and Road regions have better soft environments and more advanced hard infrastructure, enabling them to absorb knowledge and technology spillovers from coordinated two-way FDI development and thus advance local industrial chain modernization.
Table 8.
Results of heterogeneity analysis.
5.4.2. Ownership Structure Heterogeneity
Corporate ownership structure is prone to influence enterprises’ foreign investment decisions and their capacity to attract foreign capital. To explore the heterogeneous impacts of the coordinated development of two-way FDI on the modernization level of industrial chains across different ownership structures, this study divides the sample according to the proportion of state-owned equity, using the mean value as the threshold. Columns (5) and (6) of Table 8 show that the regression coefficients of OIC on ICM are larger in regions with a lower proportion of state-owned enterprises, indicating a stronger promotional effect. Moreover, the coefficient difference between the two groups is significant at the 10% level, confirming a meaningful disparity across subsamples. Regions with low state-owned equity shares typically have greater innovation and technological R&D advantages, enabling deep technological cooperation with foreign-invested enterprises to jointly develop new technologies and products, thus advancing industrial chain modernization. Meanwhile, they tend to target developed regions for outward investment, facilitating access to advanced technologies and accelerating local industrial chain modernization.
5.5. Mechanism Test
This study uses factor misallocation (FMit), labor misallocation (LMit), and capital misallocation (CMit) as mediating variables and employs a two-way fixed-effects model based on Equation (7) for empirical analysis. Columns (1) to (3) of Table 9 report the results. As shown, when FMit and LMit are the dependent variables, the regression coefficients of OIC are statistically significant and negative, indicating that OIC effectively reduces regional factor misallocation, particularly labor misallocation. Therefore, by alleviating factor misallocation—especially labor misallocation—OIC promotes industrial chain modernization. When CMit is the dependent variable, however, the OIC coefficient, though negative, is not statistically significant, suggesting a limited role of OIC in mitigating capital misallocation.
Table 9.
Mechanism test results.
To further validate the robustness of the mediating mechanism, this study employs the bias-corrected Bootstrap method to re-estimate the indirect effects of the mediating variables, and the results are presented in Table 10. Specifically, bias-corrected 95% confidence intervals are generated using 5000 bootstrap replications. The results indicate that when FMit and LMit act as mediating variables, the confidence intervals for their indirect effects do not include zero, thus confirming their significant mediating roles in the mechanism linking OIC to ICM. In contrast, when CMit is the mediating variable, its confidence interval includes zero, indicating an insignificant mediating effect. Equation (7) is re-estimated using the Driscoll/Kraay method to address heteroskedasticity, cross-sectional dependence, and serial autocorrelation. Results are shown in Columns (4) to (6) of Table 9. These estimates demonstrate that, after accounting for potential common error structures, OIC exerts a statistically significant negative effect on FMit, LMit, and CMit, thereby reinforcing the earlier findings. Overall, H2, H2a, and H2b are empirically supported.
Table 10.
Bias-corrected Bootstrap test results.
6. Further Analysis
6.1. Impact of Different Investment Types
In general terms, there are two primary investment methodologies: downward-gradient and reverse-gradient investment. Specifically, downward-gradient investment is defined as the flow of investment towards countries (regions) with an economic development level similar to or lower than that of the home country, with the aim of acquiring resources and expanding markets. Conversely, reverse-gradient investment is defined as the flow of investment towards countries (regions) with higher levels of economic development, with the aim of acquiring advanced technologies. As China’s “bringing in” and “going global” strategies deepen, the effects of downward-gradient and reverse-gradient investment patterns on industrial chain modernization may differ. This study examines the impact of various forms of two-way FDI on industrial chain modernization. To achieve this objective, two-way FDI is classified into four coupled and coordinated development models based on the gradient-based categorization framework [40]. The classification system is based on the gradient direction of IFDI and OFDI, with the respective abbreviations defined by a two-letter code. The first letter denotes the gradient direction of IFDI, and the second letter denotes that of OFDI (where “S” stands for downward-gradient investment and “N” stands for reverse-gradient investment). The four models are detailed as follows: downward-gradient IFDI coupled with downward-gradient OFDI (SS); downward-gradient IFDI coupled with reverse-gradient OFDI (SN); reverse-gradient IFDI coupled with reverse-gradient OFDI (NN); reverse-gradient IFDI coupled with downward-gradient OFDI (NS). The following criteria are applied in this paper to the screening of OFDI host countries (regions): firstly, the Hong Kong, Macau, and Taiwan regions of China were excluded from the study. Secondly, the British Virgin Islands, the Cayman Islands, and Bermuda were excluded. Thirdly, countries (regions) with OFDI stock reaching or exceeding 1 billion US dollars for six consecutive years or more from 2013 to 2023 were selected. The final sample comprises 58 countries (regions), including 18 developed countries (regions) and 40 developing countries (regions).
To analyze the impact of coordinated development between different types of two-way FDI on levels of industrial chain modernization, a gray correlation model was employed to examine their relationship. A selection of results is presented in Table 11. As illustrated in Table 11, among the four coupled and coordinated development models of two-way FDI, the coordination of downward-gradient IFDI and reverse-gradient OFDI (SN) exhibits the highest gray relational degree with the level of industrial chain modernization. In contrast, the coordination of reverse-gradient IFDI and reverse-gradient OFDI (NN) shows the lowest gray relational degree. The remaining two models rank at intermediate levels. The underlying reason lies in the complementary nature of the drivers behind two-way FDI [35]. Regarding IFDI, downward-gradient IFDI primarily manifests as resource-seeking and efficiency-seeking investments from developed countries (regions) into China. The introduction of foreign-funded enterprises heightens competition within the domestic market, and through their technology spillover effects, contributes to modernizing industrial chains. Regarding OFDI, reverse-gradient OFDI reflect China’s pursuit of technology and markets in more developed countries (regions). This enables Chinese overseas enterprises to participate extensively in international competition, directing production factors toward strategic emerging industries and advancing industrial chain modernization.
Table 11.
Gray correlation coefficients and correlation degrees by investment types.
6.2. Impact of Different Industry Segments
This study examines the impact of coordinated two-way FDI development at the industry level on industrial chain modernization. This focus arises from difficulties in obtaining city-level data for certain specific indicators within the comprehensive evaluation framework of industrial chain modernization, as well as challenges in accessing disaggregated data on OFDI and IFDI. To address this, relevant data from 18 industries from 2013 to 2023 were collected to measure the level of coordinated two-way FDI development within these sectors. Based on this framework, a gray correlation model was applied to analyze the relationship between industry-level coordinated two-way FDI development and industrial chain modernization. A selection of results is presented in Table 12. Table 12 indicates that among the 18 examined sub-industries, the manufacturing sector achieves the highest gray correlation coefficient of 0.9207 between coordinated two-way FDI development and industrial chain modernization. In contrast, the education sector records the lowest value, at just 0.6248.
Table 12.
Gray correlation coefficient and correlation degrees by industry segments.
7. Conclusions and Policy Commendations
7.1. Conclusions
First, coordinated two-way FDI development significantly contributes to advancing industrial chain modernization. A series of robustness and endogeneity tests confirm that the results remain consistent with those obtained from the benchmark regression, thereby reinforcing the reliability and robustness of the conclusion. Second, the mechanism validation results show that coordinated two-way FDI development enhances industrial chain modernization by alleviating factor misallocation, particularly in capital and labor. Third, an analysis of regional heterogeneity reveals that the facilitative impact of coordinated two-way FDI development on industrial chain modernization is more significant in coastal and border areas, as well as in regions along the Belt and Road. Fourth, an investigation into the heterogeneity of enterprise ownership structures shows that, in regions with a low proportion of state-owned equity, coordinated two-way FDI development plays a more significant role in boosting industrial chain modernization. Fifth, further analysis reveals that, by investment type, the two-way coordinated development of downward-gradient IFDI and reverse-gradient OFDI demonstrates a high degree of gray correlation with industrial chain modernization. At the sub-sector level, coordinated two-way FDI development in the manufacturing sector exhibits a particularly strong gray correlation with industrial chain modernization.
7.2. Policy Commendations
First, building on research showing that coordinated two-way FDI development enhances industrial chain modernization, further progress depends on strengthening the circular “IFDI—OFDI—IFDI…” model and simultaneously advancing high-quality inward investment and high-level outward expansion in a balanced, mutually reinforcing manner. Regarding high-quality inward investment, provinces should use dynamic adjustments of negative lists to promote fair competition and synergy between foreign and domestic firms. To address issues like prioritizing scale over technology and low tech penetration in some regions, targeted measures should be designed and implemented based on local conditions. Specifically, efforts should focus on strengthening industrial chains by supporting leading cities such as Shenzhen and Suzhou in attracting high-end foreign investment in strategic sectors including semiconductor equipment, biopharmaceuticals, and industrial software. In terms of industrial support, local governments should use regional strengths to attract foreign investment that matches their comparative advantages. For example, Zhengzhou in Henan Province can leverage its emerging new energy vehicle cluster to attract foreign firms specializing in battery materials, strengthening the local battery supply chain and boosting domestic firms’ technological capabilities through technology spillovers. By leveraging regional resource endowments, priority should be given to attracting foreign investment in photovoltaics, hydropower, and cross-border logistics in regions with abundant clean energy or strategic border locations, thus guiding green foreign investment allocation. In pursuing high-level outward expansion, provinces should establish a diversified investment framework led by state-owned enterprises and supported by private firms, with cross-sector collaboration. To address challenges like state-owned enterprise dominance, limited private firm overseas capacity, and weak technology-driven investment, strategies should be tailored to regional corporate strengths. Specifically, state-owned enterprises should focus on regional competitive industries and shift from traditional infrastructure contractors to technology service providers, strengthening their technological leadership. To address private enterprises’ constraints—such as small scale and low risk resilience—regional overseas alliances should be formed to enable collaboration and reduce operational risks. Cross-entity coordination mechanisms should also be established to support joint ventures between state-owned and private firms, promoting resource complementarity and capability synergy.
Second, building on research showing that coordinated two-way FDI development enhances industrial chain modernization by alleviating factor misallocation, further progress requires fully leveraging the market’s decisive role in resource allocation, strengthening competition, removing administrative and institutional barriers, and enabling efficient, free flow of key production factors like capital and labor. To address labor misallocation, accelerate household registration reform and establish a unified national labor market by streamlining inter-provincial social insurance transfers, piloting residence permit access to public services in manufacturing clusters, and reducing both institutional costs and practical barriers to cross-regional labor mobility. To address capital misallocation, strengthen capital market infrastructure, explore a “Two-way FDI Supporting Industry Guidance Fund,” and direct financing to sectors like manufacturing and high-tech industries with significant two-way FDI synergies. Meanwhile, strengthen oversight of capital shifting from the real to the virtual economy, improve risk early warning and intervention mechanisms, and enhance capital allocation efficiency and real economy support.
Third, to address significant regional and ownership structure differences in coordinated two-way FDI development, a targeted approach should be adopted to enhance coordination and advance industrial chain modernization. Regarding regional heterogeneity, given that coordinated two-way FDI development in coastal, border, and Belt and Road regions plays a key role in promoting industrial chain modernization, their leading and exemplary functions should be strengthened. Specifically, on the one hand, these regions should leverage their existing two-way FDI foundations to prioritize technology-intensive IFDI and pursue reverse-gradient OFDI. This dual approach strengthens the synergy between “positive technology spillovers from IFDI” and “reverse technology spillovers from OFDI,” establishing a leading demonstration zone for industrial chain modernization. On the other hand, inland and non-Belt and Road regions should learn from these experiences, aligning with local industrial strengths and addressing structural weaknesses by prioritizing IFDI that integrates closely with domestic industrial chains. Meanwhile, enterprises there should be encouraged to cautiously pursue OFDI through minority equity stakes combined with technical cooperation, gradually building coordinated two-way FDI capacity and enhancing industrial chain modernization. Regarding ownership structure heterogeneity, regions with a lower proportion of state-owned enterprises (SOEs) are better able to leverage the benefits of two-way FDI, highlighting the need to optimize corporate ownership structures. Specifically, in SOE-dominated regions, advancing mixed-ownership reforms by introducing private and foreign capital can reduce the dampening effect of excessive state control on FDI synergies. For instance, in the equipment manufacturing sector dominated by SOEs, foreign investors can be encouraged to collaborate through “technology-for-equity” arrangements. Meanwhile, private firms should have decision-making rights in two-way FDI projects to boost market vitality and innovation.
Fourth, given significant heterogeneity across investment categories and sub-sectors in how coordinated two-way FDI development affects industrial chain modernization, further progress requires promoting downward-gradient IFDI and reverse-gradient OFDI, with a focus on strengthening synergistic two-way FDI in manufacturing sector. On the one hand, national policy supports coordinated downward-gradient IFDI and reverse-gradient OFDI, with firms engaging in both receiving tax incentives and credit access. On the other hand, in manufacturing, a targeted coordination strategy applies. The foreign investment negative list should be dynamically adjusted around critical weak links to attract high-tech firms and promote deep supply chain and technology chain integration. At the same time, domestic manufacturers should be supported in acquiring advanced technologies and market channels through overseas M&A and joint R&D.
7.3. Limitations and Future Research
Overall, this study provides a comprehensive investigation of the link between coordinated two-way FDI development and industrial chain modernization. However, from the perspectives of data availability and methodology design, several limitations must be acknowledged. First, the analysis is confined to China’s provincial level and lacks international comparisons, limiting the ability to identify common patterns and heterogeneous effects across different institutional and industrial contexts, and restricting the generalizability of the findings beyond China. Second, relying on provincial macroeconomic statistics rather than firm-level microdata prevents a comprehensive assessment of how firm-specific characteristics moderate the results, thereby limiting the analytical depth of the study. Third, the coarse data granularity prevents detailed comparison between manufacturing and services sectors. As a result, the sector-specific validity and policy implications are limited by inadequate discussion of variations in capital-labor misallocation and two-way FDI coordination paths.
The above limitations suggest three directions for future research. First, comparative studies should use more representative panel data from developed and developing countries with different FDI flows to test whether coordinated two-way FDI development promotes industrial chain modernization. Second, empirical studies should use firm-level microdata to examine how coordinated two-way FDI development improves capital and labor allocation efficiency and promotes industrial chain modernization. Third, research should compare factor misallocation between manufacturing and services sectors using sector-specific or firm-level data. Such comparisons can identify the channels through which two-way FDI reduces misallocation and assess the effectiveness of each pathway.
Supplementary Materials
The following supporting information can be downloaded at: https://www.mdpi.com/article/10.3390/su17219864/s1.
Author Contributions
Conceptualization, Y.L. (Yue Ling); methodology, Y.L. (Yue Ling) and Y.L. (Yi Li); data curation, Y.L. (Yue Ling); supervision, H.W.; writing—original draft, Y.L. (Yue Ling); writing—review and editing, Y.L. (Yue Ling), Y.L. (Yi Li) and H.W. All authors have read and agreed to the published version of the manuscript.
Funding
This research is supported by the Fundamental Research Funds for the Central Universities (Grant No.: 2025lzujbkyxs004).
Institutional Review Board Statement
Not applicable.
Informed Consent Statement
Not applicable.
Data Availability Statement
The research data can be obtained from the corresponding author upon request.
Conflicts of Interest
The authors declare no conflicts of interest.
References
- Zhang, Q.Z. New Progress, New Challenges, and New Path in the Modernization of Industrial and Supply Chains. J. Shandong Univ. Philos. Soc. Sci. Ed. 2022, 1, 131–140. [Google Scholar]
- Huo, C.H. Accelerating the Cultivation of Local ‘Chain Master’ Enterprises to Enhance the Modernisation Level of China’s Industrial Chain. Guangming Daily, 29 August 2023; p. 6. Available online: https://epaper.gmw.cn/gmrb/html/2023-08/29/nw.D110000gmrb_20230829_1-06.htm (accessed on 24 May 2025).
- Liu, Z.B. Industrial Economics Analysis of Industrial Chain Modernization. Economist 2019, 12, 5–13. [Google Scholar]
- Huang, Q.H.; Ni, H.F. Improving Industrial Basic Capacity and Industrial Chain Level: From the Perspective of Global Value Chain. Econ. Syst. Reform 2020, 5, 11–21. [Google Scholar]
- Luo, Z.W.; Meng, Y.H. Regional Industrial Base Advancement and Modernization of Industrial Chain During the 14th Five-Year Period. Reg. Econ. Rev. 2020, 1, 32–38. [Google Scholar]
- Zhang, H.; Zhang, Y.; Han, A.H. Research on the Measurement of Modernization of Industrial Chains in China. Stat. Res. 2022, 11, 3–18. [Google Scholar]
- Zheng, J.H.; Dai, W.; Ran, Z. The Way to Improve the Level of Industrial Chain Modernization in the Period of the 14th Five-Year Plan: A Case Study of Jiangsu Province. Mod. Manag. Sci. 2021, 1, 4–15. [Google Scholar]
- Liu, Z.Q.; Jia, S.T.; Wang, Z.X.; Guo, C.Y.; Niu, Y.Q. A Measurement Model and Empirical Analysis of the Coordinated Development of Rural E-commerce Logistics and Agricultural Modernization. Sustainability 2022, 14, 13758. [Google Scholar] [CrossRef]
- Liu, J.Y. Empowering the Modernization of Chinese Industrial Chains through Digital Innovation and Development: Theoretical Mechanisms and Empirical Tests. Stat. Decis. 2025, 11, 123–127. [Google Scholar]
- Chen, F.L.; Chen, A.Z. FDI Inflow and Industrial Chain’s Domestic Circulation: Theory and Empirical Evidence. J. Int. Trade 2024, 3, 15–31. [Google Scholar]
- Xing, S.M.; Wang, Z.X.; Han, C.B. Industrial Chain Efficiency and High-quality of Enterprise OFDI Development: Empirical Evidence from China. World Econ. Stud. 2024, 10, 106–120+137. [Google Scholar]
- Zhang, H.; Zhang, Y.; Liu, J.Y.; Chen, T.T. Quantitative Evaluation of China’s Industrial Chain Policy under the Goal of Industrial Chain Modernization. J. Stat. Inf. 2023, 9, 32–46. [Google Scholar]
- Meng, Q. Industrial Policy and Modernization of Industrial Chain—From the Perspective of Chain Leader Policy. Financ. Econ. 2023, 3, 93–107. [Google Scholar]
- Xing, H.; Li, M.X.; Yang, Z.J.; Gao, H.X. The Mechanism of Innovative Human Capital on the Modernization of Manufacturing Industry Chain: Based on the Empirical Test of Provincial Panel Data. East China Econ. Manag. 2023, 12, 34–45. [Google Scholar]
- Zheng, Y. Impact Mechanism of Human Capital Agglomeration on Industrial Chain Modernization: The Moderating Effect of Talent Policies. Geogr. Res. 2025, 1, 129–148. [Google Scholar]
- Zheng, W.; Luo, R.F. Can Data Element Agglomeration Promote Modernization of the Industrial Chain? The Dual Perspective of Digital Finance Development and Digital Talent Agglomeration. Ind. Econ. Res. 2024, 6, 43–55+69. [Google Scholar]
- Huo, L.; Zhang, L.Y. Research on the Modernization of China’s Industrial Chain Driven by Artificial Intelligence. J. Northwestern Univ. Philos. Soc. Sci. Ed. 2024, 4, 86–102. [Google Scholar]
- Xi, M.M.; Ni, Y.; Liu, X.Y. How Digital Transformation Promotes the Modernization of Industrial and Supply Chains: A Perspective of Structural Optimization of Industrial and Supply Chains. J. Lanzhou Univ. Soc. Sci. 2023, 4, 59–73. [Google Scholar]
- Zhang, Q.; Ren, B.P. Mechanism, Objectives, and Pathways of Digital Economy Driving Industrial Chain Modernization. J. Zhengzhou Univ. Philos. Soc. Sci. Ed. 2023, 5, 39–45+128. [Google Scholar]
- Da Silva-Oliveira, K.D.; De Miranda Kubo, E.K.; Morley, M.J.; Cândido, R.M. Emerging Economy Inward and Outward Foreign Direct Investment: A Bibliometric and Thematic Content Analysis. Manag. Int. Rev. 2021, 61, 643–679. [Google Scholar] [CrossRef]
- Caetano, R.V.; Marques, A.C.; Afonso, T.L. Can Sustainable Development Induce Foreign Direct Investment? Analysis of the Complex Inward and Outward Flows of Investment in European Union Countries. J. Knowl. Econ. 2024, 15, 9756–9783. [Google Scholar] [CrossRef]
- Huang, C.H.; Teng, K.F.; Tsai, P.L. Inward and Outward Foreign Direct Investment and Poverty: East Asia vs. Latin America. Rev. World Econ. 2010, 146, 763–779. [Google Scholar] [CrossRef]
- Huang, C.H.; Teng, K.F.; Tsai, P.L. Inward and Outward Foreign Direct Investment and Inequality: Evidence from a Group of Middle-Income Countries. Glob. Econ. J. 2016, 16, 511–538. [Google Scholar] [CrossRef]
- You, K.; Solomon, O.H. China’s Outward Foreign Direct Investment and Domestic Investment: An Industrial Level Analysis. China Econ. Rev. 2015, 34, 249–260. [Google Scholar] [CrossRef]
- Tan, B.W.; Goh, S.K.; Wong, K.N. The Effects of Inward and Outward FDI on Domestic Investment: Evidence Using Panel Data of ASEAN–8 Countries. J. Bus. Econ. Manag. 2016, 17, 717–733. [Google Scholar] [CrossRef]
- Islam, M.M.; Tareque, M.; Wahid, A.N.; Alam, M.M.; Sohag, K. Do the Inward and Outward Foreign Direct Investments Spur Domestic Investment in Bangladesh? A Counterfactual Analysis. J. Risk Financ. Manag. 2022, 15, 603. [Google Scholar] [CrossRef]
- Hanson, P. Russia’s Inward and Outward Foreign Direct Investment: Insights into the Economy. Eurasian Geogr. Econ. 2010, 51, 632–652. [Google Scholar] [CrossRef]
- Goh, S.K.; Tham, S.Y. Trade Linkages of Inward and Outward FDI: Evidence from Malaysia. Econ. Model. 2013, 35, 224–230. [Google Scholar] [CrossRef]
- Rozen-Bakher, Z. Impact of Inward and Outward FDI on Employment: The Role of Strategicasset-Seeking FDI. Transnatl. Corp. Rev. 2017, 1, 16–30. [Google Scholar] [CrossRef]
- Huang, L.Y.; Liu, D.D.; Xie, H.Q. Research on the Harmonious Development of Outward Foreign Direct Investment and Inward Foreign Direct Investment. China Ind. Econ. 2018, 3, 80–97. [Google Scholar]
- Xu, J.; Zhou, M. Research on the Coordinated Development of China’s Two-way FDI and Its Influencing Factors. Soft Sci. 2021, 5, 63–69. [Google Scholar]
- Zou, Z.M.; Chen, X. Research on the Coordinative Development Level and Influencing Factors of China’s Inter-provincial Two-way FDI—Based on the Measurement of PVAR Model and Empirical Analysis of Dynamic Panel. Explor. Econ. Issues 2021, 8, 179–190. [Google Scholar]
- Wang, Y.F.; Liao, M.; Wang, Y.F.; Malik, A.; Xu, L.X. Carbon Emission Effects of the Coordinated Development of Two-Way Foreign Direct Investment in China. Sustainability 2019, 11, 2428. [Google Scholar] [CrossRef]
- Gong, M.Q.; Liu, H.Y. The Influence of Two-way FDI Coordinated Development and Industrial Structure Evolution on Environmental Pollution in China. Int. Trade Issues 2020, 2, 110–124. [Google Scholar]
- Ma, G.C.; Yang, X.Z.; Xu, J. Two-way FDI Coordinated Development and Green Total Factor Productivity: Theoretical Framework and China’s Evidence. Explor. Econ. Issues 2022, 7, 173–190. [Google Scholar]
- Dong, F.; Zhang, Y.J.; Huang, J.H.; Liu, Y.J.; Chen, Y. Nonlinear Impact of the Coordination of IFDI and OFDI on Green Total Factor Productivity in the Context of “Dual Circulation”. Financ. Innov. 2025, 11, 99. [Google Scholar] [CrossRef]
- Huang, Y.M.; Zhang, Y.N. The Coordination of Two-way FDI and Upgrading of Industries of China in Global Value Chains. Asia-Pac. Econ. Rev. 2022, 2, 91–103. [Google Scholar]
- Song, H.; Chen, W. Can Two-way Foreign Direct Investment Promote Green Innovation Capability in Manufacturing? The Threshold Role of Intellectual Property Protection. J. Clean. Prod. 2023, 425, 139035. [Google Scholar] [CrossRef]
- Xu, Y.Z.; Ren, Z.F.; Li, Y.; Su, X. How Does Two-way FDI Affect China’s Green Technology Innovation? Technol. Anal. Strateg. Manag. 2024, 36, 3245–3264. [Google Scholar] [CrossRef]
- Dai, Q.W. The Research on the Impact of the Two-Way FDI Coupling and Coordination on China’s Green Economy Efficiency. Ph.D. Dissertation, Sichuan University, Chengdu, China, 2023. [Google Scholar]
- Research Group of Institute of Industrial Economics, Chinese Academy of Social Sciences; Zhang, Q.Z. Research on the Path of Upgrading the Modernization of Industrial Chain and Supply Chain. China Ind. Econ. 2021, 2, 80–97. [Google Scholar]
- Dunning, J.H. Explaining the International Direct Investment Position of Countries: Towards a Dynamic or Developmental Approach. Weltwirtschaftliches Arch. 1981, 117, 30–64. [Google Scholar] [CrossRef]
- Blomstrom, M.; Kokko, A. Foreign Direct Investment and Spillovers of Technology. Int. J. Technol. Manag. 2001, 22, 435–454. [Google Scholar] [CrossRef]
- Aitken, B.J.; Harrison, A.E. Do Domestic Firms Benefit from Direct Foreign Investment? Evidence from Venezuela. Am. Econ. Rev. 1999, 3, 605–618. [Google Scholar] [CrossRef]
- Li, G.Q.; Qiu, X.Y. Two-way FDI and Global Value Chain Resilience: Empirical Evidence from Cross-country Data. World Econ. Res. 2024, 5, 75–91+135. [Google Scholar]
- Tao, J.Y.; Tao, Q.Y. A Review of Research Perspective and Path Evolution of Strategic Alliance Theory. J. Cap. Univ. Econ. Bus. 2017, 3, 96–102. [Google Scholar]
- Liu, H.Y.; Nie, F. Study on the Manufacturing Industrial Hollowing-out Effect of China’s OFDI. China Ind. Econ. 2015, 4, 83–96. [Google Scholar]
- Bai, J.H.; Liu, Y.Y. Can Outward Foreign Direct Investment Improve the Resource Misallocation of China? China Ind. Econ. 2018, 1, 60–78. [Google Scholar]
- Zhou, S.; Shao, S.Q. Can Co-ordination Advancement of Two-way FDI Improve Resource Misallocation? Evidence from 285 Cities in China. PLoS ONE 2024, 19, e0304836. [Google Scholar] [CrossRef]
- Cai, W.G.; Xu, F.R. Measuring the Modernization Level of China’s Manufacturing Industry Chain. Stat. Decis. 2021, 21, 108–112. [Google Scholar]
- Chen, H.X.; Lei, J.; Guo, W.W. Research on Internal Differences and Comparative Advantages of Producer Service Industry ——Based on the Input-output Analysis of Six Major Sub-industries of Producer Service Industry. China Soft Sci. 2020, S1, 50–57. [Google Scholar]
- Wang, Q.; Wang, Z. Regional Differences in the Development of Strategic Emerging Industries and the Dynamic Evolution of Distribution. Stat. Decis. 2020, 16, 110–114. [Google Scholar]
- Gan, C.H.; Zheng, R.G.; Yu, D.F. An Empirical Study on the Effects of Industrial Structure on Economic Growth and Fluctuations in China. Econ. Res. 2011, 5, 4–16+31. [Google Scholar]
- Han, Y.H.; Huang, L.X.; Wang, X.B. Do Industrial Policies Promote Industrial Structure Upgrading? Theory and Evidence from China’s Development-oriented Local Government. Econ. Res. 2017, 8, 33–48. [Google Scholar]
- Zhang, H.; Han, A.H.; Yang, Q.L. Spatial Effect Analysis of Synergetic Agglomeration of Manufacturing and Producer Services in China. Res. Quant. Tech. Econ. 2017, 2, 3–20. [Google Scholar]
- Zhou, Z.Z.; Shi, W. Research on the Calculation of Labor Factor Distortion, Spatial and Temporal Evolution Characteristics, and Regional Differences in China. Stat. Inf. Forum 2024, 3, 14–28. [Google Scholar]
- Jiang, T. Mediating Effects and Moderating Effects in Causal Inference. China Ind. Econ. 2022, 5, 100–120. [Google Scholar]
- Liu, R.; Zhang, J.; Cai, S.Y.; Yu, Y.F.; Mao, Y. Study on the Coupled and Coordinated Relationship between New Urbanization and Urban Residents’ Quality of Life in City Clusters in the Middle Reaches of the Yangtze River. Yangtze River Basin Resour. Environ. 2023, 7, 1349–1364. [Google Scholar]
- Yang, H.M.; Jiang, L. Digital Economy, Spatial Effects and Total Factor Productivity. Stat. Res. 2021, 4, 3–15. [Google Scholar]
- Bai, J.H.; Liu, Y.Y. Financial Marketization and Enterprise Technology Innovation: Mechanism and Evidence. Econ. Manag. 2021, 4, 39–54. [Google Scholar]
- Liu, Q.; Cheng, H.Q.; Shao, L.Q.; Chen, H.B.; Liu, X.Y. Empirical Study on the Effects of Coordinated Development of Two-way FDI on Regional Green Transformation under the Carbon Peaking and Carbon Neutrality Goals: Local and Spatial Spillovers. China Soft Sci. 2024, 2, 104–112. [Google Scholar]
- Xiao, R.Q.; Shen, L.; Qian, L. Study on the Green Innovation Efficiency and Its Influencing Factors of Industrial Enterprises in Provinces along “the Belt and Road”. Soft Sci. 2020, 8, 37–43. [Google Scholar]

Disclaimer/Publisher’s Note: The statements, opinions and data contained in all publications are solely those of the individual author(s) and contributor(s) and not of MDPI and/or the editor(s). MDPI and/or the editor(s) disclaim responsibility for any injury to people or property resulting from any ideas, methods, instructions or products referred to in the content. |
© 2025 by the authors. Licensee MDPI, Basel, Switzerland. This article is an open access article distributed under the terms and conditions of the Creative Commons Attribution (CC BY) license (https://creativecommons.org/licenses/by/4.0/).