Article

Effects of Urban Greening Renewal on Local Ecological Benefits: A Case Study of Residential Green Space

1
School of Architecture, Xi’an University of Architecture and Technology, Xi’an 710055, China
2
UniSA-STEM, University of South Australia, Mawson Lakes Campus, Adelaide 5095, Australia
*
Author to whom correspondence should be addressed.
Sustainability 2025, 17(21), 9855; https://doi.org/10.3390/su17219855
Submission received: 9 October 2025 / Revised: 28 October 2025 / Accepted: 29 October 2025 / Published: 5 November 2025

Abstract

The rapid urbanization process has led to deteriorating air quality and elevated carbon dioxide levels, highlighting an urgent need for effective urban greening strategies. This study aims to quantify and compare the air pollution removal (APR), carbon sequestration (CS), and oxygen production (OP) capacities of different green space renovation plans in residential areas of a typical arid to semi-arid city in Northwest China. Using the i-Tree Eco model, we simulated the ecological benefits of various vegetation configurations. Our results demonstrated that tree species selection is a critical determinant of ecological performance. Ligustrum (Privet), Magnolia, and Populus (Poplar) were identified as the predominant species, exhibiting distinct effectivities in providing these services. Specifically, we found that species with high APR and CS efficiencies should be prioritized for green space renewal in this water-limited region. Correlation analysis revealed that both APR and CS capacities were most strongly correlated with vegetation greenness, followed by species identity. In contrast, the planning layout of vegetation showed no significant correlation with greenness. For OP, tree species was the most influential factor, ahead of vegetation quantity. This study provides a scientific basis for optimizing plant species selection and spatial arrangement in urban greening projects, offering practical guidance for enhancing ecological benefits in arid and semi-arid cities undergoing renewal.

1. Introduction

Accelerated global urbanization intensifies environmental pressures, including air pollution and elevated CO2 levels [1,2]. Cities are now focal points for both causing and mitigating these challenges [3,4,5]. Consequently, ensuring urban ecological security has emerged as a cornerstone for developing sustainable and livable cities [6,7,8].
In this context, urban vegetation is widely recognized as a vital natural solution for enhancing ecological efficiency [9,10]. Extensive research has demonstrated that vegetation provides multifaceted environmental, health, and social benefits [11,12], with air pollution removal (APR), carbon sequestration (CS), and oxygen production (OP) being among the most significant ecological services [10,13]. These functions are primarily driven by plant physiological processes, such as photosynthesis and respiration, which enable the uptake of pollutants and carbon dioxide while releasing oxygen [14,15,16]. However, the effectiveness of greenery is not uniform. It depends heavily on species traits, canopy structure, and spatial configuration [17,18]. This is particularly relevant in residential areas, which form the backbone of urban green infrastructure [18,19]. While tools like the i-Tree Eco model can quantify these ecosystem services [10,20], a significant knowledge gap remains. This knowledge gap is particularly critical in arid and semi-arid regions. Urban greening in these areas faces severe challenges, including chronic water scarcity, soil moisture deficits, and high evapotranspiration rates. These environmental stressors can severely limit plant growth, survival, and physiological activity, thereby constraining the delivery of ecosystem services and rendering general greening guidelines-often developed for water-sufficient temperate climates-ineffective or even unsustainable. Consequently, we lack tailored, quantitative studies for guiding green space renovation at the community-level in such challenging environments, including Northwest China.
Quantifying these ecosystem services requires robust methodological tools. The i-Tree Eco model has been internationally applied to assess APR, CS, and OP at various scales, from individual trees to entire cities and regions [10,20]. For instance, Cimburova et al. (2020) utilized i-Tree Eco to evaluate the potential of existing urban tree inventories [20], while Yao et al. (2022) employed it to compare the air pollutant removal efficiency under different green infrastructure designs [19]. While these and numerous other studies validate the model’s utility, their findings are inherently context-dependent. The performance rankings of tree species and the absolute magnitude of benefits they report are shaped by local climates, which are predominantly humid or temperate. It remains unclear to what extent these findings can be extrapolated to arid and semi-arid cities, where water availability becomes a primary filter for species selection and a limiting factor for physiological performance. We anticipate both commonalities (e.g., the general superiority of large-canopy, fast-growing species for CS) and critical differences (e.g., a re-prioritization towards drought-tolerant species for APR) in our findings compared to studies from other climatic zones [21,22,23]. Despite the model’s widespread application, a critical research gap persists. There remains a notable scarcity of studies focusing on the community-level (e.g., residential areas) greening renewal in arid and semi-arid regions, such as Northwest China. This gap is particularly pressing given the large-scale urban renewal initiatives currently underway in China, which often prioritize the renovation of residential green infrastructure.
The city of Xi’an, a typical arid-climate metropolis in Northwest China undergoing extensive urban renewal, provides an ideal context for this investigation. While the greening of old residential areas is a key renewal strategy, a fundamental challenge persists: the optimization of limited green spaces to maximize their ecosystem service provisioning under stringent environmental constraints. This context gives rise to the overarching research question of this study: How do the key design components of urban green spaces—namely, species selection, spatial layout, and structural configuration—collectively modulate their capacity to provide critical ecosystem services (specifically APR, CS, and OP) in arid urban environments? To systematically address this core question, we employ a locally calibrated i-Tree Eco model in a series of interconnected investigations. Our specific objectives are threefold: (1) to quantify the service capacities of dominant tree species for APR, CS, and OP; (2) to evaluate how these benefits are influenced by variations in green space layout; and (3) to synthesize these findings into science-driven design strategies for ecological renewal. By linking discrete design choices to integrated ecosystem outcomes, this research not only provides a practical guide for sustainable urban renewal in Northwestern China but also contributes a conceptual framework for understanding the multifunctionality of urban green infrastructure in arid regions.

2. Methods and Study Areas

2.1. Study Area

This study was conducted in Xi’an, the capital of Shaanxi Province, situated in the central-western region of China (107°40′–109°49′ E, 33°42′–34°45′ N) (Figure 1). The city resides in the Guanzhong Plain, a topographically distinct basin bounded by the elevated Loess Plateau to the north and the majestic Qinling Mountains to the south, with the Wei River flowing through its northern part. This unique topography significantly influences the city’s local climate and ecological patterns.
Climatically, Xi’an is characterized by a temperate semi-humid continental monsoon climate, under the Köppen climate classification of Cwa. It features four distinct seasons. The mean annual temperature is 13.5 °C, and the mean annual precipitation is 506.1 mm, both of which exhibit a general increasing trend from north to south. Notably, potential evaporation often exceeds precipitation, indicating water constraints typical of semi-arid regions, which is a critical factor for urban vegetation planning.
As a major metropolitan hub, Xi’an had a permanent population of approximately 12.99 million in 2022, including about 9.3 million urban residents. The rapid expansion and intensive urbanization have placed considerable pressure on the urban environment, prompting a focus on enhancing ecological services through urban renewal.
Our investigation focused on the six central urban districts of Lianhu, Beilin, Xincheng, Yanta, Weiyang, and Baqiao, which represent the core built-up area of the city. A total of 431 residential communities within these districts were selected as sampling sites using a stratified random sampling method. The stratification was based on two criteria: (1) the construction era of the community (pre-1990, 1990–2000, post-2000) to capture different urban development phases, and (2) the district location to ensure spatial coverage. Within each stratum, communities were randomly selected from a comprehensive city roster. The selection criteria ensured a representative coverage of communities of varying construction eras, architectural densities, and initial greening designs. The green space rate within these sampled communities ranged from 11% to 35%. The predominant tree species identified in these green spaces included Prunus serrulata (Sakura), Ligustrum lucidum (Privet), Magnolia denudata (Yulan Magnolia), and Pinus tabuliformis (Chinese Red Pine), which formed the primary basis for assessing ecological benefits.
From this larger sample, two communities—No. 128 and Longfu—were selected as detailed case studies. Their selection was intentional rather than random, aimed at capturing contrasting and representative scenarios: Community No. 128 exhibited relatively higher species diversity, while Longfu Community was characterized by species monotony. This contrast allows for a more insightful analysis of the impact of species composition. Within these two communities, five specific plots (Spaces 1–3 in No. 128; Spaces 4–5 in Longfu) were identified for renovation simulation. These plots were chosen because they represented the most common types of degraded or underutilized spaces found in our survey (e.g., central activity areas with senescent trees, parking lots, linear strips with poor growth), thereby maximizing the practical relevance of our renovation strategies.

2.2. Research Data

In this study, the data were used mainly including three types. Firstly, A high-resolution satellite image from the SPOT-7 sensor (CNES, Paris, France) was acquired to extract the spatial layout of the residential areas (https://www.gscloud.cn/, accessed on 27 March 2022). The image, with a spatial resolution of 1.5 m, was obtained from the Geospatial Cloud Platform for the year 2022. After performing necessary pre-processing steps, including radiometric calibration and atmospheric correction, the image was used to generate a land use and land cover map through a supervised classification approach. This map was primarily employed to delineate community boundaries and to identify and categorize the internal green space types, which served as a fundamental layer for subsequent spatial analysis. Secondly, Comprehensive field surveys were conducted between June and September in 2022 to collect detailed attributes of each tree and shrub within the sampled communities. The measured parameters included: Tree species, Tree height, Grown width, Diameter at breast height, Health status. Finally, Classification of Green Space Types, based on the spatial configuration and functional characteristics derived from the remote sensing imagery and field verification, the green spaces within the residential areas were classified into four distinct types:
Type A: Integrated—Areas containing a combination of Central Green Space, Cluster Green Space, and Linear Green Space.
Type B: Central-Linear—Areas dominated by a Central Green Space with supporting Linear Green Spaces.
Type C: Cluster-Linear—Areas consisting primarily of Cluster Green Spaces and Linear Green Spaces.
Type D: Linear-dominant—Areas where green space is predominantly composed of Linear Green Spaces.
Collectively, these three data sources—remote sensing imagery, field surveys, and the derived green space typology—were integrated to form a comprehensive and multi-layered data foundation. This synergistic data integration ensures that the subsequent analyses and conclusions are grounded in both robust spatial representation and accurate ecological measurements, thereby establishing a reliable basis for evaluating ecosystem services in the studied residential areas.

2.3. i-Tree Model

The ecological benefits of residential green spaces, specifically air pollution removal (APR), carbon sequestration (CS), and oxygen production (OP), were quantified using the i-Tree Eco 5.0 model (USDA Forest Service). This widely recognized and peer-reviewed model suite employs established biogeochemical and atmospheric dispersion algorithms to simulate ecosystem services based on tree inventory data and local environmental conditions [10,16,24].
In this study, the field-measured parameters for each tree—including species, diameter at breast height (DBH), tree height (TH), crown width (CW), and health status—served as the primary inputs for the model. To ensure the model’s applicability to the local tree population in Xi’an, a critical local calibration was performed. For the dominant species (e.g., Populus spp., Robinia pseudoacacia, Ligustrum lucidum), which collectively accounted for over 85% of the inventoried trees, we replaced the model’s default allometric equations with species-specific equations derived from peer-reviewed studies conducted in similar semi-arid climatic regions of China [25]. This calibration is essential for accurate estimation of tree biomass and, consequently, carbon storage and sequestration.
Additionally, to enhance the accuracy of the simulations, localized hourly meteorological data and air pollution concentration data for the base year 2022 were incorporated into the model. These datasets were obtained from the Xi’an Meteorological Bureau and the Municipal Ecological Environment Bureau. The meteorological data included: temperature (annual mean: 13.5 ± 9.8 °C), relative humidity (annual mean: 68 ± 15%), precipitation (annual total: 506.1 mm), wind speed (annual mean: 1.8 ± 0.7 m/s), and solar radiation. The air pollution data included hourly concentrations of PM2.5 (annual mean: 45.2 ± 32.1 μg/m3), PM10 (annual mean: 82.5 ± 45.7 μg/m3), O3, NO2, and SO2. The integration of these high-resolution, locally-specific environmental parameters is crucial for reliably simulating deposition processes and plant growth.
The core calculations within i-Tree Eco are grounded in empirical relationships and process-based models. For instance, carbon storage is estimated based on allometric equations that relate DBH and tree species to biomass, while carbon sequestration is derived from estimated annual growth rates. Air pollution removal is simulated by calculating the dry deposition velocity of gaseous and particulate pollutants onto leaf surfaces, which is a function of pollutant concentration, leaf area index, and meteorological conditions. The specific equations and algorithms utilized for calculations are summarized in Table 1.
To integrate the three distinct ecosystem services (APR, CS, OP) into a single, comparable metric for overall performance assessment, we formulated a composite Ecosystem Service Performance Index (ESPI). The calculation proceeded in two steps. First, each service value for a given green space was normalized to a 0–1 scale using min-max normalization relative to the maximum value observed across all our study sites, as per Equation (1):
S i , n o r m = ( S i S m i n ) / ( S m a x S m i n )
where S i is the raw value of APR, CS, or OP. Second, the composite ESPI was computed as the arithmetic mean of these three normalized values, as defined in Equation (2):
E S P I = ( A P R n o r m + C S n o r m + O P n o r m ) / 3
This approach assigns equal weight to each service, providing a balanced and dimensionless measure of multifunctional performance, which was used in the subsequent correlation analysis.
To provide an on-site verification of the modeled APR, we conducted an empirical validation exercise. Leaf samples from three high-APR species (Catalpa bungei, Populus spp., and Fraxinus chinensis) were collected using a standardized protocol. The particulate matter (PM2.5 and PM10) deposited on the leaf surfaces was measured via the leaf-washing and filtration-gravimetric method [26]. The results demonstrated a strong and significant positive correlation (R2 = 0.81, p < 0.01) between the model-predicted APR values and the empirically measured PM load per unit leaf area, thereby providing robust, ground-truthed support for the model’s output.
The specific equations and algorithms utilized for calculations are summarized in Table 1, and the derivation of the composite ESPI is defined above. In summary, the integrated application of the i-Tree Eco model, locally calibrated parameters, ground-truthed biometric data, on-site verification, and localized environmental parameters provides a robust and replicable framework for quantifying the ecosystem services of urban green spaces, thereby establishing a scientifically sound basis for the findings of this study.

2.4. Uncertainty and Sensitivity Analysis

To assess the robustness of the i-Tree Eco model outputs and identify the primary sources of uncertainty, we conducted a two-tiered analysis following the guidance of [27]. First, a global sensitivity analysis was performed using the Morris elementary effects method [28]. This method is computationally efficient and well-suited for identifying the most influential parameters in a complex model. We tested the sensitivity of the key output variables—total PPM2.5 removal, carbon storage, and oxygen production—to variations in five critical input parameters: DBH, TH, CW, LAI, and background pollution concentration [PM2.5]. Each parameter was varied within a plausible range (±20% from its baseline value) based on estimated measurement errors and natural variability. Second, a Monte Carlo simulation with 3000 iterations was implemented to quantify the overall uncertainty in the estimated ecosystem services for each green space type [29]. In each iteration, values for DBH, LAI, and [PM2.5] were randomly sampled from their respective probability distributions (assumed to be normal distributions with means equal to the measured values and standard deviations derived from our field data and literature [30]). The output distributions from these iterations were used to calculate the mean value and the 95% confidence interval for each ecosystem service metric.

2.5. Simulated Parameter Settings

To assess the ecological benefits under different greening scenarios, a simulation framework was established using the i-Tree Eco module (Figure 1). The parameterization was carefully designed to reflect the specific conditions of residential areas in Xi’an, with key justifications detailed below.
Biomass Adjustment: Recognizing that allometric equations derived from forest trees tend to overestimate biomass for open-grown urban trees [20,25], a correction factor of 0.8 was applied to the calculated biomass of trees in the model, consistent with previous urban ecology studies. Furthermore, for the conversion of biomass to carbon storage, a standard carbon fraction of 0.5 was used, as recommended by the Intergovernmental Panel on Climate Change (IPCC) guidelines.
Definition of Simulation Units: Based on the field survey, the spatial configuration of green spaces was categorized into two predominant types. Representative simulation units were defined for each: a 50 m × 50 m (2500 m2) unit for centralized planar green spaces (e.g., lawns, groves), and a 60 m × 10 m (600 m2) unit for linear strip green spaces (e.g., roadside plantings, building perimeter belts). These dimensions were selected to represent the typical size and geometry of such spaces found within the studied residential communities.
Selection of Dominant Species: Ligustrum lucidum (Privet) and Photinia serratifolia (Photinia) were identified as the dominant tree species for the simulation, as they were the most frequently occurring and structurally significant species in the field inventory.
Case Study Application: This parameterized framework was subsequently applied to simulate and compare the APR, CS, and OP capacities of two distinct residential communities: Community A (e.g., No. 128) and Community B (e.g., Longfu). This comparative analysis allowed for an evaluation of how different existing green space compositions translate into quantifiable ecological benefits.

3. Results

3.1. Interspecific Variation in Ecological Benefits Across Communities

The i-Tree Eco simulation revealed significant interspecific variation in the annual ecological benefits per tree (Table 2). Notably, species that were highly abundant in the surveyed communities, such as Ligustrum lucidum (Privet) and Prunus serrulata (Sakura), demonstrated only low to moderate efficiency across all measured ecosystem services. In contrast, species like Catalpa bungei and Populus spp. emerged as superior performers for air pollution removal (APR), while Populus spp. and Robinia pseudoacacia dominated in carbon sequestration (CS) and the directly correlated oxygen production (OP). This clear disparity between current species abundance and their functional performance highlights a substantial potential for optimizing ecological returns through strategic species selection.
Air Pollution Removal (APR): Catalpa bungei and Populus spp. emerged as the most efficient species for APR on a per-tree basis.
Carbon Sequestration (CS): Populus spp. showed the highest total carbon storage and sequestration potential by a large margin, followed by Robinia pseudoacacia.
Oxygen Production (OP): As OP is directly derived from CS, the ranking of species for OP mirrored that of CS, with Populus spp. being the top performer.
Notably, some of the most abundant species in the surveyed communities, such as Ligustrum lucidum (Privet) and Prunus serrulata (Sakura), demonstrated only low to moderate efficiency across all measured ecosystem services, highlighting a widespread disparity between abundance and functional performance.

3.2. Case 1: Community No. 128—Renovation in a Relatively Diverse Setting

3.2.1. Vegetation Composition and Renovation Basis

The field survey in Community No. 128 recorded a total of 322 trees belonging to 22 species, indicating relatively high diversity. The diameter at breast height (DBH) distribution indicated a mature stand. The community was dominated by a few species: Sakura (Prunus serrulata, 29.7%), Privet (Ligustrum lucidum, 21.1%), and Yulan Magnolia (Magnolia denudata, 19.2%) collectively accounted for approximately 70% of the total tree population. Despite the diversity, the high abundance of species with low to moderate efficacy (Table 2) indicated significant potential for ecological improvement.
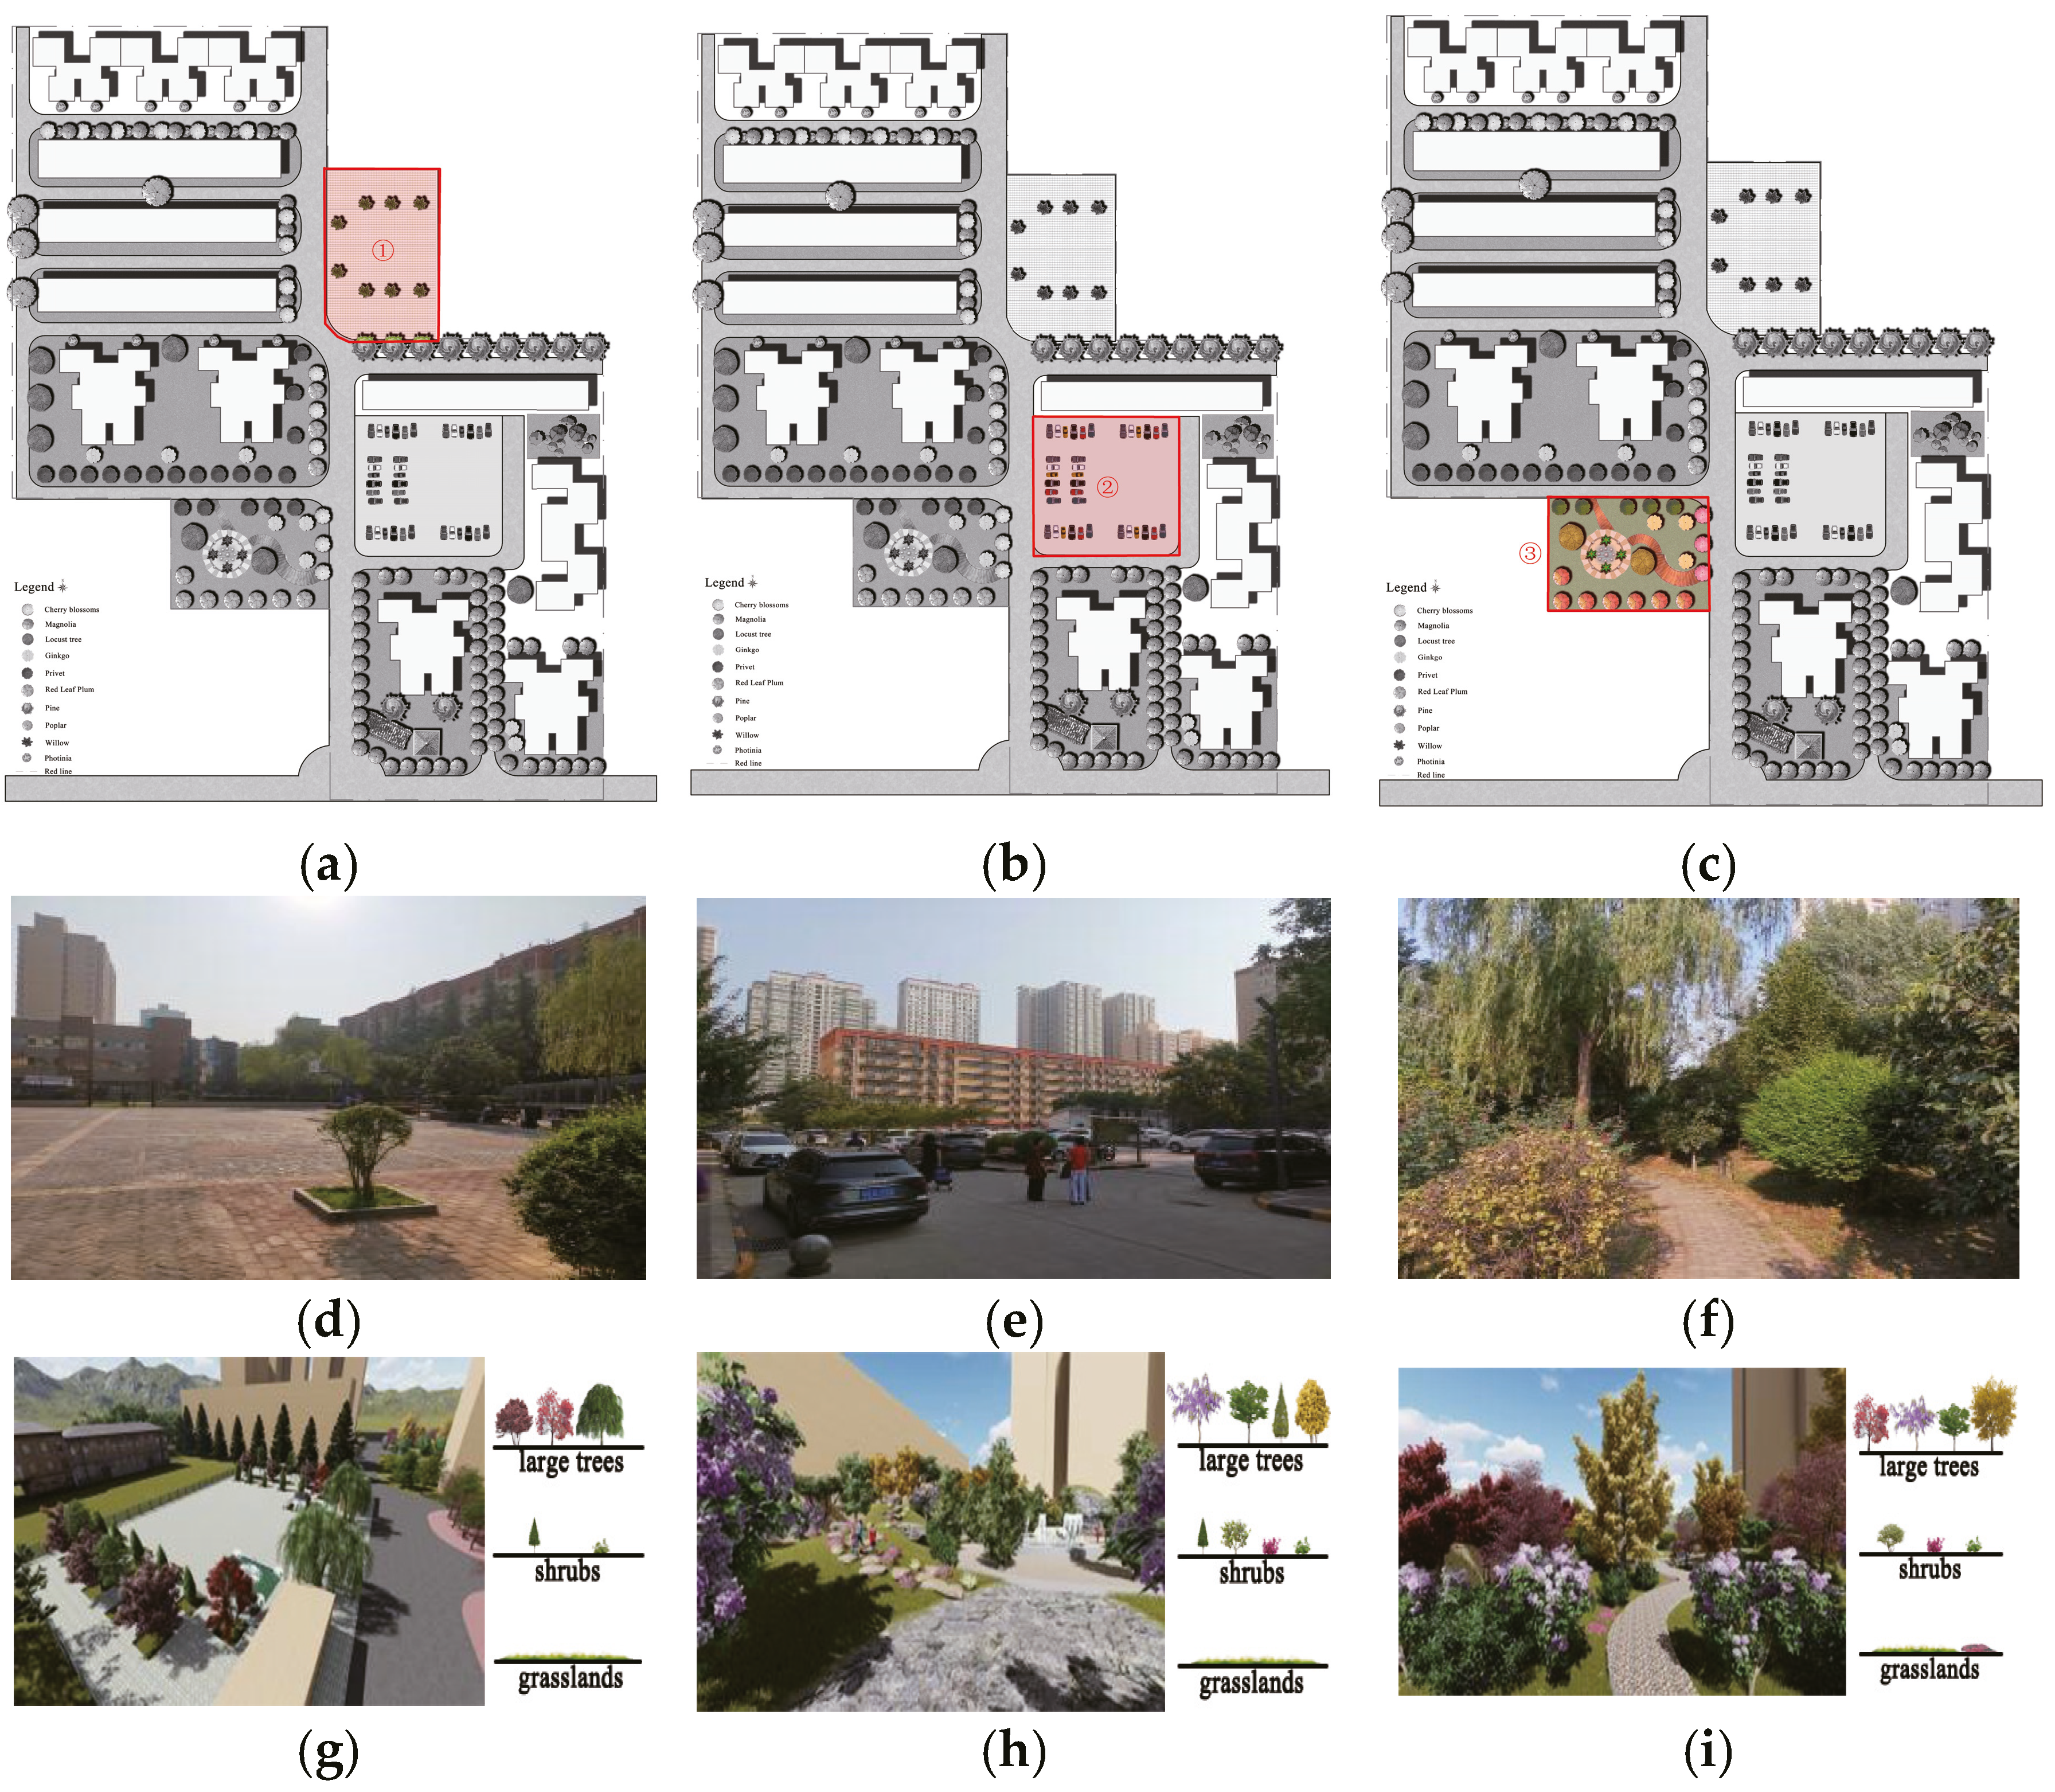
Based on the field survey, three specific plots (Plots 1, 2, and 3) within the community were identified as priorities for renovation due to the prevalence of dead or declining vegetation and a general deficiency in green space coverage (Figure 2). The renovation strategy was scientifically informed by the performance ranking established in Table 2.

3.2.2. Renovation Plan Design

Plot 1 (Central Activity Space): The strategy involved replacing senescent and low-performance species with high performers for CS and APR from Table 2. A dead Willow tree was replaced with a high-carbon-sequestration species like Pine. Understory plantings of Maple and Red-leaf Plum were added to increase biodiversity.
Plot 2 (Parking Lot Conversion): This area was transformed from an impervious surface into a multi-layered vegetation structure. The design incorporated large canopy trees (e.g., Maple, Ginkgo) for shading and CS, complemented by a secondary layer of medium-sized trees (e.g., Magnolia, Pine) to maximize APR.
Plot 3 (Degraded Green Space): The intervention focused on revitalization by removing all dead plants and replanting with high-efficiency species to directly upgrade the area’s capacity for CS and OP.

3.3. Case 2: Longfu Community—Renovation in a Species-Poor Setting

3.3.1. Vegetation Composition and Renovation Basis

The field inventory in the Longfu community recorded 236 trees from only 11 species, revealing remarkably low species diversity. The community was overwhelmingly dominated by two species: Privet (Ligustrum lucidum, 45.7%) and Red-leaf Plum (Prunus cerasifera, 42.7%), which together constituted over 90% of the tree population. This monoculture-like composition, comprised of species with low ecological efficacy (Table 2), presented a significant risk to the resilience of ecosystem services and underscored an urgent need for diversification and functional enhancement.
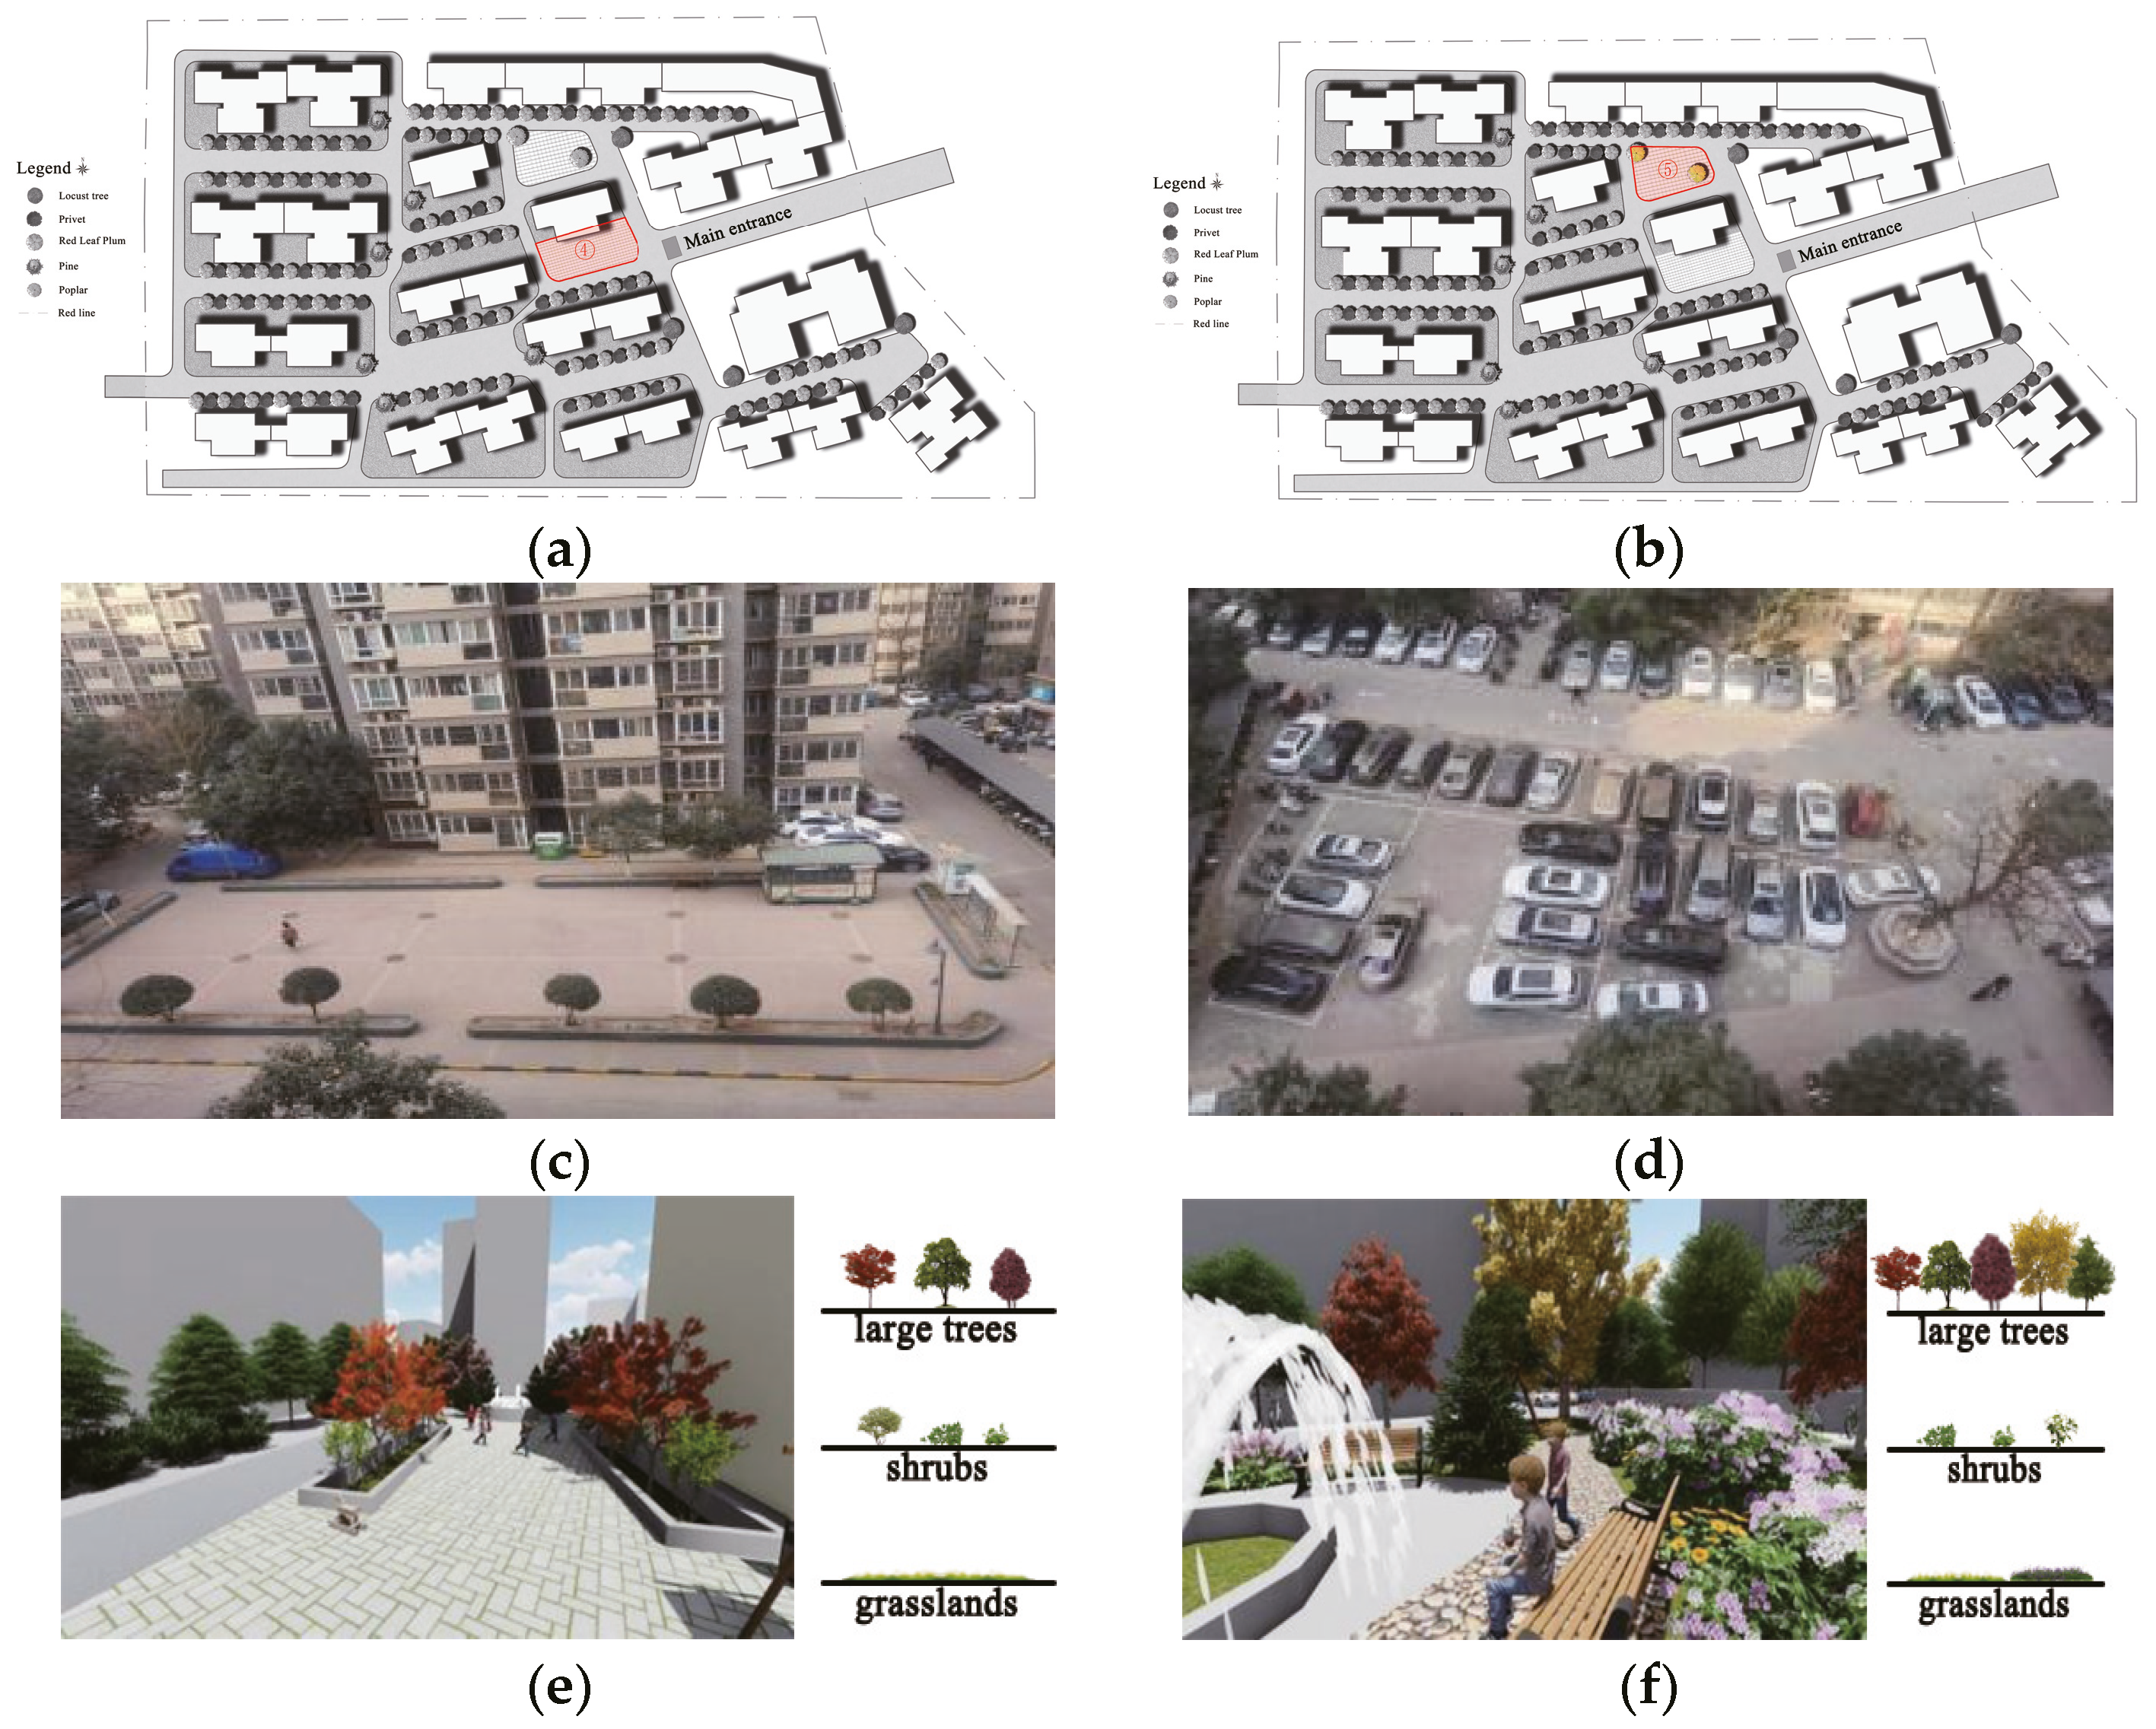
Two specific plots (Spaces 4 & 5) within Longfu were prioritized for renovation (Figure 3). Space 5, a parking lot, represented a key opportunity for land-use conversion and substantial ecological gain.

3.3.2. Renovation Plan Design

The strategy for Longfu was guided by the critical need to (1) Increase Species Diversity and (2) Introduce High-Efficiency Species identified in Table 2. For instance, the transformation of Space 5 from a parking lot into a green space garden was designed to introduce a multi-species, multi-layered plant community centered around high-performance trees like Catalpa bungei (for APR) and Populus spp. (for CS/OP), thereby directly addressing the deficiencies in species composition and quantity.

3.4. Analysis of Changes in Ecological Benefits After Renovation

3.4.1. Integrated Assessment of Benefit Enhancement

The i-Tree Eco model was employed to simulate and compare the ecosystem service capacities of the five designated spaces across both communities before and after the proposed renovation. The results demonstrated a dramatic enhancement in APR, CS, and OP across all spaces, with the magnitude of increase varying substantially based on the renovation intensity and initial conditions (Table 3, Figure 4).
(1)
Changes in APR benefits
The i-Tree Eco model was employed to simulate and compare the air pollution removal (APR) capacity of the five designated spaces before and after the proposed renovation. The results demonstrated a dramatic enhancement in APR across all spaces, with the magnitude of increase varying substantially based on the renovation intensity and initial conditions (Figure 4).
The most pronounced improvement occurred in Space 5, where the APR increased by 53.5 times. This is attributable to the fundamental land-use change from a largely impervious parking lot with minimal vegetation to a newly established green space garden with a high density of trees and shrubs. In contrast, Space 3 exhibited the most modest increase (0.6 times), as the pre-renovation area already possessed substantial vegetation cover with significant existing ecological benefits. The renovation here was limited to replacing a small number of dead or low-performance individuals rather than a large-scale redesign.
To further investigate the drivers behind the improvement in APR, a Pearson correlation analysis was conducted between the increase in APR and key renovation parameters. The results revealed a strong positive correlation with the selection of vegetation type (r = 0.91, p < 0.05), followed by the quantity of vegetation planted (r = 0.88, p < 0.05). The spatial layout of vegetation showed a weaker, though still significant, correlation (r = 0.64, p < 0.05) (Figure 5). This statistically validates that the strategic selection of high-efficiency species and an increase in overall planting density are the most critical factors for maximizing APR benefits in residential green space renewal projects.
(2)
Changes in CS benefits
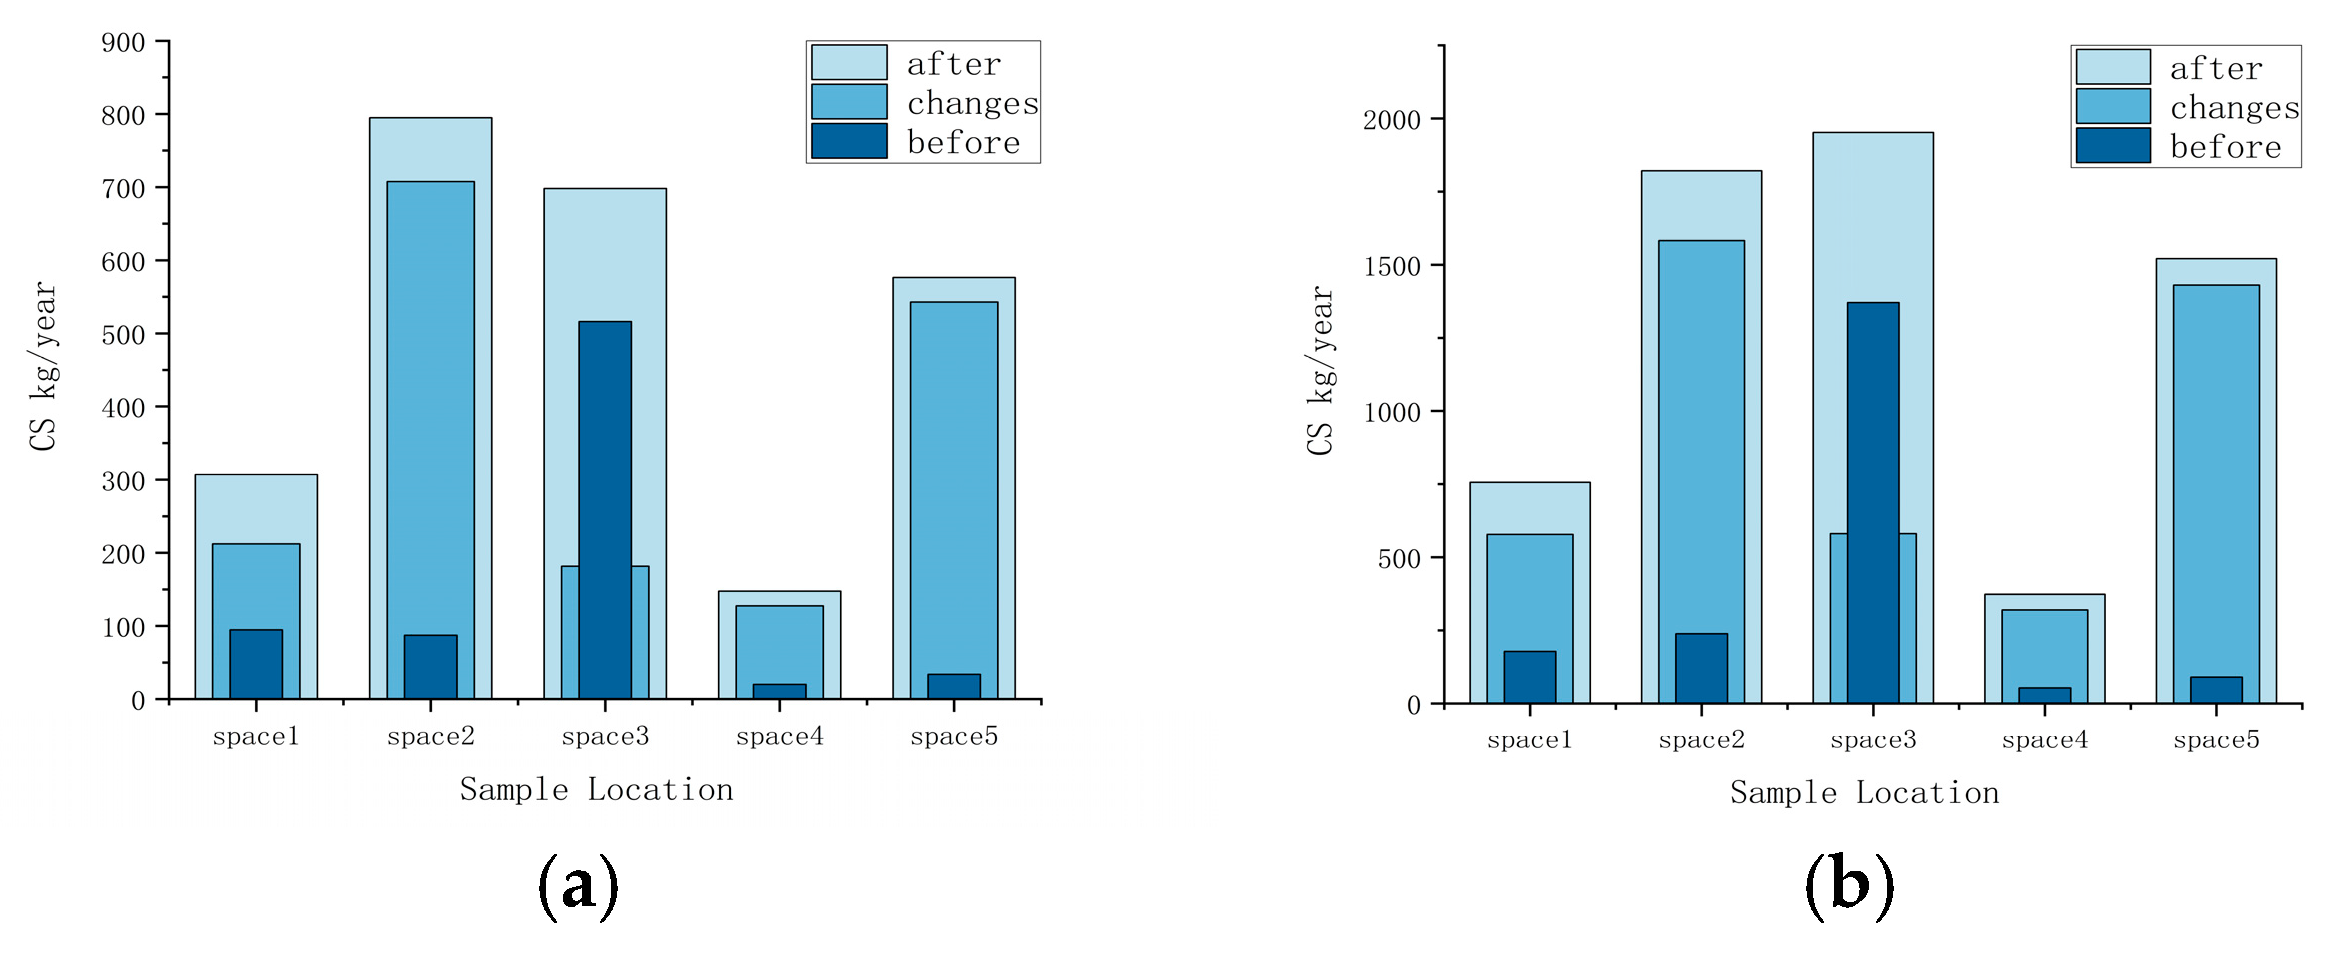
The simulation results demonstrated a substantial increase in carbon sequestration (CS) capacity across all renovated spaces, with the degree of enhancement closely linked to the renovation intensity and initial site conditions (Figure 6). The variation in CS enhancement can be attributed to two primary factors:
Pre-renovation Baseline: Space 3, which served a recreational function and already possessed substantial tree cover (e.g., pines and cypresses), underwent only limited intervention involving the replacement of dead trees with high-CS species like Magnolia. Consequently, it showed the most modest relative increase (35.2%).
Land-use Conversion and Species Selection: In stark contrast, Space 5 exhibited the most dramatic improvement (1605.9%). This space was transformed from an impervious parking lot with sparse, low-coverage vegetation into a multi-layered green space. The introduction of high-CS capacity species, identified in our previous simulations (e.g., Poplar and Magnolia from Table 2), was the principal driver of this remarkable gain. Similarly, the significant increases in Spaces 2 (809.6%) and 4 (1307.0%) are directly attributable to the strategic incorporation of these high-performance species into the new designs.
These findings robustly confirm that the CS capacity of residential green spaces is highly dependent on species selection. The strategic incorporation of high-CS capacity species, particularly in areas undergoing significant land-use change or with low initial canopy cover, is the most effective strategy for rapidly enhancing the carbon sink function at the community scale.
(3)
Enhancement of Oxygen Production Capacity
The most dramatic enhancement in OP occurred in Space 5, with a 15.9-fold in-crease, directly resulting from its conversion from a paved parking lot to a green space planted with high CS/OP species like Poplar and Maple. In contrast, Space 3, which had the highest baseline OP and CS due to its pre-existing mature vegetation, showed the most modest relative increase (0.4-fold). The renovation here was limited to re-placing dead trees, thus only marginally boosting the already high baseline.
The strong concordance between the increases in CS and OP across all spaces quantitatively validates that enhancing the carbon sink capacity of urban greenery through strategic species selection simultaneously and predictably enhances its oxygen production service.

3.4.2. Quantifying Parameter Influence Through Sensitivity Analysis

The sensitivity analysis using the Morris method provided crucial insights into the key drivers of model uncertainty and output. The results identified the Leaf Area Index (LAI) as the most influential parameter for all three ecosystem services (APR, CS, and OP), exhibiting significantly higher mean elementary effect values than other inputs. This underscores that accurately measuring or estimating LAI is paramount for reliable model predictions. Deposition velocity for ozone and tree crown width were identified as secondary influential parameters for APR, while diameter at breast height (DBH) was a key driver for CS and OP, consistent with its direct role in allometric biomass equations. The sensitivity to background PM2.5 concentration was notably lower, suggesting that the model’s APR output is more sensitive to vegetation structure than to variations in ambient pollution levels within the observed range.

3.4.3. Drivers of Ecological Benefits: Correlation Analysis

To identify the key factors driving the enhancement of ecosystem services, A Spearman’s rank correlation analysis was conducted (Table 4). The independent variables were quantifiable parameters of the renovation design: Tree Species (represented by the species-specific performance index for APR or CS, derived from Table 2 and Table 3, thus converting the categorical variable into a continuous ordinal variable), Vegetation Quantity (total leaf area per plot), and Spatial Configuration (a shape index measuring perimeter-to-area ratio). The dependent variables were the post-renovation values of APR, CS, and OP. Given that the data for some variables (e.g., species performance index) were not guaranteed to be normally distributed, we employed Spearman’s rank correlation analysis for all variables to ensure consistency and statistical robustness. The results revealed distinct patterns in how these design parameters influence different ecosystem services.
  • Air Pollution Removal (APR) was most strongly driven by Vegetation Quantity (r = 0.928, p < 0.01), indicating that the total leaf area available for pollutant deposition is the primary factor. Tree Species performance rank also showed a very strong positive correlation (r = 0.917, p < 0.01), underscoring the importance of choosing species with high particulate capture efficiency. A significant negative correlation with Spatial Configuration (r = −0.905, p < 0.05) was observed, suggesting that more complex, fragmented patch shapes may hinder air flow and reduce deposition efficiency compared to more compact designs.
  • Carbon Sequestration (CS) was also significantly correlated with both Tree Species performance rank (r = 0.862, p < 0.05) and Vegetation Quantity (r = 0.871, p < 0.05). This aligns with the physiological basis that CS is a function of biomass, which is determined by species-specific growth rates and the overall stand density.
  • Oxygen Production (OP) showed the strongest association with Tree Species performance rank (r = 0.675), although it was not statistically significant at the p < 0.05 level in this sample. This trend reinforces the intrinsic link between OP and the photosynthetic characteristics of specific species.
In summary, the analysis unequivocally identifies Tree Species selection (based on performance rank) and Vegetation Quantity as the most critical levers for enhancing ecological benefits in residential green space renewal.

4. Discussion

4.1. Key Drivers and Mechanisms Underlying Species-Specific Ecological Benefits

Our findings confirm and quantify the profound influence of tree species identity on ecosystem service provision, consistent with previous studies [19,25]. The interspecific variation in APR, CS, and OP can be attributed to a combination of morphological and physiological traits. For instance, the superior APR capacity of species like Catalpa bungei and Populus spp. is likely linked to their large leaf area, specific leaf surface characteristics (e.g., hairiness, waxiness) that facilitate particulate matter capture, and high transpiration rates that enhance the uptake of gaseous pollutants [9,27]. Similarly, the high CS potential of Populus and Robinia pseudoacacia aligns with their known rapid growth rates and substantial biomass accumulation, which are key determinants of carbon storage in urban trees [20].
When placed in a broader quantitative context, our results both align with and refine existing knowledge. For example, the annual carbon sequestration per tree for Populus spp. in our study (approximately 3.1 kg C tree−1 yr−1) falls within the reported range for this genus in semi-arid Northern China but is at the lower end compared to studies in more humid regions [30,31]. This underscores the constraining effect of water availability on growth rates. Conversely, the remarkable APR efficiency of Catalpa bungei (1.93 g tree−1 yr−1) appears to be particularly pronounced in the dusty environment of Xi’an compared to reports from less polluted cities [5], suggesting that its leaf traits are exceptionally well-suited to local pollution conditions. These cross-study comparisons highlight that while the relative performance ranking of species (e.g., fast-growing deciduous trees > slow-growing evergreens for CS) is often consistent, the absolute magnitude of benefits is highly context-dependent, modulated by local climate and pollution levels.
This strong species-functional performance relationship provides a critical scientific basis for plant selection. Our study demonstrates that simply planting the most abundant species (e.g., Ligustrum lucidum and Prunus cerasifera) may yield suboptimal ecological returns. Instead, prioritizing species with identified high efficiency, such as Catalpa bungei for APR and Populus spp. for CS, can dramatically enhance the cost-effectiveness of greening projects in semi-arid regions like Xi’an, even when the total number of trees remains constant.

4.2. Optimizing Vegetation Structure for Synergistic Benefits

Beyond species selection, the configuration of vegetation plays a crucial role. The prevalent tree-shrub-grass model in residential areas is often driven by aesthetic priorities [32]. Our correlation analysis further reveals that simply increasing vegetation quantity (leaf area) is a primary driver for APR enhancement. This supports the implementation of a multi-layered vegetation structure.
A well-designed multi-layered community, with a recommended tree-shrub-grass ratio of approximately 6:2:2 [1,19], can create a more complex and efficient canopy structure. This configuration maximizes the total leaf area index within a limited footprint, thereby synergistically enhancing APR through increased deposition surfaces and boosting CS through complementary resource use. The tree layer provides the primary carbon sink and oxygen source, while the shrub and grass layers contribute to near-ground pollution removal, microclimate regulation, and biodiversity support, leading to superior comprehensive ecological benefits compared to monoculture lawns or sparse tree plantings.

4.3. Re-Evaluating the Role of Spatial Configuration: A Counter-Intuitive Finding

A particularly intriguing and counter-intuitive finding from our study is the significant negative correlation between the complexity of green space spatial configuration (i.e., higher shape index) and air pollution removal (APR) efficiency (Table 4). This appears to contradict the common urban planning paradigm that advocates for complex and interconnected green networks to enhance ecosystem services. We propose several non-exclusive mechanisms that could explain this result:
Aerodynamic Effects on Deposition Velocity: The i-Tree Eco model calculates APR based on dry deposition velocity, which is influenced by local turbulence and wind flow. Highly complex and fragmented green patches, characteristic of a high shape index, may create a more “cluttered” aerodynamic environment. This could hinder the penetration and mixing of polluted air masses into the core of the vegetation canopy, reducing the overall contact between pollutants and leaf surfaces compared to a more compact, streamlined green space that allows for deeper air penetration [33,34].
Edge Effects and Functional Interior Area: A complex shape inherently increases the edge-to-interior ratio of a green space. While edges are important for certain ecological functions, the interior of a compact patch might provide more stable, low-turbulence conditions that are conducive to the long-residence times needed for particulate matter deposition. In a narrow, convoluted green space, the entire area may be subject to “edge effects,” including higher wind speeds that can re-suspend deposited particles [35].
Model Limitations: It is also important to consider the limitations of the i-Tree Eco model, which employs a bulk deposition algorithm. It may not fully capture the complex micro-scale turbulent structures and flow patterns around irregularly shaped vegetation patches [36]. Our finding highlights the need for future research that couples CFD (Computational Fluid Dynamics) simulations with ecosystem service models to better understand the aerodynamics of differently configured urban green spaces.
This finding does not imply that spatial configuration is unimportant. Rather, it suggests that for the specific service of air pollution removal, prioritizing compact and less fragmented green space designs might be more effective than creating complex shapes, especially in the wind-prone and often stagnant atmospheric conditions of semi-arid cities. This provides a crucial, evidence-based nuance for landscape architects and planners.

4.4. Implications of Sensitivity Analysis for Robust Ecosystem Service Assessment

Our sensitivity analysis moves beyond a simple uncertainty quantification and offers strategic guidance for both research and practice. The dominance of Leaf Area Index (LAI) as the most sensitive parameter across all services underscores a critical priority: future field campaigns and remote sensing studies aimed at predicting ecosystem services in arid cities should prioritize the accurate and precise measurement of LAI. The considerable influence of crown width and DBH further validates the central role of robust tree biometrics in any credible assessment.
From a practical planning perspective, the high sensitivity to LAI implies that management interventions which enhance canopy density and leafiness—such as selecting species with high inherent LAI, ensuring adequate irrigation, and maintaining tree health—will yield the most significant marginal gains in ecosystem service provision. Conversely, the relatively lower sensitivity to background pollution concentration is reassuring for model application, indicating that the model’s rankings of green spaces based on APR are robust to typical fluctuations in annual air quality. This finding allows urban planners to have greater confidence in the relative performance assessments of different greening designs, even if absolute pollution levels vary from year to year. Thus, the sensitivity analysis directly informs a prioritization of data collection efforts and management strategies, enhancing the efficiency and impact of urban greening programs.

4.5. Integrated Design Strategies for Ecological Renewal

Synthesizing our findings, we propose a holistic framework for optimizing green space renewal in arid and semi-arid cities, which integrates spatial, structural, and functional considerations:
  • Spatial Optimization through Land-use Conversion: The most dramatic gains in ecosystem services were achieved in Space 5, which was converted from an impervious parking lot to a green space. This underscores that increasing green space area, particularly by reclaiming underutilized paved areas, is the most effective first step. Utilizing vertical spaces (e.g., walls, columns) with climbing plants can further amplify this gain without expanding the footprint.
  • Structural Prioritization of High-Performance Strata: Given that trees provide disproportionately higher ecological benefits per unit area compared to shrubs and grasses [1], the renovation should strategically increase the proportion of trees and shrubs to 40–60% of the green space. This shift in composition from herbaceous-to woody-dominated systems is critical for maximizing CS and OP, as evidenced by the superior performance of tree-dominated spaces in our study.
  • Functional Maximization via Strategic Species Selection: The final and most precise lever is the incorporation of the high-efficiency species identified in this study. For comprehensive benefits in Xi’an, a species mix including Populus spp. (for high CS/OP), Catalpa bungei (for exceptional APR), and Robinia pseudoacacia (for strong CS) is recommended. This science-based selection ensures that every unit of limited water and space resource is allocated to vegetation that delivers the greatest ecological return on investment. Furthermore, our analysis of spatial configuration suggests a fourth, nuanced consideration: when aiming specifically to improve air quality, designers should favor compact and coherent green space forms over highly fragmented and complex ones to optimize aerodynamic conditions for pollutant deposition.
In conclusion, this integrated, multi-pronged framework—spanning spatial, structural, and functional, and now also morphological dimensions—provides a actionable and hierarchical roadmap for planners and designers. By sequentially addressing ‘where’ to add greenness, ‘what’ structure to prioritize, and ‘which’ species to plant, it enables a strategic allocation of scarce resources to maximize ecological returns in arid and semi-arid urban environments.

4.6. Comparative Contextualization with Other Arid and Temperate Cities

To further investigate our results, we have contextualized our findings by comparing Xi’an with other arid and temperate cities. For instance, studies in Lanzhou—a similarly semi-arid city—highlighted Populus and Robinia as key species for carbon sequestration, aligning with our results [37]. However, Lanzhou’s higher reliance on irrigation due to lower annual precipitation (300 mm vs. Xi’an’s 500 mm) underscores the need for water-efficient species in Xi’an to mitigate water scarcity [38].
Additionally, comparisons with temperate cities like Seoul and Berlin reveal distinct challenges and priorities. In Seoul, high PM2.5 levels drive the prioritization of species with high APR capacity (e.g., Pinus densiflora), whereas Berlin’s climate allows for a broader mix of deciduous species to enhance biodiversity [39]. In contrast, Xi’an’s unique combination of semi-aridity and rapid urbanization necessitates a dual focus on drought tolerance and air pollution mitigation. For example, while Catalpa bungei excels in APR in Xi’an, its performance in more humid temperate cities may be less pronounced due to differing pollutant deposition mechanisms [40].
Furthermore, a cross-city analysis of greening strategies in arid regions (e.g., Urumqi and Phoenix) emphasizes the importance of converting impervious surfaces to green spaces, as demonstrated in our Space 5 results. In Phoenix, the use of native xerophytic species reduced irrigation demands by 40% while maintaining comparable ecological benefits [41]. This supports our recommendation to integrate native, drought-tolerant species like Robinia pseudoacacia into Xi’an’s greening projects to balance ecological benefits and resource constraints. These comparisons highlight the universality of certain mechanisms (e.g., multi-layered vegetation for synergy) while underscoring the need for regionally tailored species selection and management practices.

4.7. Limitations of This Study

While this study provides a quantitative framework for assessing green space renovation, several limitations should be considered when interpreting the results. A primary constraint arises from our reliance on the i-Tree Eco model. Although standard for ecosystem service assessments, the model’s outputs are inherently associated with uncertainties, as key metrics like air pollution removal and carbon sequestration were simulated rather than directly empirically measured. Furthermore, our analysis identified correlations between ecosystem services and macro/meso-scale factors (e.g., species composition, spatial layout) but did not probe the underlying physiological mechanisms—such as interspecific variation in leaf area index or transpiration rates—that drive these differences. This limits a mechanistic understanding of species performance and represents a valuable avenue for future research integrating plant physiological measurements.
On a technical level, the i-Tree Eco model, while powerful for quantifying service magnitudes, has a limited capacity for high-resolution spatial visualization of benefit distribution within the urban canopy. Additionally, as noted in the discussion, its simplified representation of airflow may not fully capture the complex aerodynamics of intricate spatial configurations, potentially influencing the counter-intuitive negative correlation observed between shape complexity and air pollution removal. Finally, as a case study focused on Xi’an, the generalizability of our specific quantitative findings to cities with distinctly different climates or management practices requires further validation. Future work could test the proposed decision-making framework in other arid and semi-arid contexts.

5. Conclusions

This study establishes a functional paradigm for optimizing residential green spaces in water-limited cities, moving beyond conventional aesthetic-driven approaches. By employing a rigorously calibrated i-Tree Eco model in Xi’an, we developed a hierarchical framework for ecological renewal, which prioritizes three strategic levers in descending order of impact. First and foremost, the selection of high-performance, drought-tolerant tree species (e.g., Populus for carbon sequestration and Catalpa for air purification) was identified as the most critical factor, with superior species delivering orders-of-magnitude greater benefits than commonly planted but less effective alternatives. Second, this primary strategy is amplified by maximizing vegetation quantity through multi-layered structures that increase the total leaf area index. Third, and more subtly, our results suggest that spatial configuration matters; counter to some prevailing planning notions, compact green space designs appear more conducive to air pollution removal than complex, fragmented layouts, likely due to more favorable aerodynamics for particulate deposition.
The methodology and the general principles of this framework are transferable. This work provides urban planners and landscape architects in arid and semi-arid regions with an actionable, evidence-based strategy to maximize the atmospheric ecosystem services of their limited green infrastructure. Ultimately, by strategically allocating scarce resources—prioritizing the right species, ensuring sufficient planting density, and adopting optimized spatial forms—cities can enhance the efficacy of residential landscapes, enabling them to better mitigate environmental pressures and contribute to urban sustainability.

Author Contributions

Conceptualization, X.F.; methodology, Z.F.; formal analysis, X.F., Z.F. and S.S.; investigation, Z.Z.; resources, Z.F. and M.L.; writing—original draft preparation, X.F.; writing—review and editing, X.F., S.S., Z.F. and Z.Z.; visualization, X.Y. and Z.Z.; supervision, M.L.; project administration, X.F. and X.Y.; funding acquisition, X.F. All authors have read and agreed to the published version of the manuscript.

Funding

This research was founded by the Social Science of Shaanxi Province of China, grant number 2023F013, and Natural Science Foundation of Shaanxi Province of China, grant number 2025JC-YBMS-316.

Institutional Review Board Statement

Not applicable.

Informed Consent Statement

Not applicable.

Data Availability Statement

The data presented in this study are available on per request to the corresponding author.

Conflicts of Interest

The authors declare no conflicts of interest.

References

  1. Yang, Q.; Zhang, X.; Almendinger, J.E.; Huang, M.; Chen, X.; Leng, G.; Zhou, Y.; Zhao, K.; Asrar, G.R.; Li, X. Climate change will pose challenges to water quality management in the st. Croix River basin. Environ. Pollut. 2019, 251, 302–311. [Google Scholar] [CrossRef]
  2. Gong, C.; Xian, C.; Ouyang, Z. Assessment of NO2 Purification by Urban Forests Based on the i-Tree Eco Model: Case Study in Beijing, China. Forests 2022, 13, 369. [Google Scholar] [CrossRef]
  3. Tian, Y.; Jim, C.Y.; Wang, H. Assessing the landscape and ecological quality of urban green spaces in a compact city. Landsc. Urban Plan. 2014, 121, 97–108. [Google Scholar] [CrossRef]
  4. Abdul, B.; UI, A.N.; Tanveer, S.S.; Imran, A. Greenbelt conservation as a component of ecosystem, ecological benefits and management services: Evidence from Peshawar City, Pakistan. Environ. Dev. Sustain. 2022, 24, 11424–11448. [Google Scholar]
  5. Ren, W.; Zhao, J.; Ma, X. Analysis of spatial differentiation and air quality impact of green space landscape in Xi’an, China. Int. J. Environ. Sci. Technol. 2023, 20, 12449–12463. [Google Scholar] [CrossRef]
  6. Schebella, M.F.; Weber, D.; Schultz, L.; Weinstein, P. The Wellbeing Benefits Associated with Perceived and Measured Biodiversity in Australian Urban Green Spaces. Sustainability 2019, 11, 802. [Google Scholar] [CrossRef]
  7. Li, S.; Cao, Y.; Liu, J.; Wang, S.; Zhou, W. Assessing Spatiotemporal Dynamics of Land Use and Cover Change and Carbon Storage in China’s Ecological Conservation Pilot Zone: A Case Study in Fujian Province. Remote Sens. 2022, 14, 4111. [Google Scholar] [CrossRef]
  8. Wu, S.; Yao, X.; Qu, Y.; Chen, Y. Ecological Benefits and Plant Landscape Creation in Urban Parks: A Study of Nanhu Park, Hefei, China. Sustainability 2023, 15, 16553. [Google Scholar] [CrossRef]
  9. Sun, X.; Qiu, Y.; Qi, H.; Lu, W.; Tian, J.; Chen, S.; Xu, Y. Improving the ecological benefits evaluation on urban street trees: Development of a living vegetation volume quantifying framework with multi-source data. Ecol. Indic. 2024, 158, 111367. [Google Scholar] [CrossRef]
  10. Song, P.; Kim, G.; Mayer, A.; He, R.; Tian, G. Assessing the Ecosystem Services of Various Types of Urban Green Spaces Based on i-Tree Eco. Sustainability 2020, 12, 1630. [Google Scholar] [CrossRef]
  11. Daniels, B.; Zaunbrecher, B.S.; Paas, B.; Ottermanns, R.; Ziefle, M.; Roβ-Nickoll, M. Assessment of urban green space structures and their quality from a multidimensional perspective. Sci. Total Environ. 2018, 615, 1364–1378. [Google Scholar] [CrossRef]
  12. Wilson, K.; Willette, D.A. Valuation of ecosystem services of a nascent urban park in east los Angeles, California. Urban Ecosyst. 2022, 25, 1787–1795. [Google Scholar] [CrossRef]
  13. Zhu, C.; Ji, P.; Li, S. Effects of urban green belts on the air temperature, humidity and air quality. J. Environ. Eng. Landsc. 2017, 25, 39–55. [Google Scholar] [CrossRef]
  14. Yan, S.; Tang, J. Optimization of Green Space Planning to Improve Ecosystem Services Efficiency: The Case of Chongqing Urban Areas. Int. J. Environ. Res. Public Health 2021, 18, 8441. [Google Scholar] [CrossRef]
  15. Liu, D.; Li, H.; Qiu, M.; Liu, Y. Understanding coupled coordination relationships between social and ecological functions of urban green spaces. Geo-Spat. Inf. Sci. 2023, 26, 431–445. [Google Scholar] [CrossRef]
  16. Ghorbankhani, Z.; Zarrabi, M.M.; Ghorbankhani, M. The significance and benefits of green infrastructures using I-Tree canopy software with a sustainable approach. Environ. Dev. Sustain. 2023, 26, 14893–14913. [Google Scholar] [CrossRef]
  17. Shackleton, S.; Chinyimba, A.; Hebinck, P.; Shackleton, C.; Kaoma, H. Multiple benefits and values of trees in urban landscapes in two towns in northern South Africa. Landsc. Urban Plan. 2015, 136, 76–86. [Google Scholar] [CrossRef]
  18. Paudel, S.; States, S.L. Urban green spaces and sustainability: Exploring the ecosystem services and disservices of grassy lawns versus floral meadows. Urban For. Urban Green. 2023, 84, 127932. [Google Scholar] [CrossRef]
  19. Yao, Y.; Wang, Y.; Ni, Z.; Chen, S.; Xia, B. Improving air quality in Guangzhou with urban green infrastructure planning: An i-Tree Eco model study. J. Clean. Prod. 2022, 369, 133372. [Google Scholar] [CrossRef]
  20. Cimburova, Z.; Barton, D. The potential of geospatial analysis and Bayesian networks to enable i-Tree Eco assessment of existing tree inventories. Urban For. Urban Green. 2020, 55, 126801. [Google Scholar] [CrossRef]
  21. Cabaraban, M.T.I.; Kroll, C.N.; Hirabayashi, S.; Nowak, D.J. Modeling of air pollutant removal by dry deposition to urban trees using a WRF/CMAQ/i-Tree Eco coupled system. Environ. Pollut. 2013, 176, 123–133. [Google Scholar] [CrossRef]
  22. Ma, J.; Li, X.; Jia, B.; Liu, X.; Li, T.; Zhang, W.; Liu, W. Spatial variation analysis of urban forest vegetation carbon storage and sequestration in built-up areas of Beijing based on i-Tree Eco and Kriging. Urban For. Urban Green. 2021, 66, 127413. [Google Scholar] [CrossRef]
  23. Buccolieri, R.; Gatto, E.; Manisco, M.; Ippolito, F.; Santiago, J.L.; Gao, Z. Characterization of Urban Greening in a District of Lecce (Southern Italy) for the Analysis of CO2 Storage and Air Pollutant Dispersion. Atmosphere 2020, 11, 967. [Google Scholar] [CrossRef]
  24. Riondato, E.; Pilla, F.; Basu, A.S.; Basu, B. Investigating the effect of trees on urban quality in Dublin by combining air monitoring with i-Tree Eco model. Sustain. Cities Soc. 2020, 61, 102356. [Google Scholar] [CrossRef]
  25. Zhao, H.; Zhao, D.; Jiang, X.; Zhang, S.; Lin, Z. Assessment of Urban Forest Ecological Benefit Based on the i-Tree Eco Model—A Case Study of Changchun Central City. Forests 2023, 14, 1304. [Google Scholar] [CrossRef]
  26. Gong, Y.; Luo, X. Experimental Study on the Carbon Sequestration Benefit in Urban Residential Green Space Based on Urban Ecological Carrying Capacity. Sustainability 2014, 14, 7780. [Google Scholar] [CrossRef]
  27. Szkop, Z. Evaluating the sensitivity of the i-Tree Eco pollution model to different pollution data inputs: A case study from Warsaw, Poland. Urban For. Urban Green. 2020, 55, 126859. [Google Scholar] [CrossRef]
  28. Raj, R.; Tismer, A.; Gaisser, L.; Riedelbauch, S. A deep learning approach to calculated elementary effects of morris sensitivity analysis. Proc. Appl. Math. Mech. 2024, 24, e202400104. [Google Scholar] [CrossRef]
  29. Lin, J.; Kroll, C.N.; Nowak, D.J. An uncertainty framework for i-Tree eco: A comparative study of 15 cities across the United States. Urban For. Urban Green. 2021, 60, 127062. [Google Scholar] [CrossRef]
  30. Yao, L.; Liu, T.; Qin, J.; Jiang, H.; Yang, L.; Smith, P.; Chen, X.; Zhou, C.; Piao, S. Carbon sequestration potential of tree planting in China. Nat. Commun. 2024, 15, 8398. [Google Scholar] [CrossRef]
  31. Lu, F.; Hu, H.; Sun, W.; Yu, G. Effects of national ecological restoration projects on carbon sequestration in China from 2001 to 2010. Proc. Natl Acad. Sci. USA 2018, 115, 4039–4044. [Google Scholar] [CrossRef]
  32. Liu, F.; Tian, Y.; Jim, C.; Wang, T.; Luan, J.; Yan, M. Residents’ Living Environments, Self-Rated Health Status and Perceptions of Urban Green Space Benefits. Forests 2022, 13, 9. [Google Scholar] [CrossRef]
  33. Alsalama, T.; Koc, M.; Isaifan, R.J. Mitigation of urban air pollution with green vegetation for sustainable cities: A review. Int. J. Glob. Warm. 2021, 25, 498–515. [Google Scholar] [CrossRef]
  34. Du, H.; Bao, Z.; Zhou, F. Carbon Sequestration of Common Garden Tree Species under the Carbon Neutrality Target in East China. Forests 2024, 15, 1692. [Google Scholar] [CrossRef]
  35. Wang, P.; Luo, W.; Zhang, Q.; Han, S.; Jin, Z.; Liu, J.; Li, Z.; Tao, J. Assessing the impact of climate change on three Populus species in China: Distribution patterns and implications. Glob. Ecol. Conserv. 2024, 50, e02853. [Google Scholar] [CrossRef]
  36. Han, W.; Cheng, H.; Kang, T. Carbon storage and air pollution effect of urban trees and tree species selection: A case study in a typical city of the central Beijing-Tianjin-Hebei region. Atmos. Pollut. Res. 2024, 16, 102371. [Google Scholar] [CrossRef]
  37. Su, Y.; Sha, Y.; Zhai, G.; Zong, S.; Jia, J. Comparison of air pollution in Shanghai and Lanzhou based on wavelet transform. Environ. Sci. Pollut. Res. 2019, 26, 16825–16834. [Google Scholar] [CrossRef]
  38. Yang, Z.; Song, J.; Cheng, D.; Xia, J.; Li, Q.; Ahamad, M. Comprehensive evaluation and scenario simulation for the water resources carrying capacity in Xi’an city, China. J. Environ. Manag. 2019, 230, 221–233. [Google Scholar] [CrossRef]
  39. Seo, J.; Park, D.S.R.; Kim, J.Y.; Youn, D.; Lim, Y.B.; Kim, Y. Effects of meteorology and emissions on urban air quality: A quantitative statistical approach to long-term records (1999–2016) in Seoul, South Korea. Atmos. Chem. Phys. 2018, 18, 16121–16137. [Google Scholar] [CrossRef]
  40. Jiang, B.; Fan, S.; Sun, C.; Mu, S.; Gao, T.; Qiu, L. The regulation effect of urban green space on air particulate matter concentration under different matrices in Xi’an city. Air Qual. Atmos. Health 2024, 17, 1951–1968. [Google Scholar] [CrossRef]
  41. Chen, B.; Zhang, C. Projecting the CO2 and Climatic Change Effects on the Net Primary Productivity of the Urban Ecosystems in Phoenix, AZ in the 21st Century under Multiple RCP (Representative Concentration Pathway) Scenarios. Sustainability 2017, 9, 1366. [Google Scholar] [CrossRef]
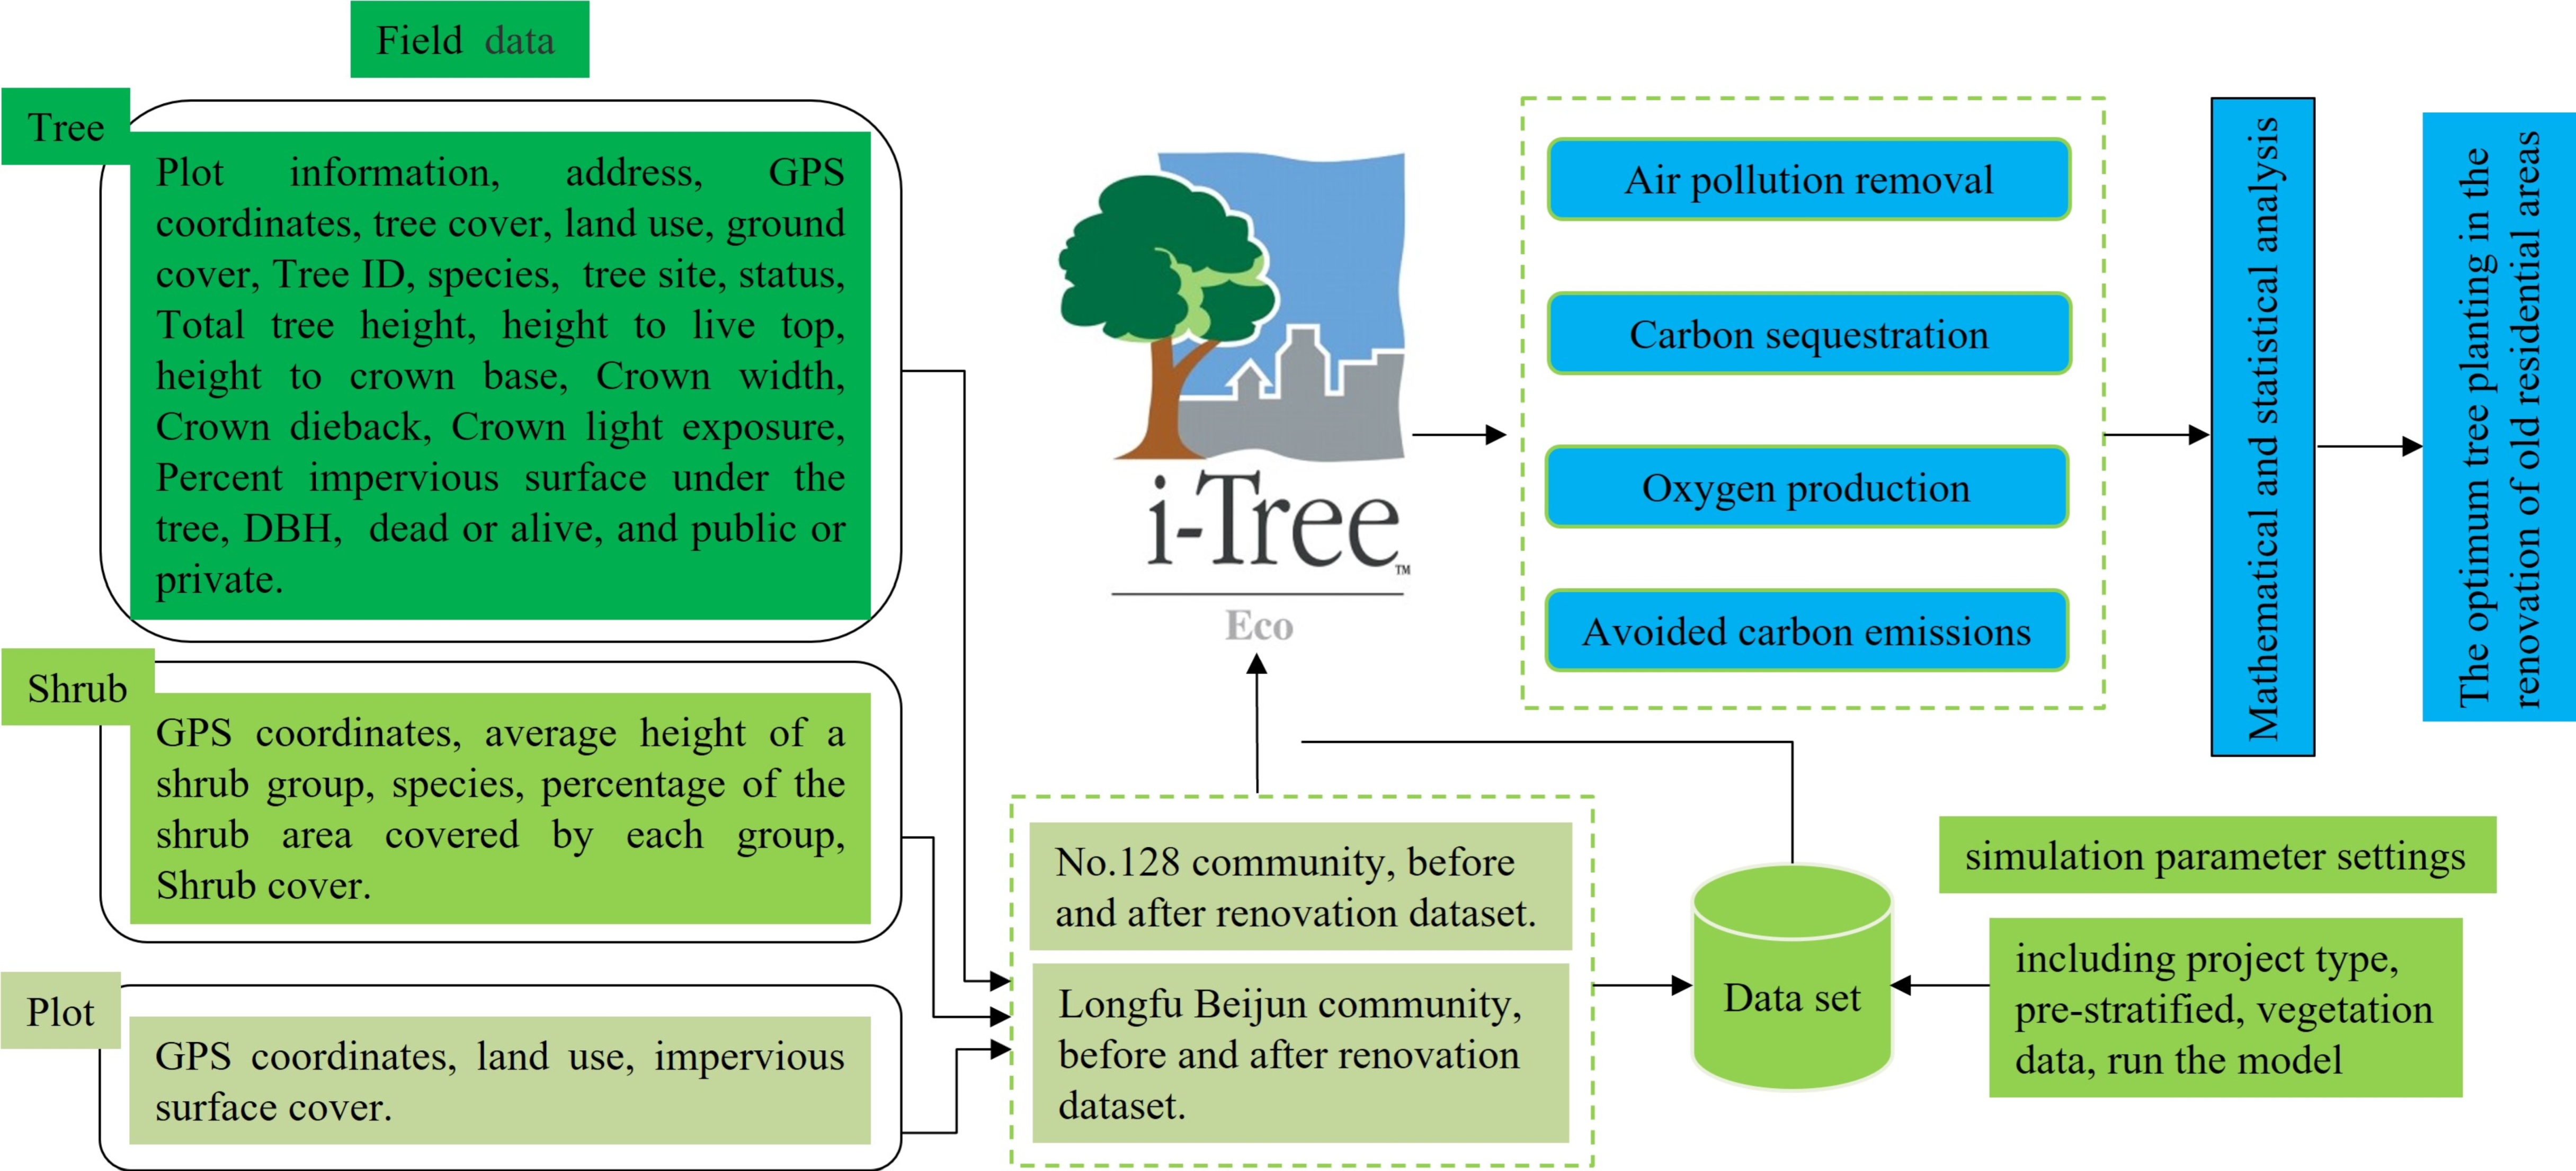
Figure 1. The flowchart and parameter setting for operating the i-Tree Eco model.
Sustainability 17 09855 g001
Figure 2. Diagrams of the renovation designs for Plots 1, 2, and 3 in Community No. 128 (ac). the panels (df) illustrate the pre-renovation state, the panels (gi) present the post-renovation design.
Sustainability 17 09855 g002
Figure 3. Diagrams of the renovation designs for Plots 4, and 5 in Longfu community (a,b). the panels (c,d) illustrate the pre-renovation state, the panels (e,f) present the post-renovation design.
Sustainability 17 09855 g003
Figure 4. Annual and monthly APR (points) and value (bars) changes of No. 128 community. PM10* is particulate matter less than 10 microns and greater than 2.5 microns.
Sustainability 17 09855 g004
Figure 5. Annual and monthly APR (points) and value (bars) changes of Longfu community. PM10* is particulate matter less than 10 microns and greater than 2.5 microns.
Sustainability 17 09855 g005
Figure 6. Changes in CS (a) and OP (b) before and after renovation.
Sustainability 17 09855 g006
Table 1. The calculation model and parameters of i-Tree model.
Ecosystem ServiceCore Calculation PrincipleDescription and Parameters
APR model F = V d × C Where F denotes the pollutant purification capacity (g·m−2s−1); Vd stands for the deposition rate (m·s−1); C presents the Atmosphere Pollutant Concentration (g·m−3).
CS modelAllometric growth equation of Ligustrum lucidum 
B = 0.907 + 0.010 D 2 H ;
Biomass calculation equation:
N P P = B c A + d B ;
Carbon sequestration calculation equation:
C = N P P × 1.63 × 12 44 ;
The first step is to calculate biomass based on the plant allometric growth equation (B). Afterwards, calculate the net primary productivity (NPP) of biomass, and then calculate the CS of plants. In this example, D, H, and NPP correspond to the DBH, TH, and NPP, respectively. B, A, and C present biomass per unit area, stand age, and carbon sequestration. For different forest types, c and d represent the constants. The coefficients for converting NPP to CO2 and CO2 to carbon are 1.63 and 12/44, respectively.
OP modelOxygen production (kg/yr) = Net carbon sequestration (kg/yr) × 32/12The oxygen release was calculated by the net carbon sequestration.
Table 2. Simulated annual ecological benefits per tree for key species across the studied communities in Xi’an.
SpeciesAPR (g · Tree−1 · yr−1)CS (kg · Tree−1)OP (kg · Tree−1 · yr−1)Dominant Community(s)
Catalpa (Catalpa bungei)1931.17218.2014.90No. 128
Poplar (Populus spp.)1002.15300.7043.51Both
Paper Mulberry (Broussonetia papyrifera)1708.33162.1711.27No. 128
Black Locust (Robinia pseudoacacia)1519.241652.2186.11Longfu
Walnut (Juglans regia)1170.80386.5818.98No. 128
Camphor (Cinnamomum camphora)1315.50261.9140.81No. 128
Yulan Magnolia (Magnolia denudata)439.87196.7432.32No. 128
Red-leaf Plum (Prunus cerasifera)262.2292.9117.19Longfu
Privet (Ligustrum lucidum)274.0481.1312.97Both
Sakura (Prunus serrulata)355.16128.3021.08No. 128
Dominant Community(s) indicates the community where the species was a major component of the tree population, as de rived from the field surveys in Section 3.2.1 and Section 3.3.1. ‘Both’ indicates significant presence in both Community No. 128 and Longfu Community.
Table 3. Summary of simulated annual ecosystem services before and after renovation for all five spaces.
Ecological BenefitsAPR (g/Year)CS (kg/Year)OP (g/Year)Type
Space Before REAfter REBefore REAfter REBefore REAfter RE
No. 12772.720,919.894.6307.0178.2756.6Block + Belt
No. 24498.443,75387.4795.0238.61821.2Block + Belt
No. 315,536.424,648.1516.3698.11370.91952.0Block + Belt
No. 41133.19878.420.0147.653.3373.6Belt
No. 5415.422,635.833.8576.690.11520.7Belt
Table 4. Spearman’s rank correlation coefficients (ρ) between renovation parameters and post-renovation ecosystem services.
Ecosystem ServiceTree SpeciesVegetation QuantitySpatial Configuration (Shpae Index)
APR0.917 **0.928 **−0.9 *
CS0.862 *0.871 *−0.762
OP0.6480.551−0.698
Note: * p < 0.05, ** p < 0.01.
Disclaimer/Publisher’s Note: The statements, opinions and data contained in all publications are solely those of the individual author(s) and contributor(s) and not of MDPI and/or the editor(s). MDPI and/or the editor(s) disclaim responsibility for any injury to people or property resulting from any ideas, methods, instructions or products referred to in the content.