Abstract
We present the first dark-sky map of Thailand, derived from calibrated Visible Infrared Imaging Radiometer Suite (VIIRS) satellite data spanning 2012–2023. Artificial night-sky brightness was classified into 14 levels, with Classes 1–9 defined as potential dark-sky areas where the Milky Way remains visible. International comparisons with the United Kingdom, Chile, and Botswana reveal that Thailand has undergone the steepest decline, losing 15.4% of pristine skies since 2012, while the UK remained stable (+0.8%), Botswana nearly unchanged (−0.7%), and Chile moderately degraded (−5.3%). A correlation analysis shows strong negative associations between potential dark-sky area and both GDP () and population (), while inflation () and unemployment () exhibit weak influence. Five algorithms, including GLM and machine learning models, were tested; among them, the Decision Tree achieved the lowest relative error (), with ensemble methods and GLM performing comparably and Deep Learning being less accurate. By 2023, over 60% of Thais lived under skies too bright to observe the Milky Way by naked eye, and one-fifth were exposed to intensities preventing dark adaptation. Thailand’s rapid transition to LED street lighting after 2015, while energy-efficient, has intensified skyglow. Protecting remaining dark-sky areas requires urgent policies, linking conservation to human health, biodiversity, cultural heritage, and sustainable development.
1. Introduction
Artificial light at night (ALAN) has become one of the most significant and fastest-growing forms of environmental pollution. It affects not only the visibility of the night sky, but also the ecological systems and human health [1,2]. Several studies have demonstrated the increasing radiance and extent of nighttime lighting worldwide, with satellite-based observations revealing year-on-year increases, particularly in developing regions [3].
In 2016, Falchi et al. [4] introduced the New World Atlas of Artificial Night-Sky Brightness, providing a global classification of sky brightness levels using a 14-class scale based on the ratio of artificial light to natural night-sky background. Since then, this framework has been widely adopted for characterizing dark-sky conditions in both global and regional studies [5,6]. The atlas revealed that a significant fraction of the world’s population now lives under skies too bright to observe the Milky Way, raising concerns for both astronomy and conservation. Despite these advancements, relatively few studies have focused on the Southeast Asian region, and none have systematically mapped sky brightness conditions across Thailand.
Dark-sky conservation is relevant not only for astronomy but also for human health, biodiversity, and cultural heritage. Artificial night lighting disrupts circadian rhythms [2], alters nocturnal ecosystems [7], and erodes the cultural experience of the night sky. Thailand, with its growing tourism sector, could benefit from protecting dark-sky areas as assets for sustainable development and astrotourism.
In this work, we produce the first dark-sky map of Thailand using VIIRS Day/Night Band data from 2012 to 2023. Data are processed to align with the classification scheme of Falchi et al. [4] to facilitate international comparison. For an international context, we compare Thailand with three countries with astronomical research collaboration cases: Chile, which hosts world-class observatories and retains extensive low-radiance areas [4]; Botswana, which remains among the least light-polluted countries globally [5]; and the United Kingdom, a densely populated nation that has introduced national lighting strategies and dark-sky designations [8]. The rationale for selecting the four countries was that the UK and Chile were chosen as reference cases because they are international models of successful dark-sky conservation policies. In contrast, Thailand and Botswana were included as focal countries where our research teams aim to promote the adoption of similar policies. Conducting this comparative study therefore allows us to illustrate the current status of potential dark-sky areas and highlight both challenges and opportunities by benchmarking Thailand and Botswana against nations with established best practices. These profiles provide a useful reference point for interpreting Thailand’s trajectory under different geographical and policy conditions. By ranking Thailand’s 77 provinces based on their potential dark-sky areas, we aim to provide data-driven insights for both policy and the promotion of dark-sky tourism. Our work also sets the stage for integrating the quality of the night sky into broader environmental and economic planning.
2. Materials and Methods
To create a dark-sky map, measurements of the calibrated zenith artificial night-sky brightness collected from the Suomi National Polar Orbiting Partnership (NPP) with the Visible Infrared Imaging Radiometer Suite (VIIRS) from 2012–2023 of the four countries studied were acquired; therefore, the factor weight of five predictive models and the correlation matrix were carried out to find the significant factors affecting the brightness of the sky.
2.1. Data Acquisition
Annual composites of calibrated zenith artificial night-sky brightness from the NPP–VIIRS’s Day/Night Band (DNB) for the years 2012–2023 were obtained. The product was used, which applies cloud masking, stray-light correction, and lunar adjustment, and excludes ephemeral light sources such as fires and aurora. Radiance values in μcd m−2 were provided with noise-reduction applied by the Earth Observation Group (EOG), Colorado School of Mines (https://eogdata.mines.edu/products/vnl/ (accessed on 30 August 2025)).
Each raster was clipped to the national boundaries of Thailand, the UK, Chile, and Botswana. The resulting images were converted into ratios of artificial to natural sky brightness following the classification scheme of Falchi et al. [4]. A natural background of 174 μcd m−2 (22 mag arcsec−2) was assumed, while updated measurements of 271.28 μcd m−2 (21.5 ± 0.4 mag arcsec−2) reported by Grauer et al. [9], Alarcon et al. [10] were also noted.
The classified results were grouped into 14 brightness classes (Table 1), ranging from Class 1 (pristine) to Class 14 (cone cell stimulation). This scheme allows direct comparison with global dark-sky studies and consistent tracking of long-term degradation.

Table 1.
Classification of sky brightness into 14 classes, from pristine (Class 1) to cone cell stimulation (Class 14). Visual impacts associated with each class are also summarized.
Table 1 presents 14 classes of sky brightness classified by the ratio between the artificial brightness and the natural background sky brightness given by Falchi et al. [4], where the natural background sky of 174 μcd m2 (or 22 mag arcsec−2) was assumed. We noted here that the up-to-date value of 271.28 μcd m−2 (or 21.5 ± 0.4 mag arcsec−2) was reported in Grauer et al. [9], Alarcon et al. [10].
2.2. Modeling
The “potential” dark sky was designated as Classes 1–9, corresponding to conditions where the Milky Way remains visible. Five socioeconomic attributes—population, GDP, inflation rate, unemployment rate, and time (year)—were analyzed to evaluate their influence on the evolution of night-sky brightness.
To assess predictive performance, five algorithms were applied using RapidMiner software version 9.1.0: Generalized Linear Models (GLM), Decision Trees, Random Forests, Gradient Boosted Trees (GBT), and Deep Learning. GLMs were employed as a baseline because they are robust under small datasets with clear assumptions of linearity and distributional errors [11]. Tree-based models (Decision Tree, Random Forest, GBT) were used to capture potential non-linear interactions, with strict complexity control to mitigate overfitting given the limited sample size (<200 observations) [12,13]. A simple feed-forward Deep Learning model was also tested, though such models typically risk overfitting with small samples and offer limited interpretability [11].
Each model was trained on annual data (2012–2023) and validated using operator performance metrics in RapidMiner. Factor weights were extracted to identify the relative importance of each attribute. The correlation matrix was then performed to establish the correlation between factors and the number of potential dark-sky areas. Prediction accuracy was quantified using the relative error, defined in Equation (1), where e represents the deviation between expected and actual values. In summary, GLMs provided interpretable baselines, tree-based models offered improved predictive power under data constraints, and Decision Trees achieved the lowest relative error in our results.
RapidMiner software was used for model implementation. Annual datasets (2012–2023) containing five variables—GDP, population, unemployment rate, inflation rate, and year—were imported. Model accuracy was evaluated using operator performance metrics, and relative error was calculated as defined in Equation (1). This metric expresses the deviation of predicted from actual values as a percentage of the true value [14].
3. Results
Dark-sky maps of Thailand during 2012–2023 are presented in Figure 1 with color codes defined in Table 1. We can see that the sky has become brighter over time, with major cities like Bangkok and its surrounding areas already experiencing sky classes 13–14 in 2012. However, the city’s high level of development was not the cause of the brighter night sky, as explained in Section 4.
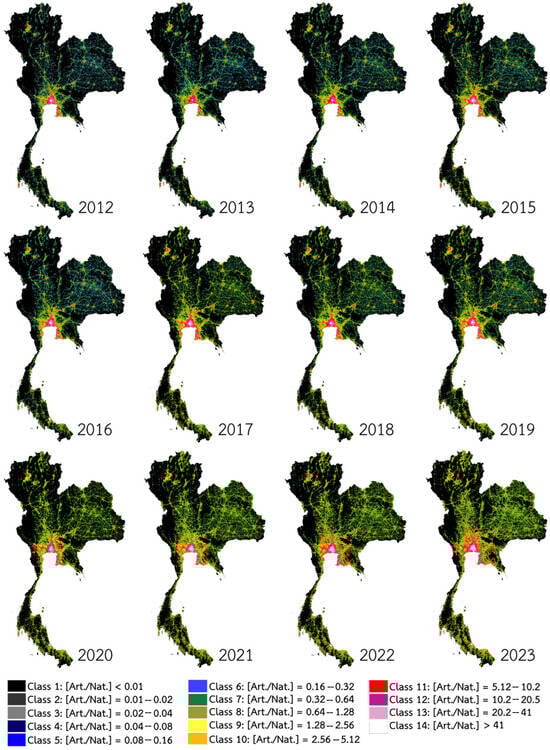
Figure 1.
Changes in sky brightness of Thailand from 2012–2023 presented in 14 color classes defined in Table 1. The figure was generated using public domain data extracted from NASA Earth Observatory by this paper. Generated from Elvidge et al. [15] under a CC BY license, with permission from the Earth Observation Group (EOG), original copyright 2017.
Figure 2 presents the dark-sky map for 2023, labeled with ranking numbers for 77 provinces of Thailand based on the number of potential dark-sky (Classes 1–9) areas. For clarity, the overlaid numbers denote provincial rankings (1–77) by the extent of potential dark-sky area (Classes 1–9); the underlying percentage values are reported in Table 2. Meanwhile, Table 2 summarizes the distribution of sky brightness classes across the provinces. The VIIRS data did not detect any areas in Classes 2–6 during the period of 2012–2023. This absence reflects a rapid shift from pristine or near-pristine skies (Class 1) directly toward brighter categories (Class 7 and above), without intermediate transitions. Future dark-sky tourism could benefit from these ranking numbers. With the exception of provinces ranked number 2 (Nakhon Ratchasima), number 5 (Ubon Ratchathani), and number 7 (Chaiyaphum), which are known for their large land areas, the top ten ranked provinces are concentrated along the western border in the Tanaosri mountain range, which extends in a north–south direction.
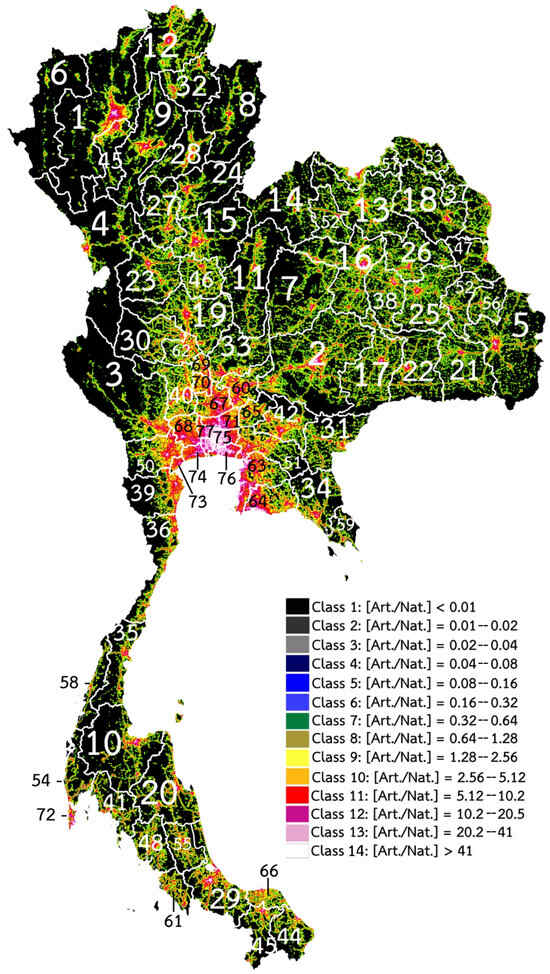
Figure 2.
Dark-sky map of Thailand in 2023. Provincial ranking numbers (1–77) are overlaid to indicate the relative extent of potential dark-sky areas (Classes 1–9). These rankings are based on the number of provincial pixels falling within Classes 1–9, as summarized in Table 2. Class colors follow the 14-level classification scheme of Falchi et al. [4], ranging from pristine (Class 1) to cone cell stimulation (Class 14). Data were derived from NASA Earth Observation Group VIIRS products (public domain).
Table 2.
Distribution of sky brightness classes across Thailand’s 77 provinces in 2023, expressed in both km2 and percentages. Classes 2–6 are not shown because no areas were detected in these ranges by the VIIRS data during 2012–2023. Rankings of provinces by the extent of potential dark-sky area (Classes 1–9) correspond to the numbers overlaid in Figure 2.
The changes in sky brightness classes 1–14 over Thailand, the UK, Chile, and Botswana during 2012–2023 are presented in Table 3. Figure 3 and Figure 4 show the percent of area of the potential dark sky (class 1–9) of the four countries during 2012–2023. In comparison with other countries, Thailand has been losing pristine dark sky at a much higher rate (75.0% in 2012 to 59.6% in 2023) compared with the UK, whose dark-sky area also remained almost unchanged (62.6% in 2012 to 63.4% in 2023). Meanwhile, the percentage of pristine dark-sky sites in Botswana remains almost unchanged (99.1% in 2012 to 98.4% in 2023), and light pollution seems to be one of the lowest in the world and even better than Chile’s (97.6% in 2012 to 92.3% in 2023), where major international observatories are located.
Table 3.
Annual distribution of sky brightness classes (1–14) from 2012 to 2023 across Thailand, the UK, Chile, and Botswana. Areas are reported in km2, with percentages in parentheses relative to each country’s land area. The table highlights long-term trends in dark-sky degradation and provides the dataset used for model evaluation (Table 4).
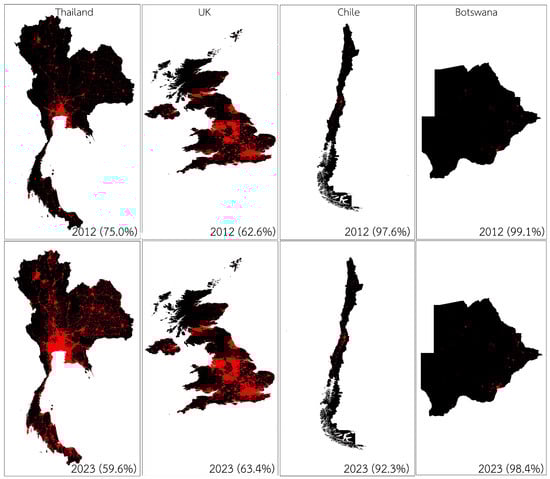
Figure 3.
Spatial changes in potential dark-sky area (Classes 1–9, black) and non-potential-dark-sky area (Classes 10–14, red) from 2012 to 2023 in Thailand, the UK, Chile, and Botswana. Values are expressed as the percentage of each country’s land area falling within Classes 1–9, relative to the total across all 14 sky brightness classes. Data derived from NASA Earth Observation Group VIIRS products (public domain), adapted from Elvidge et al. [15].
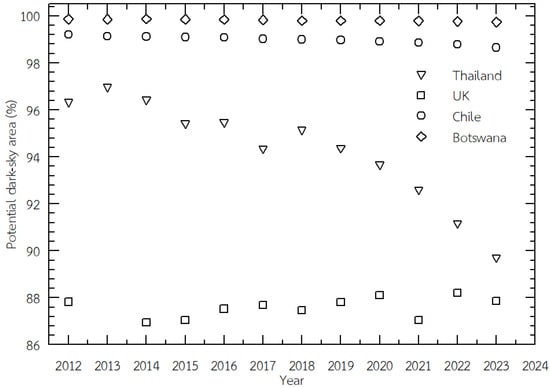
Figure 4.
Changes in the potential dark-sky (class 1–9) area of four countries from 2012 to 2023.
Figure 5 shows that potential dark-sky area is strongly and negatively correlated with GDP (r = −0.65) and population (r = −0.68), indicating that economic growth and demographic expansion are the dominant pressures reducing dark-sky availability. Inflation (r = 0.26) and unemployment (r = 0.24) exhibit only weak positive correlations, suggesting that broader macroeconomic fluctuations have little direct effect. These patterns imply that economic and demographic growth alone cannot fully explain the divergent outcomes observed internationally (Table 3; Figure 3 and Figure 4). Instead, policy measures—such as lighting regulations, urban planning, or designated dark-sky reserves—likely mediate how underlying economic pressures translate into actual sky brightness. This contrast emphasizes that there must be policy-driven interventions if Thailand is to avoid continued dark-sky loss.
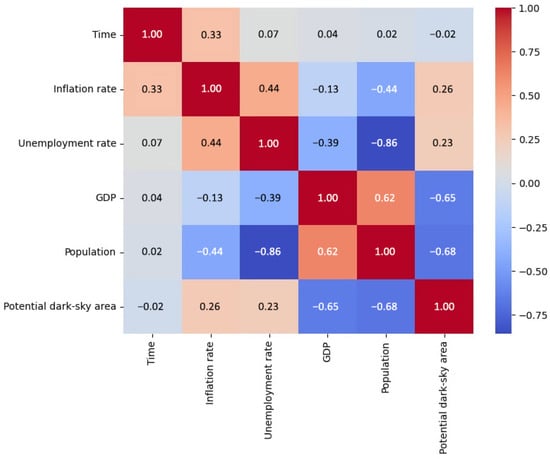
Figure 5.
Correlation metric showing relationships among inflation rate, unemployment rate, GDP, population, and number of potential dark-sky areas. Positive correlations are displayed in red and negative correlations in blue, with the intensity of color indicating correlation strength. The diagonal values of 1.00 represent the perfect correlation of each variable with itself.
Table 4 and Figure 6 together summarize the performance of the five predictive models and the relative influence of each socioeconomic attribute. Among the five models tested, the Decision Tree achieved the lowest relative error (0.4% ± 0.3%), followed by Gradient Boosted Trees (0.7% ± 0.4%) and Random Forest (2.1% ± 0.6%), while the Deep Learning (8% ± 1%) and Generalized Linear Model (9% ± 3%) performed less accurately. Factor weights extracted from these models (Table 4) indicated that the Decision Tree and GBT models gave the highest performance (i.e., lowest relative errors). When considering these two models, it was found that population and GDP consistently emerged as the strongest predictors of dark-sky loss, with an average weight (DT+GBT) of 0.065 for population and 0.046 for GDP, which agrees well with the correlation matrix shown in Figure 5. While the data from the four countries implied that inflation rate and unemployment rate showed only minor influence and time had a modest effect, the number of potential dark-sky areas in Thailand depended primarily on time alone, as shown in Figure 4.
Table 4.
Relative errors and normalized attribute weights from five predictive models applied to 2012–2023 data for Thailand, the UK, Chile, and Botswana. Errors indicate model accuracy in estimating potential dark-sky area (Classes 1–9). Attribute weights (Time, Population, Inflation, GDP, Unemployment) reflect the relative influence of each factor on predictions, averaged across models where applicable.
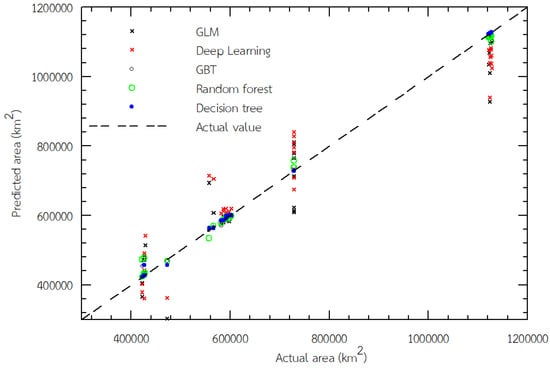
Figure 6.
Comparison of five predictive models (GLM, Decision Tree, Random Forest, Gradient Boosted Trees, Deep Learning) for estimating potential dark-sky area (Classes 1–9) using 2012–2023 data. Panels summarize relative errors and corresponding normalized attribute weights (Time, Population, Inflation rate, GDP, Unemployment rate). See Table 4 for numerical values.
Figure 3 and Figure 4 illustrate international contrasts in dark-sky trends from 2012 to 2023. Thailand experienced the steepest decline, with the potential dark-sky area falling from 75.0% to 59.6% of the national territory. By contrast, the UK remained stable (62.6% to 63.4%), Botswana preserved nearly all of its dark-sky area (99.1% to 98.4%), and Chile showed a moderate decline (97.6% to 92.3%) despite hosting major international observatories. These differences cannot be attributed to economic indicators alone. The UK’s stability reflects not only policy interventions but also its compact geography and established urban infrastructure, whereas Botswana’s vast rural landscapes buffer against sky brightening. Thailand’s rapid urbanization and expanding infrastructure exert much stronger pressures in the absence of dark-sky protection measures. Chile lies in between, combining low population density with localized pressures near metropolitan areas. Together, these results highlight that both socioeconomic drivers and policy frameworks mediate the trajectory of dark-sky conservation.
4. Discussion
Our findings indicate that neither population size, GDP, nor other economic factors explain national trends in sky brightness. Instead, country-level policy on dark-sky reserves and lighting regulations appears decisive. For example, while Bangkok and its surrounding provinces rapidly deteriorated, other countries with active policies (e.g., the UK) have stabilized their skies despite comparable urbanization.
We also noted that VIIRS data for the UK in 2013 were incomplete, detecting only the southern part of the country. This limitation suggests that caution should be applied when interpreting that year’s results.
Overlaying our maps with Thailand’s 2023 population census reveals that more than 60% of the Thai population (living in 4.5% of the land area) have already lost naked-eye visibility of the Milky Way. Within this group, over one-fifth of the population (living in less than 1% of the land area) are exposed to extremely high nighttime light intensities that prevent dark adaptation. These findings emphasize the societal relevance of dark-sky degradation.
The strong negative correlations between potential dark-sky area and both GDP and population emphasize the pressures of economic growth and urban expansion on night-sky preservation. As land resources are increasingly utilized for industrial, residential, and infrastructural development, the availability of dark-sky areas declines, consistent with previous studies linking urbanization to changes in land use and light pollution [16,17]. By contrast, the weak associations with inflation and unemployment suggest that short-term economic fluctuations play a minor role compared with long-term structural drivers. These results underscore the need to integrate dark-sky conservation into urban planning and sustainable development strategies, particularly in rapidly growing economies.
These convergent results underscore the robustness of tree-based approaches in capturing non-linear dynamics within small datasets, while also emphasizing that demographic and economic growth remain the dominant pressures on night-sky quality. At the same time, differences between countries also reflect geographic setting, urbanization patterns, and policy contexts, which must be interpreted with caution in international comparisons.
4.1. Limitations of VIIRS Sensitivity to LED Wavelengths
One limitation of the VIIRS Day/Night Band (DNB) sensor is its reduced sensitivity to short-wavelength (blue-rich) emissions from white LEDs [18]. As Thailand increasingly adopted LED lighting during the study period, VIIRS may underestimate actual upward-directed light. This could explain why VIIRS-derived trends sometimes appear stable even when ground observations indicate worsening conditions [3,6]. Future work should combine VIIRS data with ground-based photometry or new sensors with broader spectral response.
Beyond economic and demographic drivers, the societal implications of dark-sky loss are profound. Artificial night lighting disrupts circadian rhythms, with consequences for sleep quality, mental health, and metabolic processes in humans [2]. Ecologically, nocturnal species face altered behavior, reduced foraging efficiency, and disrupted predator–prey interactions, contributing to biodiversity decline [7]. Culturally, the disappearance of the Milky Way from populated areas represents a loss of shared heritage, weakening traditions that link communities to the natural night sky. For Thailand, these impacts intersect with tourism and education: protecting dark-sky areas could support both ecotourism and astrotourism, offering economic incentives for conservation.
At the same time, caution is warranted in interpreting the international comparisons. While the UK’s relative stability may reflect effective lighting regulations, it is also shaped by geographic compactness and established infrastructure. Botswana’s preservation of pristine skies arises not from explicit policy alone but from its low population density and rural land use. Chile demonstrates that even in countries with world-class observatories, urban pressures can gradually encroach on night-sky quality. Thailand’s trajectory is therefore not predetermined but contingent: without intervention, rapid urbanization is likely to accelerate losses, but targeted lighting policies, urban planning, and protected areas could significantly alter future outcomes. These findings emphasize that conservation outcomes emerge from the interaction of policy, geography, and development stage, rather than from any single factor.
4.2. Societal and Conservation Implications
Beyond economic and demographic drivers, the societal consequences of dark-sky loss are extensive. Artificial night lighting disrupts circadian rhythms, with adverse effects on sleep quality, mental health, and metabolic processes in humans [2]. Ecologically, nocturnal species experience altered activity patterns, reduced foraging success, and disrupted predator–prey dynamics, which together accelerate biodiversity decline [7]. Culturally, the disappearance of the Milky Way from populated areas erodes a shared human heritage, weakening traditions and experiences that have historically connected communities to the natural night sky. In Thailand, where tourism is a growing economic sector, conserving dark-sky areas could strengthen ecotourism and astrotourism while also enhancing science education and public engagement with astronomy.
Interpretation of international contrasts further underscores that conservation outcomes depend on multiple interacting factors. The UK’s relative stability in dark-sky areas may partly reflect compact geography and established infrastructure, but targeted policy measures have also played a role. Legislation such as the Clean Neighbourhoods and Environment Act (2005) brought certain forms of exterior lighting under statutory control, and subsequent initiatives promoted energy-efficient and shielded fixtures. Growing public awareness, the designation of dark-sky reserves, and astrotourism opportunities further reinforced conservation outcomes. Botswana’s near-pristine skies arise not from policy alone but also from its low population density and rural land use. Chile illustrates how even countries with premier astronomical observatories can face gradual losses driven by urban expansion. Thailand’s trajectory is therefore contingent rather than inevitable: without intervention, rapid urbanization is likely to accelerate degradation, but targeted policies—such as shielded lighting, urban planning measures, and the designation of dark-sky reserves—could substantially alter future outcomes. These findings demonstrate that dark-sky preservation is not merely an environmental or astronomical concern but a multidimensional issue linking human health, biodiversity, cultural heritage, and sustainable development.
5. Conclusions
This study presents the first comprehensive dark-sky map of Thailand, derived from NPP–VIIRS data spanning 2012–2023. Our analysis showed a significant decline in pristine night skies, resulting in a reduction in potential dark-sky areas by 15.4% since 2012. By contrast, the UK and Botswana retained stable proportions of dark sky, while Chile showed gradual decline. These international contrasts highlight that conservation outcomes emerge from the interaction of geography, urbanization, and policy measures rather than from economic growth alone.
Model testing demonstrated that tree-based approaches (Decision Tree, GBT, and Random Forest) achieved the lowest relative errors, with population and GDP consistently emerging as the strongest predictors of dark-sky loss. Inflation and unemployment played only minor roles, underscoring that long-term structural drivers outweigh short-term fluctuations. These results confirm that demographic and economic pressures are primary threats to night-sky quality.
For Thailand, the only country whose number of potential dark-sky areas depends solely on time, the dark-sky conservation policy is urgent. Thailand societal relevance of these findings is acute: more than 60% of the population has already lost naked-eye visibility of the Milky Way, and one-fifth is exposed to light levels preventing dark adaptation. Thailand’s rapid transition to LED street lighting after 2015, while improving energy efficiency, has unintentionally intensified skyglow because blue-rich emissions scatter more strongly in the atmosphere than the sodium lamps they replaced. Protecting remaining dark-sky areas will therefore require urgent interventions, including lighting regulations, urban planning measures, and the designation of dark-sky reserves. Such measures would directly support multiple UN Sustainable Development Goals, particularly SDG 11 (sustainable cities and communities), SDG 7 (affordable and clean energy), and SDG 15 (life on land). Dark-sky conservation thus represents not only an environmental imperative but also a strategic opportunity for sustainable development in Thailand and beyond.
Author Contributions
Conceptualization, F.S. and M.F.B.; methodology, F.S. and T.C.; data curation, J.W.; data visualization, T.C. and S.N.; writing—original draft, F.S., S.P., B.S. and M.F.B. All authors have read and agreed to the published version of the manuscript.
Funding
This research was funded by the National Astronomical Research Institute of Thailand (NARIT) grant number FFB680072/0269 and Chiang Rai Rajabhat University grant number B367019. The APC was funded by NARIT.
Institutional Review Board Statement
Not applicable.
Informed Consent Statement
Not applicable.
Data Availability Statement
The original data presented in the study are openly available at https://science.crru.ac.th/download/fahrung/thailanddarkskymap.zip (accessed on 30 August 2025).
Acknowledgments
We acknowledge the use of data from the Visible Infrared Imaging Radiometer Suite (VIIRS) nighttime lights provided by the Earth Observation Group (EOG), Payne Institute for Public Policy, Colorado School of Mines, for making the datasets publicly available under the Creative Commons Attribution 4.0 International license (CC-BY 4.0). During the preparation of this manuscript, the authors used SciSpace for the purposes of literature review and used ChatGPT 5 for the purposes of paraphrasing and language rearrangement. The authors have reviewed and edited the output and take full responsibility for the content of this publication.
Conflicts of Interest
The authors declare no conflicts of interest. The funders had no role in the design of the study; in the collection, analyses, or interpretation of data; in the writing of the manuscript; or in the decision to publish the results.
References
- Longcore, T.; Rich, C. Ecological light pollution. Front. Ecol. Evol. 2004, 2, 191–198. [Google Scholar] [CrossRef]
- Gaston, K.; Visser, M.; Hölker, F. The biological impacts of artificial light at night: The research challenge. Philos. Trans. R. Soc. B Biol. Sci. 2015, 370, 20140133. [Google Scholar] [CrossRef] [PubMed]
- Kyba, C.C.M.; Kuester, T.; de Miguel, A.S.; Baugh, K.; Jechow, A.; Hölker, F.; Bennie, J.; Elvidge, C.D.; Gaston, K.J.; Guanter, L. Artificially lit surface of Earth at night increasing in radiance and extent. Sci. Adv. 2017, 3, e1701528. [Google Scholar] [CrossRef] [PubMed]
- Falchi, F.; Cinzano, P.; Duriscoe, D.; Kyba, C.C.M.; Elvidge, C.D.; Baugh, K.; Portnov, B.A.; Rybnikova, N.A.; Furgoni, R. The new world atlas of artificial night sky brightness. Sci. Adv. 2016, 2, e1600377. [Google Scholar] [CrossRef] [PubMed]
- Kocifaj, M.; Bará, S.; Falchi, F. Towards a global map of the artificial all-sky brightness. Mon. Not. R. Astron. Soc. MNRAS 2022, 513, L25–L29. [Google Scholar] [CrossRef]
- Barentine, J.C. Night sky brightness measurement, quality assessment and monitoring. Nat. Astron. 2022, 6, 1120–1132. [Google Scholar] [CrossRef]
- Hölker, F.; Wolter, C.; Perkin, E.K.; Tockner, K. Light pollution as a biodiversity threat. Trends Ecol. Evol. 2010, 25, 681–682. [Google Scholar] [CrossRef] [PubMed]
- Campaign to Protect Rural England (CPRE). Shedding Light on Light Pollution: Tackling Artificial Light at Night. 2020. Available online: https://www.cpre.org.uk/wp-content/uploads/2019/11/Shedding_light_leaflet.pdf (accessed on 30 August 2025).
- Grauer, A.D.; Grauer, P.A.; Davies, N.; Davies, G. Impact of Space Weather on the Natural Night Sky. Publ. Astron. Soc. Pac. 2019, 131, 114508. [Google Scholar] [CrossRef]
- Alarcon, M.R.; Serra-Ricart, M.; Lemes-Perera, S.; Mallorquín, M. Natural Night Sky Brightness during Solar Minimum. Astron. J. 2021, 162, 25. [Google Scholar] [CrossRef]
- Xu, P.; Ji, X.; Li, M.; Lu, W. Small data machine learning in materials science. npj Comput. Mater. 2023, 9, 42. [Google Scholar] [CrossRef]
- Barreñada, L.; Dhiman, P.; Timmerman, D.; Boulesteix, A.L.; Van Calster, B. Understanding overfitting in random forest for probability estimation: A visualization and simulation study. Diagn. Progn. Res. 2024, 8, 14. [Google Scholar] [CrossRef] [PubMed]
- Couronné, R.; Probst, P.; Boulesteix, A.L. Random forest versus logistic regression: A large-scale benchmark experiment. BMC Bioinform. 2018, 19, 270. [Google Scholar] [CrossRef] [PubMed]
- Mahmood, Y.; Kama, N.; Azmi, A.; Khan, A.S.; Ali, M. Software effort estimation accuracy prediction of machine learning techniques: A systematic performance evaluation. Softw. Pract. Exp. 2022, 52, 39–65. [Google Scholar] [CrossRef]
- Elvidge, C.D.; Baugh, K.; Zhizhin, M.; Hsu, F.; Ghosh, T. VIIRS night-time lights. Int. J. Remote Sens. 2017, 38, 5860–5879. [Google Scholar] [CrossRef]
- Li, S.; Fu, M.; Tian, Y.; Xiong, Y.; Wei, C. Relationship between Urban Land Use Efficiency and Economic Development Level in the Beijing–Tianjin–Hebei Region. Land 2022, 11, 976. [Google Scholar] [CrossRef]
- Mahtta, R.; Fragkias, M.; Güneralp, B.; Mahendra, A.; Reba, M.; Wentz, E.; Seto, K. Urban land expansion: The role of population and economic growth for 300+ cities. npj Urban Sustain. 2022, 2, 5. [Google Scholar] [CrossRef]
- Ou, J.; Liu, X.; Li, X.; Li, M.; Li, W. Evaluation of NPP-VIIRS Nighttime Light Data for Mapping Global Fossil Fuel Combustion CO2 Emissions: A Comparison with DMSP-OLS Nighttime Light Data. PLoS ONE 2015, 10, e0138310. [Google Scholar] [CrossRef]


Disclaimer/Publisher’s Note: The statements, opinions and data contained in all publications are solely those of the individual author(s) and contributor(s) and not of MDPI and/or the editor(s). MDPI and/or the editor(s) disclaim responsibility for any injury to people or property resulting from any ideas, methods, instructions or products referred to in the content. |
© 2025 by the authors. Licensee MDPI, Basel, Switzerland. This article is an open access article distributed under the terms and conditions of the Creative Commons Attribution (CC BY) license (https://creativecommons.org/licenses/by/4.0/).