Abstract
SThe green finance structure refers to the configuration of financial instruments within the green finance system, the optimization of which is crucial for efficient resource allocation and corporate green transformation. Using panel data from Chinese A-share listed companies from 2014 to 2021, this study empirically examines the relationship between green finance structure and corporate green transformation. The results reveal a significant inverted U-shaped relationship, indicating that a coordinated balance between market-based and bank-based instruments most effectively promotes green transformation. This relationship is influenced by technological and institutional environments: in high-tech industries and regions with weaker environmental regulations, a more market-oriented green finance structure is associated with stronger transformation performance. Further analysis identifies a significant synergistic effect between green credit and green bonds, showing that their complementarity can further enhance corporate green transformation and varies across different technological and institutional contexts. Heterogeneity analysis indicates that the inverted U-shaped pattern is more pronounced in western regions and among firms with stronger internal control systems, while eastern and central regions exhibit a more linear positive relationship. Overall, this study introduces a structural perspective to explain the role of green finance in supporting corporate sustainability transitions and provides new empirical evidence for optimizing the green financial system.
1. Introduction
Faced with increasingly severe global environmental concerns, many countries are grappling with how to strike a balance between economic development and environmental protection [1]. China, the world’s largest developing country and a key manufacturing powerhouse, is currently in the midst of a significant economic transformation and green growth. As significant participants in the market economy, firms’ green transformation is critical not only for their own long-term prosperity but also for China’s ecological civilization initiatives and carbon neutrality ambitions. Corporate green transformation necessitates changes in production and operational models that improve both environmental and economic performance [2]. However, various problems arise during this process, including resource limits, lengthy investment return periods, and the ambiguity of green technology paths. Limited financial support and poor funding channels have been cited as significant barriers to green transformation.
In light of this, green finance has increasingly emerged as a major tool for encouraging firms’ green transformation. Green finance directs the flow of funds to environmentally friendly industries and projects, optimizes resource allocation, promotes green technological innovation, and provides long-term and stable financial support for enterprises, thereby strongly supporting their sustainable development [3,4]. However, there is still controversy about whether green finance can effectively assist green corporate transformation. Some studies argue that green finance can promote green transformation by lowering financing costs and optimizing resource allocation [5,6], whereas others argue that green finance has the risk of greenwashing or pollution transfer, which may limit the financing ability of high-polluting enterprises [7,8]. The primary reason for this disparity is that most existing studies concentrate on the direct effects of individual instruments—such as green credit or green bonds—on either macroeconomic outcomes or firm-level behaviors. The structural link between the various green financial products has received little attention.
According to the new structural finance theory, the financial structure is the relative composition of financing techniques within the financial system. It primarily includes bank-led indirect finance and capital market-based direct finance. To improve the efficiency of financial resource allocation, the financial structure should be compatible with the actual economy’s developmental stage and structural characteristics. Green credit continues to hold a dominating position in China’s contemporary green financial system, thanks to its strong risk control capabilities and high capital security. It primarily serves green projects with an excellent credit history and low risk. Green bonds use the market mechanism to increase resource allocation efficiency through information disclosure and price discovery functions. It is better suited for green projects with high capital requirements and a mature development stage. Therefore, stronger coordination and complementarity between green credit and green bonds, as well as other instruments, are required to optimize the structure of green finance.
Based on the preceding context, this article focuses on the impact of green finance structures on corporate green transformation, raising the following basic questions: Do different green finance instruments have varying effects on corporate green transformation? What type of green financial structure is most successful in promoting enterprise green transformation? Does the suitability of green finance structures vary across different technological and institutional environments?
Compared with existing studies that primarily focus on single green financial instruments such as green credit or green bonds, this study adopts a structural perspective to examine how the configuration between market-based and bank-based instruments affects corporate green transformation. Unlike previous research that emphasizes either financial or environmental outcomes, our analysis identifies a nonlinear relationship between green finance structure and transformation performance, providing new insights into the optimal balance of financial instruments. Moreover, by incorporating technological and institutional environments, this study extends prior research by highlighting how variations in external contexts shape the effectiveness of green finance, offering a more dynamic understanding of its role in corporate green transformation. Overall, this research bridges structural finance theory with firm-level evidence, advancing the understanding of how financial system structures contribute to sustainable transformation.
The remainder of this paper is organized as follows. Section 2 reviews the relevant literature. Section 3 develops the theoretical framework and hypotheses. Section 4 describes the data, variables, and methodology. Section 5 presents the empirical results and robustness tests. Section 6 provides further analysis. Section 7 concludes with key findings, policy implications, and future research directions.
2. Literature Review
2.1. Green Finance and Corporate Green Transformation
There is an ongoing debate regarding the influence of green finance on corporate green transformation, with divergences arising along two dimensions—financial and environmental outcomes. On the financial side, green credit policies may tighten financing constraints for heavily polluting firms and thus weaken their investment capacity [9]. At the same time, green finance can operate through reputational and disclosure channels that enhance market trust and competitive advantages, improving firms’ financial performance [10]. Empirical evidence based on regional green finance indices also indicates financial gains through capital aggregation and knowledge transmission [11]. These findings suggest that the financial effects of green finance are context-dependent and mechanism-specific.
On the environmental side, multiple mechanisms have been documented. Green bonds can generate industry spillovers that raise peer standards and environmental investment, while green credit reduces lending to high-emission, energy-intensive firms and increases their debt costs [12,13]. In parallel, green finance may reduce emissions by raising environmental awareness, increasing green investment, and improving production efficiency [8]. Evidence from low-carbon city practices also suggests that ecological efficiency can be enhanced through green technology innovation, underscoring the role of innovation in linking financial and environmental outcomes [14]. Nevertheless, countervailing forces exist: tighter constraints may induce relocation of polluting activities toward laxer jurisdictions, and financial limitations can trigger short-termism that weakens abatement efforts and raises social and environmental costs [7,15]. Overall, environmental effects remain heterogeneous across settings and channels.
Taken together, most prior work evaluates the overall effectiveness of green finance but pays less attention to instrument-level heterogeneity and to how different tools interact. Recent firm-level evidence shows that green credit policies reduce energy-consumption intensity by easing financing constraints and supporting technological upgrading [16]. By contrast, although green bonds create spillover and signaling effects within industries, their financial and environmental impacts are not always aligned, partly due to disclosure and verification frictions that raise greenwashing risk [17]. This pattern motivates a shift from single-instrument evaluations to a structural perspective that examines how the configuration and complementarity of green financial tools shape corporate green transformation.
2.2. Green Financial Structure
Research on green financial structures is still limited. Related research has focused mostly on the relationship between financial structure and company or economic development. Early studies often minimized the impact of financial structure, focusing instead on the contribution of financial size to economic growth and paying insufficient attention to the structural makeup of the financial structure [18]. The financial structure irrelevance hypothesis contends that financial structure has no discernible impact on economic progress. However, current research indicates that economic development is not just influenced by the size of the financial system, but also by its structure. Financial structure is receiving more attention for its role in improving resource allocation efficiency and mitigating financial risks [19].
There is ongoing debate on the impact of financial structure on macroeconomic development and firm-level behavior, primarily between the “bank-based” and “market-based” viewpoints. Banks have intrinsic advantages in addressing information asymmetries, lowering financing costs, and stimulating technological innovation [20]. In a bank-dominated financial system, long-term credit relationships and information-sharing procedures between banks and enterprises improve banks’ ability to distribute money to innovative ventures [21]. In such a system, green credit, an indirect financing mechanism, can reduce information rents and collateral limits, giving more external finance to creative enterprises [12]. However, banks’ conservative risk management methods frequently restrict lending to high-risk technological advances, reducing their capacity to assist enterprises with their green transition [22,23].
The market-based perspective emphasizes the benefits of financial markets in price discovery, risk diversification, and capital liquidity, which allow for more effective support for technological innovation projects [24]. Markets provide more financing possibilities for high-risk businesses by disclosing information through pricing mechanisms and optimizing resource allocation [25]. Green bonds, as a market-driven financial instrument, can direct capital flows toward green technology innovation by utilizing market disclosure and price signaling methods [26].
The evolution of financial structure theory provides an analytical foundation for identifying the heterogeneous effects of green financial instruments. The shift from traditional bank-based to market-based finance highlights institutional differences between financing channels in terms of resource allocation efficiency and risk-bearing capacity.
2.3. Literature Commentary
Overall, existing studies have laid a solid theoretical and empirical foundation for understanding the relationship between green finance and corporate green transformation. However, several important gaps remain to be addressed.
First, existing studies tend to focus on a single green financial instrument, such as green credit or green bonds, overlooking the fundamental differences among various financing approaches in terms of their functional orientation, incentive mechanisms, and risk-sharing pathways. Second, there remains considerable divergence in the findings on the effectiveness of green finance, particularly regarding its impact on financial and environmental performance. These differences also vary across regions, firm characteristics, and governance levels. Although some studies have identified heterogeneous effects through subgroup or interaction analyses, few have provided in-depth explanations of the underlying structural mechanisms. In particular, the compatibility between green finance structures and institutional environments has not been systematically addressed. Finally, research on green financial structure remains at an early stage. Although the distinction between bank-based and market-based finance offers a useful theoretical framework for understanding the functional differences among financing channels, this perspective has not yet been fully integrated into the study of green finance.
Against this backdrop, this paper centers on the green finance structure, examining how the configuration of different financing instruments influences corporate green transformation performance. It provides a structural theoretical foundation and practical implications for green transition policy formulation.
3. Theoretical Analysis and Research Hypotheses
3.1. Impact of Green Financial Structures on Corporate Green Transformation
The green finance structure refers to the proportional allocation and synergistic relationships among different green financial instruments within the financial system, reflecting how financial resources are distributed and interact across various financing channels. The green finance system generally comprises three main categories of instruments: market-based instruments (e.g., green bonds), bank-based instruments (e.g., green credit), and government-supported and non-market instruments (e.g., green funds and green insurance). Among them, non-market instruments play an external supporting role in promoting green transformation, while the balance between bank- and market-based instruments constitutes the core of the internal financial structure. Accordingly, this study focuses on the subsequent analysis of the structural effects between market-based and bank-based instruments. Figure 1 illustrates the internal composition of the green finance structure.
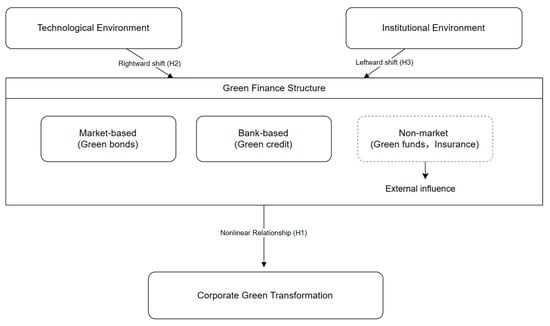
Figure 1.
Mechanisms of green finance structure on corporate green transformation.
China’s green finance system has long been bank-dominated, with green credit accounting for the majority of total green financing. According to credit allocation theory, banks have comparative advantages in information acquisition and risk assessment, enabling effective support for low-risk and short-term green projects through long-term relationships and supervision mechanisms [27,28]. In contrast, green bonds, as market-oriented direct financing instruments, rely on market pricing, disclosure, and risk diversification to support capital-intensive, long-term, and innovation-driven projects such as green infrastructure and environmental technology R&D [24].
The structural balance between green credit and green bonds is crucial for promoting corporate green transformation. Green credit provides stable funding and supervision, while green bonds strengthen market incentives and information transparency. A moderate balance integrates these advantages, improving resource allocation efficiency and the authenticity of green investment. From the perspective of stakeholder theory, a balanced financial structure aligns the incentives of banks, investors, and regulators, strengthening external monitoring and reputational discipline; based on the resource-based view, diversified financing channels serve as strategic resources that enhance firms’ green innovation and sustainable transformation capabilities [29]. In contrast, overreliance on a single financing channel may distort incentives and amplify the risk of greenwashing, as firms may prioritize symbolic compliance over substantive environmental performance, thereby undermining the governance effectiveness of green finance.
In summary, a balanced green financial structure is more conducive to corporate green transformation than a single financing structure. Accordingly, Hypothesis 1 is proposed.
H1:
The configuration of financing instruments in green finance has a nonlinear relationship with corporate green transformation, with an optimal structure that maximizes transformation outcomes.
3.2. Effects of Technological and Institutional Environments on Optimal Green Finance Structure
The external technological and institutional environments in which firms pursue green transformation largely shape the optimal configuration of green finance structures. This paper examines their effects on the adaptability of green finance structures from two perspectives: technological environment, measured by industry-level technological intensity, and institutional environment, captured by the stringency of environmental regulations faced by firms.
In terms of the technological environment, industrial structure refers to the relative composition and interrelationships of various industries within a region at a given time, reflecting its stage of economic development and level of technological advancement [30]. High-tech factor-intensive industries, characterized by strong innovation capacity and market competitiveness, differ significantly from traditional low-tech sectors, yet they also face greater R&D expenditures and financial constraints [31]. According to the theory of new structural finance, financial structures can effectively support corporate green transformation only when aligned with the underlying characteristics of industrial development [32]. From a risk perspective, high-tech projects are often characterized by greater uncertainty and a higher probability of technological failure. Due to risk aversion and internalized risk control mechanisms, traditional credit financing is generally reluctant to absorb such risks. In contrast, direct financing instruments such as green bonds can more effectively accommodate high-risk projects through market-based risk diversification mechanisms [33]. From the perspective of maturity matching, green technology R&D and infrastructure projects typically involve long cycles and delayed returns, thereby requiring stable and sustainable medium- to long-term financing [34]. Compared with bank loans, green bonds offer greater flexibility in maturity structures and more diversified funding sources, making them more suitable for such capital-intensive and long-horizon projects. In terms of financing scale, high-tech projects often demand substantial initial investment and sustained capital input. Bank credit faces limitations in both credit ceilings and single-source funding, while capital markets possess superior resource mobilization and capital aggregation capabilities. These financing characteristics suggest that high-tech-intensive industries are more compatible with market-oriented green direct financing, where green bonds offer a natural advantage in meeting their financing needs. Therefore, in regions with higher technological intensity, the proportion of market-oriented instruments in the green finance structure increases, shifting the optimal configuration threshold rightward.
In terms of institutional environment, environmental regulation influences firms’ financing decisions and resource allocation through policy incentives, regulatory constraints, and market signals [35]. First, the promotion theory suggests that moderate environmental regulation can stimulate green technological innovation by firms [36]. Through the innovation compensation effect, firms may offset compliance-related cost pressures, thereby facilitating their green transformation [37]. Green credit relies on banks’ capabilities to assess corporate creditworthiness and environmental performance to allocate financial resources accordingly. When supplemented by policy tools such as preferential interest rates and green refinancing, green credit’s transmission effectiveness and allocation efficiency are further enhanced, making it particularly effective under stringent environmental regulation. Second, the suppression theory posits that environmental regulation may impose a crowding-out effect on firms [38]. Stringent policies significantly raise compliance costs, constraining firms’ financial capacity to invest in green upgrades and technological improvements [39]. As a market-based instrument, green bonds may face limitations in accessibility, especially in the early stages, due to strict compliance requirements and procedural complexity. Issuing green bonds typically involves rigorous information disclosure, green certification, and third-party evaluation, all of which elevate the initial costs and administrative burden associated with financing. Therefore, stronger environmental regulation is associated with a higher share of bank-dominated instruments in the green finance structure, shifting the optimal configuration point leftward. Figure 2 and Figure 3, respectively, present the moderating effects of technological and institutional environments, corresponding to Hypotheses 2 and 3.
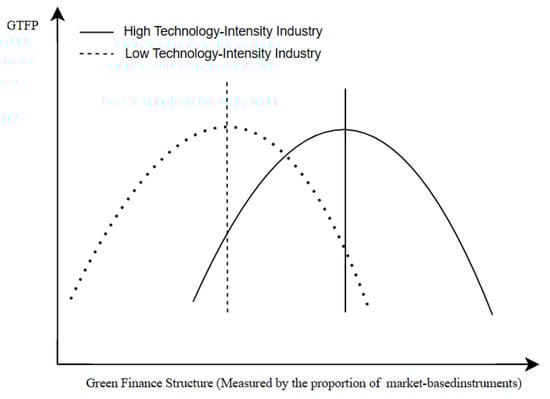
Figure 2.
Impact of Technological Environment.
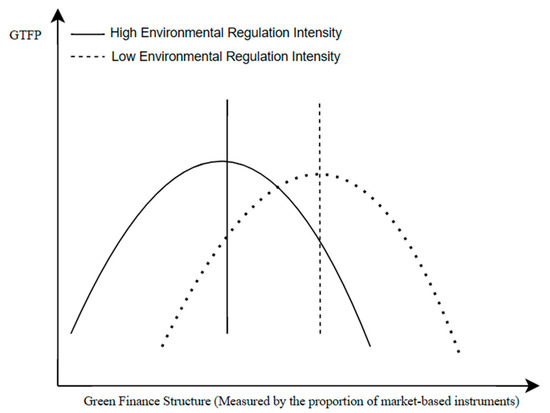
Figure 3.
Impact of Institutional Environment. Note: These figures are illustrative only and do not correspond to precise functional values.
H2:
Technological environment moderates the inverted U-shaped relationship between green finance structure and green transformation, with higher technological intensity favoring market-based instruments.
H3:
Institutional environment moderates the inverted U-shaped relationship between green finance structure and green transformation, with stronger regulation favoring bank-based instruments.
4. Data and Methodology
4.1. Sample and Data
This study examines Chinese A-share listed companies on the Shanghai and Shenzhen stock exchanges from 2014 to 2021. Firm-level characteristics and financial data are obtained from the CSMAR database, while provincial-level data are collected from various editions of the China Statistical Yearbook. Data related to green finance are sourced from the National Financial Regulatory Administration of China, the People’s Bank of China, the CSMAR database, and the Wind database. To ensure data reliability and representativeness, this study excludes financial firms and further removes companies that had been listed for less than one year, were labeled as ST, or had severe data deficiencies. Based on this, all continuous variables are winsorized at the 1st and 99th percentiles to mitigate the influence of extreme values on the estimation results. The final sample consists of 19,733 firm-year observations.
4.2. Variable Measurement
4.2.1. Independent Variable
This paper considers the green financial structure (GFS) as the independent variable. Green credit and green bonds, the two primary instruments in China’s green financial system in terms of scale and policy coverage, are selected as representative components. Accordingly, the proportion of green bonds in the total amount of green credit and green bonds is used as a proxy for GFS, reflecting the relative share of direct financing in the allocation of green financial resources [40]. Due to data limitations, green credit statistics are available only at the national level for major banks, with no disaggregated provincial data. Previous studies often use interest expenses in several energy-intensive industries as a proxy. To improve measurement accuracy, this study collects green credit balance data from 38 listed and state-owned commercial banks in China, including six large state-owned banks and twelve joint-stock commercial banks. Provincial-level green credit balances are then estimated using a branch-ratio weighting method, in which each bank’s total green credit is multiplied by the ratio of its branches in a province to its total branches nationwide, and the results are aggregated across banks. This approach is grounded in the branch-driven business model, where the number of bank outlets is positively associated with business scale and credit activity [41]. Empirical evidence indicates that branch closures significantly reduce local lending, while broader and more decentralized branch networks enhance credit accessibility and market reach. Therefore, branch distribution serves as a valid and empirically supported proxy for the spatial allocation of credit when provincial-level data are unavailable [42,43].
4.2.2. Dependent Variable
This study uses corporate green total factor productivity (GTFP) as a proxy for corporate green transformation [8]. GTFP measures green production efficiency by accounting for pollutant emissions and resource consumption, evolving from the traditional total factor productivity framework. By incorporating energy inputs and pollutant emissions into the efficiency evaluation, GTFP captures the environmental costs of corporate development and provides a comprehensive assessment of green production efficiency. The input and output indicators for GTFP are defined as follows. First, labor input is proxied by the number of employees. Capital input is estimated using the perpetual inventory method:
where is the capital stock in period t, is the depreciation rate set at 5%, is net fixed asset investment in period t, and is the investment price index of the firm’s province in period t. Energy input is proxied by the industrial electricity consumption of the city where the firm is located. Second, the expected output is represented by the firm’s operating revenue. Third, undesired outputs are measured by regional industrial pollutant emissions, including industrial sulfur dioxide (SO2), industrial wastewater, and industrial smoke emissions. To further ensure robustness, this study also employs the Global Malmquist-Luenberger (GML) index as an alternative measure of green total factor productivity in robustness tests.
4.2.3. Moderating Variables
This study examines two moderating factors: environmental regulation and industrial structure. Environmental regulation intensity is captured through two complementary measures. The first (ER1) reflects the share of regional fiscal expenditure devoted to environmental protection, indicating the strength of government-led environmental governance. The second (ER2) is based on the frequency of environment-related keywords in provincial government work reports, representing policy attention and regulatory emphasis on environmental issues. Together, these measures provide a more comprehensive depiction of environmental regulation intensity from both fiscal and policy perspectives.
Industrial structure (Ins) is assessed based on the degree of technological intensity. Based on the 2017 Classification of High-Tech Industries (Manufacturing) defined by the National Bureau of Statistics of China, high-tech industries include six major categories: pharmaceutical manufacturing, aerospace vehicle and equipment manufacturing, electronic and communication equipment manufacturing, computer and office equipment manufacturing, medical instruments and meters manufacturing, and information-based chemical manufacturing. This study uses the ratio of the output value of high-tech industries to the total output value of the manufacturing sector in each province as a proxy indicator of industrial structure.
4.2.4. Control Variables
This paper incorporates both firm-level and regional-level control variables into the model to account for other factors that may influence corporate green transformation. Firm-level control variables include firm age (Firmage), firm size (Size), cash flow ratio (Cashflow), leverage ratio (Lev), equity multiplier (EM), ownership concentration (Top1), audit opinion (Big4), asset structure (Fixed), and Tobin’s Q (TobinQ), capturing characteristics related to business operations, financial health, capital structure, and corporate governance. Regional-level control variables include the level of economic development (ED) and financial development (FD), which are measured by GDP per capita and the ratio of total regional deposits and loans to regional GDP, respectively. Detailed definitions of these variables are provided in Table 1. Descriptive statistics of the main variables are presented in Table 2.

Table 1.
Descriptive statistics of variables.
Table 2.
Descriptive statistics.
4.3. Model Setup
4.3.1. Baseline Model
To empirically test the hypothesized inverted U-shaped relationship between green finance structure (GFS) and corporate green transformation (GTFP), this study establishes the following panel benchmark model:
where denotes the green total factor productivity of firm i in year t. represents the green financial structure of the region where firm i is located in year t, and is its squared term. denotes the vector of control variables. and represent firm fixed effects and time fixed effects, respectively. is the stochastic error term.
4.3.2. Moderation Effect Model
To examine the moderating effects of industrial structure (Ins) and environmental regulation (ER), this paper constructs Model (3), where M represents the moderating variable. And denote the interaction terms between the moderating variable and the linear and quadratic terms of green financial structure, respectively. The rest of the model remains consistent with Model (3).
5. Empirical Findings
5.1. Baseline Regression Result
Table 3 reports the regression results based on the full sample. Column (1) presents the results of regressing GTFP on GFS and its squared term, GFS2, controlling for firm and time fixed effects. Column (2) further incorporates control variables. The coefficient of GFS is 0.385 and significantly positive at the 1% level, while the coefficient of GFS2 is −0.340 and significantly negative at the 1% level. These results indicate an inverted U-shaped relationship between GFS and GTFP, supporting Hypothesis 1 proposed in the theoretical framework.
Table 3.
Baseline regression result.
In the early stages of green finance system development, green credit led by banks is the primary driver. At this point, increasing the proportion of direct finance (such as green bonds) can compensate for the lack of credit in supporting high-risk, long-cycle green innovation projects, improve financing efficiency through market-based pricing, strict information disclosure, and risk diversification mechanisms, and promote enterprise green transformation. However, when the fraction of direct finance exceeds the ideal threshold, over-reliance on market financing may aggravate risk exposure and undermine banks’ advantages in supervising long-term projects and stabilizing financing, impeding transformational impacts.
5.2. U-Test Analysis
This paper further employs the Utest command to examine the existence of a U-shaped relationship, with the results presented in Table 4. The test confirms the presence of an inverted U-shaped relationship between GFS and corporate green transformation GTFP. Specifically, the p-value of the Utest is 0.020, which allows us to reject the null hypothesis at the 5% significance level. The coefficients indicate a pattern that is first positive (0.337) and then negative (−0.077), with the turning point estimated at 0.565, which lies within the observed range of GFS. These findings further support the validity of the inverted U-shaped relationship between GFS and GTFP.
Table 4.
Results of the U-Test.
5.3. Robustness Testing
5.3.1. Replace the Sample
First, observations from municipalities directly under the central government were excluded from the sample. These municipalities differ significantly from other cities in terms of resource allocation, preferential policies, industrial strategies, and economic foundations. Particularly during the early stages of green finance development, they often received more policy attention and resource support, which may have led to an uneven sample distribution and potential estimation bias. To enhance the robustness and reliability of the findings, this study excluded data from these municipalities. As reported in Column (1) of Table 5, the inverted U-shaped relationship between GFS and GFTP remains robust. In addition, subsample regressions were conducted to address potential biases caused by the COVID-19 pandemic. Specifically, two alternative samples were used: one restricted to the pre-pandemic period (2014–2019), and another excluding the year 2020. The results, presented in Columns (2) and (3) of Table 5, consistently support the validity of the baseline model’s inverted U-shaped relationship.
Table 5.
Robustness Test Result.
5.3.2. Alternative Measurement for the Dependent Variable
To test the robustness of the results, the ML index with global reference was used as a substitute for the dependent variable (GTFP). As shown in Column (4) of Table 5, the regression results based on the alternative variable remain consistent with the baseline findings.
5.3.3. Multiple Fixed Effect Models
Although the previous empirical analysis has controlled for firm and time fixed effects, systematic differences may still exist across industries and regions in terms of firm characteristics, industrial structure, environmental governance, and the maturity of financial markets. Industry and city fixed effects are further included to reduce potential estimation bias from unobserved factors [9]. As shown in column (5) of Table 5, the significance and signs of the coefficients for the core explanatory variable (GFS) and its squared term (GFS2) remain unchanged, thereby supporting the validity of the main conclusions.
5.3.4. Endogeneity Test
To address potential endogeneity concerns arising from reverse causality, both the linear (GFS) and quadratic (GFS2) terms of green financial structure are lagged by one period. As reported in column (6) of Table 5, the estimated coefficients for L.GFS and L.GFS2 are 0.559 and −0.506, respectively, both significant at the 1% level. These results remain consistent with the baseline findings.
5.4. Moderating Effect Analysis
This paper further investigates the moderating effect of specific variables on the nonlinear relationship between GFS and GTFP, with particular attention to the shift in the turning point of the inverted U-shaped curve. To determine the location of the axis of symmetry in Model (5), we solved for the critical point where the first derivative of GFS equals zero, as suggested by the analysis of the moderating effect of the inverted U-shaped relationship [44]. Since this inflection point is a function of the moderating variable M, we take its partial derivative with respect to M to examine how the position of the turning point changes dynamically with variations in M, as shown in Mode (6).
Specifically, this paper examines whether the interaction coefficient between the moderating variable M and the squared term of GFS in the moderating effect model (2) is statistically significant, in order to determine whether M exerts a moderating effect. If the partial derivative of the turning point with respect to M is positive, it indicates that the inflection point shifts to the right as M increases. Conversely, a negative partial derivative indicates a leftward shift in the inflection point.
5.4.1. Moderating Influence of Industrial Structure
The moderating effect of industrial structure is reported in Column (1) of Table 6. The coefficients of GFS and GFS2 remain statistically significant, indicating that the main effect persists. The interaction term between GFS and Ins is significantly negative (−0.658), while the interaction term between GFS2 and Ins is significantly positive (0.990), both at the 1% significance level. These results suggest that industrial structure negatively moderates the inverted U-shaped relationship between GFS and corporate green transformation, effectively flattening the original curve. According to Equation (5), the calculated value of is 0.165. This indicates that industrial structure shifts the vertex of the inverted U-shaped relationship between GFS and GFTP to the right. This implies that as the high-tech intensity of the industrial structure increases, the optimal configuration point of GFS tends to involve a higher proportion of green direct financing, supporting Hypothesis 2 proposed in the theoretical framework.
Table 6.
Moderating Effect Analysis Result.
High-tech-intensive industries typically possess stronger capabilities in technological innovation and greater market competitiveness. As such, direct finance instruments are better suited to meet their demands for innovation and green transformation. Therefore, as the industrial structure shifts toward high-tech intensity, the optimal proportion of green direct financing correspondingly increases, resulting in a rightward shift in the inflection point in the inverted U-shaped curve.
5.4.2. Moderating Effects of Environmental Regulation
Columns (2) and (3) of Table 6 present the moderating effects of environmental regulation, which are measured by two alternative indicators: government expenditure on environmental protection (ER1) and the frequency of environment-related keywords in provincial government work reports (ER2). The coefficients of GFS and GFS2 remain significant, confirming the robustness of the inverted U-shaped relationship between the green financial structure and corporate green transformation. For both measures, the interaction effect between the squared green financial structure and environmental regulation is significantly negative (−4.79 and −0.002, both significant at the 1% level), indicating that environmental regulation steepens the curvature of the inverted U-shaped relationship. The calculated turning points for ER1 and ER2 are −0.7289 and 0003, respectively, both negative, suggesting that stronger environmental regulation shifts the optimal point of the relationship to the left.
This implies that in regions with higher environmental investment or greater policy attention, firms can achieve optimal green transformation performance at a lower level of market-based green financing. Overall, environmental regulation enhances the efficiency of green financial resource allocation through external constraints and improved information disclosure, thereby supporting Hypothesis 3.
5.5. Heterogeneity Test
5.5.1. Enterprise Internal Control Heterogeneity Test
Effective internal control enhances organizational efficiency and risk management while fostering a governance environment conducive to innovation. In this study, the level of internal control is proxied by the opinion issued in internal control audits: firms receiving an unqualified opinion are considered to have high internal control quality. The regression results are presented in columns (1) and (2) of Table 7. In the high internal control group, the coefficient of GFS is significantly positive at the 1% level, while the coefficient of GFS2 is significantly negative at the 1% level, indicating a statistically significant inverted U-shaped relationship between GFS and GTFP. In contrast, for the low internal control group, neither the linear nor the quadratic term of GFS is statistically significant.
Table 7.
Enterprise Internal Control Heterogeneity Test.
This finding suggests that internal control plays a key governance role in linking the green financial structure to corporate green transformation. High-quality internal control strengthens supervision and incentive mechanisms, effectively reducing agency costs and information asymmetry, thereby enabling firms to better coordinate bank- and market-based financing channels and improve the efficiency of green capital allocation [45]. However, as the green financial structure becomes excessively market-oriented, increasing scrutiny and disclosure requirements from investors may lead to overlaps between internal control and external regulation, raising governance and compliance costs and weakening marginal benefits. Moreover, robust internal control mitigates greenwashing behavior and enhances information transparency, ensuring that green capital flows to projects with genuine environmental benefits [46]. When the share of market-based financing grows too large, however, disclosure and compliance burdens increase, financial flexibility declines, and green innovation investment diminishes, resulting in diminishing marginal returns in green transformation performance.
5.5.2. Regional Heterogeneity Test
In western China, the coefficient of GFS is significantly positive at the 5% level, while the coefficient of its squared term, GFS2 is significantly negative at the 5% level, indicating a clear inverted U-shaped relationship. In contrast, for firms in the eastern and central regions, neither the linear nor the quadratic term of GFS is statistically significant. To further examine this, a simplified regression model including only the linear term of GFS was estimated for firms in the eastern and central regions. As shown in column (3) of Table 8, the coefficient of GFS is significantly positive at the 5% level, with an estimated value of 0.014. This suggests that at the current stage, an increase in the proportion of direct financing within the green financial structure continues to have a significant positive effect on promoting green transformation among enterprises in the eastern and central regions.
Table 8.
Regional Heterogeneity Test.
This regional difference reflects variations in financial system maturity and institutional environments. In the western region, underdeveloped capital markets and relatively weak information disclosure and regulatory systems make bank-based green credit more effective in easing financing constraints at the early stage. However, when the structure becomes excessively market-oriented, limited oversight capacity and persistent information asymmetry reduce the efficiency of green capital allocation, leading to diminishing marginal returns. By contrast, the eastern and central regions possess more developed financial systems with greater liquidity and stronger disclosure mechanisms, allowing market-based instruments to complement bank-based financing more effectively. Consequently, the optimization of the green financial structure in these regions remains in a stage of steady enhancement and has not yet reached the point of diminishing returns.
6. Further Analysis
To examine the synergistic effects between different green financial instruments, this study includes an interaction term between green credit and green bonds (L.GB#L.GC), which is lagged by one period to capture the delayed impact of green financing on firms’ green transformation. Table 9 reports the regression results under varying levels of industrial technological intensity and environmental regulation. Column (1) presents the full-sample results. The coefficients of GFS and GFS2 remain significantly positive and negative, confirming the inverted U-shaped relationship between green financial structure and firms’ green total factor productivity. The interaction term L.GB#L.GC is significantly positive at the 1% level, indicating a strong complementarity between green credit and green bonds in promoting corporate green transformation.
Table 9.
Complementarity effects of green credit and green bonds.
Columns (2) and (3) show the results grouped by industrial technological intensity. In regions with higher technological intensity, the coefficients remain consistent with the full-sample results but lose statistical significance. In regions with lower technological intensity, the inverted U-shaped relationship remains robust, and the interaction term L.GB#L.GC is significantly positive, suggesting that the synergy between the two instruments becomes more pronounced during the process of industrial upgrading as they jointly alleviate financing constraints and enhance green capital allocation efficiency. Columns (4) and (5) report the results grouped by environmental regulation intensity. The inverted U-shaped relationship remains significant in both groups, and the interaction term L.GB#L.GC is positive and significant in each, with stronger significance in the high-regulation group. This indicates that stricter environmental regulation strengthens the complementarity between green credit and green bonds by aligning policy pressure with market incentives, thereby improving the overall effectiveness of the green financial system.
7. Conclusions and Implications
7.1. Discussion
This study provides a solid theoretical and empirical foundation for understanding the role of green finance in fostering corporate green transformation. Previous research has primarily focused on specific green financial instruments or policy implications [28,47]. This paper introduces the concept of the green financial structure and examines its impact on corporate green transformation through the structural interaction between market-based and bank-based financing. This contributes to the theoretical framework of how green finance affects business behavior while addressing the lack of research on the structural configuration of financial instruments in previous studies. Moreover, this study identifies the moderating roles of industrial structure and environmental regulation, indicating that the effectiveness of green financial tools is jointly shaped by economic structure and regulatory pressure. The findings enhance the understanding of the synergy between green finance and environmental policy, emphasizing the importance of aligning financial instrument characteristics with external governance conditions. To further deepen the structural perspective, this study also examines the synergistic relationship between green credit and green bonds by introducing an interaction term. The results show a significant complementary effect between the two instruments, suggesting that their coordination serves as a key mechanism for optimizing financial structure and improving the effectiveness of green transformation. Finally, heterogeneity analysis reveals that the structural effect is stronger among firms with high-quality internal control and in less developed financial regions, enriching the explanation of regional disparities in green finance from the perspective of structural configuration [11].
7.2. Conclusion and Policy Implications
Using panel data of Chinese A-share listed companies from 2014 to 2021, this study systematically examines the impact of green financial structure on corporate green transformation. The results reveal a significant inverted U-shaped relationship between green financial structure and green total factor productivity, indicating that a moderately balanced structure best facilitates green transformation. Industrial technological intensity and environmental regulation significantly moderate this relationship: in high-tech industries and less regulated regions, market-based financing plays a greater role, while in traditional industries and highly regulated regions, the supervisory and stabilizing functions of bank-based financing become more critical. Further analysis shows a strong synergy between green credit and green bonds, as their rational coordination alleviates financing constraints and enhances capital allocation efficiency—especially under industrial upgrading and stringent environmental regulation. Heterogeneity tests further demonstrate that the inverted U-shaped relationship is more pronounced among firms with better internal controls and in western regions, implying that governance capacity and regional financial environments significantly influence structural effects.
Based on these findings, several policy implications can be drawn. First, promoting a balanced and coordinated development of financing structures is essential. The green financial system should avoid overreliance on a single instrument, and instead, achieve complementarity between green credit and green bonds through improved regulatory coordination, unified disclosure standards, and environmental evaluation mechanisms. Second, green financial structures should be optimized according to regional and industrial characteristics. In high-tech and innovation-oriented industries with weaker regulation, the proportion of market-based financing should be appropriately increased to stimulate innovation. Conversely, in traditional sectors or under stricter regulation, bank-based financing should be strengthened to ensure stability and precision in green funding allocation. Finally, improving corporate governance and incentive mechanisms is crucial. Enhancing firms’ internal control and environmental disclosure can increase transparency and the effectiveness of green capital use. Regulators should establish performance-based incentive systems that guide financial resources toward well-governed firms with genuine transformation potential, reducing symbolic ‘greenwashing’ and promoting substantive green transition.
While this study offers valuable insights into the structural role of green finance in fostering corporate green transformation, certain limitations remain. Corporate green transformation is assessed using green total factor productivity (GTFP), a comprehensive and widely recognized indicator of environmental efficiency. However, this proxy may not fully reflect firm-level differences in green practices or strategic transformation processes. Future research could incorporate more granular environmental and innovation data to gain a deeper understanding of how financial structures support sustainable transformation.
Author Contributions
Conceptualization, Y.L. and F.X.; methodology, Y.L.; software, Y.L.; validation, Y.L. and F.X.; formal analysis, Y.L.; investigation, Y.L.; resources, Y.L.; data curation, Y.L.; writing—original draft preparation, Y.L.; writing—review and editing, F.X.; visualization, Y.L.; supervision, F.X.; project administration, F.X.; funding acquisition, F.X. All authors have read and agreed to the published version of the manuscript.
Funding
This research was funded by the Jiangsu Social Science Foundation (Grant No. 25EYC014); the Jiangsu Soft Science Research Program (Grant No. BR2025015); and the Fundamental Research Funds for the Central Universities, Hohai University (Grant No. B250207041).
Data Availability Statement
The data supporting the findings of this study are available from the corresponding author upon reasonable request.
Conflicts of Interest
The authors declare no conflicts of interest.
References
- Wu, S.; Cai, D.; Wang, X.; Chen, H. Does the Chinese New Diversified Green Finance Affect Corporate Employee Demand? J. Environ. Manag. 2025, 387, 125810. [Google Scholar] [CrossRef] [PubMed]
- Wang, L.; Fang, W.; Wang, C.; Wang, S. A literature review of enterprise green transformation from the perspective of complex social network and prospects. J. Univ. Sci. Technol. China 2020, 50, 1330–1342. [Google Scholar] [CrossRef]
- Li, X.; Wang, R.; Shen, Z.Y.; Song, M. Green Credit and Corporate Energy Efficiency: Enterprise Pollution Transfer or Green Transformation. Energy 2023, 285, 129345. [Google Scholar] [CrossRef]
- Wang, Z.; He, A.; Nan, S. Green Finance Reform, Multifaceted Collaborative Governance, and Corporate Greenwashing: Evidence from Double/Debiased Machine Learning Method. J. Environ. Manag. 2025, 383, 125466. [Google Scholar] [CrossRef]
- Cheng, Z.; Wu, Y. Can the Issuance of Green Bonds Promote Corporate Green Transformation? J. Clean. Prod. 2024, 443, 141071. [Google Scholar] [CrossRef]
- Meng, Y.; Yu, J.; Yu, Y.; Ren, Y. Impact of Green Finance on Green Total Factor Productivity: New Evidence from Improved Synthetic Control Methods. J. Environ. Manag. 2024, 372, 123394. [Google Scholar] [CrossRef] [PubMed]
- Bartram, S.M.; Hou, K.; Kim, S. Real Effects of Climate Policy: Financial Constraints and Spillovers. J. Financ. Econ. 2022, 143, 668–696. [Google Scholar] [CrossRef]
- Zhang, Z.; Luo, X.; Du, J.; Xu, B. Does Green Credit Accelerate Green Transformation of Heavily Polluting Enterprises? Int. Rev. Financ. Anal. 2025, 98, 103895. [Google Scholar] [CrossRef]
- Yao, S.; Pan, Y.; Sensoy, A.; Uddin, G.S.; Cheng, F. Green Credit Policy and Firm Performance: What We Learn from China. Energ. Econ. 2021, 101, 105415. [Google Scholar] [CrossRef]
- Liu, Y.; Xi, B.; Wang, G. The Impact of Corporate Environmental Responsibility on Financial Performance—Based on Chinese Listed Companies. Environ. Sci. Pollut. R. 2021, 28, 7840–7853. [Google Scholar] [CrossRef]
- Yu, B.; Liu, L.; Chen, H. Can Green Finance Improve the Financial Performance of Green Enterprises in China? Int. Rev. Econ. Financ. 2023, 88, 1287–1300. [Google Scholar] [CrossRef]
- Lin, B.; Pan, T. Financing Decision of Heavy Pollution Enterprises under Green Credit Policy: Based on the Perspective of Signal Transmission and Supply Chain Transmission. J. Clean. Prod. 2023, 412, 137454. [Google Scholar] [CrossRef]
- Flammer, C. Corporate green bonds. J. Financ. Econ. 2021, 142, 499–516. [Google Scholar] [CrossRef]
- Du, M.; Antunes, J.; Wanke, P.; Chen, Z. Ecological Efficiency Assessment under the Construction of Low-Carbon City: A Perspective of Green Technology Innovation. J. Environ. Plan. Manag. 2022, 65, 1727–1752. [Google Scholar] [CrossRef]
- Xu, Q.; Kim, T. Financial Constraints and Corporate Environmental Policies. Rev. Financ. Stud. 2022, 35, 576–635. [Google Scholar] [CrossRef]
- Tan, W.; Huang, Y.; Chen, X.H.; Gatto, A. Green Credit Policy and Energy Consumption Intensity in China: Firm-Level Evidence and Insights. J. Environ. Manag. 2025, 373, 123664. [Google Scholar] [CrossRef]
- Khan, M.A.; Vismara, S. Green Bond Issuance and Corporate Environmental and Financial Performance: A Meta-Analysis. Int. Rev. Econ. Financ. 2025, 102, 104313. [Google Scholar] [CrossRef]
- Levine, R. Bank-Based or Market-Based Financial Systems: Which Is Better? J. Financ. Intermediation 2002, 11, 398–428. [Google Scholar] [CrossRef]
- Wu, Y.; Ziqi, L. Are Advancements in Renewable Energy Technologies Being Driven by the Digital Economy and Financial Structure? An Overview of the Key Eight Nations. Energy Strategy Rev. 2025, 59, 101679. [Google Scholar] [CrossRef]
- Moradi, Z.S.; Mirzaeenejad, M.; Geraeenejad, G. Effect of Bank-Based or Market-Based Financial Systems on Income Distribution in Selected Countries. Procedia Econ. Financ. 2016, 36, 510–521. [Google Scholar] [CrossRef]
- Dang, V.D.; Nguyen, H.C. Bank Asset Allocation and Finance Structure under Uncertainty in Vietnam. Manag. Financ. 2021, 48, 500–520. [Google Scholar] [CrossRef]
- Hsu, P.-H.; Tian, X.; Xu, Y. Financial Development and Innovation: Cross-Country Evidence. J. Financ. Econ. 2014, 112, 116–135. [Google Scholar] [CrossRef]
- Kim, S.; Lee, H.; Kim, J. Divergent Effects of External Financing on Technology Innovation Activity: Korean Evidence. Technol. Forecast. Soc. Change 2016, 106, 22–30. [Google Scholar] [CrossRef]
- Gan, Q. Financial System and Technology Innovation in an Emerging Economy: Can Innovation Efficiency Be Increased? Kybernetes 2022, 52, 6049–6062. [Google Scholar] [CrossRef]
- Begenau, J.; Landvoigt, T. Financial Regulation in a Quantitative Model of the Modern Banking System. Rev. Econ. Stud. 2022, 89, 1748–1784. [Google Scholar] [CrossRef]
- Tolliver, C.; Keeley, A.R.; Managi, S. Policy Targets behind Green Bonds for Renewable Energy: Do Climate Commitments Matter? Technol. Forecast. Soc. Change 2020, 157, 120051. [Google Scholar] [CrossRef]
- Chen, M.; Song, L.; Zhu, X.; Zhu, Y.; Liu, C. Does Green Finance Promote the Green Transformation of China’s Manufacturing Industry? Sustainability 2023, 15, 6614. [Google Scholar] [CrossRef]
- Xu, X.; Li, J. Asymmetric Impacts of the Policy and Development of Green Credit on the Debt Financing Cost and Maturity of Different Types of Enterprises in China. J. Clean. Prod. 2020, 264, 121574. [Google Scholar] [CrossRef]
- Wang, S.; Shu, W.; Cui, L. Green Finance Policy and Green Economic Transformation. Int. Rev. Financ. Anal. 2024, 96, 103785. [Google Scholar] [CrossRef]
- Hu, J.; Zhang, H. Has Green Finance Optimized the Industrial Structure in China? Environ. Sci. Pollut. Res. 2023, 30, 32926–32941. [Google Scholar] [CrossRef] [PubMed]
- Wang, D.; Mugera, A.; White, B. Directed Technical Change, Capital Intensity Increase and Energy Transition: Evidence from China. Energy J. 2019, 40, 277–296. [Google Scholar] [CrossRef]
- Shen, H.; Qin, M.; Li, T.; Zhang, X.; Zhao, Y. Digital Finance and Industrial Structure Upgrading: Evidence from Chinese Counties. Int. Rev. Financ. Anal. 2024, 95, 103442. [Google Scholar] [CrossRef]
- Chy, M.; Kyung, H. The Effect of Bond Market Transparency on Bank Loan Contracting. J. Account. Econ. 2023, 75, 101536. [Google Scholar] [CrossRef]
- Bai, R.; Lin, B. Nexus between Green Finance Development and Green Technological Innovation: A Potential Way to Achieve the Renewable Energy Transition. Renew. Energy 2023, 218, 119295. [Google Scholar] [CrossRef]
- Hua, M.; Li, Z.; Zhang, Y.; Wei, X. Does Green Finance Promote Green Transformation of the Real Economy? Res. Int. Bus. Financ. 2024, 67, 102090. [Google Scholar] [CrossRef]
- Fan, M.; Yang, P.; Li, Q. Impact of Environmental Regulation on Green Total Factor Productivity: A New Perspective of Green Technological Innovation. Environ. Sci. Pollut. Res. 2022, 29, 53785–53800. [Google Scholar] [CrossRef]
- Lena, D.; Pasurka, C.A.; Cucculelli, M. Environmental Regulation and Green Productivity Growth: Evidence from Italian Manufacturing Industries. Technol. Forecast. Soc. Change 2022, 184, 121993. [Google Scholar] [CrossRef]
- Tang, H.; Liu, J.; Wu, J. The Impact of Command-and-Control Environmental Regulation on Enterprise Total Factor Productivity: A Quasi-Natural Experiment Based on China’s “Two Control Zone” Policy. J. Clean. Prod. 2020, 254, 120011. [Google Scholar] [CrossRef]
- Wei, B.; Chenxi, L.; Shanshan, L. Environmental Regulation, R&D Subsidies, and Industrial Green Total Factor Productivity. Sustain. Futures 2024, 8, 100333. [Google Scholar] [CrossRef]
- Yi, H.; Hao, L.; Liu, A.; Zhang, Z. Green Finance Development and Resource Efficiency: A Financial Structure Perspective. Resour. Policy 2023, 85, 104068. [Google Scholar] [CrossRef]
- Eid, N.; Yang, J.; Duygun, M. Bridging the Credit Gap: The Influence of Regional Bank Structure on the Expansion of Peer-to-Peer Lending. Br. Account. Rev. 2024, 56, 101448. [Google Scholar] [CrossRef]
- Nguyen, H.-L.Q. Are Credit Markets Still Local? Evidence from Bank Branch Closings. Am. Econ. J. Appl. Econ. 2019, 11, 1–32. [Google Scholar] [CrossRef]
- Pham, T.; Talavera, O.; Tsapin, A. Branch Network Structure, Authority and Lending Behaviour. Econ. Syst. 2022, 46, 101040. [Google Scholar] [CrossRef]
- Haans, R.F.J.; Pieters, C.; He, Z. Thinking about U: Theorizing and Testing U- and Inverted U-shaped Relationships in Strategy Research. Strategy Manag. J. 2016, 37, 1177–1195. [Google Scholar] [CrossRef]
- Wu, L.; Tian, W.; Zhu, Y.; Lyulyov, O.; Pimonenko, T. The Effect of Governance Structure on Green Technology Innovation: Based on the Internal Control Perspective. Bus. Strategy Environ. 2025. Early View. [Google Scholar] [CrossRef]
- Khan, P.A.; Johl, S.K.; Kumar, A.; Luthra, S. Hope-Hype of Green Innovation, Corporate Governance Index, and Impact on Firm Financial Performance: A Comparative Study of Southeast Asian Countries. Environ. Sci. Pollut. Res. 2023, 30, 55237–55254. [Google Scholar] [CrossRef]
- Lin, B.; Pan, T. The Impact of Green Credit on Green Transformation of Heavily Polluting Enterprises: Reverse Forcing or Forward Pushing? Energy Policy 2024, 184, 113901. [Google Scholar] [CrossRef]
Disclaimer/Publisher’s Note: The statements, opinions and data contained in all publications are solely those of the individual author(s) and contributor(s) and not of MDPI and/or the editor(s). MDPI and/or the editor(s) disclaim responsibility for any injury to people or property resulting from any ideas, methods, instructions or products referred to in the content. |
© 2025 by the authors. Licensee MDPI, Basel, Switzerland. This article is an open access article distributed under the terms and conditions of the Creative Commons Attribution (CC BY) license (https://creativecommons.org/licenses/by/4.0/).