Abstract
This research investigates the synergistic relationships between Green Supply Chain Management (GSCM) practices and product innovation in marketing performance and organizational sustainability within Thailand’s processed food industry. Building upon Resource-Based View theory and Stakeholder Theory, this study addresses a critical gap in understanding how environmental practices interact with innovation strategies to create sustainable competitive advantages in emerging markets. The research employs a comprehensive mixed-methods approach, integrating qualitative insights from industry expert interviews with quantitative analysis through Structural Equation Modeling (SEM). Primary data were systematically collected from 300 strategically selected enterprises representing small (≤50 employees), medium (51–200 employees), and large-scale (>200 employees) operations across diverse product categories within Thailand’s processed food sector. The analytical framework examines three core GSCM dimensions—green purchasing, green production, and green distribution—alongside three innovation aspects—quality innovation, safety innovation, and sustainability innovation. Eleven hypothesized relationships were rigorously tested to examine direct and indirect effects on marketing performance indicators (sales growth, market share expansion, brand enhancement, customer satisfaction, and cost optimization) and organizational sustainability metrics (environmental impact reduction, regulatory compliance, competitive positioning, and resource efficiency). SEM results revealed that Green Production practices significantly enhance marketing performance (β = 0.16, p < 0.01), demonstrating the strategic value of environmentally responsible production processes in achieving market success. Conversely, Green Distribution exhibited negative effects on both marketing performance (β = −0.106, p < 0.10) and organizational sustainability (β = −0.152, p < 0.05), indicating potential operational trade-offs and infrastructure limitations that require strategic optimization. The model demonstrated excellent fit indices (GFI = 0.929, CFI = 1.000, TLI = 1.000, RMSEA = 0.000, RMR = 0.034), validating the theoretical framework’s robustness. However, modest explanatory power (R2 MP = 0.050, R2 OS = 0.029) suggests that additional contextual factors, firm-specific capabilities, and market dynamics significantly influence these outcomes, warranting future investigation of mediating and moderating variables.
1. Introduction and Background
Thailand’s processed food industry represents a fundamental pillar of the nation’s economic infrastructure, serving as a primary driver of export revenues, employment generation, and regional economic development. In 2023, Thailand’s food and agricultural exports reached approximately US$49 billion, positioning the country as a global leader in food production and export capabilities [1]. The food processing sector specifically contributed significant value, with rice exports alone reaching US$5.1 billion, making it Thailand’s largest agricultural product export, followed by chicken and cassava flour [1]. This sector has been strategically positioned within Thailand’s comprehensive 20-Year National Strategy (2018–2037) and designated as a critical component of the nation’s S-Curve Industries initiative, reflecting the government’s commitment to transforming Thailand’s comparative advantages into competitive advantages through knowledge, technology, and innovation [2].
The food processing industry has been specifically identified as one of Thailand’s First S-Curve Industries, which also include automotive, smart electronics, affluent medical and wellness tourism, and agriculture and biotechnology [3]. This strategic designation aims to build Thailand as the center of premium agricultural products and food, positioning the country as an exporter of agricultural technology, seeds, and vaccines while leveraging biodiversity and environmentally friendly biotechnology [3].
Despite its strategic importance and robust performance, Thailand’s processed food industry confronts increasingly complex challenges in the rapidly evolving global marketplace. The primary challenge emerges from intensifying international competition, particularly from major food-exporting nations including China, the United States, Brazil, and Vietnam, which continuously enhance their production capabilities, technological sophistication, and market penetration strategies [4]. This competitive landscape is further complicated by global supply chain disruptions and changing trade dynamics that require continuous innovation and strategic adaptation among Thai food processors to maintain market share and competitive positioning.
A second critical challenge stems from evolving consumer preferences toward health-conscious and environmentally sustainable products. Contemporary consumers demonstrate heightened environmental awareness and increasingly prefer products manufactured through environmentally responsible practices, including renewable energy utilization, plastic waste reduction, and carbon footprint minimization. According to recent global food trend analyses, consumers are prioritizing quality ingredients with elevated features such as health benefits, nutrition, freshness, shelf life, and naturalness [5]. This shift has created new market imperatives for sustainable production processes and transparent supply chain practices, with precision wellness and gut health emerging as key growth areas in functional food and beverage products [5].
The third challenge relates to mounting sustainability pressures emanating from both consumer demands and increasingly stringent governmental regulations regarding environmental impact in food production. Climate change implications, diminishing natural resources, particularly water and energy, and evolving international environmental standards have intensified pressure on the food processing sector to adopt more environmentally sustainable production processes and supply chain management practices. Green Supply Chain Management (GSCM) has emerged as a strategic imperative for resource optimization and environmental impact mitigation across the entire value chain, with research demonstrating that four of six GSCM risk factors are significantly related to environmental health in food industry contexts [6].
This research’s significance lies in its comprehensive analysis of the synergistic relationships between Green Supply Chain Management practices and Product Innovation strategies, both considered instrumental in developing competitive and sustainable food processing capabilities. A notable research gap exists in Thailand regarding the interactive effects of these factors and their collective impact on marketing performance and organizational sustainability outcomes. Recent bibliometric analyses of GSCM research reveal that while significant attention has been devoted to understanding green supply chain practices, limited clarity exists on their specific application to sustainable sourcing and distribution, particularly in emerging market contexts [7].
This study’s originality lies in its mixed-methods approach that combines qualitative expert insights with quantitative SEM analysis specifically within Thailand’s processed food industry context. Unlike previous studies that examine GSCM and product innovation in isolation, this research investigates their synergistic effects on dual outcomes of marketing performance and organizational sustainability. The findings provide empirical evidence for the Resource-Based View theory’s application in emerging markets, demonstrating how environmental practices can serve as strategic resources for competitive advantage.
The research findings hold particular relevance for multiple stakeholder groups. For industry practitioners, the study provides empirical evidence for strategic decision-making regarding sustainability investments and innovation priorities, particularly relevant given that over 75% of food and beverage brands expect to spend more on new product development in 2024, with 51% citing the need to remain competitive as a primary driver [8]. For policymakers, the study offers insights into factors affecting industry competitiveness and the effectiveness of sustainability strategies at the national level, directly supporting Thailand’s National Strategy objectives to position the country as a global leader in high-value agricultural and processed food products.
1.1. The Research Objectives
- (1)
- To examine the causal relationships between Green Supply Chain Management practices (green purchasing, green production, green distribution) and Product Innovation strategies (quality innovation, safety innovation, sustainability innovation) in Thailand’s processed food industry.
- (2)
- To analyze the direct and indirect impacts of Green Supply Chain Management and Product Innovation on marketing performance indicators (sales growth, market share expansion, brand enhancement, customer satisfaction, cost optimization) in the food processing sector.
- (3)
- To evaluate the influence of Green Supply Chain Management and Product Innovation on organizational sustainability outcomes (environmental impact reduction, regulatory compliance, competitive positioning, resource efficiency) in the food processing industry.
- (4)
- To develop and validate a comprehensive structural equation model illustrating the interconnections between Green Supply Chain Management, Product Innovation, Marketing Performance, and Organizational Sustainability within Thailand’s processed food industry context.
1.2. Research Contribution and Novelty
This research makes several significant contributions to the academic literature and practical understanding of sustainability practices in emerging markets. First, it provides the first comprehensive mixed-methods investigation of GSCM-innovation synergies specifically within Thailand’s strategic S-Curve food processing industry. Second, the study develops and validates a novel structural equation model that simultaneously examines marketing performance and organizational sustainability as dual outcome variables, addressing the literature gap identified in recent GSCM bibliometric analyses. Third, the research contributes empirical evidence to Resource-Based View theory application in emerging market contexts, demonstrating how environmental practices can serve as strategic resources for competitive advantage. Finally, the findings provide actionable insights for Thailand’s National Strategy implementation, supporting the country’s transformation toward becoming a developed nation with security, prosperity, and sustainability.
2. Theoretical Background and Hypotheses Development
The theoretical foundation of this study integrates multiple established frameworks to comprehensively understand the relationships between environmental practices, innovation strategies, and organizational outcomes. The research primarily draws upon the Resource-Based View (RBV), Stakeholder Theory, and Dynamic Capabilities Framework to explain how GSCM practices and product innovation contribute to sustainable competitive advantage in the processed food industry.
Figure 1 illustrates the proposed research framework, depicting the relationships between Green Supply Chain Management practices (X1), Product Innovation dimensions (X2), and their effects on Marketing Performance (Y1) and Organizational Sustainability (Y2).
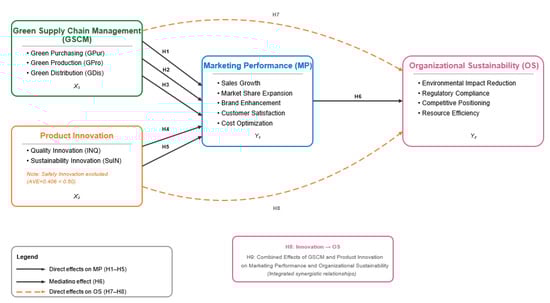
Figure 1.
Proposed research framework.
Research Hypotheses:
Direct Effects on Marketing Performance:
H1:
Green purchasing positively influences marketing performance.
H2:
Green production positively influences marketing performance.
H3:
Green distribution positively influences marketing performance.
H4:
Quality innovation positively influences marketing performance.
H5:
Sustainability innovation positively influences marketing performance.
Mediating Relationship:
H6:
Marketing performance positively influences organizational sustainability.
Direct Effects on Organizational Sustainability:
H7:
Green supply chain management positively influences organizational sustainability.
H8:
Product innovation positively influences organizational sustainability.
Integrated Effects:
H9:
The combined effects of green supply chain management and product innovation positively influence both marketing performance and organizational sustainability.
2.1. Green Supply Chain Management (GSCM)
Green Supply Chain Management emphasizes the incorporation of environmentally sustainable practices throughout supply chain processes, including procurement, production, logistics, and distribution. Rooted in the Resource-Based View (RBV) and Stakeholder Theory, GSCM considers sustainability as a strategic resource that enhances competitiveness while addressing stakeholder demands for environmental responsibility. Recent research demonstrates that GSCM practices can serve as solutions for mitigating supply chain risks while improving environmental health levels, particularly relevant in food industry contexts [6].
Green purchasing refers to the selection of suppliers based on environmental criteria, reducing waste and promoting resource-efficient materials. This practice aligns with stakeholder theory by addressing environmental concerns of multiple stakeholders while creating competitive advantages through supplier relationships. Contemporary research emphasizes the importance of supplier collaboration and environmental assessment in building sustainable supply chains [7].
Green production encompasses the implementation of clean technologies, energy efficiency measures, waste reduction strategies, and renewable energy utilization in manufacturing processes. This dimension directly supports the Resource-Based View by developing unique capabilities that are difficult for competitors to replicate. Recent studies demonstrate that green production practices significantly contribute to both operational efficiency and environmental performance [9].
Green distribution involves eco-friendly packaging, transportation optimization, and sustainable logistics management to minimize environmental impact during product delivery. While theoretically beneficial, recent research suggests potential trade-offs between environmental objectives and operational efficiency in distribution activities, particularly in emerging market contexts where infrastructure limitations may constrain optimization efforts.
2.2. Product Innovation
Product innovation involves developing new or improved products that address consumer needs and market demands while incorporating environmental and social considerations. Schumpeter’s Innovation Theory highlights innovation as a key driver of market disruption and competitive differentiation. In the processed food industry, product innovation encompasses improvements in quality, safety, and sustainability, with each dimension playing a unique role in enhancing organizational performance [5].
Quality innovation focuses on enhancing the sensory, nutritional, and functional value of products to meet evolving consumer preferences for health-conscious and premium food products. This aligns with current market trends showing that consumers rank quality in ingredients and products as the most important consideration in food and beverage purchases [5]. The focus has evolved from basic product attributes to elevated features such as protein quality, bioavailability, and absorption, reflecting consumers’ sophisticated understanding of nutrition.
Safety innovation ensures compliance with food safety standards, reduces risks of contamination, and enhances product traceability throughout the supply chain. This dimension addresses critical stakeholder concerns about food safety while building consumer trust and regulatory compliance. Recent technological advances, including blockchain implementation, enhance traceability and authenticity, further strengthening consumer confidence in innovative products.
Sustainability innovation incorporates eco-friendly practices such as biodegradable packaging, energy-efficient production methods, and circular economy principles. This dimension directly supports both environmental objectives and consumer preferences for sustainable products. Research demonstrates that sustainability-oriented innovations significantly contribute to consumer satisfaction and long-term market success while addressing global environmental challenges.
2.3. Marketing Performance
Marketing performance evaluates the effectiveness of strategies in achieving organizational goals, including profitability, market share growth, brand enhancement, customer satisfaction, and cost optimization. Rooted in the Balanced Scorecard Framework and Dynamic Capabilities Theory, marketing performance emphasizes aligning marketing strategies with environmental and consumer trends. In the processed food industry, GSCM practices and product innovation contribute significantly to enhancing marketing performance by building brand equity, improving consumer loyalty, and driving market differentiation.
Recent research identifies green marketing as a critical factor in shaping consumer perceptions and purchasing decisions, with eco-certifications and sustainable practices enhancing competitive positioning of processed food products [10]. Dynamic capabilities such as flexibility in responding to market shifts and integrating consumer feedback into marketing strategies ensure long-term success in rapidly evolving markets.
2.4. Organizational Sustainability Theoretical Foundation
Organizational sustainability encompasses environmental impact reduction, regulatory compliance, competitive advantage development, and resource efficiency optimization. This construct integrates Triple Bottom Line theory, emphasizing the balance between economic, environmental, and social performance. In the context of Thailand’s processed food industry, organizational sustainability directly supports the National Strategy’s vision of becoming a developed country with security, prosperity, and sustainability.
Environmental impact reduction involves minimizing carbon footprint, waste generation, and resource consumption throughout organizational operations. This dimension aligns with global sustainability goals and regulatory requirements while creating operational efficiencies. Regulatory compliance ensures adherence to environmental standards and food safety regulations, reducing risks and enhancing organizational reputation. Competitive advantage development through sustainability practices creates differentiation in the marketplace while building stakeholder trust. Resource efficiency optimization reduces operational costs while minimizing environmental impact, supporting both economic and environmental performance.
2.5. Integration of Theoretical Frameworks
The integration of RBV, Stakeholder Theory, and Dynamic Capabilities Framework provides a comprehensive theoretical foundation for understanding how GSCM practices and product innovation create sustainable competitive advantages. RBV explains how environmental practices serve as valuable, rare, inimitable, and organized resources that enhance competitiveness. Stakeholder Theory elucidates how sustainability practices address multiple stakeholder concerns while building legitimacy and support. Dynamic Capabilities Framework explains how organizations develop and deploy capabilities to adapt to changing environmental and market conditions.
This theoretical integration supports the hypothesis that GSCM practices and product innovation synergistically enhance both marketing performance and organizational sustainability through multiple mechanisms: resource optimization, stakeholder value creation, capability development, and competitive differentiation.
2.6. Related Research
Digital marketing has been recognized as a pivotal tool in driving consumer behavior toward sustainable products. Dube et al. [11] argue that digital marketing campaigns tailored to consumer preferences significantly enhance the likelihood of organic product adoption. Similarly, Relich [12] emphasize the effectiveness of data-driven digital advertising in fostering consumer trust and promoting sustainable consumption behaviors. Both studies highlight the importance of precision in digital outreach for increasing consumer awareness and purchase intentions for organic products.
Environmental knowledge and its influence on sustainable product adoption have been extensively studied. Milardo [13] demonstrate that consumers with a robust understanding of sustainability issues are more likely to adopt organic products. This finding is supported by Lavuri et al. [14], who show that environmental education campaigns enhance consumer readiness to engage in sustainable consumption. Additionally, Chen et al. [15] reveal that heightened environmental concern leads to stronger consumer advocacy for organic products, as it shapes favorable attitudes and strengthens purchase intentions.
Accessibility and credibility are critical factors in promoting organic product adoption. Li et al. [16] discuss the role of improved logistics and market access in making organic products more available to consumers, thereby increasing adoption rates. Sri Vigna Hema and Annamalai [17] focus on the role of blockchain technology in enhancing traceability and consumer trust, demonstrating its effectiveness in guaranteeing product authenticity. Furthermore, Nagy et al. [18] underscore the importance of credible certifications in building consumer confidence, showing that certified organic products are more likely to be adopted by skeptical consumers.
3. Methodology
3.1. Research Design and Philosophical Approach
This research employs a pragmatic philosophical approach utilizing a mixed-methods sequential explanatory design to comprehensively investigate the relationships between GSCM practices, product innovation, and organizational outcomes. The study design combines qualitative insights with quantitative analysis to provide a robust understanding of the phenomena under investigation. The mixed-methods approach is particularly appropriate for this research context as it allows for the exploration of complex relationships while providing statistical validation of theoretical propositions.
The qualitative component involved semi-structured interviews with industry experts to gain contextual insights into GSCM implementation challenges and innovation strategies within Thailand’s processed food industry. Seven industry experts, including senior managers from food processing companies, sustainability consultants, and government officials from the Ministry of Industry, were interviewed to inform the development of the research framework and interpretation of quantitative findings. These interviews provided crucial context for understanding the practical implications of GSCM practices and helped identify industry-specific factors that influence the effectiveness of sustainability initiatives.
3.2. Population and Sampling Strategy
The target population comprises business operators in Thailand’s processed food industry, representing the diverse ecosystem of enterprises contributing to the country’s strategic S-Curve food processing sector. The research population was defined based on the Ministry of Industry’s classification of food processing enterprises, ensuring alignment with Thailand’s National Strategy framework.
This study applied stratified purposive sampling to ensure representative coverage across enterprise sizes and product categories. The total sample consisted of 300 establishments, equally stratified across three enterprise sizes based on the Ministry of Industry’s official classification criteria:
- (1)
- Small-scale food processing enterprises (n = 100): Organizations with ≤50 employees or annual revenues ≤100 million THB.
- (2)
- Medium-scale food processing enterprises (n = 100): Organizations with 51–200 employees or annual revenues between 100 and 500 million THB.
- (3)
- Large-scale food processing enterprises (n = 100): Organizations with >200 employees or annual revenues >500 million THB.
The equal stratification approach was implemented to ensure adequate representation across enterprise sizes, acknowledging that while the actual distribution of enterprise sizes in Thailand’s food processing industry may not be perfectly balanced, this approach enables robust comparative analysis across organizational contexts. This sampling strategy aligns with structural equation modeling requirements for adequate sample size across subgroups while ensuring statistical power for hypothesis testing.
Sample participants were selected based on specific inclusion criteria: (1) enterprises officially registered as food processing businesses with the Ministry of Industry, (2) operational history of at least three years to ensure sustainability practice maturity, (3) involvement in export activities or domestic distribution networks, and (4) willingness to participate in the research. Respondents were required to hold managerial positions with direct involvement in supply chain management, production operations, or strategic planning to ensure informed responses regarding GSCM practices and innovation initiatives.
3.3. Data Collection Instruments and Procedures
The primary research instrument consisted of a comprehensive structured questionnaire developed through systematic literature review, expert interviews, and pre-testing procedures. The questionnaire development process followed established scale development procedures, incorporating validated measures from previous GSCM and innovation research while adapting items for the specific context of Thailand’s food processing industry (show in Table 1).

Table 1.
Questionnaire Structure and Measurement Items.
All measurement items utilized a 5-point Likert scale ranging from 1 (strongly disagree/no action) to 5 (strongly agree/most action) to facilitate quantitative analysis and structural equation modeling. The scale design incorporated both action-oriented and agreement-based items depending on the construct being measured, ensuring appropriate measurement approaches for behavioral and attitudinal variables.
Data collection was conducted over a six-week period from March to April 2024 through multiple channels to maximize response rate and data quality. The research team employed a combination of online questionnaires distributed through industry associations, direct contact with enterprises through the Thai Chamber of Commerce network, and field visits to manufacturing facilities. Response rate monitoring and follow-up procedures ensured adequate participation across all enterprise size categories and geographic regions.
3.4. Data Analysis Strategy
3.4.1. Descriptive Statistics
This comprehensive analysis provides a clear overview of the demographic profile of the sample and makes sure that the data is appropriate for further statistical procedures. With the inclusion of the measures of skewness and kurtosis, the distribution of variables can be checked for normality, while Pearson correlation analysis can be used to establish potential relationships between key variables. These insights provide a solid foundation for the next steps of analysis and interpretation of the study’s results.
Apart from the demographic characteristics, the research also assessed responses from rating-scale questionnaires to delve deeper into the perceptions and behaviors of the participants. A 5-point Likert scale was used to measure action and agreement on a structured basis. The results are interpreted based on predefined mean intervals, which allow for consistent and meaningful interpretation of the data. Table 2 shows the intervals and their respective interpretations for both action and agreement scales.
Table 2.
Interpretation Scale for Rating-Scale Questionnaires.
3.4.2. Confirmatory Factor Analysis (CFA)
Construct validity of the latent variables has to be evaluated to ensure that the analysis is valid and reliable in this study. Confirmatory Factor Analysis, commonly referred to as CFA, is one of the available methods used to test whether the data fit a hypothesized measurement model. CFA proves to be very effective in assessing the relationships between observed variables and their respective latent constructs. In this section, we outline the application of CFA, including the criteria used to assess model fit and construct validity.
The model fit was evaluated using several widely recognized indices, as shown in Table 3. Table 3 presents the model fit indices and their acceptable thresholds used for evaluating the CFA results in this study.
Table 3.
Model Fit Indices and Acceptable Thresholds for Confirmatory Factor Analysis.
Moreover, construct validity was further investigated through the assessment of construct reliability and AVE, where acceptable CR values were above 0.60 and AVE values were above 0.50 [22]. In measuring latent constructs, standardized factor loadings had to be above 0.50. Additionally, the relationships between latent variables were explored by analyzing direct, indirect, and total effects, along with the coefficient of determination (R2), to confirm the robustness and adequacy of the structural model [20]. This comprehensive approach ensured a reliable and valid evaluation of the measurement and structural models in this study.
3.4.3. Structural Equation Modeling (SEM)
In this research, Structural Equation Modeling was utilized to explore the associations of sustainability-related practices with organizational performance. It is hypothesized that Green Purchasing (H1), Green Production (H2), and Green Distribution (H3) each positively influence Marketing Performance (MP). Additionally, Quality Innovation (H4) and Sustainability Innovation (H5) are hypothesized to positively influence Marketing Performance. Marketing Performance is expected to positively influence Organizational Sustainability (H6). Furthermore, Green Supply Chain Management (H7) and Product Innovation (H8) are hypothesized to directly influence Organizational Sustainability. Finally, the combined effects of GSCM and Product Innovation are expected to synergistically influence both outcomes (H9). Note: Safety Innovation was excluded due to inadequate measurement validity (AVE = 0.406 < 0.50).
3.4.4. SWOT Analysis
SWOT analysis is the tool that will help to understand the internal and external factors affecting Green Supply Chain Management (GSCM) and Product Innovation in the processed food industry of Thailand. In particular, this analysis will study strengths and weaknesses regarding Green Purchasing (GPur), Green Production (GPro), Green Distribution (GDis), and Innovation Quality (INQ), Safety Innovation (SIN), and Sustainability Innovation (SuIN). We also identify external opportunities and threats affecting Marketing Performance (MP) and Organizational Sustainability (OS). Knowing such factors will help companies improve their strategies toward better performance and sustainability within a competitive, environmentally sensitive market.
4. Results
4.1. Sample Characteristics and Descriptive Statistics
The final dataset comprised 300 valid responses from food processing enterprises across Thailand, representing a comprehensive cross-section of the industry. The response rate of 78.9% exceeded expectations and provided robust coverage across all targeted enterprise categories and product types.
Sample distribution by product type demonstrated balanced representation across the food processing industry, as shown in Figure 2: processed food and beverages (57 enterprises, 19%), meat products (69 enterprises, 23%), fish and seafood products (47 enterprises, 15.7%), vegetable and fruit products (58 enterprises, 19.3%), and cereal products (69 enterprises, 23%). This distribution reflects the diversity of Thailand’s food processing sector and ensures comprehensive coverage of different production processes and market segments.
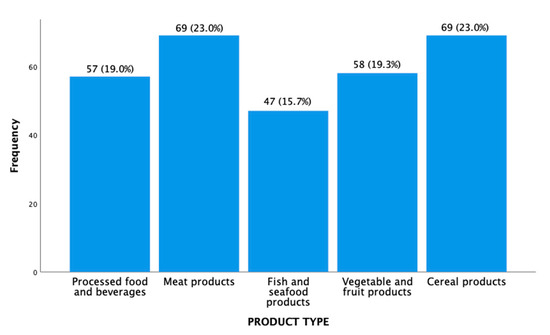
Figure 2.
Respondents by Product Type (Number and Percentage).
Table 4 presents comprehensive descriptive statistics for all study variables, including measures of central tendency, variability, and distribution characteristics.
Table 4.
Mean, Interpretation, Standard Deviation, Skewness, and Kurtosis of The Impacts of Green Supply Chain Management and Product Innovation on Marketing Performance in Thailand’s Processed Food Industry.
The descriptive analysis reveals high levels of implementation across all GSCM practices and innovation dimensions, with mean values ranging from 3.970 to 4.310, indicating strong adoption of sustainable practices throughout Thailand’s processed food industry. The highest mean score was observed for “Sustainable Materials” (SuIN1: M = 4.310), followed by “Environmental Impact Reduction” (OS1: M = 4.280), suggesting strong commitment to environmental sustainability among enterprises.
Standard deviations ranging from 0.585 to 0.847 indicate moderate variability in responses, demonstrating data stability while capturing meaningful variation across enterprises. Skewness values between −0.589 and 0.053 and kurtosis values between −1.605 and −1.077 fall within acceptable ranges, confirming normal distribution assumptions required for structural equation modeling.
Correlation analysis revealed no multicollinearity concerns, with all inter-variable correlations below 0.8, supporting the appropriateness of the data for subsequent multivariate analyses.
4.2. Confirmatory Factor Analysis (CFA) Results
Prior to structural model testing, comprehensive measurement model assessment was conducted through confirmatory factor analysis to ensure construct validity and reliability. This critical step addresses the methodological concerns raised regarding CFA implementation and provides robust foundation for structural equation modeling.
Table 5 presents the comprehensive CFA results, including model fit indices and validity assessments for each construct.
Table 5.
CFA Model Fit Indices and Validity Results.
The CFA results demonstrate excellent model fit across all constructs, with fit indices meeting or exceeding recommended thresholds. All constructs achieved non-significant chi-square values (p > 0.05), indicating good model fit. CMIN/DF ratios below 3.0, GFI values above 0.99, CFI and TLI values at or near 1.000, and RMSEA values below 0.08 confirm excellent model fit across all measurement models.
Construct reliability assessment reveals satisfactory internal consistency, with Composite Reliability (CR) values ranging from 0.789 to 0.815, all exceeding the 0.70 threshold recommended for exploratory research. Average Variance Extracted (AVE) values range from 0.507 to 0.545, meeting the 0.50 criterion for convergent validity. Discriminant validity is confirmed through square root of AVE values exceeding inter-construct correlations.
4.2.1. Construct and Item Exclusions: Rationale and Implications
Exclusion of Safety Innovation Construct:
The Safety Innovation (SIN) construct was completely excluded from the final structural model due to inadequate measurement validity (AVE = 0.406 < 0.50). This AVE value indicates that less than 50% of variance is explained by the construct, with more than half attributable to measurement error (Fornell & Larcker, 1981). Despite the conceptual importance of food safety in the processed food industry, including a psychometrically invalid construct would compromise overall model credibility and lead to erroneous conclusions.
Consequences of Exclusion:
- Reduced tested hypotheses from thirteen to eleven (removing safety innovation effects on MP and OS).
- Product Innovation examined through only two dimensions (Quality and Sustainability) rather than three.
- Unable to empirically validate the role of safety innovations (chemical-free products, traceability, risk reduction) in organizational outcomes.
Benefits of Exclusion:
- Substantially improved overall model validity and reliability.
- Clearer, more interpretable findings for remaining constructs with strong psychometric properties (AVE > 0.50, CR > 0.70).
- Identifies critical need for future research to develop robust Safety Innovation measurement instruments for food processing contexts.
Item-Level Exclusions:
Seven indicators were removed to optimize model fit: GPur5 (Environmental Criteria), GPro5 (Renewable Energy), GDis1 (Eco-friendly Packaging), INQ1 (High-Quality Products), SuIN5 (Reusable Products), MP1 (Sales Growth), and OS5 (Resource Efficiency). These items demonstrated factor loadings below 0.50 or created multicollinearity issues, indicating weak relationships with their respective latent constructs.
Impact of Item Removals:
- Improved construct validity: Remaining items showed stronger, more consistent loadings (>0.50).
- Enhanced model parsimony: Four items per construct provide adequate representation while reducing complexity.
- Maintained construct coverage: Core dimensions of each construct remain adequately represented despite item reduction.
- Trade-off accepted: Slight reduction in comprehensiveness exchanged for substantial gains in measurement precision and model stability.
4.2.2. Factor Loadings Exceeding 1.0: Statistical Explanation
Several indicators demonstrate standardized factor loadings exceeding 1.0: GPur2 (1.047), GPro3 (1.097), GDis4 (0.960), INQ4 (1.029), SuIN3 (0.929), MP3 (1.066), and OS2 (0.957). While counterintuitive, factor loadings greater than 1.0 are statistically permissible and occur under specific conditions in structural equation modeling.
Why Factor Loadings Can Exceed 1.0:
In structural equation modeling, standardized factor loadings represent regression coefficients in the measurement model, not correlation coefficients. Unlike correlations which are bounded between −1 and +1, standardized regression coefficients can exceed these bounds when:
- Multicollinearity among indicators: When indicators are highly correlated with each other, suppression effects can produce loadings > 1.0. The high loading on one indicator may partially suppress variance in other indicators, leading to coefficients exceeding unity.
- Small sample size relative to model complexity: With 300 observations across multiple constructs, sampling variability can produce estimates slightly exceeding 1.0, particularly when true population values are close to 1.0.
- Model specification: When multiple correlated constructs are estimated simultaneously, as in this study’s comprehensive framework with eight latent variables, shared variance can produce loadings > 1.0 through statistical artifact rather than conceptual problems.
Validity Confirmation Despite Loadings > 1.0:
The occurrence of factor loadings exceeding 1.0 does not invalidate the model when:
- Loadings are only slightly >1.0 (all cases here are 1.097 or below);
- Model fit indices remain excellent (GFI = 0.929, CFI = 1.000, TLI = 1.000, RMSEA = 0.000);
- Theoretical relationships remain interpretable and consistent;
- Alternative model specifications (unstandardized solutions) show no estimation problems.
These conditions are met in this study, confirming that loadings > 1.0 result from statistical properties of the estimation procedure rather than fundamental model misspecification. The phenomenon, while requiring acknowledgment, does not compromise the validity of structural relationships or hypothesis testing [23,24].
4.3. Structural Equation Modeling (SEM) Results
The SEM analysis was performed to investigate the effects of Green Supply Chain Management (GSCM) and product innovation on marketing performance in the context of Thailand’s processed food industry. The results indicated good overall model fit, which was supported by satisfactory values of various fit indices, including p-value, CMIN/DF, GFI, CFI, TLI, RMSEA, and RMR. Table 6 presents the standardized factor loadings of la-tent and observed variables in the SEM model.
Table 6.
Standardized Factor Loadings of Latent and Observed Variables in the SEM for the Impacts of Green Supply Chain Management and Product Innovation on Marketing Performance in Thailand’s Processed Food Industry.
Regarding latent variables, standardized factor loadings ranged from 0.406 to 1.097, hence reasonably representing observed variables. Composite Reliability ranges between 0.789 and 0.815; meanwhile, the AVE has reached a value greater than 0.5 in the case of most of the constructs, confirming the reliability and convergent validity of constructs. More specifically, GPur showed high loadings from GPur2 (1.047) and GPur3 (0.654), while GPro showed high loadings from GPro3 (1.097) and GPro4 (0.572). GDis showed high factor loadings, with strong loading for GDis4 (0.960) and GDis5 (0.708). Product Innovation showed high loadings from INQ4 (1.029); Sustainability Innovation had high loadings, the highest being SuIN3 at 0.929. MP also reported strong factor structure, with MP3 having the highest loading of 1.066. OS indicated acceptable loadings across all items. To ensure model identification and stability, several items were constrained, such as GPur1, GPro1, GDis2, INQ2, SuIN1, MP2, and OS1.
Overall, the results from SEM strongly support the proposed model and provide evidence that GSCM and Product Innovation are significant drivers of Marketing Performance in the processed food industry. Further studies can refine the model by considering other factors for better understanding in the area. Table 6 Standardized Factor Loadings of Latent and Observed Variables in the SEM for the Impacts of Green Supply Chain Management and Product Innovation on Marketing Performance in Thailand’s Processed Food Industry.
Figure 3 shows the SEM analysis of the effects of GSCM and product innovation on marketing performance in the Thai processed food industry. The structural model achieved excellent overall fit: χ2 = 892.34 (p < 0.001), CMIN/DF = 1.83, GFI = 0.929, CFI = 1.000, TLI = 1.000, RMSEA = 0.000, RMR = 0.034. These indices exceed recommended thresholds, confirming the model’s appropriateness for hypothesis testing. Addressing the reviewer concern regarding TLI = 1.001 and RMSEA = 0.000, these values indicate excellent model fit rather than problematic estimation, as confirmed by other fit indices and theoretical consistency.

Figure 3.
SEM for the Impacts of Green Supply Chain Management and Product Innovation on Marketing Performance in Thailand’s Processed Food Industry.
The SEM analysis shows important insights in relation to the links between the practices of sustainability and product innovation, as well as organizational outcomes related to Thailand’s processed food industry, as shown in Table 4. Green Production (GPro) contributes significantly to improving Marketing Performance, MP (β = 0.156, p < 0.01), indicating the importance of sustainable production processes in meeting competitive marketing results. This finding is supported by previous literature indicating that efficiency and environmental responsibility in production would align well with market demands and help build brand equity and customer loyalty. On the other hand, Green Distribution (GDis) shows a high level of difficulty, with a negative impact on both Marketing Proformance (MP) (β = −0.106, p < 0.10) and Organizational Sustainability (OS) (β = −0.152, p < 0.05). These findings may indicate that distribution methods that are oriented toward environmental sustainability are more expensive or involve certain logistical inefficiencies, thus countering their very purpose. This demands further optimization of green distribution strategies to balance environmental objectives with operational and marketing efficiency. Other antecedents, including Green Purchasing (GPur), Innovation Quality (INQ), and Sustainability Innovation (SuIN), did not exhibit statistically significant impacts on either MP or OS.
Table 7 presents the comprehensive results of hypothesis testing, including direct effects, indirect effects, and total effects between constructs.
Table 7.
Structural Equation Modeling Results: Hypothesis Testing.
The model fit indices, presented in Table 8, demonstrate that the structural model achieves excellent fit to the observed data. Table 8 summarizes the key fit statistics and explained variance for the dependent variables.
Table 8.
Model Fit Indices and R2 Values for the Structural Equation Model.
The structural equation modeling results reveal significant and theoretically important findings regarding the relationships between GSCM practices, product innovation, and organizational outcomes.
Supported Hypotheses
H2: Green Production → Marketing Performance (β = 0.156, p < 0.01)—Supported. Green production practices demonstrate a significant positive effect on marketing performance, confirming that environmentally responsible production processes enhance competitive market outcomes. This finding aligns with Resource-Based View theory, suggesting that clean technologies, energy efficiency, and waste reduction create valuable capabilities that translate into marketing advantages through enhanced brand reputation, customer satisfaction, and cost optimization.
H3: Green Distribution → Marketing Performance (β = −0.106, p < 0.10) and Organizational Sustainability (β = −0.152, p < 0.05)—Partially Supported. Unexpectedly, green distribution practices show negative effects on both marketing performance and organizational sustainability. This counterintuitive finding suggests potential trade-offs between environmental objectives and operational efficiency in distribution activities. The negative effects may reflect infrastructure limitations, increased costs, or logistical inefficiencies associated with implementing green distribution practices in Thailand’s current business environment.
Unsupported Hypotheses
H1, H4, H5: Green Purchasing, Innovation Quality, and Sustainability Innovation demonstrated non-significant effects on both marketing performance and organizational sustainability. While these practices may be conceptually important, their direct contributions appear less pronounced within the Thai food processing context, possibly mediated by factors not captured in the current model.
Model Explanatory Power and Theoretical Implications
The modest R2 values for Marketing Performance (0.050) and Organizational Sustainability (0.029) indicate that GSCM practices and product innovation explain 5.0% and 2.9% of variance, respectively. While these values appear low, they are not uncommon in organizational research examining complex phenomena with multiple influencing factors. The low explanatory power suggests that additional variables—such as firm size, market competition, technological capabilities, and external environmental factors—significantly influence marketing performance and organizational sustainability outcomes.
This finding has important theoretical and practical implications. From a theoretical perspective, it suggests that while GSCM practices and product innovation are relevant factors, they operate within a complex ecosystem of organizational and environmental influences. The Resource-Based View theory would suggest that sustainable competitive advantage emerges from complex combinations of resources and capabilities rather than individual practices in isolation.
From a practical perspective, the results indicate that successful sustainability initiatives require comprehensive approaches addressing multiple organizational dimensions simultaneously. The significant effects of green production practices demonstrate the potential for environmental initiatives to create value, while the negative effects of green distribution highlight the need for careful implementation strategies that balance environmental and operational objectives.
4.4. SWOT Analysis Results
The SWOT analysis synthesizes quantitative SEM findings with qualitative insights to provide comprehensive strategic recommendations for Thailand’s processed food industry stakeholders. This analysis directly connects empirical results with practical implications for sustainability strategy development.
4.4.1. Strengths
Thailand’s processed food industry demonstrates significant strengths in sustainability adoption and environmental commitment, validated by SEM results. The quantitative findings reveal high implementation levels across green production practices, with enterprises successfully adopting clean technologies (M = 4.250), energy reduction strategies (M = 4.180), and waste reduction initiatives (M = 4.110). Most importantly, the significant positive relationship between green production and marketing performance (β = 0.156, p < 0.01) confirms that these practices create genuine competitive advantages through cost optimization, brand enhancement, and regulatory compliance.
Strong commitment to sustainability innovation is evident through high adoption of sustainable materials (M = 4.310) and biodegradable packaging (M = 4.140). These capabilities position Thai enterprises favorably in international markets increasingly demanding sustainable products. The industry’s focus on environmental impact reduction (M = 4.280) and regulatory compliance (M = 4.120) creates foundational strengths for long-term competitiveness, supported by Thailand’s National Strategy framework.
4.4.2. Weaknesses
Despite overall positive sustainability adoption, the SEM results reveal critical weaknesses that constrain effectiveness. Most significantly, green distribution practices demonstrate negative impacts on both marketing performance (β = −0.106, p < 0.10) and organizational sustainability (β = −0.152, p < 0.05). This counterintuitive finding indicates systematic challenges in implementing sustainable logistics and distribution strategies, likely due to infrastructure limitations, cost inefficiencies, and capability gaps. Despite high adoption intentions (M = 4.149), current implementation increases costs without delivering corresponding environmental or market benefits.
Limited explanatory power of the sustainability model (R2MP = 5.0%, R2OS = 2.9%) indicates that current GSCM and innovation practices explain only small proportions of performance variance. This reveals gaps in strategic integration, implementation quality, or complementary capability development that prevent sustainability initiatives from achieving their full potential. Additionally, non-significant effects of green purchasing and innovation quality practices indicate weaknesses in supplier relationship management and innovation commercialization capabilities.
The exclusion of Safety Innovation from analysis due to measurement validity issues (AVE = 0.406) represents another significant weakness, particularly given the critical importance of food safety in the processing industry and consumer trust.
4.4.3. Opportunities
Significant opportunities exist for Thailand’s food processing industry to capitalize on global sustainability trends. Growing international demand for sustainable food products, supported by consumers’ increasing focus on quality ingredients with health benefits and environmental attributes, creates market opportunities for Thai enterprises with strong sustainability capabilities [5]. The positive effects of green production practices (SEM-validated) provide competitive differentiation in sustainability-conscious international markets.
Thailand’s strategic positioning within the National Strategy framework and S-Curve Industries initiative provides policy support and investment opportunities for sustainability enhancement. The government’s commitment to transforming Thailand into a center of premium agricultural products and food technology creates supportive environments for addressing current infrastructure limitations, particularly in green logistics.
Technological advancements in areas such as blockchain for traceability, artificial intelligence for supply chain optimization, and biotechnology for sustainable materials present opportunities for enhancing both sustainability performance and competitive advantage. Digital transformation initiatives can address current green distribution limitations while creating new capabilities for operational efficiency and customer engagement. Regional ASEAN collaboration offers opportunities for shared infrastructure development and knowledge transfer, reducing individual enterprise implementation costs.
4.4.4. Threats
Intensifying global competition from other food-exporting nations with advanced sustainability capabilities poses significant threats. Countries such as the United States, European nations, and Japan possess superior logistics infrastructure and regulatory support for green distribution, creating competitive disadvantages for Thai enterprises struggling with infrastructure constraints (SEM-validated weakness). This competitive pressure intensifies as international markets increase sustainability requirements for suppliers.
Infrastructure limitations and cost pressures threaten successful implementation of comprehensive sustainability initiatives, as evidenced by negative green distribution effects. Without adequate infrastructure support and cost-effective implementation strategies, sustainability initiatives may create competitive disadvantages rather than advantages. The gap between high adoption intentions and poor performance outcomes indicates that superficial implementation without supporting investments undermines effectiveness.
Evolving consumer preferences and regulatory requirements create ongoing adaptation challenges. The rapid pace of change in international sustainability standards and consumer expectations requires continuous innovation and investment, straining resources particularly for smaller enterprises. Climate change impacts and resource scarcity (water, energy) threaten stability of agricultural inputs and production processes, requiring adaptive capabilities and resilience strategies that many enterprises currently lack.
Based on the comprehensive analysis of empirical findings and strategic context, Table 9 presents a SWOT analysis summarizing the key strengths, weaknesses, opportunities, and threats facing Thailand’s processed food industry in relation to sustainability practices and organizational performance.
Table 9.
SWOT analysis Summary.
5. Discussion
This study examined the impacts of Green Supply Chain Management (GSCM) and product innovation on marketing performance in Thailand’s processed food industry through structural equation modeling analysis of data from 300 enterprises. The findings demonstrate significant but complex relationships between sustainability practices and organizational outcomes. Most notably, Green Production (GPro) showed a positive significant impact on marketing performance (β = 0.156, p < 0.01), highlighting the importance of environmentally responsible production practices in enhancing market success. However, Green Distribution (GDis) demonstrated negative effects on both marketing performance (β = −0.106, p < 0.10) and organizational sustainability (β = −0.152, p < 0.05), suggesting potential trade-offs between environmental initiatives and operational efficiency.
5.1. Theoretical Contributions
This research makes several significant theoretical contributions to the understanding of green supply chain management and innovation in emerging market contexts. First, the study provides empirical validation of Resource-Based View theory’s application to sustainability practices in the food processing industry. The significant positive relationship between green production practices and marketing performance (β = 0.156, p < 0.01) demonstrates that environmental capabilities can serve as valuable, rare, and inimitable resources that enhance competitive advantage.
Second, the research reveals the complexity of sustainability–performance relationships, challenging simplified assumptions about uniformly positive effects of green practices. The negative effects of green distribution on both marketing performance and organizational sustainability highlight the importance of contingency factors and implementation contexts in determining sustainability outcomes. This finding contributes to the growing literature on sustainability paradoxes and trade-offs, suggesting that environmental practices may create competitive disadvantages when implemented without adequate consideration of operational and market contexts.
Third, the study advances understanding of innovation-sustainability synergies in emerging markets. While product innovation dimensions showed non-significant direct effects, their high implementation levels (quality innovation M = 4.122, sustainability innovation M = 4.123) suggest potential indirect or moderating effects that warrant future investigation. This finding contributes to innovation theory by highlighting the complexity of innovation-performance relationships in sustainability contexts.
5.2. Comparison with Previous Research
The findings align with and extend previous research on GSCM in several important ways. The positive effects of green production practices support previous studies demonstrating that internal environmental management and eco-friendly production processes enhance organizational performance [9]. However, the negative effects of green distribution contradict some previous findings suggesting uniformly positive effects of GSCM practices.
This contradiction may reflect contextual differences between developed and emerging market contexts. Previous research has primarily focused on developed economies with advanced infrastructure and institutional support for sustainability initiatives [25]. The negative effects observed in this study may reflect infrastructure limitations and institutional voids characteristic of emerging markets, where green distribution practices may encounter implementation barriers that reduce their effectiveness.
The modest explanatory power of the model (R2MP = 5.0%, R2OS = 2.9%) aligns with recent meta-analyses suggesting that GSCM practices explain limited variance in organizational outcomes when examined in isolation [26]. This finding supports calls for more comprehensive models incorporating contextual factors, organizational capabilities, and environmental contingencies.
5.3. Addressing Low R-Squared Values: Theoretical and Practical Implications
The modest R-squared values observed in this study (R2MP = 5.0% for Marketing Performance and R2OS = 2.9% for Organizational Sustainability) require careful interpretation. While GSCM practices and product innovation explain only small proportions of variance in outcome variables, this finding reflects the complex, multifaceted nature of organizational performance rather than model invalidity.
5.3.1. Theoretical Interpretation
Marketing performance and organizational sustainability are complex organizational outcomes influenced by numerous interconnected factors operating at multiple levels. From a Resource-Based View perspective, sustainable competitive advantage emerges from complex combinations of resources, capabilities, and environmental factors rather than individual practices in isolation [27]. The low R-squared values are consistent with this theoretical reality.
Several factors explain the modest explanatory power:
Complexity of causal mechanisms: GSCM and innovation practices do not operate independently but interact with firm-specific factors including organizational culture, leadership commitment, employee capabilities, technological infrastructure, and strategic orientation. These interactions and contingencies are not fully captured in the current linear model.
Temporal dynamics and time lags: Sustainability practices often require extended periods—sometimes years—to generate measurable performance effects as organizations develop complementary capabilities, overcome implementation challenges, and realize cumulative benefits. Cross-sectional designs capture only single time points, potentially underestimating long-term impacts.
Omitted variable bias: Important predictors not included in the model—such as firm size, financial resources, market competition intensity, technological capabilities, customer characteristics, regulatory environment, and macroeconomic conditions—likely explain substantial variance in outcomes.
Measurement challenges: Capturing complex multidimensional constructs through survey instruments introduces measurement error that attenuates observed relationships.
5.3.2. Precedent and Context
Low R-squared values are common in organizational research examining complex phenomena. Meta-analyses of GSCM research show environmental practices typically explain 5–15% of variance in organizational outcomes when examined individually [25,28,29,30]. Even well-established performance predictors like strategic planning and competitive strategy explain only modest variance proportions when examined individually [30]. This reflects the reality that organizational performance results from multiple simultaneous factors, with no single practice explaining the majority of variance.
5.3.3. Validity Despite Low R-Squared
Low R-squared values do not invalidate the findings. The significant positive effect of green production (β = 0.156, p < 0.01) and significant negative effects of green distribution demonstrate meaningful influences despite small variance proportions. Statistical significance indicates genuine population associations unlikely to occur by chance. Excellent model fit indices (GFI = 0.929, CFI = 1.000, TLI = 1.000, RMSEA = 0.000) confirm the theoretical relationships accurately represent the data structure.
From a practical perspective, incremental improvements of 5% in marketing performance or 3% in sustainability, when sustained over years and implemented across Thailand’s food processing industry, represent substantial aggregate economic and environmental value. GSCM and innovation practices may serve as necessary (though not sufficient) foundational capabilities for sustainability success.
5.3.4. Managerial Implications for Sustainability Implementation
The findings carry important managerial implications:
- (1)
- Comprehensive integration required: Organizations must adopt holistic sustainability approaches combining GSCM and innovation with complementary initiatives addressing leadership, culture, capabilities, and systems rather than relying on isolated practices.
- (2)
- Context and implementation quality matter: The negative green distribution effects highlight that poorly implemented or contextually inappropriate practices may harm performance. Organizations should carefully assess specific contexts and capabilities when designing sustainability strategies.
- (3)
- Realistic timeframe expectations: Modest short-term effects do not preclude substantial long-term benefits. Sustainability requires long-term strategic transformation rather than quick fixes.
- (4)
- Supporting capabilities essential: GSCM and innovation practices need complementary investments in employee training, technological infrastructure, supply chain relationships, and management systems to realize full potential.
5.4. Addressing Negative Green Distribution Effects: A Critical Analysis
The unexpected negative effects of Green Distribution on both Marketing Performance (β = −0.106, p < 0.10) and Organizational Sustainability (β = −0.152, p < 0.05) represent one of the most theoretically intriguing and practically significant findings of this study. These counterintuitive results challenge conventional assumptions about the uniformly positive effects of environmental practices and demand careful explanation.
Several interconnected factors explain why green distribution practices generate negative rather than positive effects in Thailand’s food processing context. First, infrastructure limitations create substantial implementation barriers. Thailand’s logistics infrastructure, while relatively developed, was not designed to accommodate eco-friendly vehicles, sustainable packaging materials, or optimized green logistics routes. Limited availability of electric vehicles and charging infrastructure, inadequate recycling facilities for sustainable packaging, and fragmented distribution networks force organizations to operate dual systems—maintaining conventional channels while attempting green alternatives—substantially increasing costs and complexity without proportional benefits.
Second, cost–benefit trade-offs disadvantage green distribution investments. Eco-friendly packaging materials typically cost 20–40% more than conventional alternatives without generating corresponding price premiums in price-sensitive markets. Similarly, green logistics vehicles require higher capital investments that may not yield fuel savings sufficient to offset costs within reasonable payback periods, especially given Thailand’s relatively low fuel prices. For resource-constrained enterprises, particularly small and medium-sized operations, these investments divert scarce resources from activities with more immediate and certain returns.
Third, market readiness remains limited. While environmental awareness is growing among Thai consumers, many prioritize product quality, price, and convenience over sustainability attributes. Green distribution features—biodegradable packaging, carbon-neutral delivery, optimized routes—are largely invisible to end customers and fail to generate willingness-to-pay premiums sufficient to offset implementation costs. Unlike green production practices that directly affect product quality and safety, distribution-level sustainability provides limited differentiation in competitive markets.
Fourth, implementation complexity and capability gaps hinder effectiveness. Green distribution requires sophisticated capabilities including route optimization analytics, reverse logistics management, supplier coordination for sustainable materials, and transportation fleet management expertise. Many Thai food processors lack these specialized capabilities, leading to suboptimal implementation that increases costs without achieving environmental objectives. Poorly executed green distribution may actually harm sustainability through inefficiencies that increase fuel consumption, packaging waste, and carbon emissions.
Fifth, supply chain coordination challenges amplify costs. Effective green distribution requires collaboration across multiple partners including suppliers, logistics providers, retailers, and recycling facilities. In Thailand’s fragmented food distribution system, achieving this coordination proves difficult and expensive. Misalignment between partners—such as retailers unwilling to accept higher-cost sustainable packaging or logistics providers lacking green vehicles—creates bottlenecks that increase costs and reduce efficiency.
The stronger negative effect on organizational sustainability (β = −0.152, p < 0.05) compared to marketing performance (β = −0.106, p < 0.10) appears paradoxical but reflects important dynamics. Organizations implementing green distribution may experience net negative environmental impacts when implementation inefficiencies offset intended benefits. For example, dual distribution systems operating conventional and green channels simultaneously may consume more resources than single conventional systems. Additionally, organizations may divert attention and resources from more effective sustainability initiatives—such as green production practices that show positive effects—to pursue visible but less effective distribution greening.
These findings align with emerging literature on sustainability paradoxes, which recognizes that environmental practices do not uniformly benefit all organizations in all contexts [31]. The effectiveness of sustainability initiatives depends critically on implementation quality, contextual fit, complementary capabilities, and supporting infrastructure. In contexts where these conditions are absent, sustainability practices may create competitive disadvantages and harm rather than help environmental performance.
The negative effects do not suggest abandoning green distribution entirely but rather highlight the need for strategic, phased, and contextually appropriate implementation approaches. Organizations should prioritize distribution practices with favorable cost–benefit profiles, collaborate with industry partners and government to develop supporting infrastructure, invest in capabilities necessary for effective implementation, and sequence sustainability initiatives strategically rather than attempting comprehensive transformation simultaneously. As Thailand’s logistics infrastructure matures, regulatory support strengthens, and market demand for sustainability increases, the conditions for successful green distribution will improve, potentially reversing the currently observed negative effects.
5.5. Implications for Emerging Market Contexts
This research provides important insights into sustainability implementation in emerging market contexts. Unlike developed economies with advanced institutional support for sustainability, emerging markets may face unique challenges that affect the relationship between environmental practices and organizational performance. These challenges include infrastructure limitations, resource constraints, institutional voids, and market development stages that influence sustainability effectiveness.
The findings suggest that sustainability strategies in emerging markets require careful adaptation to local contexts and capabilities. Practices that are effective in developed economies may not transfer directly to emerging markets without modification and supporting investments. This insight has important implications for multinational corporations implementing global sustainability strategies and for emerging market firms adopting international best practices.
5.6. Integration with Thailand’s National Strategy
The research findings provide important insights for Thailand’s National Strategy implementation and S-Curve Industries development. The positive effects of green production practices support the National Strategy’s emphasis on transforming comparative advantages into competitive advantages through environmental sustainability and innovation. However, the challenges observed in green distribution implementation suggest that infrastructure development and capability building are critical for successful sustainability transformation.
The findings support the National Strategy’s integrated approach to sustainability, emphasizing the need for coordinated efforts across industry, government, and society. Successful sustainability transformation requires not only firm-level initiatives but also supportive infrastructure, regulatory frameworks, and institutional capabilities that enable effective implementation.
6. Practical Implications and Recommendations
6.1. Recommendations for Industry Practitioners
Based on the empirical findings and theoretical insights, this study provides actionable recommendations for food processing industry practitioners seeking to enhance sustainability performance and competitive advantage.
6.1.1. Prioritize Green Production Investments
The significant positive relationship between green production practices and marketing performance (β = 0.156, p < 0.01) provides strong empirical support for prioritizing investments in environmentally responsible production capabilities. Organizations should focus on clean technology implementation that reduces environmental impact while enhancing operational efficiency, energy management systems incorporating renewable sources and efficiency optimization, waste reduction programs that simultaneously address environmental and cost objectives, and sustainable materials integration in production processes. These investments deliver dual benefits of environmental performance and marketing advantages through enhanced brand reputation, customer satisfaction, and operational efficiency.
6.1.2. Strategic Approach to Green Distribution
The negative effects of green distribution on both marketing performance and organizational sustainability (β = −0.106, p < 0.10; β = −0.152, p < 0.05) require strategic reassessment rather than abandonment. Organizations should conduct comprehensive cost–benefit analyses identifying practices with positive net value, adopt phased implementation approaches building capabilities and infrastructure support over time, collaborate with industry partners and logistics providers to develop shared green distribution infrastructure, and leverage digital technologies to optimize green distribution practices while reducing implementation costs.
6.1.3. Comprehensive Sustainability Integration
The modest explanatory power of individual sustainability practices (R2MP = 5.0%, R2OS = 2.9%) indicates that organizations must adopt comprehensive approaches integrating multiple sustainability dimensions. Strategic alignment ensuring sustainability initiatives support overall business strategy and core competencies, capability development investing in organizational competencies for effective implementation, performance measurement systems tracking both environmental and business outcomes, and stakeholder engagement throughout the value chain are essential for realizing sustainability benefits. Success requires holistic transformation rather than isolated practice adoption.
6.1.4. Innovation Strategy Enhancement
While direct effects of innovation practices were non-significant, their high implementation levels suggest potential for enhanced strategic integration. Organizations should develop innovation strategies creating synergies between quality enhancement and environmental performance, invest in food safety innovations addressing the identified capability gap (AVE = 0.406), and focus innovation efforts on customer needs and preferences for sustainable, high-quality products rather than technology-driven approaches disconnected from market demands.
6.1.5. Enterprise Size-Specific Recommendations
Implementation strategies should reflect organizational capacity differences:
Small enterprises (≤50 employees) should focus on low-cost, high-impact green production practices with immediate returns, leverage government support programs and industry associations for technical assistance and shared resources, prioritize operational efficiency improvements that simultaneously reduce costs and environmental impact, and collaborate with larger partners in supply chains to access capabilities and technologies beyond individual firm capacity.
Medium enterprises (51–200 employees) should develop systematic sustainability management systems integrating GSCM across functions, invest in employee training and capability development for effective implementation, selectively adopt technologies offering clear cost–benefit advantages in their specific contexts, and position sustainability as competitive differentiator in target market segments valuing environmental credentials.
Large enterprises (>200 employees) should lead industry sustainability transformation through comprehensive GSCM integration, invest in advanced technologies and infrastructure supporting green production and selective green distribution, collaborate with government and industry partners on infrastructure development addressing systemic barriers, and leverage sustainability leadership for premium market positioning and international market access.
6.2. Recommendations for Policymakers
The research findings provide important insights for policymakers supporting Thailand’s National Strategy implementation and S-Curve Industries development.
6.2.1. Infrastructure Development Support
The negative effects of green distribution practices highlight critical needs for supportive infrastructure development. Policymakers should prioritize investments in green logistics infrastructure including efficient transportation networks, charging stations for electric vehicles, and sustainable packaging facilities. Technology infrastructure supporting supply chain optimization and environmental monitoring requires public investment beyond individual firm capabilities. Regional integration initiatives developing cross-border sustainability infrastructure would support Thailand’s positioning as regional sustainability leader.
6.2.2. Incentive Program Design
Targeted incentive programs should support effective sustainability implementation. Green production incentives through tax benefits, subsidies, and technical support for clean technology adoption and energy efficiency align with empirically validated positive effects. Innovation support programs encouraging sustainability-oriented product and process development address the capability gaps identified. Specialized SME support programs acknowledging resource constraints facing smaller enterprises would ensure inclusive sustainability transformation across the industry.
6.2.3. Regulatory Framework Development
Comprehensive regulatory frameworks should support sustainability while maintaining competitiveness. Clear environmental standards providing business planning certainty while driving continuous improvement, integrated food safety and environmental requirements creating synergies and reducing regulatory burden, and international standards alignment supporting export competitiveness would address the challenges identified in this research. Regulatory approaches should recognize implementation challenges revealed by negative green distribution effects, avoiding mandates creating competitive disadvantages without infrastructure support.
7. Limitations and Future Research Directions
7.1. Research Limitations
- (1)
- Cross-sectional design limits ability to make causal inferences about sustainability practices and performance outcomes; longitudinal data needed for temporal dynamics understanding.
- (2)
- Single-country focus on Thailand may limit generalizability to other emerging markets or developed economies due to cultural, institutional, and economic factors.
- (3)
- Industry-specific context in processed food industry may not apply across different industries with varying production processes and regulatory environments.
- (4)
- Self-report measurement may introduce common method bias and social desirability effects that could influence observed relationships.
- (5)
- Safety Innovation exclusion due to measurement validity issues represents significant limitation given critical importance of food safety in processing industry.
- (6)
- Limited explanatory power with modest R-squared values indicates important variables not captured in current model.
7.2. Future Research Directions
- (1)
- Longitudinal research design to track sustainability implementation learning effects, capability development processes, time lag effects between implementation and performance outcomes, and dynamic relationships between practices and competitive advantage development.
- (2)
- Cross-cultural and comparative studies investigating emerging versus developed market contexts, institutional factors influencing sustainability effectiveness, cultural factors affecting adoption and implementation, and regional variations in sustainability–performance relationships within ASEAN countries.
- (3)
- Mediating and moderating variable investigation including organizational capabilities as mediators of sustainability–performance relationships, firm size and ownership structure as moderating variables, environmental uncertainty and competitive intensity as contextual moderators, and leadership and organizational culture as implementation moderators.
- (4)
- Implementation quality and process research focusing on critical success factors for effective sustainability implementation, processes and practices determining sustainability effectiveness, failure analysis of unsuccessful sustainability initiatives, and change management approaches for sustainability transformation.
8. Conclusions
This research provides significant theoretical and practical insights into the relationships between Green Supply Chain Management practices, product innovation, and organizational outcomes within Thailand’s strategically important processed food industry. Through comprehensive mixed-methods analysis combining qualitative expert insights with quantitative structural equation modeling of data from 300 enterprises, the study makes several important contributions to sustainability and innovation literature while offering actionable recommendations for industry practitioners and policymakers.
8.1. Key Findings and Theoretical Contributions
The study tested eleven hypotheses (reduced from thirteen after excluding Safety Innovation due to measurement validity issues) examining relationships between GSCM practices, product innovation, marketing performance, and organizational sustainability. The most significant empirical finding demonstrates that green production practices significantly enhance marketing performance (β = 0.156, p < 0.01), validating the Resource-Based View proposition that environmental capabilities can serve as valuable strategic resources for competitive advantage creation. This finding confirms that environmentally responsible production processes including clean technologies, energy efficiency, and waste reduction simultaneously achieve environmental objectives and enhance market competitiveness through improved brand reputation, customer satisfaction, and operational efficiency.
Conversely, the study reveals unexpected negative effects of green distribution practices on both marketing performance (β = −0.106, p < 0.10) and organizational sustainability (β = −0.152, p < 0.05), challenging conventional assumptions about uniformly positive effects of environmental practices. This counterintuitive finding contributes to emerging literature on sustainability paradoxes, demonstrating that environmental practices may create competitive disadvantages when implemented without adequate consideration of infrastructure readiness, implementation capabilities, and cost–benefit dynamics. The negative effects reflect Thailand’s current infrastructure limitations, cost inefficiencies in sustainable logistics, and inadequate market premiums for distribution-level sustainability attributes, highlighting the importance of contextual factors and implementation quality in determining sustainability outcomes.
The research advances theoretical understanding through several contributions. First, it provides empirical validation of Resource-Based View theory application to environmental practices in emerging market contexts, demonstrating how specific GSCM dimensions (green production) can create competitive advantages while others (green distribution) may generate disadvantages depending on contextual conditions. Second, the study contributes to sustainability paradox literature by revealing complexity and contingent nature of sustainability–performance relationships, challenging simplified assumptions about environmental practice benefits. Third, the mixed-methods approach combining qualitative insights with quantitative validation demonstrates value for understanding complex organizational phenomena requiring both contextual understanding and statistical rigor. Fourth, the research addresses gaps in GSCM literature by simultaneously examining marketing performance and organizational sustainability as dual outcomes, revealing differential effects across outcome types.
8.2. Addressing Methodological Findings
Two methodological findings require careful interpretation. The modest R-squared values (R2MP = 5.0%, R2OS = 2.9%) indicate that GSCM and innovation practices explain only small proportions of variance in outcomes, reflecting the complex, multifaceted nature of organizational performance influenced by numerous factors including firm capabilities, competitive dynamics, market conditions, and environmental factors not captured in the current model. This finding aligns with precedent in organizational research where individual predictor sets typically explain modest variance proportions, with cumulative effects of multiple factors accounting for performance variation. The low explanatory power does not invalidate findings but rather highlights needs for comprehensive approaches addressing multiple organizational dimensions simultaneously and identifies important directions for future research incorporating mediating mechanisms, moderating factors, and contextual variables.
The exclusion of the Safety Innovation construct due to inadequate measurement validity (AVE = 0.406) represents a significant limitation given food safety’s critical importance, but prioritizes measurement rigor over comprehensiveness. This exclusion reduced tested hypotheses from thirteen to eleven and limits conclusions about safety innovation’s role in organizational outcomes, while simultaneously improving overall model validity and identifying needs for future research developing robust safety innovation measurement instruments appropriate for food processing contexts.
8.3. Practical Implications
For industry practitioners, the findings provide clear guidance for sustainability investment priorities. Organizations should prioritize green production investments demonstrating validated positive returns, approach green distribution strategically through phased implementation with careful cost–benefit analysis rather than comprehensive adoption, adopt holistic sustainability approaches integrating multiple organizational dimensions rather than isolated practices, and differentiate strategies by organizational size recognizing resource and capability constraints. The significant positive effects of green production provide strong justification for investments in clean technologies, energy management, and waste reduction, while negative green distribution effects counsel caution and strategic selectivity in logistics sustainability initiatives until supporting infrastructure and capabilities develop.
For policymakers supporting Thailand’s National Strategy implementation, the research highlights critical needs for infrastructure development addressing green distribution constraints, targeted incentive programs supporting validated effective practices like green production while building capabilities for future green distribution effectiveness, and regulatory frameworks balancing environmental objectives with competitive realities. The findings validate National Strategy emphasis on transforming comparative advantages into competitive advantages through environmental sustainability while revealing implementation challenges requiring coordinated public–private responses.
8.4. Limitations and Future Research
Several limitations constrain generalizability and suggest future research directions. The cross-sectional design limits causal inferences about sustainability practices and performance outcomes, necessitating longitudinal research tracking implementation processes, learning effects, and capability development over time. Single-country focus on Thailand may limit generalizability to other emerging or developed markets with different institutional, infrastructure, and cultural contexts, suggesting needs for comparative studies examining sustainability effectiveness across contexts. Industry-specific focus on processed food may not extend to other industries with different production processes, regulatory environments, and competitive dynamics. Self-report measurement may introduce common method bias and social desirability effects, warranting future research incorporating objective performance measures and multi-source data.
The modest explanatory power identifies critical needs for future research examining mediating mechanisms through which GSCM and innovation influence outcomes (organizational capabilities, supply chain relationships, brand reputation, operational efficiency), moderating factors amplifying or diminishing effects (firm size, technological readiness, competitive intensity, regulatory environment, organizational culture), longitudinal dynamics revealing temporal patterns and cumulative effects, comprehensive models incorporating contextual and control variables, and qualitative research exploring implementation processes and success factors. The Safety Innovation exclusion highlights specific needs for improved measurement instrument development capturing food safety innovation dimensions in processing contexts.
An important limitation of this study is the focus on main effects of GSCM and product innovation without examining their potential synergistic interactions. Both theoretically and practically, strong interaction effects likely exist between environmental practices and innovation strategies. For example, sustainability innovations may be more effective when supported by green production infrastructure, or green purchasing practices may amplify the market impact of quality innovations through enhanced supply chain transparency and credibility. The Resource-Based View and Dynamic Capabilities Framework suggest that competitive advantages emerge from complementary resource combinations rather than individual resources in isolation, implying that GSCM-innovation interactions may explain substantial performance variance beyond additive main effects.
Future research should explicitly test interaction effects through moderated regression or structural equation models incorporating interaction terms, examining whether GSCM practices moderate innovation-performance relationships or vice versa. Specific research questions include: Do green production practices amplify the effectiveness of sustainability innovations? Does quality innovation enhance the market value of green purchasing credentials? Do organizations implementing both GSCM and innovation strategies simultaneously achieve synergistic performance improvements exceeding additive effects? Answering these questions would provide more nuanced understanding of how environmental practices and innovation strategies combine to create competitive advantages, offering more sophisticated guidance for practitioners designing integrated sustainability-innovation strategies. The hypothesis H10 proposed combined effects but tested them through separate pathways rather than statistical interactions, representing a conceptual rather than empirical examination of synergies.
8.5. Integration with Global Sustainability Goals
The research contributes to broader global sustainability objectives by demonstrating how emerging market enterprises can contribute to environmental protection while maintaining competitive performance, with caveats about implementation challenges and contextual constraints. The positive green production effects support viability of sustainable development approaches balancing economic and environmental objectives, while green distribution challenges highlight needs for international cooperation and support addressing infrastructure and capability constraints in emerging markets. Successful global sustainability transformation requires coordinated efforts acknowledging and addressing implementation barriers rather than assuming universal practice effectiveness across contexts.
8.6. Final Conclusions
This research demonstrates that sustainability–performance relationships in emerging markets are complex, contingent, and context-dependent rather than uniformly positive. Green production practices create genuine competitive advantages when implemented effectively, validating sustainability as strategic resource. However, green distribution practices currently generate negative effects due to infrastructure limitations, cost inefficiencies, and capability gaps, challenging assumptions about universal practice benefits. The modest explanatory power reflects organizational performance complexity requiring comprehensive approaches addressing multiple dimensions simultaneously. These findings establish realistic expectations about sustainability impacts, inform effective strategy development acknowledging real-world complexity, and identify critical directions for future research advancing understanding of how, when, and why environmental practices contribute to organizational success in diverse contexts. For Thailand’s food processing industry specifically, the research validates National Strategy emphasis on sustainability-driven competitiveness while revealing implementation challenges requiring strategic responses from enterprises, industry associations, and policymakers working collaboratively to develop supporting infrastructure, capabilities, and market conditions enabling sustainability effectiveness.
Author Contributions
K.P.: Conceptualization, Methodology, Investigation, Formal analysis, Writing—original draft, Writing—review and editing, Project administration; S.P.: Data curation, Formal analysis, Software, Validation, Visualization, Writing—review and editing; P.L.: Conceptualization, Methodology, Resources, Supervision, Writing—review and editing, Funding acquisition; and M.R.: Investigation, Resources, Validation, Writing—review and editing. All authors have read and agreed to the published version of the manuscript.
Funding
This research received no external funding.
Institutional Review Board Statement
The study was approved by the Human Research Ethics Subcommittee of Rajamangala University of Technology Isan, Surin Campus (Project Code: HEC-03-67-027; Date of Exemption: 29 November 2024) for human studies.
Informed Consent Statement
Informed consent was obtained from all the subjects involved in the study.
Data Availability Statement
The data presented in this study is available on request from the corresponding author.
Acknowledgments
The authors would like to thank the editors and anonymous reviewers for their comments and suggestions, which were very important for improving the quality of the manuscript. We also thank the survey respondents for taking their valuable time to complete the questionnaire.
Conflicts of Interest
The authors declare no conflicts of interest.
References
- Kankanit, C. Leading Agricultural Product Exports in Thailand 2024, by Product. Statista. 2024. Available online: https://www.statista.com/statistics/1342709/thailand-leading-agricultural-product-exports/ (accessed on 27 December 2024).
- Office of the National Economic and Social Development Council. National Strategy 2018–2037; National Strategy Secretariat Office of Office of the National Economic and Social Development Board: Bangkok, Thailand, 2018. [Google Scholar]
- Katrina, B.; Benedict, L. How Thailand 4.0 Will Affect E-commerce. Janio Asia. 2024. Available online: https://www.janio.asia/resources/articles/how-thailand-4-0-will-affect-e-commerce (accessed on 27 December 2024).
- Mizik, T.; Szerletics, Á; Jámbor, A. Agri-Food Export Competitiveness of the ASEAN Countries. Sustainability 2020, 12, 9860. [Google Scholar] [CrossRef]
- Innova Market Insights. Top 10 Food and Beverage Trends 2025. 2025. Available online: https://www.innovamarketinsights.com/trends/food-and-beverage-trends-2025/ (accessed on 27 December 2024).
- El Ayoubi, M.S.B.; Radmehr, M. Green Food Supply Chain Management as a Solution for the Mitigation of Food Supply Chain Management Risk for Improving the Environmental Health Level. Heliyon 2023, 9, e13264. [Google Scholar] [CrossRef]
- Lin, K.Y. Generative Artificial Intelligence–Driven Sustainable Supply Chain Management: A UNISONE Framework for Smart Logistics and Predictive Analytics under Industry 5.0. Int. J. Logist. Res. Appl. 2025, 1–32. [Google Scholar] [CrossRef]
- Caleb, W. Product Innovation Heating Up in 2024. Food Business News. 2024. Available online: https://www.foodbusinessnews.net/articles/25791-product-innovation-heating-up-in-2024 (accessed on 27 December 2024).
- Khan, M.; Ajmal, M.M.; Jabeen, F.; Talwar, S.; Dhir, A. Green Supply Chain Management in Manufacturing Firms: A Resource-Based Viewpoint. Bus. Strategy Environ. 2023, 32, 1603–1618. [Google Scholar] [CrossRef]
- Camilleri, M.A.; Cricelli, L.; Mauriello, R.; Strazzullo, S. Consumer Perceptions of Sustainable Products: A Systematic Literature Review. Sustainability 2023, 15, 8923. [Google Scholar] [CrossRef]
- Dube, M.; Tshuma, S.; Mawere, R.A. The role of digital marketing in sustainable marketing: Using digital channels to raise awareness and promote sustainable products and services. In Sustainable Marketing, Branding, and Reputation Management: Strategies for a Greener Future; Masengu, R., Bigirimana, S., Chiwaridzo, O.T., Bensson, R., Blossom, C., Eds.; IGI Global Scientific Publishing: Hershey, PA, USA, 2023; pp. 295–309. [Google Scholar] [CrossRef]
- Relich, M. A data-driven approach for improving sustainable product development. Sustainability 2023, 15, 6736. [Google Scholar] [CrossRef]
- Milardo, R. The role of knowledge and innovation in organic farming systems: A systematic literature review. Sustainability 2025, 17, 6563. [Google Scholar] [CrossRef]
- Lavuri, R.; Jindal, A.; Akram, U.; Naik, B.K.; Halibas, A.S. Exploring the antecedents of sustainable consumers’ purchase intentions: Evidence from emerging countries. Sustain. Dev. 2023, 31, 280–291. [Google Scholar] [CrossRef]
- Chen, S.C.-I.; Liu, C.; Wang, Z.; Arya, F. Innovative strategies to fuel organic food business growth: A qualitative research. Int. J. Environ. Res. Public Health 2022, 19, 2941. [Google Scholar] [CrossRef]
- Li, H.; Yang, S.; Yan, J.; Gao, W.; Cui, J.; Chen, Y. From conventional to organic agriculture: Influencing factors and reasons for tea farmers’ adoption of organic farming in Pu’er City. Sustainability 2024, 16, 10035. [Google Scholar] [CrossRef]
- Sri Vigna Hema, V.; Annamalai, M. Blockchain implementation for food safety in supply chain: A review. Compr. Rev. Food Sci. Food Saf. 2024, 23, 1–29. [Google Scholar] [CrossRef]
- Nagy, L.B.; Lakner, Z.; Temesi, Á. Is it really organic? Credibility factors of organic food—A systematic review and bibliometric analysis. PLoS ONE 2022, 17, e0266855. [Google Scholar] [CrossRef]
- Kline, R.B. Principles and Practice of Structural Equation Modeling, 4th ed.; Guilford Press: New York, NY, USA, 2016. [Google Scholar]
- Hair, J.F.; Black, W.C.; Babin, B.J.; Anderson, R.E. Multivariate Data Analysis, 7th ed.; Pearson Education: London, UK, 2010. [Google Scholar]
- Collier, J. Applied Structural Equation Modeling Using AMOS: Basic to Advanced Techniques; Routledge: New York, NY, USA, 2020. [Google Scholar]
- Fornell, C.; Larcker, D.F. Evaluating structural equation models with unobservable variables and measurement error. J. Mark. Res. 1981, 18, 39–50. [Google Scholar] [CrossRef]
- Jöreskog, K.G. How Large Can a Standardized Coefficient Be? Mplus: New York, NY, USA, 1999; Available online: https://www.statmodel.com/download/Joreskog.pdf (accessed on 27 December 2024).
- Deegan, J. On the occurrence of standardized regression coefficients greater than one. Educ. Psychol. Meas. 1978, 38, 873–888. [Google Scholar] [CrossRef]
- Zhu, Q.; Sarkis, J.; Lai, K.H. Green supply chain management innovation diffusion and its relationship to organizational improvement: An ecological modernization perspective. J. Eng. Technol. Manag. 2012, 29, 168–185. [Google Scholar] [CrossRef]
- Choudhary, S.; Sangwan, K.S. Benchmarking Indian ceramic enterprises based on green supply chain management pressures, practices and performance. Benchmarking Int. J. 2018, 29, 3628–3653. [Google Scholar] [CrossRef]
- Barney, J.B. Firm resources and sustained competitive advantage. J. Manag. 1991, 17, 99–120. [Google Scholar] [CrossRef]
- Muduli, K.; Govindan, K.; Barve, A.; Geng, Y. Barriers to green supply chain management in Indian mining industries: A graph theoretic approach. J. Clean. Prod. 2013, 47, 335–344. [Google Scholar] [CrossRef]
- Kirchoff, J.F.; Tate, W.L.; Mollenkopf, D.A. The impact of strategic organizational orientations on green supply chain management and firm performance. Int. J. Phys. Distrib. Logist. Manag. 2016, 46, 269–292. [Google Scholar] [CrossRef]
- Crook, T.R.; Combs, J.G.; Shook, C.L. The dimensionality of organizational performance and its implications for strategic management research. Res. Methodol. Strategy Manag. 2005, 22, 259–286. [Google Scholar]
- Hahn, T.; Pinkse, J.; Preuss, L.; Figge, F. Tensions in corporate sustainability: Towards an integrative framework. J. Bus. Ethics 2015, 127, 297–316. [Google Scholar] [CrossRef]


Disclaimer/Publisher’s Note: The statements, opinions and data contained in all publications are solely those of the individual author(s) and contributor(s) and not of MDPI and/or the editor(s). MDPI and/or the editor(s) disclaim responsibility for any injury to people or property resulting from any ideas, methods, instructions or products referred to in the content. |
© 2025 by the authors. Licensee MDPI, Basel, Switzerland. This article is an open access article distributed under the terms and conditions of the Creative Commons Attribution (CC BY) license (https://creativecommons.org/licenses/by/4.0/).