Abstract
Information is a critical factor shaping firms’ strategic decisions. In the era of digital governance, governments can improve information transparency through public data openness, yet how this influences corporate sustainability practices remains underexplored. Using data on Chinese A-share listed firms from 2007 to 2023, this study employs a staggered difference-in-differences approach to examine the impact of Government Open Data Platforms on corporate environmental, social, and governance (ESG) performance. The results show that the establishment of Government Open Data Platforms significantly improves firms’ ESG performance. Mechanism analysis reveals that the effect operates through two channels: first, by reducing firms’ perceived uncertainty, thereby enhancing their internal motivation to engage in long-term ESG investments; second, by increasing external attention, which strengthens stakeholder oversight and reputational incentives. Further heterogeneity analyses show that such positive impact is stronger in cities with higher-quality data platforms, among non-heavily polluting firms, and for state-owned enterprises. Overall, these results highlight that government-led data openness can lower information frictions, serving as an effective soft governance tool to promote corporate sustainability.
1. Introduction
In recent years, corporate environmental, social, and governance (ESG) performance has drawn growing attention from scholars and policymakers, as it is increasingly seen as a key driver of firm’s long-term value and sustainable development. A growing body of the literature has examined the economic and organizational consequences of ESG activities, showing their impact on sustained innovation [1], financial performance [2], market value [3], and stakeholder relations [4]. Yet ESG initiatives typically require large, asset-specific, and irreversible investments—such as the purchase of pollution control equipment, the implementation of employee welfare programs, and the restructuring of governance practices—whose benefits often materialize only in the long term. As a result, firms often lack sufficient incentives to engage in ESG activities [5]. This has prompted a subset of the literature to analyze how external factors can drive ESG performance, focusing on perspectives such as legal systems [6], social norms [7], and stakeholder attention [8].
However, limited attention has been paid to the role of government-led digital governance initiatives—particularly Government Open Data Platforms (GODPs)—in shaping firms’ ESG behaviors. The development of digital and information technologies is exerting a profound impact on society and the economy, and a large body of research has focused on the influence of firms’ digital transformation on their ESG performance [9,10]. However, few studies have examined the impact of digital governance of government on firms’ sustainability outcomes. Jun et al. demonstrated that the Pilot Program of the Integration of Informatization and Industrialization significantly enhanced the ESG ratings of manufacturing firms [11]. Agboare et al. observed that the Internet Plus Initiative exerts varying impacts on corporate ESG scores across different stages of implementation [12]. Zhang and Bilawal Khaskheli examined the strategies employed for achieving sustainable economic development across the EU, the US, and China, highlighting the facilitating role of digital technology in advancing ESG performance. These policies represent distinct approaches to digital governance. As a new factor of production, how does the data factor affect firms’ ESG performance? By leveraging the launch of GODPs, this paper attempts to make a marginal contribution to this field.
Open government data refers to the practice of making government-generated data freely available to the public in machine-readable formats for unrestricted use and re-use. As a core component of digital government construction, open government data initiatives have proliferated worldwide over the past decade, aiming to improve transparency, accountability, and public participation [13]. Theoretically, opening public data can reduce information asymmetry, enhance trust in government, and improve the predictability of the regulatory environment. Empirically, studies have shown that open government data can stimulate transparency [14], innovation [15], investment, and capital flow [16]. Yet little is known about whether and how open government data affect corporate ESG performance.
China offers an ideal setting to investigate this question. Since 1999, the Chinese government has made efforts to construct digital government infrastructure and promote open data [17]. Beijing and Shanghai launched the first open data platforms in 2012 [18]. Subsequently, a number of cities have successively established public data open platforms [19]. By the end of 2023, 204 cities had established GODPs, covering more than 60% of all prefecture-level cities [16]. These platforms publish a wide range of datasets—including enterprise registration records, credit information, environmental monitoring data, and administrative penalties—that are crucial for reducing information frictions and fostering a transparent business environment [19]. Importantly, the staggered rollout of GODPs across cities creates quasi-experimental variation that allows for rigorous causal identification.
Combining data from Chinese A-share listed companies between 2007 and 2023, this study employs a staggered difference-in-differences (DID) approach to confirm that GODPs can significantly improve firms’ ESG performance. This conclusion passed a series of robustness tests. Second, this study verifies that reducing firms’ perceived uncertainty and increasing external attention are two important transmission channels. Third, this study finds that the promotional effect of GODPs is significant across all three sub-dimensions of ESG, and this effect is more pronounced in regions with higher data quality and for firms in non-heavily polluting industries and state-owned enterprises.
We make three main contributions to the literature. First, we provide novel evidence on the real effects of digital governance initiatives, demonstrating that government-led open data efforts can significantly improve firm-level ESG outcomes. While prior research has focused on the consequences of ESG [1,2,3,4], we shift the focus to its drivers, highlighting the role of data openness as a ‘soft’ regulatory tool. Additionally, from the perspective of data openness, we emphasize how data, as a new factor of production, influences firms’ behaviors. We suggest that digital governance, by improving data accessibility and transparency, can serve as a powerful “soft” regulatory tool for promoting sustainable business practices. Second, we identify two key mechanisms of this positive effect: (i) reducing firms’ perceived uncertainty, which strengthens their internal motivation to undertake long-term ESG investments; (ii) enhancing external attention, which intensifies stakeholder monitoring and reputational pressure, further incentivizing firms to improve ESG performance. Third, we document important heterogeneity: the positive effect of GODPs is stronger in cities with higher-quality open data platforms and among firms in less-polluting industries, highlighting the boundary conditions of information-based policy tools.
The remainder of the paper is organized as follows. Section 2 is the literature review, covering the institutional background and theoretical foundations, and develops the research hypotheses. Section 3 introduces the methodology, detailing the empirical strategy and data. Section 4 reports the baseline regression results and robustness checks and further explores the underlying mechanisms and heterogeneity analyses. Section 5 discusses the findings in comparison with prior studies. Finally, Section 6 concludes and outlines future research directions and policy implications.
2. Literature Review
2.1. Institutional Background
In the digital economy era, data has become a new production factor comparable to land and capital, playing a crucial role in driving high-quality economic growth, improving governance capacity, and enhancing public service [19]. Public data refers to information generated by government agencies and public institutions in the process of fulfilling statutory duties or providing public services [20]. Such data carries essential information on the functioning of society and serves as a cornerstone for advancing government digital transformation and the modernization of state governance [21]. Opening public data improves government transparency, strengthens public oversight, and facilitates evidence-based and participatory policymaking, thereby providing market participants with high-quality information for decision-making [22].
China has attached great importance to public data openness, progressing from basic information disclosure to systematic data sharing and full-scale open data initiatives. The launch of the “Government Online Project” in 1999 marked the first step toward Internet-based disclosure of government information [17]. The Regulations on Open Government Information (2007) provided a legal foundation by clarifying principles, scope, and procedures for disclosure. The Action Plan for Promoting Big Data Development (2015) was a milestone, establishing data as a strategic national resource and calling for accelerated government data openness and sharing. Since 2017, open data initiatives have accelerated: pilot programs were rolled out in Beijing, Shanghai, Zhejiang, and Guizhou, focusing on areas such as credit services, healthcare, and social security [16]. More recently, the 14th Five-Year Plan for Digital Economy Development and the Guidelines on Strengthening Digital Government Construction (2022) emphasized building a unified, interoperable, and secure national open data platform to unlock the “data dividend” and enable efficient allocation of data resources.
In practice, Beijing and Shanghai launched the first open data platforms in 2012, followed by cities such as Wuxi, Foshan, Zhanjiang, and Wuhan in 2014 [18]. Since 2015, the expansion has accelerated nationwide. By the end of 2023, 204 cities had launched open data platforms, achieving a coverage rate of 60.53% and forming a relatively comprehensive multi-tier open data ecosystem [16].
Open data platforms publish a wide range of information, including that on community governance, urban construction, administrative approvals, regulatory enforcement, enterprise registration, and credit records. Such data has two key characteristics: (i) originality, as it preserves raw data for secondary use and value creation; (ii) publicness, as access is non-rivalrous and non-excludable, available to all social actors.
Overall, public data openness represents an institutional innovation that promotes efficient circulation of data elements and aligns government governance logic with market efficiency logic. On the one hand, it enhances government transparency and public participation, promoting government transformation and optimization. On the other hand, it reduces information search and transaction costs for market actors, improves resource allocation efficiency, and provides an institutional foundation for corporate digital transformation and green development. These features make China an ideal setting to examine how public data openness affects firm-level ESG outcomes, given the staggered rollout of open data platforms across cities.
2.2. Theoretical Foundations and Hypothesis Development
2.2.1. GODPs and Corporate ESG Performance
From the perspective of institutional economics, a transparent and accessible information environment constitutes an essential element of a well-functioning market [20]. Prior studies provide consistent evidence that information transparency can generate positive externalities and foster sustainable outcomes. For instance, Xie et al. showed that enhanced information transparency has a positive impact on mental health [23]. Xu et al. found that the Automatic Environment Monitoring and Information Disclosure system improved environmental information transparency, thereby enhancing firms’ ESG performance [24]. Similarly, Li et al. suggested that when information provision is combined with performance incentives, local bureaucrats are more likely to take actions to reduce pollution [25].
The rapid development of digital government has profoundly transformed the way public resources are allocated and managed [11]. A key pillar of this transformation is the establishment of GODPs, which systematically collect, integrate, and release public data generated by various government agencies [21]. The core economic rationale behind public data openness lies in its ability to reduce information asymmetry between governments, firms, and other market participants, thereby improving market efficiency and promoting sustainable development [22].
GODPs provide standardized, credible, and timely data covering a wide range of domains, including macroeconomic indicators, environmental statistics, credit records, and administrative decisions [16]. This enhanced information infrastructure can help firms make more forward-looking and socially responsible decisions. First, public data openness increases the availability of reliable information on environmental and social issues, allowing firms to better understand stakeholder expectations and regulatory trends. Second, greater transparency enhances the accountability of firms and creates reputational incentives to meet higher ESG standards.
Taken together, these arguments suggest that the establishment of GODPs may create a more transparent, predictable, and efficiency-enhancing institutional environment, which supports and encourages firms to improve their ESG performance. Therefore, we propose the following baseline hypothesis:
Hypothesis 1.
The establishment of GODPs promotes corporate ESG performance.
This baseline hypothesis provides the foundation for our study. In the following subsections, we further explore the mechanisms through which GODPs may affect corporate ESG performance, focusing on two channels: reducing firms’ perceived uncertainty (internal channel) and enhancing external attention (external channel).
2.2.2. Reducing Firms’ Perceived Uncertainty
A growing body of the literature indicates that external uncertainty significantly inhibits firms’ ESG performance [26,27]. The underlying mechanisms can be attributed to three main aspects: First, according to real options and irreversibility investment theory [28,29], uncertainty dampens firms’ expectations of future returns, leading management to adopt a “wait-and-see” approach. Bernanke theoretically demonstrates that when new information about long-term project returns arrives gradually, firms prefer to delay investment decisions to avoid making irreversible mistakes, resulting in cyclical fluctuations in investment activities [28]. Building on this foundation, Baker et al. construct an index of economic policy uncertainty based on newspaper coverage and empirically show that greater uncertainty significantly reduces corporate investment in the United States [30]. Consistently with these findings, Wang and Zhu use Chinese firm-level data and find that higher uncertainty intensifies financing constraints, thereby discouraging inefficient or long-term investment [31]. These studies together provide solid theoretical and empirical support for the view that uncertainty leads to the postponement of or reduction in long-term strategic investments. Improving ESG performance typically requires substantial investments in dedicated assets, such as purchasing pollution control equipment, implementing long-term employee welfare programs, and optimizing governance structures. Such investments are often characterized by long investment cycles, slow returns, and low flexibility. Consequently, in a high-uncertainty environment, firms are more likely to view ESG projects as non-essential expenditures, thereby suppressing their ESG initiatives. Second, according to the managerial risk aversion theory, executives who hold substantial firm-specific human capital and securities tend to be more cautious in formulating long-term strategies when external uncertainty rises [32,33]. This risk aversion directly constrains their motivation to pursue proactive ESG improvements. Third, based on the attention allocation theory, uncertainty forces entrepreneurs to reallocate limited resources toward maintaining short-term cash flow. Meanwhile, to cope with rapid policy changes, management may prioritize tracking policy trends, lobbying, and building political connections [34]. This reallocation of cognitive resources crowds out the planning and execution of complex ESG strategies.
Many existing studies rely on macroeconomic policy uncertainty indices, implicitly assuming that all firms perceive the external environment in the same way. In practice, however, firms vary widely in their ability to process information, their tolerance for risk, and how they form expectations. The uncertainty a firm perceives is actually more direct and influential on its decisions than macro-level indicators. Therefore, effectively improving corporate expectations and mitigating their perceived uncertainty becomes a critical factor in stimulating ESG practices.
GODPs can significantly mitigate firms’ perceived uncertainty, thereby improving their ESG performance. The core mechanism is that the platforms provide high-quality, trustworthy data through multiple channels, creating a more stable and predictable business environment that strengthens firms’ willingness and ability to engage in ESG practices. First, opening public data reduces uncertainty by offering comprehensive and timely information on multi-dimensional data, including macroeconomic indicators, energy consumption data, healthcare information, environmental statistics, and social welfare data. This broad information coverage helps alleviate information asymmetry and reduces firms’ concerns about the future operating environment, enabling them to better grasp policy trends and market signals [16]. Second, opening public data can increase policy transparency. By providing governmental data, the platforms improve the transparency, accessibility, and credibility of the policymaking and implementation processes [20,35]. This creates conditions for firms to form stable expectations. Existing studies have shown that a more transparent institutional environment can significantly boost the confidence of market agents [36,37], reducing the “wait-and-see” and investment-delaying behaviors caused by insufficient information. Third, opening public data significantly lowers information search and processing costs. Unlike unstructured information scattered across various channels with varying degrees of credibility, the public data platforms provide authoritative, centralized, and credible data [13,20]. This greatly simplifies firms’ information verification and processing, allowing them to assess environmental changes more efficiently and accurately, thereby mitigating the perception of uncertainty arising from information incompleteness. Finally, opening data indirectly reduces uncertainty by improving corporate cooperation and financing environment. The platforms’ disclosure of corporate credit records, administrative penalties, and lists of exemplary firms helps alleviate information asymmetry, enabling firms to identify reliable partners and enhance their reputation in the capital market [16]. This increased transparency strengthens firms’ confidence in their future financing and collaboration environment, thereby mitigating overly conservative behavior driven by financing uncertainty.
In summary, GODPs mitigate firms’ perceived uncertainty not only by broadening information coverage, enhancing policy transparency, and lowering information costs but also by improving collaboration networks and financing conditions. Together, these factors create a more predictable and institutionally supportive environment for ESG strategies, strengthening firms’ confidence and capacity to engage in ESG activities. Based on this analysis, we propose the following hypothesis:
Hypothesis 2.
The establishment of GODPs reduces firms’ perceived uncertainty and facilitates improvements in their ESG performance.
2.2.3. Enhancing External Attention
GODPs serve as critical information infrastructure that elevates the attention of multiple external stakeholders—investors, analysts, rating agencies, media, and even supply chain partners—to local economies and firms. This heightened attention mitigates information asymmetry, strengthens external monitoring, and amplifies reputational pressure, ultimately incentivizing firms to improve their ESG performance.
GODPs enhance external attention primarily through two channels:
- 1.
- Broadening the base of external stakeholders.
Information asymmetry is a leading cause of resource misallocation [38]. Prior research has shown that the provision of comprehensive and reliable information can effectively reduce information asymmetry. Based on cross-country evidence from 27 nations, García-Sánchez et al. demonstrate that integrated reporting disclosure helps mitigate information asymmetry between firms and external stakeholders [39]. Building on this, Vitolla et al. assess integrated reporting quality across four dimensions—background, content, form, and assurance and reliability—and find that higher-quality disclosure reduces information asymmetry and, consequently, firms’ cost of equity capital [40]. In a similar vein, GODPs provide extensive datasets on local economic indicators, regulatory records, environmental monitoring, and corporate registries, which collectively enhance information transparency and reduce information asymmetry [20].
Beyond improving information accessibility, GODPs also lower the cost for information intermediaries, such as analysts and media outlets, to collect information, initiate coverage, and report on corporate activities [20]. For instance, analysts can more efficiently issue forecasts and identify promising firms, while media outlets can provide timely and accurate reporting. Similarly, investors lacking reliable data tend to adopt conservative strategies, leading to underinvestment in certain regions [28]. By publishing firm directories, “Top 100” firm lists, credit records, and sanction histories, GODPs offer investors an independent source of firm-level information, enabling them to better evaluate local risk-return profiles and allocate capital more efficiently [16].
- 2.
- Facilitating more detailed and comprehensive evaluation.
The authoritative and multi-dimensional information provided—from tax records to environmental compliance data—enables analysts, media, and investors to develop a deeper understanding of a firm’s operations, risk profiles, and governance practices. This richer information environment allows for more effective stakeholder monitoring of ESG-related activities. Consequently, GODPs not only widen the scope of external attention but also make that attention more informed and effective, leading to greater accountability for firms’ ESG performance.
Increased external attention promotes improvements in corporate ESG performance through two primary channels: alleviating financing constraints and strengthening external monitoring and reputational pressure.
Increased external attention improves the information environment, thereby lowering firms’ financing costs and alleviating financing constraints. Under information asymmetry, investors find it difficult to accurately assess firms’ true value and risk profiles, which leads them to demand higher risk premia to compensate for uncertainty, ultimately raising firms’ cost of capital. Greater attention from analysts, media, and investors expands the amount of firm-related information that is collected, disclosed, and interpreted in the market, improving the transparency and verifiability of firms’ operations, risk exposures, and governance practices [41,42]. This enhanced information environment reduces investors’ cost of acquiring and processing information and lowers their perceived uncertainty about firms’ future cash flows, making them more willing to supply funds at lower risk premia. As a result, firms experience reduced financing costs and mitigated financing constraints, which provides them with additional resources and stronger incentives to invest in ESG initiatives, such as environmental protection, employee welfare, and governance improvements.
External attention strengthens monitoring and reputational pressure. He et al. suggest that the media, as an informal institutional force, plays an effective monitoring role in improving the ESG performance of listed firms in China [8]. Lin and Guan focus on state-owned enterprises and argue that media exposure can alleviate regulatory paralysis and information asymmetry by quickly transmitting information about CEOs’ short-sighted behavior to the public, thereby generating reputational pressure and inducing better corporate practice [43]. Another important group of external stakeholders is analysts. Wan et al. find that firms receiving greater analyst attention are more likely to enhance their ESG engagement to achieve sustainable development and attract capital market interest [44]. Although there may be concerns about potential greenwashing [45], Liu et al. show that analyst coverage can in fact mitigate such behavior by improving transparency and external scrutiny [41]. Together, these studies indicate that firms under closer scrutiny from media, analysts, and rating agencies face greater oversight, which helps curb managerial self-serving behavior and mitigate principal–agent conflicts, thereby encouraging firms to account for the environmental and social impacts of their actions. Moreover, this transparency increases firms’ exposure to reputational risk. According to reputation theory, a firm’s reputation is a valuable intangible asset [46]. Greater visibility of misconduct can directly damage its social image and brand value. To safeguard their long-term market standing and maintain access to capital, firms are incentivized to proactively enhance their environmental and social performance.
Based on above analysis, we propose the following hypothesis:
Hypothesis 3.
Local GODPs enhance external attention, which in turn promotes firms’ ESG performance.
Figure 1 illustrates the pathways through which GODPs influence corporate ESG performance.
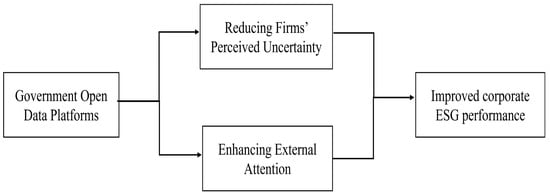
Figure 1.
Conceptual framework diagram.
3. Methodology
3.1. Empirical Strategy
The difference-in-differences (DID) method is a widely used quasi-experimental approach for policy evaluation [47]. It estimates causal effects by comparing the changes in outcomes between treated and control groups before and after a policy intervention [48]. The key identifying assumption is the parallel trends assumption, which posits that, in the absence of the treatment, the two groups would have followed similar trajectories over time [49].
Compared with traditional regression methods, the DID framework offers several advantages. First, it mitigates potential endogeneity concerns by exploiting policy shocks that are exogenous to individual firms’ decisions. Second, it controls for both time-invariant unobserved heterogeneity across firms and common time-varying shocks, thereby yielding unbiased estimates of the policy effect [49].
The standard DID model typically assumes two groups (treated and control) and two time periods (pre- and post-treatment). The staggered DID design extends this framework to multiple periods where treatment occurs at different times across units [48]. This design is particularly suitable for settings in which policy implementation is gradual or sequential across regions.
In the context of this study, the establishment of GODPs represents a policy shock that affects only certain cities at specific times. Since different cities launch their GODPs in different years, the treatment is staggered rather than simultaneous. The staggered DID framework allows us to fully exploit the variation in treatment timing, enhancing the precision and credibility of our causal identification.
3.2. Model Specification
To investigate the causal effect of GODPs on corporate ESG performance, this study leverages the exogenous shock of government data platform launches in various cities and employs a staggered difference-in-differences model [50]. Specifically, we designate cities that have established GODPs as the treatment group and other cities as the control group, and we estimate the following regression model:
where the subscripts i, c, and t denote the firm, city, and year, respectively. The dependent variable represents the ESG rating of firm i in city c in year t. The Huazheng ESG rating system classifies corporate ESG performance into nine tiers, in descending order: AAA, AA, A, BBB, BB, B, CCC, CC, and C. Since the dependent variable in a regression model should be numerical, it is a common practice in the literature to assign sequential values from 9 to 1 to these grades [6,11]. Specifically, a rating of AAA corresponds to a score of 9, AA to 8, and so on. The core explanatory variable is a binary indicator equal to 1 if city c launched a GODP in year t and 0 otherwise. The coefficient is the main coefficient of our interest, capturing the effect of GODPs on the ESG performance of firms. represents firm fixed effects, controlling for unobserved time-invariant firm-level characteristics. represents year fixed effects, accounting for time-specific shocks common to all firms. is the idiosyncratic error term. To address potential serial correlation and heteroskedasticity, standard errors are clustered at the city level.
includes a set of firm- and city-level covariates potentially affecting ESG ratings. Based on the existing literature, firm-level controls include firm size (scale, the natural logarithm of total assets), firm age (age, the natural logarithm of years since establishment), leverage (lev, the ratio of total liabilities to total assets), profitability (roe, the ratio of net income to total equity), firm value (tobinq, the ratio of market value to total assets), board size (board, the natural logarithm of number of directors), and the proportion of shares held by the top ten shareholders (sharehold). We also control for the nature of firm ownership (soe). City-level controls include the level of economic development (lngdpp, the natural logarithm of GDP per capita), industrial structure (industry_structure, the ratio of the added value of the secondary industry to GDP), and financial development (finance, the ratio of end-of-year outstanding loans from financial institutions to GDP).
3.3. Sample Selection and Data Sources
Our sample period spans from 2007 to 2023. The data used in this study are primarily from the following sources:
- Data on corporate ESG performance was sourced from the Huazheng ESG database, which is widely used in research on Chinese firms’ ESG performance. The ESG rating system integrates three dimensions, environmental (E), social (S), and governance (G), each of which covers multiple themes and specific issues. Environmental evaluation includes climate change, resource use, pollution, environmental friendliness, and environmental management; social evaluation covers human capital, product responsibility, supply chain, social contribution, and data security and privacy; and governance evaluation encompasses shareholder rights, governance structure, disclosure quality, governance risks, sanctions, and business ethics. The weighted ESG score is calculated by aggregating the sub-indicators using predetermined weights. To mitigate potential bias arising from differences in rating standards across industries, Huazheng standardizes the ESG scores within each industry. The standardized scores are then ranked from highest to lowest and classified into nine categories: AAA, AA, A, BBB, BB, B, CCC, CC, and C. Following the established literature [11,42], we use the annual average rating for our baseline regression, since the ratings are updated quarterly or monthly. For robustness checks, we also use Bloomberg’s ESG Ratings to rule out the influence of different rating methodologies.
- The launch dates for the cities’ GODPs were manually collected from publicly available reports. We cross-verified these dates using the “China Local Government Open Data Report” (Fudan DMG Lab) and the “China Government Open Data Utilization Research Report” (Central China Normal University) to ensure data accuracy.
- Financial, corporate, and analyst prediction data were sourced from the CSMAR database. The CSMAR database was developed as China’s first comprehensive economic and financial database, drawing on the professional standards of internationally renowned databases such as the University of Chicago’s CRSP, S&P’s Compustat, NYSE’s TAQ, ISDA, Thomson, and GSI Online, while adapting to China’s institutional context. It covers 19 research series, including the stock market, firms, funds, bonds, and derivative markets, making it the most comprehensive database available for research on China’s economy and financial markets. It is widely used in research on Chinese listed companies.
- Information about perceived corporate uncertainty was extracted from the “Management Discussion and Analysis” (MD&A) section of firms’ annual reports. We then used text-based analysis to construct our measure of perceived uncertainty.
- Indicators of media attention to listed companies were obtained from the CNRDS database, specifically its Financial News Database (CFND) module. CFND consists of two modules: online financial news and print financial news. The online financial news module collects news reports from over 400 major online media outlets, with a focus on the twenty most influential financial media sources, including Hexun, Sina Finance, Eastmoney, Tencent Finance, Netease Finance, and FT Chinese, among others. These outlets are recognized as leading domestic sources in terms of coverage and data quality and are frequently accessed by investors. The print financial news module includes data from over 600 leading newspapers, with particular emphasis on eight mainstream financial newspapers that are commonly used in academic research: China Securities Journal, Shanghai Securities Journal, China Business News, 21st Century Business Herald, China Business Journal, Economic Observer, Securities Daily, and Securities Times. These newspapers are valued for their timeliness, high-quality reporting, and significant influence, making them the most frequently used data sources in research on media-related issues in economics, management, and business studies.
- City-level control variables were obtained from the China City Statistical Yearbook for the period 2007–2023. The China City Statistical Yearbook is an official statistical publication that provides a comprehensive overview of urban development across China. It contains detailed data on various aspects of cities, including economic performance, social indicators, demographics, environmental conditions, and infrastructure development.
To ensure the reliability of our empirical results, we preprocessed the data with the following steps: (1) we excluded firms with abnormal listing statuses, such as ST and PT; (2) we removed firms in the financial and real estate industries due to their unique accounting principles; (3) we dropped firms with non-positive operating income; (4) we removed observations with missing key variables; (5) we excluded firms that changed their city of registration during the sample period to address potential self-selection bias. Finally, to mitigate the influence of outliers, we winsorized all continuous firm-level variables at the 1st and 99th percentiles.
Variable definitions are presented in Table 1, and descriptive statistics are reported in Table 2. The descriptive statistics indicate that the ESG performance of sample firms ranges from a minimum of 1 to a maximum of 7.75, with a mean of 4.1337 and a standard deviation of 0.7810, suggesting considerable variation across firms. The mean of opendata is 0.5312. In fact, our sample covers 253 cities, among which 172 had established GODPs by 2023.

Table 1.
Variable definitions.
Table 2.
Descriptive statistics.
4. Results
4.1. Baseline Regression Results
Table 3 presents the estimation results for Equation (1). Specifically, Column (1) reports the results without control variables, including only firm and year fixed effects. To address the concern of omitted variables, Columns (2) and (3) sequentially introduce firm-level and city-level controls. This allows us to isolate the effect of our variable of interest from these observable factors.
Table 3.
Baseline regression.
Across all specifications (Columns 1 to 3), the coefficient of opendata remains significantly positive at the 1% level, with an estimated coefficient of approximately 0.1707. This implies that the launch of a GODP leads to a 0.1707-point increase in corporate ESG scores on average. Relative to the standard deviation of 0.781 for the ESG score (Table 2), this effect is economically substantial. Furthermore, the consistent statistical significance of the opendata variable at the 1% level across all three columns, coupled with the minimal fluctuation in the coefficient estimates, underscores the robustness of our findings and suggests that potential estimation bias is limited.
4.2. Parallel Trends Test
The validity of the staggered difference-in-differences method hinges on the parallel trends assumption, which requires that the treatment and control groups would have followed similar trends in ESG performance in the absence of the policy intervention. To verify this assumption, we employ the following dynamic DID model:
where is a dummy variable, which equals 1 if year t is k years away from the launch year of the GODP in city c and 0 otherwise. For example, if city c launched its open data platform in 2016, then in 2014. Given that our sample covers 2007–2023, the launch years range from 2012 to 2022 and the range of k is [−13, 10]. To improve estimation precision, we collapse all leads with into one group and all lags with into another.
Figure 2 illustrates the results of the parallel trends test. The estimated coefficients for are not significantly different from zero in the periods before the launch of GODPs, validating the parallel trends assumption by confirming no significant pre-existing differences in ESG performance between the treatment and control groups. This implies that the subsequent improvement is unlikely to be driven by time-invariant firm-specific characteristics between the two groups.
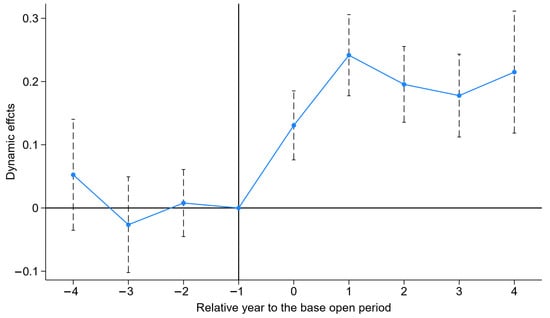
Figure 2.
Dynamic effect of government data openness on corporate ESG performance. Notes: This figure plots the dynamic effects of GODPs on corporate ESG performance. The horizontal axis marks years relative to the policy launch (0 = implementation year). The point estimates (solid dots) with their 99% confidence intervals (vertical lines) show that all pre-treatment intervals include zero, satisfying the parallel trends assumption. However, the coefficients turn positive and statistically significant from the implementation year onward, demonstrating a positive impact of GODPs on ESG performance.
Upon the launch of a GODP, the coefficient for the initial period (t = 0) turns significantly positive, underscoring that the policy’s positive impact on ESG performance is both immediate and rapid. This prompt market response suggests that external stakeholders closely monitor and trust the newly available government data, promptly incorporating it into their firm assessments.
Furthermore, the coefficients remain significantly positive for up to four years after the launch, with their magnitudes even exceeding that of the initial period. This pattern indicates that the effect of GODPs is not transient but exhibits persistence and even a gradual strengthening over time. A plausible explanation is that these platforms foster a sustained information monitoring ecosystem, which durably alters stakeholder behavior and exerts continuous pressure on firms to enhance their ESG practices.
4.3. Placebo Test
A potential concern is that unobservable confounding factors, which are simultaneously correlated with both the establishment of GODPs and corporate ESG performance, may bias our results. To address this issue, we conducted a placebo test. First, we randomly assigned the launch cities and years to construct a pseudo-treatment group and then re-estimated Equation (1). Then we repeated this random sampling process 1000 times and plotted the kernel density of the estimated coefficients. Figure 3 presents the kernel density distribution of the 1000 placebo coefficients generated from this procedure. We highlight two key analytical insights from this figure. First, the distribution is centered tightly around zero and approximates a normal distribution, which is the pattern we would expect if the policy assignment were random and had no true effect. Second, our baseline estimate of 0.1707 (indicated by the dashed vertical line on the right) lies far in the right tail of this placebo distribution, with none of the simulated coefficients exceeding its value. Thus, we can statistically reject the possibility that our actual result is a product of chance; the p-value implied by this test is effectively below 0.01. Collectively, this evidence strongly suggests that the significant improvement in ESG performance is a genuine causal effect of the GODPs and cannot be explained by unobserved confounders.
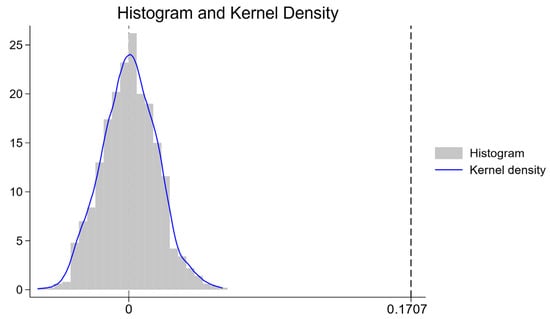
Figure 3.
Placebo test results. Notes: This figure plots the distribution of coefficients from 1000 randomizations of the launch city and time of GODPs. The resulting simulated distribution approximates a normal distribution centered around zero. Our actual benchmark estimate (0.1707, vertical dashed line) is a clear outlier in this distribution, as none of the placebo coefficients reach its magnitude. This confirms that the observed effect is genuine and not spurious.
4.4. Addressing Heterogeneous Treatment Effects
Section 4.2 preliminarily validated the parallel trends assumption. However, the recent literature indicates that the traditional two-way fixed effects model may yield biased estimates when heterogeneous treatment effects are present in staggered DID settings [51]. To mitigate this potential bias, we employ the stacked estimator for heterogeneous treatment effects, following the methodology of existing studies [52], to re-examine the dynamic effect of the GODPs on corporate ESG performance. As shown in Figure 4, there are no significant differences in ESG performance between the firms in affected and unaffected cities before the launch of GODPs. However, following platform launches, the ESG performance of firms in the treatment cities is significantly higher than that of firms in the control cities. This confirms that the parallel trends assumption holds even when accounting for heterogeneous treatment effects, and our fundamental conclusion remains robust.
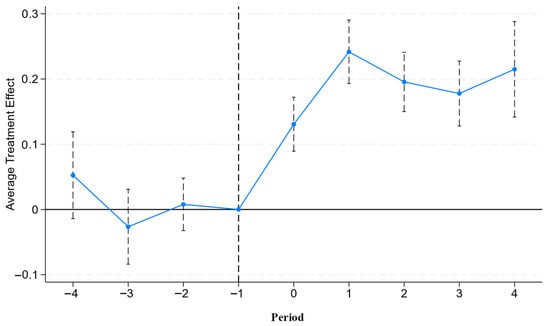
Figure 4.
Dynamic effect of government data openness on corporate ESG performance, considering heterogeneous treatment effects. Notes: The horizontal axis denotes the time relative to the initial launch of a GODP (where period 0 is the policy implementation year). The solid dots represent the point estimates, and the vertical dashed lines depict their 95% confidence intervals. The results validate the parallel pre-trends, as all pre-treatment confidence intervals include zero. From the implementation year onward, a statistically discernible positive effect emerges, evidenced by point estimates greater than zero with confidence intervals that exclude it.
4.5. PSM-DID
To further address concerns that our results might be driven by systematic pre-treatment differences between firms in cities that did and did not launch GODPs, we employed a Propensity Score Matching (PSM) DID approach. Specifically, we first used the PSM method to find appropriate control firms for the treatment group, matching all control variables included in the main model using 1:1 nearest-neighbor matching without replacement. This process created a more comparable counterfactual.
Subsequently, we applied the DID estimation to the successfully matched sample. The result from this refined sample is presented in Column (1) of Table 4. The coefficient for opendata is 0.1346 and remains significant at the 1% level. We provide two key analytical insights from this result. First, the coefficient’s significance confirms that our main finding is robust. Second, while the coefficient is slightly smaller than the benchmark of 0.1707, this attenuation is economically intuitive. It suggests that a portion of the initial estimated effect might be attributable to the slightly superior baseline characteristics of firms in cities that launched GODPs earlier. After matching, we isolated the effect of the policy itself from these firm-level predispositions. Consequently, this test not only reinforces the robustness of our core conclusion but also refines our interpretation, pointing toward a more precise causal estimate.
Table 4.
Robustness tests.
4.6. Exclusion of Alternative Policies
A primary identification challenge in our study stems from the fact that the launch of GODPs was part of a broader, national digital governance movement. Several other major policies promoting digital government construction were rolled out during our sample period; it was crucial to isolate the independent effect of GODPs from these concurrent initiatives. Our strategy was to directly control for these policies in our baseline model. If the effect of opendata remained robust, it would provide strong evidence that our results are not confounded by these alternative explanations.
- Internet Plus Government Services Initiative: Since both GODPs and the Internet Plus Government Services Initiative are key components of digital government development, and the latter was launched in 2016 within our sample period, it is crucial to ensure that our results are not confounded by this policy. The Guiding Opinions on Accelerating the Promotion of Internet Plus Government Services, issued by the State Council on September 25, 2016, designated 80 cities as pilot cities. So we set 2017 as the policy shock year and the 80 pilot cities as the treatment group. We introduced the dummy variable Internet, which equals 1 for pilot cities in 2017 and thereafter and 0 otherwise. Column (2) of Table 4 shows that the coefficients of both opendata and Internet are significantly positive, indicating that the positive effect of public data openness on local corporate ESG performance persists even after controlling for the influence of the Internet Plus policy.
- Broadband China Pilot Cities: This policy promoted digital infrastructure development and information flow. To rule out the effect of this policy, we introduced the dummy variable broadband into the baseline regression, where broadband equals 1 if the city c was designated as a Broadband China Pilot City in year t and 0 otherwise. Column (3) of Table 4 shows that the coefficient of opendata remains significantly positive after controlling for the Broadband China policy.
- National Pilot Policy of Information Benefiting the People: Both the National Pilot Policy of Information Benefiting the People and the establishment of GODPs aim to optimize the allocation of public resources through digitalization, serving as new mechanisms and models for innovating social governance and public services. In June 2014, the National Development and Reform Commission (NDRC) announced that 80 cities were designated as pilot cities under this program. To eliminate potential confounding effects from this policy, we introduced the dummy variable information into the baseline regression, where information is set to 1 if a firm is located in a pilot city and the year is 2015 or later and 0 otherwise. As shown in Column (4) of Table 4, the coefficient of opendata remains significantly positive even after controlling for the effects of this pilot program.
Furthermore, a comparison of the coefficient magnitudes in Table 4 reveals that the estimate for GODPs is notably larger than those for the other digital governance policies. This suggests that the establishment of GODPs has a more substantial marginal effect on corporate ESG performance relative to the alternative policies considered. This finding offers valuable empirical evidence for policymakers, indicating that investing in public data transparency may yield greater returns in promoting corporate sustainability compared to other digital initiatives, thereby aiding in the prioritization of policy tools.
4.7. Other Robustness Checks
To further verify the robustness of our conclusions, we also conducted the following tests:
- Excluding municipalities directly under the central government. Given that China’s four municipalities (Beijing, Shanghai, Tianjin, and Chongqing) enjoy unique policy advantages and greater administrative and economic resources, their inclusion might have led to an overestimation of the average treatment effect. To exclude the potential influence of these special environments and ensure the generalizability of our findings, we dropped these municipalities from the sample. Column (1) of Table 5 shows that the coefficient of opendata remains significantly positive.
Table 5. Other robustness checks.
- 2.
- Using an alternative ESG rating database. In the benchmark regression, we used the Huazheng ESG rating as a proxy for ESG performance. To exclude biases caused by different rating standards, we re-estimated Equation (1) using the Bloomberg ESG rating, which is also widely used in studies. Column (2) of Table 5 shows that the coefficient of opendata is 0.7623 and remains significant at the 1% level. This indicates that the improvement in corporate ESG performance driven by GODPs is not an artifact of a specific rating standard but reflects a fundamental and measurable enhancement in corporate sustainability practices that is recognized by multiple evaluators.
- 3.
- Controlling for more fixed effects. While our baseline model already controls for firm fixed effects and year fixed effects, we further controlled for industry fixed effects to mitigate bias from firms’ changing business scope. Additionally, to further mitigate bias from omitted variables, industry-year fixed effects and province-year fixed effects were included. These two fixed effects can absorb any potential omitted variable bias arising from industry-specific or province-specific time-varying shocks. As shown in Columns (3)–(6) of Table 5, the coefficient of opendata remains significantly positive.
Collectively, the battery of robustness checks presented in Table 5 subjects our core finding to a series of exacting challenges. The result holds when excluding potentially influential special administrative units, when measured by an entirely different ESG rating methodology, and when controlling for a rich array of time-varying unobserved confounders at the industry and province levels. This multi-faceted consistency suggests that the positive relationship between GODPs and corporate ESG performance is causal, robust, and generalizable.
4.8. Mechanism Tests
4.8.1. Mitigating Perceived Corporate Uncertainty
In the theoretical analysis, we proposed that open public data can improve corporate ESG performance by mitigating firms’ perceived uncertainty. To empirically test this mechanism, we first constructed the following regression model:
The dependent variable, , measures the perceived uncertainty of firm i in city c in year t. The other variables are defined as in Equation (1). Following the existing literature [53,54], we used a text-based analysis to construct based on Management Discussion and Analysis (MD&A) sections of firms’ annual reports. Specifically, we (i) extracted the MD&A section from each annual report, (ii) cleaned the text by removing numbers and punctuation, (iii) identified sentences that simultaneously contained policy-related terms and uncertainty-related terms, and classified them as uncertain sentences, otherwise as non-uncertain sentences. The policy-related terms and uncertainty-related terms we identified were the same as those identified by Huang and Luk (2020) [54].
We then constructed two measures: , the share of uncertainty-related words relative to the total number of words, and , the share of uncertainty sentences relative to the total number of sentences. Columns (1) and (2) in Table 6 show that the coefficient of opendata is significantly negative. This indicates that the establishment of GODPs leads to a reduction in the frequency of uncertainty-related discourse in corporate disclosures. This finding provides direct empirical support for the first link in our proposed causal pathway: that open data platforms effectively mitigate the policy and regulatory uncertainty perceived by firms. By making government information more accessible and predictable, GODPs appear to create a more stable business environment, as reflected in firms’ own communications.
Table 6.
Mechanism tests: mitigating perceived corporate uncertainty.
We further provide some indirect evidence for this mechanism.
First, a firm’s sensitivity to public data is closely related to the local business environment. In regions with a less favorable business environment, GODPs can significantly increase policy transparency and reduce the difficulty for firms to identify policy risks. Therefore, if open public data improves firms’ ESG performance by mitigating uncertainty, we expect this effect to be more pronounced in regions with a poor business environment.
To test this hypothesis, we divided the samples into quartiles based on the China Provincial Marketization Index [55]. We defined the bottom quartile as the “poor business environment” group and the top quartile as the “excellent business environment” group and estimated the impact of GODPs on ESG performance separately for these two groups. The results in Columns (3) and (4) of Table 6 show that the coefficient of opendata is insignificant for firms in the best business environment group, but it is significantly positive (at the 1% level) for firms in the worst business environment group. This is highly consistent with our theoretical expectation. In institutionally underdeveloped regions, information opacity and arbitrary policy implementation are primary sources of uncertainty for firms. GODPs, by injecting a stream of standardized, credible public data, mitigate this problem. They serve as a functional substitute for weak formal institutions, providing the clarity and predictability needed for firms to confidently make long-term ESG investments. In regions with a better business environment, the well-established institutional foundations may limit the marginal effect of open public data. This result also implies that GODPs help mitigate regional disparities caused by institutional differences.
Secondly, we examine the mechanism from the perspective of political connections. Close relationships between firms and government officials are a key feature of many economies, particularly in emerging markets [56]. Research has shown that political connections can serve as a non-market mechanism to reduce external uncertainty. On one hand, politically connected firms have greater access to information and government advice, allowing them to better navigate policy trends [57]. On the other hand, these firms are more likely to receive government support, such as subsidies, tax incentives, and credit resources [34,58]. Therefore, if open public data improves firms’ ESG performance by mitigating uncertainty, we would expect this effect to be smaller for politically connected firms. Faccio defined political connection as a situation where a firm’s top executive is a head of state, member of parliament, or government minister [34]. Wang et al. extended this definition to include executives who maintain strong ties with government officials or have served in governmental roles [59]. Similarly, Zhang et al. conceptualized political connections as having senior executives who are, or were, government bureaucrats or military officers [60]. Following these studies, we define a firm as politically connected if its chairman or general manager has or has had a government role. Columns (5) and (6) of Table 6 reveal that GODPs significantly enhance the ESG performance of non-politically connected firms, while their effect on politically connected firms is insignificant. This result further confirms our mechanism hypothesis: open public data primarily improves corporate ESG performance by mitigating policy uncertainty, and its effect is relatively limited for firms that already possess an information advantage. Also, they demonstrate that a primary function of these platforms is to democratize access to policy-relevant information. By acting as an essential public good, GODPs help level the informational playing field for the majority of firms lacking privileged access, thereby fostering a more equitable environment for information acquisition and mitigating the uncertainty disadvantage they face.
4.8.2. Enhancing External Attention
As crucial information intermediaries in the capital market, financial analysts systematically collect, process, and analyze firms’ public information. In doing so, they effectively mitigate market information asymmetry and serve as an external monitoring force, thereby prompting firms to enhance their governance and green innovation capabilities [41,61]. This enhanced scrutiny is vital for driving firms to improve their ESG performance and for fostering the sustainable development of the capital market. Based on this premise, we first investigate the impact of GODPs on analyst attention by estimating the following regression model:
Following existing research [61], we adopt two proxy variables for analyst attention: the number of analysts tracking a firm and the number of research reports published on the firm. The specific construction is as follows:
As shown in Columns (1) and (2) of Table 7, the coefficients on opendata are significantly positive, indicating that the establishment of GODPs draws significantly greater attention from financial analysts to local firms. Specifically, the coefficients of 0.0618 and 0.0881 imply that, on average, the launch of a GODP leads to an approximately 6.18% increase in the number of analysts covering a firm and an 8.81% rise in the number of associated research reports. The substantial magnitude of these effects underscores the considerable influence of public data disclosure in stimulating analyst engagement. This indicates that by providing more comprehensive, accurate, and timely macroeconomic and industry data, the policy reduces analysts’ information acquisition costs and improves the depth and efficiency of their research, attracting more analysts to initiate and maintain coverage.
Table 7.
Mechanism tests: enhancing external attention.
On the other hand, the media also plays a pivotal role as a key external governance mechanism in monitoring corporate behavior [62]. Studies have shown that an increase in media attention can significantly improve a firm’s ESG performance [8,43]. Drawing on the previous literature, we construct media attention indicators from two dimensions: online news and financial news in traditional newspapers. If a news article mentions a specific firm, it is considered relevant to that firm. We measure the final metric by taking the natural logarithm of one plus the total number of relevant news articles in a given year.
Columns (3) and (4) of Table 7 report the regression results for media attention. The coefficient of opendata in Column (3) is 0.0303 and statistically significant at the 5% level, indicating that the establishment of GODPs leads to an average increase of approximately 3% in online news coverage. Similarly, in Column (4), the coefficient of 0.0677—also significant at the 5% level—suggests that the platforms lead to a 6.77% rise in newspaper coverage. Notably, the larger percentage increase in newspaper coverage compared to that in online news may be attributable to the lower baseline volume of newspaper reports, given their limited space and slower publication cycle. Despite the smaller absolute increase, the 6.77% rise in newspaper coverage could exert a stronger influence on corporate behavior, as traditional newspapers often provide more in-depth and analytical reporting that carries substantial reputational weight. This result suggests that GODPs provide the media with a richer source of information and data support, enabling them to conduct more timely and in-depth corporate reporting.
In conclusion, the establishment of open public data platforms significantly boosts the attention that analysts and the media pay to firms. By improving the information environment, reinforcing monitoring mechanisms, and amplifying reputational effects, this policy incentivizes firms to improve their ESG performance, thereby highlighting its crucial value as an external governance tool for promoting sustainable corporate development.
4.9. Heterogeneity Analysis
4.9.1. Quality of Data Openness
The baseline results confirm that the establishment of GODPs, on average, improves firms’ ESG performance. However, platforms vary significantly in terms of data coverage, accessibility, update frequency, and usability. These quality dimensions may influence the platforms’ actual effectiveness. To gain a deeper understanding of how open data quality moderates the policy’s impact, we conducted further analysis.
We used the China Open Data Index published by the Digital and Mobile Governance Lab at Fudan University as a proxy for the quality of each city’s open data platform. This index systematically evaluates platforms across four key dimensions: readiness (covering institutional foundations like regulations, standards, and organizational support), the platform layer (focusing on functional features such as open protocols, data discovery, and user feedback), the data layer (assessing data quantity, quality, and security), and the utilization layer (evaluating mechanisms for promoting data use, application diversity, and the value of outcomes). This framework provides a comprehensive and objective measure of a government’s overall data openness quality.
Based on this index, we constructed a dummy variable, highquality, which equals 1 if a city’s index ranks among the top 50 nationwide and 0 otherwise. We then introduced an interaction term, opendata × highquality, into our baseline model to examine how data quality influences the effect of GODPs on corporate ESG performance. As shown in Column (1) of Table 8, the coefficient of the interaction term is significantly positive at the 10% level. This indicates that the positive effect of GODPs on corporate ESG performance is significantly stronger in cities with higher open data quality. The likely reason is that high-quality platforms provide more comprehensive, accessible, and reliable data resources, which more effectively reduces firms’ information acquisition costs and policy uncertainty and arouse more attention from external stakeholders. This, in turn, strengthens firms’ willingness and capacity to undertake long-term ESG investments. This finding has a clear policy implication: local governments should not only focus on whether they open data but also on continuously improving its quality to fully realize the platforms’ potential in creating a stable and transparent business environment that incentivizes firms to pursue sustainable development.
Table 8.
Heterogeneity analysis.
4.9.2. Impact on ESG Sub-Dimensions
An ESG rating is a composite score based on a firm’s performance across three distinct dimensions—environmental (E), social (S), and governance (G)—all of which are crucial for a firm’s long-term sustainability. To explore the differentiated impact of the GODPs on each sub-dimension of ESG performance, we use each of the three sub-scores as a separate dependent variable and estimate the following regression model:
where represents the E, S, and G scores of firm i in city c in year t, each measured on a 0–100 scale. The other variables are defined as in the baseline regression. Columns (2) through (4) of Table 8 report the estimated results for each dimension. The results show that GODPs have a significant positive impact on performance across all three dimensions—environmental, social, and governance. This suggests that public data openness, through various mechanisms including improving policy expectations, reducing information costs, and enhancing external scrutiny, has comprehensively incentivized firms to deepen and expand their sustainable practices. This highlights the vital role of high-quality open data as an institutional infrastructure in promoting multidimensional corporate sustainability.
4.9.3. Heterogeneous Effects by Pollution Intensity
To examine whether the effect of GODPs on corporate ESG performance varies across firms with different levels of environmental sensitivity, we conducted a heterogeneity analysis based on whether a firm belongs to a heavily polluting industry. Distinguishing between heavily polluting and non-polluting firms allows us to better identify the boundary conditions of this policy.
Following the Guidelines for Environmental Information Disclosure of Listed Companies issued by China’s Ministry of Environmental Protection in 2010, heavily polluting industries include thermal power, steel, cement, electrolytic aluminum, coal, metallurgy, chemicals, petrochemicals, building materials, paper-making, brewing, pharmaceuticals, fermentation, textiles, leather, and mining. We then constructed a dummy variable, polluted, which equals 1 if a firm belongs to any of the above industries and 0 otherwise. To test for heterogeneous effects, we augmented the baseline specification (1) by including an interaction term between public data openness (opendata) and the polluted-industry dummy (polluted), leading to the following model:
Column (5) of Table 8 reports the estimation results. The coefficient of the interaction term is significantly negative at the 1% level, indicating that the positive effect of public data openness on ESG performance is more pronounced among non-heavily polluting firms, whereas the improvement effect is relatively weaker for heavily polluting firms. Consistently with our mechanism analysis, the main channels through which data openness operates—stabilizing firms’ expectations and enhancing external monitoring—represent a form of “soft constraint,” which may be less effective for firms with high abatement costs and strong resistance to transformation.
This result likely reflects differences in how the two types of firms respond to information-based policy instruments. For firms with lower environmental burdens, enhanced transparency and visibility stabilize expectations and increase external scrutiny, which effectively encourages them to improve ESG practices. By contrast, for heavily polluting firms, two factors may limit the effectiveness of public data openness: first, these firms face substantially higher costs of pollution control, technological upgrades, and capacity adjustments, making ESG improvements less financially attractive when driven solely by information disclosure or reputational concerns; second, such firms are already subject to more stringent administrative regulations and mandatory policies—such as emission standards, production restrictions, and environmental taxes—so the marginal contribution of transparency-based policies may be partly offset.
Overall, these findings highlight the boundary conditions of public data openness as a policy tool. It suggests that policymakers should adopt differentiated strategies for different types of firms when promoting digital governance and environmental management. For non-heavily polluting firms, strengthening data openness and other information-based measures remains an effective way to foster a transparent market environment that encourages ESG improvements. For heavily polluting firms, however, complementary measures with stronger enforcement power—such as stricter regulatory standards, targeted subsidies for green technology upgrades, and economic instruments like environmental taxes—may be necessary to induce substantive ESG improvements and ensure that the overall policy objective of sustainable development is achieved.
4.9.4. Heterogeneous Effects by Corporate Ownership
Differences in ownership may influence the impact of GODPs on firms’ ESG performance. In China, state-owned enterprises (SOEs) are generally expected to shoulder greater social responsibilities and respond more actively to government policies. Therefore, the effect of GODPs may be more pronounced for SOEs. To test this conjecture, we classified central, provincial, and municipal state-controlled as well as wholly state-owned firms as SOEs (soe = 1), while privately owned and foreign-invested firms were categorized as non-SOEs (soe = 0) [63]. We then conducted subsample regressions. The results, reported in Table 8, Columns (6) and (7), show that GODPs significantly enhance ESG performance for both SOEs and non-SOEs. Column (8) further incorporates the interaction term between opendata and soe, and the coefficient is significantly positive, indicating that the effect of GODPs on improving ESG performance is stronger for SOEs.
This result can be attributed to SOEs’ inherent institutional nature. SOEs operate under a multiple-objective function that explicitly incorporates social and political goals alongside profit motives. Therefore, when GODPs clarify governmental priorities and societal expectations, SOEs are not only more sensitive to such signals but are also institutionally predisposed to align their resources accordingly. Furthermore, SOEs often benefit from softer budget constraints, which may afford them the financial flexibility to undertake substantial, long-term ESG investments that the improved information environment makes appear more viable. In contrast, for non-SOEs, which primarily operate under a profit-maximizing paradigm, the data primarily serves to reduce the uncertainty and costs associated with ESG investments, making them more attractive. While effective, this mechanism may trigger a more measured and incremental response compared to the policy-driven mobilization observed in SOEs.
5. Discussion
Our findings align with and extend prior research showing that greater information transparency alleviates information asymmetry and promotes ESG engagement. However, unlike studies emphasizing voluntary disclosure [2,3], our results highlight government-led data transparency as an exogenous institutional shock that reshapes the information environment at the city level. This demonstrates that public sector information openness can be an effective policy tool for influencing corporate behavior.
Moreover, our results complement the literature linking governance quality and digital transformation to sustainability outcomes. Prior studies have shown that stronger institutions foster better ESG performance [6,7]; our findings indicate that GODPs—unlike direct regulatory or fiscal instruments—operate through information diffusion rather than administrative enforcement. In contrast to policies such as “Internet Plus” and digital government initiatives [11], we find that GODPs exert a more substantial and stable impact on firms’ ESG outcomes, suggesting that information-based governance may be more cost-effective in promoting corporate responsibility.
At the mechanism level, our results confirm that GODPs lower perceived uncertainty and increase external scrutiny—findings consistent with the literature on corporate risk-taking and stakeholder monitoring [16,17]. Furthermore, we observe that the positive effect of GODPs is more pronounced among firms with weaker political connections, echoing studies that view political ties as substitutes for formal information channels [34,58]. This implies that GODPs enhance the fairness of information access and thereby improve overall market efficiency.
Finally, our results provide new evidence for policy design. Previous research has documented that tax incentives and mandatory emission reduction policies are effective in improving ESG outcomes among heavily polluting firms [6,44]. We show that open data policies represent a distinct and complementary policy tool: while traditional regulation remains necessary for high-emission firms, information transparency can effectively motivate non-heavily polluting firms to improve their ESG performance through market-based mechanisms. In addition, by demonstrating that the quality of open data—rather than mere existence—plays a decisive role, we extend prior research that focused solely on whether governments disclose data. This underscores the need for policymakers to continuously improve data quality to maximize the policy’s economic and environmental benefits.
6. Conclusions, Implications, and Future Research Works
6.1. Conclusions
This study investigates how GODPs, a cornerstone of digital governance, influence corporate ESG performance. Using a staggered difference-in-differences model and a comprehensive dataset of Chinese A-share listed firms from 2007 to 2023, we leverage the quasi-natural experiment of the launch of GODPs in various cities and draw the following key conclusions.
First, the establishment of a GODP by a city government significantly improves the ESG performance of local enterprises. This primary finding remains robust after controlling for concurrent government policies and holds through a battery of robustness checks, including parallel trend tests, placebo tests, heterogeneity-adjusted DID estimators, PSM-DID estimation, using an alternative ESG rating database (Bloomberg), excluding municipalities, and controlling for more granular fixed effects.
Second, we identify two distinct channels through which GODPs enhance corporate ESG performance. (1) GODPs reduce firms’ perceived uncertainty by providing timely, reliable, and policy-relevant information. This more predictable environment lowers the risks associated with long-term ESG investments and strengthens firms’ internal incentives to engage in sustainability-oriented practices. (2) GODPs increase external attention by facilitating media coverage, analyst tracking, and stakeholder monitoring. Heightened scrutiny creates reputational incentives and imposes external discipline, encouraging firms to improve their ESG performance to maintain legitimacy and avoid negative public exposure.
Furthermore, our heterogeneity analysis provides a more nuanced understanding of GODPs’ effects. We find that the positive impact is not uniform but is significantly stronger in cities with higher-quality open data platforms. This result underscores that the policies’ effectiveness hinges not just on the existence of platforms but, more critically, on the quality of the data and the platforms themselves. We also demonstrate that the policies’ influence is comprehensive, positively and significantly impacting all three ESG sub-dimensions—environmental, social, and governance—suggesting that public data openness can holistically incentivize firms’ sustainable practices.
6.2. Policy Implications
Our findings highlight the critical role of opening public data in promoting sustainable corporate behavior. Based on our results, we propose the following suggestions.
First, governments should accelerate the construction and expansion of GODPs to cover more regions and industries. The empirical evidence shows that the presence of a GODP exerts a positive and statistically significant impact on corporate ESG performance. Expanding the coverage of GODPs can help narrow the information gap across regions, reduce spatial disparities in firms’ ability to obtain data, and create a more level playing field for sustainable development.
Second, improving the quality of data openness is crucial. Our heterogeneity analysis reveals that the positive impact of GODPs is significantly stronger in cities with higher-quality data openness. Therefore, policymakers should move beyond the “quantity” dimension of data release and focus on the “quality” dimension, emphasizing comprehensiveness, machine-readability, update frequency, and standardization. Establishing rigorous quality evaluation mechanisms, continuous monitoring, and third-party audits can further ensure that open data is truly usable and valuable for market participants.
Third, public data openness should be embedded in a broader digital governance framework. GODPs should not function as passive data repositories but as dynamic platforms that integrate cross-departmental information, encourage interagency collaboration, and support innovative applications. By strengthening the interface between open data and policy implementation—e.g., through APIs, real-time data streams, and public feedback mechanisms—governments can enhance both the efficiency and credibility of their governance efforts, creating a virtuous cycle between data transparency and policy compliance.
Fourth, policymakers should actively promote the utilization of open data by enterprises. Merely providing data does not guarantee its effective use. Capacity-building programs, training workshops, and incentive mechanisms—such as grants and preferential procurement policies—can encourage firms, especially small and medium-sized enterprises (SMEs), to integrate open data into decision-making, ESG reporting, and risk management. Encouraging public–private partnerships and fostering a data innovation ecosystem can also maximize the economic and social value of open data.
Finally, ESG-related regulatory frameworks should be aligned with data openness efforts. Open data can serve as a foundation for more science-based and predictable ESG policies. Governments can leverage data to design targeted regulations, monitor compliance more efficiently, and evaluate policy effectiveness in real time. Coordinating data openness with ESG disclosure requirements, green finance initiatives, and carbon neutrality targets will amplify the overall impact of sustainable development policies.
6.3. Future Research Directions
This study provides novel evidence on the impact of GODPs on corporate ESG performance, yet several promising avenues for future research remain.
First, subsequent studies could delve deeper into the micro-level mechanisms through which GODPs influence corporate decision-making. For instance, it would be valuable to examine whether improved data accessibility enhances firms’ risk management capabilities or reshapes their communication strategies with stakeholders.
Second, further heterogeneity in firm characteristics warrants exploration. Firms likely differ in their capacity to utilize open data, which may lead to varying degrees of ESG responsiveness. Investigating these differential capabilities could yield more nuanced insights.
Third, while this study focuses on the effect of data availability on corporate ESG behavior, we note significant variation across cities in terms of data update frequency, coverage, and user accessibility—dimensions reflecting the quality of platform development. Our measure of data quality relies on the Open Data Index compiled by Fudan University; future work could refine the measurement of data quality and compare the heterogeneous effects of opening different types of data.
Finally, it would be insightful to compare the relative effectiveness of GODPs with other digital governance initiatives—such as smart city construction and digital regulatory systems—on various corporate behaviors. Such comparisons would contribute to a more comprehensive understanding of the digital governance ecosystem.
In summary, these research directions would significantly advance our understanding of how data openness shapes corporate behavior and offer a more robust empirical foundation for policymaking in the era of digital governance.
Author Contributions
Conceptualization, R.X. and C.X.; methodology, R.X.; software, R.X.; validation, R.X.; formal analysis, R.X.; investigation, R.X.; data curation, R.X.; writing—original draft preparation, R.X.; writing—review and editing, R.X. and C.X.; visualization, R.X.; supervision, C.X.; project administration, C.X.; funding acquisition, C.X. All authors have read and agreed to the published version of the manuscript.
Funding
This research was funded by the National Social Science Foundation of China, grant number No. 08&ZD037.
Data Availability Statement
The raw data supporting the conclusions of this article will be made available by the authors on request.
Acknowledgments
During the preparation of this manuscript, to enhance the clarity and flow of the manuscript, the text was polished with the assistance of an AI-powered tool. The authors have reviewed and edited the output and take full responsibility for the content of this publication.
Conflicts of Interest
The authors declare no conflicts of interest.
References
- Li, H.; Wang, J.; Zhang, R.; Duan, M. Research on the Impact of Corporate ESG Performance on Sustained Innovation in the VUCA Context: Evidence from China. Sustainability 2025, 17, 5304. [Google Scholar] [CrossRef]
- Ali, N.B.M.; Ali Hussin, H.A.A.; Mohammed, H.M.F.; Mohmmed, K.A.A.H.; Almutiri, A.A.S.; Ali, M.A. The Effect of Environmental, Social, and Governance (ESG) Disclosure on the Profitability of Saudi-Listed Firms: Insights from Saudi Vision 2030. Sustainability 2025, 17, 2977. [Google Scholar] [CrossRef]
- He, F.; Feng, Y.; Hao, J. Corporate ESG Rating and Stock Market Liquidity: Evidence from China. Econ. Model. 2023, 129, 106511. [Google Scholar] [CrossRef]
- Elamer, A.A.; Boulhaga, M. ESG Controversies and Corporate Performance: The Moderating Effect of Governance Mechanisms and ESG Practices. Corp. Soc. Responsib. Environ. Manag. 2024, 31, 3312–3327. [Google Scholar] [CrossRef]
- Wang, N.; Pan, H.; Feng, Y.; Du, S. How Do ESG Practices Create Value for Businesses? Research Review and Prospects. Sustain. Account. Manag. Policy J. 2024, 15, 1155–1177. [Google Scholar] [CrossRef]
- He, Y.; Zhao, X.; Zheng, H. How Does the Environmental Protection Tax Law Affect Firm ESG? Evidence from the Chinese Stock Markets. Energy Econ. 2023, 127, 107067. [Google Scholar] [CrossRef]
- Cicchiello, A.F.; Marrazza, F.; Perdichizzi, S. Non-financial Disclosure Regulation and Environmental, Social, and Governance (ESG) Performance: The Case of EU and US Firms. Corp. Soc. Responsib. Environ. Manag. 2023, 30, 1121–1128. [Google Scholar] [CrossRef]
- He, F.; Guo, X.; Yue, P. Media Coverage and Corporate ESG Performance: Evidence from China. Int. Rev. Financ. Anal. 2024, 91, 103003. [Google Scholar] [CrossRef]
- Ding, X.; Sheng, Z.; Appolloni, A.; Shahzad, M.; Han, S. Digital Transformation, ESG Practice, and Total Factor Productivity. Bus. Strategy Environ. 2024, 33, 4547–4561. [Google Scholar] [CrossRef]
- Guo, X.; Pang, W. The Impact of Digital Transformation on Corporate ESG Performance. Financ. Res. Lett. 2025, 72, 106518. [Google Scholar] [CrossRef]
- Jun, X.; Ai, J.; Zheng, L.; Lu, M.; Wang, J. Impact of Information Technology and Industrial Development on Corporate ESG Practices: Evidence from a Pilot Program in China. Econ. Model. 2024, 139, 106806. [Google Scholar] [CrossRef]
- Agboare, E.I.; Guang, L.; Ullah, A.; Iftikhar, H. Impact of Tech-Enabled Financial Disruptions and Internet Plus Initiative on Environmental, Social, and Governance (ESG) Performance in China: Evidence from a PVAR Approach. Manag. Decis. Econ. 2025, 46, 3467–3485. [Google Scholar] [CrossRef]
- Ubaldi, B. Open Government Data: Towards Empirical Analysis of Open Government Data Initiatives; OECD Publishing: Paris, France, 2013. [Google Scholar]
- Duguay, R.; Rauter, T.; Samuels, D. The Impact of Open Data on Public Procurement. J. Account. Res. 2023, 61, 1159–1224. [Google Scholar] [CrossRef]
- Du, Y.; Xu, J.; Yuan, X. How Public Digital Governance System Affects Firms’ Digital Technology Innovation Performance: Base on Open Innovation Perspective. Technol. Soc. 2025, 83, 103001. [Google Scholar] [CrossRef]
- Long, Y.; Zhang, X.; Wang, L. How Does Government Data Openness Affect Cross-Regional Capital Flow? Evidence from Chinese-Listed Firms’ Off-Site Investment. Econ. Model. 2025, 152, 107289. [Google Scholar] [CrossRef]
- Liu, H.; Xie, J.; Yang, Y. Government Data Opening and Corporate Cash Holdings: Evidence from a Quasi-Natural Experiment in China. Econ. Anal. Policy 2024, 84, 1394–1414. [Google Scholar] [CrossRef]
- Xie, D.-C.; Kuang, X.-W. The Effect of Public Data Openness on Enterprise Cross-Regional Investment: Evidence from China. Appl. Econ. Lett. 2025, 1–8. [Google Scholar] [CrossRef]
- Li, X.; Liu, Z.; Ye, Y. Public Data and Corporate Employment: Evidence from the Launch of Chinese Public Data Platform. Econ. Anal. Policy 2024, 84, 124–144. [Google Scholar] [CrossRef]
- Zhang, L.; Sok, S. The Impact of Government Open Data Platform Construction on Corporate Capital Market Performance: Evidence from Stock Liquidity. Pac. Basin Financ. J. 2025, 90, 102667. [Google Scholar] [CrossRef]
- Yan, J. Assessing the Link between Digital Government Development and Urban Industrial Chain Resilience: Evidence from Public Data Openness. Environ. Impact Assess. Rev. 2025, 112, 107796. [Google Scholar] [CrossRef]
- Wang, H.; Yang, G.; Ouyang, X.; Tan, Z. Does Environmental Information Disclosure Promote the Supply of Environmental Public Goods? Evidence Based on a Dynamic Spatial Panel Durbin Model. Environ. Impact Assess. Rev. 2022, 93, 106725. [Google Scholar] [CrossRef]
- Xie, T.; Yuan, Y.; Zhang, H. Information, Awareness, and Mental Health: Evidence from Air Pollution Disclosure in China. J. Environ. Econ. Manag. 2023, 120, 102827. [Google Scholar] [CrossRef]
- Xu, M.; Wang, Z.; Zhou, Y.; Wang, F.; Wu, Z. Environmental Information Transparency and Firms’ Sustainable Development: Evidence from Automatic Environment Monitoring and Information Disclosure in China. Energy Econ. 2025, 150, 108826. [Google Scholar] [CrossRef]
- Li, P.; Lu, Y.; Peng, L.; Wang, J. Information, Incentives, and Environmental Governance: Evidence from China’s Ambient Air Quality Standards. J. Environ. Econ. Manag. 2024, 128, 103066. [Google Scholar] [CrossRef]
- Ge, H.; Zhang, X. From Uncertainty to Sustainability: How Climate Policy Uncertainty Shapes Corporate ESG? Int. Rev. Econ. Financ. 2025, 98, 104011. [Google Scholar] [CrossRef]
- Jia, J.; Li, Z. Does External Uncertainty Matter in Corporate Sustainability Performance? J. Corp. Financ. 2020, 65, 101743. [Google Scholar] [CrossRef]
- Bernanke, B.S. Irreversibility, Uncertainty, and Cyclical Investment. Q. J. Econ. 1983, 98, 85. [Google Scholar] [CrossRef]
- Dixit, A.K.; Pindyck, R.S. Investment under Uncertainty; Princeton University Press: Princeton, NJ, USA, 2012; ISBN 978-1-4008-3017-6. [Google Scholar]
- Baker, S.R.; Bloom, N.; Davis, S.J. Measuring Economic Policy Uncertainty. Q. J. Econ. 2016, 131, 1593–1636. [Google Scholar] [CrossRef]
- Wang, J.; Zhu, S. Impact of Economic Policy Uncertainty on Corporate Investment Efficiency: Moderating Roles of Financing Constraints and Financialisation. Int. Rev. Econ. Financ. 2025, 98, 103897. [Google Scholar] [CrossRef]
- Wang, Y.; Liu, S. Managerial Short-Termism, ESG Performance, and Corporate Financial Fraud: A Heterogeneity Analysis Based on Corporate Ownership. Int. Rev. Econ. Financ. 2025, 102, 104385. [Google Scholar] [CrossRef]
- Zhang, Z.; Wang, F. Managerial Short-termism and Financial Statement Comparability. Account. Financ. 2023, 63, 5027–5067. [Google Scholar] [CrossRef]
- Faccio, M.; Masulis, R.W.; McConnell, J.J. Political Connections and Corporate Bailouts. J. Financ. 2006, 61, 2597–2635. [Google Scholar] [CrossRef]
- van Ooijen, C.; Ubaldi, B.; Welby, B. A Data-Driven Public Sector: Enabling the Strategic Use of Data for Productive, Inclusive and Trustworthy Governance; OECD Publishing: Paris, France, 2019. [Google Scholar]
- Li, Y.; Shang, H. How Does E-Government Use Affect Citizens’ Trust in Government? Empirical Evidence from China. Inf. Manag. 2023, 60, 103844. [Google Scholar] [CrossRef]
- Guo, J.; Wang, Q.; Li, R. Can Official Development Assistance Promote Renewable Energy in Sub-Saharan Africa Countries? A Matter of Institutional Transparency of Recipient Countries. Energy Policy 2024, 186, 113999. [Google Scholar] [CrossRef]
- Akerlof, G. The Market for “Lemons”: Quality Uncertainty and the Market Mechanism. In Essential Readings in Economics; Estrin, S., Marin, A., Eds.; Macmillan Education: London, UK, 1995; pp. 175–188. ISBN 978-0-333-59452-0. [Google Scholar]
- García-Sánchez, I.; Noguera-Gámez, L. Integrated Reporting and Stakeholder Engagement: The Effect on Information Asymmetry. Corp. Soc. Responsib. Environ. Manag. 2017, 24, 395–413. [Google Scholar] [CrossRef]
- Vitolla, F.; Salvi, A.; Raimo, N.; Petruzzella, F.; Rubino, M. The Impact on the Cost of Equity Capital in the Effects of Integrated Reporting Quality. Bus. Strategy Environ. 2020, 29, 519–529. [Google Scholar] [CrossRef]
- Liu, Y.; Zhang, J.; Dai, Y. Analyst Following and Greenwashing Decision. Financ. Res. Lett. 2023, 58, 104510. [Google Scholar] [CrossRef]
- Lu, Y.; Xu, C.; Zhu, B.; Sun, Y. Digitalization Transformation and ESG Performance: Evidence from China. Bus. Strategy Environ. 2024, 33, 352–368. [Google Scholar] [CrossRef]
- Lin, O.; Guan, J. The Impact of Media Attention, Board Independence on CEO Power, and ESG in State-Owned Enterprises. Financ. Res. Lett. 2024, 62, 105180. [Google Scholar] [CrossRef]
- Wan, G.; Zhang, W.; Li, C. How Does Low-Carbon City Pilot Policy Catalyze Companies toward ESG Practices? Evidence from China. Econ. Anal. Policy 2024, 81, 1593–1607. [Google Scholar] [CrossRef]
- Pizzetti, M.; Gatti, L.; Seele, P. Firms Talk, Suppliers Walk: Analyzing the Locus of Greenwashing in the Blame Game and Introducing ‘Vicarious Greenwashing’. J. Bus. Ethics 2021, 170, 21–38. [Google Scholar] [CrossRef]
- Board, S.; Meyer-ter-Vehn, M. A Reputational Theory of Firm Dynamics. Am. Econ. J. Microecon. 2022, 14, 44–80. [Google Scholar] [CrossRef]
- Roth, J.; Sant’Anna, P.H.C.; Bilinski, A.; Poe, J. What’s Trending in Difference-in-Differences? A Synthesis of the Recent Econometrics Literature. J. Econom. 2023, 235, 2218–2244. [Google Scholar] [CrossRef]
- Baker, A.C.; Larcker, D.F.; Wang, C.C.Y. How Much Should We Trust Staggered Difference-in-Differences Estimates? J. Financ. Econ. 2022, 144, 370–395. [Google Scholar] [CrossRef]
- Angrist, J.; Pischke, J.-S. Mostly Harmless Econometrics: An Empiricist’s Companion. In Mostly Harmless Econometrics: An Empiricist’s Companion; Princeton University Press: Princeton, NJ, USA, 2009; ISBN 9780691120348. [Google Scholar]
- Callaway, B.; Sant’Anna, P.H.C. Difference-in-Differences with Multiple Time Periods. J. Econom. 2021, 225, 200–230. [Google Scholar] [CrossRef]
- Goodman-Bacon, A. Difference-in-Differences with Variation in Treatment Timing. J. Econom. 2021, 225, 254–277. [Google Scholar] [CrossRef]
- Cengiz, D.; Dube, A.; Lindner, A.; Zipperer, B. The Effect of Minimum Wages on Low-Wage Jobs. Q. J. Econ. 2019, 134, 1405–1454. [Google Scholar] [CrossRef]
- He, C.; Li, Y.; Zhu, J. The Effect of Firm-Level Perception of Uncertainty on Innovation: Evidence from China’s Listed Firms. Econ. Lett. 2022, 221, 110886. [Google Scholar] [CrossRef]
- Huang, Y.; Luk, P. Measuring Economic Policy Uncertainty in China. China Econ. Rev. 2020, 59, 101367. [Google Scholar] [CrossRef]
- Fan, G.; Wang, X.; Zhu, H. China’s Provincial Market Index Report; Social Sciences Academic Press: Beijing, China, 2018. [Google Scholar]
- Long, Z.; Duan, Y.; Zhan, H. The Impact of Organizational-Level Political Connection on Environmental Strategy in Private Firms. Econ. Model. 2024, 132, 106644. [Google Scholar] [CrossRef]
- Wong, W.-Y.; Hooy, C.-W. Do Types of Political Connection Affect Firm Performance Differently? Pac. Basin Financ. J. 2018, 51, 297–317. [Google Scholar] [CrossRef]
- Huang, Z.; Gao, N.; Jia, M. Green Credit and Its Obstacles: Evidence from China’s Green Credit Guidelines. J. Corp. Financ. 2023, 82, 102441. [Google Scholar] [CrossRef]
- Wang, Z.; Liu, X.; Kong, X.; Zhou, J. Corporate Political Connection, Rent Seeking and Government Procurement Order. Int. Rev. Econ. Financ. 2025, 103, 104354. [Google Scholar] [CrossRef]
- Zhang, C.; Zhou, B.; Tian, X. Political Connections and Green Innovation: The Role of a Corporate Entrepreneurship Strategy in State-Owned Enterprises. J. Bus. Res. 2022, 146, 375–384. [Google Scholar] [CrossRef]
- Wang, L.; Cao, L. Analyst Attention and Corporate Green Innovation. Financ. Res. Lett. 2024, 60, 104924. [Google Scholar] [CrossRef]
- An, Y.; Jin, H.; Liu, Q.; Zheng, K. Media Attention and Agency Costs: Evidence from Listed Companies in China. J. Int. Money Financ. 2022, 124, 102609. [Google Scholar] [CrossRef]
- Liu, X.; Huang, N.; Su, W.; Zhou, H. Green Innovation and Corporate ESG Performance: Evidence from Chinese Listed Companies. Int. Rev. Econ. Financ. 2024, 95, 103461. [Google Scholar] [CrossRef]


Disclaimer/Publisher’s Note: The statements, opinions and data contained in all publications are solely those of the individual author(s) and contributor(s) and not of MDPI and/or the editor(s). MDPI and/or the editor(s) disclaim responsibility for any injury to people or property resulting from any ideas, methods, instructions or products referred to in the content. |
© 2025 by the authors. Licensee MDPI, Basel, Switzerland. This article is an open access article distributed under the terms and conditions of the Creative Commons Attribution (CC BY) license (https://creativecommons.org/licenses/by/4.0/).