Article

Optimizing Nitrogen Management in Acidic Tea Orchard Soils: The Role of Biochar-Based Fertilizers in Reducing Losses and Enhancing Sequestration

Tea Research Institute, Anhui Academy of Agricultural Sciences, Hefei 230001, China
*
Author to whom correspondence should be addressed.
Sustainability 2025, 17(21), 9751; https://doi.org/10.3390/su17219751 (registering DOI)
Submission received: 19 August 2025 / Revised: 20 October 2025 / Accepted: 30 October 2025 / Published: 1 November 2025

Abstract

Biochar-based fertilizers have attracted increasing attention as sustainable soil amendments due to their potential to enhance nitrogen (N) retention and mitigate N losses. However, their effects on N dynamics in tea orchard soils remain inadequately understood. This study investigated the impact of biochar-based fertilizer (BF) on N migration and transformation into acidic tea orchard soils through controlled laboratory experiments comprising nine treatments, including sole urea (U) applications and various combinations of BF and U. The results showed that ammonia (NH3) volatilization peaked within seven days after application. Compared with urea-only treatments, the application of BF at 15 t·ha−1 combined with a low U application rate (0.72 t·ha−1) significantly reduced NH3 and total dissolved nitrogen losses by up to 22.33% and 33.56%, respectively, while higher BF rates increased these losses. BF applications markedly improved soil N sequestration, as evidenced by increases in total nitrogen, ammonium nitrogen (NH4+-N), nitrate nitrogen (NO3-N), and the NH4+-N/NO3-N ratio. Additionally, soil organic carbon, urease activity, and pH were significantly enhanced. Random forest analysis identified soil pH and organic carbon as the primary predictors of NH3 volatilization and soil N retention. Partial least squares path modeling revealed that the BF-to-urea ratio governed N dynamics by directly influencing N transformation and indirectly modifying soil physicochemical properties. BF applied at ≤15 t·ha−1 with low U inputs exhibited potential for improving N use efficiency and sustainability, pending further field validation.

1. Introduction

Tea (Camellia sinensis) is one of the most widely cultivated crops in tropical and subtropical regions such as China, India, and Sri Lanka [1]. As a key economic crop, it has high nutrient demands, particularly for nitrogen (N), driving tea farmers to apply excessive chemical N fertilizers to maximize yields. In China, the average annual N fertilizer application rate is 533 kg·ha−1, with over 30% of tea plantations experiencing N over-fertilization [2,3]. Unlike annual crops, tea is cultivated as a long-term perennial monoculture, where the same soil is continuously fertilized for decades without crop rotation or fallow periods. This management pattern, coupled with acidic soils (pH 3.5–5.0) and high rainfall conditions typical of tea-growing regions, creates unique challenges for N cycling and retention [4].
The frequent application of N fertilizers, typically administered three to four times per year, combined with the inherently low buffering capacity of tea orchard soils, markedly accelerates nitrification processes and exacerbates nitrate nitrogen (NO3-N) leaching losses [5]. The pronounced soil acidity characteristic of tea-growing regions further intensifies the solubility and mobility of phytotoxic aluminum ions, while simultaneously suppressing microbial-mediated N transformations [6]. As a result, a substantial proportion of applied N is lost via leaching and gaseous emissions rather than being assimilated by tea plants, resulting in persistently low N use efficiency (often below 40%) [7]. Prolonged and excessive fertilizer inputs have also contributed to soil acidification [8,9], compaction [10], organic matter depletion, and diminished nutrient-use efficiency, thereby amplifying nutrient losses through leaching, surface runoff, and greenhouse gas emissions [11,12]. These chronic nutrient imbalances have progressively impaired soil health, disrupted microbial community diversity and functionality, and constrained the biosynthesis of key biochemical constituents essential for tea yield and quality [3]. Collectively, these issues underscore the pressing necessity to establish sustainable N management practices tailored to the long-term perennial nature of tea plantation systems within the broader framework of global environmental sustainability.
In this context, biochar and fulvic acid have attracted increasing attention as environmentally friendly soil amendments. Biochar is a carbon-rich material produced through the oxygen-limited thermochemical conversion of biomass, which features a highly porous structure [13] that contributes to long-term soil carbon sequestration and reductions in CO2 emissions [14]. Its unique physicochemical properties, such as enhancing soil cation exchange capacity, buffering soil pH, and improving overall soil structure, can increase soil fertility and crop productivity [15,16,17]. Importantly, biochar also influences the soil N cycle by reducing ammonium nitrogen (NH4+-N) and nitrate nitrogen (NO3-N) leaching through cation exchange and adsorption [18,19]; mitigates NH3 and N2O emissions via microbial regulation [20,21,22]; and improves N fertilizer use efficiency and crop productivity [18,21]. However, its alkalinity may paradoxically promote NH3 volatilization under certain conditions [23].
Fulvic acid, a short-chain molecule derived from natural humic substances, has high loading capacities and physiological activities [24]. Its application can improve the soil environment, promote plant growth, enhance nutrient uptake efficiency, and increase plant stress resistance, making it a widely used soil amendment [25,26]. Jin et al. [24] found that fulvic acid application elevated soil pH, NH4+-N and NO3-N contents, and the microbial decomposition ability of soil organic matter. Jiao et al. [27] showed that applying 4.65 g·kg−1 fulvic acid significantly increased tobacco soil organic matter, alkaline nitrogen, pH, and urease activity by 22.04% to 93.16%.
Biochar-based fertilizers (BFs) are organic amendments created by combining biomass-derived biochar with additives such as chemical fertilizers, humic acid, clay, or seaweed. This formulation prolongs nutrient release, improves nutrient-use efficiency, and better meets the long-term nutrient needs of crops [28,29,30]. For instance, Puga et al. [29] demonstrated that a BF formulated with a biochar-to-urea ratio of 2:10 significantly delayed N release and reduced NH3 volatilization by 14% compared to urea (U) alone. In contrast, Zhou et al. [23] found that while BF increased soil NH3 emissions relative to conventional fertilizers, they also enhanced N use efficiency and reduced leaching losses. In tea plantations, Yang et al. [31] reported that BF applications improved soil total N, organic matter content, and pH in acidified soils; enhanced microbial diversity; and altered microbial community structure, ultimately improving tea yield and quality. Notwithstanding these advances, the interactive effects of BF and chemical N fertilizer on soil N dynamics, N losses via NH3 volatilization and leaching, and underlying regulatory mechanisms remain poorly understood in tea orchard ecosystems.
Despite these advances, the mechanisms underlying the interaction between BF and chemical N fertilizers in regulating soil N dynamics in tea orchard soils remain insufficiently understood. Although several studies have explored the effects of biochar or organic amendments on N transformation, most have focused on their independent impacts or on annual crop systems, providing limited insight into the distinctive soil environment of perennial tea plantations [32,33]. The strong acidity, low organic matter content, and continuous fertilization typical of tea soils may alter microbial activity and N conversion pathways, making it necessary to re-evaluate how BF influences N migration and transformation under such conditions.
To address these issues, we formulated a BF by combining biochar with fulvic acid and conducted laboratory incubation experiments. We investigated the effects of varying application rates of this BF in combination with U on N migration and transformation in tea orchard soil, quantified N losses via volatilization and leaching, and identified key factors governing soil N retention. Accordingly, we hypothesize that co-application of BF and U will result in the following: (1) reduce N volatilization; (2) decrease N leaching; and (3) strengthen soil N sinks, thereby collectively minimizing N losses. These findings provide a data basis for the scientific application of BF in sustainable tea plantation management.

2. Materials and Methods

2.1. Soil Collection and Preparation of Biochar-Based Fertilizer

The test soils were collected from a 30-year-old tea orchard in the Shizipu tea plantation of the Anhui Provincial Farming Group, Xuancheng City, Anhui province, China (119.13° E, 30.96° N). Fifteen composite samples were excavated using a spade from the 0–30 cm plough layer. A part of the fresh soil sample was used for basic physicochemical analysis, while the remainder was air-dried, ground to pass through a 2 mm sieve, and stored in a cool, dry place before experimentation. The soil was classified as an acidic clay loam with the following properties: total nitrogen (TN): 1.10 g·kg−1; soil organic carbon (SOC): 12.08 g·kg−1; pH (H2O): 4.25; NH4+-N: 81.03 mg·kg−1; NO3-N: 24.36 mg·kg−1; electrical conductivity (EC): 97.61 µS·cm−1; bulk density: 1.15 g·cm−3; sand: 25.38%; silt: 40.10%; and clay: 34.52%.
The BF was prepared by carbonizing leguminous straw at 400 °C for 1 h under anaerobic conditions. After carbonization, the biochar was crushed, passed through a 2 mm sieve, and then mixed thoroughly with fulvic acid at a mass ratio of 5:1. The resulting BF has the following characteristics: nitrogen content: 5.3%; carbon content: 55%; C/N ratio: 10.38; and pH: (H2O, 1:2.5 w/v) 7.3.

2.2. Experimental Design

The experiment comprised nine treatments with three replicates each: a control group (CK), high-urea (U) application (Uhigh, 0.52 g·kg−1 ≈ 1.50 t·ha−1, dry soil basis), low-U application (Ulow, 0.25 g·kg−1 ≈ 0.72 t·ha−1, dry soil basis), and three rates of BF application (BF0.5, 5 g·kg−1 ≈ 15 t·ha−1; BF1, 10 g·kg−1 ≈ 30 t·ha−1; BF3, 30 g·kg−1 ≈ 90 t·ha−1; dry soil basis), each applied in combination with both Uhigh and Ulow. The corresponding application rates were calculated based on the soil layer thickness and a bulk density of 1.15 g·cm−3. The specific treatments and application rates are detailed in Table 1. The experimental setup for simulating N migration in tea orchard soil is shown in Figure 1. First, a pot (25 cm in height and 15 cm in inner diameter) was layered with a 2 cm thick layer of quartz sand (particle size 2 mm) at the bottom. Then, it was layered with 5.70 kg of 2 mm sieved soil alone or mixed evenly with BF at different proportions, adjusted to 30% water holding capacity with distilled water, lightly compacted, and incubated indoors at room temperature for one week. Subsequently, 50 g of soil was mixed evenly with different amounts of U and spread on the surface of each treatment soil, followed by coverage with a 0.5 cm thick layer of quartz sand (particle size 2 mm). A 25 cm diameter funnel was placed at the bottom of the pot to collect leachate in a 1 L glass beaker. The entire pot setup was then enclosed within a PVP sealing cover measuring 35 cm (length) × 22 cm (width) × 35 cm (height), and a 200 mL glass bottle containing 0.1 mol·L−1 HCl (pH ≈ 1) was placed adjacent to the pot to capture ammonia (NH3), resulting in the formation of NH4Cl [34]. The HCl solution was replaced on days 2, 4, 7, 10, 14, 18, 23, and 28 for NH3 analysis. Meanwhile, the surface soil pH (0–10 cm) was measured using a portable pH meter (Model ST300, Ohaus Corp., Pine Brook, NJ, USA). The simulation mimicked the monthly average rainfall of 140 mm within 3 months after the application of the topdressing fertilizer in the tea regions of southern China, with a rainfall rate of 18 mm·h−1. Leaching was carried out using 600 mL of distilled water for 2 h every 2 weeks. The beaker was replaced, and the leachate was collected and tested on days 7, 21, 35, 49, 63, 77, and 91. After three months, destructive sampling was conducted. A portion of fresh soil was immediately used to determine NH4+-N, NO3-N, and urease activity (UE). The remaining soil was air-dried; sieved through a 2 mm mesh; and analyzed for TN, EC, pH, and SOC.

2.3. Analytical Methods

The NH3 gas captured using the HCl solution, resulting in the formation of NH4Cl, was analyzed for NH4+-N concentration using a continuous flow analyzer (San++System, Skalar Analytical B.V., Breda, The Netherlands). The NH3 volatilization rate (F, kg·ha−1·d−1) was calculated according to Equation (1):
F = M A × D × 10 2
where M is the mass of NH3 (mg), A is the cross-sectional area (m2), and D is the collection duration (d).
The cumulative NH3 volatilization loss (ENH3,tot) (kg·ha−1) was calculated as the sum of all intervals:
E N H 3 , t o t = i = 1 n E N H 3 , i
where ENH3,i is the amount of NH3 volatilized per unit area during the i-th interval (kg·ha−1), and n is the total number of sampling intervals.
The volume of each leachate was recorded. The EC was measured using a conductivity meter (DDS-307A, Leici, Shanghai, China), and pH was determined using a pH meter (PHS-3C, Leici, Shanghai, China). The concentrations of NH4+-N and NO3-N in each leachate sample were analyzed using a continuous flow analyzer (San++System, Skalar Analytical B.V., Breda, The Netherlands). Total dissolved nitrogen (TDN) and dissolved organic carbon (DOC) concentrations were measured using a TOC analyzer (TOC-L CPH/CPN, Shimadzu, Kyoto, Japan). Dissolved organic nitrogen (DON) was calculated by subtracting the concentrations of inorganic nitrogen (NH4+-N and NO3-N) from the TDN.
The total leachate volume (TV) (mL) was calculated according to Equation (3):
T V = i = 1 n V i
where Vi is the volume of the i-th leachate (mL), and n is the total number of leaching events.
The leaching TDN, NH4+-N, NO3-N, DON, and DOC (mg·kg−1, w/w, dry soil basis) were calculated according to Equation (4):
L k = i = 1 n ( C k , i × V i ) m
where Lk is the cumulative leaching amount of solute k (mg), Ck,i is the concentration of solute k in the i-th leachate sample (mg·L−1), Vi is the volume of the i-th leachate (L), and n is the total number of leaching events. m is the mass of dry soil (kg). The solutes considered in this study include TDN, NH4+-N, NO3-N, and DOC.
The TN content of the soil was determined using an elemental analyzer (Vario EL Cube, Elementar, Langenselbold, Germany). The soil NH4+-N and NO3-N ions were extracted using a 2 mol·L−1 KCl solution at a soil-to-extractant ratio of 1:5 (w/v), and their concentrations were determined using a continuous flow analyzer (San++System, Skalar Analytical B.V., Breda, The Netherlands). Soil organic nitrogen (SON) was calculated by subtracting the concentrations of soil inorganic nitrogen (NH4+-N and NO3-N) from the TN. SOC was measured using the potassium dichromate oxidation method [35]. Soil urease activity (UE) was measured using the indophenol blue colorimetric method [36]. Soil pH was measured using a pH meter (PHS-3C, Leici, Shanghai, China), with a soil-to-water ratio of 1:2.5. Soil EC was measured using a conductivity meter (DDS-307A, Leici, Shanghai, China), with a soil-to-water ratio of 1:5.

2.4. Statistical Analysis

Data were analyzed using SPSS Statistics 27.0.1. One-way analysis of variance (ANOVA) was performed to assess the effect of pH on NH3 and the effect of total nitrogen input on soil TN, NH4+-N, NO3-N, and NH4+-N/NO3-N. Two-way analysis of variance (ANOVA) was performed to determine the effects of treatments on NH3, leachate characteristics, and soil parameters. Duncan’s Multiple Range Test (α = 0.05) was applied to assess significant differences among treatment means. At each leaching time, significant differences in TDN, NH4+-N, NO3-N, and DON concentrations among treatments were analyzed using one-way ANOVA, followed by a post hoc LSD test, performed with the “stats” package in R (version 4.5.0). Random forest analysis was conducted using the “randomForest” package in R (v4.5.0) to identify the key influencing factors of soil TN, ENH3,tot, and TDN. Additionally, partial least squares path modeling (PLS-PM) was conducted using the “plspm” package in R (v4.5.0) to investigate the direct and indirect effects of BF and U dosage, soil physicochemical properties (soil NH4+-N, soil NO3-N, NH4+-N/NO3-N, SOC, pH, UE, EC, and C/N), and leachate characteristics (leachate NH4+-N, leachate NO3-N, DOC, and TV) on TN, TDN, and NH3.

3. Results

3.1. Dynamic Changes and Cumulative Amount of Ammonia Volatilization in Tea Orchard Soils

3.1.1. Dynamic Changes and Cumulative Losses of Ammonia Volatilization

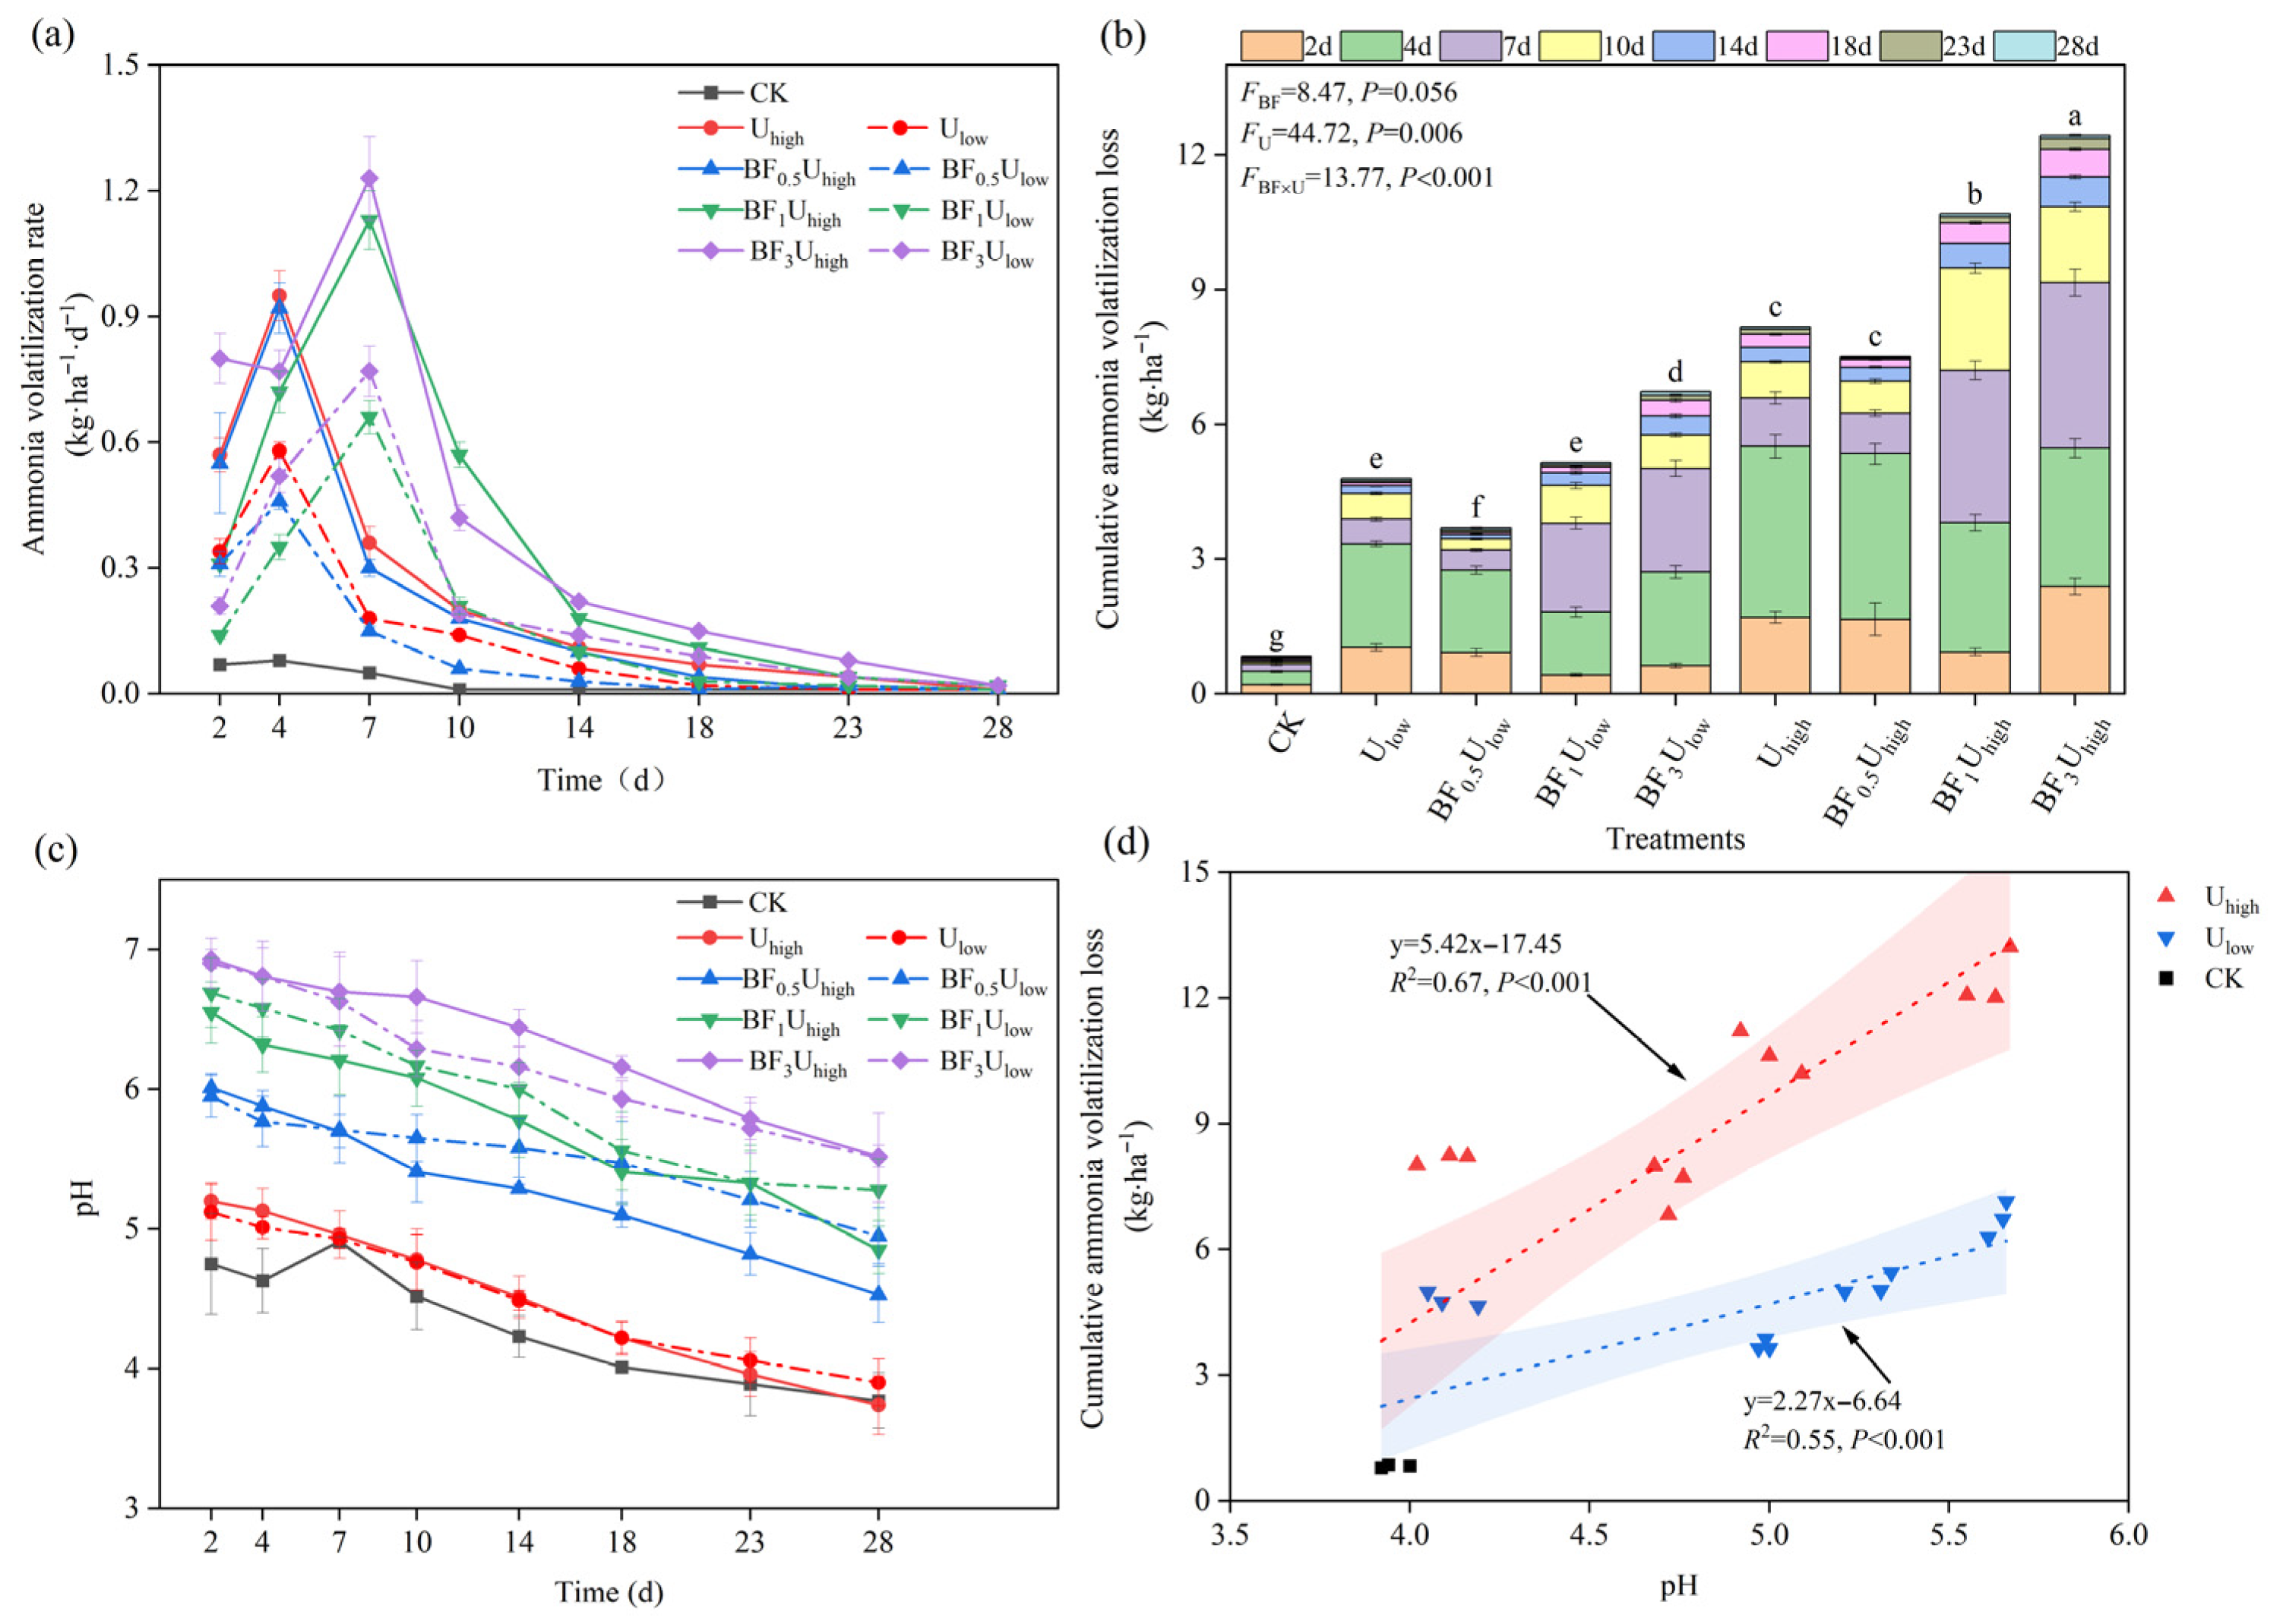
The dynamic changes in NH3 volatilization within 28 days after U application into the soil showed that the NH3 volatilization rate under the CK treatment was relatively low, without any distinct peak, and a maximum rate of 0.08 kg·ha−1·d−1 (Figure 2a) was observed. In comparison with the CK treatment, all fertilization treatments significantly enhanced NH3 volatilization, and the volatilization rate showed an increasing and then decreasing trend after fertilizer application. The NH3 volatilization rates under the Uhigh treatment group were consistently higher than those under the Ulow treatment group. NH3 volatilization peaked on the 4th day for the Ulow, Uhigh, BF0.5Ulow, and BF0.5Uhigh treatments, while it peaked on the 7th day for the BF1Ulow, BF1Uhigh, BF3Ulow, and BF3Uhigh treatments. The Ulow and BF0.5Ulow treatments had the shortest NH3 volatilization time, which was 18 days. There was no significant change thereafter. However, the BF1Uhigh and BF3Uhigh treatments experienced NH3 volatilization that lasted 28 days, and then, there was no significant change.
Compared with the CK treatment, all fertilization treatments significantly increased ENH3,tot losses (Figure 2b). Under both N levels, ENH3,tot was lower in the low-nitrogen treatments than in the high-nitrogen treatments. Notably, in both the Uhigh and Ulow treatment groups, the combination of U with a low dosage of BF (BF0.5) resulted in the lowest ENH3,tot. Specifically, the ENH3,tot values of BF0.5Ulow and BF0.5Uhigh were 3.72 and 7.51 kg·ha−1, respectively, representing reductions of 22.33% and 7.96% compared to Ulow and Uhigh, respectively. In contrast, the BF3 treatments significantly increased the ENH3,tot, with losses reaching 6.73 and 12.44 kg·ha−1, showing increases of 40.29% and 52.33% compared to Ulow and Uhigh, respectively. The combined application of N and BF significantly affected ENH3,tot in the soil (p < 0.001).

3.1.2. Soil pH Dynamics and Its Relationship with Cumulative Ammonia Volatilization

During the NH3 collection period, the soil pH for each treatment gradually decreased from 4.75–6.93 to 3.77–5.52 (Figure 2c). The treatment groups with N fertilizer alone did not show significant differences compared to the CK treatment. In contrast, the treatments with the combined application of BF generally had higher soil pH values than both the CK and the nitrogen-only treatments. Moreover, the soil pH increased as the amount of BF increased. Compared with the CK treatment, BF treatments increased the soil’s pH by 0.76–1.75 units.
Linear regression analysis indicated that the NH3 volatilization rate in soil was significantly positively correlated with soil pH under both high and low N levels (R2 = 0.67 and R2 = 0.55, respectively; p < 0.001) (Figure 2d). Furthermore, the slope of the regression line was steeper in the Uhigh treatment group than in the Ulow group, indicating that NH3 volatilization losses were more sensitive to pH changes under high-nitrogen conditions.

3.2. Dynamic Characteristics and Accumulation of Nitrogen Leaching in Tea Orchard Soils

3.2.1. pH and Electrical Conductivity of Leachate

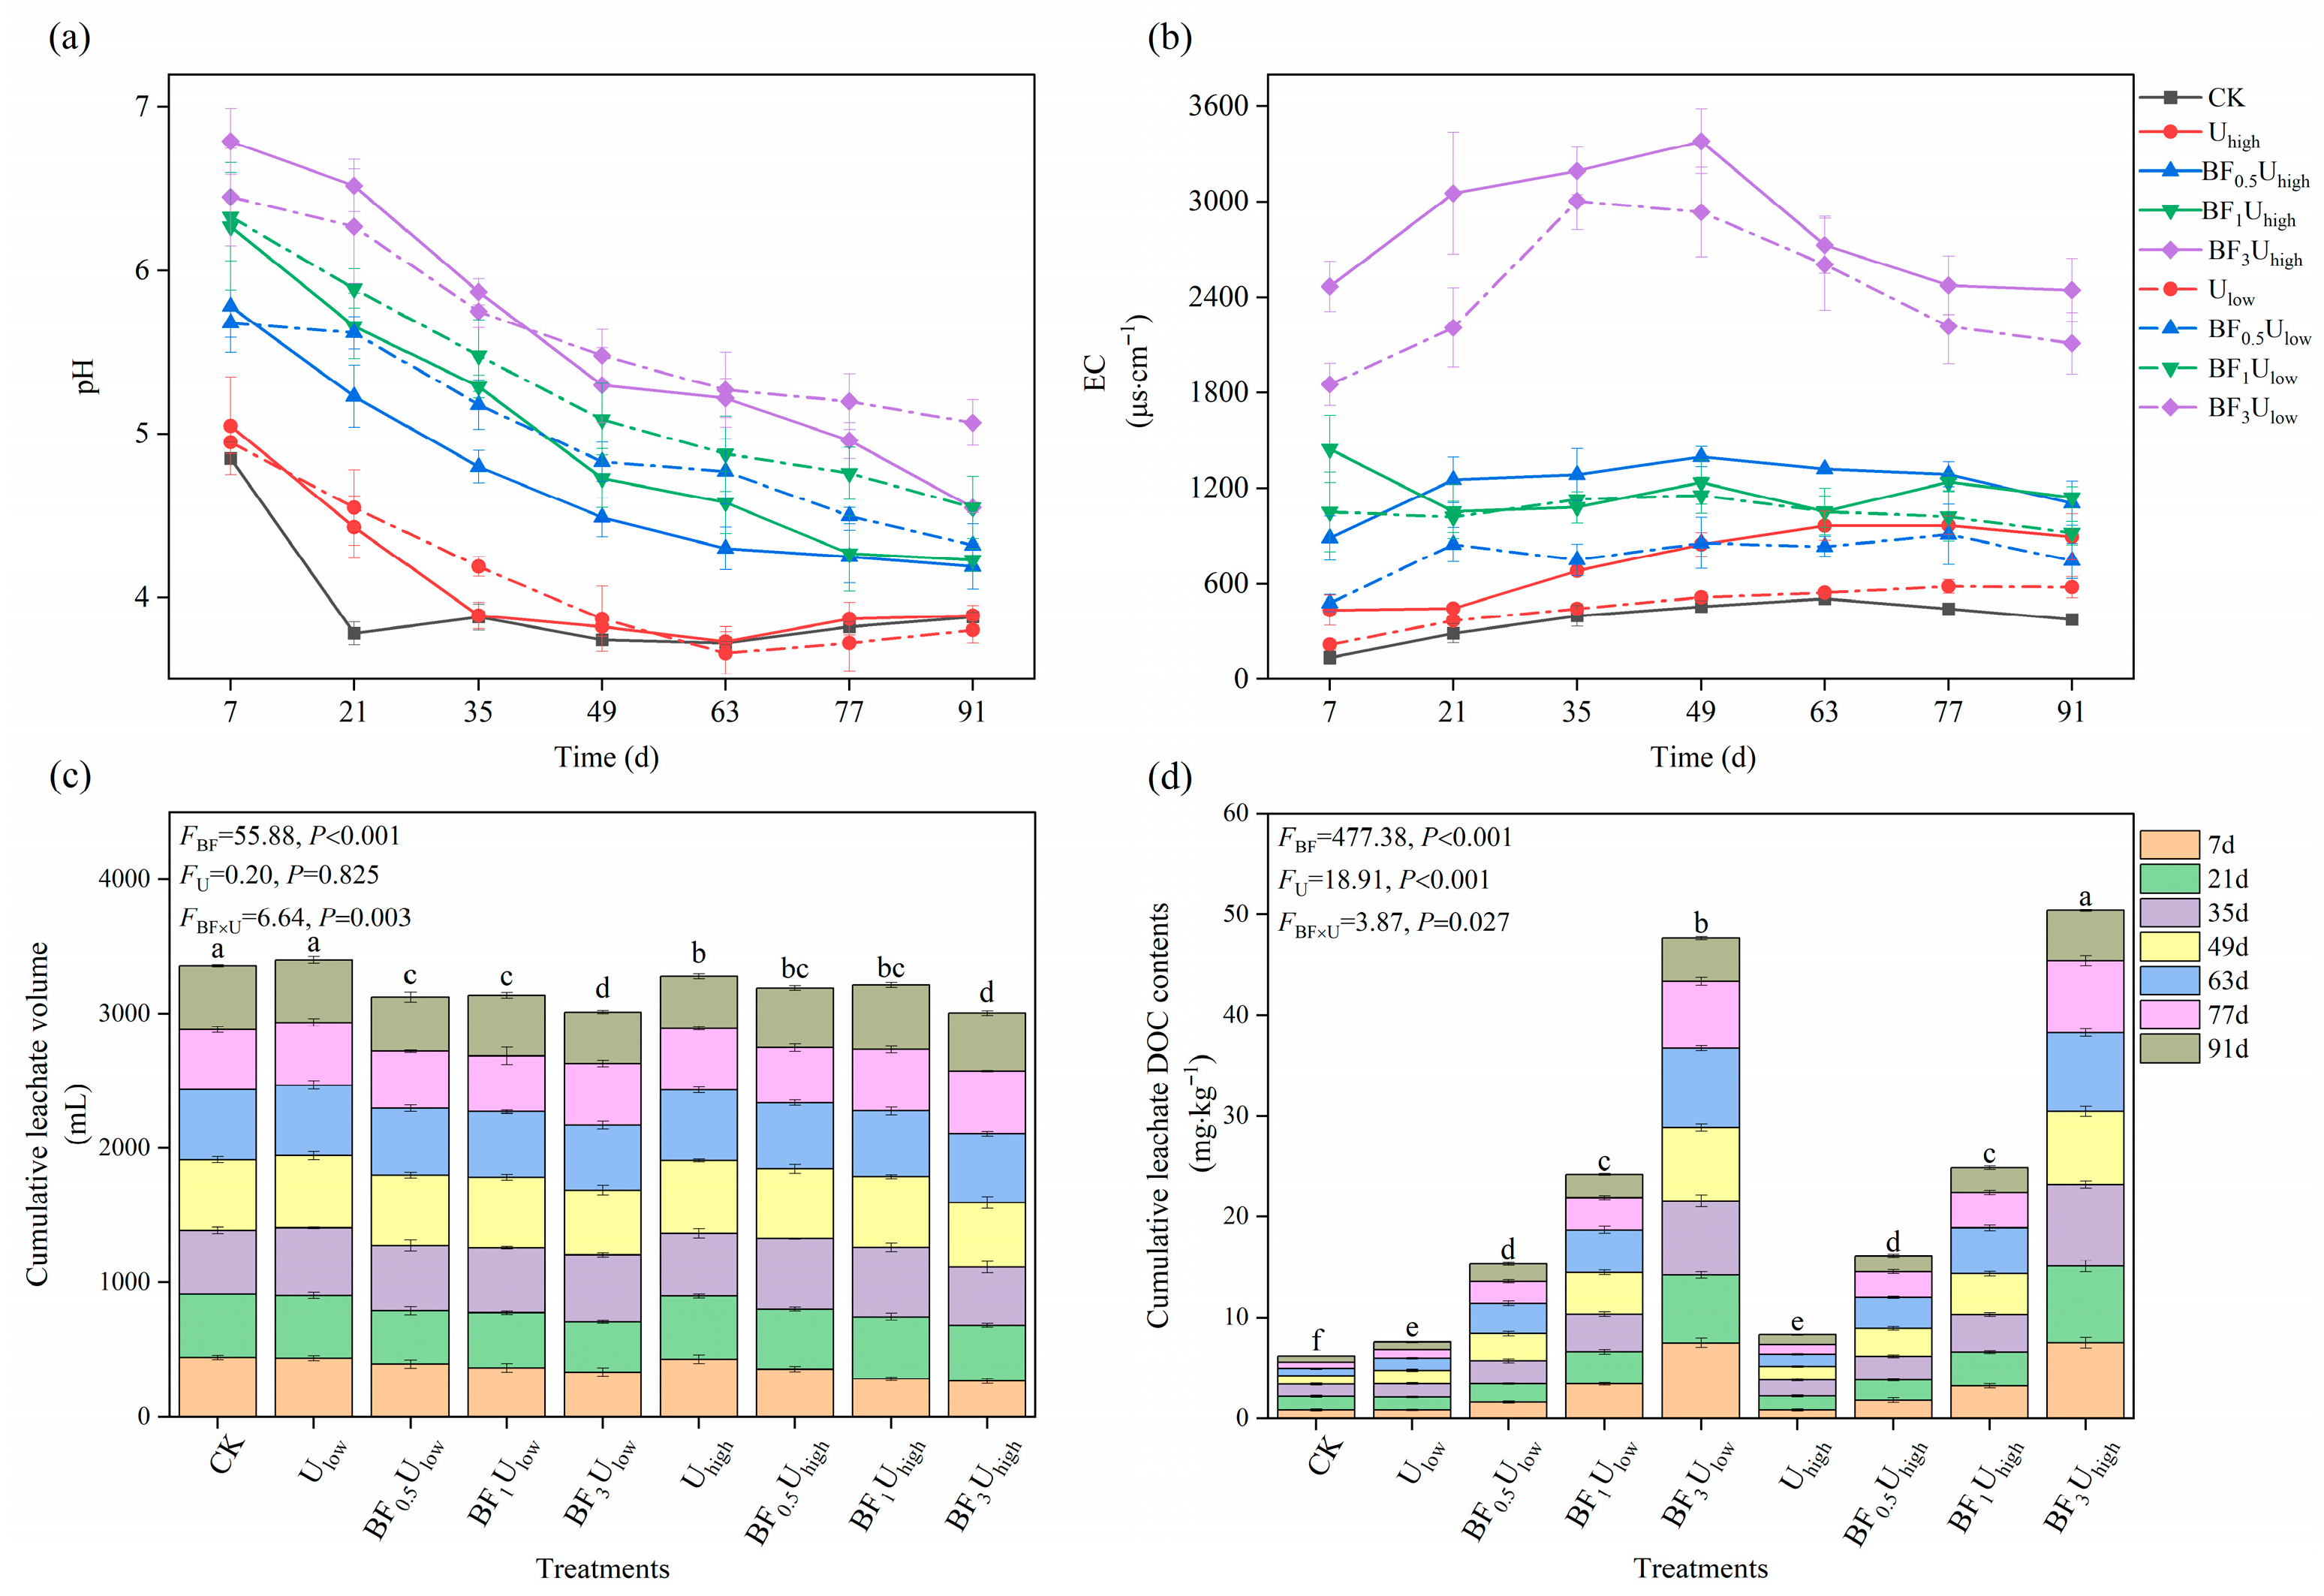
The pH values of the leachate under all treatments exhibited a gradual decrease throughout the leaching periods (Figure 3a). Specifically, the pH in the CK treatment stabilized after the 21st day, while the pH in the Ulow and Uhigh treatments gradually stabilized after the 49th day. The pH of the leachate in the BF treatments was significantly higher than that in the CK treatment and the urea-only treatments. Additionally, as the amount of BF applied increased, the pH correspondingly increased. Compared to CK, the pH of the leachate in the BF treatments increased by 0.31–1.6 units. Similarly, both U and BF treatments resulted in an increase in the EC of the leachate compared to CK, with increments ranging from 1.59 to 8.02 times (Figure 3b). Furthermore, the EC increased as the fertilizer application rate increased, with the BF treatments having a higher overall EC than the urea-only treatments.

3.2.2. Leachate Volume and DOC Content

All treatments, except for the Ulow treatment, reduced the leachate volume compared to the CK treatment (3357.88 mL), with reductions ranging from 80.91 to 353.61 mL (Figure 3c). Among these, the BF3 treatment showed the most remarkable reduction (p < 0.001). Compared to CK, BF3Ulow and BF3Uhigh reduced the leachate volume by 10.42% and 10.71%, respectively.
Both BF and U treatments significantly impacted the cumulative content of DOC in the leachate (p < 0.001). The cumulative DOC content increased significantly as the application of BF increased (Figure 3d). Compared to the CK treatment, the cumulative DOC content under the BF treatments increased by 2.48–8.16 times.

3.2.3. Nitrogen Leaching Characteristics

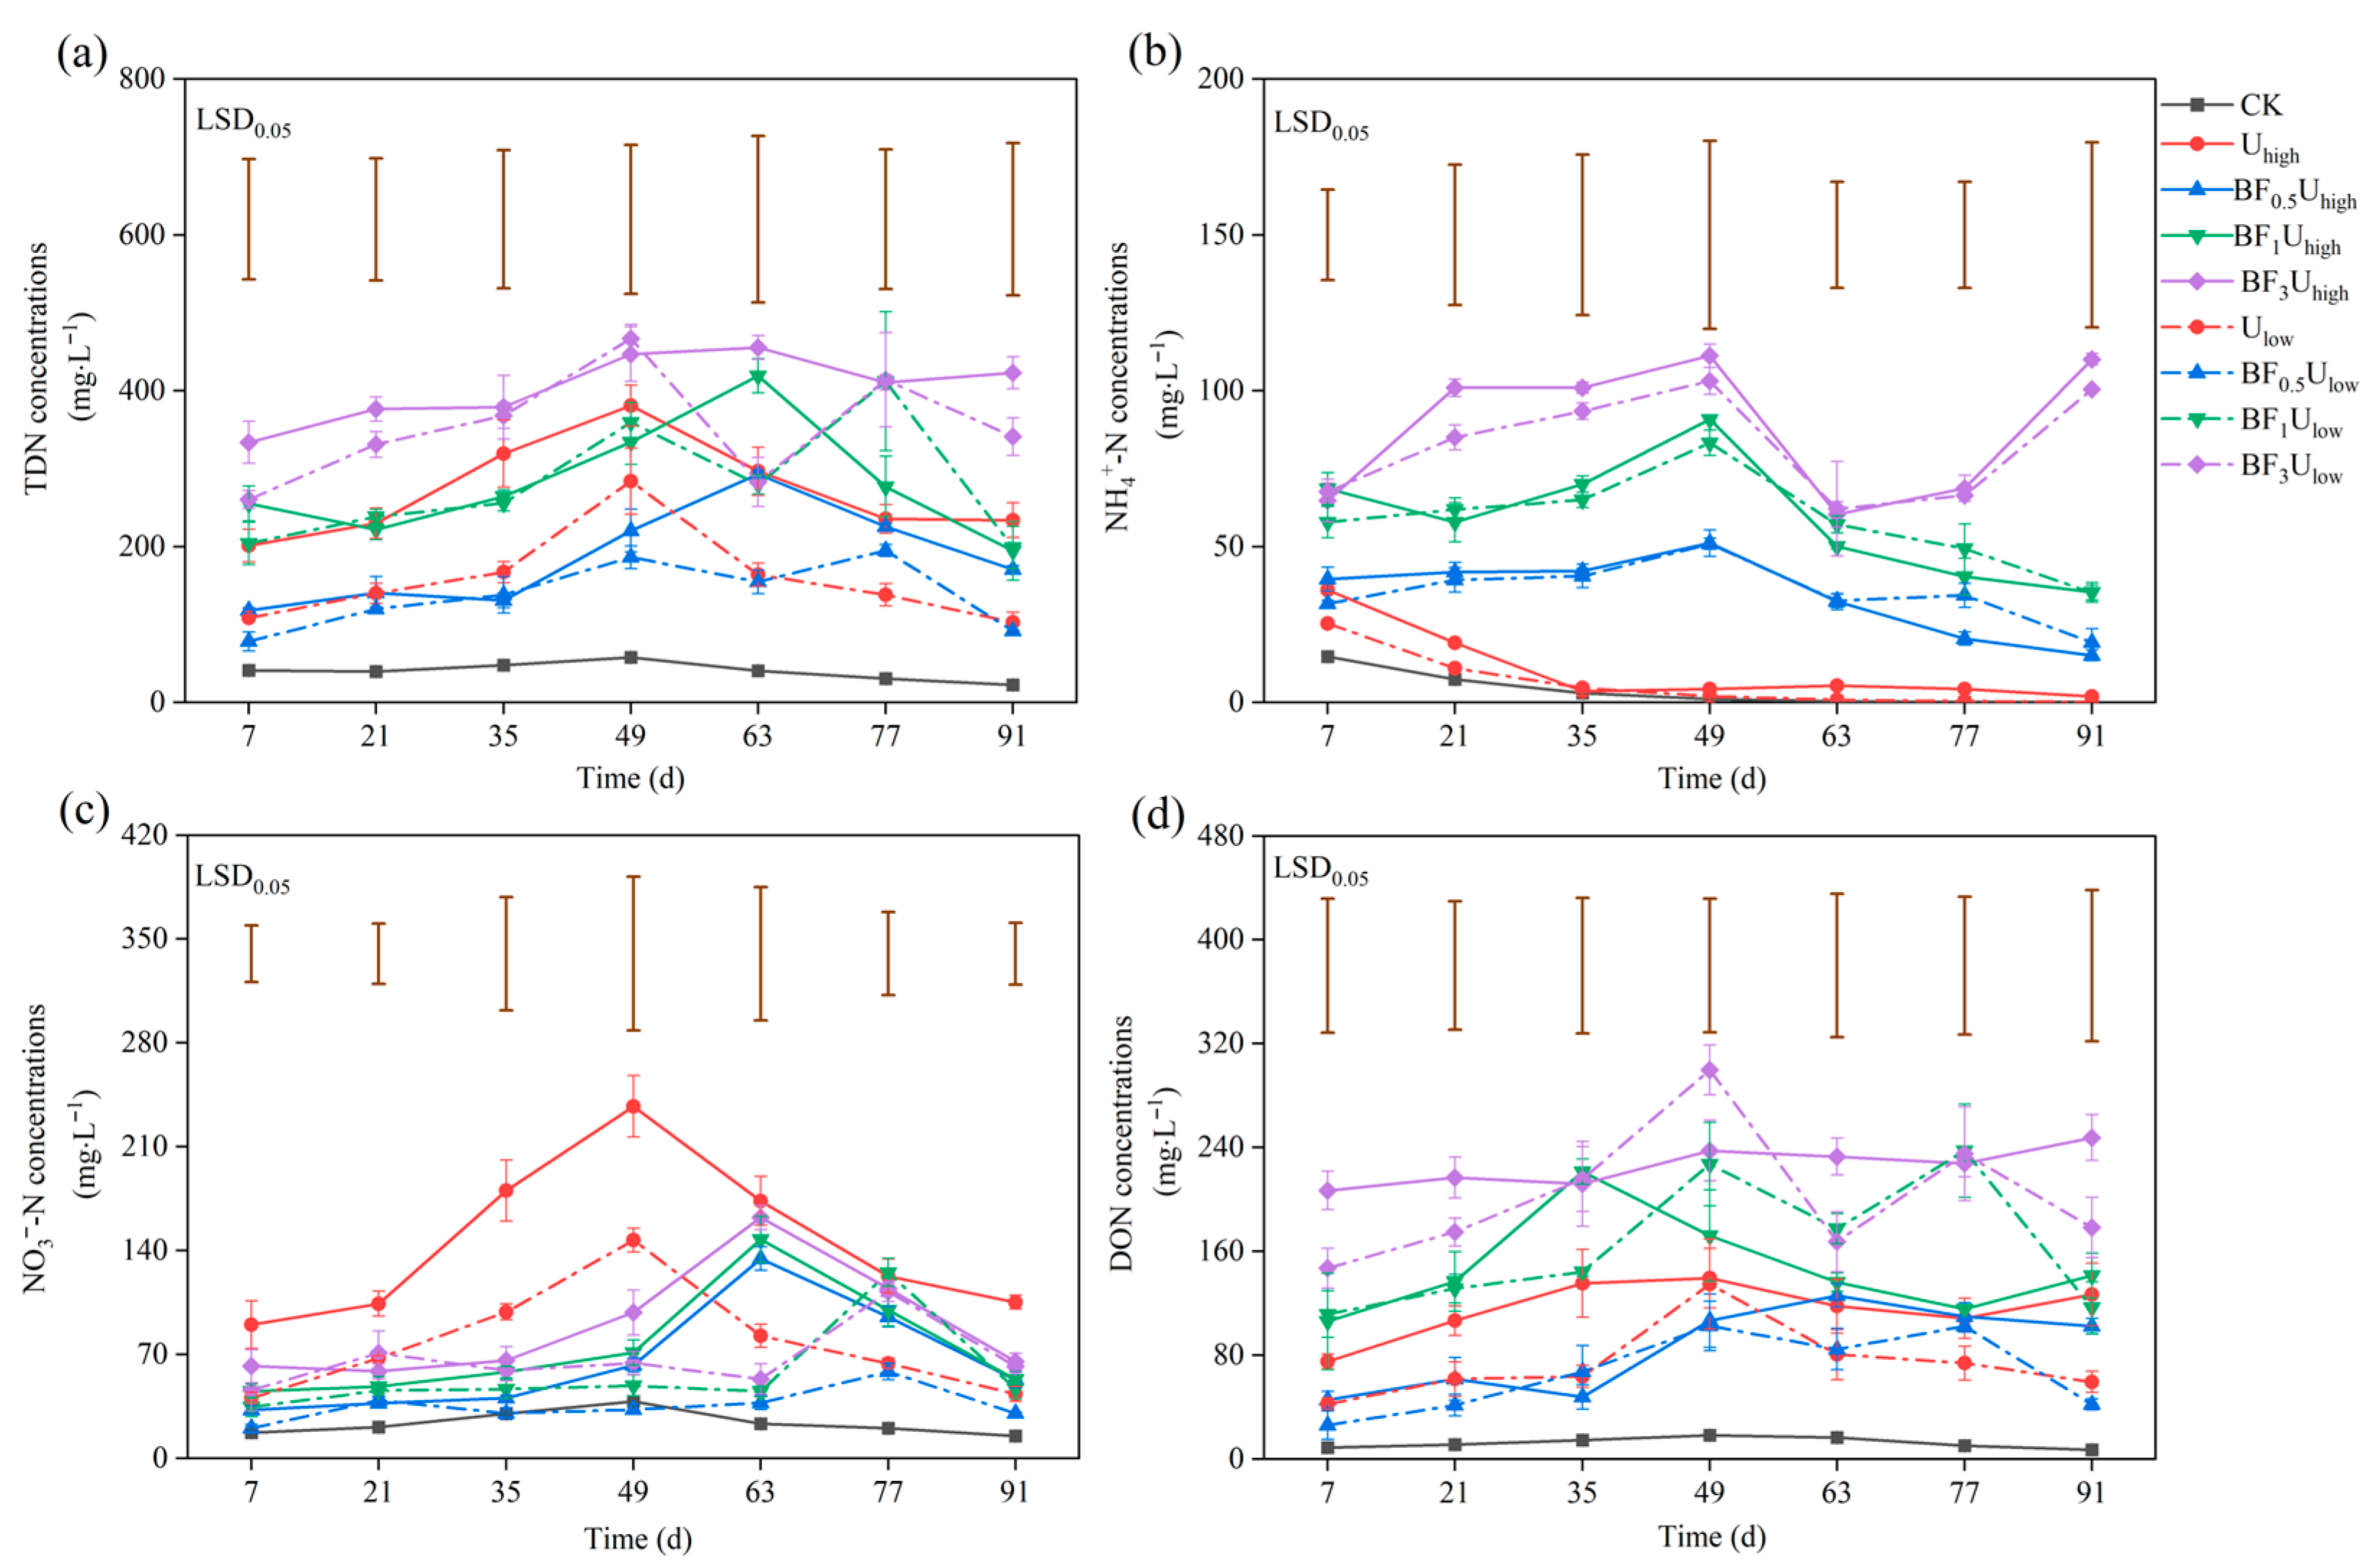
The dynamic changes in the concentration of N in the leachate for different treatments are shown in Figure 4a–d. During the leaching period, significant differences were observed in TDN concentrations among the different treatments (22.37–467.08 mg·L−1) (Figure 4a). TDN concentrations initially increased, peaked between 49 and 77 days after fertilization, and then decreased. The increase in TDN concentrations in the Uhigh treatment group was generally higher than that in the Ulow treatment group. The leaching peak of NH4+-N for CK, Uhigh, and Ulow treatments all occurred on the 7th day after fertilization, with values of 14.75, 36.04, and 25.27 mg·L−1, respectively (Figure 4b). For the BF treatments, the peaks were reached on the 49th day (50.91–111.19 mg·L−1). Subsequently, the NH4+-N concentration gradually decreased in all treatments, but the BF3 treatment showed a subsequent increase in NH4+-N on the 77th and 91st day. Throughout the leaching period, the Uhigh treatment group showed a higher increase in NH4+-N than the Ulow treatment group. The NO3-N concentrations in all treatments also followed an initially increasing and then decreasing pattern (Figure 4c). The Uhigh treatment almost showed higher NO3-N concentrations in the leachate than the Ulow treatment. Among these treatments, the difference between the maximum and minimum values for CK treatment was the smallest (11.10 mg·L−1), while that for the Uhigh treatment was the largest (147.15 mg·L−1). Both the Uhigh and Ulow treatments reached their peaks of NO3-N concentrations on day 49, whereas the peaks occurred on day 63 and day 77, respectively, when combined with the BF application. The leaching of DON also differed among treatments (Figure 4d). The CK treatment showed minimal fluctuation, while most of the Uhigh treatments, except for BF1Uhigh, showed no significant peaks. However, the Ulow combined with BF treatments exhibited double peaks on day 49 and day 77.

3.2.4. Cumulative Nitrogen Leaching Losses

As shown in Table 2, both BF and U had significant effects on the cumulative leaching loss of TDN, with a significant interaction between BF and U (p < 0.01). The cumulative leaching loss of TDN in all fertilized treatments was 3.25–9.10 times that of the CK treatment. Among the BF treatments, BF0.5 exhibited the lowest TDN leaching loss, which decreased by 19.79% and 33.56% compared to the Ulow and Uhigh treatments, respectively. The BF1 and BF3 treatments increased TDN leaching losses by 0.89–96.68% compared to the urea-only treatments. The cumulative leaching loss of NH4+-N was significantly affected by BF (p < 0.01). Compared to CK, the application of BF significantly increased the cumulative NH4+-N leaching loss, with the increase being greater as the amount of BF applied increased. Compared to the urea-only treatments, the NH4+-N cumulative leaching loss increased by 3.3–12.31 times. U had a significant effect on NO3-N leaching, and there was also a significant interaction between U and BF (p < 0.01). Compared to CK, all fertilized treatments promoted an increase in NO3-N in the leachate. However, when compared to urea-only treatments, the addition of BF significantly reduced the NO3-N content, with reductions of 25.10–59.09% compared to urea-only treatments. Similarly to TDN, the DON content in the leachate increased in the order of CK < BF0.5 < U < BF1 < BF3. The BF0.5 treatment showed a reduction in DON by 15.87% and 27.47% compared to U, while the BF1 and BF3 treatments increased the DON content by 24.74–143.70% compared to U. The NH4+-N/NO3-N ratio in the leachate was the lowest in both Ulow and Uhigh treatments at 0.07, while the highest ratio was 1.23 for BF3Ulow. BF significantly affected the NH4+-N/NO3-N ratio, and there was a significant interaction between BF and U (p < 0.01).

3.3. Soil Nitrogen Forms and Chemical Properties in the Tea Orchard

3.3.1. Effects of Fertilization on Soil Nitrogen Forms

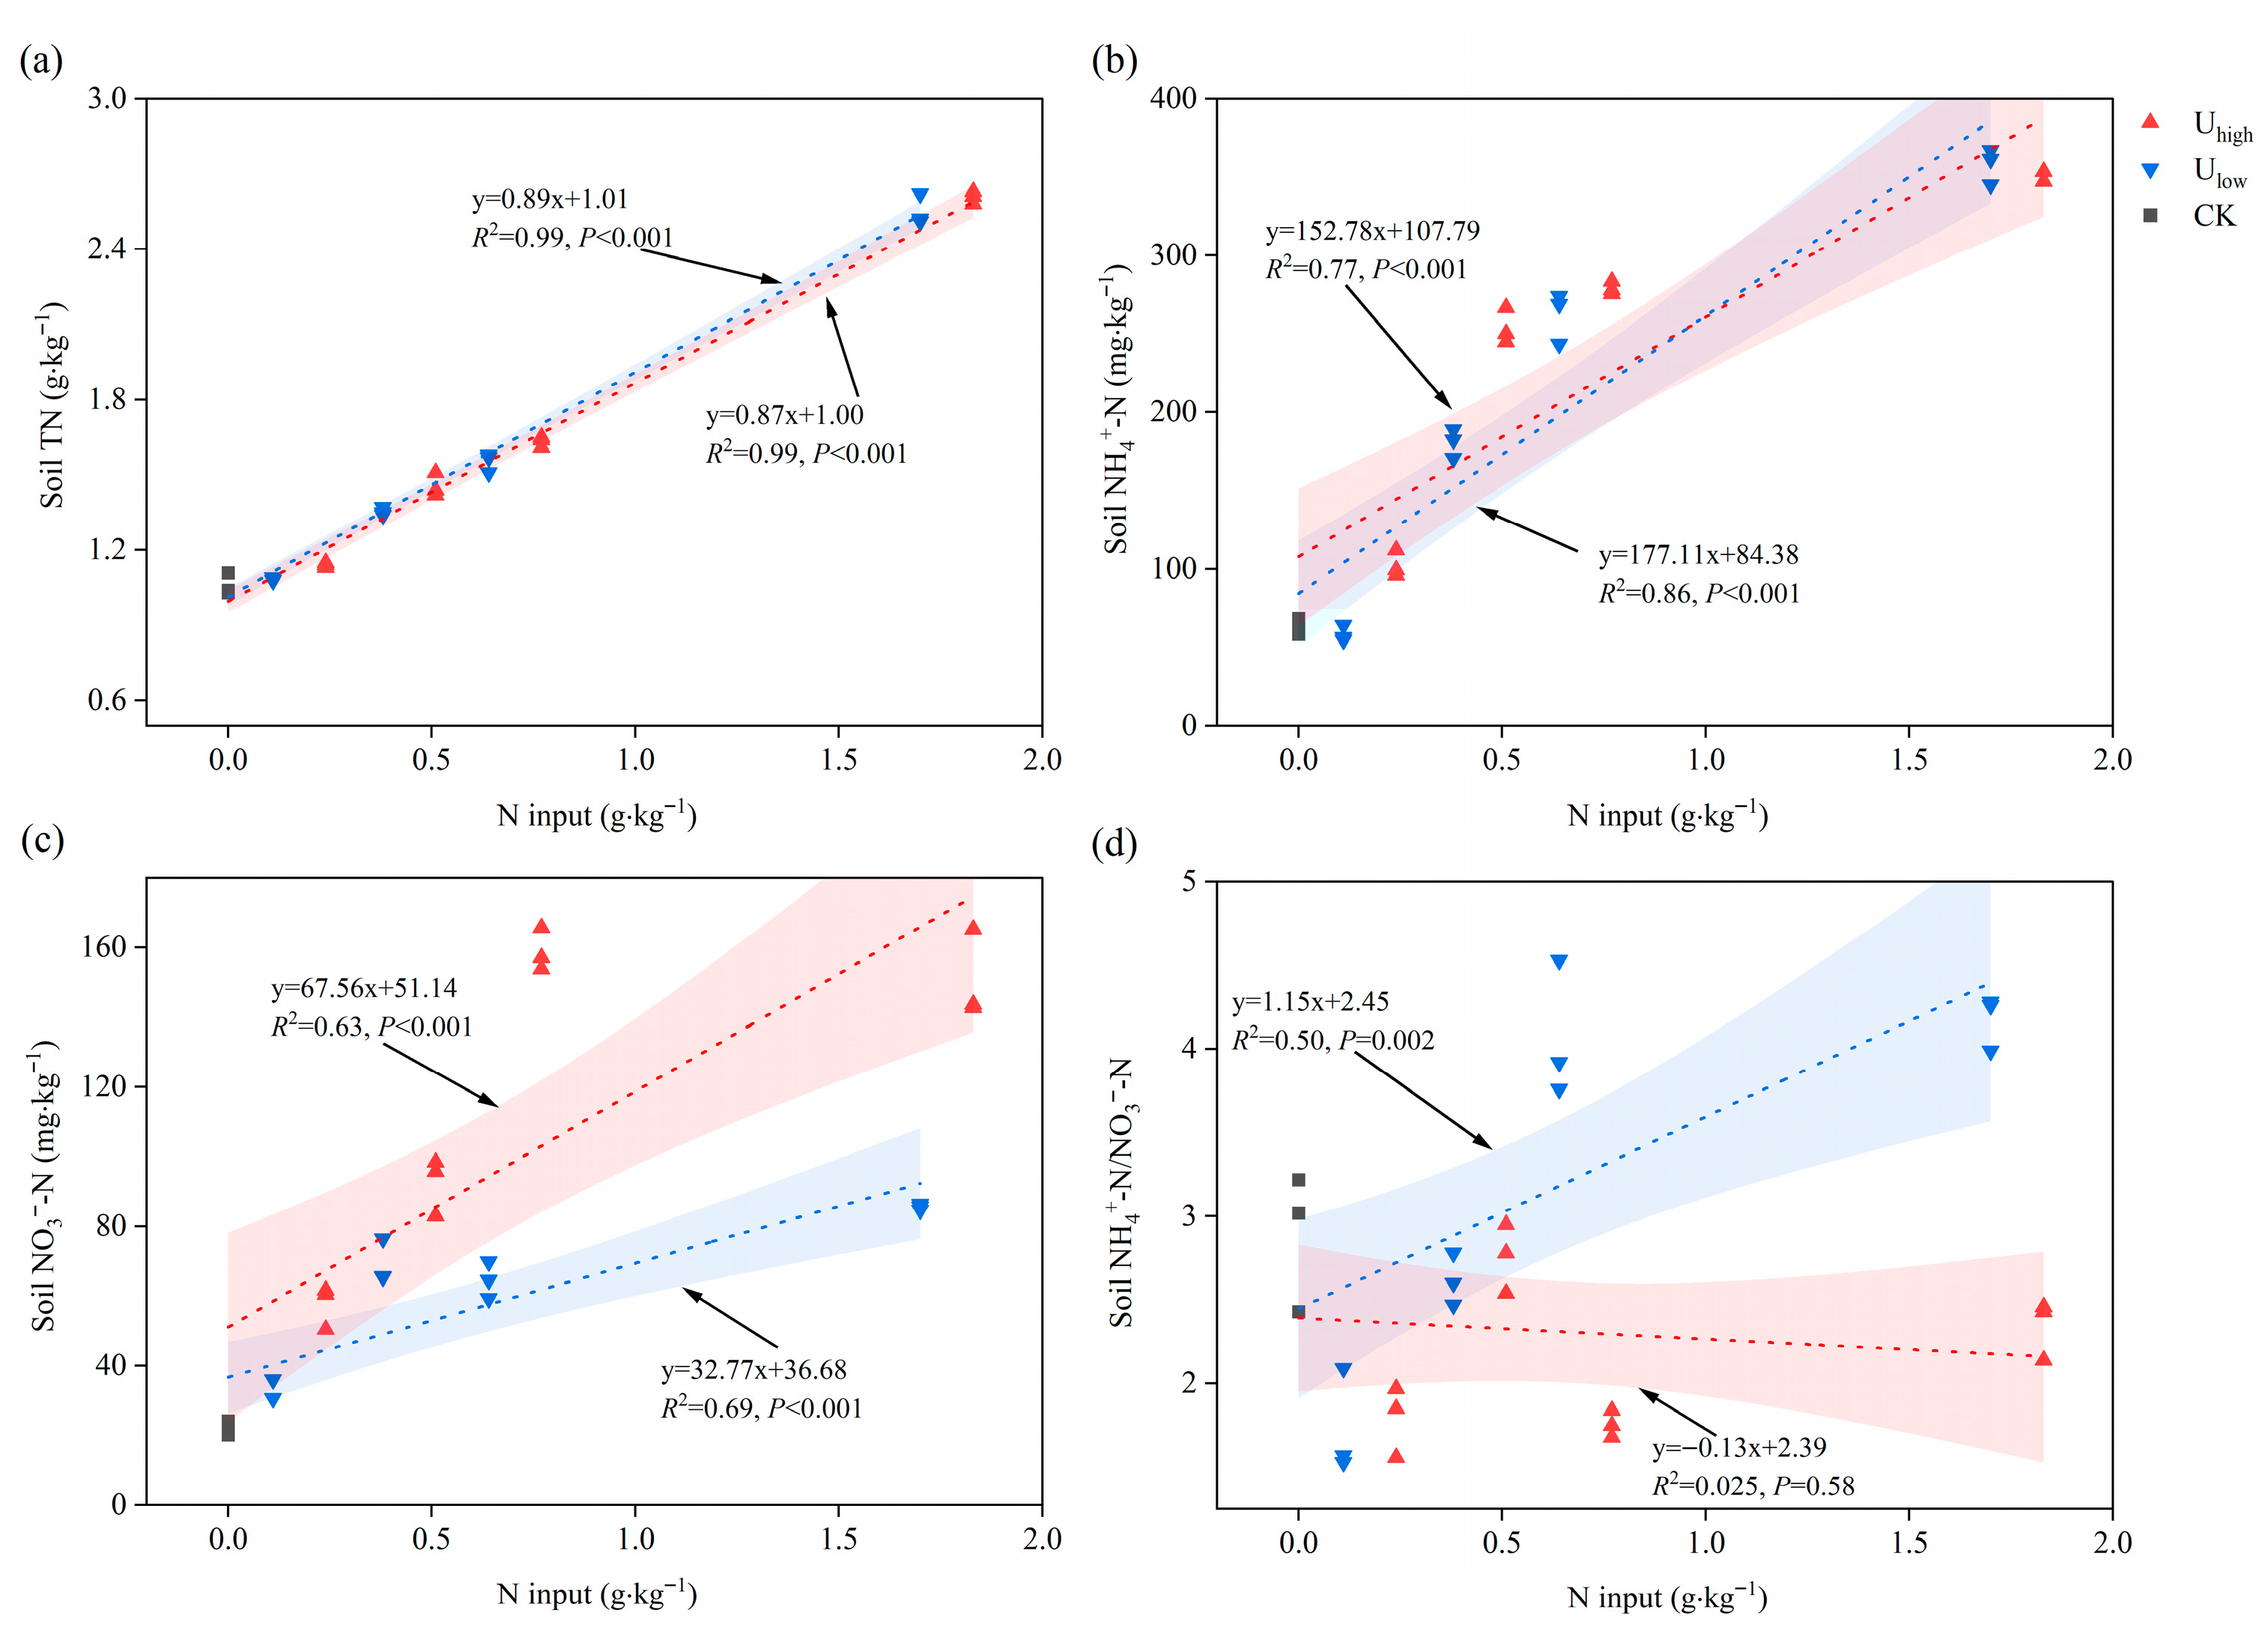
As shown in Table 3, compared to CK, all treatments, except for Ulow, significantly increased the soil total nitrogen (TN) content, with increases ranging from 1.89% to 146.23%. The treatments with BF increased soil TN content 1.25 to 2.36 times more than the urea-only treatments. Both BF and U significantly affected soil TN (p < 0.05). Figure 5a indicated that soil TN was positively correlated with N input in both Ulow and Uhigh treatments (p < 0.001). The trend in soil NH4+-N content followed that of TN, with increases ranging from 59.78% to 457.89%, except for Ulow. The BF treatment increased soil NH4+-N content 2.48 to 6.1 times more than the urea-only treatments. BF significantly affected soil NH4+-N (p < 0.01), and there was an interaction between BF and U (p < 0.01). Soil NH4+-N content was also positively correlated with N input in both Ulow and Uhigh treatments (p < 0.001) (Figure 5b). For soil NO3-N content, the BF treatments were 1.61 to 2.76 times higher than the urea-only treatments. For the same amount of BF, the Uhigh treatment was significantly higher than the Ulow treatment. As shown in Figure 5c, soil NO3-N content was positively correlated with N input (p < 0.001), with the slope for Uhigh being steeper than for Ulow. For the NH4+-N/NO3-N ratio, the lowest ammonium to nitrate ratios were observed in the Ulow and Uhigh treatments, with values of 1.73 and 1.79, respectively, which were 38.06% to 40.14% lower than in CK. In contrast, the BF3Ulow and BF1Ulow treatments showed significantly higher ratios than the other treatments, with increases of 44.64% to 40.83% compared to CK. Figure 5d showed that the NH4+-N/NO3-N ratio was significantly positively correlated with N input in the Ulow treatment group (R2 = 0.50, p = 0.002), but no significant correlation was found in the Uhigh treatment group (R2 = 0.03, p = 0.58).

3.3.2. Impact of Fertilization on Soil Chemical Properties

Compared to CK, the BF treatments significantly increased SOC content, with increases ranging from 11.19% to 76.69%, whereas no significant effects were observed in Ulow and Uhigh treatments (Table 3). BF had a significant effect on SOC (p < 0.01), but no interaction between BF and U was observed. Soil EC was mainly affected by BF (p < 0.01), with an increase in EC corresponding to the amount of BF applied. There was an interaction between BF and U (p < 0.05). Under Ulow conditions, EC increased by 0.60 to 7.74 times in BF treatments compared to CK, while under Uhigh conditions, EC increased by 1.00 to 9.58 times. Soil urease (UE) content was influenced by both BF (p < 0.01) and U (p < 0.05). The Ulow and Uhigh treatments increased UE by 1.61 and 1.70 times, respectively, compared to CK, while treatments with BF increased UE by 2.46 to 3.79 times compared to CK. All fertilization treatments significantly reduced the soil C/N ratio, with urea-only treatments reducing it by 3.8% to 7.6% compared to CK, and BF treatments reducing it by 12.94% to 28.14%. Both BF (p < 0.01) and U (p < 0.05) had significant effects on the C/N ratio, though no interaction was observed between BF and U. At the end of the cultivation period, the soil pH in Ulow and Uhigh treatments decreased by 0.12 and 0.16, respectively, compared to CK, while treatments with BF increased pH by 0.19 to 0.87 compared to CK. BF had a significant effect on soil pH (p < 0.01).

3.4. Analysis of Factors Influencing Nitrogen Migration and Transformation in Tea Orchard Soils

3.4.1. Effects of Fertilization on Soil Nitrogen Accumulation and Loss

The net increase in soil N across the fertilization treatments ranged from 0.08 to 1.55 g·kg−1 (Table 4), representing 18.73–87.67% of the total N input (Table 5). BF additions significantly enhanced the net N accumulation in the soil. Specifically, in the Ulow treatment group, the proportion of net N increase in treatments with BF was 4.14–4.68 times higher than Ulow alone, while in the Uhigh group, it was 2.33–2.53 times greater than in Uhigh treatment without BF (Table 5). At the end of the soil incubation period, the net N losses (mainly through NH3 volatilization and N leaching) in Uhigh and Ulow treatments were 141.40 and 75.97 mg·kg−1 (Table 4), respectively, accounting for 58.91% and 69.06% of the total N input (Table 5). Within these treatments, the lowest N loss occurred in the BF0.5 treatment, with net losses of 88.05 and 55.97 mg·kg−1 for Uhigh and Ulow, respectively (Table 4). Compared to Uhigh and Ulow alone, BF addition reduced the proportion of net nitrogen loss by 67.92–85.52% (Table 5). Among the N loss pathways, leaching was the dominant route, accounting for 9.62–65.10% of net N losses (Table 5). The highest leaching losses were observed in the urea-only treatments (55.55–65.10%), whereas BF incorporation reduced N leaching by 38.06–55.48% relative to urea-only applications (Table 5). ENH3,tot accounted for a smaller proportion of net N losses (0.38–3.97%), with the highest values recorded in Uhigh and Ulow treatments (3.97% and 3.37%, respectively). The addition of BF effectively reduced ENH3,tot losses by 1.93–3.59% compared to urea-only treatments (Table 5).

3.4.2. Correlation and Random Forest Analysis of Nitrogen Drivers

Correlation analyses (Figure 6a) revealed that BF was positively correlated with soil TN (p < 0.01). Soil NH4+-N, NO3-N, NH4+-N/NO3-N ratio, C/N ratio, SOC, DOC, UE, pH, and EC all showed significant positive correlations with soil TN (p < 0.05), while TV (total leachate volume) was negatively correlated with soil TN. BF and U application rates were significant influencing factors of ENH3,tot and TDN (p < 0.01). Except for the NO3-N, NH4+-N/NO3-N ratio, C/N ratio, and TV, all other factors were significantly positively correlated with ENH3,tot, while TV showed a significant negative correlation. Similarly, BF and U were also key factors influencing TDN (p < 0.01). All factors, except the NH4+-N/NO3-N ratio and C/N ratio, were significantly positively correlated with TDN (p < 0.01). Random forest analysis (Figure 6b–d) identified the top predictors: for soil TN, pH (7.79%), SOC (7.37%), and soil NH4+-N (7.25%) were the most important variables (p < 0.05); for ENH3,tot, the key predictors were soil NH4+-N (15.61%), pH (13.20%), and NH4+-N (12.47%) (p < 0.05); for TDN, DON (19.01%), NH4+-N (10.75%), and NO3-N (8.28%) were most influential (p < 0.05).

3.4.3. Path Modeling of Nitrogen Transformation Mechanisms

Partial least squares path modeling (PLS-PM) was employed to further elucidate the relationships among soil chemical properties, leachate physicochemical characteristics, soil N retention, leaching, and ENH3,tot under various levels of BF and U co-application (Figure 7a). The results indicate that BF and U co-application had direct and significant positive effects on soil chemical properties (path coefficient = 0.592), soil TN (0.253), TDN (0.990), and ENH3,tot (0.926). Soil chemical properties directly and positively influenced the leachate properties (0.398), while showing a significant negative effect on TDN (−0.737). Leachate properties had significant positive effects on both TDN (0.902) and TN (0.682), whereas TN had a direct negative effect on TDN (−0.552). As shown in Figure 7b, the impact of BF and U co-application on leachate properties (0.912) was primarily indirect, and the influence of soil chemical properties on ENH3,tot (−0.832) was also predominantly indirect. In summary, the proportion and application rate of BF and U were the principal driving factors governing N migration and transformation in tea orchard soils. Their co-application not only directly affected the physicochemical properties of the soil but also indirectly influenced N retention, leaching, and volatilization.

3.4.4. Schematic Diagram of Nitrogen Migration and Transformation in Acidified Tea Orchard Soils

In order to visually summarize the effects of BF and U on soil N dynamics, a schematic diagram was prepared (Figure 8). Among the nine treatments, the representative groups of Ulow (0.72 t·ha−1) and Ulow combined with three BF application rates (BF0.5: 15 t·ha−1; BF1: 30 t·ha−1; BF3: 90 t·ha−1) were selected for illustration. The Ulow treatment served as the reference, while BF0.5, BF1, and BF3 represented low, medium, and high BF addition levels, respectively.
As shown in Figure 8, compared with Ulow, BF addition enhanced soil TN, SON, N4+-N, and NO3-N by 24.83–135.10%, 11.33–112.41%, 2.08–5.10 times, and 1.02–1.50 times, respectively, while pH increased by 0.41–0.95 units and SOC by 12.98–79.05%. Regarding gaseous and leaching losses, BF0.5 reduced NH3 volatilization by 22.33%, whereas BF1 and BF3 increased it by 7.52–40.29%. Compared with U alone, BF0.5 decreased TDN and DON leaching by 19.79% and 15.87%, respectively, while BF1 and BF3 increased them by 60.18–96.68% and 102.06–143.70%. BF treatments increased NH4+-N and DOC concentrations in leachates (by 4.56–11.32 times and 1.02–5.29 times) but reduced NO3-N by 25.10–59.09%. Therefore, the co-application of BF0.5 (15 t·ha−1) with U was more effective in mitigating NH3 volatilization and N leaching while improving N retention in acidified tea orchard soils.

4. Discussion

4.1. Effect of Biochar-Based Fertilizer on Ammonia Volatilization in Tea Orchard Soils

In all fertilization treatments, NH3 volatilization gradually peaked between days 4 and 7 (Figure 2a), consistent with rapid U hydrolysis during the initial 3 days that generates abundant NH4+, thereby accelerating NH3 volatilization [37,38]. However, the peaks in BF1 and BF3 occurred later (day 7) than those in BF0.5 and urea-only treatments, indicating that BF altered the temporal dynamics of NH3 volatilization. This delay is likely attributable to the slower decomposition of biochar, its capacity to adsorb NH4+, and its influence on soil physical–chemical properties, which collectively mitigate NH3 release [23,39]. Similar observations have been reported in other BF systems, where enhanced NH4+ retention and moderated pH fluctuations contributed to suppressed volatilization [23]. Importantly, NH3 volatilization in all treatments approached 0 by day 28, indicating that the first 21 days are the key period for regulating NH3 volatilization loss from the soil.
This study confirmed that increasing the U application rate significantly enhanced NH3 volatilization. This effect can be explained by the process of U hydrolysis, in which the rapid ammonization of U elevates soil pH, thereby shifting the equilibrium from NH4+ to gaseous NH3 [40]. Such results are consistent with previous reports that high N fertilization accelerates N loss pathways by altering soil chemical environments and increasing volatilization risk [41]. Therefore, the baseline effect of U provides a critical reference for evaluating the additional impacts of BF application.
When BF was applied at relatively high rates (30–90 t·ha−1), NH3 volatilization increased by 7.52–52.33% compared with urea-only treatments (Figure 2b). This result is consistent with the findings of Liu et al. [42], who reported that applying alkaline biochar at rates ≥ 40 t·ha−1 increased NH3 emissions in acidic soils. In our study, the biochar used (pH 7.3) raised the soil pH by 0.31–0.72 units, which increased OH- availability and accelerated the conversion of NH4+ into NH3 [40,43]. Thus, under high BF input, the dominant mechanism driving NH3 volatilization is the alkalinity-induced elevation of soil pH (Figure 2d). In contrast, the addition of BF at a lower rate (15 t·ha−1) resulted in a reduction in NH3 volatilization by 7.96–22.33% relative to the Ulow and Uhigh treatments, and this is likely due to enhanced NH4+ adsorption and improved soil cation exchange capacity [33,44]. However, this physicochemical explanation alone may not fully account for the observed dose-dependent pattern, as microbial and ionic processes could also play important roles.
Beyond soil pH regulation, the contrasting effects of low and high BF rates may reflect differences in microbial activity and N transformation pathways [42,45]. Low BF rates likely enhanced microbial immobilization of inorganic N and reduced substrate availability for NH3 volatilization, whereas high BF rates might have provided more labile organic matter and nutrients, stimulating microbial mineralization and nitrification processes that increased NH4+ and NO3 accumulation [46]. Additionally, excessive BF input may have altered ion balance (e.g., increased competition among NH4+, K+, and Ca2+) and disrupted adsorption–desorption equilibria, further facilitating NH3 release [13,47].
Taken together, these findings reveal a dose-dependent response with a potential threshold-like behavior: At lower BF rates (≤15 t·ha−1), adsorption and cation exchange capacity dominate, resulting in reduced NH3 volatilization, whereas at higher BF rates (≥30 t·ha−1), soil pH elevation becomes the primary driver of volatilization. Although the absolute amount of NH3 volatilization loss increased under higher BF application, the relative proportion of N lost declined because the legume-derived BF contained 5.3% N, increasing the total N input (Table 4). Therefore, applying 15 t·ha−1 BF appears to be optimal under the present experimental conditions, as it balances soil N retention and NH3 emission mitigation. Nevertheless, the generalizability of these findings may be affected by soil type, climatic conditions, and BF properties; thus, further studies across diverse agroecosystems are needed to validate this pattern.

4.2. Effects of Biochar-Based Fertilizer on Nitrogen Leaching in Tea Orchard Soils

Biochar is generally reported to mitigate N leaching by adsorbing NH4+ onto surface functional groups and retaining it through cation exchange [44,46]. In contrast, our results showed that BF application markedly increased NH4+-N leaching, with concentrations 3.3–12.31 times higher than those under urea-only treatments (Table 2). Several factors may account for this discrepancy: (1) The NH4+ adsorption capacity of biochar depends strongly on pyrolysis temperature and feedstock characteristics [47], which, in this case, may have been insufficient for immobilizing the available NH4+. (2) Rapid U hydrolysis combined with the mineralization of organic N in BF likely produced more NH4+ than the biochar could retain, thus increasing the NH4+-N content in the leachate. (3) The application of BF increased salt ion concentrations in the soil. When these concentrations surpassed a threshold, nitrification was inhibited, resulting in the accumulation and subsequent leaching of NH4+-N [48]. (4) The source of NH4+ may have shifted over time, initially dominated by U hydrolysis and later supplemented by progressive mineralization of BF-derived N, resulting in persistently high NH4+ levels in the leachate [49]. Taken together, these mechanisms likely explain the unexpected increase in NH4+ leaching observed in the BF treatments.
In contrast, BF application substantially reduced NO3-N leaching by 25.10–59.09% compared with U alone (Table 2), consistent with previous findings by Huang et al. [50]. This reduction may result from two complementary processes: (1) The partial retention of NH4+ via biochar (mainly through cation exchange and surface adsorption) reduces substrate availability for nitrification, thereby limiting NO3-N leaching [44]. (2) The elevated EC following BF addition further suppresses nitrification [51], collectively limiting NO3 formation and mobility. The simultaneous increase in NH4+ and decrease in NO3 leaching highlights a shift in N species dynamics, driven by the physicochemical effects of biochar on the soil environment.
The dynamic changes in DON concentrations in the leachate further illustrate the complex influence of BF. In the Ulow treatment group, the addition of BF exhibited a bimodal trend, with peaks occurring at 49 and 77 days (Figure 4d). This pattern may be attributed to the initial peak resulting from the leaching of small-molecule monomers such as amino acids and U, while the second peak corresponds to larger molecular aggregates, such as humic substances and peptides. By contrast, in the Uhigh treatment group, no significant peaks were observed in any treatment, possibly because the large amount of U provided ample N, which maintained a relatively stable organic N concentration in the soil solution, rendering it difficult to form significant peaks [52,53]. In terms of DON content in the leachate, the BF0.5 treatment reduced DON release by 15.87–27.47% compared with U alone (Table 2), showing a similar trend to the 39–56% reductions reported by Shi et al. [54] under biochar–urea co-applications. In contrast, DON leaching was enhanced under BF1 and BF3 treatments, possibly due to the higher organic N content in the soybean-straw-derived BF and the additional labile carbon provided by the biochar, which stimulated microbial activity and promoted the mineralization and leaching of organic N. This underscores that BF dosage and composition are critical determinants of DON dynamics.
In this study, the TDN results indicated that BF played a dual role in regulating nitrogen loss, showing both beneficial and adverse effects depending on the application rate. Low BF addition (BF0.5Uhigh and BF0.5Ulow) reduced TDN by 33.56% and 19.79%, respectively, compared with U alone, consistent with previous findings that appropriate BF rates enhance soil N retention through the adsorption of NH4+ and suppression of nitrification [55,56]. At low application rates, BF appeared to enhance soil cation exchange capacity and provided suitable conditions for microbial immobilization of inorganic N, thereby decreasing N leaching.
However, excessive BF input (30–90 t·ha−1) promoted TDN leaching (Table 2), suggesting that higher dosages may disturb soil physicochemical balance. The intrinsic N and labile carbon contained in BF can stimulate the mineralization of both BF-derived and native soil organic N, increasing the availability of mobile inorganic N [57]. Moreover, high BF rates can increase soil EC and alter ion competition, weakening NH4+ adsorption and enhancing its leaching potential [13,48]. Overall, these findings indicate that the effect of BF on N loss is dose-dependent, governed by the combined influence of its nutrient composition, impact on microbial activity, and modification of soil ionic balance. The simulated soil layer in this study closely corresponds to the typical 30 cm fine-root distribution zone in tea orchards [58]. The BF0.5 treatment significantly reduced N leaching. Therefore, this study provides a valuable reference for determining the optimal BF application rate and depth under field conditions.
Overall, the BF application altered the balance of N species in leachate by promoting NH4+ retention, suppressing nitrification and NO3 production, and modifying organic N turnover. Importantly, the co-application of 15 t·ha−1 BF with U optimized these effects, reducing total N leaching losses while enhancing soil N retention capacity (Table 4). These results suggest that the regulation of N leaching by BF depends on both its intrinsic characteristics and the applied dosage in the simulated system.

4.3. Effects of Biochar-Based Fertilizer on Soil Nitrogen and Physicochemical Properties in Tea Orchard Soils

SOC is widely recognized as a key indicator of soil fertility and quality, as it contributes to nutrient and water retention, aggregate stability, and microbial biodiversity [59,60]. In the present study, the application of BF increased SOC by 11.19–76.69% and TN by 27.36–146.23%, consistent with the results of García-Jaramillo et al. [61]. These results highlight the strong capacity of BF, as a carbon-rich amendment, to enhance soil C and N pools. Partial least squares path modeling (PLS-PM) (Figure 7a) further demonstrated that BF application directly influenced soil TN levels, suggesting that increases in SOC may be a major driver of enhanced N retention. Supporting this view, random forest analysis (Figure 6b) identified SOC as the most important predictor of soil TN, consistent with the role of biochar in stabilizing organic N and mitigating TN leaching [62].
In addition, a clear dose-dependent effect was observed: the 90 t·ha−1 BF treatment produced the greatest increase in soil TN, followed by the 30 t·ha−1 and 15 t·ha−1 treatments (Table 3). This trend aligns with the findings of Zhang et al. [63], who reported that higher rates of Moutai lees-derived biochar (2–4%) more effectively promoted N retention in loess soils than lower rates (0.5–1%). Collectively, these results suggest that the contribution of BF to N retention is regulated by the combined effects of their carbon enrichment properties and application rate.
BF application also altered soil pH, increasing it by 0.19–0.87 units (Table 3), likely due to the alkaline nature of biochar and its release of base cations [64,65]. This is important because soil pH is a key regulator of N availability. Whitman et al. [66] reported that increasing soil pH toward neutral conditions (around 6.5) enhances nutrient retention and availability. These findings suggest that, in addition to SOC enrichment, pH adjustments provide an additional pathway through which BF promotes TN accumulation.
The application of BF markedly enhanced soil inorganic N, with NH4+-N increasing 1.48–5.10 times and NO3-N by 0.61–1.76 times compared with U alone (Table 3). Similarly to previous studies [59,63,67], this improvement is attributed to stimulated N mineralization and urease activity. Notably, NH4+-N consistently dominated over NO3-N across BF treatments, likely due to the porous structure of biochar, which improves water retention and creates anaerobic microsites that suppress nitrification, while its alkaline nature and release of base cations further regulate microbial transformations [64,65]. The incorporation of fulvic acid may additionally enhance enzyme activity and microbial community shifts, synergistically promoting inorganic N accumulation [24]. Overall, these mechanisms indicate that BF improves not only the quantity but also the form of available N, enriching NH4+-N relative to NO3-N, thereby supporting more efficient N uptake in tea orchard systems.
Another important aspect of N dynamics concerns the relative proportions of NH4+-N and NO3-N, as their balance plays a decisive role in plant nutrition. A higher ratio of NH4+-N to NO3-N is beneficial for N uptake and metabolism in plants [68]. In tea orchard soils, NH4+-N is generally more favorable for tea plant growth than NO3-N [69]. Ruan et al. [70] reported that tea plants exhibit a higher uptake rate of NH4+-N than NO3-N, as they are well-adapted to NH4+-rich environments and possess a strong capacity for NH4+ assimilation in their root systems. In our study, the NH4+-N/NO3-N ratio under treatments combining BF with low U application (Ulow) increased by 51.45–142.62% compared with the Ulow treatment alone (Table 3).
These findings highlight that BF, especially when applied at lower rates in combination with reduced U input, can enhance soil C and N pools and adjust the NH4+-N/NO3-N ratio in ways favorable to tea plant nutrition. While the BF0.5 treatment (15 t·ha−1) exhibited promising results in improving N retention and reducing losses under laboratory conditions, these outcomes should be interpreted with caution. The absence of plant uptake and environmental variability in the experimental setup limits direct extrapolation to field-scale applications.
To ensure the agronomic relevance of these findings, field trials are needed to evaluate BF performance under actual tea-growing conditions, including its effects on yield and tea quality. In addition, broader implementation of BF will require consideration of production costs, biomass availability, and integration with current fertilization practices. Assessing the economic feasibility and scalability of BF is essential for its adoption as a sustainable strategy in the tea orchard.

5. Conclusions

The first 21 days after fertilization represent a critical period for reducing N losses by controlling NH3 volatilization. The co-application of U with a low dose of BF (BF0.5 = 15 t·ha−1) effectively reduced NH3 volatilization. However, medium-to-high application rates (BF1 = 30 t·ha−1 and BF3 = 90 t·ha−1) instead promoted NH3 volatilization. Compared with NH3 volatilization, the risk of N leaching in tea orchard soils was found to be higher, with NO3-N and DON being the primary forms of N loss. Under simulated rainfall conditions, BF0.5 treatment significantly reduced TDN leaching, while BF1 and BF3 treatments increased TDN losses. BF treatments enhanced N retention in tea orchard soils by increasing soil TN, NH4+-N, NO3-N, and the NH4+-N/NO3-N ratio, along with improvements in SOC, UE, and pH. Throughout the experiment, BF directly affected N retention, leaching, and NH3 volatilization, and it indirectly influenced N migration and transformation by modifying soil physicochemical properties. The application of BF reduced the proportion of N losses (via leaching and volatilization) relative to N inputs, thereby enhancing soil N accumulation. Among the influencing factors, soil pH was identified as the dominant predictor of NH3 volatilization, while both pH and SOC were the key predictors of soil TN content. Although BF can effectively enhance soil N retention, application rates exceeding 30 t·ha−1 may pose environmental risks and increase economic costs. Therefore, a BF application rate of ≤15 t·ha−1 in combination with a low U dose (Ulow = 0.72 t·ha−1) appears to be a promising strategy for enhancing soil N retention and optimizing the NH4+-N/NO3-N ratio, creating a more favorable environment for tea plant growth, and also mitigating NH3 volatilization and N leaching.
This study used controlled laboratory simulations to clarify how BF regulates N migration and transformation in tea orchard soils. However, the incubation approach inherently lacks plant uptake processes and relies on artificial rainfall simulation, which may not fully represent the dynamic interactions occurring under natural field conditions. In an actual tea orchard, fluctuating temperatures, soil moisture, rainfall patterns, and management practices can markedly influence N transport and microbial activity, potentially resulting in different outcomes. Therefore, long-term in situ field trials in hilly and mountainous tea orchards are needed to validate these findings; assess spatial and temporal variability in N cycling; and better understand their interactions with soil chemical, physical, and biological properties to support region-specific and adaptive fertilization strategies.

Author Contributions

Conceptualization, Y.S. (Youjian Su); methodology, Y.S. (Yulong Sun); validation, Y.Z. and Y.W.; formal analysis, Y.S. (Yulong Sun) and Y.Z.; investigation, Y.S. (Yulong Sun), T.T., J.L., Y.F. and X.X.; resources, Y.S. (Youjian Su); data curation, Y.F. and X.X.; writing—original draft preparation, Y.S. (Yulong Sun); writing—review and editing, Y.S. (Youjian Su), Y.Z. and J.L.; visualization, Y.S. (Yulong Sun) and T.T.; supervision, Y.S. (Youjian Su) and Y.W.; project administration, Y.S. (Youjian Su); funding acquisition, Y.S. (Youjian Su) and Y.W. All authors have read and agreed to the published version of the manuscript.

Funding

This study was supported by the earmarked fund for China Agriculture Research System (CARS 19); the Young Talent Program of Anhui Academy of Agricultural Sciences (QNYC-202518); the Anhui Tea Industry System Cultivation Post (AHCYJSTX-11); the Tunxi National Agricultural Experimental Station for Agricultural Environment (No. NAES–AE–040); and the Scientific Research Program of Anhui Academy of Agricultural Sciences (2025YL015).

Institutional Review Board Statement

Not applicable.

Informed Consent Statement

Not applicable.

Data Availability Statement

The data presented in this study are available upon request from the corresponding author.

Conflicts of Interest

The authors declare no conflicts of interest.

Abbreviations

The following abbreviations are used in this manuscript:
NNitrogen
BFBiochar-based fertilizer
UUrea
NH3Ammonia
TDNTotal dissolved nitrogen
TNTotal nitrogen
SONSoil organic nitrogen
NH4+-NAmmonium nitrogen
NO3-NNitrate nitrogen
UEUrease activity
SOCSoil organic carbon
ECElectrical conductivity
ENH3,totCumulative NH3 volatilization loss
TVTotal leachate volume
DOCDissolved organic carbon
DONDissolved organic nitrogen
PLS-PMPartial least squares path modeling

References

  1. Yan, P.; Shen, C.; Fan, L.; Li, X.; Zhang, L.; Zhang, L.; Han, W. Tea planting affects soil acidification and nitrogen and phosphorus distribution in soil. Agric. Ecosyst. Environ. 2018, 254, 20–25. [Google Scholar] [CrossRef]
  2. Wu, Y.; Li, Y.; Fu, X.; Liu, X.; Shen, J.; Wang, Y.; Wu, J. Three-dimensional spatial variability in soil microorganisms of nitrification and denitrification at a row-transect scale in a tea field. Soil Biol. Biochem. 2016, 103, 452–463. [Google Scholar] [CrossRef]
  3. Tang, S.; Zheng, N.; Ma, Q.; Zhou, J.; Sun, T.; Zhang, X.; Wu, L. Applying Nutrient Expert system for rational fertilisation to tea (Camellia sinensis) reduces environmental risks and increases economic benefits. J. Clean. Prod. 2021, 305, 127197. [Google Scholar] [CrossRef]
  4. Shao, S.; Li, Y.; Li, Z.; Ma, X.; Zhu, Y.; Luo, Y.; Cai, P.; Jia, X.; Rensing, C.; Li, Q. Impact of tea tree cultivation on soil microbiota, soil organic matter, and nitrogen cycling in mountainous plantations. Agronomy 2024, 14, 638. [Google Scholar] [CrossRef]
  5. Liu, Y.; Zhang, M.; Li, Y.; Zhang, Y.; Huang, X.; Yang, Y.; Zhu, H.; Xiong, H.; Jiang, T. Influence of nitrogen fertilizer application on soil acidification characteristics of tea plantations in karst areas of Southwest China. Agriculture 2023, 13, 849. [Google Scholar] [CrossRef]
  6. Ruan, J.; Ma, L.; Shi, Y. Aluminium in tea plantations: Mobility in soils and plants, and the influence of nitrogen fertilization. Environ. Geochem. Health 2006, 28, 519–528. [Google Scholar] [CrossRef]
  7. Yu, Y.; Zhang, Y.; Yang, B.; Qian, C.; Wang, Y.; Chen, T.; Han, X.; Yang, L.; Xue, L. Nitrogen utilization and loss of the tea plantation system on sloped farmland: A short-term response to substitution with organic fertilizer. Agronomy 2024, 14, 392. [Google Scholar] [CrossRef]
  8. Li, S.; Li, H.; Yang, C.; Wang, Y.; Xue, H.; Niu, Y. Rates of soil acidification in tea plantations and possible causes. Agric. Ecosyst. Environ. 2016, 233, 60–66. [Google Scholar] [CrossRef]
  9. Yang, X.; Ni, K.; Shi, Y.; Yi, X.; Zhang, Q.; Fang, L.; Ma, L.; Ruan, J. Effects of long-term nitrogen application on soil acidification and solution chemistry of a tea plantation in China. Agric. Ecosyst. Environ. 2018, 252, 74–82. [Google Scholar] [CrossRef]
  10. Rauber, L.P.; Andrade, A.P.; Friederichs, A.; Mafra, Á.L.; Baretta, D.; Rosa, M.G.D.; Mafra, M.S.H.; Correa, J.C. Soil physical indicators of management systems in traditional agricultural areas under manure application. Sci. Agric. 2018, 75, 354–359. [Google Scholar] [CrossRef]
  11. Baffaut, C.; Ghidey, F.; Lerch, R.N.; Kitchen, N.R.; Sudduth, K.A.; Sadler, E.J. Long-term simulated runoff and water quality from grain cropping systems on restrictive layer soils. Agric. Water Manag. 2019, 213, 36–48. [Google Scholar] [CrossRef]
  12. Zhu, T.; Zhang, J.; Meng, T.; Zhang, Y.; Yang, J.; Müller, C.; Cai, Z. Tea plantation destroys soil retention of NO3 and increases N2O emissions in subtropical China. Soil Biol. Biochem. 2014, 73, 106–114. [Google Scholar] [CrossRef]
  13. Li, H.; Dong, X.; Da Silva, E.B.; De Oliveira, L.M.; Chen, Y.; Ma, L.Q. Mechanisms of metal sorption by biochars: Biochar characteristics and modifications. Chemosphere 2017, 178, 466–478. [Google Scholar] [CrossRef] [PubMed]
  14. Castejón-del Pino, R.; Sánchez-Monedero, M.A.; Sánchez-García, M.; Cayuela, M.L. Fertilization strategies to reduce yield-scaled N2O emissions based on the use of biochar and biochar-based fertilizers. Nutr. Cycl. Agroecosyst. 2024, 129, 491–501. [Google Scholar] [CrossRef]
  15. Melo, L.C.A.; Lehmann, J.; Carneiro, J.S.D.S.; Camps-Arbestain, M. Biochar-based fertilizer effects on crop productivity: A meta-analysis. Plant Soil 2022, 472, 45–58. [Google Scholar] [CrossRef]
  16. Ding, Z.; Huang, R.; Li, X.; Fan, Q.; Hu, L.; Liu, S. Effects of biochar on soil organic carbon mineralization in citrus orchards. Sustainability 2024, 16, 9967. [Google Scholar] [CrossRef]
  17. Majeed, M.; Ali Jaaf, S.; Li, Y.; Günal, E.; Ali El Enshasy, H.; Salmen, S.H.; Sürücü, A. The impact of corncob biochar and poultry litter on pepper (Capsicum annuum L.) growth and chemical properties of a silty-clay soil. Saudi J. Biol. Sci. 2022, 29, 2998–3005. [Google Scholar] [CrossRef]
  18. Feng, Y.; Yang, X.; Singh, B.P.; Mandal, S.; Guo, J.; Che, L.; Wang, H. Effects of contrasting biochars on the leaching of inorganic nitrogen from soil. J. Soils Sediments 2020, 20, 3017–3026. [Google Scholar] [CrossRef]
  19. Chen, P.; Liu, Y.; Mo, C.; Jiang, Z.; Yang, J.; Lin, J. Microbial mechanism of biochar addition on nitrogen leaching and retention in tea soils from different plantation ages. Sci. Total Environ. 2021, 757, 143817. [Google Scholar] [CrossRef]
  20. Zhang, X.; Lv, J.; Zhang, Y.; Li, S.; Chen, X.; Sha, Z. A meta-analysis study on the use of biochar to simultaneously mitigate emissions of reactive nitrogen gases (N2O and NO) from soils. Sustainability 2023, 15, 2384. [Google Scholar] [CrossRef]
  21. He, T.; Yuan, J.; Xiang, J.; Lin, Y.; Luo, J.; Lindsey, S.; Liao, X.; Liu, D.; Ding, W. Combined biochar and double inhibitor application offsets NH3 and N2O emissions and mitigates N leaching in paddy fields. Environ. Pollut. 2022, 292, 118344. [Google Scholar] [CrossRef]
  22. Liu, Q.; Liu, B.; Zhang, Y.; Hu, T.; Lin, Z.; Liu, G.; Wang, X.; Ma, J.; Wang, H.; Jin, H.; et al. Biochar application as a tool to decrease soil nitrogen losses (NH3 volatilization, N2O emissions, and N leaching) from croplands: Options and mitigation strength in a global perspective. Glob. Change Biol. 2019, 25, 2077–2093. [Google Scholar] [CrossRef]
  23. Zhou, M.; Ying, S.; Chen, J.; Jiang, P.; Teng, Y. Effects of biochar-based fertilizer on nitrogen use efficiency and nitrogen losses via leaching and ammonia volatilization from an open vegetable field. Environ. Sci. Pollut. Res. 2021, 28, 65188–65199. [Google Scholar] [CrossRef]
  24. Jin, Q.; Zhang, Y.; Wang, Q.; Li, M.; Sun, H.; Liu, N.; Zhang, L.; Zhang, Y.; Liu, Z. Effects of potassium fulvic acid and potassium humate on microbial biodiversity in bulk soil and rhizosphere soil of panax ginseng. Microbiol. Res. 2022, 254, 126914. [Google Scholar] [CrossRef]
  25. Kanabar, P.; Wu, Y.; Nandwani, D. Enhancing sustainable cultivation of organic bell pepper through fulvic acid (FA) application: Impact on phytochemicals and antioxidant capacity under open-field conditions. Sustainability 2024, 16, 6745. [Google Scholar] [CrossRef]
  26. Abdelrasheed, K.G.; Mazrou, Y.; Omara, A.E.-D.; Osman, H.S.; Nehela, Y.; Hafez, E.M.; Rady, A.M.S.; El-Moneim, D.A.; Alowaiesh, B.F.; Gowayed, S.M. Soil amendment using biochar and application of K-humate enhance the growth, productivity, and nutritional value of onion (Allium cepa L.) under deficit irrigation conditions. Plants 2021, 10, 2598. [Google Scholar] [CrossRef] [PubMed]
  27. Jiao, Y.; Chen, Q.; Guo, X.; Li, H.; Chen, X.; Men, K.; Liu, X.; Shang, X.; Gao, Y.; Zhang, L.; et al. Effect of potassium fulvate on continuous tobacco cropping soils and crop growth. Front. Plant Sci. 2024, 15, 1457793. [Google Scholar] [CrossRef] [PubMed]
  28. Ahmad, B.; Rahim, H.U.; Mian, I.A.; Ali, W. Synergistic Biochar–nitrogen application enhances soil fertility and compensates for nutrient deficiency, improving wheat production in calcareous soil. Sustainability 2025, 17, 2321. [Google Scholar] [CrossRef]
  29. Puga, A.P.; Queiroz, M.C.D.A.; Ligo, M.A.V.; Carvalho, C.S.; Pires, A.M.M.; Marcatto, J.D.O.S.; Andrade, C.A.D. Nitrogen availability and ammonia volatilization in biochar-based fertilizers. Arch. Agron. Soil Sci. 2020, 66, 992–1004. [Google Scholar] [CrossRef]
  30. Liu, L.; Fang, W.; Yuan, M.; Li, X.; Wang, X.; Dai, Y. Metolachlor-adsorption on the walnut shell biochar modified by the fulvic acid and citric acid in water. J. Environ. Chem. Eng. 2021, 9, 106238. [Google Scholar] [CrossRef]
  31. Yang, W.; Li, C.; Wang, S.; Zhou, B.; Mao, Y.; Rensing, C.; Xing, S. Influence of biochar and biochar-based fertilizer on yield, quality of tea and microbial community in an acid tea orchard soil. Appl. Soil Ecol. 2021, 166, 104005. [Google Scholar] [CrossRef]
  32. Jiang, Y.; Wang, X.; Zhao, Y.; Zhang, C.; Jin, Z.; Shan, S.; Ping, L. Effects of biochar application on enzyme activities in tea garden soil. Front. Bioeng. Biotechnol. 2021, 9, 728530. [Google Scholar] [CrossRef]
  33. Puga, A.P.; Grutzmacher, P.; Cerri, C.E.P.; Ribeirinho, V.S.; Andrade, C.A. Biochar-based nitrogen fertilizers: Greenhouse gas emissions, use efficiency, and maize yield in tropical soils. Sci. Total Environ. 2020, 704, 135375. [Google Scholar] [CrossRef] [PubMed]
  34. Plaimart, J.; Acharya, K.; Mrozik, W.; Davenport, R.J.; Vinitnantharat, S.; Werner, D. Coconut Husk Biochar amendment enhances nutrient retention by suppressing nitrification in agricultural soil following anaerobic digestate application. Environ. Pollut. 2021, 268, 115684. [Google Scholar] [CrossRef] [PubMed]
  35. Zhang, Y.; Zhou, J.; Ren, H.; Chen, H. Characterization of forest soil acidification in Wenzhou Daluoshan and Zhejiang Wuyanling National Nature Reserve. Sustainability 2024, 16, 7051. [Google Scholar] [CrossRef]
  36. Zhang, X.; Han, G. The effect of warming and nitrogen addition on soil aggregate enzyme activities in a desert steppe. Sustainability 2025, 17, 6031. [Google Scholar] [CrossRef]
  37. Gwenzi, W.; Nyambishi, T.J.; Chaukura, N.; Mapope, N. Synthesis and nutrient release patterns of a biochar-based N–P–K slow-release fertilizer. Int. J. Environ. Sci. Technol. 2018, 15, 405–414. [Google Scholar] [CrossRef]
  38. Soares, J.R.; Cantarella, H.; Menegale, M.L.d.C. Ammonia volatilization losses from surface-applied urea with urease and nitrification inhibitors. Soil Biol. Biochem. 2012, 52, 82–89. [Google Scholar] [CrossRef]
  39. Zhenghu, D.; Honglang, X. Effects of soil properties on ammonia volatilization. Soil Sci. Plant Nutr. 2000, 46, 845–852. [Google Scholar] [CrossRef]
  40. Jindo, K.; Audette, Y.; Higashikawa, F.S.; Silva, C.A.; Akashi, K.; Mastrolonardo, G.; Sánchez-Monedero, M.A.; Mondini, C. Role of biochar in promoting circular economy in the agriculture sector. Part 1: A review of the biochar roles in soil N, P and K cycles. Chem. Biol. Technol. Agric. 2020, 7, 15. [Google Scholar] [CrossRef]
  41. Liang, H.; Chen, Q.; Liang, B.; Hu, K. Modeling the effects of long-term reduced N application on soil N losses and yield in a greenhouse tomato production system. Agric. Syst. 2020, 185, 102951. [Google Scholar] [CrossRef]
  42. Liu, Q.; Zhang, Y.; Liu, B.; Amonette, J.E.; Lin, Z.; Liu, G.; Ambus, P.; Xie, Z. How does biochar influence soil N cycle? A meta-analysis. Plant Soil 2018, 426, 211–225. [Google Scholar] [CrossRef]
  43. Xu, R.; Zhao, A.; Yuan, J.; Jiang, J. pH buffering capacity of acid soils from tropical and subtropical regions of China as influenced by incorporation of crop straw biochars. J. Soils Sediments 2012, 12, 494–502. [Google Scholar] [CrossRef]
  44. Clough, T.J.; Condron, L.M. Biochar and the nitrogen cycle: Introduction. J. Environ. Qual. 2010, 39, 1218–1223. [Google Scholar] [CrossRef]
  45. Quilliam, R.S.; Glanville, H.C.; Wade, S.C.; Jones, D.L. Life in the ‘charosphere’—Does biochar in agricultural soil provide a significant habitat for microorganisms? Soil Biol. Biochem. 2013, 65, 287–293. [Google Scholar] [CrossRef]
  46. Mukherjee, A.; Zimmerman, A.R. Organic carbon and nutrient release from a range of laboratory-produced biochars and biochar–soil mixtures. Geoderma 2013, 193–194, 122–130. [Google Scholar] [CrossRef]
  47. Taghizadeh-Toosi, A.; Clough, T.J.; Sherlock, R.R.; Condron, L.M. Biochar adsorbed ammonia is bioavailable. Plant Soil 2012, 350, 57–69. [Google Scholar] [CrossRef]
  48. Zhu, H.; Yang, J.; Yao, R.; Wang, X.; Xie, W.; Zhu, W.; Liu, X.; Cao, Y.; Tao, J. Interactive effects of soil amendments (biochar and gypsum) and salinity on ammonia volatilization in coastal saline soil. Catena 2020, 190, 104527. [Google Scholar] [CrossRef]
  49. Jílková, V.; Angst, G. Biochar and compost amendments to a coarse-textured temperate agricultural soil lead to nutrient leaching. Appl. Soil Ecol. 2022, 173, 104393. [Google Scholar] [CrossRef]
  50. Huang, C.; Sun, X.; Wang, L.; Storer, P.; Siddique, K.H.M.; Solaiman, Z.M. Nutrients leaching from tillage soil amended with wheat straw biochar influenced by fertilizer type. Agriculture 2021, 11, 1132. [Google Scholar] [CrossRef]
  51. Ma, Y.; Xie, W.; Yao, R.; Feng, Y.; Wang, X.; Xie, H.; Feng, Y.; Yang, J. Biochar and hydrochar application influence soil ammonia volatilization and the dissolved organic matter in salt-affected soils. Sci. Total Environ. 2024, 926, 171845. [Google Scholar] [CrossRef] [PubMed]
  52. Hussain, M.Z.; Robertson, G.P.; Basso, B.; Hamilton, S.K. Leaching losses of dissolved organic carbon and nitrogen from agricultural soils in the upper US Midwest. Sci. Total Environ. 2020, 734, 139379. [Google Scholar] [CrossRef]
  53. Zhang, P.; Yue, F.-J.; Wang, X.-D.; Chen, S.-N. Dynamic transformation and leaching processes of nitrogen in a karst agricultural soil under simulated rainfall conditions. J. Contam. Hydrol. 2025, 269, 104494. [Google Scholar] [CrossRef]
  54. Shi, W.; Ju, Y.; Bian, R.; Li, L.; Joseph, S.; Mitchell, D.R.G.; Munroe, P.; Taherymoosavi, S.; Pan, G. Biochar bound urea boosts plant growth and reduces nitrogen leaching. Sci. Total Environ. 2020, 701, 134424. [Google Scholar] [CrossRef] [PubMed]
  55. Li, Y.; Cheng, J.; Lee, X.; Chen, Y.; Gao, W.; Pan, W.; Tang, Y. Effects of biochar-based fertilizers on nutrient leaching in a tobacco-planting soil. Acta Geochim. 2019, 38, 1–7. [Google Scholar] [CrossRef]
  56. Zhao, X.; Yan, X.; Wang, S.; Xing, G.; Zhou, Y. Effects of the addition of rice-straw-based biochar on leaching and retention of fertilizer N in highly fertilized cropland soils. Soil Sci. Plant Nutr. 2013, 59, 771–782. [Google Scholar] [CrossRef]
  57. Tao, W.-Q.; Wu, Q.-Q.; Zhang, J.; Chang, T.-T.; Liu, X.-N. Effects of applying organic amendments on soil aggregate structure and tomato yield in facility agriculture. Plants 2024, 13, 3064. [Google Scholar] [CrossRef]
  58. Xin, W.; Zhang, J.; Yu, Y.; Tian, Y.; Li, H.; Chen, X.; Li, W.; Liu, Y.; Lu, T.; He, B.; et al. Root microbiota of tea plants regulate nitrogen homeostasis and theanine synthesis to influence tea quality. Curr. Biol. 2024, 34, 868–880.e6. [Google Scholar] [CrossRef]
  59. Zheng, H.; Wang, Z.; Deng, X.; Herbert, S.; Xing, B. Impacts of adding biochar on nitrogen retention and bioavailability in agricultural soil. Geoderma 2013, 206, 32–39. [Google Scholar] [CrossRef]
  60. Lehman, R.M.; Acosta-Martinez, V.; Buyer, J.S.; Cambardella, C.A.; Collins, H.P.; Ducey, T.F.; Halvorson, J.J.; Jin, V.L.; Johnson, J.M.F.; Kremer, R.J.; et al. Soil biology for resilient, healthy soil. J. Soil Water Conserv. 2015, 70, 12A–18A. [Google Scholar] [CrossRef]
  61. García-Jaramillo, M.; Meyer, K.M.; Phillips, C.L.; Acosta-Martínez, V.; Osborne, J.; Levin, A.D.; Trippe, K.M. Biochar addition to vineyard soils: Effects on soil functions, grape yield and wine quality. Biochar 2021, 3, 565–577. [Google Scholar] [CrossRef]
  62. Sun, X.; Yang, X.; Hu, Z.; Liu, F.; Xie, Z.; Li, S.; Wang, G.; Li, M.; Sun, Z.; Bol, R. Biochar effects on soil nitrogen retention, leaching and yield of perennial citron daylily under three irrigation regimes. Agric. Water Manag. 2024, 296, 108788. [Google Scholar] [CrossRef]
  63. Zhang, M.; Liu, Y.; Wei, Q.; Gou, J. Biochar enhances the retention capacity of nitrogen fertilizer and affects the diversity of nitrifying functional microbial communities in karst soil of Southwest China. Ecotoxicol. Environ. Saf. 2021, 226, 112819. [Google Scholar] [CrossRef]
  64. Sun, H.; Lu, H.; Chu, L.; Shao, H.; Shi, W. Biochar applied with appropriate rates can reduce N leaching, keep N retention and not increase NH3 volatilization in a coastal saline soil. Sci. Total Environ. 2017, 575, 820–825. [Google Scholar] [CrossRef]
  65. Atkinson, C.J.; Fitzgerald, J.D.; Hipps, N.A. Potential mechanisms for achieving agricultural benefits from biochar application to temperate soils: A review. Plant Soil 2010, 337, 1–18. [Google Scholar] [CrossRef]
  66. Whitman, T.; Singh, B.P.; Zimmerman, A.R. Priming effects in biochar-amended soils: Implications of biochar-soil organic matter interactions for carbon storage. In Biochar for Environmental Management, 2nd ed.; Lehmann, J., Joseph, S., Eds.; Routledge: London, UK, 2015; pp. 487–520. [Google Scholar]
  67. Javeed, H.M.R.; Ali, M.; Ahmed, I.; Wang, X.; Al-Ashkar, I.; Qamar, R.; Ibrahim, A.; Habib-Ur-Rahman, M.; Ditta, A.; El Sabagh, A. Biochar enriched with buffalo slurry improved soil nitrogen and carbon dynamics, nutrient uptake and growth attributes of wheat by reducing leaching losses of nutrients. Land 2021, 10, 1392. [Google Scholar] [CrossRef]
  68. Xu, G.; Fan, X.; Miller, A.J. Plant nitrogen assimilation and use efficiency. Annu. Rev. Plant Biol. 2012, 63, 153–182. [Google Scholar] [CrossRef]
  69. Ruan, J.; Zhang, F.; Wong, M.H. Effect of nitrogen form and phosphorus source on the growth, nutrient uptake and rhizosphere soil property of Camellia sinensis L. Plant Soil 2000, 223, 65–73. [Google Scholar] [CrossRef]
  70. Ruan, J.; Gerendás, J.; Härdter, R.; Sattelmacher, B. Effect of nitrogen form and root-zone pH on growth and nitrogen uptake of tea (Camellia sinensis) plants. Ann. Bot. 2007, 99, 301–310. [Google Scholar] [CrossRef]
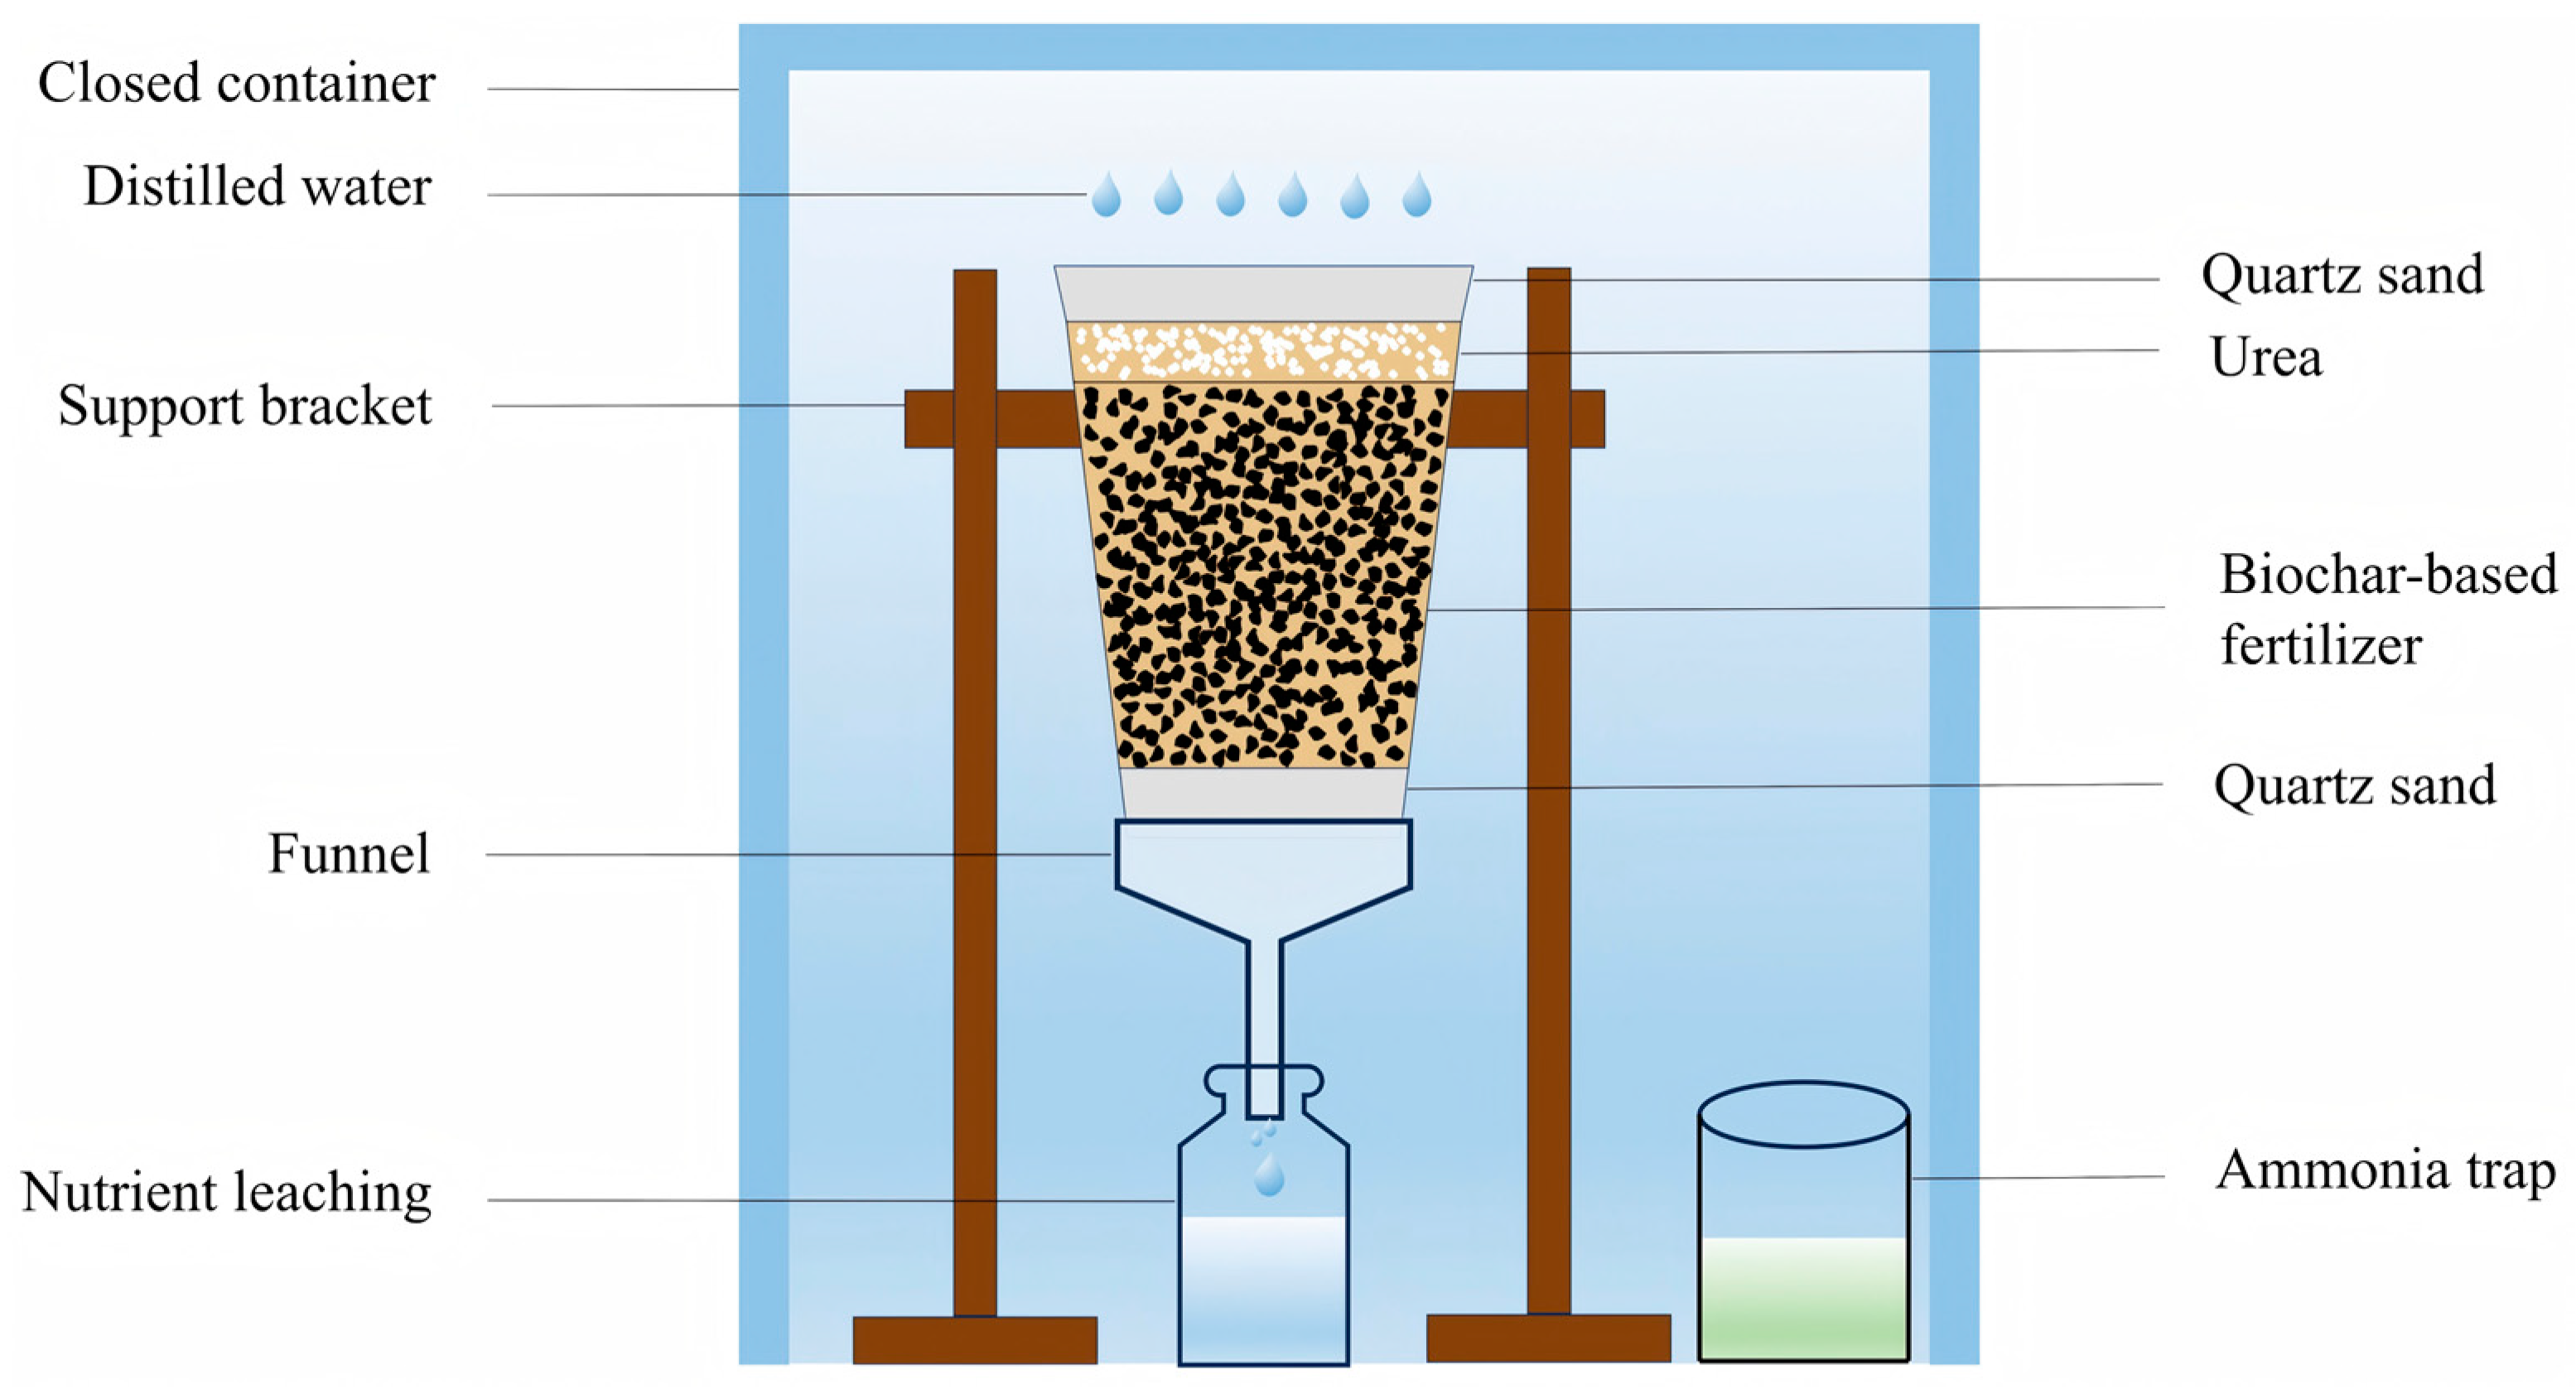
Figure 1. Schematic of ammonia volatilization and nutrient leaching setup.
Sustainability 17 09751 g001
Figure 2. Dynamic changes in ammonia volatilization and pH under different treatments, and the relationship between pH and cumulative ammonia volatilization loss. Note 1: CK, control treatment; Uhigh and Ulow represent 1.50 t·ha−1 and 0.72 t·ha−1 of urea, respectively, while BF0.5, BF1, and BF3 correspond to 15 t·ha−1, 30 t·ha−1, and 90 t·ha−1 of the biochar-based fertilizer, respectively. Note 2: Dynamic changes in the rate of soil ammonia volatilization and soil pH (a,c), and cumulative ammonia volatilization loss in soil (b). Panel (d) shows the relationship between cumulative ammonia volatilization loss and pH. Note 3: Vertical bars represent standard deviation (SD) from n = 3 replicates. Different letters indicate significant differences between treatments (p < 0.05). Red and blue areas represent 95% confidence intervals of the regression line.
Sustainability 17 09751 g002
Figure 3. Dynamic changes in pH, EC, cumulative leachate volume, and cumulative dissolved organic carbon contents under different treatments. Note 1: EC, electrical conductivity; DOC, dissolved organic carbon. Note 2: Dynamic changes in pH (a), EC (b), the cumulative volume (c), and cumulative DOC content (d) of the leachate under different treatments. Note 3: Vertical bars represent standard deviation (SD) from n = 3 replicates. Different letters indicate significant differences between treatments (p < 0.05).
Sustainability 17 09751 g003
Figure 4. Dynamic changes in concentrations of TDN, NH4+-N, NO3-N, and DON of leachate under different treatments. Note 1: TDN, total dissolved nitrogen; NH4+-N, ammonium nitrogen; NO3-N, nitrate nitrogen; DON, dissolved organic nitrogen. Note 2: Dynamic changes in the concentrations of TDN (a), NH4+-N (b), NO3-N (c), and DON (d) of the leachate under different treatments. Note 3: For each sampling time, the LSD value at p < 0.05 is shown as a vertical bar, indicating the minimum significant difference among treatments. Vertical bars represent standard deviation (SD) from n = 3 replicates.
Sustainability 17 09751 g004
Figure 5. Relationship between soil TN, NH4+-N, NO3-N, and NH4+-N/NO3-N ratio with nitrogen input under different treatments. Note 1: TN, soil total nitrogen; Soil NH4+-N, soil ammonium nitrogen; Soil NO3-N, soil nitrate nitrogen; Soil NH4+-N/NO3-N, ammonium to nitrate ratio. Note 2: Relationship between soil TN (a), NH4+-N (b), NO3-N (c), and NH4+-N/NO3-N (d) ratios with nitrogen input under different treatments. Note 3: Red and blue areas represent the 95% confidence intervals of the regression line for high-urea and low-urea treatments, respectively. R2 values indicate the goodness of fit, and p-values denote the statistical significance of the relationships.
Sustainability 17 09751 g005
Figure 6. Correlation and random forest analysis of nitrogen drivers. Note 1: Associations between nitrogen losses, soil nitrogen pools, other factors, and fertilization treatments (a). Random forest analysis to identify the main predictors of soil TN (b), ENH3,tot (c), and TDN (d). Note 2: Abbreviations of conceptual schema denote the following: Asterisks denote significance at the * p < 0.05 and ** p < 0.01 probability levels. R2 values indicate the proportion of variance in the dependent variable explained by the random forest model. Note: We only tagged the significance level of correlations between variables in (a).
Sustainability 17 09751 g006
Figure 7. Path modeling of nitrogen transformation mechanisms. Note 1: Depiction of the interconnections between the application rate of biochar-based fertilizers and urea, soil properties, leachate properties, soil TN, TDN, and ENH3,tot (a). Details the significant standardized path coefficients with direct and indirect effects (b). Note 2: Coefficients are presented on corresponding arrows with widths reflecting the absolute value of the path coefficient. Red arrows represent a positive influence, while blue arrows represent a negative influence. Solid lines indicate significant correlations, and dashed lines indicate non-significant correlations. *, p < 0.05; ***, p < 0.001. GOF indicates the overall fit of the PLS-PM. R2 values indicate the proportion of variance in the dependent variables.
Sustainability 17 09751 g007
Figure 8. Schematic diagram of nitrogen migration and transformation into acidified tea orchard soils under Ulow and Ulow + BF treatments. Note 1: The Ulow treatment serves as the reference, while BF0.5, BF1, and BF3 represent low, medium, and high rates of biochar-based fertilizer (15, 30, and 90 t·ha−1, respectively). Numerical values of key indicators are presented for Ulow, and the relative changes (percentages or fold increases/decreases) are shown for BF treatments. Red and green arrows indicate decreases and increases relative to Ulow.
Sustainability 17 09751 g008
Table 1. Urea and biochar-based fertilizer application rate.
Dose (t·ha−1)CKUhighBF0.5UhighBF1UhighBF3UhighUlowBF0.5UlowBF1UlowBF3Ulow
U1.501.501.501.500.720.720.720.72
BF15.0030.0090.0015.0030.0090.00
Notes: CK, control treatment; Uhigh and Ulow represent 1.50 t·ha−1 and 0.72 t·ha−1 of urea, respectively, while BF0.5, BF1, and BF3 correspond to 15 t·ha−1, 30 t·ha−1, and 90 t·ha−1 of the biochar-based fertilizer, respectively.
Table 2. Leachate contents of TDN, NH4+-N, NO3-N, and DON, and the NH4+-N/NO3-N ratio for biochar-based fertilizer, urea, and their combined treatments.
TreatmentTDN
(mg·kg−1)
NH4+-N
(mg·kg−1)
NO3-N
(mg·kg−1)
DON
(mg·kg−1)
NH4+-N/NO3-N
CK23.49 ± 1.22 g2.13 ± 0.03 g13.99 ± 0.25 g7.37 ± 1.02 g0.15 ± 0.00 f
Ulow95.09 ± 3.78 e3.52 ± 0.16 f47.09 ± 0.93 b44.48 ± 3.99 ef0.07 ± 0.00 f
BF0.5Ulow76.27 ± 1.79 f19.59 ± 0.85 d19.27 ± 0.80 f37.42 ± 2.31 f1.02 ± 0.06 bc
BF1Ulow152.32 ± 1.66 c32.21 ± 1.23 c30.25 ± 1.60 e89.87 ± 1.06 c1.07 ± 0.09 b
BF3Ulow187.03 ± 11.30 b43.36 ± 2.57 b35.27 ± 2.03 d108.39 ± 9.91 b1.23 ± 0.03 a
Uhigh156.80 ± 5.94 c5.91 ± 0.25 e84.74 ± 3.87 a66.14 ± 2.12 d0.07 ± 0.00 f
BF0.5Uhigh104.17 ± 3.70 d19.53 ± 0.70 d36.67 ± 1.81 d47.97 ± 3.56 e0.53 ± 0.02 e
BF1Uhigh158.19 ± 5.59 c32.98 ± 0.11 c42.70 ± 0.79 c82.51 ± 6.28 c0.77 ± 0.02 d
BF3Uhigh213.66 ± 4.55 a46.36 ± 0.57 a48.74 ± 0.97 b118.56 ± 4.62 a0.95 ± 0.03 c
BF***ns**
U*ns**ns
BF × U**ns******
Notes: Values are shown as the mean ± standard errors. Different letters indicate significant differences between treatments (p < 0.05); *, **, and ns represent significant differences, with extremely significant differences and no differences at p < 0.05, p < 0.01, and p > 0.05 levels. TDN, Total dissolved nitrogen; NH4+-N, ammonium nitrogen; NO3-N, nitrate nitrogen; DON, dissolved organic nitrogen; NH4+-N/NO3-N, ammonium-to-nitrate ratio.
Table 3. Soil TN, NH4+-N, NO3-N, SOC EC, pH, UE NH4+-N/NO3-N ratio, and C/N ratio under biochar-based fertilizer, urea, and their combined treatments.
TreatmentSoil TN
(g·kg−1)
Soil NH4+-N
(mg·kg−1)
Soil NO3-N
(mg·kg−1)
Soil NH4+-N/NO3-NSOC
(g·kg−1)
EC
(μs·cm−1)
UE
(mg·g−1·24 h−1)
Soil C/NpH
CK1.06 ± 0.05 g64.12 ± 5.00 f22.35 ± 1.97 e2.89 ± 0.41 b11.71 ± 0.64 d89.58 ± 5.83 g0.56 ± 0.04 e11.05 ± 0.22 a4.17 ± 0.03 d
Ulow1.08 ± 0.00 fg58.63 ± 4.88 f34.24 ± 3.09 d1.73 ± 0.31 c11.53 ± 0.11 d143.21 ± 9.71 fg0.95 ± 0.07 d10.63 ± 0.13 ab4.05 ± 0.02 e
BF0.5Ulow1.35 ± 0.02 e180.60 ± 9.24 d69.23 ± 6.30 c2.62 ± 0.16 b13.02 ± 0.34 c293.70 ± 16.48 e1.38 ± 0.12 c9.62 ± 0.13 c4.46 ± 0.04 bc
BF1Ulow1.55 ± 0.04 c262.07 ± 16.29 c64.65 ± 5.23 c4.07 ± 0.40 a14.55 ± 0.48 b465.40 ± 14.90 d1.60 ± 0.10 bc9.36 ± 0.35 c4.55 ± 0.05 b
BF3Ulow2.55 ± 0.06 a357.72 ± 11.26 a85.64 ± 0.85 b4.18 ± 0.16 a20.64 ± 1.06 a783.25 ± 64.97 b2.07 ± 0.15 a8.10 ± 0.50 d5.00 ± 0.05 a
Uhigh1.14 ± 0.01 f102.45 ± 8.45 e57.59 ± 6.14 c1.79 ± 0.21 c11.64 ± 0.58 d179.30 ± 15.91 f0.90 ± 0.07 d10.21 ± 0.49 b4.01 ± 0.03 e
BF0.5Uhigh1.46 ± 0.05 d253.82 ± 11.33 c92.45 ± 8.25 b2.76 ± 0.21 b13.05 ± 0.36 c352.30 ± 15.83 e1.44 ± 0.09 c8.97 ± 0.47 c4.36 ± 0.07 c
BF1Uhigh1.63 ± 0.02 b279.00 ± 4.00 b158.96 ± 6.20 a1.76 ± 0.08 c14.65 ± 0.09 b568.85 ± 49.54 c1.69 ± 0.10 b8.96 ± 0.05 c4.57 ± 0.04 b
BF3Uhigh2.61 ± 0.03 a351.35 ± 3.51 a150.66 ± 12.77 a2.34 ± 0.18 b20.69 ± 0.90 a947.70 ± 54.34 a2.12 ± 0.18 a7.94 ± 0.33 d5.04 ± 0.1 a
BF****nsns**********
U*nsnsnsnsns**ns
BF × Uns******ns*nsnsns
Notes: Values are shown as the mean ± standard errors. Different letters indicate significant differences between treatments (p < 0.05); *, **, and ns represent significant differences, with extremely significant differences and no differences at p < 0.05, p < 0.01, and p > 0.05 levels. Soil TN, Soil total nitrogen; soil NH4+-N, soil ammonium nitrogen; soil NO3-N, soil nitrate nitrogen; soil NH4+-N/NO3-N, ammonium-to-nitrate ratio; soil C/N, carbon-to-nitrogen ratio; EC, electrical conductivity; UE, urease activity.
Table 4. Nitrogen contents in the tea-planted soil of different fertilizer treatments.
N ContentCKUhighUlow
UhighBF0.5BF1BF3UlowBF0.5BF1BF3
Fertilizer application (g·kg−1)00.240.510.771.830.110.380.641.70
Mineral N residue (g·kg−1)1.06 g1.14 f1.46 d1.63 b2.61 a1.08 g1.35 e1.55 c2.55 a
Losses via leaching and NH3 volatilization (mg·kg−1)24.40 h165.80 c112.46 e169.96 c227.37 a100.37 f80.37 g158.00 d194.44 b
NH3 volatilization loss (mg·kg−1)0.91 g9.00 c8.28 c11.77 b13.71 a5.28 e4.10 f5.68 e7.41 d
Leaching loss of total N (mg·kg−1)23.49 g156.80 c104.17 d158.19 c213.66 a95.09 e76.27 f152.32 c187.03 b
Notes: Values are shown as the mean. Different letters indicate significant differences between treatments (p < 0.05).
Table 5. Fate of nitrogen in the tea-planted soil of different fertilizer treatments.
Ratio * of Applied N (%)UhighUlow
UhighBF0.5BF1BF3UlowBF0.5BF1BF3
Minerals N residue33.37 b77.84 a74.68 a84.54 a18.73 bc77.46 a77.29 a87.67 a
Losses via leaching and NH3 volatilization58.91 b17.27 cd18.90 c11.09 e69.06 a14.73 d20.88 c10.00 e
NH3 volatilization loss3.37 b1.44 c1.41 c0.70 d3.97 a0.84 d0.74 d0.38 e
Leaching loss of total N55.55 b15.82 d17.49 cd10.39 e65.10 a13.89 d20.13 c9.62 e
Undefined #7.61 b4.89 d6.42 c4.37 d12.21 a7.82 b1.83 f2.33 e
Notes: Values are shown as the mean. Different letters indicate significant differences between treatments (p < 0.05). * Ratio = (amount in fertilizer applied treatment − amount in control treatment)/N fertilizer applied × 100%. # Undefined = 100% − ratio of mineral N residue (%) − ratio of losses via leaching and NH3 volatilization.
Disclaimer/Publisher’s Note: The statements, opinions and data contained in all publications are solely those of the individual author(s) and contributor(s) and not of MDPI and/or the editor(s). MDPI and/or the editor(s) disclaim responsibility for any injury to people or property resulting from any ideas, methods, instructions or products referred to in the content.