Digital Economy, Spatial Imbalance, and Coordinated Growth: Evidence from Urban Agglomerations in the Middle and Lower Reaches of the Yellow River Basin
Abstract
1. Introduction
2. Regional Overview and Research Methods
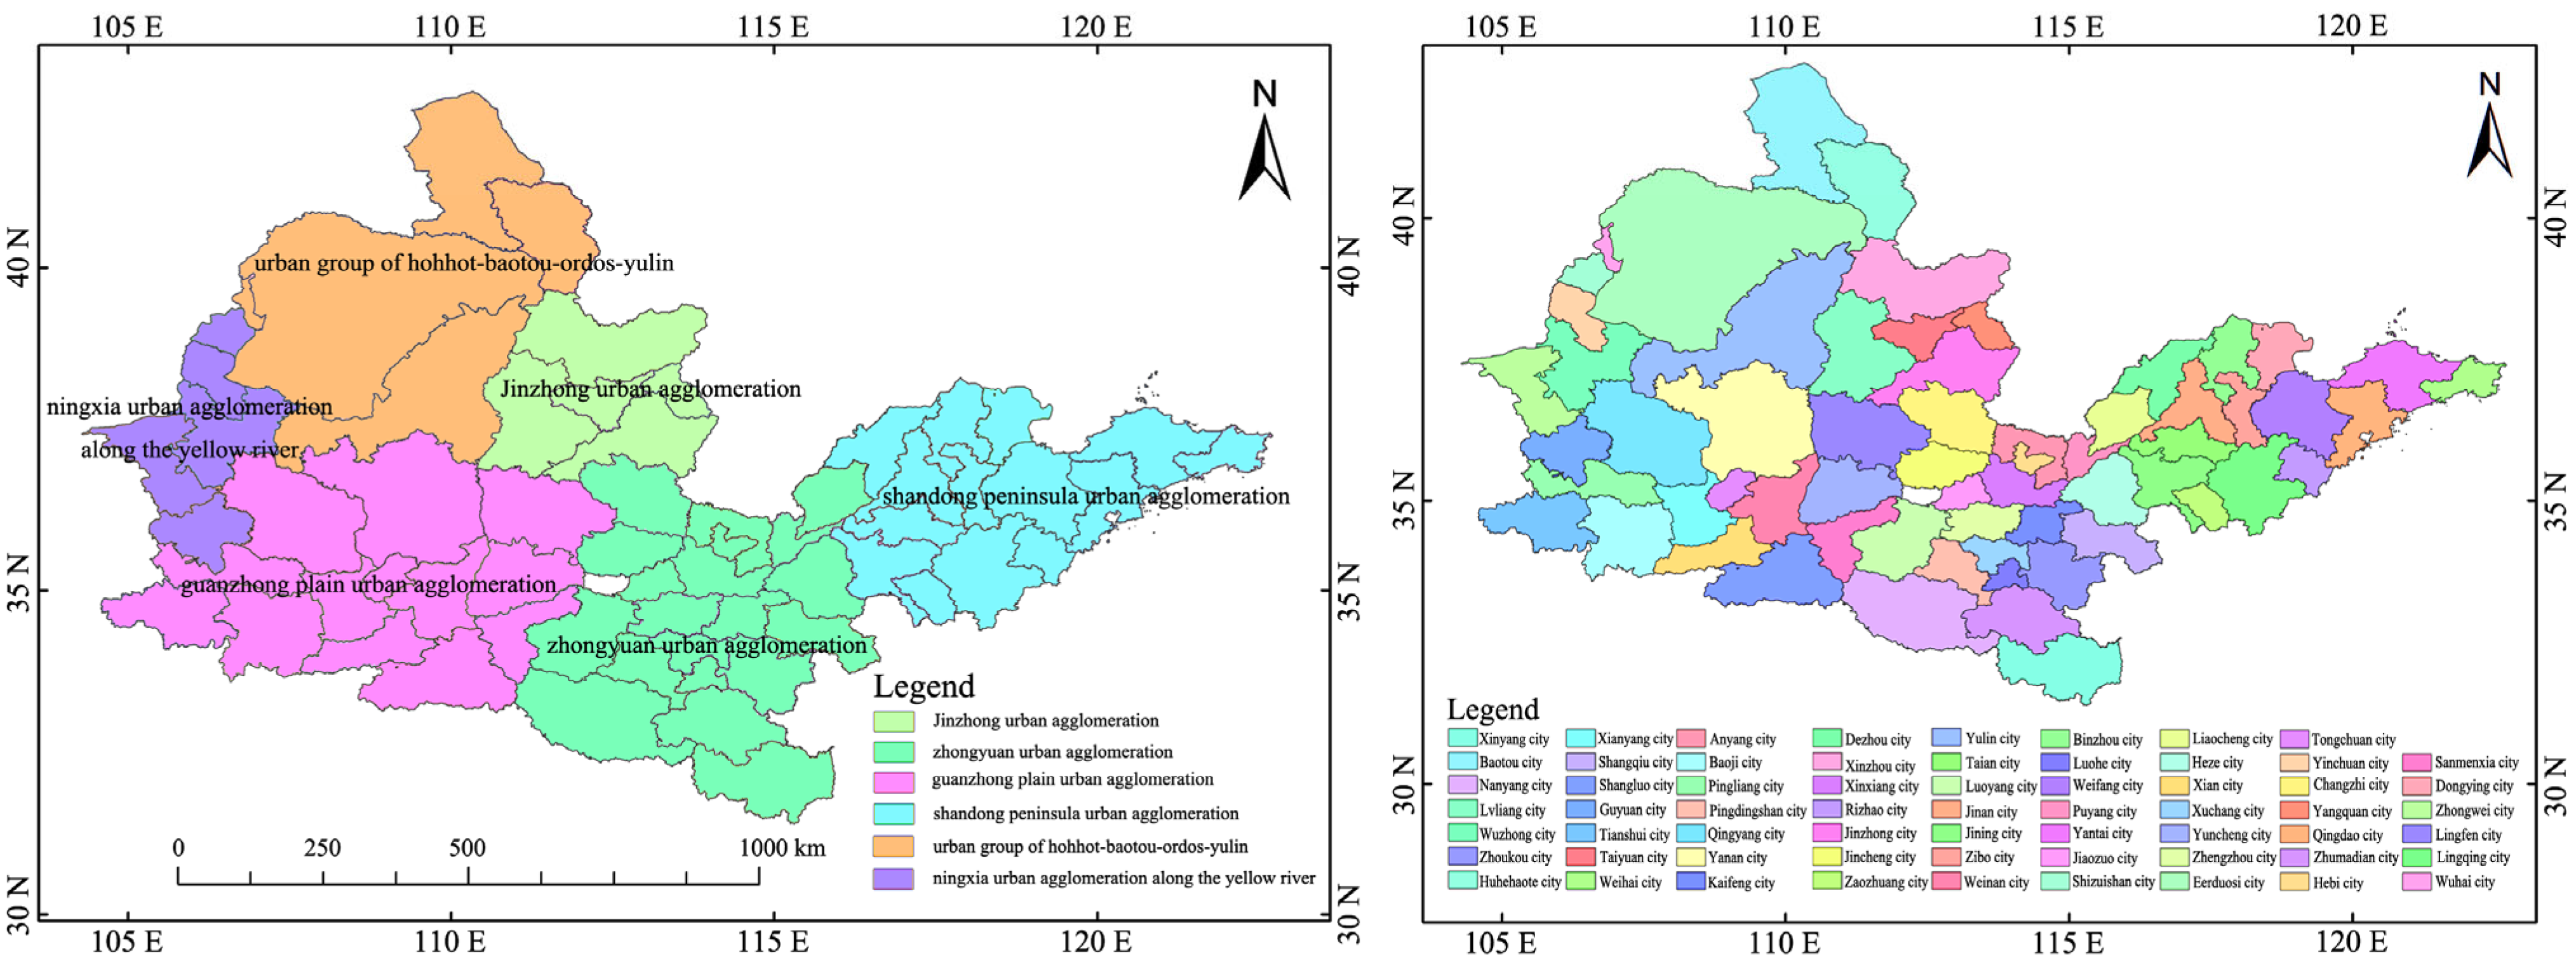
2.1. Regional Overview
Research Framework and Analysis Steps
2.2. Research Methods
2.2.1. Data Is Not Quantified
- (1)
- Select n regions and m indicators, then the value of the j-th indicator in the i-th region is (i = 1,2…n; j = 1,2,m).
- (2)
- Standardize the indicators: First, standardize the data to eliminate the dimension effect. The initial matrix X = xi, i = 1,2…n; j = 1,2,m; i is the number of variables; j is the number of indicators. The indicators are divided into positive indicators and negative indicators for unscrupulous tempering treatment. The specific method is as follows:
Non-Negativity Treatment of Normalized Data
2.2.2. Factor Analysis
2.2.3. Entropy Method
2.2.4. Combination Weight
2.2.5. Summary of TOPSIS
2.2.6. Coupling Coordination Degree
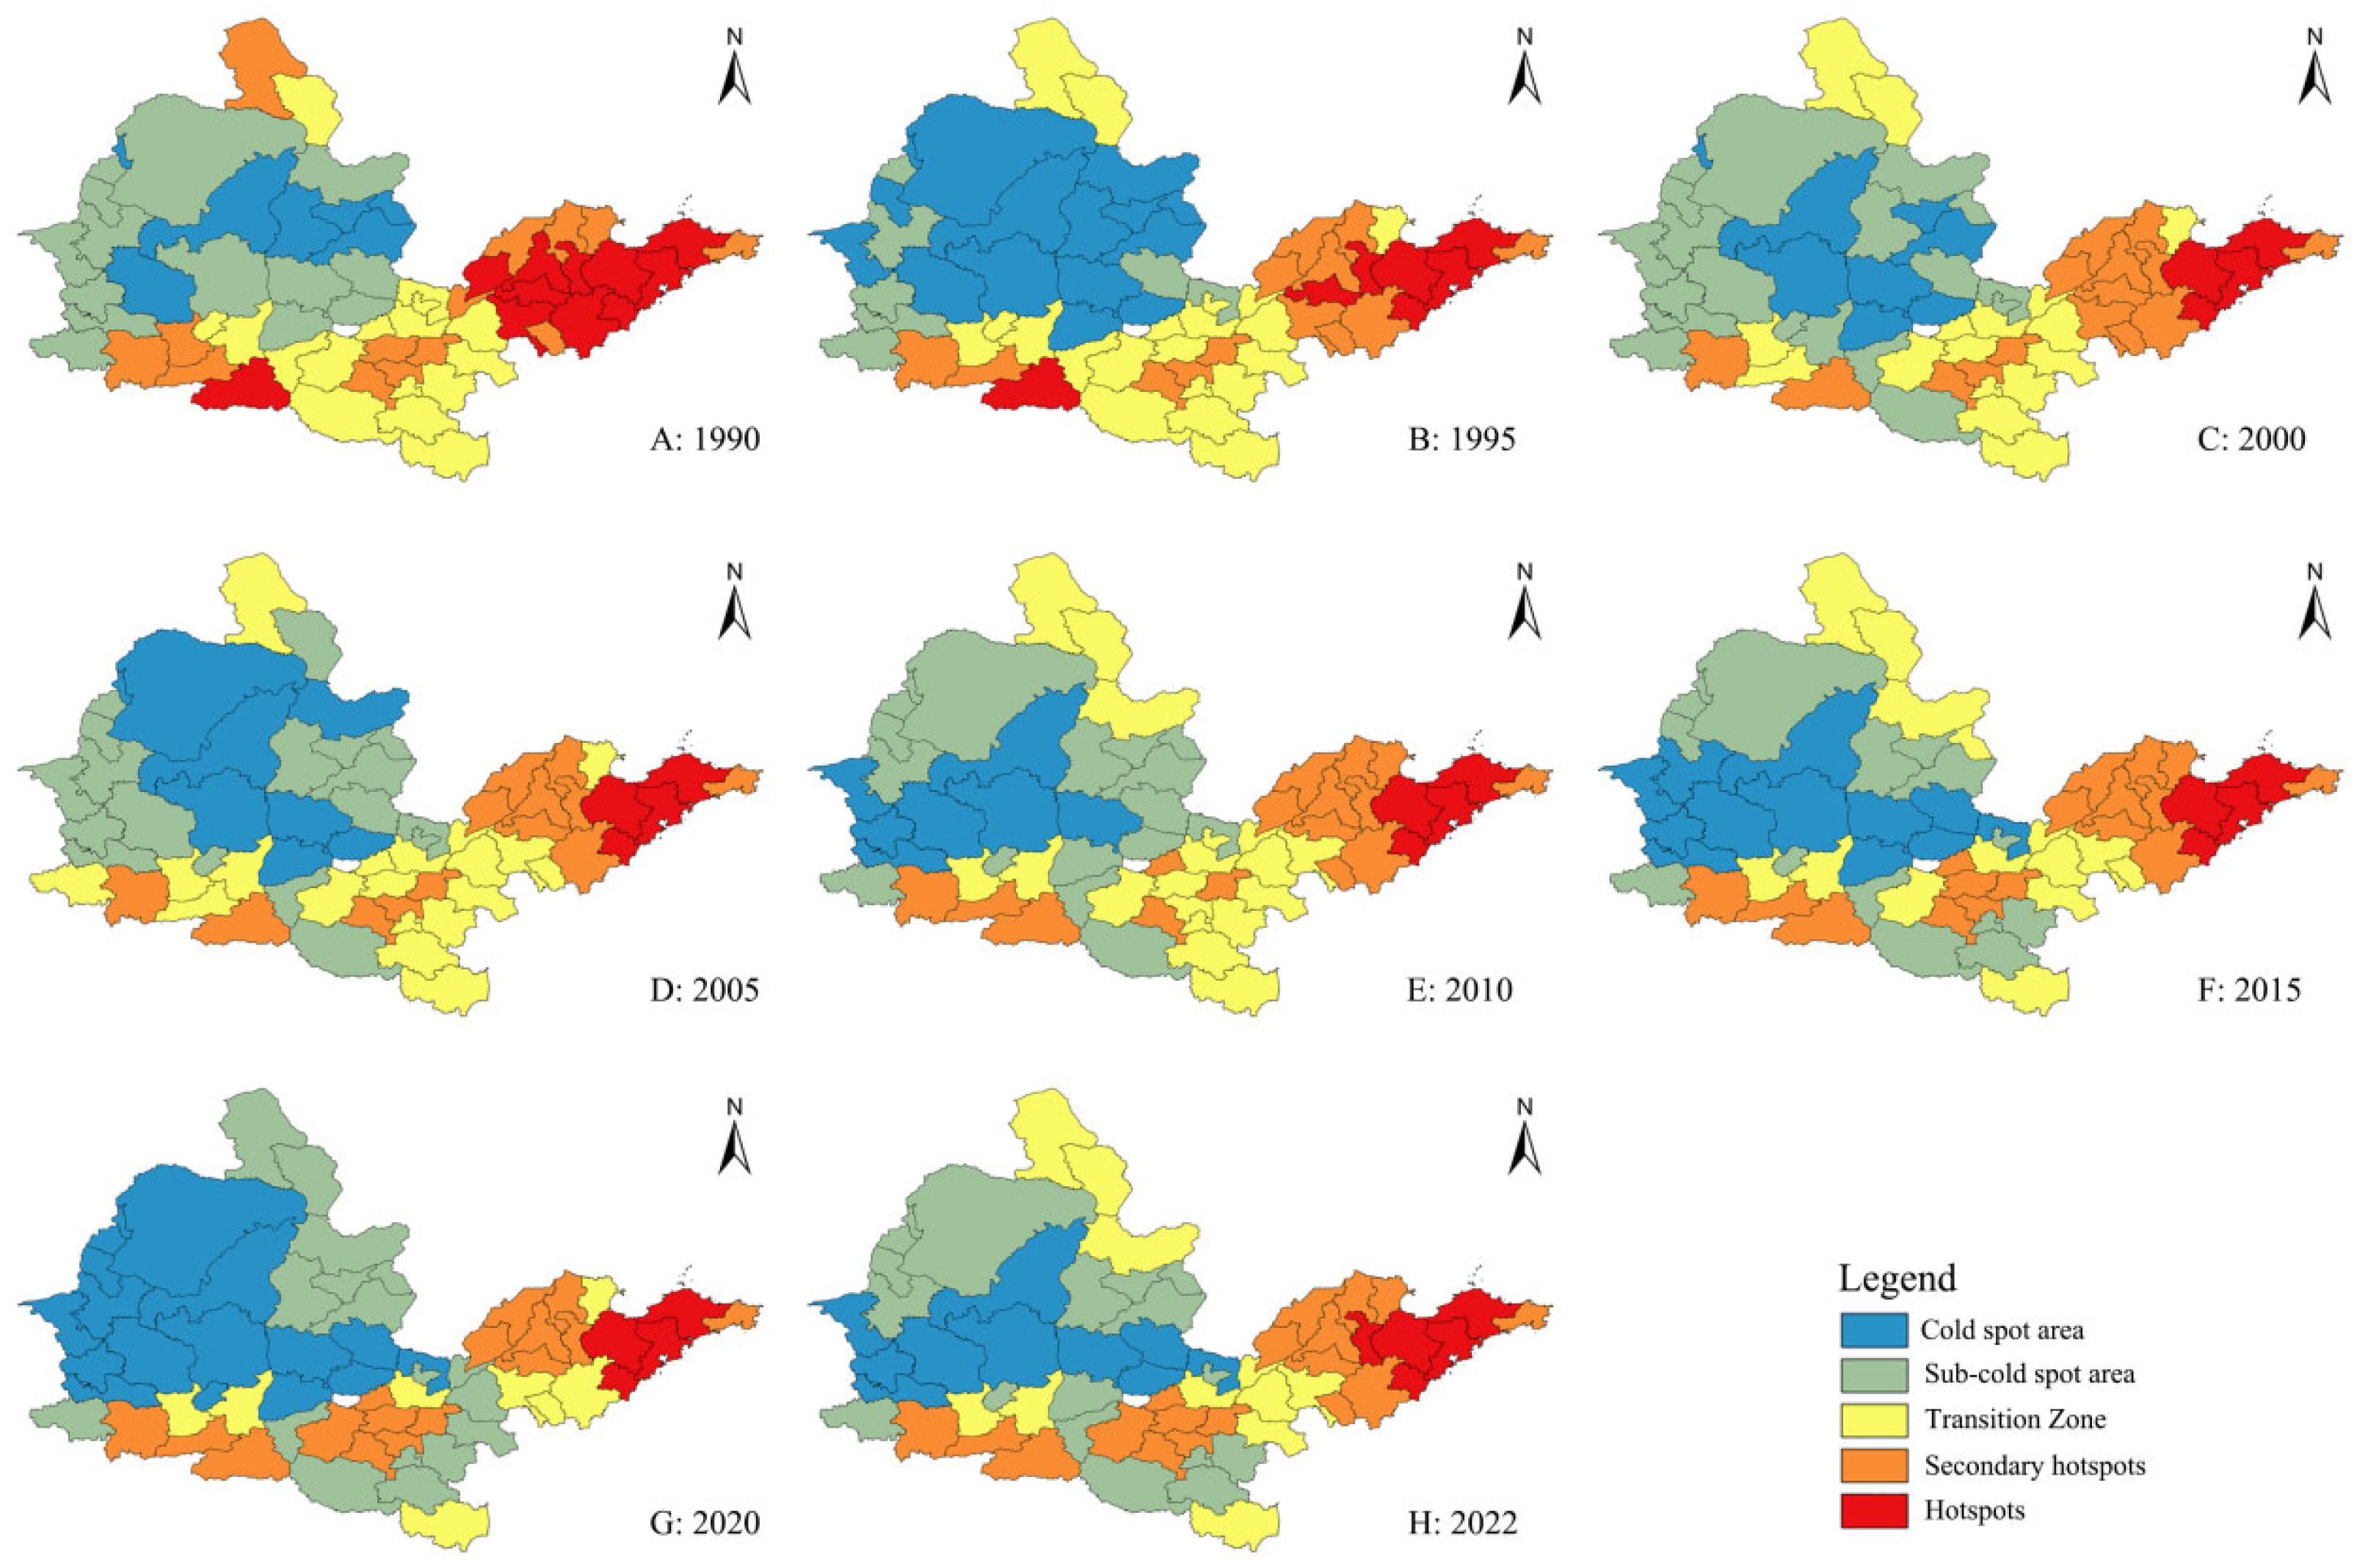
2.2.7. Spatial Distribution of Hot and Cold Spots
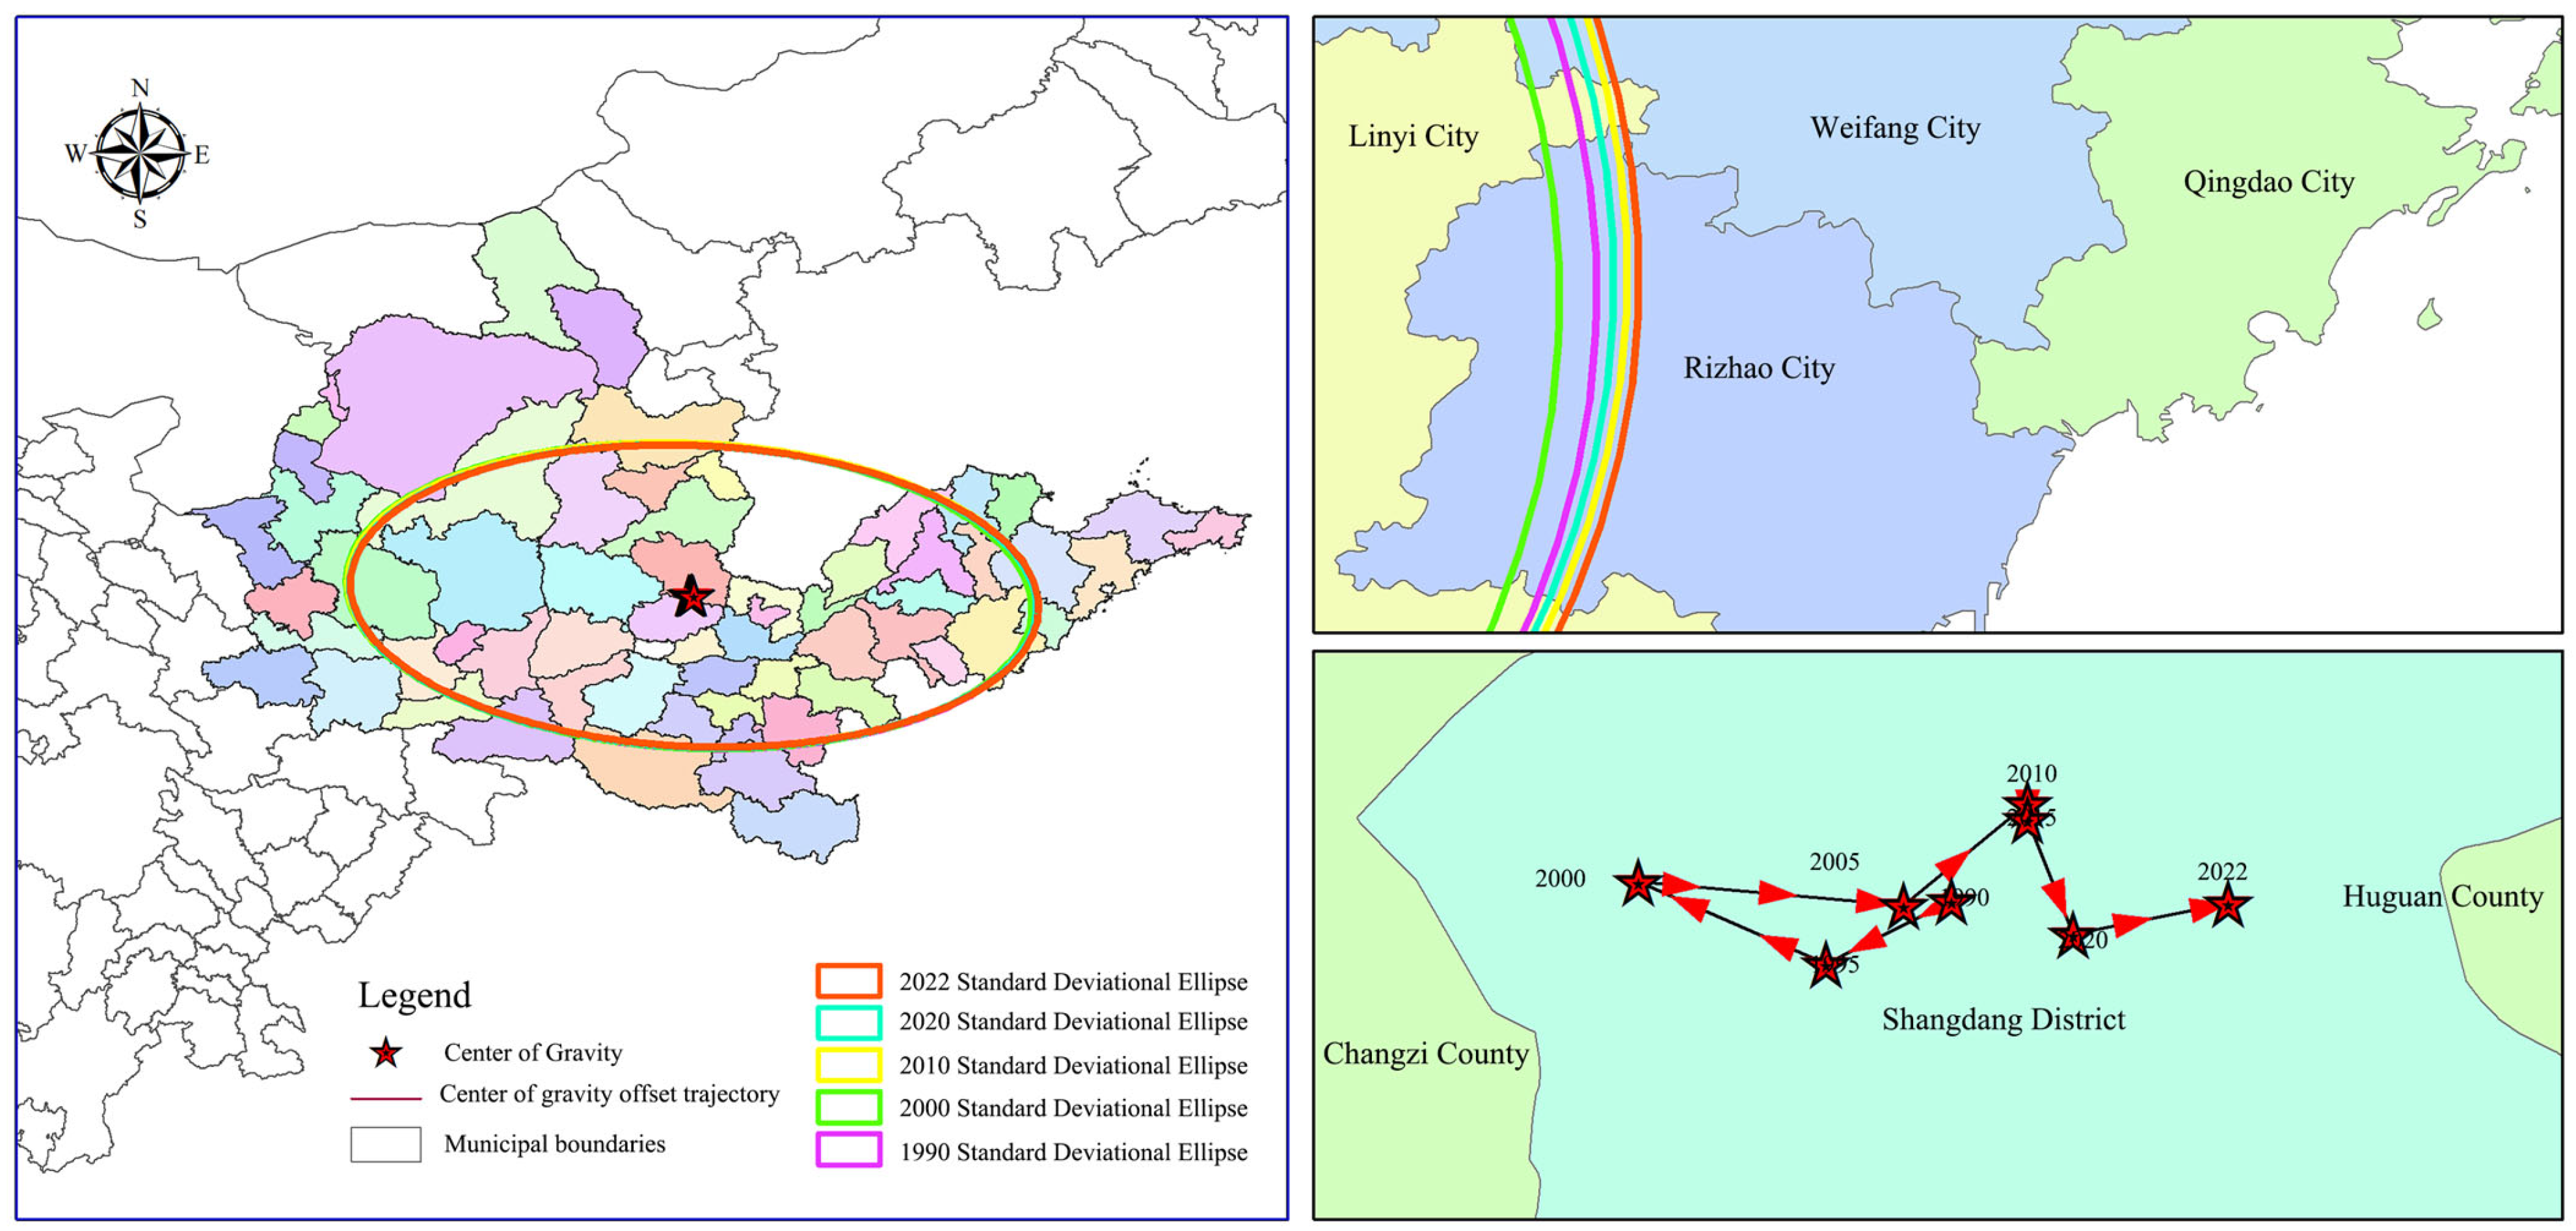
2.2.8. Spatial Center of Gravity Shift Model
2.2.9. Grey Correlation
3. Results
3.1. Ranking of Digital Economy and High-Quality Development of Urban Agglomerations
3.2. Coupling and Coordination Between Digital Economy and High-Quality Development
3.3. Spatial and Temporal Variation Trends of Hot and Cold Spots
3.4. Center of Gravity and Standard Deviation Ellipse Offset Trajectory
3.5. Digital Economy and Driving Factors of High-Quality Development in Urban Agglomerations
4. Discussion
5. Conclusions
Supplementary Materials
Author Contributions
Funding
Institutional Review Board Statement
Informed Consent Statement
Data Availability Statement
Conflicts of Interest
References
- Wang, Y. A Century of Great Changes, High-Quality Development, and Building a New Development Pattern. J. Manag. World 2020, 36, 1–13. [Google Scholar] [CrossRef]
- Zhang, W.; Zhao, S.; Wan, X.; Yao, Y. Study on the Effect of Digital Economy on High-Quality Economic Development in China. PLoS ONE 2021, 16, e0257365. [Google Scholar] [CrossRef] [PubMed]
- Wu, X.H.; Yu, C. The Impact of the Digital Economy on China’s Economic Growth and Productivity Performance. China Econ. J. 2022, 15, 153–170. [Google Scholar] [CrossRef]
- Zang, S. Digital Economy, Innovation Capability, and High-Quality Economic Development. Jiangsu Commer. Forum. 2024, 1, 22–27+36. [Google Scholar] [CrossRef]
- Jing, X.; Wang, L. On Political Courage and Political Discourse: Studying the “Decision of the CPC Central Committee on Further Comprehensively Deepening Reform and Promoting Chinese-Style Modernization”. J. Shanxi Norm. Univ. (Soc. Sci. Ed.) 2024, 52, 1–7. [Google Scholar] [CrossRef]
- Zhai, Y.; Cheng, Z.; He, Z.; Chen, S.; Tan, H.; Wu, G.; Sun, Y.; Zhang, C.; Zeng, R.; Yang, C.; et al. Coordinating the Construction of Digital China and Comprehensively Leading the New Era of Digital Intelligence: A Discussion on the “Overall Layout Plan for the Construction of Digital China. E-Government 2023, 2–22. [Google Scholar] [CrossRef]
- Wu, J.; Tao, C. Activating Data Elements to Empower Industries: A Policy Interpretation of the “Data Elements ×” Three-Year Action Plan (2024–2026). Inf. Stud. Theory Appl. 2024, 47, 16–19. [Google Scholar] [CrossRef]
- Ivus, O.; Boland, M. The Employment and Wage Impact of Broadband Deployment in Canada. Can. J. Econ. 2015, 48, 1803–1830. [Google Scholar] [CrossRef]
- Zhao, Y.; Zhang, Y. China’s Digital Economy Development Strategy under the Background of High-Quality Development: An Analysis of Digital Economy Development in RCEP Countries. Bus. Econ. 2024, 1–5+174. [Google Scholar] [CrossRef]
- Luo, K.; Liu, Y.; Chen, P.-F.; Zeng, M. Assessing the Impact of Digital Economy on Green Development Efficiency in the Yangtze River Economic Belt. Energy Econ. 2022, 112, 106127. [Google Scholar] [CrossRef]
- Liu, J.; Li, Y. The Impact of Digital Economy Development on Green Innovation Efficiency: From the Perspective of High-Quality Population Development. Front. Environ. Sci. 2022, 10, 1–20. [Google Scholar]
- Zhong, W.; Zheng, M.; Zhong, C. Digital Economy Development and Urban Low-Carbon Transformation: Impact Effects and Mechanisms. Stat. Decis. 2024, 40, 109–114. [Google Scholar] [CrossRef]
- Han, D.; Ding, Y.; Shi, Z.; He, Y. The Impact of Digital Economy on Total Factor Carbon Productivity: The Threshold Effect of Technology Accumulation. Environ. Sci. Pollut. Res. 2022, 29, 55691–55706. [Google Scholar] [CrossRef] [PubMed]
- Liu, Y.; X, Y. Does the Development of the Digital Economy Improve Urban Green Ecological Efficiency?—Empirical evidence based on data from 269 prefecture-level cities. J. Chengdu Univ. (Soc. Sci.) 2024, 50–66. Available online: https://link.cnki.net/urlid/51.1064.c.20241031.1446.014 (accessed on 1 September 2025).
- Peng, W.; Su, X. The impact of digital economy development on carbon emission efficiency in the Yangtze River Delta region—Based on the threshold effect of industrial agglomeration. Contemp. Financ. Econ. 2024, 126–139. [Google Scholar] [CrossRef]
- Tan, F.; Sun, C. Digital economy development drives urban carbon emission effects: From spatial spillover to spatial network. Environ. Sci. 2025, 46, 5441–5453. [Google Scholar] [CrossRef]
- Guan, H.; Guo, B.; Zhang, J. Study on the Impact of the Digital Economy on the Upgrading of Industrial Structures—Empirical Analysis Based on Cities in China. Sustainability 2022, 14, 11378. [Google Scholar] [CrossRef]
- Zhao, Y.; Lou, F. The Impact Mechanism of Digital Economy on Urban Economic Development—Based on the Mediating Effect of Industrial Structure Optimization and Residents’ Living Standards Improvement. J. Commer. Econ. 2024, 110–114. Available online: https://kns.cnki.net/kcms2/article/abstract?v=IPzr95zWmwTKofBBdUr8Jd9gy8u_fqRqAd55g3dpQGh3hjY1zMBF9gSqs53f-wS1Y3WamVhjiUiGsb3IvgQEF_YOADLX27blgDVOGuJ6Myjf_C_YOWYetBhp0ozLnuH6Jf11IribK93vB8StjbsfW0pI6nPq6UQzx7bYQ40d_fZZfBSBqh1eng==&uniplatform=NZKPT&language=CHS (accessed on 1 September 2025).
- Yang, C.; Yao, N. Measurement and Spatial-Temporal Differentiation of Digital Economy Development in the Yangtze River Delta Urban Agglomeration. Stat. Decis. 2024, 40, 117–121. [Google Scholar] [CrossRef]
- Tang, J.; Li, J.; Ding, W. Measurement and Spatial-Temporal Analysis of Digital Economy Development in the Yangtze River Delta Region. China J. Commer. 2024, 33, 40–44. [Google Scholar] [CrossRef]
- Li, Z.; Wang, J. The Dynamic Impact of Digital Economy on Carbon Emission Reduction: Evidence City-Level Empirical Data in China. J. Clean. Prod. 2022, 351, 131570. [Google Scholar] [CrossRef]
- Zhao, G.; Du, Y. Research on the Collaborative Governance of the 14th Five-Year Plan and the Short-Term Construction Plan. Plan 2020, 36, 14–21. [Google Scholar]
- Tao, Z.; Zhang, Z.; Shangkun, L. Digital Economy, Entrepreneurship, and High-Quality Economic Development: Empirical Evidence from Urban China. J. Manag. World 2020, 36, 65–76. [Google Scholar] [CrossRef]
- Katehakis, D.G.; Filippidis, D.; Karamanis, K.; Kouroubali, A.; Farmaki, A.; Natsiavas, P.; Krithara, A.; Christodoulou, E.G.; Antonakakis, M.; Plexousakis, D. The smartHEALTH European Digital Innovation Hub Experiences and Challenges for Accelerating the Transformation of Public and Private Organizations within the Innovation Ecosystem. Front. Med. 2024, 11, 1503235. [Google Scholar] [CrossRef] [PubMed]
- Butter, M.; Gijsbers, G.; Goetheer, A.; Karanikolova, K. Digital Innovation Hubs and Their Position in the European, National and Regional Innovation Ecosystems; Springer International Publishing: Cham, Switzerland, 2019; pp. 45–60. [Google Scholar]
- Bănică, A.; Ţigănaşu, R.; Nijkamp, P.; Kourtit, K. Institutional Quality in Green and Digital Transition of EU Regions–A Recovery and Resilience Analysis. Glob. Chall. 2024, 8, 2400031. [Google Scholar] [CrossRef]
- Yue, W.; Xia, H.; Zhang, X. Rethinking the Territorial Spatial Governance System for Urban Agglomerations with High-Quality Development: A Case Study of the Yangtze River Delta Urban Agglomeration and the Guangdong-Hong Kong-Macao Greater Bay Area. Trop. Geogr. 2024, 44, 2129–2141. [Google Scholar] [CrossRef]
- Huang, G.; Li, X.; Zhang, W.; Lin, J.; Tian, L.; Zhang, J.; Zhu, J.; Wang, S.; Ye, Y.; Li, Z. Urban Renewal in China under the Context of High-Quality Development Transformation: Challenges and Paths. J. Nat. Resour. 2025, 40, 1–19. [Google Scholar] [CrossRef]
- Song, J.; Yuan, M.; Zhang, L. Spatial Effects of New Urbanization on Regional High-Quality Development: A Case Study of the Middle Yangtze River Urban Agglomeration. Econ. Geogr. 2024, 44, 43–51. [Google Scholar] [CrossRef]
- Liu, F. Research on the Path of High-Quality Urban Development Based on the Basic Laws of Urban Development. Shanghai Urban Manag. 2024, 33, 75–79. [Google Scholar]
- Yuan, T.; Xiang, Y.; Xiong, L. Driving Forces and Obstacles Analysis of Urban High-Quality Development in Chengdu. Sci. Rep. 2024, 14, 24530. [Google Scholar] [CrossRef]
- Wang, Y. Ensuring High-Quality Sustainable Urban Development Based on Optimizing Urban Functions in China. Modern Managerial and Socio-Economic Aspects of the Development of the State, Regions and Business Entities in the Context of the Transformation of Public Administration: Proceedings of the IV International Scientific and Practical Conference. 2021. Available online: https://scholar.google.com/scholar?hl=en&as_sdt=0%2C5&q=Ensuring+High-Quality+Sustainable+Urban+Development+Based+on+Optimizing+Urban+Functions+in+China.&btnG= (accessed on 1 September 2025).
- Ming, C.; Peng, H. Digital Economy, High-Quality Urban Economic Development, and Spatial Spillover Effects: An Empirical Study of 26 Cities in the Yangtze River Delta. East China Econ. Manag. 2024, 38, 25–35. [Google Scholar] [CrossRef]
- Zhou, H.; Yang, Z.; Cui, X.; Wang, S. Research on the Impact Mechanism of Digital Economy Development on Urban Economic Resilience: Based on the Mediating Effect of Entrepreneurship. Soft Sci. 2024, 38, 23–30. [Google Scholar] [CrossRef]
- Ye, X.; Wang, J.; Sun, R. The Coupling and Coordination Relationship of the Digital Economy and Tourism Industry from the Perspective of Industrial Integration. Eur. J. Innov. Manag. 2022, 27, 1182–1205. [Google Scholar] [CrossRef]
- Chen, H.; Li, J. Spatial Spillover Effects of High-Quality Development of the Yangtze River Delta Urban Agglomeration on Carbon Emission Intensity. Ecol. Econ. 2024, 40, 77–86. [Google Scholar]
- Du, G.F.; Long, Z.W. Evaluation of Digital Economy Development Level in Hunan Province Based on Entropy Weight-TOPSIS Method. Math. Pract. Theory 2023, 53, 257–266. Available online: https://link.cnki.net/urlid/11.2018.O1.20230926.1528.002 (accessed on 1 September 2025).
- Zhu, J.; Li, J. How Does Digital Economy Promote the Export Upgrading of China’s Urban Manufacturing Industry?—An Empirical Analysis Based on the Mediation Effect Model and the Spatial Durbin Model. Reform Econ. System 2024, 184–192. Available online: https://kns.cnki.net/kcms2/article/abstract?v=IPzr95zWmwThzmLzzcCYhVWSm-PZsktEk6vUXMRda9ECWH34Mi6vxGgga8EHkFCwB6feN7-74UdsY1Ymda9tPs6jTvJdxDmFsZW_uDpIUP4oUili_zGeJLBA76v83hmaP_FMQyhOwnF85YS_MJWBD2LXvs17vo-FLzzY1qFcIx7kIn8QsfMjDw==&uniplatform=NZKPT&language=CHS (accessed on 1 September 2025).
- Ma, Y.; Qiu, W.; Wang, X. Urban Infrastructure, Technological Innovation, and Regional Economic Development: An Analysis Based on the Mediation Effect and Panel Threshold Model. J. Ind. Technol. Econ. 2019, 38, 116–123. [Google Scholar]
- Tian, X.; Li, R. Digital Technology Empowers the Transformation and Development of the Real Economy: An Analytical Framework Based on Schumpeter’s Endogenous Growth Theory. J. Manag. World 2022, 38, 56–73. [Google Scholar] [CrossRef]
- He, D.H. China’s Actions on Sustainability and High-Quality Economic and Social Development. J. Shanxi Univ. (Philos. Soc. Sci. Ed.) 2024, 47, 1–11. [Google Scholar] [CrossRef]
- Wang, Y.; Yu, H. New Quality Productivity and China’s High-Quality Development: An Analysis from the Perspective of New Structural Economics. Sci. Social. 2024, 13–21. Available online: https://kns.cnki.net/kcms2/article/abstract?v=IPzr95zWmwTdp3MGRGmLXHaZ6SbLe-E7lJDsH_ZtDo8pF2YT8yUzanWBzGjeNOW0_R7N44n3pwX94N6TClERh8UGlPkddGtYovniw4DTe3r1-JMCkH866hghrApLpCpLQ374IY1DGycmcAE0nsZZSai2JIfzZ9wj3SEsHOOeEYqeJiZz2MpPzw==&uniplatform=NZKPT&language=CHS (accessed on 1 September 2025).
- Fang, Y.; Yu, J.; Chen, F.; Meng, Q. Digital Technology-Driven Industrial Innovation System: Theoretical Framework and Practical Implications. Sci. Sci. Manag. S.&T. 2025, 46, 79–91. [Google Scholar] [CrossRef]
- Ru, L.; Wang, P.; Lu, Y. An Empirical Investigation into the Effects of the Digital Economy on Regional Integration: Evidence from Urban Agglomeration in China. Sustainability 2024, 16, 7760. [Google Scholar] [CrossRef]
- Gu, H.; Guo, G.; Li, C. Treating the Symptoms as Well as the Root Causes: How the Digital Economy Can Mitigate the Negative Impacts of Land Resource Mismatches on Urban Ecological Resilience. Land 2024, 13, 1463. [Google Scholar] [CrossRef]
- Zhou, S.; Yu, S. Do Digital Economy and Collaborative Governance of Digital Economy Affect the High-Quality Urban Development? Int. J. Innov. Comput. Inf. Control 2024, 20, 635–642. [Google Scholar]
- Ren, J.; Li, Y.; Zhang, J.; Xu, H.; Hao, C. Does Urban Shrinkage Equate to a Decline in Development Levels?–Urban Development Measurement and Influencing Factors Analysis. Environ. Impact Assess. Rev. 2024, 105, 107401. [Google Scholar] [CrossRef]
- Meng, W.; Liu, H.; Zhang, Y. Measurement and Characteristic Analysis of Green Development Efficiency in the Seven Urban Agglomerations in the Yellow River Basin. Arid. Land Geogr. 2022, 46, 846–856. [Google Scholar]
- Li, Z.; Li, Z.; Gao, W. Evaluation of the Coordination Level of Energy-Economy-Environment-Technology Coupling in the Urban Agglomerations in the Yellow River Basin. Stat. Decis. 2023, 39, 88–91. [Google Scholar] [CrossRef]
- Wang, S.; Ning, W.; Niu, J.; An, K. Study on the Spatiotemporal Differentiation and Convergence of Ecological Resilience in Cities in the Yellow River Basin: An Empirical Analysis of 61 Cities in the Seven Urban Agglomerations. Arid. Land Geogr. 2024, 47, 93–103. [Google Scholar]
- Zhang, D.; Zhu, Z. Evaluation of China’s Business Environment Based on Factor Analysis and Entropy Method. Financ. Account. Mon. 2019, 124–130. [Google Scholar] [CrossRef]
- Zhu, Y.; Liu, H.; Zhou, Z. Bank Performance Evaluation Based on Improved Factor Analysis and Entropy Method. Friends Account. 2014, 79–82. [Google Scholar]
- Li, J.; Ning, J.; Song, J.; Chen, X. Analysis of the Spatial Mismatch Pattern of Net Carbon in Agriculture and Its Influencing Factors. Impact Assess. Rev. 2024, 106, 107522. [Google Scholar] [CrossRef]
- Wu, T.; Shao, W. Research on the Effects and Mechanisms of Digital Economy in Promoting High-Quality Economic Development: An Analysis Based on Panel Data of 41 Cities in the Yangtze River Delta. Price Theory Pract. 2024, 154–159+230. [Google Scholar] [CrossRef]
- Wu, H.; Zhou, W. The Impact of Digital Economy on Regional Coordinated Development from the Perspective of High-Quality and Shared Development. Econ. Probl. 2025, 121–129. [Google Scholar] [CrossRef]
- Wang, J.; Wang, B.; Dong, K.; Dong, X. How Does the Digital Economy Improve High-Quality Energy Development? The Case of China. Technol. Forecast. Soc. Chang. 2022, 184, 121960. [Google Scholar] [CrossRef]
- Ding, C.; Liu, C.; Zheng, C.; Li, F. Digital Economy, Technological Innovation and High-Quality Economic Development: Based on Spatial Effect and Mediation Effect. Sustainability 2021, 14, 216. [Google Scholar] [CrossRef]
- Zhao, Y.; Gu, J. Technological and Institutional Collaborative Innovation Mechanism and Its Synergistic Effect on Industrial Upgrading. Forum Sci. Technol. China 2018, 1–9. [Google Scholar] [CrossRef]
- Krugman, P. Increasing Returns and Economic Geography; National Bureau of Economic Research: Cambridge, MA, USA, 1990. [Google Scholar]
- Zhu, W.; Chen, J. The spatial analysis of digital economy and urban development: A case study in Hangzhou, China. Cities 2022, 123, 103563. [Google Scholar] [CrossRef]
- Yang, H.; Xu, X. Coupling and Coordination Analysis of Digital Economy and Green Agricultural Development: Evidence from Major Grain Producing Areas in China. Sustainability 2024, 16, 4533. [Google Scholar] [CrossRef]
- Tang, X.; Xu, Y.; Xie, S. How does the digital economy and data factor allocation affect the improvement of urban high-quality development?—Evidence from the Yangtze River Economic Belt. Sci. Sci. Manag. S. T. 2025, 46, 39–53. [Google Scholar] [CrossRef]
- Ma, D.; Zhu, Q. Innovation in Emerging Economies: Research on the Digital Economy Driving High-Quality Green Development. J. Bus. Res. 2022, 145, 801–813. [Google Scholar] [CrossRef]
- Wang, L.; Chen, L.; Li, Y. Digital Economy and Urban Low-Carbon Sustainable Development: The Role of Innovation Factor Mobility in China. Environ. Sci. Pollut. Res. 2022, 29, 48539–48557. [Google Scholar] [CrossRef] [PubMed]
- Zhang, J.; Lyu, Y.; Li, Y.; Geng, Y. Digital Economy: An Innovation Driving Factor for Low-Carbon Development. Environ. Impact Assess. Rev. 2022, 96, 106821. [Google Scholar] [CrossRef]
- Bliese, D.P.; Schepker, J.D.; Essman, M.S.; Ployhart, E.R. Bridging Methodological Divides between Macro-and Microresearch: Endogeneity and Methods for Panel Data. J. Manag. 2020, 46, 70–99. [Google Scholar] [CrossRef]
- Zhang, W.; Wu, J. Endogenous Growth and Data Heterogeneity in Data Economics. Financ. Res. Lett. 2025, 78, 107185. [Google Scholar] [CrossRef]
- Hill, D.A.; Johnson, G.S.; Greco, M.L.; O’Boyle, H.E.; Walter, L.S. Endogeneity: A Review and Agenda for the Methodology-Practice Divide Affecting Micro and Macro Research. J. Manag. 2021, 47, 105–143. [Google Scholar] [CrossRef]
- Qu, J.; Hao, X. Digital Economy, Financial Development, and Energy Poverty Based on Mediating Effects and a Spatial Autocorrelation Model. Sustainability 2022, 14, 9206. [Google Scholar] [CrossRef]
- Kopczewska, K. Spatial Machine Learning: New Opportunities for Regional Science. Ann. Reg. Sci. 2022, 68, 713–755. [Google Scholar] [CrossRef]
- Xiao, Y.; Gong, P. Removing Spatial Autocorrelation in Urban Scaling Analysis. Cities 2022, 124, 103600. [Google Scholar] [CrossRef]




| KMO | 0.915 | |
|---|---|---|
| Bartlett’s test of sphericity | Approximate Chi-Square | 301,501.329 |
| Degrees of freedom (df) | 1035 | |
| Significance (p) | 0.000 | |
| System Layer | Criteria Layer | Indicator Layer | Entropy Method | Factor Analysis | Comprehensive Weight |
|---|---|---|---|---|---|
| Coupling and coordination effects of digital economy and high-quality urban development | Economic Development | Regional GDP growth rate | 0.001 | 0.015 | 0.013 |
| Gross Regional Product | 0.027 | 0.028 | 0.024 | ||
| Number of industrial enterprises above designated size | 0.019 | 0.024 | 0.019 | ||
| Number of foreign-invested enterprises | 0.055 | 0.018 | 0.041 | ||
| Total fixed asset investment | 0.036 | 0.025 | 0.028 | ||
| General fiscal revenue | 0.035 | 0.027 | 0.028 | ||
| GDP per capita | 0.019 | 0.023 | 0.019 | ||
| Shared Development | Number of employees at the end of the year | 0.023 | 0.019 | 0.019 | |
| Average salary of employees | 0.016 | 0.026 | 0.020 | ||
| Number of hospitals and health centers | 0.010 | 0.018 | 0.013 | ||
| Number of doctors | 0.012 | 0.029 | 0.022 | ||
| Number of urban employees covered by basic pension insurance | 0.016 | 0.026 | 0.020 | ||
| Number of participants in unemployment insurance | 0.016 | 0.027 | 0.021 | ||
| Number of beds in social work institutions providing accommodation | 0.013 | 0.019 | 0.015 | ||
| Green Development | Industrial sulfur dioxide emissions | 0.001 | 0.017 | 0.014 | |
| Industrial smoke emissions | 0.000 | 0.014 | 0.013 | ||
| Industrial smoke and dust emissions | 0.000 | 0.009 | 0.008 | ||
| Harmless treatment rate of domestic waste | 0.005 | 0.017 | 0.013 | ||
| Comprehensive utilization rate of general industrial solid waste | 0.004 | 0.016 | 0.012 | ||
| Centralized treatment rate of sewage treatment plants | 0.002 | 0.016 | 0.013 | ||
| Annual average concentration of inhalable fine particulate matter | 0.013 | 0.012 | 0.011 | ||
| Education Development | Education expenditure | 0.026 | 0.026 | 0.023 | |
| Number of employees in the culture, sports and entertainment industries | 0.046 | 0.018 | 0.034 | ||
| Number of secondary vocational education/general colleges and universities | 0.013 | 0.024 | 0.018 | ||
| Secondary vocational education/full-time teachers in general colleges and universities | 0.046 | 0.024 | 0.034 | ||
| Number of college students per 10,000 people | 0.017 | 0.020 | 0.017 | ||
| Public Library | 0.007 | 0.025 | 0.019 | ||
| Public library books per 100 people | 0.023 | 0.010 | 0.017 | ||
| Technological Development | Science spending | 0.053 | 0.023 | 0.039 | |
| Employment in the Information Transmission, Computer Services, and Software Sectors | 0.036 | 0.029 | 0.029 | ||
| Employment in Scientific Research, Technical Services, and Geological Exploration Sectors | 0.033 | 0.026 | 0.026 | ||
| Number of Employees Engaged in R&D Activities | 0.031 | 0.023 | 0.024 | ||
| Internal R&D expenditure | 0.055 | 0.011 | 0.043 | ||
| Number of patent applications | 0.040 | 0.023 | 0.030 | ||
| Digital Economic Development | Total Local Telephone Subscribers by Year-End | 0.017 | 0.027 | 0.020 | |
| Number of mobile phone users at the end of the year | 0.026 | 0.028 | 0.024 | ||
| International Internet users | 0.033 | 0.026 | 0.026 | ||
| Number of employees in transportation, warehousing, post and telecommunications industries | 0.023 | 0.025 | 0.021 | ||
| Number of Internet broadband access users | 0.036 | 0.029 | 0.029 | ||
| Industrial development of digital economy | The added value of the primary industry accounts for the proportion of GDP | 0.008 | 0.025 | 0.019 | |
| The added value of the secondary industry accounts for the proportion of GDP | 0.003 | 0.016 | 0.012 | ||
| The added value of the tertiary industry accounts for the proportion of GDP | 0.002 | 0.025 | 0.020 | ||
| Aggregate Profits of Industrial Enterprises above the Designated Size Threshold | 0.009 | 0.022 | 0.016 | ||
| Aggregate Retail Sales of Consumer Goods | 0.032 | 0.027 | 0.026 | ||
| Postal business volume | 0.043 | 0.023 | 0.032 | ||
| Total telecommunications business | 0.024 | 0.021 | 0.020 |
| D | 0~0.1 | 0.1~0.2 | 0.2~0.3 | 0.3~0.4 | 0.4~0.5 |
| Coupling coordination | Extremely disordered | Serious disorder | Moderate Disorder | Mild disorder | On the verge of disorder |
| D | 0.5~0.6 | 0.6~0.7 | 0.7~0.8 | 0.8~0.9 | 0.9~1 |
| Coupling coordination | Barely out of tune | Primary Coordination | Intermediate Coordination | Good coordination | High-quality coordination |
| 1990 | Ranking | 1995 | Ranking | 2000 | Ranking | 2005 | Ranking |
|---|---|---|---|---|---|---|---|
| GDP per capita | 1 | Number of hospitals and health centers | 1 | Number of public libraries | 1 | Number of public libraries | 1 |
| Number of hospitals and health centers | 2 | Education expenditure | 2 | Number of hospitals and health centers | 2 | Education expenditure | 2 |
| Number of employees in information transmission, computer services and software industries | 3 | GDP per capita | 3 | Education expenditure | 3 | Harmless treatment rate of domestic waste | 3 |
| Harmless treatment rate of domestic waste | 4 | Number of employees in information transmission, computer services and software industries | 4 | GDP per capita | 4 | Number of hospitals and health centers | 4 |
| Number of industrial enterprises above designated size | 5 | Number of public libraries | 5 | Harmless treatment rate of domestic waste | 5 | GDP per capita | 5 |
| Number of public libraries | 6 | Harmless treatment rate of domestic waste | 6 | Number of employees in information transmission, computer services and software industries | 6 | Postal business volume | 6 |
| Number of employees in transportation, warehousing, post and telecommunications industries | 7 | Number of industrial enterprises above designated size | 7 | Number of industrial enterprises above designated size | 7 | Number of employees in information transmission, computer services and software industries | 7 |
| Total telecommunications business | 8 | Number of employees in transportation, warehousing, post and telecommunications industries | 8 | Science spending | 8 | Annual average concentration of inhalable fine particulate matter | 8 |
| Education expenditure | 9 | Total telecommunications business | 9 | Annual average concentration of inhalable fine particulate matter | 9 | Science spending | 9 |
| Postal business volume | 10 | Postal business volume | 10 | Total telecommunications business | 10 | Total telecommunications business | 10 |
| Annual average concentration of inhalable fine particulate matter | 11 | Science spending | 11 | Number of employees in transportation, warehousing, post and telecommunications industries | 11 | Number of employees in transportation, warehousing, post and telecommunications industries | 11 |
| Science spending | 12 | Annual average concentration of inhalable fine particulate matter | 12 | Postal business volume | 12 | International Internet users | 12 |
| International Internet users | 13 | International Internet users | 13 | International Internet users | 13 | Number of industrial enterprises above designated size | 13 |
| 2010 | Ranking | 2015 | Ranking | 2020 | Ranking | 2022 | |
| Harmless treatment rate of domestic waste | 1 | Harmless treatment rate of domestic waste | 1 | Harmless treatment rate of domestic waste | 1 | Harmless treatment rate of domestic waste | 1 |
| Number of public libraries | 2 | Number of public libraries | 2 | Annual average concentration of inhalable fine particulate matter | 2 | Annual average concentration of inhalable fine particulate matter | 2 |
| Education expenditure | 3 | Annual average concentration of inhalable fine particulate matter | 3 | Number of public libraries | 3 | Number of public libraries | 3 |
| Annual average concentration of inhalable fine particulate matter | 4 | Education expenditure | 4 | GDP per capita | 4 | GDP per capita | 4 |
| Number of hospitals and health centers | 5 | GDP per capita | 5 | Education expenditure | 5 | Education expenditure | 5 |
| Postal business volume | 6 | Number of hospitals and health centers | 6 | International Internet users | 6 | Number of hospitals and health centers | 6 |
| GDP per capita | 7 | International Internet users | 7 | Number of hospitals and health centers | 7 | International Internet users | 7 |
| International Internet users | 8 | Total telecommunications business | 8 | Number of industrial enterprises above designated size | 8 | Total telecommunications business | 8 |
| Number of employees in information transmission, computer services and software industries | 9 | Number of employees in transportation, warehousing, post and telecommunications industries | 9 | Total telecommunications business | 9 | Number of industrial enterprises above designated size | 9 |
| Science spending | 10 | Postal business volume | 10 | Number of employees in transportation, warehousing, post and telecommunications industries | 10 | Number of employees in transportation, warehousing, post and telecommunications industries | 10 |
| Number of employees in transportation, warehousing, post and telecommunications industries | 11 | Number of industrial enterprises above designated size | 11 | Postal business volume | 11 | Postal business volume | 11 |
| Total telecommunications business | 12 | Number of employees in information transmission, computer services and software industries | 12 | Science spending | 12 | Science spending | 12 |
| Number of industrial enterprises above designated size | 13 | Science spending | 13 | Number of employees in information transmission, computer services and software industries | 13 | Number of employees in information transmission, computer services and software industries | 13 |
Disclaimer/Publisher’s Note: The statements, opinions and data contained in all publications are solely those of the individual author(s) and contributor(s) and not of MDPI and/or the editor(s). MDPI and/or the editor(s) disclaim responsibility for any injury to people or property resulting from any ideas, methods, instructions or products referred to in the content. |
© 2025 by the authors. Licensee MDPI, Basel, Switzerland. This article is an open access article distributed under the terms and conditions of the Creative Commons Attribution (CC BY) license (https://creativecommons.org/licenses/by/4.0/).
Share and Cite
Li, Y.; Xu, B.; Wan, Y.; Li, Y.; Li, H. Digital Economy, Spatial Imbalance, and Coordinated Growth: Evidence from Urban Agglomerations in the Middle and Lower Reaches of the Yellow River Basin. Sustainability 2025, 17, 9743. https://doi.org/10.3390/su17219743
Li Y, Xu B, Wan Y, Li Y, Li H. Digital Economy, Spatial Imbalance, and Coordinated Growth: Evidence from Urban Agglomerations in the Middle and Lower Reaches of the Yellow River Basin. Sustainability. 2025; 17(21):9743. https://doi.org/10.3390/su17219743
Chicago/Turabian StyleLi, Yuan, Bin Xu, Yuxuan Wan, Yan Li, and Hui Li. 2025. "Digital Economy, Spatial Imbalance, and Coordinated Growth: Evidence from Urban Agglomerations in the Middle and Lower Reaches of the Yellow River Basin" Sustainability 17, no. 21: 9743. https://doi.org/10.3390/su17219743
APA StyleLi, Y., Xu, B., Wan, Y., Li, Y., & Li, H. (2025). Digital Economy, Spatial Imbalance, and Coordinated Growth: Evidence from Urban Agglomerations in the Middle and Lower Reaches of the Yellow River Basin. Sustainability, 17(21), 9743. https://doi.org/10.3390/su17219743


