Abstract
This study introduces a parametric multi-objective optimization framework for urban block morphology. It integrates micro-climate data corrected by the Urban Weather Generator (UWG), energy simulation through EnergyPlus and Honeybee, and the Non-dominated Sorting Genetic Algorithm II (NSGA-II) within the Wallacei platform. Using Wuhan, China, a city with a representative hot-summer and cold-winter climate, as a case study, the framework simultaneously optimizes three key objectives: Average Sunshine Hours (Av.SH), Energy Use Intensity (EUI), and Average Universal Thermal Climate Index (Av.UTCI). The framework systematically links parametric modeling, environmental simulation, and evolutionary optimization to explore how block typologies and height configurations affect the trade-offs among solar access, energy demand, and outdoor thermal comfort. Among the feasible solutions, Av.SH exhibits the greatest variation, ranging from 4.30 to 7.93 h, followed by Av.UTCI (44.13 to 45.46 °C), while EUI shows the least fluctuation, from 91.69 to 93.36 kWh/m2. Key design variables, such as building type and height distribution, critically influence the outcomes. Optimal configurations are achieved by interweaving low-rise (2 to 3 floors), mid-rise (6 to 8 floors), and high-rise (15 to 20 floors) buildings to enhance openness and ventilation. The proposed framework offers a quantifiable strategy for guiding future climate-responsive and energy-efficient neighborhood design.
1. Introduction
As global climate change escalates, the building sector’s role in energy consumption and carbon emissions has made its sustainability a strategic priority worldwide. This is particularly critical for China, which is undergoing rapid urbanization while heavily reliant on coal-based energy. Inefficient building energy management directly challenges China’s “dual carbon” goals. Consequently, enhancing building energy efficiency is urgent, and urban form optimization has emerged as a crucial pathway to reconcile energy savings with environmental comfort [1,2,3,4,5].
Extensive research has established that urban morphology significantly influences building energy demand and microclimate conditions [6,7,8]. Studies have progressively employed multi-objective optimization (MOO) frameworks, often integrating parametric modeling with algorithms like NSGA-II, to navigate the complex trade-offs between objectives such as energy use intensity (EUI) and solar access [9,10,11]. However, a discernible gap persists in the current literature. Firstly, many studies prioritize energy efficiency as the primary goal, often treating outdoor thermal comfort, a crucial determinant of livability and public health, as a secondary consideration or excluding it from the core optimization objectives [12,13]. Secondly, while Multi-objective optimization is widely applied, many frameworks rely on standard meteorological data [14,15,16,17,18], failing to account for the localized urban heat island effect and microclimatic variations generated by the urban form itself, which can significantly alter building energy loads and outdoor comfort conditions [14]. This omission can lead to optimization results that are less representative of actual urban environments. Consequently, there is a pressing need for an integrated optimization framework that simultaneously addresses energy consumption, solar potential, and outdoor thermal comfort under morphologically influenced microclimatic conditions.
To address this gap, this study proposes a novel multi-objective optimization framework that integrates an Urban Weather Generator (UWG)-corrected microclimate model into the design feedback loop. Focusing on the neighborhood scale, the framework simultaneously optimizes three conflicting objectives: Energy Use Intensity (EUI), average sunlight hours (Av.SH), and the outdoor Universal Thermal Climate Index (Av.UTCI). Using a case study in Wuhan, China, a representative city with a hot-summer-cold-winter climate, this research demonstrates how the proposed method can identify urban block configurations that effectively balance energy efficiency, solar access, and thermal comfort under realistic urban microclimatic conditions. The primary contribution of this work is to provide a more holistic and climatically responsive approach to sustainable urban design, moving beyond energy-centric optimization towards the creation of truly high-performance and livable urban neighborhoods.
2. Literature Review
2.1. Urban Form and Building Energy Consumption
The correlation between urban morphology and building energy usage has been thoroughly investigated using several analytical techniques and case studies. A substantial corpus of research has concentrated on the empirical analysis and quantitative evaluation of the influence of urban form characteristics—such as building density, configuration, type, and land-use structure—on building energy consumption (notably heating and cooling), related carbon dioxide emissions, and energy and material flows at the urban level, along with the fundamental mechanisms that drive these effects. Salat (2009) [19] performed a comprehensive analysis of Paris. Liu et al. (2012) [20] examined residential heating in Dublin, Krüger et al. (2012) [21] established an indicator classification utilizing 3D models, Zhang et al. (2014) [22] analyzed urban energy metabolism networks, Vartholomaios (2017) [23] conducted a parameter sensitivity analysis, and Javanroodi et al. (2018) [24] performed CFD simulation studies. Collectively, these works have substantiated, through comprehensive data, models, or simulation methodologies, that urban form is a crucial determinant of regional and city-wide energy consumption and environmental performance, while also exploring the mechanisms through which it exerts its influence [19,20,21,22,23,24]. Weisz et al. (2010) contextualized this influence within urban material flows, demonstrating how socioeconomic factors, such as household income, interact with structural elements to collectively impact implicit energy and material consumption [25]. Common density metrics, including floor area ratio (FAR), building density (BD), window-to-wall ratio (WWR), window orientation (WO), and road density, are extensively analyzed concerning building energy usage [26,27,28,29].
A primary focus is the creation and implementation of urban form design methodologies, planning frameworks, and evaluation tools to attain energy efficiency objectives. This project aims to explore how urban design might be intentionally modified to improve energy efficiency and meet sustainability goals. Okeil (2010) promotes an integrated design approach for building forms that accounts for climatic seasonality [30]; Marique et al. (2014) introduced a streamlined framework for evaluating the viability of zero-energy communities, which integrates the systemic effects of form on energy demand, renewable energy potential, and transportation energy use [31]; Robinson et al. (2017) illustrated the efficacy of machine learning predictive models in assessing the influence of urban form on commercial building energy consumption using limited building feature data, thereby supporting data-driven planning [32]; Quan et al. (2014) [33] simulated energy consumption for heating and cooling through AutoCAD2013 C# scripts, MATLAB2013, and EnergyPlus 8.0008 across more than 14,000 hypothetical models within Portland’s urban grid. The findings revealed that, contrary to prevalent belief, energy consumption for building cooling and heating does not consistently demonstrate an inverse relationship with density [33]; Additionally, research by Quan et al. (2020) indicated that once density surpasses a specific threshold, building energy use intensity initially declines before subsequently increasing [34]; You et al. (2018) employed structural equation modeling to examine a building-level empirical dataset from a residential area in Seoul, Republic of Korea, uncovering the indirect effects of urban design and land use characteristics mediated by other variables, alongside the direct impacts of building attributes [35]. Beyond this, numerous studies in recent years have explored sustainable building energy consumption using AI-assisted surrogate models. Bazazzadeh et al. employed Light Gradient Boosted Machine Regressors (LGBMR), evaluating performance based on prediction accuracy for energy savings and thermal comfort improvements [36]; Naghipour et al. combined Extreme Gradient Boosting (XGB) and Histogram Gradient Boosting (HGB) with three advanced optimization techniques to achieve higher prediction accuracy and adaptability to regional climate conditions [37]; Qian et al. proposed an AI-Hydraulic Model (AHMM) integrating mechanistic and data-driven models to more accurately characterize the actual output behavior of building energy system equipment [38]; Mehraban et al. enhanced scenario development and building optimization using artificial intelligence, employing Python-based scripts and a non-dominated sorting genetic algorithm (NSGA-II) through EnergyPlus simulations to develop and evaluate seven machine learning (ML) models for predicting three key performance indicators [39]; Abdelaziz et al. proposed a hybrid intelligent model to forecast future energy consumption levels in public buildings [40].
Urban texture largely delineates the three-dimensional geometric attributes of a metropolis. Street canyons have emerged as a focus point in related studies due to their substantial influence, leading to the identification of crucial variables such as shading angle [41] and sky view factor (SVF) [42]. Empirical research has demonstrated a correlation between street canyons, temperature environments, and building energy use [43]. The cooling impact of street greening on street temperature decrease and peak electricity usage is more significant in shallow street canyons than in deep street canyons. Research suggests that in shallow street canyons devoid of building shade, the cultivation of street trees is essential for enhancing the microclimate and realizing energy savings in buildings [44]. The physical configuration of roadway canyons impacts the comfort of plants and pavement materials, thereby influencing energy usage [45].
Although prior research links urban form to building energy use and offers various evaluation frameworks, key gaps remain. Most studies focus on a single scale (building or city) or a single target (cooling or heating), lacking form-driven optimization of annual total energy intensity at the neighborhood scale. AI-assisted proxy models improve prediction efficiency but often rely on idealized prototypes and fixed envelopes, overlooking microclimate feedback such as urban heat island effects, which undermines simulation accuracy. This study addresses these gaps by proposing a block-level form optimization framework that integrates UWG-based microclimate corrections to balance energy use with other environmental goals.
2.2. Multi-Objective Optimization Design of Urban Form
Recent research has focused on the application of multi-objective optimization in urban form design, highlighting the integration of advanced modeling techniques with sustainability considerations. Many studies have concentrated on the development, enhancement, and integration of advanced multi-objective optimization algorithms, computational models, and automated workflows to improve the efficiency of tackling complex urban form design challenges. These efforts particularly focus on optimizing energy consumption, lighting, and indoor comfort through architectural form design [46,47,48,49]. Yun et al. (2009) developed a meta-modeling approach utilizing support vector regression, successfully predicting complex unknown objective functions and highlighting the significance of surrogate models in multi-objective optimization [50]. Shi et al. (2017) performed a systematic review of simulation-based generation and optimization methods, creating an energy-oriented model framework that highlights the importance of simulation technology in optimization processes [51]. The genetic algorithm framework known as the “Energy-Efficient Form Finder (EEF)” developed by Javanroodi et al. (2019) and the automated optimization process proposed by Wang et al. (2021) illustrate the benefits of evolutionary algorithms and automation in effectively navigating the form solution space [52,53]. Santiago (2019) demonstrated the efficacy of evolutionary algorithms in facade optimization [54]. In contrast, Sun et al. (2022) presented a novel tensor field generation toolkit, enhancing the integration of form generation and multi-objective optimization (MOO) [8]. The nested structure proposed by Wang et al. (2014) [55] and the machine learning-CFD fusion method developed by enhancing the technical approaches available for solving complex multi-domain, multi-physics problems. This direction focuses on enhancing computational efficiency, processing capacity, and automation to develop a more effective optimization engine for urban design [55]. Akopov et al. (2019) employed agent-based simulation to investigate the interaction between urban greening and pollutants, demonstrating a modeling approach for the interaction mechanisms required when treating vegetation as a key element in urban environmental governance [56]. Yoon et al. (2019) [57] proposed a multi-objective planning model for urban greening layout. By employing optimization algorithms to balance available green space, visual connectivity, and microclimate improvement, it provides a direct reference for integrating greening metrics (such as canopy cover and vegetation placement) into multi-objective urban form optimization [57].
A significant focus is on the application of MOO technology to specific urban design challenges, with an emphasis on the integration of multi-dimensional sustainability objectives. Martins et al. (2014) examined Brazil’s tropical climate through the application of multi-objective optimization (MOO) to reconcile solar energy capture with overheating risks in architectural forms, thereby offering an empirical solution for sustainable design tailored to specific climate zones [58]. Yang et al. (2018) illustrated the robust integration capabilities of MOO at the district scale, incorporating renewable energy potential, water resource management, and human experience indicators within a geographic design framework aimed at achieving a comprehensive, sustainable, and human-centered urban environment [59]. Sun et al. (2022) created a toolkit designed for the rapid generation and assessment of design solutions that fulfill multiple objectives [8]. A study optimizing multi-story residential buildings in the Suzhou region employed the Multi-Objective Non-Dominated Sorting Genetic Algorithm III (NSGA-III) alongside an Artificial Neural Network (ANN). Results indicated improvements in energy consumption, thermal comfort, and lifecycle CO2 emissions of 45.8%, 12.2%, and 28.0%, respectively, relative to the original design [60].
Optimization algorithms enable researchers to efficiently identify superior designs while maximizing design objectives within established constraints. A variety of plugins have been created for urban optimization and construction purposes. Rhino and Grasshopper, the leading parametric platforms for designers, have integrated numerous optimization features. Key plugins in Grasshopper comprise Galapagos [61], Octopus [62], and Wallacei [15], among others. Designers can utilize various optimization tools to iteratively compute optimal solutions in both multi-objective and single-objective contexts, thereby offering valuable support and reference for design processes. Wallacei provides the NSGA-II algorithm, which improves the visualization and analysis of optimization results. The NSGA-II algorithm offers several advantages, including high computational efficiency, effective diversity in solution sets, and the capability to address low-dimensional optimization problems [63].
Multi-objective optimization techniques are becoming increasingly mature in urban design, yet the potential for block-level form design remains largely untapped. Current research faces three key limitations: 1. Insufficient goal integration, with most studies focusing on energy or indoor comfort while neglecting the synergistic optimization of outdoor thermal comfort (e.g., UTCI) with energy consumption and daylighting. This fails to meet sustainable design’s comprehensive requirements for outdoor environments; 2. Limited flexibility in form generation, relying on preset typologies rather than deriving forms from fundamental variables like building types and stories, thereby restricting exploration of optimal configurations; 3. Insufficient coupling with real climate data, using standardized suburban meteorological data without integrating local microclimates altered by block morphology, affects practical applicability. This study addresses these shortcomings through simultaneous optimization, combining parametric generation with UWG-corrected meteorological data.
2.3. Urban Form and Environmental Comfort
Urban form is a significant determinant of environmental comfort, especially in relation to outdoor thermal comfort, and has been a prominent subject of scholarly inquiry. Studies have consistently highlighted the critical importance of design strategies in addressing microclimate issues, including the urban heat island effect, and in improving thermal comfort [17,64,65,66]. Initial research, including that of Fahmy et al. (2008) [67], emphasized the importance of comprehending the intricacies of urban climate and fostering interdisciplinary collaboration. They contended that building design and urban planning significantly affect microclimate and necessitate the amalgamation of diverse expertise to create effective thermal comfort strategies [67]. Yang (2016) [68] emphasized the need to examine high-rise building clusters as cities evolve, noting that their combined effects on environmental performance, including microclimate and sustainability, remain underexplored. He advocated for an integrated approach to urban design [68]. Morganti et al. (2020) examined social housing in Rome at the neighborhood scale, demonstrating that microclimate and thermal comfort are influenced by both individual buildings and the spatial arrangement and material characteristics of building clusters, underscoring the significance of assessing overall form at the micro level [69].
The research methodology employed by Elnabawi et al. (2020) [70] illustrates a comprehensive approach by integrating microclimate parameters with residents’ subjective assessments to investigate outdoor thermal comfort. Their findings highlight the substantial impact of local climate and adaptive behaviors on perceived comfort levels, underscoring the necessity of combining objective and subjective data in urban design [70]. Rad et al. (2021) [71] conducted a quantitative assessment utilizing the PMV/PPD model to examine the effects of community form on thermal comfort in Tehran. This study offers a methodological framework for evaluating urban form interventions and elucidates the direct impact of design and layout on microclimate [71]. Fuladlu (2021) analyzed campus space by equating urban form with surface materials and vegetation as critical environmental parameters influencing microclimate conditions, thereby affirming the multidimensional nature of determinants of environmental comfort [72]. Darbani et al. (2022) [73] systematically observed in their review that morphological elements, including building density, height, and spatial layout, play a significant role in regulating microclimate and impacting human health (e.g., heat island effect). They advocate for the incorporation of these morphological variables in models to enhance the understanding and mitigation of thermal environmental issues [73].
Recent studies have concentrated on the various advantages of morphological optimization. Khraiwesh et al. (2023) established a connection between outdoor thermal comfort and energy consumption at the urban block scale [74]. Their findings indicate that design parameters, including building orientation, height, and canyon aspect ratio, significantly affect microclimate and building energy efficiency. This suggests that optimizing morphology can concurrently improve comfort and decrease energy consumption. Saninah et al. (2023) examined the potential of green morphologies, specifically “urban forests,” as natural microclimate regulators [75]. They highlighted their significance in improving outdoor thermal environments, enhancing environmental comfort, and offering cultural and ecological services.
Urban morphology significantly influences outdoor thermal environments and heat island effects, yet quantifying its impact to guide early design remains challenging: 1. Evaluation remains disconnected from design, with most studies conducting post hoc analyses rather than systematically embedding indicators like UTCI into generation and optimization processes; 2. Synergy with energy consumption is insufficient, as few studies balance thermal comfort and energy consumption during optimization or reveal trade-off relationships; 3. Limited regional applicability: Few studies address strategies for simultaneously managing summer heat stress and winter daylighting needs in regions like Wuhan, characterized by hot summers and cold winters. This paper proposes an actionable morphological optimization method for Wuhan by setting Average UTCI alongside EUI and Average SH as core optimization targets.
2.4. Research Objectives
The literature review delineates the contributions and limitations of current research in this domain. Although the quantitative relationship between urban form and energy-environmental performance has been thoroughly examined, there is a notable deficiency in studies addressing performance-driven neighborhood form optimization during the initial design phases, as well as in multi-objective optimization research that incorporates energy consumption, power generation, and environmental objectives. Furthermore, certain studies utilizing ideal building models have not sufficiently addressed variations in local form. This paper seeks to address these issues and outlines the following specific research objectives:
- (1)
- How do block typologies and height mixes affect the balance between solar, energy, and UTCI?
- (2)
- Utilize this framework to analyze residential neighborhoods in Wuhan, focusing on optimal neighborhood configurations, the interconnections between various objectives, and the influence of design variables on neighborhood efficacy.
- (3)
- Translate research findings into design guidelines to investigate the relationship between building energy consumption, daylighting, and outdoor thermal comfort in urban neighborhood forms. Discuss strategies for creating livable and energy-efficient urban neighborhoods while maintaining energy efficiency and environmental comfort.
3. Methodology
3.1. Theoretical Framework
This study optimizes urban block form with energy conservation as the core objective through four integrated phases: parametric design, performance simulation, multi-objective optimization, and data analysis (Figure 1).
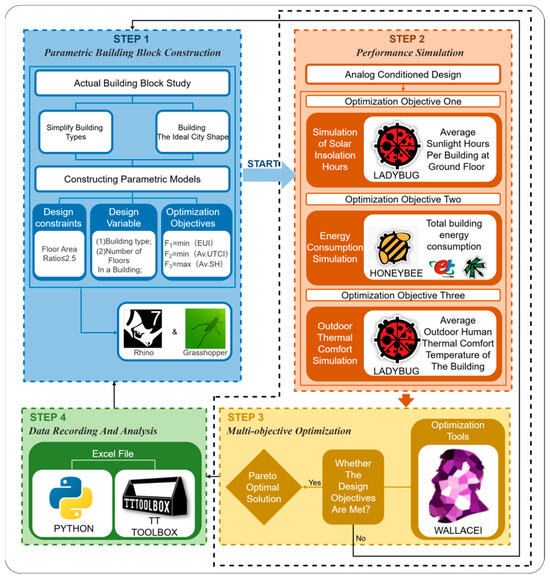
Figure 1.
A Framework for Multi-Objective Optimization Research.
Parametric design: Using Rhino and Grasshopper, building mass type and combination, height are defined as adjustable variables. Real cases are idealized to meet planning constraints and energy goals, forming a design space for optimization. Building floor height and layout form are the primary design variables. Optimization targets include maximizing average south-facing first-floor daylight on the coldest day (SH), minimizing total energy use intensity (EUI), and minimizing the outdoor thermal comfort index (Av.UTCI). A floor area ratio (FAR) ≤ 2.5 serves as a constraint. Performance simulation: Climate data (EPW) with Ladybug and Honeybee supports automated analyses of solar radiation, dynamic energy use, and outdoor thermal comfort on the parametric models. Multi-objective optimization: Using the Wallacei evolutionary algorithm, the process iteratively explores the Pareto front to minimize energy use and maximize winter sunlight, balancing competing objectives. Data analysis: Each simulation records scheme ID, parameters, and performance metrics, which are exported to Excel or a database and visualized in Python. All steps run on Rhino/Grasshopper, with Ladybug for solar radiation, Honeybee (EnergyPlus engine) for energy use, and Dragonfly’s Urban Weather Generator to adjust EPW files for microclimate effects.
3.2. Research Location
The research is conducted in Wuhan City, Hubei Province, China (see Figure 2). Wuhan was selected strategically because it is a prototypical representative of China’s hot-summer and cold-winter climate zone—a region where balancing solar gain (for winter heating) and solar shading (for summer cooling) is critical to building energy performance, with lessons applicable to hundreds of millions of people in climatically similar areas.
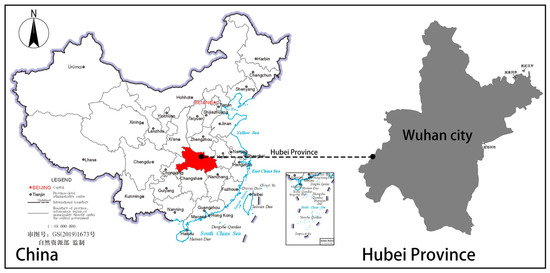
Figure 2.
Research Location.
Located in central China, Wuhan spans 8569.15 square kilometers and has a permanent population of 13.8091 million. Classified under General Specifications for Civil Building Design (GB 50352-2019, [76]) as a hot-summer and cold-winter region [77], it faces acute climatic tensions: summers are intensely hot (peak monthly temperature reaches 29.5 °C, driving massive cooling demand), while winters are damp and cold (minimum monthly temperature drops to 3 °C, requiring heating). Moreover, the region has high annual precipitation, limited sunshine hours, and minimal daily temperature fluctuations—conditions that exacerbate the challenge of harnessing solar energy effectively while mitigating overheating. With an annual average temperature of 16.7 °C, Wuhan has substantial and dual energy demands for both heating and cooling, coupled with strict building energy efficiency standards. Studying urban form optimization in Wuhan thus addresses a core dilemma for sustainable design in hot-summer and cold-winter zones: how to reconcile the need for solar access (to support winter thermal comfort and heating) with solar avoidance (to reduce summer cooling loads).
3.3. Parametric Block Modeling
3.3.1. Extracting and Simplifying Building Blocks
Recently, the architectural typology method has been extensively utilized in neighborhood form research [73,74]. This method entails a thorough investigation and analysis of neighborhood forms, facilitating the effective simplification and extraction of the most representative architectural prototypes. The extracted architectural prototypes effectively represent the fundamental geometric characteristics of real neighborhood forms [75,77]. This study utilizes findings from prior research [21,22,78,79], focusing on actual neighborhoods in the Wuhan region. It systematically extracts typical residential architectural prototypes, as illustrated in Figure 3. Nine layout types have been identified from the cases: one L-shaped, one U-shaped, one I-shaped, two tower blocks, two slab buildings, one point-shaped, and one courtyard layout. These types exemplify the typical urban neighborhood configurations frequently employed in urban design practices. Table 1 presents the geometric parameters for each building prototype.
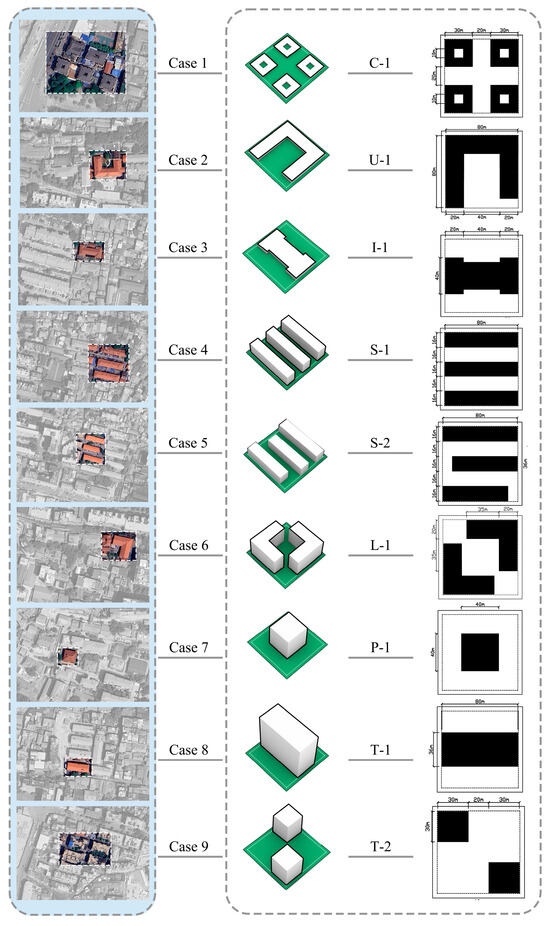
Figure 3.
Urban Neighborhood Model.

Table 1.
Geometric Block Parameters.
Building height design is influenced by multiple factors, with solar access regulations serving as a significant constraint. Regulations mandate that to guarantee sufficient solar access for neighboring structures, taller buildings must maintain a greater minimum distance from surrounding buildings, particularly those located to the north. This study examines the dynamic relationship between building height and spacing, subsequently defining the appropriate height variation ranges for various building prototypes (Table 1).
3.3.2. Setting the Ideal Neighborhood Form and Generating Building Blocks
The block form consists of fundamental building units, open spaces, roadways, and additional components. This study defines the size of an ideal plot as 300 m × 300 m, which is subdivided into nine land units of 100 m × 100 m, as illustrated in Figure 4. The boundaries of each land unit are set 5 m inward from the road boundary line, while the building boundaries are positioned 10 m inward. The developable area within the building line measures 80 m × 80 m, precisely matching the dimensions necessary for a single building type. Moreover, each ideal block is consistently oriented toward the south. Figure 4 depicts the optimal neighborhood configuration consisting of the nine building types suggested in this research.
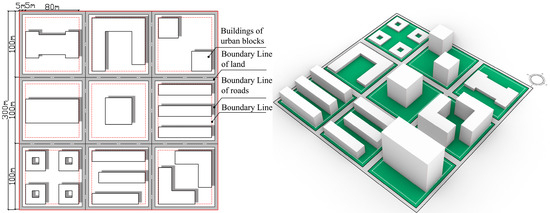
Figure 4.
Setting and block generation of the ideal neighborhood form.
3.4. Performance Simulation of Building Blocks
After conducting parametric modeling in block form, the next steps entail assessing their individual performance. Urban block designs must aim to minimize energy consumption, maximize the use of on-site renewable energy, and improve overall livability. This study assessed the performance of the generated block forms in terms of energy use, outdoor thermal comfort, and solar radiation exposure. The following metrics were introduced: building total energy consumption intensity (EUI), average building outdoor thermal comfort degree (Av. UTCI), and average south-facing first-floor solar radiation hours on the coldest day (SH). Table 2 presents comprehensive calculations for the optimization objectives of this performance simulation, accompanied by illustrative diagrams.
Table 2.
Overview of performance simulation parameters.
3.4.1. Total Energy Consumption Intensity of Buildings
This study uses the building energy intensity (EUI) as an indicator to characterize the energy consumption of a neighborhood. There are two definitions of building energy consumption: broad-based building energy consumption refers to the total energy consumption throughout the entire process, from the production of building materials, construction, to the use of the building. Narrow-based building energy consumption, i.e., the operational energy consumption of a building, refers to the energy consumption from daily activities such as heating, air conditioning, lighting, cooking, and laundry, which constitutes the dominant portion of building energy consumption. The energy consumption simulation in this study primarily focuses on operational energy consumption, i.e., daily energy use.
As is well known, climate significantly influences building energy consumption. In general energy consumption simulations, typical meteorological year data are typically used as boundary conditions. However, standard meteorological station data reflect the average climate characteristics of suburban areas over a longer period [80]. Therefore, building energy consumption simulations typically do not consider the influence of microclimate. This study employs the UWG tool [81] to simulate the microclimate of a neighborhood using the Dragonfly model, as standard meteorological station data cannot accurately reflect the local microclimate conditions of urban areas (especially densely populated neighborhoods). The UWG file is an input file used to configure the UWG model and define the characteristics of the target urban area. The meteorological files obtained through UWG correction can more accurately reflect the local microclimate conditions of the neighborhood (primarily higher temperatures), thereby significantly improving the accuracy and reliability of simulation results for building energy consumption, indoor and outdoor thermal comfort, and natural ventilation potential. This is crucial for conducting meaningful building and neighborhood performance analysis and optimization design in urban environments.
UWG (Urban Weather Generator) calculates hourly local air temperature and humidity within the urban canopy based on urban landscape geometry and land use information [82]. The model’s performance accuracy has been validated in cities (e.g., Basel, Toulouse) and regions under various climate conditions. Running the UWG model requires inputting parameterized building and urban characteristics of the neighborhood. Building parameters include building function, envelope specifications, and construction year (Table 3). This study defines the building type as a new medium-sized residential apartment building, while maintaining the energy simulation configuration parameters listed in Table 3. The climate zone is set to Zone 3A, but urban characteristics (such as traffic volume, road base materials, and road albedo) are typically not considered.
Table 3.
Energy simulation configuration parameters.
The Bee plugin uses the EnergyPlus engine to simulate the energy demand of the neighborhood. Under the guidance of the U.S. Department of Energy, the comprehensive building energy simulation program EnergyPlus was developed and is now widely used in engineering and academic fields [83]. The calculation of the total energy consumption intensity for the building is shown in Table 2. For each room, the monthly energy consumption data for that component (in kWh) is obtained. If a regional multiplier (i.e., the room is duplicated) exists, the energy consumption of each room is multiplied by the multiplier. The energy consumption of all rooms in the same month is summed to obtain the total energy consumption for that month. The monthly total energy consumption is divided by the total floor area of the entire model (unit: square meters) to obtain the monthly energy consumption per unit area (kWh/m2). For cooling and heating, it is further divided by the corresponding COP (Coefficient of Performance). Finally, the energy consumption of all 12 months is summed to obtain the annual total energy consumption per unit area for that component (kWh/m2).
3.4.2. Sunlight Hours
This study evaluates a neighborhood’s daylighting performance by using the number of hours of south-facing sunlight received on the first floor of a building during the coldest day (SH) as an indicator. SH is presently a required metric in China’s building regulations (GB 50180-2018, [84]) to assess the daylighting efficacy of residential structures. The Chinese “Standards for the Planning and Design of Urban Residential Areas” stipulate that residential buildings must receive a minimum of 2 h of continuous sunlight on the coldest day of the year, specifically from 8:00 to 16:00 on this day, which typically occurs around 20 January.
This study employed the sunlight duration analysis calculator from the Ladybug plugin to determine sunlight duration, incorporating inputs like weather files and simulation cycles. The simulation period was established for 20 January, the coldest day, from 08:00 to 16:00. Reference points were established at 1 m intervals on the south-facing windowsills of each building within the block, and sunlight duration was recorded at a height of 0.9 m above ground level. Table 2 presents the following variables: n represents the total number of test points, ∆t indicates the time step, NV signifies the total number of solar vectors, Vij reflects the visibility of the jth solar vector from the ith point, and the overall daylighting performance of the block is assessed by computing the average daylight hours across all reference points within the block.
3.4.3. Universal Thermal Climate Index
This research utilizes the Universal Thermal Climate Index (UTCI) as the primary metric for evaluating thermal comfort in outdoor urban environments. The UTCI is a sophisticated metric derived from a human thermal equilibrium model that thoroughly accounts for the interactive effects of multiple environmental and human factors, including air temperature, mean radiant temperature, relative humidity, wind speed, and human physiological parameters such as activity metabolic rate and clothing thermal resistance. This method facilitates a thorough and physiologically sound assessment of human thermal perception in intricate outdoor settings.
The analysis timeframe was designated as 12:00 to 14:00 on 25 July. Parameters including air temperature, mean radiant temperature, and relative humidity were extracted from the EPW meteorological file for that day and subsequently input into the Ladybug tool for simulation. The simulation process assessed the primary radiative components influencing the human body in outdoor settings, encompassing solar shortwave direct radiation and longwave radiation exchange between the human body and the sky, along with environmental surfaces, such as buildings, specifically regarding mean radiant temperature. To evaluate the distribution of thermal comfort at the site scale, a series of fixed-position points was established within the site area, with the locations determined as pre-selected random samples to optimize computational resources and efficiency. At a height of 1.7 m, representing pedestrian height, buildings served as obstructions to impede direct solar radiation and sky view (Sky View Factor) (Context). The environmental parameters—air temperature, average radiation temperature, relative humidity, and wind speed—derived from the aforementioned simulation at each location were utilized as inputs for the UTCI calculation in Ladybug’s “LB UTCI Comfort” component. The UTCI values from all selected points were averaged to establish a primary optimization target of this study: the Average Universal Thermal Climate Index (Average UTCI). This simulation was limited to buildings as the primary radiation-blocking elements due to computational resource constraints, excluding other potential obstructions such as vegetation and small structures. The UTCI values derived from the simulation may exceed those measured in complex real-world environments.
3.5. Multi-Objective Optimization
This study leverages a parametric modeling platform, where genetic algorithms have been widely applied to solve multi-objective building performance optimization problems. This research utilizes the Wallacei plugin within the Grasshopper platform to conduct multi-objective collaborative optimization of neighborhood performance, primarily employing the NSGA-II (Nondominated Sorting Genetic Algorithm II) algorithm. This algorithm models biological evolutionary processes to effectively identify the Pareto optimal solution set (Pareto Front) within intricate solution spaces, focusing on conflicting objectives. The core advantage of NSGA-II lies in its dual strategy of nondominated sorting and crowding distance. The former guarantees the convergence of solutions towards the global optimum, whereas the latter preserves solution diversity by encompassing a broad spectrum of design possibilities. The mathematical principles are defined as follows:
The initial formula presents an optimization problem comprising M objective functions fk (k = 1, 2, …, m) and N design variables xi (i = 1, 2, …, n), with X representing the constraint space for the design variables. In the second formula, Xa and Xb represent two candidate solutions (i.e., combinations of design variables). The notation fk (xa) indicates the value of solution xa at the kth objective function. The symbol ∀ signifies “holds for all objective functions,” while ∃ indicates “holds for at least one objective function.” If xa is not worse than xb on all objectives and is better on at least one objective, then xa dominates xb; The third formula quantifies the sparsity of solutions within the same non-dominated level Fi, aiming to avoid local clustering. Here, di represents the crowding distance of solution i; a larger value indicates sparser surrounding solutions and improved diversity. Upon sorting fk (i + 1) and fk (i − 1) in ascending order by objective k, the objective values of the two adjacent solutions to solution i are denoted as fkmax and fkmin, representing the maximum and minimum values of objective k within the current level Fi. The denominator fkmax − fkmin standardizes the range of values for objective k to prevent dimensional discrepancies.
This research seeks to employ multi-objective optimization algorithms to develop sustainable urban neighborhood designs that optimize sunlight exposure, minimize building energy consumption, and enhance photovoltaic power generation. Three optimization objectives were identified: minimizing total building Energy Use Intensity (EUI), minimizing the Average Universal Thermal Climate Index (Av.UTCI), and maximizing average south-facing first-floor sunlight hours on the coldest day (SH). This study’s objective function is outlined as follows:
Within this context, f1, f2, and f3 denote three optimization objective functions. Np indicates the quantity of thermal environment sampling points established at the site, while bti, bfi, and osi are design variables that correspond to building type, number of floors, and random seeds for building layout, respectively. The FAR delineates the limitations on design variable values, with all derived block forms required to satisfy the constraint that FAR is less than or equal to 2.5. To clarify the functional relationship between the objective function and design variables, we provide detailed mathematical expressions and computational procedures in Appendix A. For further details, please refer to Appendix A.
The NSGA-II (Non-Dominating Sorting Genetic Algorithm with Elite Strategy) process generally proceeds as follows (Figure 5): First, initialize the population and set the initial generation number Gen = 0; Next, perform non-dominated sorting: if the population classification is incomplete, identify non-dominated individuals, assign them “virtual fitness”, and perform sharing operations within the current front while updating the front; once population classification is complete, execute reproduction operations (including selection, crossover, and mutation) based on virtual fitness; Then, check if the current generation number is less than the maximum generation maxgen. If less, increment the generation number by 1 and repeat the process; if reached, the algorithm terminates.

Figure 5.
NSGA-II Algorithm Flowchart.
This algorithm efficiently solves multi-objective optimization problems by combining non-dominated sorting for decomposing the problem into superior and inferior regions, an elite retention strategy (preserving superior individuals), and density comparison (maintaining population diversity). It enhances computational efficiency and solution quality.
4. Simulation and Result Analysis
4.1. Overall Optimization Trend Analysis
4.1.1. Multi-Objective Optimization (The First Simulation)
This study employed a workstation with an AMD Ryzen 7 5800H processor (3.2 GHz) (Advanced Micro Devices, Inc., Santa Clara, CA, USA) to perform all simulations and optimizations. The initial multi-objective run used a population size of 40 and 50 generations, producing about 2000 design solutions in approximately 25 h (parameter settings are listed in Table 4).
Table 4.
First simulation parameters.
Figure 6 summarizes the iterative behavior of the three objectives: average sunshine hours (Av.SH), energy use intensity (EUI), and average UTCI. For Av.SH (Figure 6a,d), the standard-deviation curve narrows and the mean rises rapidly within the first 30–35 generations before stabilizing, indicating that solutions quickly converge toward higher solar exposure while maintaining moderate diversity. The slight late-stage fluctuation reflects the trade-off between taller tower forms, which improve ground-level sun access, and denser mid-rise blocks, which introduce intermittent shading. For EUI (Figure 6b,e), the variation remains small (≈91.7–93.3 kWh/m2). Because envelope parameters were held constant, energy demand is driven mainly by building massing and orientation; the limited spread confirms that geometry alone exerts a modest influence compared with envelope performance. For Av.UTCI (Figure 6c,f), the mean decreases slightly after an early rise, while the distribution widens. This reflects the complex micro-climatic response in hot-humid Wuhan: taller, more open layouts enhance ventilation and reduce radiant loading for some configurations but can also increase heat exposure in open plazas, producing higher variability. Absolute UTCI values remain high (>40 °C), which indicates that although relative comfort improves among Pareto-optimal solutions, extreme summer heat stress persists.

Figure 6.
Trends in different objectives in the optimization process (First simulation). (a) Av.SH (h) Standard Deviation Graph of Av.SH. (b) Standard Deviation Graph of EUI. (c) Standard Deviation Graph of Av.UTCI. (d) Mean Values Trendline of Av.SH. (e) Mean Values Trendline of EUI. (f) Mean Values Trendline of Av.UTCI.
Overall, the three objectives show rapid convergence of their mean values within roughly 30–35 generations, followed by small oscillations as the algorithm refines the Pareto front. To enhance robustness and explore a broader solution space, subsequent experiments will employ larger populations, more generations, and adjusted crossover/mutation probabilities, with hyper-volume and generational-distance metrics to monitor convergence.
4.1.2. Multi-Objective Optimization (The Second Simulation)
The second optimization employed 100 generations with a crossover probability of 0.8 and a mutation probability of 0.5 (Table 5). Figure 7 summarizes the iterative behavior of the three objectives: average sunshine hours (Av.SH), energy use intensity (EUI), and average UTCI. Av.SH rose quickly and stabilized after roughly 30–35 generations, while EUI reached its mean plateau around generation 70. Both show narrowing standard-deviation curves, indicating convergence despite minor late-stage oscillations. In contrast, Av.UTCI peaked within the first 8 generations and then fluctuated slightly but remained high (>44 °C), reflecting persistent extreme summer heat and the competing effects of more open layouts that improve ventilation yet increase radiant exposure. The narrow EUI range (≈91.7–93.4 kWh/m2) again shows that fixed envelope properties limit energy sensitivity to geometric changes.
Table 5.
Second simulation parameters.
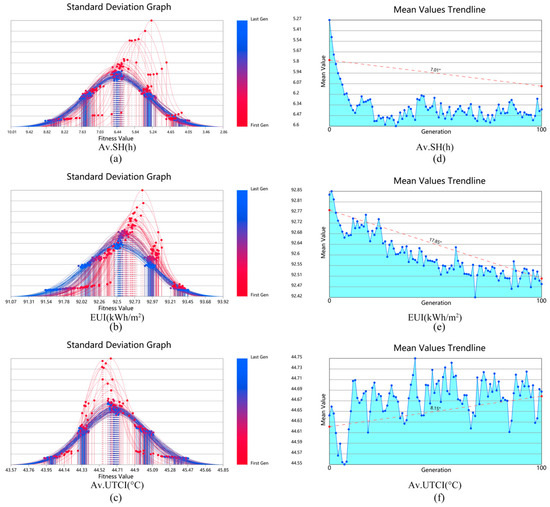
Figure 7.
Trends in different objectives in the optimization process (Second simulation). (a) Av.SH(h) Standard Deviation Graph of Av.SH. (b) Standard Deviation Graph of EUI. (c) Standard Deviation Graph of Av.UTCI. (d) Mean Values Trendline of Av.SH. (e) Mean Values Trendline of EUI. (f) Mean Values Trendline of Av.UTCI.
Figure 8 provides additional perspective through a fitness-value chart and a parallel-coordinate plot. Av.SH spans 4.9–7.9 h, EUI 91.7–93.4 kWh/m2, and Av.UTCI 44.1–45.5 °C. Lines in the parallel-coordinate plot transition from blue to red as generations advance, illustrating that candidate solutions cover the full range of each objective and that variability persists across the Pareto front without complete convergence. Overall, the larger population and longer run broadened the explored design space but confirmed that meaningful comfort gains will require additional strategies, such as vegetation, higher-albedo materials, or adaptive envelopes—beyond pure block-form optimization.
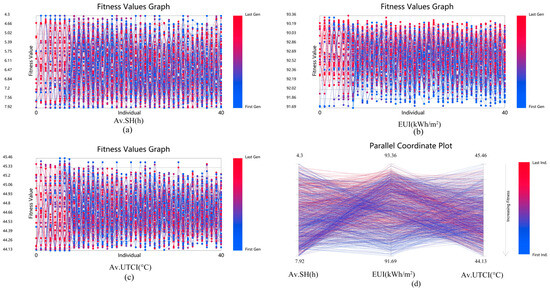
Figure 8.
Fitness Value Chart and Parallel Coordinate Plot (Second simulation). (a) Fitness Values Graph of Av.SH. (b) Fitness Values Graph of EUI. (c) Fitness Values Graph of Av.UTCI. (d) Parallel Coordinate Plot.
4.2. Distribution of Pareto Optimal Solutions
Figure 9 visualizes the feasible solution space and the Pareto front for the three-objective optimization. In the 3-D scatter plot (Figure 9a), gray points represent all feasible solutions, red points are Pareto-optimal solutions, and the translucent blue surface outlines the non-dominated front defined by average sunshine hours (Av.SH, h), energy use intensity (EUI, kWh/m2), and average UTCI (°C). Projections on the two-objective planes (Figure 9b–d) reveal key trade-offs: Av.SH and Av.UTCI show a clear negative correlation—improving solar access generally raises thermal stress, while the Av.UTCI–EUI relationship is nonlinear, indicating multiple equilibrium patterns. These plots confirm strong conflicts among the three objectives and highlight the boundary-clustering of Pareto solutions where competing goals are most efficiently balanced.

Figure 9.
Pareto Front and Two-Dimensional Projection Analysis for Multi-Objective Optimization. (a) 3D Pareto Front of Av.SH, EUI, and Av.UTCI. (b) 2D Projection of Av.SH vs. EUI. (c) 2D Projection of Av.SH vs. Av.UTCI). (d) 2D Projection of EUI vs. Av.UTCI.
Figure 10 compares the distributions of feasible versus Pareto solutions for each objective using box plots. For Av.SH and EUI (Figure 10a,b), feasible solutions have slightly higher medians and wider interquartile ranges, reflecting greater variability and the presence of extreme values. Pareto solutions exhibit narrower spreads and lower medians, signifying more stable energy performance and better multi-objective balance. For Av.UTCI (Figure 10c), the Pareto set again shows a lower, more concentrated median, indicating improved thermal comfort consistency despite the hot-summer context. Overall, the Pareto front achieves superior stability by modestly sacrificing performance on single objectives to deliver designs that better reconcile solar access, energy use, and outdoor comfort.
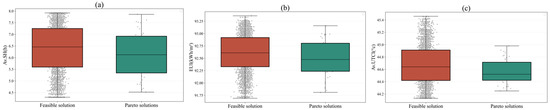
Figure 10.
Comparison of the distribution differences between feasible solutions and Pareto solutions across various objectives. (a) Boxplot comparison of Av.SH for feasible vs. Pareto solutions; (b) Boxplot comparison of EUI for feasible vs. Pareto solutions. (c) Boxplot comparison of Av.UTCI for feasible vs. Pareto solutions.
4.3. Design Variable Analysis
Figure 11 presents a correlation heat map that visually represents the distribution characteristics of Pearson correlation coefficients among various variables, indicated by color intensity and numerical values. The horizontal and vertical axes denote the nine variables: C-1, U-1, I-1, S-1, S-2, L-1, P-1, T-1, and T-2. The diagonal values are all 1.00, signifying that each variable exhibits perfect positive correlation with itself. The color scale progresses from dark purple, indicating a negative correlation, to bright yellow, representing a strong positive correlation, aligned with a numerical range of −1 to 1. The heat map indicates that correlations among various variables are predominantly low to moderate, with most correlation coefficients ranging from −0.2 to 0.4. The correlation coefficient between U-1 and S-1 is 0.41, suggesting a moderate positive correlation, whereas T-1 and C-1 show a weak negative correlation of −0.17. The correlation coefficient between P-1 and T-1 is 0.44, representing one of the highest non-diagonal correlation values in the figure, indicating a relatively strong consistency in their data distributions. Furthermore, certain variable combinations, including I-1 and S-2 (−0.14) and T-1 and S-1 (−0.14), exhibit minor negative correlations; however, the overall trend lacks significance.
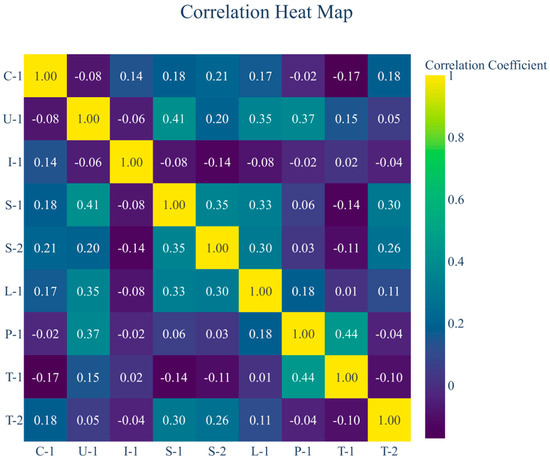
Figure 11.
Correlation Heat Map.
Figure 12 shows the parallel-coordinates plot (PCP) of the nine design variables (C-1, U-1, I-1, S-1, S-2, L-1, P-1, T-1, T-2) based on 4000 sampled solutions. Each colored polyline represents one design and the color shift from purple to yellow tracks the optimization sequence. Variables C-1, U-1, and I-1 are mostly confined to values of 1–3, indicating limited design flexibility, while S-1 and S-2 span roughly 4–9 and T-1 and T-2 extend to 13–19, reflecting wider exploration and greater degrees of freedom. Dense intersections between S-1 and S-2 reveal a strong mutual dependence: changes in one strongly affect the other. In contrast, T-1 and T-2 display relatively parallel, stable trajectories, suggesting weaker coupling or synchronized adjustments.
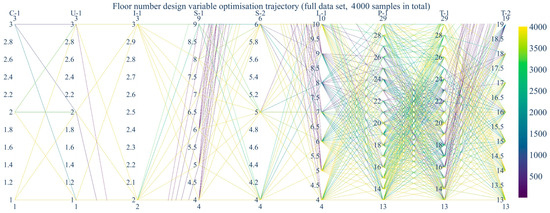
Figure 12.
Parallel coordinate optimization trajectory diagram of floor number design variables.
The color progression highlights the optimization dynamics. Early iterations (purple) are widely scattered across all variable ranges, demonstrating a broad initial search of the design space. Later iterations (yellow) cluster toward specific value bands, especially on S-1, S-2, and T-2, indicating convergence toward preferred design combinations. These patterns identify S-1, S-2, and T-2 as key drivers of the final Pareto-optimal solutions and provide insight into which parameters most strongly influence neighborhood form in the multi-objective optimization.
Figure 13 presents a scatter matrix diagram that facilitates the analysis of pairwise relationships among nine design variables (C-1, U-1, I-1, S-1, S-2, L-1, P-1, T-1, T-2) as well as the evolutionary characteristics of these variables throughout the optimization iterations. The total volume of data comprises 4000 samples. The main diagonal in the figure illustrates the distribution of each variable, exhibiting a clear characteristic of discrete values. The remaining subplots illustrate the scatter distribution relationships between pairs of variables, with each point denoting a sample. The colors vary from dark purple to light yellow, reflecting the progression of optimization iterations or sample numbers from initial to later stages. Certain variables demonstrate clear patterns or constraints in their overall distribution characteristics. The scatter plot between S-1 and S-2 exhibits a diagonal distribution, indicating a strong correlation or influence from specific constraints between the two variables. In contrast, the scatter plot between T-1 and T-2 is more dispersed, suggesting a relatively independent relationship between these variables. The scatter plots for variables C-1, U-1, and I-1 exhibit a more dispersed matrix pattern when analyzed with other variables. This suggests that these variables demonstrate greater independence in optimization design or exhibit weaker direct connections with the other variables. The color distribution elucidates the dynamic characteristics inherent in optimization iterations. Initial samples (dark purple) are more widely dispersed across most subplots, encompassing various areas of the variable space, which illustrates the optimization algorithm’s extensive initial search of the solution space. In contrast, subsequent samples (light yellow) increasingly focus on specific areas, exhibiting greater clustering in subplots associated with variables such as S-1, S-2, and T-2, signifying the algorithm’s convergence towards a restricted solution set region throughout the iterations. This convergence phenomenon indicates that specific combinations of variables are critical to achieving the final optimized solution.
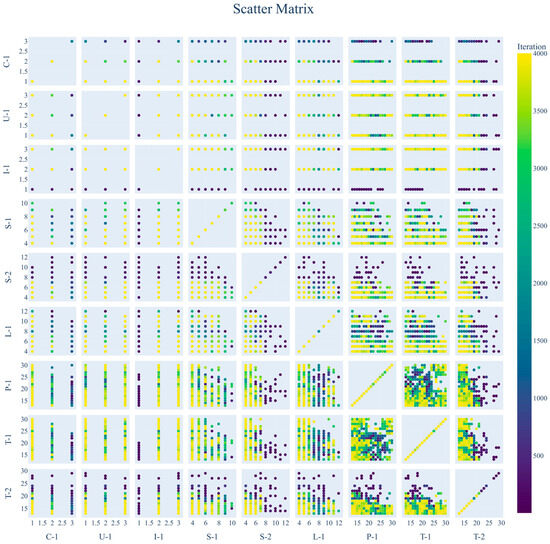
Figure 13.
Scatter Matrix.
4.4. Comparison of the Performance of the Selected Solutions
To evaluate how different Pareto-optimal layouts perform across the three objectives, average daily sunshine hours (Av.SH), energy use intensity (EUI), and average UTCI—representative solutions from the 99th generation (Indices 0, 1, 2, 4, 5, 6, 14, 17, 19, 21, 22, 24, 25, 31, 33, 35, 36, 37, 38, 39) were compared (Figure 14).

Figure 14.
Performance comparison of selected schemes.
Av.SH ranges from 4.29 h (Index 1) to 7.92 h (Index 4), with most schemes between 5.0 and 7.5 h, showing clear trade-offs in solar access. EUI remains tightly clustered between 91.7 and 93.3 kWh/m2, reflecting stable energy demand under the fixed envelope conditions. UTCI varies from 44.15 °C (Index 1) to 45.29 °C (Index 22), a modest spread that still represents strong summer heat stress.
A clearer pattern emerges when the spatial forms are examined. Layouts with moderate density and a balanced height mix of low- to mid-rise buildings, such as Indices 1 and 17, consistently achieve higher Av.SH and lower UTCI without increasing EUI. Conversely, dispersed footprints or clusters of tall towers reduce ground-level solar access and raise outdoor thermal stress. Compact but evenly distributed blocks therefore provide the best compromise: roughly 40–60% mid-rise (4–8 stories) combined with a limited share of taller elements (≤18 m) to promote shading balance and cross-ventilation. Designers seeking minimal energy use can adopt layouts similar to Index 0, which delivers the lowest EUI, but at the cost of slightly poorer comfort indicators.
This comparative analysis demonstrates that the multi-objective framework not only identifies Pareto solutions but also yields actionable design guidance: favor compact, moderately dense neighborhoods with a graded height.
5. Discussion and Conclusions
5.1. Implication of This Study
5.1.1. Interrelationships Between Different Objectives
Representative Pareto optimal solutions in the 99th generation (indices 0, 1, 2, 4, 5, 6, 14, 17, 19, 21, 22, 24, 25, 31, 33, 35, 36, 37, 38, 39) reveal trade-offs between average sunshine hours (Av.SH), energy use intensity (EUI), and average UTCI (Figure 13). Av.SH values ranged from 4.29 h (Index 1) to 7.92 h (Index 4), indicating significant variations in solar gain conditions. With fixed envelope characteristics, EUI values remained within a narrow range of 91.7–93.3 kWh/m2. UTCI ranged from 44.15 to 45.29 °C, meaning that while certain layouts reduced thermal stress, all schemes faced extreme summer heat. This framework mitigates rather than eliminates discomfort. Furthermore, since this study did not incorporate greening or cooling technologies, UTCI fell far short of conventional thermal comfort standards. Indicator 1 achieves optimal average sunshine duration (Av.SH) and lowest thermal stress index (UTCI), though with a slightly higher energy consumption index; Indicator 0 minimizes energy consumption at the expense of daylighting and comfort. Spatial form dictates these outcomes: highly uniform, progressive compact layouts simultaneously improve average sunlight duration and UTCI, whereas dispersed building clusters or tower clusters worsen both metrics. Note, however, that these conclusions apply only to a single extreme summer day, fixed building envelopes, and conditions without vegetation. Future research must incorporate greening measures, high-reflectance materials, or adaptive curtain wall systems to enhance comfort; otherwise, these optimization strategies cannot be widely implemented.
5.1.2. Impact of Design Variables on Block Performance
Analysis of design-variable distributions and performance indicators shows that building height is the primary driver of neighborhood performance. Low-rise blocks (C-1, U-1, I-1, 1–3 floors) reveal that increasing floors beyond 2–3 reduces average sunshine hours (Av.SH) and slightly raises energy use intensity (EUI) without improving average UTCI, so keeping them at 2–3 floors maintains openness while satisfying floor-area ratio requirements. Mid-rise blocks (S-1, S-2, L-1, 4–12 floors) have the strongest impact: when their heights exceed about 6–8 floors, sunshine hours drop sharply, EUI increases, and heat accumulation elevates UTCI, indicating that limiting these buildings to roughly 6–8 floors preserves ventilation corridors and moderates outdoor heat. High-rise groups (P-1, T-1, T-2, 13–30 floors) exert a more complex influence: dense clusters block solar access and raise UTCI, while too few high-rises lower overall density and increase per capita energy demand. Pareto-optimal schemes such as Indices 1 and 17 show that a limited share of high-rises around 15–20 stories, strategically placed to avoid shading key courtyards, provides the best balance. Overall, for hot-summer, cold-winter neighborhoods like Wuhan, the recommended composition is about 40–50% low-rise (2–3 floors), 30–40% mid-rise (6–8 floors), and 15–20% high-rise (15–20 floors) arranged to maintain open ventilation corridors, a mix that optimizes solar access, limits energy demand, and mitigates outdoor heat stress within the constraints of the current model.
5.2. Conclusion and Future Work
This study proposes a multi-objective optimization framework for urban block form and, through its application to a case study in Wuhan, reveals the potential and trade-offs of block form in balancing daylighting, energy consumption, and thermal comfort objectives. However, several limitations exist in this research, which also point to clear and specific directions for future improvements.
First, the design variables are relatively simplified, primarily focusing on building types and story counts. Future studies should incorporate other key morphological parameters significantly influencing block performance, such as building spacing, setbacks, roof greening, façade material reflectance, and ground surface materials, to more comprehensively capture the complexity of real urban environments. Second, three major limitations exist in performance simulation and evaluation: (1) Outdoor thermal comfort (UTCI) assessment relied solely on single-day static simulations during the hottest summer period, failing to reflect annual dynamic thermal variations or the frequency and duration of extreme heat stress events. Future work should conduct year-round dynamic simulations and incorporate cumulative metrics like thermal discomfort duration. (2) The simulated scenarios represent purely “hard” built environments, neglecting the impact of ecological cooling measures like greenery and water bodies. Integrating vegetation (e.g., tree canopy) and blue-green infrastructure will be crucial steps to enhance model realism and optimize ecological benefits. (3) Evaluation dimensions can be expanded to incorporate multiple sustainability metrics such as wind environment, carbon emissions, and stormwater management, enabling more comprehensive performance optimization. Third, at the optimization algorithm and framework level, constrained by computational costs, the population size and iteration count employed in this study may limit the full convergence of the Pareto frontier. To enhance optimization efficiency and robustness, a key direction involves developing and integrating machine learning proxy models to replace computationally expensive physical simulations, thereby supporting larger-scale exploration and uncertainty analysis. Additionally, while this framework currently operates under static assumptions, future iterations could incorporate temporal dimensions (e.g., seasons, day-night cycles) and pedestrian behavior models to enhance responsiveness to dynamic usage demands.
Finally, regarding empirical validation and practical application, the study’s conclusions have not yet been verified against field monitoring data. Critical next steps include post-evaluation, on-site measurements, or cross-validation with more detailed CFD simulations to assess model reliability. Simultaneously, translating research findings into practice is crucial. Exploring how to integrate the optimized morphological guidelines (e.g., height zoning recommendations) with China’s Green Building Evaluation Standards and urban design guidelines will enhance the methodology’s practical impact. By deepening these directions, the proposed framework holds promise for significant advancement in both scientific rigor and practical guidance value.
Author Contributions
Conceptualization, L.L. and C.Z.; methodology, L.L. and C.Z.; software, H.Z.; validation, C.Z.; formal analysis, C.Z.; investigation, C.N. All authors have read and agreed to the published version of the manuscript.
Funding
This research received no external funding.
Institutional Review Board Statement
Not applicable.
Informed Consent Statement
Not applicable.
Data Availability Statement
Data provided as requested.
Conflicts of Interest
The authors declare no conflicts of interest.
Nomenclature
The following abbreviations are used in this manuscript:
| Abbreviation | Explanation |
| Av.SH (h) | Average Sunshine Hours (h) |
| EUI (kWh/m2) | Energy Use Intensity (kWh/m2) |
| Av.UTCI (°C) | Average Universal Thermal Climate Index (°C) |
| bt | Building type index (genetic variable) |
| bf | Building floor number (genetic variable) |
| UWG | Urban Weather Generator |
| EPW | EnergyPlus Weather file |
| NSGA-II | Non-dominated Sorting Genetic Algorithm II |
Appendix A
The design variable vector x (where bti, bfi, and osi are design variables corresponding to building type, number of floors, and random seeds for building layout, respectively) is transformed into a specific three-dimensional model G through the geometric generative function Φ(x). Building upon this foundation, the formula defines quantification methods for three key performance indicators: Sunlight Hours (SH) are calculated by accumulating the duration of direct solar exposure at sampling points during the evaluation period (determined by the visibility function V_p,t (G)), then averaging this value to assess winter daylighting potential at the site; UTCI is a comprehensive thermal comfort index that integrates microclimate parameters—air temperature, mean radiant temperature derived from the radiation exchange model, humidity, and wind speed—into an equivalent thermal sensation temperature via a computational function, also spatially averaged; Annual Energy Use Intensity (EUI) is calculated by aggregating simulated energy consumption corrected by monthly energy efficiency coefficients (COP_m) and dividing by total building floor area, yielding a standardized energy efficiency metric.
References
- Alšauskas, O. World Energy Outlook 2024; International Energy Agency: Paris, France, 2024. [Google Scholar]
- Min, J.; Yan, G.; Abed, A.M.; Elattar, S.; Amine Khadimallah, M.; Jan, A.; Elhosiny Ali, H. The Effect of Carbon Dioxide Emissions on the Building Energy Efficiency. Fuel 2022, 326, 124842. [Google Scholar] [CrossRef]
- Omer, A.M. Energy, Environment and Sustainable Development. Renew. Sustain. Energy Rev. 2008, 12, 2265–2300. [Google Scholar] [CrossRef]
- Cronshaw, I. World Energy Outlook 2014 Projections to 2040: Natural Gas and Coal Trade, and the Role of China. Aust. J. Agric. Resour. Econ. 2015, 59, 571–585. [Google Scholar] [CrossRef]
- Li, J.; Colombier, M. Managing Carbon Emissions in China through Building Energy Efficiency. J. Environ. Manag. 2009, 90, 2436–2447. [Google Scholar] [CrossRef]
- Kropf, K. Aspects of urban form. Urban Morphol. 2009, 13, 105–120. [Google Scholar] [CrossRef]
- Oliveira, V.; Monteiro, C.; Partanen, J. A Comparative Study of Urban Form. Urban Morphol. 2014, 19, 73–92. [Google Scholar] [CrossRef]
- Sun, C.; Zhang, Y.; Ma, W.; Wu, R.; Wang, S. The Impacts of Urban Form on Carbon Emissions: A Comprehensive Review. Land 2022, 11, 1430. [Google Scholar] [CrossRef]
- Nieuwenhuijsen, M.; De Nazelle, A.; Pradas, M.C.; Daher, C.; Dzhambov, A.M.; Echave, C.; Gössling, S.; Iungman, T.; Khreis, H.; Kirby, N.; et al. The Superblock Model: A Review of an Innovative Urban Model for Sustainability, Liveability, Health and Well-Being. Environ. Res. 2024, 251, 118550. [Google Scholar] [CrossRef] [PubMed]
- Zhu, W.; Wang, J.; Qin, B. The Relationship between Urban Greenness and Mental Health: A National-Level Study of China. Landsc. Urban Plan. 2023, 238, 104830. [Google Scholar] [CrossRef]
- Yin, S.; Lang, W.; Xiao, Y. The Synergistic Effect of Street Canyons and Neighbourhood Layout Design on Pedestrian-Level Thermal Comfort in Hot-Humid Area of China. Sustain. Cities Soc. 2019, 49, 101571. [Google Scholar] [CrossRef]
- Askarizad, R.; He, J. Post-Pandemic Urban Design: The Equilibrium between Social Distancing and Social Interactions within the Built Environment. Cities 2022, 124, 103618. [Google Scholar] [CrossRef] [PubMed]
- Liu, S.; Wang, Y.; Liu, X.; Yang, L.; Zhang, Y.; He, J. How Does Future Climatic Uncertainty Affect Multi-Objective Building Energy Retrofit Decisions? Evidence from Residential Buildings in Subtropical Hong Kong. Sustain. Cities Soc. 2023, 92, 104482. [Google Scholar] [CrossRef]
- Li, J.; Wang, Y.; Xia, Y.; Song, Y.; Xie, H. Optimization of Urban Block Form by Adding New Volumes for Capacity Improvement and Solar Performance Using A Multi-Objective Genetic Algorithm: A Case Study of Nanjing. Buildings 2022, 12, 1710. [Google Scholar] [CrossRef]
- Liu, K.; Xu, X.; Huang, W.; Zhang, R.; Kong, L.; Wang, X. A Multi-Objective Optimization Framework for Designing Urban Block Forms Considering Daylight, Energy Consumption, and Photovoltaic Energy Potential. Build. Environ. 2023, 242, 110585. [Google Scholar] [CrossRef]
- Liu, P.; Hussein, A.A.; Alizadeh, A.; Baghoolizadeh, M.; Yan, G.; Zargari Pour, M.; Alkhalifah, T. Multi-Objective Optimization of Office Building Envelopes Properties and Venetian Blinds Using NSGA-II to Save Energy Consumption and Enhance Thermal and Visual Comfort. Case Stud. Therm. Eng. 2024, 64, 105484. [Google Scholar] [CrossRef]
- Castrejon-Esparza, N.M.; González-Trevizo, M.E.; Martínez-Torres, K.E.; Santamouris, M. Optimizing Urban Morphology: Evolutionary Design and Multi-Objective Optimization of Thermal Comfort and Energy Performance-Based City Forms for Microclimate Adaptation. Energy Build. 2025, 342, 115750. [Google Scholar] [CrossRef]
- Zhang, Y.; Teoh, B.K.; Zhang, L. Multi-Objective Optimization for Energy-Efficient Building Design Considering Urban Heat Island Effects. Appl. Energy 2024, 376, 124117. [Google Scholar] [CrossRef]
- Salat, S. Energy Loads, CO2 Emissions and Building Stocks: Morphologies, Typologies, Energy Systems and Behaviour. Build. Res. Inf. 2009, 37, 598–609. [Google Scholar] [CrossRef]
- Liu, X.; Sweeney, J. Modelling the Impact of Urban Form on Household Energy Demand and Related CO2 Emissions in the Greater Dublin Region. Energy Policy 2012, 46, 359–369. [Google Scholar] [CrossRef]
- Krüger, A.; Kolbe, T.H. Building Analysis for Urban Energy Planning Using Key Indicators on Virtual 3d City Models—The Energy Atlas of Berlin. Int. Arch. Photogramm. Remote Sens. Spat. Inf. Sci. 2012, XXXIX-B2, 145–150. [Google Scholar] [CrossRef]
- Zhang, Y.; Zheng, H.; Fath, B.D. Analysis of the Energy Metabolism of Urban Socioeconomic Sectors and the Associated Carbon Footprints: Model Development and a Case Study for Beijing. Energy Policy 2014, 73, 540–551. [Google Scholar] [CrossRef]
- Vartholomaios, A. A Parametric Sensitivity Analysis of the Influence of Urban Form on Domestic Energy Consumption for Heating and Cooling in a Mediterranean City. Sustain. Cities Soc. 2017, 28, 135–145. [Google Scholar] [CrossRef]
- Javanroodi, K.; Mahdavinejad, M.; Nik, V.M. Impacts of Urban Morphology on Reducing Cooling Load and Increasing Ventilation Potential in Hot-Arid Climate. Appl. Energy 2018, 231, 714–746. [Google Scholar] [CrossRef]
- Weisz, H.; Steinberger, J.K. Reducing Energy and Material Flows in Cities. Curr. Opin. Environ. Sustain. 2010, 2, 185–192. [Google Scholar] [CrossRef]
- Alghoul, S.K.; Rijabo, H.G.; Mashena, M.E. Energy Consumption in Buildings: A Correlation for the Influence of Window to Wall Ratio and Window Orientation in Tripoli, Libya. J. Build. Eng. 2017, 11, 82–86. [Google Scholar] [CrossRef]
- Dawodu, A.; Cheshmehzangi, A. Impact of Floor Area Ratio (FAR) on Energy Consumption at Meso Scale in China: Case Study of Ningbo. Energy Procedia 2017, 105, 3449–3455. [Google Scholar] [CrossRef]
- Mostafavi, N.; Heris, M.; Gándara, F.; Hoque, S. The Relationship between Urban Density and Building Energy Consumption. Buildings 2021, 11, 455. [Google Scholar] [CrossRef]
- Steemers, K. Energy and the City: Density, Buildings and Transport. Energy Build. 2003, 35, 3–14. [Google Scholar] [CrossRef]
- Okeil, A. A Holistic Approach to Energy Efficient Building Forms. Energy Build. 2010, 42, 1437–1444. [Google Scholar] [CrossRef]
- Marique, A.-F.; Reiter, S. A Simplified Framework to Assess the Feasibility of Zero-Energy at the Neighbourhood/Community Scale. Energy Build. 2014, 82, 114–122. [Google Scholar] [CrossRef]
- Robinson, C.; Dilkina, B.; Hubbs, J.; Zhang, W.; Guhathakurta, S.; Brown, M.A.; Pendyala, R.M. Machine Learning Approaches for Estimating Commercial Building Energy Consumption. Appl. Energy 2017, 208, 889–904. [Google Scholar] [CrossRef]
- Quan, S.J.; Economou, A.; Grasl, T.; Yang, P.P.-J. Computing Energy Performance of Building Density, Shape and Typology in Urban Context. Energy Procedia 2014, 61, 1602–1605. [Google Scholar] [CrossRef]
- Quan, S.J.; Economou, A.; Grasl, T.; Yang, P.P.-J. An Exploration of the Relationship between Density and Building Energy Performance. Urban Des. Int. 2020, 25, 92–112. [Google Scholar] [CrossRef]
- You, Y.; Kim, S. Revealing the Mechanism of Urban Morphology Affecting Residential Energy Efficiency in Seoul, Korea. Sustain. Cities Soc. 2018, 43, 176–190. [Google Scholar] [CrossRef]
- Bazazzadeh, H.; Hoseinzadeh, S.; Mohammadi, M.M.; Garcia, D.A. AI-Aided Surrogate Model for Prediction of HVAC Optimization Strategies in Future Conditions in the Face of Climate Change. Energy Rep. 2025, 13, 1834–1845. [Google Scholar] [CrossRef]
- Naghipour, P.; Naghipour, A. Evaluating Heating Energy Consumption in Residential Buildings Using Hybrid Machine Learning Models: The Case of Parsabad City. Next Res. 2025, 2, 100721. [Google Scholar] [CrossRef]
- Qian, C.; He, N.; Cheng, Z.; Li, H. An Optimal Scheduling Method for Building Energy System Integrating Solar Energy Based on Adaptive Hybrid Mechanism Model and Learning-Based Model Predictive Control. Energy Build. 2025, 341, 115833. [Google Scholar] [CrossRef]
- Mehraban, M.H.; Sepasgozar, S.M.; Ghomimoghadam, A.; Zafari, B. AI-Enhanced Automation of Building Energy Optimization Using a Hybrid Stacked Model and Genetic Algorithms: Experiments with Seven Machine Learning Techniques and a Deep Neural Network. Results Eng. 2025, 26, 104994. [Google Scholar] [CrossRef]
- Abdelaziz, A.; Santos, V.; Dias, M.S.; Mahmoud, A.N. A Hybrid Model of Self-Organizing Map and Deep Learning with Genetic Algorithm for Managing Energy Consumption in Public Buildings. J. Clean. Prod. 2024, 434, 140040. [Google Scholar] [CrossRef]
- Li, L.; Qu, M.; Peng, S. Performance Evaluation of Building Integrated Solar Thermal Shading System: Building Energy Consumption and Daylight Provision. Energy Build. 2016, 113, 189–201. [Google Scholar] [CrossRef]
- Miao, C.; Yu, S.; Hu, Y.; Zhang, H.; He, X.; Chen, W. Review of Methods Used to Estimate the Sky View Factor in Urban Street Canyons. Build. Environ. 2020, 168, 106497. [Google Scholar] [CrossRef]
- Wang, M.; Gou, Z. The Impact of Cooling Strategies on Urban Microclimates and Building Energy Consumption: A Study of a Street Canyon in Melbourne. Energy Built Environ. 2025; in press. [Google Scholar] [CrossRef]
- Huang, K.-T.; Li, Y.-J. Impact of Street Canyon Typology on Building’s Peak Cooling Energy Demand: A Parametric Analysis Using Orthogonal Experiment. Energy Build. 2017, 154, 448–464. [Google Scholar] [CrossRef]
- Chatzidimitriou, A.; Yannas, S. Street Canyon Design and Improvement Potential for Urban Open Spaces; the Influence of Canyon Aspect Ratio and Orientation on Microclimate and Outdoor Comfort. Sustain. Cities Soc. 2017, 33, 85–101. [Google Scholar] [CrossRef]
- Evins, R. A Review of Computational Optimisation Methods Applied to Sustainable Building Design. Renew. Sustain. Energy Rev. 2013, 22, 230–245. [Google Scholar] [CrossRef]
- Futrell, B.J.; Ozelkan, E.C.; Brentrup, D. Optimizing Complex Building Design for Annual Daylighting Performance and Evaluation of Optimization Algorithms. Energy Build. 2015, 92, 234–245. [Google Scholar] [CrossRef]
- Lu, Y.; Wu, W.; Geng, X.; Liu, Y.; Zheng, H.; Hou, M. Multi-Objective Optimization of Building Environmental Performance: An Integrated Parametric Design Method Based on Machine Learning Approaches. Energies 2022, 15, 7031. [Google Scholar] [CrossRef]
- Wu, H.; Zhang, T. Multi-Objective Optimization of Energy, Visual, and Thermal Performance for Building Envelopes in China’s Hot Summer and Cold Winter Climate Zone. J. Build. Eng. 2022, 59, 105034. [Google Scholar] [CrossRef]
- Yun, Y.; Yoon, M.; Nakayama, H. Multi-Objective Optimization Based on Meta-Modeling by Using Support Vector Regression. Optim. Eng. 2009, 10, 167–181. [Google Scholar] [CrossRef]
- Shi, Z.; Fonseca, J.A.; Schlueter, A. A Review of Simulation-Based Urban Form Generation and Optimization for Energy-Driven Urban Design. Build. Environ. 2017, 121, 119–129. [Google Scholar] [CrossRef]
- Javanroodi, K.; Nik, V.M.; Mahdavinejad, M. A Novel Design-Based Optimization Framework for Enhancing the Energy Efficiency of High-Rise Office Buildings in Urban Areas. Sustain. Cities Soc. 2019, 49, 101597. [Google Scholar] [CrossRef]
- Wang, W.; Liu, K.; Zhang, M.; Shen, Y.; Jing, R.; Xu, X. From Simulation to Data-Driven Approach: A Framework of Integrating Urban Morphology to Low-Energy Urban Design. Renew. Energy 2021, 179, 2016–2035. [Google Scholar] [CrossRef]
- Santiago, P. Evolutionary Optimization of Building Facade Form for Energy and Comfort in Urban Environment through BIM and Algorithmic Modeling A Case Study in Porto, Portugal. In Proceedings of the Blucher Design Proceedings, Porto, Portugal, 11–13 September 2019; pp. 153–160. [Google Scholar]
- Wang, Y.; Sun, G.; Wu, Y.; Rosenberg, M.W. Urban 3D Building Morphology and Energy Consumption: Empirical Evidence from 53 Cities in China. Sci. Rep. 2024, 14, 12887. [Google Scholar] [CrossRef]
- Akopov, A.S.; Beklaryan, L.A.; Saghatelyan, A.K. Agent-Based Modelling of Interactions between Air Pollutants and Greenery Using a Case Study of Yerevan, Armenia. Environ. Model. Softw. 2019, 116, 7–25. [Google Scholar] [CrossRef]
- Yoon, E.J.; Kim, B.; Lee, D.K. Multi-Objective Planning Model for Urban Greening Based on Optimization Algorithms. Urban For. Urban Green. 2019, 40, 183–194. [Google Scholar] [CrossRef]
- Martins, T.A.; Adolphe, L.; Bastos, L.E. From Solar Constraints to Urban Design Opportunities: Optimization of Built Form Typologies in a Brazilian Tropical City. Energy Build. 2014, 76, 43–56. [Google Scholar] [CrossRef]
- Yang, P.P.-J. A Geodesign Method of Human-Energy-Water Interactive Systems for Urban Infrastructure Design: 10KM2 Near-Zero District Project in Shanghai. Engineering 2018, 4, 182–189. [Google Scholar] [CrossRef]
- Wu, H.; Deng, F.; Tan, H. Research on Parametric Design Method of Solar Photovoltaic Utilization Potential of Nearly Zero-Energy High-Rise Residential Building Based on Genetic Algorithm. J. Clean. Prod. 2022, 368, 133169. [Google Scholar] [CrossRef]
- Rutten, D. Galapagos: On the Logic and Limitations of Generic Solvers. Archit. Des. 2013, 83, 132–135. [Google Scholar] [CrossRef]
- Shen, X.; Singhvi, A.; Mengual, A.; Spastri, M.; Watson, V. Evaluating the Multi-Objective Optimization Methodology for Performance-Based Building Design in Professional Practice; ASHRAE and IBPSA: Chicago, IL, USA, 2018. [Google Scholar]
- Deb, K.; Pratap, A.; Agarwal, S.; Meyarivan, T. A Fast and Elitist Multiobjective Genetic Algorithm: NSGA-II. IEEE Trans. Evol. Comput. 2002, 6, 182–197. [Google Scholar] [CrossRef]
- Anderson, C.C.; Julia Sophie, U.; Schmidt, S. Visitor Motivations and Design Feature Use for Thermal Comfort on Hot Days in Bochum City Park, Germany. Urban For. Urban Green. 2024, 102, 128564. [Google Scholar] [CrossRef]
- Jamei, E.; Rajagopalan, P.; Seyedmahmoudian, M.; Jamei, Y. Review on the Impact of Urban Geometry and Pedestrian Level Greening on Outdoor Thermal Comfort. Renew. Sustain. Energy Rev. 2016, 54, 1002–1017. [Google Scholar] [CrossRef]
- Zhang, L.; Wang, S.; Zhai, W.; He, Z.; Shi, W.; Li, Y.; Zhao, C. How Does Blue-Green Infrastructure Affect the Urban Thermal Environment across Various Functional Zones? Urban For. Urban Green. 2025, 105, 128698. [Google Scholar] [CrossRef]
- Fahmy, M.; Sharples, S.; Al-Kady, A.-W. Extensive Review for Urban Climatology: Definitions, Aspects and Scales. Int. Conf. Civ. Archit. Eng. 2008, 7, 550–593. [Google Scholar] [CrossRef]
- Yang, F. High-Rise Urban Form and Environmental Performance—An Overview on Integrated Approaches to Urban Design for a Sustainable High-Rise Urban Future. Int. J. High-Rise Build. 2016, 5, 87–94. [Google Scholar] [CrossRef]
- Morganti, M.; Rosso, F. Urban Microclimate and Thermal Comfort in the Social Housing Districts of Rome: The Combined Effect of Built Form and Urban Materials. In Innovative Renewable Energy; Springer International Publishing: Cham, Switzerland, 2020; pp. 293–302. ISBN 978-3-030-18487-2. [Google Scholar]
- Elnabawi, M.; Hamza, N. Outdoor Thermal Comfort: Coupling Microclimatic Parameters with Subjective Thermal Assessment to Design Urban Performative Spaces. Buildings 2020, 10, 238. [Google Scholar] [CrossRef]
- Rezaei Rad, H.; Khodaee, Z.; Ghiai, M.M.; Tabe Arjmand, J.; El Haj Assad, M. The Quantitative Assessment of the Effects of the Morphology of Urban Complexes on the Thermal Comfort Using the PMV/PPD Model (a Case Study of Gheytariyeh Neighborhood in Tehran). Int. J. Low-Carbon Technol. 2021, 16, 672–682. [Google Scholar] [CrossRef]
- Fuladlu, K. Environmental Parameters for Campus Outdoor Space: A Microclimate Analysis of the Eastern Mediterranean University (EMU) Campus. J. Green Build. 2021, 16, 217–236. [Google Scholar] [CrossRef]
- Sanagar Darbani, E.; Parapari, D.M. Ideal Model for Investigating Urban form Effects on Urban Heat Island and Outdoor Thermal Comfort: A Review. Int. J. Eng. Sci. Technol. 2022, 6, 64–90. [Google Scholar] [CrossRef]
- Khraiwesh, M.M.; Genovese, P.V. Outdoor Thermal Comfort Integrated with Energy Consumption for Urban Block Design Optimization: A Study of the Hot-Summer Mediterranean City of Irbid, Jordan. Sustainability 2023, 15, 8412. [Google Scholar] [CrossRef]
- Saninah, T.N.; Hermawan, R.; Setiawan, Y.; June, T. The Potential of Bekasi “Eduforest” Urban Forest in Cultural Environmental Services. J. Pengelolaan Sumberd. Alam Lingkung. 2023, 12, 186–198. [Google Scholar]
- GB 50352-2019; Uniform Standard for Civil Building Design. Ministry of Housing and Urban-Rural Development: Beijing, China, 2019.
- Crawley, D.B.; Lawrie, L.K.; Winkelmann, F.C.; Buhl, W.F.; Huang, Y.J.; Pedersen, C.O.; Strand, R.K.; Liesen, R.J.; Fisher, D.E.; Witte, M.J.; et al. EnergyPlus: Creating a New-Generation Building Energy Simulation Program. Energy Build. 2001, 33, 319–331. [Google Scholar] [CrossRef]
- Li, J.; Wang, Y.; Xia, Y. A Novel Geometric Parameter to Evaluate the Effects of Block Form on Solar Radiation towards Sustainable Urban Design. Sustain. Cities Soc. 2022, 84, 104001. [Google Scholar] [CrossRef]
- Zhang, M.; Gao, Z. Effect of Urban Form on Microclimate and Energy Loads: Case Study of Generic Residential District Prototypes in Nanjing, China. Sustain. Cities Soc. 2021, 70, 102930. [Google Scholar] [CrossRef]
- Garcia, S.; Derrac, J.; Cano, J.R.; Herrera, F. Prototype Selection for Nearest Neighbor Classification: Taxonomy and Empirical Study. IEEE Trans. Pattern Anal. Mach. Intell. 2012, 34, 417–435. [Google Scholar] [CrossRef] [PubMed]
- Ma, Y.; Deng, W.; Xie, J.; Heath, T.; Xiang, Y.; Hong, Y. Generating Prototypical Residential Building Geometry Models Using a New Hybrid Approach. Build. Simul. 2022, 15, 17–28. [Google Scholar] [CrossRef]
- Natanian, J.; Wortmann, T. Simplified Evaluation Metrics for Generative Energy-Driven Urban Design: A Morphological Study of Residential Blocks in Tel Aviv. Energy Build. 2021, 240, 110916. [Google Scholar] [CrossRef]
- Ratti, C.; Raydan, D.; Steemers, K. Building Form and Environmental Performance: Archetypes, Analysis and an Arid Climate. Energy Build. 2003, 35, 49–59. [Google Scholar] [CrossRef]
- GB 50176-2018; Code for Thermal Design of Civil Buildings. China Architecture & Building Press: Beijing, China, 2018.


Disclaimer/Publisher’s Note: The statements, opinions and data contained in all publications are solely those of the individual author(s) and contributor(s) and not of MDPI and/or the editor(s). MDPI and/or the editor(s) disclaim responsibility for any injury to people or property resulting from any ideas, methods, instructions or products referred to in the content. |
© 2025 by the authors. Licensee MDPI, Basel, Switzerland. This article is an open access article distributed under the terms and conditions of the Creative Commons Attribution (CC BY) license (https://creativecommons.org/licenses/by/4.0/).