Abstract
Urbanization markedly influences the microclimatic conditions in semi-arid regions by elevating land surface temperatures (LST) and contributing to ecological degradation. This study examined the spatial and temporal evolution of LST and urban heat island (UHI) effects in Benguerir, Morocco, over a 30-year period (1994–2024), employing high-resolution satellite imagery and in situ sensor data. Urban expansion was quantified using thermal bands from Landsat imagery, the Normalized Difference Built-up Index (NDBI), and the Built-up Index (BU), whereas thermal comfort was evaluated through the Universal Thermal Climate Index (UTCI) and Predicted Mean Vote (PMV) using air temperature and humidity data collected via spatial sensor and the Sniffer Bike mobile sensor network. These urban transformations have intensified the UHI effect, resulting in a 29.34 °C increase in mean LST to 41.82 °C in 2024 across built-up areas. Statistical modeling revealed strong linear relationships between LST and urban indices, with R2 values ranging from 0.93 to 0.96, and correlation coefficients around 0.98 (all p-values < 0.001), indicating a reliable model fit. Furthermore, the analysis of thermal comfort trends underscores urbanization’s impact on human well-being. In 1994, 34.2% of the population experienced slight warmth and 65.8% experienced hot conditions. By 2024, conditions had shifted dramatically, with 76.7% experiencing hot conditions and 16.2% exposed to very hot conditions, leaving only 7.1% in the slight warmth category. These findings highlight the urgent need for adaptive urban planning strategies. The implementation of urban greening initiatives, the use of reflective materials, and the integration of data-driven planning approaches are essential to mitigate thermal stress and enhance urban resilience. Leveraging climate modeling and spatial analytics can support the identification of high-risk zones and inform targeted interventions to effectively address the escalating UHI phenomenon.
1. Introduction
Urbanization has profoundly reshaped global urban ecosystems, fundamentally changing local climate conditions through complex interactions between constructed environments and atmospheric processes [1,2]. This change is most notably seen in the urban heat island (UHI) effect, where urban areas have significantly higher temperatures than nearby rural regions [3]. The temperature gap results from several factors, including greater heat absorption and retention by urban surfaces, reduced vegetation cover, and altered surface energy balance [4,5]. These issues create considerable challenges for city residents, such as increased risks of heat-related health problems and higher energy consumption for cooling, which require innovative urban planning solutions to tackle these escalating concerns [6,7]. Given the complexity of urban thermal environments, remote sensing technologies have become essential tools for studying these systems across diverse spatial and temporal scales, offering unprecedented insights into heat distribution patterns [8,9]. Recent improvements in satellite-based thermal infrared sensors provide meaningful value by capturing surface temperature data at various resolutions across large urban areas, allowing for comprehensive analysis of heat distribution and identification of urban heat islands [10].
The development of these technologies has been well documented, with studies using high-resolution Land Surface Temperature (LST) data from MODIS Aqua, Sentinel-3, and Landsat 8/9 satellites to enable detailed urban thermal analysis [11,12]. The continual availability of satellite imagery supports long-term assessments of changes in urban thermal conditions, yielding vital insights to guide urban planning and climate adaptation strategies [10]. Additionally, combining satellite-derived thermal data with other urban datasets, such as land use patterns and population density, helps to develop a thorough understanding of the factors affecting heat distribution and their effects on residents [13,14]. This approach allows researchers to pinpoint areas requiring urgent attention and assess the success of existing cooling measures through analysis of temporal changes. Building on these technological advances, understanding human responses to urban thermal environments has become more advanced with the development of thermal comfort indices. Recent research shows that people living in different geographical areas display varying levels of tolerance and sensitivity to extreme heat conditions [15]. Evidence indicates that populations in regions with both hot summers and cold winters exhibit the greatest adaptability to thermal changes. However, a full evaluation of residents’ living conditions and comfort levels—crucial for effective urban planning—must consider both extreme land surface temperature (LST) thresholds and detailed population data [15,16]. Modern studies have increasingly compared thermal comfort indices, with the Universal Thermal Climate Index (UTCI) displaying the highest correlation with Predicted Mean Vote (PMV) values and showing greater applicability for outdoor thermal comfort assessment [17]. The UTCI is recognized for its comprehensive approach, accounting for both heat and cold stress, which allows its use across different climate conditions [18]. Urban greenery plays a vital role in cooling temperatures and reducing heat wave effects in cities, emphasizing the importance of green infrastructure in thermal management strategies [15].
The convergence of these methodological advances and considerations of human comfort is especially relevant in the context of rapidly urbanizing semi-arid regions, with Benguerir, Morocco, serving as a clear example of urban climate dynamics. The city has undergone rapid urban growth in recent years, significantly changing its land use and land cover (LULC) patterns [19,20]. These changes have had widespread effects on regional ecology, surface temperature, humidity, and climate conditions, including rising surface temperatures and decreased precipitation, evaporation rates, and hydrological processes [21]. Located in a semi-arid area, Benguerir increasingly faces extreme heat conditions, with a notable expansion of ‘very hot’ areas, highlighting the urgent need for comprehensive climate adaptation strategies [22]. The choice of Benguerir for this study reflects its status as a rapidly growing North African urban center, exemplifying major climate challenges faced across the region. The city’s ongoing development, driven by industrial expansion and regional planning efforts, makes it an ideal place to study the intersection of rapid urbanization and climate vulnerabilities. As a typical semi-arid city, Benguerir offers valuable insights into localized urban heat island effects and thermal comfort issues often overlooked in research focused solely on large metropolitan areas. This research gap is especially important since urban heat island studies have largely concentrated on megacities, while secondary cities in arid and semi-arid zones remain under-studied despite their particular vulnerabilities [23]. Furthermore, Benguerir is of considerable policy interest due to its strategic role in regional development plans, including industrial zones and infrastructure investments. Its evolving urban landscape provides unique opportunities to evaluate the effectiveness of climate resilience measures in similar North African contexts [24]. The planned expansion within a semi-arid climate presents specific challenges for sustainable urban development and climate resilience [25,26], while the city’s transformation from rural to urban hub offers an important case for analyzing how land cover changes, urban form, and human activities influence local climate over time [27,28]
A fundamental aspect of comprehending urban transformations is acknowledging that Land Surface Temperature (LST) serves as a crucial indicator of urban environmental quality, significantly influencing human thermal comfort, energy consumption patterns, and urban ecosystem functioning [22]. Temperature variations associated with urban heat islands can result in increased energy consumption for cooling, exacerbate air pollution conditions, and negatively impact human health outcomes [29]. Consequently, monitoring and understanding LST patterns in urban areas is essential for urban planners and policymakers in developing effective strategies to mitigate UHI effects and enhance overall urban livability [30]. This study examines the influence of urbanization on local climate patterns by exploring the relationships between LST and UHI effects [31]. By incorporating biophysical indices such as NDBI and BU areas, this research provides a comprehensive understanding of urban thermal environments. The results of the multi-regression analysis have the potential to guide urban planning strategies and mitigation measures addressing challenges posed by increasing urbanization and associated thermal effects. To achieve these objectives, this research quantifies the relationships between urbanization and thermal conditions while identifying factors driving LST variations across Benguerir’s urban landscape through the combination of multi-temporal remote sensing data with spatial analysis methods. Thermal comfort indices, particularly the Predicted Mean Vote (PMV) and Universal Thermal Climate Index (UTCI), were evaluated using air temperature and humidity data collected through mobile sensor platforms within the Sniffer Bike network [32,33]. This methodological approach aligns with contemporary practices in thermal comfort research, where UTCI has demonstrated superior performance in outdoor thermal comfort assessment across various climatic conditions [34]. Furthermore, this comprehensive approach addresses the well-documented gap in UHI research, which, despite being extensively studied across various climate zones, remains under-researched in cities within arid and semi-arid regions. Benguerir’s rapid growth highlights the unique vulnerabilities of these areas, where limited green infrastructure, high solar exposure, and increasing impervious surfaces exacerbate warming trends. While previous studies have examined LST dynamics in global megacities, few have combined high-resolution thermal remote sensing with field-collected microclimate data and thermal comfort modeling in emerging North African urban centers. This study addresses this significant research gap by integrating multi-temporal satellite data with in-situ sensor networks to analyze thermal evolution, its drivers, and implications for climate-resilient planning. The outcomes of this investigation provide essential insights for sustainable urban planning in Benguerir and other developing Moroccan cities. As Morocco pursues ambitious urban development goals while addressing climate change challenges, evidence-based strategies for managing urban heat are essential for creating livable, energy-efficient, and climate-resilient urban environments [19]. The findings contribute to a broader understanding of urban climate adaptation in semi-arid regions and inform policy development for similar contexts globally, particularly as remote sensing technologies continue to advance in their capacity to monitor and assess urban thermal environments [23].
2. Materials and Methods
2.1. Study Area
Benguerir (32.23680° N, −7.950349° W) is strategically located in the Rhamna subdivision of Morocco’s Marrakech-Safi region (Figure 1). This predominantly rural area, situated in the northern part of the region, is marked by rugged terrain at an elevation of 445 m above sea level. The city experiences a semi-arid climate with significant temperature fluctuations, ranging from minimum temperatures of 4.3 °C to 5.1 °C to maximum temperatures of 37.5 °C to 39.3 °C [35]. The region receives some of the lowest precipitation levels in Morocco, leading to persistent structural droughts that mirror broader climate challenges across the country [36]. The area includes the Rhamna Massif and Gantour Plateau, both rich in phosphate deposits, which underpin the region’s economic activities [37]. The Office Chérifien du Phosphate (OCP), Morocco’s leading mining exploration company, has ambitious plans to transform Benguerir into an innovative and sustainable city, making it an ideal natural laboratory for urban climate research [38].
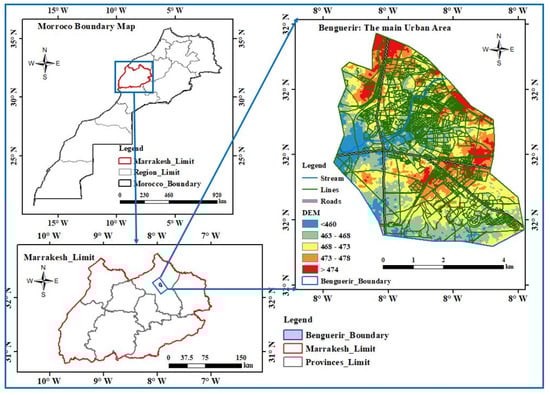
Figure 1.
Location map of the study area.
Furthermore, the selection of Benguerir as a case study is particularly justified by its unique convergence of extreme climate vulnerability, planned sustainable development, and rural-to-urban transition. This planned transformation, coupled with the area’s water scarcity, temperature extremes, and persistent drought conditions, offers a rare opportunity to study urban climate dynamics in a resource-constrained environment representative of climate-stressed regions globally [39]. Studying spatial and temporal climate variations in Benguerir provides essential insights for both traditional and green city development, informing stakeholder decisions through critical climate parameters [40].
Understanding changes in local climate zones through surface temperature analysis offers baseline data for predictive modeling and evidence-based mitigation strategies, particularly important given the documented interplay between climate and urban expansion on building energy demand in Morocco [41]. This makes Benguerir an exceptionally relevant case study for advancing climate-responsive urban planning, with findings applicable to similar contexts globally facing the dual challenges of urbanization and climate change in arid and semi-arid environments [19].
2.2. Data and Methodology Adopted
The Landsat series has been predominantly utilized for Urban Heat Island (UHI) studies, as illustrated in Table 1. Landsat data are freely accessible via the USGS website (https://earthexplorer.usgs.gov, accessed on 10 March 2025). The study utilized Landsat 5/7 TM imagery for the years preceding 1994, 1999, 2004 and 2009, and Landsat 8/9 OLI/OLI/TIRS imagery for the subsequent years of 2014, 2019, and 2024. The remote sensing data used for detecting changes were obtained from a sensor system capable of generating LST and LULC information by utilizing multispectral and thermal data from Landsat with a spatial resolution of 30 m. Additionally, biophysical indices, such as the NDBI and BU, were derived from the downloaded datasets and subsequently applied to identify and quantify built-up or urban areas. All Landsat data used had less than 10% cloud cover. The advanced tools of ArcGIS 10.2 facilitated efficient spatial analysis and data visualization. Satellite imagery was imported and used for image processing to create accurate base maps. Various thematic layers were then overlaid to identify patterns and relationships in the geographic data [42,43].

Table 1.
Data Inventory lists and sources in the entire investigation.
Our study employed a Sniffer Bikes sensor equipped with an air pollution monitoring system (APMS_R2, Benguerir, Morocco) to collect air temperature and relative humidity data at ground level. Following data collection, the sensor underwent rigorous co-located calibration against a reference meteorological station at the Benguerir Central Meteorological Observatory as part of the processing analysis. This calibration procedure, along with the sensor specifications, was meticulously detailed to validate the quality of the ground-based measurements. To facilitate comparison between our mobile data and satellite observations, we implemented a spatiotemporal matching protocol utilizing LST data at a 30 m resolution. We averaged all Sniffer Bike measurements recorded at the local time of satellite passage (10:30) that fell within the boundaries of each 30 m satellite pixel. This method yielded a matched dataset that directly aligned the mean ground-level air temperature with the corresponding satellite-derived surface temperature (LST) for each grid cell, thereby enabling a robust comparative analysis. Consequently, this approach also allows us to calculate the error range by determining the Mean Absolute Error (MAE), Root Mean Square Error (RMSE), Mean Absolute Percentage Error (MAPE), Coefficient of Determination (R2), Bias and Correlation under clear-sky conditions from 2022 to 2024.
Furthermore, Sniffer Bike sensor data, which includes temperature and humidity, along with satellite-derived spatial data for 2022–2024, will be compared and validated with weather station data to assess their accuracy and contribution to the primary research.
Table 1 offers a detailed overview of the findings derived from the data processing and analysis carried out using ArcGIS 10.2 geospatial software. Before conducting biophysical analysis, radiometric calibration was executed to transform all data into sensor spectral radiance [44]. Following calibration, the data underwent atmospheric correction to remove the impacts of atmospheric scattering and absorption, thereby ensuring precise surface reflectance values.
2.3. Datasets Pre-Processing
This study employed multi-temporal Landsat satellite datasets, as detailed in Table 1, to evaluate the spatial distribution of LULC classes and to quantify LST and UHI effects, in accordance with established remote sensing methodologies for urban thermal analysis [45,46]. All data pre-processing operations were executed using ArcGIS 10.2 software, beginning with atmospheric correction via the Atmospheric Analysis and Correction Tool to mitigate atmospheric interference effects [47]. This was followed by the systematic overlay and merging of individual spectral bands from Landsat 5/7 TM and Landsat 8/9 OLI/TIRS to produce multi-band composite images, which were resampled to a uniform 30-m spatial resolution and projected to the WGS 84/UTM Zone 29N coordinate system [48]. LST estimation utilized established thermal infrared retrieval algorithms, employing Landsat 5/7 TM Band 6 (10.40–12.50 μm) and Landsat 8/9 OLI/TIRS Bands 10 and 11 (10.60–11.19 μm and 11.50–12.51 μm) through the systematic conversion of Digital Numbers (DNs) to top-of-atmosphere radiance, followed by brightness temperature calculation and emissivity correction procedures [49,50]. The investigation incorporated NDBI and BU as complementary spectral indices for urban area identification, leveraging the enhanced reflectance characteristics of built-up surfaces in shortwave infrared bands compared to near-infrared bands [51]. UHI analysis integrated LST data with LULC classifications using Surface Urban Heat Island intensity calculations through temperature difference approaches, comparing urban surface temperatures with surrounding non-urban reference areas, with the complete analytical workflow illustrated in Figure 2.
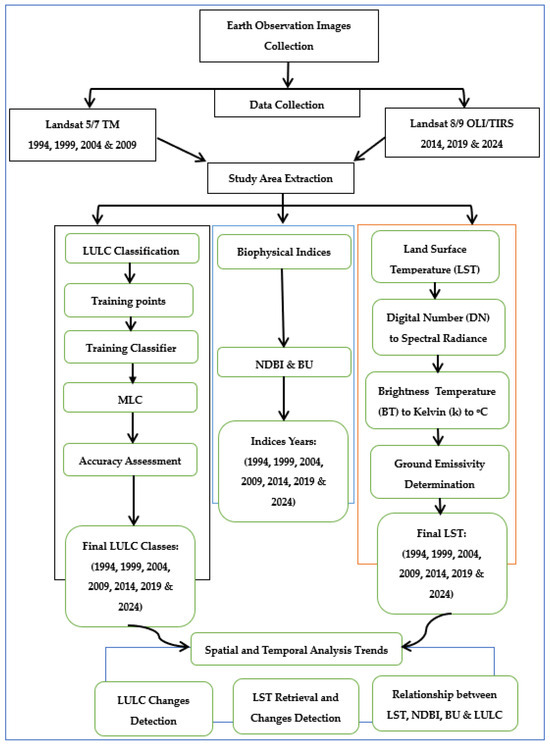
Figure 2.
Flowchart Diagram of this study.
2.4. LULC Classification and Accuracy Assessment
Land use and cover maps are commonly generated using data acquired through remote sensing techniques. This study employs the Maximum Likelihood Classification (MLC) method, a widely utilized supervised classification technique with diverse applications [52,53]. Furthermore, MLC’s efficacy in various remote sensing applications, such as land cover and land use classification, underscores its practicality and efficiency. For example, research has demonstrated that MLC achieves competitive accuracy rates comparable to more advanced methods like Support Vector Machines (SVM) and Artificial Neural Networks (ANN) in urban land cover classification tasks using multispectral imagery [54]. Additionally, MLC generally demands less computational power than techniques such as Random Forests (RF), Support Vector Machines (SVM), or Convolutional Neural Networks (CNN) [47]. When the spectral signatures of land cover classes in the study area approximate normal distributions, MLC can be particularly effective. MLC offers advantages over other parametric classification methods as it accounts for the variance-covariance within class distributions [43,55]. To analyze the land cover distribution, images from 1994, 1999, 2004, 2009, 2014, 2019 and 2024 were classified. To enhance the visualization of urban areas, composite imagery with specific band combinations was utilized for Landsat 5/7 TM and Landsat 8/9 OLI/TIRS images. The classification process involved three signature classes: Bare Soil, Built-up area, and Vegetation. The Built-up area encompasses residential structures, roads, industrial sites, and commercial buildings, while Bare Soil refers to unused land, and Vegetation denotes areas with greenery. Training areas were established by selecting one or more polygons for each class, with pixels from these areas serving as the training pixels.
2.5. Accuracy Assessment
Accuracy assessment or validation is an essential component of any project involving spatial data [56,57]. The spatial distribution of various land use and land cover (LULC) classes was validated by comparing classification results with high-resolution imagery from Google Earth, supplemented by field samples consisting of 50 ground-based training samples for each LULC class. To evaluate accuracy, overall accuracy, user accuracy, producer accuracy, and kappa statistics were calculated, as these represent some of the most effective quantitative methods for assessing image classification accuracy [58,59]. The estimation of accuracy for LULC classification for 1994, 1999, 2004, 2009, 2014, 2019 and 2024 was based on detailed field knowledge and surveys conducted as part of studies in the area.
In the context of the confusion matrix, N represents the relationship between the total number of pixels. The variable r denotes the number of classes, while k indicates the position of additional pixels within the rows and columns, specifically denoted as xkk. Within the error matrix, x+k refers to the total number of samples in column k, whereas xk+ represents the total number of samples in row k.
2.6. Computation of Land Use Indices
In this study, a range of biophysical indices derived from remote sensing data were utilized to investigate annual landscape changes. Specifically, the biophysical indices NDBI and BU were calculated to assess the spatial and temporal dynamics of built-up areas and bare soil, respectively [60]. The emphasis on built-up areas by NDBI is particularly significant for this research. Recently, it has been employed to determine the extent of built-up regions [12]. Given the strong correlation between NDBI and LST, it is essential to compare them. As built-up areas expand, impervious surfaces increase, leading to a rise in LST. The NDBI focuses on built-up elements; thus, the NDBI-LST relationship underscores the influence of built-up areas on the overall increase in surface temperature [22,61]. Equation (5) was employed to evaluate the NDBI within the study area.
where SWIR denotes shortwave infrared reflectance, whereas NIR refers to near-infrared reflectance. NDBI values ranged from −1 to +1, with negative values indicating the presence of water bodies and higher values signifying built-up areas. The vegetation typically exhibited low NDBI values.
The Built-Up Index (BU) is an analytical method employed in remote sensing to identify and evaluate urban areas through the analysis of satellite imagery. This index is particularly effective in distinguishing between urban expansion and natural land cover, which is essential for comprehending the dynamics of urbanization and planning sustainable urban development [62]. The Built-Up Index (BU) is another widely utilized method for identifying urban areas by analyzing various bands of satellite imagery to differentiate between urban expansion and natural land cover [63]. To enhance our analysis of urban patterns, we integrated BU with NDBI and NDVI. Consequently, the BU is represented by the following formula:
The Built-Up Index serves as a binary indicator, wherein elevated positive values denote built-up and barren areas, thereby enabling the automated detection of urban regions.
2.7. Land Surface Temperature (LST) Estimation
The Land Surface Temperature (LST) refers to the temperature of the Earth’s surface as detected through radiation, influenced by solar energy. In this research, to ascertain LST, raw thermal band data (band 6 from Landsat 5/7 (TM) and band 10 from Landsat 8/9 (OLI/TIRS)) were converted into spectral radiance data using the methods outlined by [64,65]. The process began by calculating the radiance at the top of the atmosphere (TOA) by applying a radiance scaling factor. Next, the thermal infrared digital number (DN) was transformed into TOA spectral radiance by incorporating the thermal bands from Landsat 5/7 (TM) and Landsat 8/9 (OLITIRS) data (Equation (7)). This was followed by determining the brightness temperature (BT) at the atmospheric surface using thermal constants from the metadata file (Equation (8)). The subsequent steps included calculating the vegetation fraction (Equation (9)) and land surface emissivity (Equation (10)), both derived from Normalized Difference Vegetation Index (NDVI) values. Land surface emissivity (LSE) indicates the average emissivity of a surface element on Earth. Finally, the calculated brightness temperature (BT), the wavelength of the emitted radiation, and land surface emissivity (E) were combined in a comprehensive equation (Equation (11)) to determine the land surface temperature (LST). Initially, the top-of-atmosphere radiance (TOA = λL) was evaluated.
In this context, Lλ denotes the top-of-atmosphere (TOA) spectral radiance, expressed in (Watts/ (m2 × sr × µm)). ML represents the Radiance Multiplicative Band (No), AL signifies the radiance added band (No), and Qcal refers to the quantized and calibrated standard product pixel value (DN). Subsequently, the brightness temperature (BT) was determined using the following equation:
where BT refers to the Brightness Temperature at the top of the atmosphere, measured in degrees Celsius, while Lλ represents the TOA spectral radiance, quantified in (Watts/ (m2 × sr × µm). K1 and K2 are the thermal conversion constants specific to each band, with K1 expressed (in watts/m2 × sr × µm) and K2 in Kelvin (Table 2). To determine LST, we initially assessed the Proportion of Vegetation (PV).
Table 2.
Thermal constants for Landsat 5/7 and Landsat 8/9.
In this context, PV denotes the proportion of vegetation, whereas NDVI refers to the DN values obtained from the NDVI image. NDVImin and NDVImax represent the minimum and maximum values from the NDVI image, respectively. Subsequently, the Land Surface Emissivity (ε) was evaluated.
where ε represents Land Surface Emissivity, while PV denotes the Proportion of Vegetation. The Land Surface Temperature is calculated by integrating the top-of-atmosphere Brightness Temperature (BT), the central wavelength (μm) of the Landsat thermal band, and the Land Surface Emissivity.
In this context, λ denotes the central wavelength (μm) of the Landsat thermal band, with p equal to 1.438 × 10⁻² m. Land Surface Temperature (LST) data were employed to demonstrate the impact of temperature on plant health. Elevated temperatures and low humidity can adversely affect plant growth.
Table 2 outlines the thermal constants for Landsat 5/7 and Landsat 8/9, which are utilized to determine the Brightness Temperature at the top of the atmosphere in degrees Celsius. In this context, K1 and K2 denote the thermal conversion constants unique to each band, with K1 measured in (watts/m2 × sr × µm) and K
2.8. Surface Temperature Variation and Thermal Comfort in Benguerir
The Universal Thermal Climate Index (UTCI) and Predicted Mean Vote (PMV) were calculated using microclimatic data gathered through the Sniffer Bike initiative, a mobile urban sensing platform equipped with calibrated temperature-humidity sensors attached to commuter bicycles. The Universal Thermal Climate Index (UTCI) calculation incorporates several key environmental variables, such as air temperature, relative humidity, wind speed and mean radiant temperature, which is estimated using land surface temperature (LST) proxies. These parameters collectively shape the human thermal environment by influencing heat exchange mechanisms like convection, radiation, and evaporation [47]. The mean radiant temperature, indirectly derived from LST data, approximates the thermal radiation load on the human body, thereby aiding in the assessment of outdoor thermal stress levels under varying climatic conditions. Conversely, the Predicted Mean Vote (PMV) is a widely adopted index designed to evaluate thermal comfort, particularly in indoor and outdoor settings during warm seasons. As specified by ISO 7730 standards, the PMV calculation relies on several critical parameters, including metabolic rate, clothing insulation, air temperature, mean radiant temperature, air velocity, and relative humidity [66]. Each of these parameters plays a significant role in assessing thermal comfort.
According to ISO 7730, the PMV is determined based on empirical relationships that consider the metabolic rate linked to activity levels and the insulation provided by clothing [67]. The standard values for metabolic rate and clothing insulation are crucial as they influence the heat exchange between the human body and the external environment. Outdoor thermal assessments often include alternative thermal indices, such as the Universal UTCI, alongside PMV to comprehensively evaluate thermal comfort [68]. The necessity for such comprehensive evaluation methods is highlighted by the varying effects of metabolic rate and clothing insulation, which can significantly impact thermal comfort, especially in extreme or fluctuating climates [69]. Although approximate, this hybrid approach enables the mapping of meaningful thermal comfort in urban areas with limited data.
2.9. Multi-Linear Regression Approach and Use of Q-Q Plots Test
Multi-linear regression models were constructed to quantify the predictive strength of urbanization indices (NDBI, BU) on LST from 1994 to 2024. Residual diagnostics (normality, homoscedasticity), multi-collinearity checks (VIF < 2), and adjusted R2 were reported to ensure statistical robustness. All spatial analyses were performed in QGIS 3.4 and R 4.2.2 [70]. The model can be represented as [71]:
In this equation, Y signifies the dependent variable, while X1…X4 stand for the independent variables, and β0…β4 are the coefficients that need to be estimated. The symbol ε represents the error term. Linear regression is widely applied in numerous fields due to its ease of interpretation and computational efficiency [71]. Nevertheless, despite its straightforward nature, the method relies on several crucial assumptions for its validity, such as linear relationships, independence of errors, homoscedasticity, and the normal distribution of errors [72]. To enhance the clarity and robustness of our regression analysis, we incorporated confidence intervals for all regression coefficients, thereby indicating the precision of our estimates. Additionally, we specified that our analysis employed 100 observations per year, ensuring an adequate sample size for the regression models. These diagnostic details facilitated a more comprehensive evaluation of the reliability and significance of our findings.
On the other hand, we used Quantile-Quantile (Q-Q) plots, which are essential graphical tools in statistical analysis for evaluating the normality of a dataset [66,73]. These plots juxtapose the quantiles of the observed data with the theoretical quantiles of a normal distribution. By plotting these quantiles against one another, researchers can visually assess whether the data conforms to a normal distribution. If the points on the Q-Q plot align approximately along a straight line, it indicates that the data is normally distributed. Deviations from this line suggest departures from normality, which are critical in determining the suitability of certain statistical tests and models [74].
In the realm of multi-linear regression analysis, Q-Q plots are instrumental in validating the assumption of normally distributed residuals. Following the fitting of a regression model, the residuals (the differences between observed and predicted values) should ideally exhibit a normal distribution for the model to be deemed valid [75].
3. Results
3.1. Land Use Land Cover Changes Analysis
From 1994 to 2024, changes in LULC categories were detected using Landsat images analyzed with the Maximum Likelihood Classification (MLC) method, as shown in Table 3 and Figure 3. The accuracy of the LULC maps was assessed using kappa statistics, user accuracy, producer accuracy, and overall classification accuracy.
Table 3.
Areal distribution of different LULC classes in the study area from 1994 to 2024.
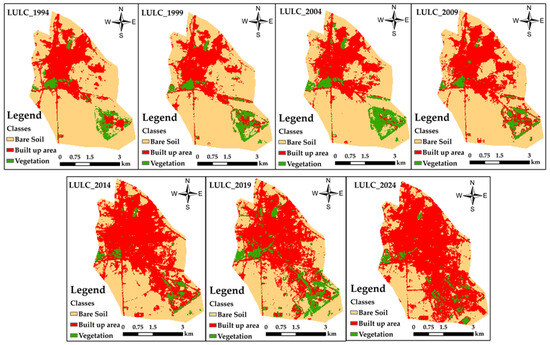
Figure 3.
Spatial Distribution of LULC of Benguerir City in (1994–2024).
Over the last 30 years, built-up areas have grown from 27.58% (6.57 km2) in 1994 to 28.20% (6.72 km2) in 2004 and further increased to 52.27% (12.45 km2) and 63.96% (15.22 km2) in 2014 and 2024, respectively. Simultaneously, vegetative land decreased from 6.18% (1.47 km2) in 1994 to 4.80% (0.91 km2) and 4.21% (1.00 km2) in 2024, with an increase in planted green space due to the construction of the Mohammed VI Polytechnic University, reaching 11.10% (2.64 km2) in 2019.
Two notable patterns were observed in the LULC categories. The first trend is a significant rise in urban areas, and the second is a noticeable decline in vegetation and bare soil. The overall shift in LULC categories reveals that urban regions were the only areas to witness substantial growth over the last three decades, increasing by +57.36%, whereas bare soil experienced a significant reduction, with a net change of −8.17% from 1994 to 2024. Several elements have driven the expansion of Benguerir’s urban zones. As detailed in Table 4, the overall classification accuracies for 1994, 1999, 2004, 2009, 2014, 2019 and 2024 were 89%,85%, 86%, 88%, 87%, 87%, and 88%, respectively, demonstrating a high level of accuracy (Table 4).
Table 4.
LULC Classification Accuracy Assessment Summary for Benguerir (1994–2024).
A recent report highlighted that the significant expansion of Benguerir’s city area in recent years was primarily attributed to a notable surge in population and urban development initiatives [19]. This rapid increase in population has necessitated a significant expansion of the urban area to accommodate new housing, essential infrastructure, and the growing demand for various services.
3.2. Land Surface Temperature Changes
Each year, LST was determined using the equations outlined in Section 2.7, covering the years 1994, 1999, 2004, 2009, 2014, 2019 and 2024, as depicted in Figure 4. LST is a crucial metric because it represents the lowest layer of the urban atmosphere, indicating changes in surface energy and the effects of urban elements on air temperature. The LST data were divided into temperature zones that reflected yearly temperature observations. Above 42 °C, the historical trend of annual LST changes during the study period exhibited a notable shift, as illustrated in Figure 4. From 1994 to 2024, the area classified under high LST categories, such as >30.8 °C, consistently expanded in Benguerir. Conversely, the area within the LST category of < 30.8 °C decreased between 1994 and 2024 as this region transitioned into a high-temperature zone.

Figure 4.
Spatial Distribution of LST for Benguerir in 1994–2024.
Figure 4 illustrates the variations of minimum and maximum annual LST, with the average in 1994, 2004, 2014 and 2024 of 29.79 °C, 32.05 °C, 37.27 °C and 43.09 °C, respectively. By 2024, the peak maximum LST reached 46.30 °C, compared to 33.90 °C in 1994. The trend of the highest LST remained consistent with that in 1994. From 1994 to 2024, the annual mean LST in the study area increased by 13.3 °C. In 2024, the lowest minimum and highest maximum temperatures increased during this period, reaching 36.43 °C and 46.30 °C, respectively. An approximate increase of 12.81 °C in the annual maximum LST was observed from 1994 to 2024 in the study area (Table 5).
Table 5.
LST Distribution from 1994–2024.
The areal variation of LST in Benguerir city was divided into five categories, with temperatures ranging from less than 29.79 °C to more than 37.27 °C. The findings indicated that areas with lower LST values decreased from 1994 to 2024. Conversely, an upward trend was observed in areas with higher LST values during the same period in the study region.
3.3. LST Statistical Analysis by Land Use Class (1994–2024)
The examination of LST in Benguerir from 1994 to 2024 revealed a significant temperature rise, largely attributed to urban expansion and land changes. The urban heat island (UHI) effect has intensified as developed regions grow, resulting in the degradation of natural features like vegetation, which usually aid in cooling the area. Built-up area shows an increase of mean LST from 29.34 °C in 1994 to 41.82 °C in 2024 (Table 6), demonstrating the influence of urbanization on vegetation’s role in microclimate regulation. Vegetation in Benguerir saw a 12.39 °C increase in mean LST (1994–2024), highlighting its vulnerability to urban development pressures. Nonetheless, a study conducted in Benguerir city from 2000 to 2020 observed that bare soil and low-rise urban zones experienced higher LST due to scarce vegetation and heat buildup, with the temperature disparity between urban and peri-urban areas widening [76]. The warming of vegetation underscores the necessity of urban planning that prioritizes conservation and restoration to mitigate temperature rises.
Table 6.
LST Statistics by Land Cover Type (°C).
From 1994 to 2024, the mean LST in areas with vegetation rose by 12.39 °C, with the most notable increase occurring after 1994 (Figure 4). Nevertheless, from 1994 to 2024, the rapid increase in LST underscores the significance of implementing sustainable urban planning, such as incorporating green infrastructure, to alleviate the UHI effect and enhance urban living conditions Figure 5. This suggests that urbanization noticeably increases LST and intensifies the UHI.
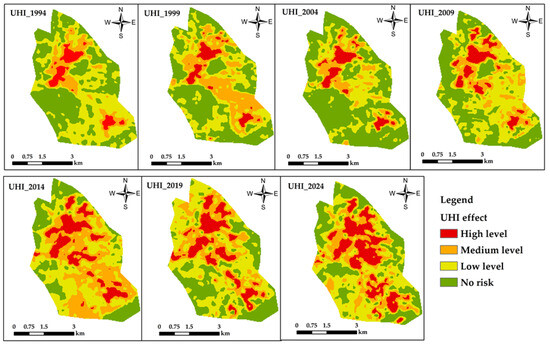
Figure 5.
Urban Heat Island distribution of Benguerir in (1994–2024).
Figure 5 shows a spatial view of the current Urban Heat Island (UHI) phenomenon, divided into four categories from “High level” (shown in red) to “No risk” or “null” (shown in green). Areas with null UHI effects are mostly the city’s main urban parks, highlighting the important role of vegetation in reducing ambient temperatures. Conversely, the historic center and nearby residential districts show moderate to high UHI levels, while some upstream and downstream areas have lower intensity, depicted in yellow. The highest UHI values in Benguerir are found in urbanized and industrial zones, which are characterized by large impervious surfaces and a notable lack of green spaces.
3.4. Temperature Variations in Different LULC Classes
According to Table 7, the built-up area exhibited the highest temperature, followed by bare soil and vegetation. The present study also revealed that since 1994, the annual LST has increased across all LULC categories, including vegetation. The expansion of impervious surfaces and developed areas significantly contributed to the increase in LST, reaching 41.82 °C. As indicated in Table 7, the LST increased for all LULC categories in the study region between 1994 and 2024. A significant portion of the study area experienced elevated temperatures in built-up zones, followed by bare soil and vegetation.
Table 7.
LST Change by Land Cover Type.
3.5. Comparison Between Sniffer Bike Sensor Data and Satellite-Derived Spatial Data
A comparison of Sniffer Bike sensor data, which includes temperature and humidity, with satellite-derived spatial data can evaluate the dependability and complementary advantages of both datasets by examining correlations, biases, and spatial differences [77]. Sniffer Bike offers high-resolution, ground-level data along cycling paths, whereas satellites provide wider but less detailed coverage, with significant differences in the types of measurements (air versus land surface temperature) and resolutions (both temporal and spatial). Indeed, spatial heatmaps can highlight local variations, especially in urban areas where microclimates or sensor-satellite mismatches might occur [34,78]. This comparison aids in validating mobile sensor networks, enhancing urban climate models, and identifying optimal use cases by revealing a significant trend from 2022 to 2024 for each data source (Figure 6). Comparing Sniffer Bike sensor data with satellite-derived spatial data enhances the analysis of how the high-frequency Sniffer Bike measurements complement the less frequent satellite observations to capture diurnal and short-term temperature/humidity variations [33,79]. Compare the detailed spatial patterns detected by Sniffer Bikes along urban routes with the broader patterns seen in satellite imagery [16]. Investigate how the relationship between the two data sources varies across seasons, particularly during extreme heat events [80]. Comparing long-term climate trends identified by satellites with the more recent but detailed Sniffer Bike data helps to understand urban climate evolution.
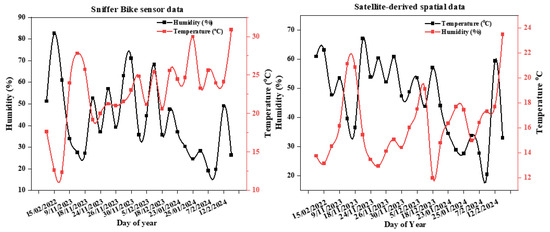
Figure 6.
Temperature and Humidity distribution for Benguerir city (2022–2024).
To evaluate uncertainties, we conducted a comparative analysis between interpolated sniffer bike data and satellite-derived land surface temperature (LST). The satellite LST data provided extensive spatial coverage, allowing us to evaluate the representativeness of our sniffer bike measurements across the urban landscape (Figure 6). We identified a strong correlation between the two datasets, with bicycle measurements generally corresponding well with satellite-derived temperatures. Nonetheless, discrepancies were noted in areas characterized by complex urban geometries or rapid temperature fluctuations, underscoring the necessity for further investigation into these microclimate phenomena. To enhance our understanding, a comprehensive analysis of prediction accuracy for meteorological variables is conducted using Error Metrics Comparison, includes Mean Absolute Error (MAE), Root Mean Square Error (RMSE), Mean Absolute Percentage Error (MAPE), Coefficient of Determination (R2), Bias and Correlation under clear-sky conditions, as detailed in Table 8.
Table 8.
Comprehensive Error Metrics Comparison-Benguerir City (2022–2024).
The comprehensive analysis shows that the temperature and humidity forecast models for Benguerir City perform consistently from 2022 to 2024. The models have high R2 values of about 0.93 to 0.96 and strong correlations of about 0.98, indicating a reliable fit and a linear relationship. The prediction errors, which are evaluated using MAE, RMSE and MAPE, show that the temperature predictions are significantly more accurate. The MAE value remains below 1.3, the RMSE value is slightly higher, and the MAPE value is around 5 to 6%, which indicates very accurate predictions. In contrast, the predictions for humidity are less accurate, with an MAE between 2.4 and 3.0, a similar trend for the RMSE, and an MAPE of around 7 to 8%. Over the years, the errors have increased slightly, especially for temperature, and the biases indicate a systematic overestimation of temperature and an underestimation of humidity in 2024. Overall, the models provide accurate and reliable forecasts over the entire study period.
3.6. Distribution of the Normalized Difference Built-Up Index in Benguerir (1994–2024)
From 1994 to 2024, NDBI values in Benguerir steadily increased in developed areas, reaching a maximum of 0.12 in 1994 and 0.19 in 2004. This figure rose to 0.37 by 2014, indicating rapid urban expansion. By 2024, the maximum value had climbed to 0.42, suggesting that the built-up areas were nearing their limits (Figure 7).
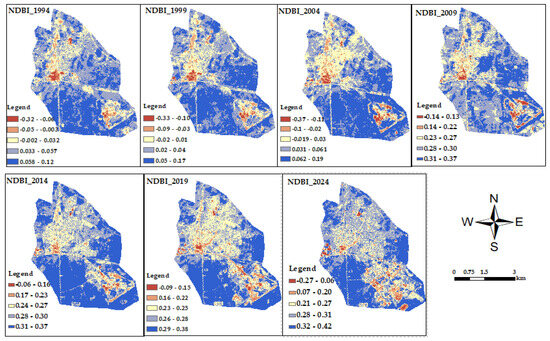
Figure 7.
Spatial Distribution of NDBI in Benguerir (1994–2024).
This trend mirrors global patterns, such as in Cairo, where urbanization has transformed agricultural land, leading to higher NDBI values [81]. The increase in impervious surfaces in Benguerir has exacerbated the UHI effect and decreased groundwater recharge. The stabilization of the NDBI in 2024 implies a potential cap on urban growth, highlighting the challenges in managing population increase and infrastructure development.
3.7. Correlation Between Land Surface Temperature and Biophysical Indices (NDBI, BU)
Analysis of the correlation matrix for Benguerir City across different time periods (1994, 1999, 2004, 2009, 2014, 2019, and 2024) revealed several significant patterns in the relationships among LST, UHI, NDBI, and BU, as shown in Figure 8. The correlations show temporal variation, with LST and UHI consistently demonstrating strong positive relationships, ranging from 0.39 in 1999 to 0.15 in 2009, highlighting their close association in urban heat dynamics. NDBI and BU display variable correlations over time, with strong positive values like 0.17 in 1994, shifting to weaker links in later years, such as 0.32 in 2019. Notably, the 2024 data reveal some negative correlations, particularly between LST and UHI (−0.20), and UHI and NDBI (−0.07), suggesting a possible shift in urban development patterns or measurement methods. The built-up areas generally show weak to moderate correlations with other variables throughout most years, with values typically between −0.15 and 0.32, indicating that urban growth in Benguerir may not consistently relate to temperature increases or heat island effects.
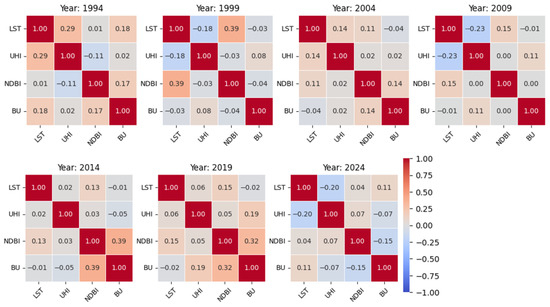
Figure 8.
Correlation Matrices between LST, UHI and biophysical indices (NDBI, BU).
Overall, the matrices indicate that the connections between land surface temperature and urban variables such as UHI have become significantly stronger over time, while the correlations involving NDBI and BU show some fluctuations, suggesting changing dynamics in how built environmental factors relate to temperature and urban heat island effects.
The correlation coefficient (r) ranges from −1 to +1, with values near +1 indicating a strong positive correlation, values near −1 indicating a strong negative correlation, and values close to 0 suggesting little or no correlation. The p-value indicates the likelihood that the observed correlation happened by chance under the null hypothesis; a p-value below 0.05 is typically considered statistically significant, suggesting a meaningful relationship rather than a random occurrence.
The scatter plots in Figure 9 depict the diverse and evolving relationships between LST, NDBI, BU, and UHI intensity in Benguerir City from 1994 to 2024. Each subplot is dedicated to a specific year and variable pair, displaying regression lines, confidence intervals, correlation coefficients (r), and p-values (p). The correlations between LST and NDBI exhibited temporal variations, beginning with a weak negative correlation in 1994 (r = −0.08, p = 0.452), transitioning to a weak negative correlation in 2004 (r = −0.11, p = 0.261), becoming non-significant in 2014 (r = −0.04, p = 0.700), and remaining minimal in 2024 (r = 0.03, p = 0.740). The relationships between LST and BU consistently demonstrated weak correlations throughout the study period, with values ranging from r = −0.06 (1994) to r = 0.03 (2024), all indicating non-significant associations (p = 0.05). The UHI and NDBI relationships displayed moderate correlations in the earlier years (r = 0.06 in 1994 and 2004, p = 0.580 and 0.579, respectively) before weakening in the later periods (r = −0.07 in 2014, r = 0.12 in 2024). Similarly, the correlations between UHI and BU show a declining trend from moderate positive associations in 1994 (r = 0.08, p = 0.445) to weaker relationships in subsequent years, with 2004 exhibiting the strongest correlation (r = 0.21, p = 0.037) before declining to r = −0.09 (2014) and r = 0.10 (2024). These patterns suggest that the relationships between urban development indicators and temperature metrics in Benguerir City have become increasingly complex and less predictable over the 30-year period, potentially reflecting changes in urban planning, land-use patterns, or local climate dynamics.
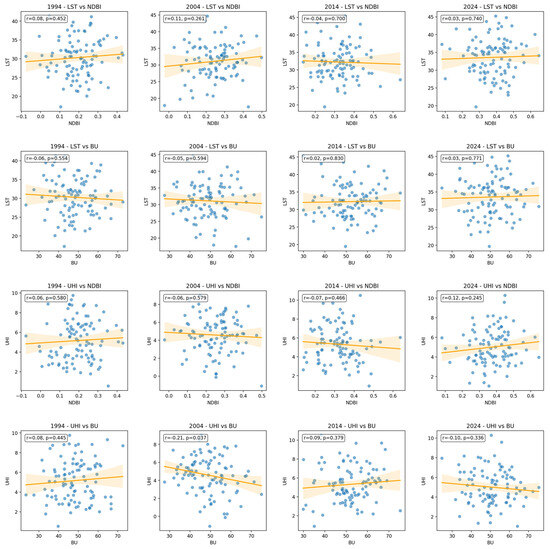
Figure 9.
Scatter plots show the relationship between LST, NDBI and BU from 1994 to 2024.
The Q-Q plots for Benguerir City provide an assessment of the normality of the relationships between NDBI and LST, as well as between BU and LST, across four distinct time periods (1994, 2004, 2014, and 2024), as shown in Figure 10. These plots illustrate that both relationships show noticeable linear patterns, with data points generally aligning with the theoretical quantile line, thereby indicating approximately normal residual distributions. The correlations between NDBI and LST ranged from moderate to strong, with coefficients between r = 0.48 and r = 0.60, whereas the correlations between BU and LST consistently demonstrated stronger coefficients, ranging from r = 0.77 to r = 0.83 across all years. The Q-Q plots reveal some deviations from normality at the extreme quantiles, as evidenced by points diverging from the theoretical line, particularly visible in the residual plots located in the upper right corners of each subplot. These deviations suggest slight non-normality in the data distribution, with some outliers. However, the overall linear trend in the main plots indicates that the relationships between these urban indices and land surface temperature are robust and statistically significant (all p-values < 0.001). This demonstrates that both built-up areas and the normalized difference built-up index are reliable predictors of surface temperature patterns in Benguerir over the 30-year study period.
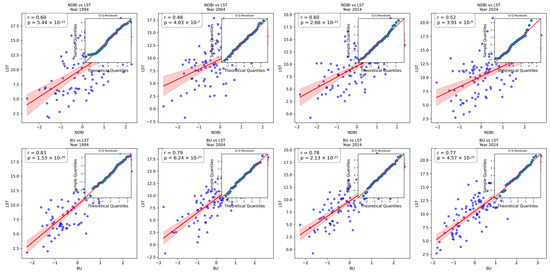
Figure 10.
Q-Q plots for Benguerir across four distinct time periods (1994, 2004, 2014, and 2024).
3.8. Thermal Comfort Analysis of Benguerir City (1994–2024)
Transforming permeable surfaces into impermeable ones in urban settings alters local energy dynamics and exacerbates the urban heat island effect, particularly in densely populated cities [82]. In areas with warm and humid climates, enhancing outdoor thermal conditions is essential, particularly because a large number of people live in informal housing [83] (Figure 11).

Figure 11.
Detailed Thermal Comfort analysis of Benguerir (1994–2024).
Additionally, integrating water features and permeable surfaces can further boost the cooling effect, making outdoor areas more comfortable and pleasant for inhabitants. This research, however, employed thermal comfort indices like UTCI calculation, which considered air temperature, relative humidity, wind speed (assumed to be an average of 1.5 m/s), and mean radiant temperature derived from LST proxies, whereas PMV is a widely used index for assessing thermal comfort in various environments, including outdoor settings during the summer. Furthermore, the use of a fixed wind speed of 1.5 m/s in calculating the Universal Thermal Climate Index (UTCI) and Predicted Mean Vote (PMV) simplifies the process but may overlook local wind field variations, potentially impacting the results.
This approach was chosen based on standard comfort assessment practices to ensure consistency across different urban areas, making it easier to compare locations and simplify the computational process. However, it is important to acknowledge that assuming a constant wind speed might lead to an overestimation of thermal comfort in areas with higher wind speeds, an underestimation in areas with lower wind speeds, and reduced sensitivity to microclimatic variations within urban environments. To address this limitation, future research could incorporate more local wind field data or use computational fluid dynamics (CFD) simulations to estimate site-specific wind speeds, thereby improving the accuracy of thermal comfort predictions. Additionally, a sensitivity analysis could be performed by varying wind speeds within a realistic range (e.g., 0.5 m/s to 3 m/s) to assess the impact of this assumption on UTCI and PMV values.
The thermal comfort analysis of Benguerir City from 1994 to 2024 in Figure 11, indicates a troubling trend of increasing thermal stress over this 30-year period. The predicted mean vote (PMV) distributions show a gradual transition from near-neutral conditions in 1994 (mean: 1.60, Std: 0.25) to increasingly warm conditions by 2024 (mean: 2.09, Std: 0.41), with all years displaying PMV values significantly exceeding the thermal neutrality threshold. Similarly, the Universal Thermal Climate Index (UTCI) distributions reveal an increase in heat stress, with mean temperatures rising from 30.9 °C in 1994 to 34.7 °C in 2024, accompanied by heightened variability (standard deviation increasing from 7.1 °C to 9.3 °C).
The thermal comfort category distributions illustrate a marked decline in comfort conditions. In 1994, the population experienced 34.2% slight warmth and 65.8% hot conditions, whereas by 2024, this shifted to predominantly hot conditions (76.7%) with the emergence of very hot conditions (16.2%) and only 7.1% experiencing slight warmth.
This analysis suggests that Benguerir City has undergone significant intensification of thermal stress for over three decades, with the majority of the population now encountering uncomfortable hot conditions, reflecting broader climate change impacts and urban heat island effects in the region. This trend suggests growing thermal discomfort for residents, a heightened risk of heat-related health issues, and challenges in maintaining energy efficiency. It highlights the impact of climate change and the urgent need for urban planning and climate adaptation strategies to mitigate these extreme temperatures and improve overall thermal comfort [15] (Figure 12).

Figure 12.
LST vs. UHI distribution in Benguerir (1994–2024).
This figure illustrates the significant evolution of Land Surface Temperature (LST) and Urban Heat Island (UHI) effects in Benguerir, Morocco, from 1994 to 2024, analyzed from three different perspectives. The scatter plots in the top row show a progressively stronger positive correlation between LST and UHI intensity, with urban areas (depicted by red/orange points) increasingly clustering in higher temperature ranges over the 30-year period. The spatial distribution maps in the middle row display a clear regional warming trend, shifting from mainly cool temperatures (blue) in 1994 to widespread elevated temperatures (red, 30–42 °C) by 2024, with distinct urban hot spots appearing in central areas. The UHI distribution maps in the bottom row highlight the intensification and spatial expansion of heat island effects, evolving from scattered mild UHI zones in 1994 to widespread strong UHI effects (4–6 °C) across urban areas by 2024. This comprehensive visualization effectively captures the study’s key findings, showing how average LST increases in built-up areas and demonstrating how urbanization has fundamentally altered the thermal landscape, creating increasingly severe heat stress conditions for urban populations.
4. Discussion
The spatiotemporal analysis of urban heat island (UHI) effects in Benguerir reveals patterns consistent with broader North African urban thermal dynamics, while highlighting the specific challenges facing mid-sized cities in semi-arid regions. The observed annual fluctuations in land surface temperature (LST) and UHI intensity reflect the complex interplay between rapid urbanization, climate variability, and landscape transformation that characterizes Morocco’s evolving urban centers [84]. This pattern aligns with established research on LST variations and land use/land cover (LULC) changes, demonstrating how urban expansion fundamentally alters local thermal environments through the replacement of natural landscapes with impervious surfaces [85,86]. The documented thermal intensification in Benguerir corresponds with recent findings across comparable North African cities experiencing similar urbanization pressures. Recent research in Kenitra, Morocco, revealed that land use types, such as residential and industrial development, as well as vacant land, contribute to an increase in land surface temperature, while vegetation and water cover lead to a decrease, demonstrating patterns analogous to those observed in Benguerir [87]. A comprehensive review of urban heat island phenomena in Morocco has highlighted the crucial relationship between urban forms and UHI intensity, emphasizing how urbanization and climate change compound the creation of elevated temperatures in cities with similar morphological characteristics to Benguerir [88]. Furthermore, temperature trend analysis across various Moroccan climate stations from 1970 to 2019 revealed significant fluctuations in minimum and maximum temperatures, with coastal areas such as Rabat experiencing distinct seasonal patterns that provide a regional context for understanding urban thermal dynamics [89]. These regional thermal patterns were further contextualized by extreme climatic events affecting North Africa. The unprecedented early heatwave in April 2023, which shattered historical temperature records across the western Mediterranean region, including northwestern Africa, illustrates the compound effects of drought and extreme heat that amplifying urban thermal stress. This regional climatic stress, combined with ongoing pressures of urbanization, creates particularly challenging conditions for cities such as Benguerir, which are experiencing rapid development without adequate thermal mitigation strategies.
The observed relationship between built-up density and land surface temperature (LST) in Benguerir is consistent with findings from broader regional studies. Miky et al. [90,91] identified significant positive correlations between built-up density and LST in Jeddah, Saudi Arabia, while demonstrating negative correlations with vegetation indices. This relationship is further corroborated by analyses of eight arid and semi-arid Gulf region cities, where bare areas consistently exhibited the highest mean LST values, with temperature differences between bare and green areas ranging from 1 to 7 °C. These temperature gradients align with observations in Benguerir and support the regional applicability of vegetation-based cooling strategies across semi-arid urban environments. The thermal dynamics documented in Greater Cairo by [92] provide an additional comparative context, where a 94% increase in urban cover over 27 years resulted in an average LST increase of 10 °C, establishing a quantitative relationship where every 42.7 km2 of urban expansion corresponds to a 1 °C LST elevation. This phenomenon arises as natural landscapes are converted into urban environments, altering surface properties and the radiative balance, thereby leading to increased temperatures [93]. These findings demonstrate that North African cities experiencing rapid urbanization face substantial thermal intensification risks that require proactive mitigation strategies. International comparisons reveal that while urban heat island (UHI) effects are universal urban phenomena, their magnitude and characteristics vary significantly based on local climate conditions and urban morphology. Research in Zhengzhou, China (2005–2020) documented an average LST increase of 0.92 °C, while urban growth in Abuja, Nigeria, converting 358.3 km2 of natural land, resulted in LST increases from 30.65 °C to 32.69 °C over 29 years [1,94]. More dramatically, Doha, Qatar, experienced a 343.16% increase in developed areas from 2000 to 2023, corresponding to a 7.64 °C summer temperature elevation [22]. These comparative studies highlight the potential for substantial thermal intensification in rapidly developing cities, particularly in arid and semi-arid regions, similar to Benguerir.
The distinct thermal patterns of the region highlight the importance of planning frameworks that incorporate local urban morphology and climatic conditions. Recent research across the Middle East and North Africa has documented an increase in urban heat island (UHI) trends, with statistical analyses showing that human-induced temperature increases in urban areas consistently exceed those in rural areas [95]. This regional trend analysis is crucial for understanding the thermal evolution of Benguerir within the broader context of climate change impacts in North Africa. Additionally, studies of major cities in the El-Minya Governorate, Egypt, demonstrated the significant influence of anthropogenic activities on UHI formation in semi-arid environments, supporting the relevance of findings from Benguerir to similar urban contexts across North Africa [96]. Systematic documentation of UHI intensification across regions suggests that isolated mitigation efforts in individual cities may be insufficient without coordinated regional adaptation strategies. The methodological contributions of this study, particularly the integration of field-validated sensor data with remote sensing analyses, enhance the reliability of thermal comfort indices, such as PMV and UTCI trends. This approach is not commonly used in the regional remote sensing literature, despite its potential to improve the accuracy of urban climate assessments. However, a comprehensive understanding of UHI dynamics requires consideration of additional urban factors beyond the thermal-environment relationships examined here. Recent research underscores the importance of urban geometry parameters, such as sky view factors, building density configurations, population distribution dynamics, and localized energy consumption patterns, in determining UHI intensity [97,98,99]. This pattern is typical of North African urban development, where horizontal expansion rather than vertical densification prevails, resulting in distinct thermal signatures that differ from those observed in high-density urban centers [100]. The regional specificity of these thermal patterns underscores the necessity for context-appropriate mitigation strategies that consider local urban morphology and climatic conditions. The use of field-validated sensor data enhances the reliability of PMV/UTCI trends, a methodology infrequently employed in the remote sensing literature.
The lack of significant land surface temperature (LST) moderation through existing vegetation coverage in Benguerir underscores a crucial finding for regional urban climate management [101]. The documented patterns of thermal intensification, occurring within the context of regional climate stress and Morocco’s evolving climate strategy aimed at balancing growth, resilience, and sustainability [102], necessitate the urgent implementation of evidence-based urban climate management strategies. The National Climate Plan and SNDD 2030 provide policy frameworks for implementing thermal mitigation strategies, but their effectiveness depends on the integration of local climate data with regional comparative experiences from cities facing similar challenges across the Maghreb region.
5. Conclusions
This study provides a comprehensive examination of the impacts of urbanization on temperature variations and ecological degradation in Benguerir City, a semi-arid region, over a 30-year period using remote sensing and geospatial methodologies. The quantitative analysis reveals significant LULC transformations, with built-up areas increasing by 9.95% and bare soil decreasing by 11.62 km2 between 1994 and 2024. These urban transformations have intensified the UHI effect, resulting in an increase in mean LST from 29.34 °C to 41.82 °C from 1994 to 2024 across built-up areas. Statistical modelling demonstrated robust relationships between LST and urban indices, with high R2 values ranging from 0.93 to 0.96, and strong correlations of approximately 0.98, indicating reliable model fit and linear relationships. Moreover, linear trends confirm that relationships between urban indices and land surface temperature are statistically significant (all p-values < 0.001), with positive correlations between LST, NDBI, and BU highlighting the role of developed areas in exacerbating urban heat dynamics.
Furthermore, Thermal comfort analysis revealed a significant deterioration in living conditions, with the predicted mean vote (PMV) and universal thermal climate index (UTCI) showing a noticeable shift toward extreme heat conditions and marked a decline in comfort conditions. In 1994, the population experienced 34.2% slight warmth and 65.8% hot conditions, whereas by 2024, this shifted to predominantly hot conditions (76.7%) with the emergence of very hot conditions (16.2%) and only 7.1% experiencing slight warmth. This intensification of thermal stress over three decades reflects broader climate change impacts and urban heat island effects, suggesting increasing thermal discomfort for residents, heightened risks of heat-related health issues, and challenges in maintaining energy efficiency.
These findings underscore the critical importance of implementing sustainable urban planning strategies to mitigate urban heat and enhance livability in semi-arid environments. The strategic implementation of permeable surfaces and shade structures is proposed to further mitigate the UHI effect and create more thermally comfortable outdoor environments. This research significantly contributes to the understanding of urban thermal dynamics in semi-arid regions and underscores the urgent need for climate-resilient urban planning in the context of rapid urbanization and climate change. Future research should incorporate socioeconomic and policy variables to provide a more holistic understanding of urban thermal dynamics and inform evidence-based policymaking for sustainable urban development.
Author Contributions
Conceptualization, M.A.S.A.; methodology, M.A.S.A.; software, R.A. and M.H.; validation, M.A.S.A., M.H. and R.A.; formal analysis, M.A.S.A.; investigation, M.B., E.B.D. and S.A.E.A.; writing original draft preparation, M.A.S.A.; writing review and editing, M.A.S.A., J.C. and M.H.; visualization, R.A. and E.B.D.; supervision, J.C.; project administration, J.C. All authors have read and agreed to the published version of the manuscript.
Funding
This research received no external funding.
Institutional Review Board Statement
Not applicable.
Informed Consent Statement
Not applicable.
Data Availability Statement
The data supporting our analysis are contained within the article and can be accessed from the links provided in the paper.
Acknowledgments
We express our sincere gratitude to all the individuals who contributed to the successful completion of this study. We acknowledge the indispensable administrative and technical support provided by our institution, which was essential for facilitating our work. We extend appreciation to the Center of Urban Systems (CUS) at Mohammed Polytechnic University (UM6P) in Benhguerir for supplying the Sniffer Bike sensor data, as well as to all the staff members for their assistance with the experimental setup and data collection. We are also grateful to the editor and anonymous reviewers for their valuable time and helpful comments and suggestions.
Conflicts of Interest
The authors declare no conflicts of interest.
References
- Zhou, D.; Zhou, G.; Xiao, J.; Zhang, L.; Frolking, S. Urbanization Contributes Little to Global Warming but Substantially Intensifies Local and Regional Land Surface Warming. Earth’s Future 2022, 10, 5. [Google Scholar] [CrossRef]
- Shen, P.; Zhao, S. Intensifying urban imprint on land surface warming: Insights from local to global scale. IScience 2024, 27, 109110. [Google Scholar] [CrossRef] [PubMed]
- Keith, L.; Gabbe, C.J.; Schmidt, E. Urban heat governance: Examining the role of urban planning. J. Environ. Policy Amp. Plan. 2023, 25, 642–662. [Google Scholar] [CrossRef]
- Wen, Z.; Tian, D.; Zhu, Y. Research on Spatial and Temporal Patterns of Heat Island Variability and Influencing Factors in Urban Center Areas: A Case Study of Beijing’s Central Area. Buildings 2023, 13, 1887. [Google Scholar] [CrossRef]
- He, Y.; Zhang, X.; Wu, C.; Tang, W.; Pu, N. Long-Term Spatiotemporal Heterogeneity and Influencing Factors of Remotely Sensed Regional Heat Island Effect in the Central Yunnan Urban Agglomeration. Land 2025, 14, 232. [Google Scholar] [CrossRef]
- Visvanathan, G.; Patil, K.; Suryawanshi, Y.; Meshram, V.; Jadhav, S. Mitigating urban heat island and enhancing indoor thermal comfort using terrace garden. Sci. Rep. 2024, 14, 9697. [Google Scholar] [CrossRef] [PubMed]
- Cuce, P.M.; Cuce, E.; Santamouris, M. Towards Sustainable and Climate-Resilient Cities: Mitigating Urban Heat Islands Through Green Infrastructure. Sustainability 2025, 17, 1303. [Google Scholar] [CrossRef]
- Hou, H.; Long yang, Q.; Su, H.; Zeng, R.; Xu, T.; Wang, Z.-H. Prioritizing environmental determinants of urban heat islands: A machine learning study for major cities in China. Int. J. Appl. Earth Obs. Geoinf. 2023, 122, 103411. [Google Scholar] [CrossRef]
- Agustiyara, A.; Ikhwali, M.F.; Kasiwi, A.N.; Nurmandi, A.; Mutiarin, D. Mapping Urban Green Spaces in Indonesian Cities Using Remote Sensing Analysis. Urban Sci. 2025, 9, 23. [Google Scholar] [CrossRef]
- Wen, C.; Huo, W.; Zhou, C.; Gao, J.; Yang, F.; Li, R.; Mamtimin, A.; Feng, J.; Wang, Y.; Song, M.; et al. Diurnal Variation in Urban Heat Island Intensity in Birmingham: The Relationship between Nocturnal Surface and Canopy Heat Islands. Land 2023, 12, 2062. [Google Scholar] [CrossRef]
- Kazemi, S.; Jafari, H.R.; Tahmasbian, B. Climatic comparison of surface urban heat island using satellite remote sensing in Tehran and suburbs. Sci. Rep. 2023, 13, 24139. [Google Scholar] [CrossRef]
- Cetin, M.; Ozenen Kavlak, M.; Senyel Kurkcuoglu, M.A.; Bilge Ozturk, G.; Cabuk, S.N.; Cabuk, A. Determination of land surface temperature and urban heat island effects with remote sensing capabilities: The case of Kayseri, Türkiye. Nat. Hazards 2024, 120, 5509–5536. [Google Scholar] [CrossRef]
- Luo, J.; Yin, Q.; Yao, Y. Analysis of Long Time Series of Summer Surface Urban Heat Island under the Missing-Filled Satellite Data Scenario. Sensors 2023, 23, 9206. [Google Scholar] [CrossRef] [PubMed]
- Kustura, K.; Conti, D.; Sammer, M.; Riffler, M. Harnessing Multi-Source Data and Deep Learning for High-Resolution Land Surface Temperature Gap-Filling Supporting Climate Change Adaptation Activities. Remote Sens. 2025, 17, 318. [Google Scholar] [CrossRef]
- Wang, C.; Ren, Z.; Guo, Y.; Zhang, P.; Hong, S.; Ma, Z.; Hong, W.; Wang, X. Assessing urban population exposure risk to extreme heat: Patterns, trends, and implications for climate resilience in China (2000–2020). Sustain. Cities Soc. 2024, 103, 105260. [Google Scholar] [CrossRef]
- Lee, J.; Cintron, R.; Berkelhammer, M.; Love, N.; Wilson, M.D. Urban Land Surface Temperature Downscaling in Chicago: Addressing Ethnic Inequality and Gentrification. Remote Sens. 2024, 16, 1639. [Google Scholar] [CrossRef]
- Zare, S.; Hasheminejad, N.; Shirvan, H.E.; Hemmatjo, R.; Sarebanzadeh, K.; Ahmadi, S. Comparing universal thermal climate index (UTCI) with selected thermal indices to evaluate outdoor thermal comfort in traditional courtyards with BWh climate. Urban Clim. 2024, 53, 101455. [Google Scholar]
- Fang, Z.; Zhang, S.; Cheng, Q.; Peng, J.; Wang, Q.; Feng, D. Development of adaptive thermal comfort model for urban park based on field survey and literature review. Front. Built Environ. 2025, 10, 1526919. [Google Scholar] [CrossRef]
- Bounoua, L.; Lachkham, M.A.; Ed-Dahmany, N.; Lagmiri, S.; Bahi, H.; Messouli, M.; Khebiza, M.Y.; Nigro, J.; Thome, K.J. Urban sustainability development in Morocco, a review. Urban Sci. 2024, 8, 28. [Google Scholar] [CrossRef]
- Ayt Ougougdal, H.; Lachir, A.; Messouli, M.; Yacoubi Khebiza, M. Assessment of Future Water Demand and Supply under IPCC Climate Change and Socio-Economic Scenarios, Using a Combination of Models in Ourika Watershed, High Atlas, Morocco. Water 2020, 12, 1751. [Google Scholar] [CrossRef]
- Khan, M.; Chen, R. Assessing the Impact of Land Use and Land Cover Change on Environmental Parameters in Khyber Pakhtunkhwa, Pakistan: A Comprehensive Study and Future Projections. Remote Sens. 2025, 17, 170. [Google Scholar] [CrossRef]
- Patel, S.; Indraganti, M.; Jawarneh, R.N. Land surface temperature responses to land use dynamics in urban areas of Doha, Qatar. Sustain. Cities Soc. 2024, 104, 105273. [Google Scholar] [CrossRef]
- Singh, S.; Mall, R.K.; Chaturvedi, A.; Singh, N.; Srivastava, P.K. Advances in remote sensing in measuring urban heat island effect and its management. Remote Sens. Appl. Soc. Environ. 2024, 33, 101121. [Google Scholar]
- Rezvani, S.; De Almeida, N.; Falcão, M. Climate Adaptation Measures for Enhancing Urban Resilience. Buildings 2023, 13, 2163. [Google Scholar] [CrossRef]
- Ben Nasr, J.; Chaar, H.; Bouchiba, F.; Zaibet, L. Assessing and building climate change resilience of farming systems in Tunisian semi-arid areas. Environ. Sci. Pollut. Res. 2021, 28, 46797–46808. [Google Scholar] [CrossRef] [PubMed]
- Wang, D.; Li, K.; Li, H.; Zhang, Y.; Fu, T.; Sun, L.; Wang, Y.; Zhang, J. Water resource utilization and future supply?demand scenarios in energy cities of semi-arid regions. Sci. Rep. 2025, 15, 5005. [Google Scholar] [CrossRef] [PubMed]
- Olgun, R.; Cheng, C.; Coseo, P. Nature-based solutions scenario planning for climate change adaptation in arid and semi-arid regions. Land 2024, 13, 1464. [Google Scholar] [CrossRef]
- Guo, Y.; Ren, Z.; Dong, Y.; Hu, N.; Wang, C.; Zhang, P.; Jia, G.; He, X. Strengthening of surface urban heat island effect driven primarily by urban size under rapid urbanization: National evidence from China. GIScience Remote Sens. 2022, 59, 2127–2143. [Google Scholar] [CrossRef]
- Pozzer, A.; Steffens, B.; Proestos, Y.; Sciare, J.; Akritidis, D.; Chowdhury, S.; Burkart, K.; Bacer, S. Atmospheric health burden across the century and the accelerating impact of temperature compared to pollution. Nat. Commun. 2024, 15, 9379. [Google Scholar] [CrossRef] [PubMed]
- Yang, G.; Zhang, P.; Ren, G.; Jia, W.; Zheng, X.; Tysa, S.K.; Jia, W.; Qin, Y.; Zheng, X.; Zhang, S. PM2.5 Influence on Urban Heat Island (UHI) Effect in Beijing and the Possible Mechanisms. J. Geophys. Res. Atmos. 2021, 126, 2386–2395. [Google Scholar] [CrossRef]
- Tian, L.; Yang, J.; Jin, C. Dynamic Changes in Land Cover and Its Effect on Urban Heat Islands. IEEE J. Sel. Top. Appl. Earth Obs. Remote Sens. 2024, 17, 2386–2395. [Google Scholar] [CrossRef]
- Speak, A.F.; Salbitano, F. Summer thermal comfort of pedestrians in diverse urban settings: A mobile study. Build. Environ. 2021, 208, 108600. [Google Scholar] [CrossRef]
- Hassani, A.; Castell, N.; Watne, Å.K.; Schneider, P. Citizen-operated mobile low-cost sensors for urban PM2.5 monitoring field calibration, uncertainty estimation, and application. Sustain. Cities Soc. 2023, 95, 104607. [Google Scholar] [CrossRef]
- Li, P.; Sharma, A. Hyper?Local Temperature Prediction Using Detailed Urban Climate Informatics. J. Adv. Model. Earth Syst. 2024, 16, e2023MS003943. [Google Scholar] [CrossRef]
- Driouech, F.; Rached, S.B.; El Rhaz, K. Recent observed country wide climate trends in Morocco. Int. J. Climatol. 2021, 41, 6326–6344. [Google Scholar] [CrossRef]
- Hssaisoune, M.; Bouchaou, L.; Sifeddine, A.; Bouimetarhan, I.; Chehbouni, A. Moroccan groundwater resources and evolution with global climate changes. Geosciences 2020, 10, 81. [Google Scholar] [CrossRef]
- El Alem, A.; Chokmani, K.; Laurion, I.; El Adlouni, S.E. Geology and mine planning of phosphate deposits: Benguerir deposit Gantour Basin, Morocco. Procedia Eng. 2014, 83, 70–77. [Google Scholar] [CrossRef]
- Group ADB. Morocco: Off. Chérifien Des Phosphates (OCP Group)—Phase II 2019. Available online: https://www.afdb.org/en/topics-and-sectors/topics/industrialization/key-projects/morocco-office-cherifien-des-phosphates-ii (accessed on 7 March 2025).
- Portal WBCCK. Morocco—Climatology. 2024. Available online: https://climateknowledgeportal.worldbank.org/country/morocco/climate-data-historical (accessed on 18 March 2025).
- Lachir, A.; Ahmad Nia, H. Urban design impact on local climate and its consequences on building energy demand in Morocco. J. Mediterr. Cities 2023, 3, 43–58. [Google Scholar] [CrossRef]
- Lachir, A.; Ahmad Nia, H.; Chehri, A. The interplay between climate and urban expansion on building energy demand in Morocco. Urban Sci.-Com. 2025, 9, 168. [Google Scholar]
- Braik, A.M.; Koliou, M. Automated building damage assessment and large-scale mapping by integrating satellite imagery, GIS, and deep learning. Comput.-Aided. Civ. Infrastruct. Eng. 2024, 39, 2389–2404. [Google Scholar] [CrossRef]
- Zhong, B.; Wu, J.; Luo, X.; Dan, H.; Ao, K.; Yang, A.; Wu, J. FERDNet: High-Resolution Remote Sensing Road Extraction Network Based on Feature Enhancement of Road Directionality. Remote Sens. 2025, 17, 376. [Google Scholar] [CrossRef]
- Daniels, L.; Eeckhout, E.; Dejaegher, Y.; Wieme, J.; Audenaert, K.; Maes, W.H. Identifying the Optimal Radiometric Calibration Method for UAV-Based Multispectral Imaging. Remote Sens. 2023, 15, 2909. [Google Scholar] [CrossRef]
- Rehman, A.; Liu, G.; Keshavarz, M.; Chen, T.; Barletta, A.; Ghamisi, P. Interannual variations in surface urban heat island intensity and associated drivers in China. J. Environ. Manag. 2024, 326, 116–129. [Google Scholar]
- Liu, H.; Huang, B.; Zhan, Q.; Gao, S.; Li, R.; Fan, Z. The influence of urban form on surface urban heat island and its planning implications: Evidence from 1288 urban clusters in China. Sustain. Cities Soc. 2023, 96, 104–118. [Google Scholar] [CrossRef]
- Cheng, F.; Wang, M.; Ou, G.; Liu, C. Remote Sensing Estimation of Forest Carbon Stock Based on Machine Learning Algorithms. Forests 2024, 15, 681. [Google Scholar] [CrossRef]
- Zhang, Y.; Balzter, H.; Wu, X. Spatial-temporal patterns of urban thermal environment and heat island evolution in megacities. Environ. Res. Lett. 2023, 18, 034–048. [Google Scholar]
- Kumar, P.; Sajjad, H.; Joshi, P.K.; Elvidge, C.D. Spatio-temporal analysis of land surface temperature and land use/land cover change relationship. J. Land. Use Sci. 2024, 19, 12–28. [Google Scholar]
- Peng, S.; Piao, S.; Ciais, P.; Friedlingstein, P.; Ottle, C.; Bréon, F.M.; Nan, H.; Zhou, L.; Myneni, R.B. Surface urban heat island across 419 global big cities: Magnitude, drivers, and trends. Nat. Commun. 2023, 14, 892. [Google Scholar]
- Farmonaut. Normalized Difference Built-Up Index: Urban Change Guide 2024. Available online: https://farmonaut.com/remote-sensing/normalized-difference-built-up-index-urban-change-guide (accessed on 7 March 2025).
- Yan, X.; Su, Y.; Ma, T.; Smith, A.R.; Li, J.; Yang, D. Rapid Land Cover Classification Using a 36-Year Time Series of Multi-Source Remote Sensing Data. Land 2023, 12, 2149. [Google Scholar] [CrossRef]
- Aroonsri, I. Comparative Analysis of Land Use Classification Accuracy Using Maximum Likelihood Classification (MLC) and Spectral Angle Mapping (SAM) Methods. Int. J. Adv. Res. Comput. Sci. 2025, 16, 21–26. [Google Scholar] [CrossRef]
- Soni, P.K.; Mishra, V.K.; Mehta, R.; Rajpal, N. Urban land cover and land use classification using multispectral sentinal-2 imagery. Multimed. Tools Appl. 2021, 81, 36853–36867. [Google Scholar] [CrossRef]
- Liu, Z.; Gilbert, G.; Cepeda, J.M.; Lysdahl, A.O.K.; Piciullo, L.; Hefre, H.; Lacasse, S. Modelling of shallow landslides with machine learning algorithms. Geosci. Front. 2021, 12, 385–393. [Google Scholar] [CrossRef]
- Issa, S.; Saleous, N.; Ksiksi, T.; Dahy, B. A Review of Terrestrial Carbon Assessment Methods Using Geo-Spatial Technologies with Emphasis on Arid Lands. Remote Sens. 2020, 12, 2008. [Google Scholar] [CrossRef]
- Ibrahim, A.; Wayayok, A.; Shafri, H.Z.M.; Toridi, N.M. Remote Sensing Technologies for Unlocking New Groundwater Insights: A Comprehensive Review. J. Hydrol. X 2024, 23, 100175. [Google Scholar] [CrossRef]
- Feizizadeh, B.; Darabi, S.; Blaschke, T.; Lakes, T. QADI as a new method and alternative to kappa for accuracy assessment of remote sensing-based image classification. Sensors 2022, 22, 4506. [Google Scholar] [CrossRef] [PubMed]
- Farhadpour, S.; Warner, T.A.; Maxwell, A.E. Selecting and Interpreting Multiclass Loss and Accuracy Assessment Metrics for Classifications with Class Imbalance: Guidance and Best Practices. Remote Sens. 2024, 16, 533. [Google Scholar] [CrossRef]
- Duan, X.; Haseeb, M.; Tahir, Z.; Mahmood, S.A.; Tariq, A.; Jamil, A.; Ullah, S.; Abdullah-Al-Wadud, M. A geospatial and statistical analysis of land surface temperature in response to land use land cover changes and urban heat island dynamics. Sci. Rep. 2025, 15, 4943. [Google Scholar] [CrossRef] [PubMed]
- Zaitunah, A.; Silitonga, A.F.; Syaufina, L.; Samsuri, S. Urban Greening Effect on Land Surface Temperature. Sensors 2022, 22, 4168. [Google Scholar] [CrossRef] [PubMed]
- Bindajam, A.A.; Rahman, A.; Talukdar, S.; Shohan, A.A.A.; Shahfahad, S.; Mallick, J. Modeling the spatiotemporal heterogeneity of land surface temperature and its relationship with land use land cover using geo-statistical techniques and machine learning algorithms. Environ. Sci. Pollut. Res. 2022, 30, 106917–106935. [Google Scholar] [CrossRef] [PubMed]
- Bianchini, L.; Alemanno, R.; Di Stefano, V.; Sateriano, A.; Colantoni, A.; Marucci, A. Urbanization and Long-Term Forest Dynamics in a Metropolitan Region of Southern Europe (1936–2018). Sustainability 2021, 13, 12164. [Google Scholar] [CrossRef]
- Meng, X.; Guo, H.; Guo, Y.; Yao, B.; Cheng, J. Accuracy Evaluation of the Landsat 9 Land Surface Temperature Product. IEEE J. Sel. Top. Appl. Earth Obs. Remote Sens. 2022, 15, 8694–8703. [Google Scholar] [CrossRef]
- Ye, X.; Zhu, J.; Liu, R.; Hui, J. Land Surface Temperature Estimation from Landsat-9 Thermal Infrared Data Using Ensemble Learning Method Considering the Physical Radiance Transfer Process. Land 2023, 12, 1287. [Google Scholar] [CrossRef]
- Krismer, E.; Bludau, I.; Mann, M.; Strauss, M.T. AlphaPeptStats: An open-source Python package for automated and scalable statistical analysis of mass spectrometry-based proteomics. Bioinformatics 2023, 39, btad461. [Google Scholar] [CrossRef] [PubMed]
- Laouadi, A. A New General Formulation for the PMV Thermal Comfort Index. Buildings 2022, 12, 1572. [Google Scholar] [CrossRef]
- Elraouf, R.A.; Elmokadem, A.; Megahed, N.; Eleinen, O.A.; Eltarabily, S. Evaluating urban outdoor thermal comfort: A validation of ENVI-met simulation through field measurement. J. Build. Perform. Simul. 2022, 15, 268–286. [Google Scholar] [CrossRef]
- Basaly, L.G.; Badawy, N.M.; Newport, D.; Elsharkawy, H.; Hashemi, A. Effects of Retrofit Strategies on Thermal Comfort and Energy Performance in Social Housing for Current and Future Weather Scenarios. Buildings 2024, 15, 80. [Google Scholar] [CrossRef]
- Filzmoser, P.; Nordhausen, K. Robust linear regression for high dimensional data: An overview. WIREs Comput. Stat. 2020, 13, e1524. [Google Scholar] [CrossRef]
- Jarantow, S.W.; Pisors, E.D.; Chiu, M.L. Introduction to the Use of Linear and Nonlinear Regression Analysis in Quantitative Biological Assays. Curr. Protoc. 2023, 3, e801. [Google Scholar] [CrossRef] [PubMed]
- Weisberg, S. Applied Linear Regression, 3rd ed.; Wiley: Hoboken, NJ, USA, 2005. [Google Scholar] [CrossRef]
- Gow, A. Understanding the Myelin g Ratio from First Principles, Its Derivation, Uses and Artifacts. ASN Neuro. 2025, 17, 2445624. [Google Scholar] [CrossRef] [PubMed]
- Gosselin, R.-D. Testing for normality: A user’s (cautionary) guide. Lab. Anim. 2024, 58, 433–437. [Google Scholar] [CrossRef] [PubMed]
- Marquez, J.; Francis-Hew, L.; Humphrey, N. Protective factors for resilience in adolescence: Analysis of a longitudinal dataset using the residuals approach. Child. Adolesc. Psychiatry Ment. Health 2023, 17, 140. [Google Scholar] [CrossRef] [PubMed]
- Rida, A.; Koumetio, C.S.T.; Diop, E.B.; Chenal, J. Exploring the relationship between urban form and land surface temperature (LST) in a semi-arid region: Case study of Ben Guerir city-Morocco. Environ. Chall. 2021, 5, 100229. [Google Scholar]
- Chen, Y.; Xu, M.; Wang, Z.; Chen, W.; Lai, C. Reexamination of the Xie model and spatiotemporal variability in rainfall erosivity in mainland China from 1960 to 2018. Catena 2020, 195, 104837. [Google Scholar] [CrossRef]
- Janse, R.J.; Jager, K.J.; Van Diepen, M.; Dekker, F.W.; Zoccali, C.; Tripepi, G.; Hoekstra, T. Conducting correlation analysis: Important limitations and pitfalls. Clin. Kidney J. 2021, 14, 2332–2337. [Google Scholar] [CrossRef] [PubMed]
- Chen, C.; Bao, Y.; Zhu, F.; Yang, R. Remote sensing monitoring of rice growth under Cnaphalocrocis medinalis (Guene) damage by integrating satellite and UAV remote sensing data. Int. J. Remote Sens. 2024, 45, 772–790. [Google Scholar] [CrossRef]
- De Winter, N.J.; Tindall, J.; Johnson, A.L.A.; Goudsmit-Harzevoort, B.; Wichern, N.; Kaskes, P.; Claeys, P.; Huygen, F.; van Leeuwen, S.; Metcalfe, B.; et al. Amplified seasonality in western Europe in a warmer world. Sci. Adv. 2024, 10, eadl6717. [Google Scholar] [CrossRef] [PubMed]
- Saura-Vallverdú, A. Urbanisation Along the Nile’s Canyon-Delta Junction: A remote-sensing approach to permeability and urban form in Greater Cairo. Semin. Int. Investig. En. Urban. 2024, 16. [Google Scholar] [CrossRef]
- Han, D.; Zhang, T.; Qin, Y.; Tan, Y.; Liu, J. A comparative review on the mitigation strategies of urban heat island (UHI): A pathway for sustainable urban development. Clim. Dev. 2022, 15, 379–403. [Google Scholar] [CrossRef]
- Pereira, C.; Mendes, M.P.; Flores Colen, I. Guidelines to reduce the effects of urban heat in a changing climate: Green infrastructures and design measures. Sustain. Dev. 2023, 32, 57–83. [Google Scholar] [CrossRef]
- Pandey, B.; Ghosh, A. Urban ecosystem services and climate change: A dynamic interplay. Front. Sustain. Cities 2023, 5, 1281430. [Google Scholar] [CrossRef]
- Tan, J.; Tan, X.; Yu, D.; Zhou, W.; Li, Q. Spatial relationship between land-use/land-cover changes and land surface temperature in the Dongting Lake area, China. Sci. Rep. 2020, 10, 9245. [Google Scholar] [CrossRef] [PubMed]
- Hussain, S.; Raza, A.; Abdo, H.G.; Mubeen, M.; Tariq, A.; Nasim, W.; Majeed, M.; Almohamad, H.; Al Dughairi, A.A. Relation of land surface temperature with different vegetation indices using multi-temporal remote sensing data in Sahiwal region, Pakistan. Geosci. Lett. 2023, 10, 33. [Google Scholar] [CrossRef]
- Nasraoui, R.; Benzidiya, K. The Impact of Industrial Activities on the Land Surface Temperature (LST) in the Urban Environment of the City of Kenitra (Morocco). In Climate Change Effects and Sustainability Needs; Kahime, K., El Yamani, M., Pouffary, S., Eds.; Springer Nature: Cham, Switzerland, 2024; pp. 163–180. [Google Scholar] [CrossRef]
- Idoumskine, I.; Aydda, A.; Ezaidi, A.; Ramouch, K.; Ait Haddou, M. Assessing impact of land use/land cover dynamic on urban climate change in a semi-arid region-case study of Agadir City (Morocco). Ecol. Eng. Environ. Technol. 2024, 25, 172–187. [Google Scholar] [CrossRef] [PubMed]
- Bounoua, L.; Zhang, T.; Thome, K.J.; Ed-dahmany, N.; Lachkham, M.A.; Bahi, H.; Khebiza, M.Y.; Messouli, M. The Urban Archipelago Effect: A Case Study in Morocco. Urban Sci. 2025, 9, 97. [Google Scholar] [CrossRef]
- Miky, Y.; Al Shouny, A.; Abdallah, A. Studying the Impact of Urban Management Strategies and Spatiotemporal Dynamics of LULC on Land Surface Temperature and SUHI Formation in Jeddah, Saudi Arabia. Sustainability 2023, 15, 15316. [Google Scholar] [CrossRef]
- Alshayeb, M.J.; Bindajam, A.A.; Mallick, J.; Shohan, A.A.A. Integrating fuzzy logic and land use dynamics to delineate urban heat island formation zones and assess land surface temperature changes over three decades: A case study of Asir region, Saudi Arabia. Stoch. Environ. Res. Risk Assess. 2025, 1–20. [Google Scholar] [CrossRef]
- Nahas, F. High-Resolution Insights into Nighttime Urban Heat Island Detection: A comparative temporal analysis of 1988 and 2015 in Greater Cairo. GeoJournal 2025, 90, 30. [Google Scholar] [CrossRef]
- Calhoun, Z.D.; Willard, F.; Ge, C.; Rodriguez, C.; Bergin, M.; Carlson, D. Estimating the effects of vegetation and increased albedo on the urban heat island effect with spatial causal inference. Sci. Rep. 2024, 14, 540. [Google Scholar] [CrossRef] [PubMed]
- Koko, A.F.; Yue, W.; Abubakar, G.A.; Alabsi, A.A.N.; Hamed, R. Spatiotemporal Influence of Land Use/Land Cover Change Dynamics on Surface Urban Heat Island: A Case Study of Abuja Metropolis, Nigeria. ISPRS Int. J. Geo.-Inf. 2021, 10, 272. [Google Scholar] [CrossRef]
- Tzyrkalli, A.; Economou, T.; Lazoglou, G.; Constantinidou, K.; Hadjinicolaou, P.; Lelieveld, J. Urban Heat Island Trends in the Middle East and North Africa: A statistical approach. Int. J. Climatol. 2024, 44, 3998–4008. [Google Scholar] [CrossRef]
- Fahmy, A.H.; Abdelfatah, M.A.; El-Fiky, G. Investigating land use land cover changes and their effects on land surface temperature and urban heat islands in Sharqiyah Governorate, Egypt. Egypt. J. Remote Sens. Space Sci. 2023, 26, 293–306. [Google Scholar]
- Na, N.; Xu, D.; Fang, W.; Pu, Y.; Liu, Y.; Wang, H. Automatic Detection and Dynamic Analysis of Urban Heat Islands Based on Landsat Images. Remote Sens. 2023, 15, 4006. [Google Scholar] [CrossRef]
- Rajeswari, J.R.; Fountoukis, C.; Siddique, A.; Moosakutty, S.; Mohieldeen, Y.; Ayoub, M.A.; Alfarra, M.R. Urban heat island phenomenon in a desert, coastal city: The impact of urbanization. Urban Clim. 2024, 56, 102016. [Google Scholar] [CrossRef]
- Shi, Z.; Jia, G. Changes in urban heat island intensity during heatwaves in China. Environ. Res. Lett. 2024, 19, 074061. [Google Scholar] [CrossRef]
- Deng, X.; Cao, Q.; Wang, L.; Wang, W.; Wang, S.; Wang, S.; Wang, L. Characterizing urban densification and quantifying its effects on urban thermal environments and human thermal comfort. Landsc. Urban Plan. 2023, 237, 104803. [Google Scholar] [CrossRef]
- Benaomar, K.; Outzourhit, A. Exploring the Complexities of Urban Forms and Urban Heat Islands: Insights from the Literature, Methodologies, and Current Status in Morocco. Atmosphere 2024, 15, 822. [Google Scholar] [CrossRef]
- Ersoy, S.R.; Terrapon-Pfaff, J.; Agouzoul, H. Sustainable transformation of Morocco’s energy system. In Development of a Phase Model; Friedrich-Ebert-Stiftung: Berlin, Germany, 2024. [Google Scholar]


Disclaimer/Publisher’s Note: The statements, opinions and data contained in all publications are solely those of the individual author(s) and contributor(s) and not of MDPI and/or the editor(s). MDPI and/or the editor(s) disclaim responsibility for any injury to people or property resulting from any ideas, methods, instructions or products referred to in the content. |
© 2025 by the authors. Licensee MDPI, Basel, Switzerland. This article is an open access article distributed under the terms and conditions of the Creative Commons Attribution (CC BY) license (https://creativecommons.org/licenses/by/4.0/).