1. Introduction
The accelerating pace of urbanization and the continued growth in global energy consumption have underscored the critical need for sustainable, intelligent, and flexible energy systems. According to the Australian Energy Update 2024, residential electricity consumption declined by 3%, while energy use in commercial buildings rose by 4% compared to previous years. Concurrently, solar power generation experienced its highest annual growth on record in 2023, with a 20% year-on-year increase [
1]. These trends highlight the expanding role of distributed energy resources (DERs) and smart technologies in facilitating the residential sector’s transition toward a more sustainable and resilient energy future. Globally, electricity demand has surged in recent decades, particularly in developing regions. For instance, India’s total electricity consumption rose from 1180 TWh in 2010 to over 1700 TWh in 2022, reflecting a 44% growth over 12 years, driven largely by residential and commercial sector expansion. Similarly, Indonesia’s electricity demand grew by nearly 75% between 2010 and 2021, as reported by the International Energy Agency (IEA), with future projections indicating continued escalation due to economic development and population growth. In contrast, developed countries such as the United States have experienced relatively slower demand growth, with decarbonization and energy efficiency policies offsetting consumption increases. This growth has intensified the challenges of reducing greenhouse gas emissions, maintaining grid reliability, and managing infrastructure expansion. The building sector accounts for approximately 30% of global energy use and contributes nearly 37% of total CO
2 emissions, with residential buildings being the primary contributors [
2]. Within this sector, space heating, cooling, and domestic appliances collectively account for 50–70% of total energy consumption, depending on regional climatic conditions [
3].
Demand response (DR) programs have been well-established in industrial and commercial sectors, where centralized control systems and predictable load profiles have facilitated effective demand-side strategies. These successes have increasingly motivated efforts to adapt DR frameworks to residential contexts. In the residential sector, demand-side management (DSM) initiatives have primarily targeted individual households and smart homes, leveraging technologies such as smart meters and automated load controllers to optimize appliance usage [
4]. However, implementing DSM in multi-story residential buildings introduces distinct complexities, including heterogeneous occupant behavior, diverse load profiles, and the presence of shared infrastructure. While such buildings offer considerable potential for collective energy efficiency and coordinated resource sharing, the adoption of rooftop solar photovoltaic (PV) systems and battery storage remains relatively limited. In Australia, for instance, although more than two million rooftop PV systems have been installed, exceeding 11 GW in cumulative capacity, the vast majority are located on single-family dwellings [
5].
Bridging this gap necessitates extending demand-side management (DSM) strategies beyond individual dwellings to incorporate shared infrastructure and flexible, community-scale energy solutions. While demand response (DR) programs are well-established in industrial and commercial sectors, their adaptation to residential contexts, particularly multi-unit buildings, remains a developing area. The integration of appliance-level control and coordinated energy usage in shared living environments presents ongoing challenges related to infrastructure limitations, privacy, and occupant behavior variability. Nevertheless, aggregated DR strategies within residential communities have demonstrated greater potential for improving energy efficiency compared to isolated household-level approaches. The deployment of smart appliances, community-scale battery energy storage systems, and advanced energy management platforms facilitates real-time operational flexibility, load balancing, and reductions in greenhouse gas emissions [
2].
Energy sharing has emerged as a transformative concept in residential energy systems. Distributed energy resources now allow surplus energy to be exchanged among households, enabling collective energy self-consumption. Initially introduced in Europe through collective self-consumption schemes, energy sharing has evolved into a dynamic mechanism enabled by real-time digital platforms. These systems lower electricity costs and improve the use of local renewable generation, advancing equity and sustainability objectives [
6,
7].
Australian Renewable Energy Agency (ARENA) examined the role of shared PV and battery systems in medium-density residential developments. A governance model was proposed for managing such systems as common property within strata schemes, with findings indicating that shared infrastructure could meet up to 80% of household electricity demand [
8].
However, implementing energy sharing in multi-unit dwellings remains challenging due to complex ownership arrangements and regulatory constraints. Despite this, these buildings offer significant untapped potential through integrated DSM frameworks involving flexible load scheduling, shared battery systems, and real-time coordination platforms [
9]. A techno-economic analysis demonstrated that combining rooftop PV, battery energy storage systems and smart EV charging can reduce electricity demand by up to 58% while significantly lowering grid dependency [
10].
Flexibility in residential energy systems is increasingly critical for improving responsiveness to supply and demand fluctuations. This includes adjusting energy generation, consumption, and storage to reduce peak demand, lower costs, and enhance the integration of intermittent renewables. The CER reported over 61,000 new rooftop PV installations in Q2 2023 alone. With over 91,000 expected installations by the end of the year, Australia’s cumulative residential PV capacity is projected to exceed 20.5 GW [
11].
BESS plays a key role in enabling local energy optimization by maximizing PV self-consumption and reducing grid imports. Empirical studies have shown that integrating BESS with DSM strategies enhances economic returns and energy performance, especially in households with high variability in demand [
12,
13]. Recent evaluations of Front of the Meter and Behind the Meter systems in rural Australia highlight that centralized FTM storage can reduce peak loads and support network stability, while BTM systems improve self-sufficiency at the household level [
14]. Community Battery Systems represent an intermediate solution, aggregating battery storage at a neighborhood scale to support shared energy use, EV charging, and coordinated DSM.
The integration of vehicle-to-building systems introduces new opportunities for leveraging mobile storage assets to enhance building-level flexibility. A recent optimization-based framework demonstrated that V2B systems, when coupled with PV and stationary energy storage, can reduce annual grid energy consumption by 46.79%, peak loads by 63.49%, electricity costs by 51.15%, and emissions by 45.99%. Importantly, these gains were achieved through coordinated EV charging shared between office buildings and nearby residential areas during off-peak hours [
15].
Moreover, community-scale DSM using MPC has been shown to enable coordinated energy sharing among heterogeneous buildings. Behrang Vand et al. [
16] demonstrated that optimal electricity flow across a small community of buildings led to cost savings between 5.4% and 7.7% at the community level and up to 87.9% at the individual level, depending on each building’s efficiency profile. These results underscore the value of managing buildings as integrated energy clusters to maximize local renewable use and reduce dependency on centralized grids. Additionally, achieving sustainable, resilient energy communities requires addressing socio-technical and organizational challenges. a multi-layered framework that identifies four essential domains for guiding energy strategies: (i) building envelope flows, (ii) Heating, ventilation and air conditioning and energy systems, (iii) building-level optimization, and (iv) inter-building energy exchange. The authors emphasized that traditional studies often treat these domains in isolation, limiting the integration and scalability of renewable technologies. They argue for coordinated policy, planning, and monitoring systems to support the transition to nearly zero-energy and positive energy buildings [
17].
While numerous studies [
6,
9,
11,
15,
16] have explored the feasibility of community energy sharing and electric vehicle (EV) integration in isolated or commercial settings, limited research has addressed cost-optimized energy allocation in multi-story residential buildings, particularly those featuring shared EV charging infrastructure and subject to seasonal solar variability. Existing optimization frameworks frequently overlook the interdependence between individual apartment loads, common-area infrastructure (e.g., EV chargers, hot water systems), and shared battery discharges, which are especially critical in high-density residential contexts governed by strata-title schemes.
This study addresses these research gaps by evaluating the techno-economic benefits of integrating demand-side management (DSM), rooftop photovoltaic (PV) systems, a community-shared battery energy storage system, and flexible EV charging in a multi-apartment building under seasonally varying solar conditions. A Mixed-Integer Linear Programming (MILP) model is developed using the Gurobi optimizer to perform hourly energy allocation across nine apartments and common loads over two representative seasonal scenarios: February (summer) and September (spring). The results demonstrate that community-based energy sharing, combined with cost-optimized scheduling and equitable resource allocation, can significantly reduce energy costs and grid dependence. This study highlights the economic and operational advantages of adopting integrated DSM and community energy-sharing strategies, leveraging renewable generation and shared battery systems within a residential microgrid framework.
The manuscript is structured as follows:
Section 2 presents the materials and methods, including building configuration, appliance scheduling, synthetic demand profiling, and the design of the rooftop PV and battery systems. It also outlines the energy allocation logic and the mathematical formulation.
Section 3 reports the results, covering solar generation, battery behavior, common load consumption, optimization outcomes, seasonal demand patterns, and EV charging analysis.
Section 4 provides the discussion, and
Section 5 concludes with key findings and future research directions.
2. Materials and Methods
This section presents the methodological and conceptual framework designed to optimize energy consumption and the allocation of flexible appliances within a multi-story residential building. A cost-optimization model based on MILP and implemented with the Gurobi optimizer is developed to minimize total electricity costs under time-of-use tariffs. Classical optimization techniques (such as Linear Programming (LP), MILP, and Non-Linear Programming (NLP)) have been extensively applied in residential DR studies. These models typically focus on appliance scheduling, cost minimization, and occupant comfort constraints. Among these methods, MILP is particularly effective due to its capability to handle complex discrete decision variables efficiently with advanced optimization solvers. Recent studies demonstrate MILP’s application in optimizing residential heating systems, balancing economic and environmental factors through multi-criteria analysis. It has also been effectively employed in the design of distributed energy systems within residential clusters, significantly achieving cost reductions. In this study, the model enables community energy sharing and evaluates different scenarios, including the integration of EVs and their charging requirements. This section outlines the key methodological components of the study, including the selection of flexible appliances, the development of a synthetic 24 h demand dataset, the specification of solar PV and battery system parameters, the definition of modeling assumptions, and the mathematical formulation of the optimization problem. The analysis focuses exclusively on energy resource allocation. Architectural parameters of the building are held constant or derived from established standards, as detailed architectural modeling falls outside the scope of this study.
2.1. Building Configuration
The study investigates a hypothetically modeled three-story residential apartment building comprising nine dwelling units, with three units per level. The location Joondalup, Perth, Western Australia, was deliberately selected for simulation purposes due to its favorable solar irradiance profile, which supports high photovoltaic (PV) energy generation throughout the year. The building configuration was not derived from a physical survey but rather developed in alignment with national planning codes and typical apartment layouts relevant to Australian medium-density housing design guidelines [
18,
19].
The study adopts several architectural assumptions. Each apartment is assigned a standardized and identical internal layout, consisting of one bedroom, a combined bathroom and toilet, an open-plan kitchen integrated with the living area, and a balcony. This spatial configuration complies with the Class 2 building classification defined under the national construction code, wherein each apartment is considered a Sole-Occupancy Unit, SOU, defined as an individually occupied dwelling within a vertically stacked multi-unit structure contained in a shared building envelope [
20]. The building is assumed to include a shared rooftop solar PV array, a community battery storage system, and common property electrical loads such as a pool pump and a centralized hot water system. These elements are owned and managed under a strata-title arrangement. Strata-title arrangement refers to a legal framework commonly used in multi-unit residential developments where individual ownership is assigned to each apartment, while shared facilities such as common areas, electrical infrastructure, and energy systems are collectively owned and managed by a strata body corporate. This governing entity is responsible for financial administration, maintenance, and operational decisions related to all communal elements of the property. This governance model aligns with the principles outlined in the Residential Apartment Buildings (Compliance and Enforcement Powers) Act 2020, which emphasizes collective accountability for sustainable infrastructure in strata-managed developments [
21]. For simulation purposes, it is assumed that all apartments are leased to tenants, with each unit individually metered and billed for electricity usage. These individual energy costs are computed for each apartment in the study. Each apartment is equipped with a uniform set of smart, energy-efficient appliances, selected based on their energy star ratings and operational flexibility. These include lighting systems, refrigerators, HVAC units, washing machines, and dryers. The building, as illustrated in
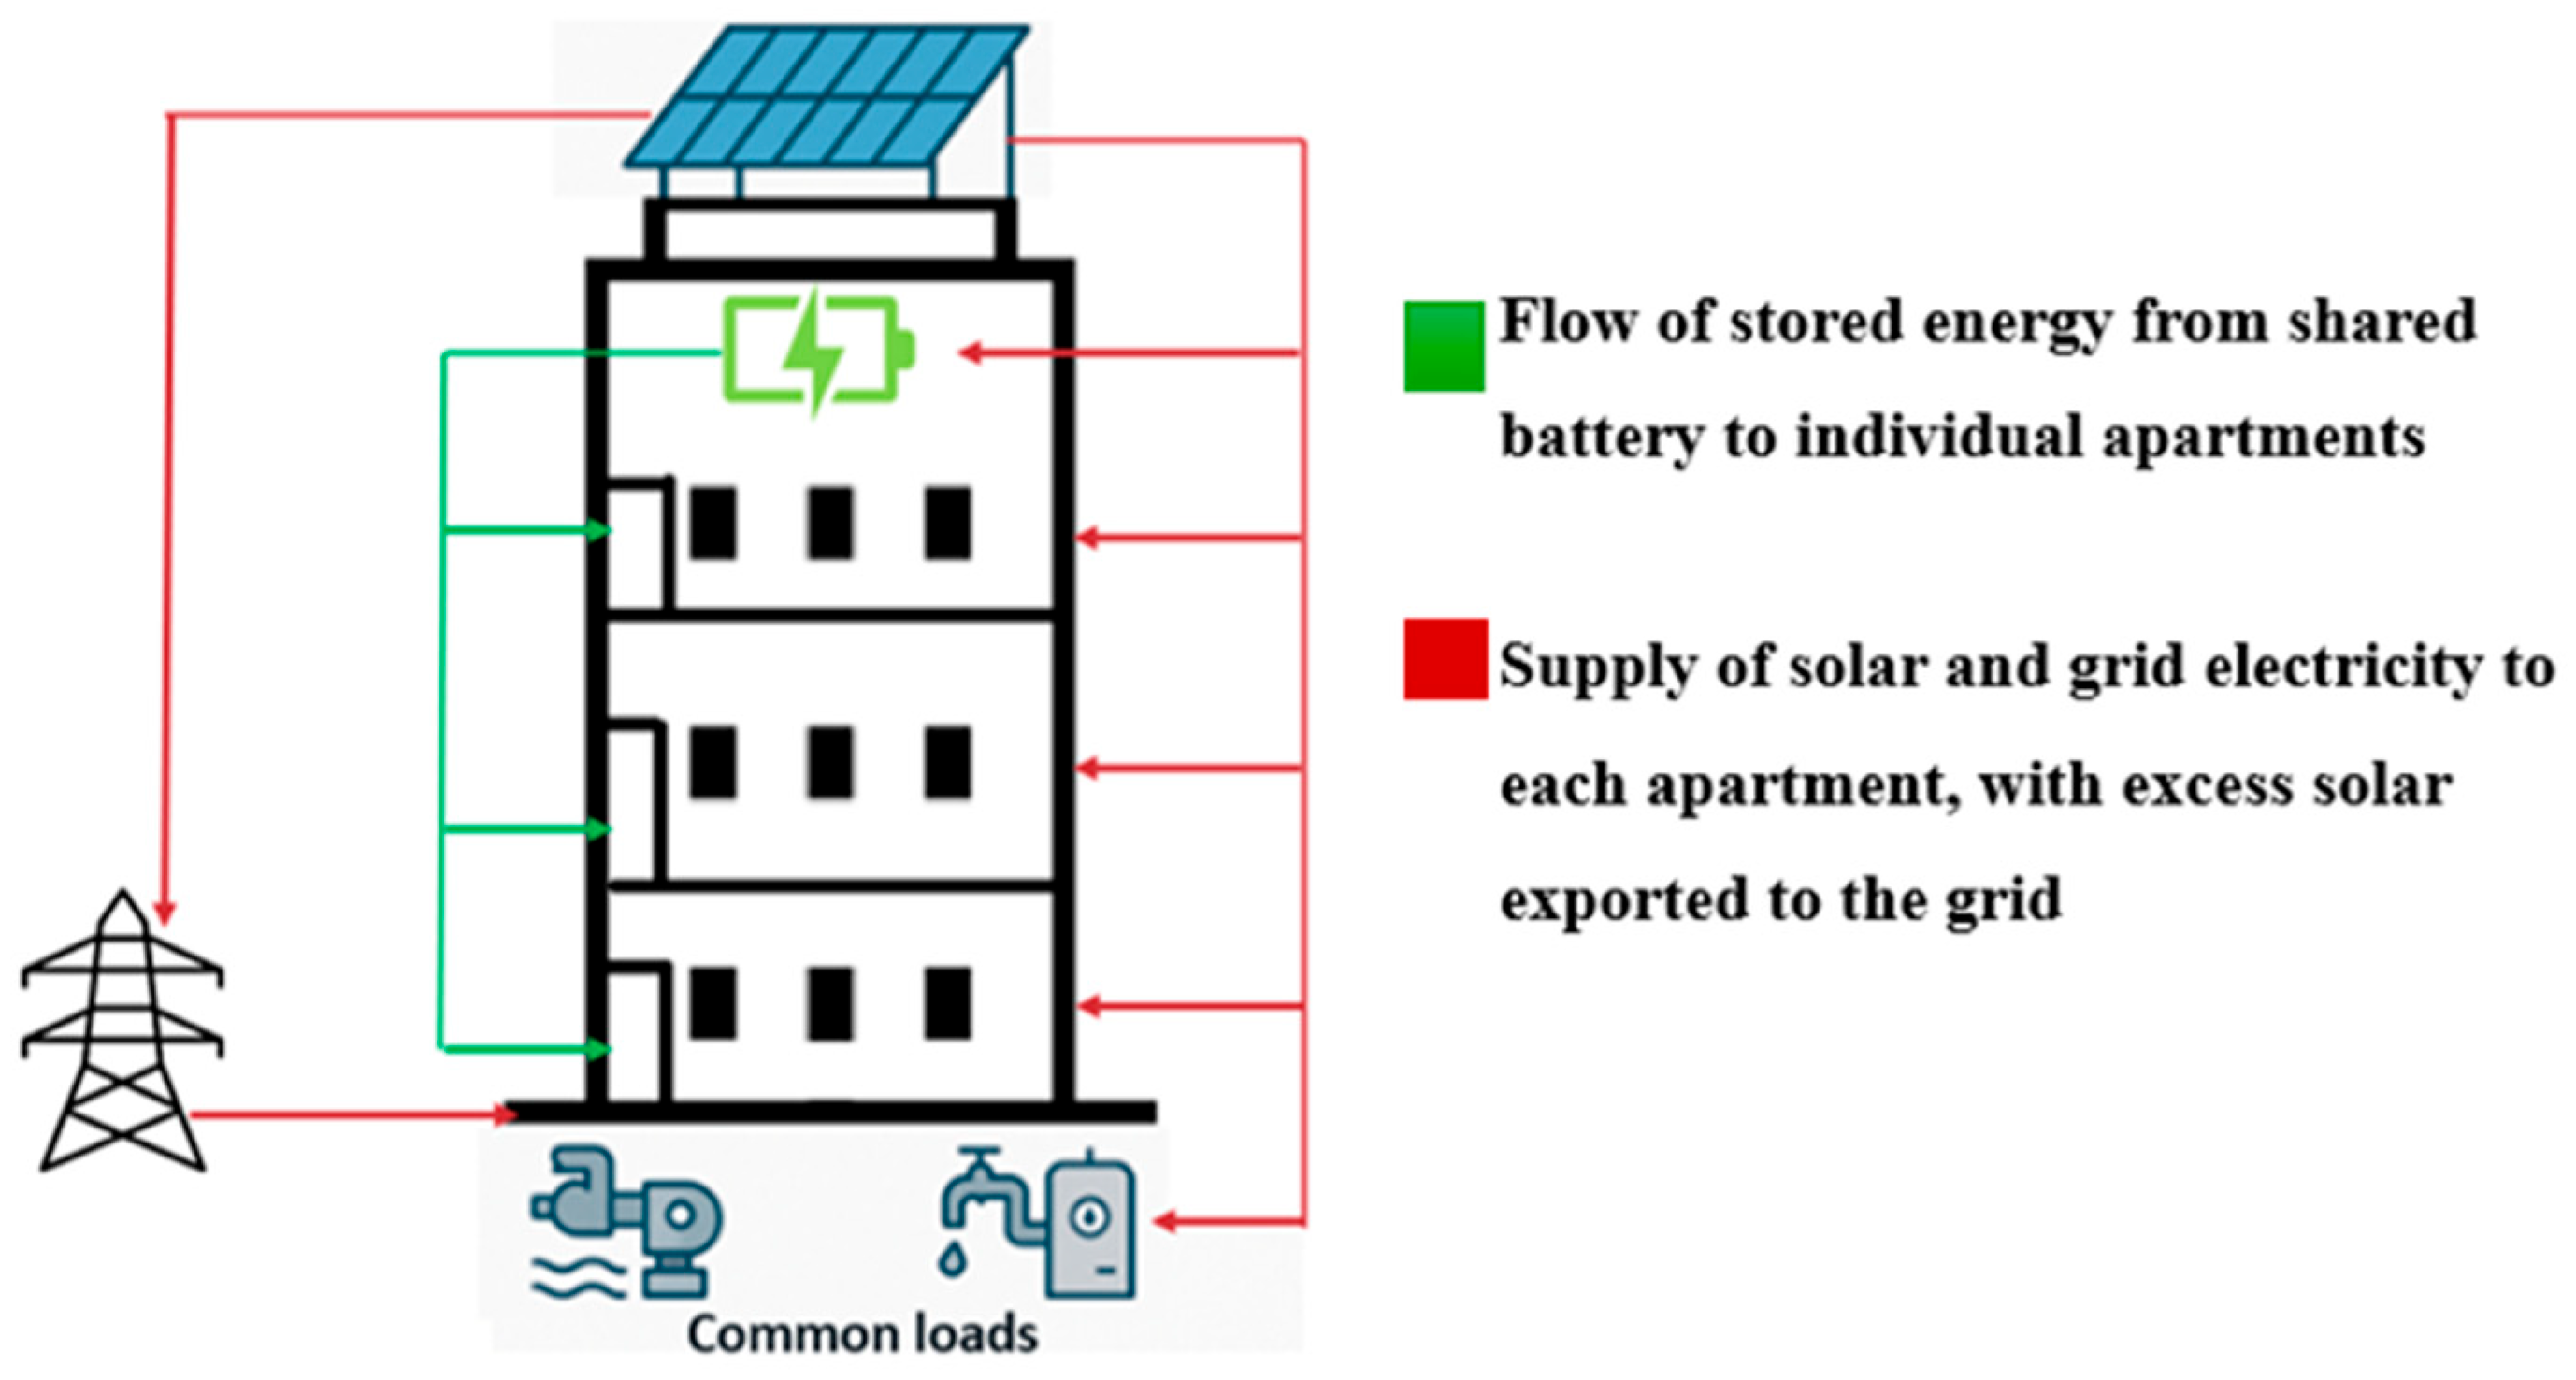
Figure 1, represents a typical multi-story urban residential configuration. Red arrows depict the energy flow from the rooftop solar PV system to the apartments, battery storage, and common loads, with surplus energy exported to the grid. Green arrows indicate the discharge of energy from the battery to the apartment units. This configuration is selected to evaluate the scalability, fairness, and cost-effectiveness of demand side management strategies, solar-battery integration, and community energy sharing within a collective ownership framework.
2.2. Appliance Selection and Scheduling
This study incorporates flexible appliance scheduling within a multi-story residential energy management framework, aimed at enhancing demand-side flexibility and minimizing electricity costs. The selection of smart, energy-efficient, and controllable appliances plays a pivotal role in enabling residential demand-side management, providing both direct (automated) and indirect (user-responsive) control mechanisms. This section outlines the strategy adopted for appliance selection in the simulated residential setting, with a focus on enhancing operational flexibility. The appliance selection was guided by the following key criteria:
High energy efficiency (≥4-star rated appliances);
Smart operability, enabling scheduled control and load shifting;
Suitability for Australian residential environments, including size compatibility with typical apartment occupancy.
Each apartment was assumed to contain a standardized set of major energy-consuming appliances, including a refrigerator, washing machine, dryer, air conditioning unit, and lighting system. These appliances were chosen due to their significant impact on residential energy use and their capability to respond to scheduling signals. Minor, inflexible, or user-driven loads (e.g., microwave ovens, kettles) were excluded due to limited deferrable potential.
Appliance energy rating (star label);
Annual energy consumption (kWh/year);
Nominal power rating (Watts);
Hourly energy consumption (kWh);
Typical usage duration per day (hours);
Total daily consumption per appliance (kWh);
Aggregated daily demand per apartment (kWh);
Time resolution for load profile modeling: 1 h intervals.
Common property loads were also integrated into the energy model to reflect shared infrastructure governed by strata ownership. Two principal shared load systems were modeled, considering the following:
Pool Pump: A Hayward ECOSTAR vs. 1HP variable-speed pump (1.9 kW input) was selected for its 7-star rating and compliance with AS 5102.1:2019. (Australian Standard for the performance of household electrical appliances, specifically for swimming pool pump-units). Operating for an average of 6.19 h per day, its fixed daily energy use was estimated at 11.76 kWh. Its real-time speed control supports classification as a flexible common load [
22,
23].
Hot Water System: A centralized Mitsubishi Electric Heat2O unit was modeled to serve all apartments, incorporating a heat pump and a 24 h recirculation loop. Based on occupancy assumptions (2.5 residents per unit, 9 units), daily thermal energy demand was calculated as 123.6 kWh, with an additional 32.4 kWh/day attributed to thermal recirculation losses, totaling 156 kWh/day. These were distributed across hourly intervals to align with solar generation periods and integrated into the load dataset [
24,
25,
26,
27].
The smart appliances, including the 10-star Hisense heat pump dryer (0.55 kW) [
28], AI-enabled Samsung washing machine (0.548 kW) [
29], inverter-based 8-star refrigerator (0.175 kW) [
30], 7-star Mitsubishi HVAC (0.31–0.47 kW) [
31], and Philips Hue LED lighting (11 W) [
32], were modeled with programmable schedules and daily operational durations derived from real-world manufacturer data. Flexible appliances were scheduled in response to solar availability and price signals, while inflexible loads (e.g., fridge) were treated as static baseloads.
A summary of appliance specifications is provided in
Table 1, and the resulting hourly demand profiles informed the MILP optimization model of the study.
2.3. Synthetic Demand Profile Development
The synthetic load dataset developed in this study captures the detailed 24 h energy consumption profiles of a nine-apartment multi-story residential building, incorporating both private residential and common property loads. This time-resolved dataset serves as a foundational input for MILP optimization-based energy management models developed in this research.
Occupant Behavior and Load Diversity
Recognizing that occupant behavior significantly influences residential energy consumption, the dataset was designed to reflect heterogeneous usage patterns based on lifestyle segmentation. Apartments were categorized into three occupant archetypes:
Daytime Workers: Users are typically absent during the day with peak appliance use in the early morning and evening;
Night-Shift Workers: Occupants are present at home during daytime hours, with increased midday electricity usage;
Passive Users: Includes retirees or home-based workers with consistent, moderate appliance use throughout the day.
This segmentation allowed for the modeling of stochastic and behaviorally diverse demand profiles [
33,
34].
Each apartment was assigned a fixed appliance suite and usage schedule according to its assigned profile, enhancing the realism of load distribution under time-of-use pricing and renewable generation constraints. These profiles also support differentiated demand response strategies based on user flexibility [
35,
36]. Power ratings, daily runtimes, and energy ratings were derived from real product specifications to ensure accurate simulation inputs. Each apartment’s daily energy demand was structured over a 24 h horizon with 1 h resolution, resulting in individualized load profiles that collectively represent the building’s total demand. Shared infrastructure components were included in the synthetic dataset as fixed daily common loads, with operational scheduling aligned with solar availability.
The model does not define occupant behavior as decision variables but incorporates behavior diversity through varied hourly demand profiles. These influence the optimization outputs by shaping resource allocation decisions within the shared energy environment of the building. In the MILP optimization model, hourly appliance consumption remained fixed; however, the model dynamically selected the optimal energy source (solar PV, battery, or grid) at each timestep to minimize operational cost. This consistent input structure allows for a fair comparative analysis of economic and operational benefits in the optimized energy allocation strategies under seasonal solar variation.
2.4. Solar Photovoltaic and Battery Energy Storage System Design
This study incorporates a centralized solar PV system coupled with a shared BESS to support both apartment-level and common load energy demands in a nine-unit multi-story residential building located in Joondalup, Western Australia. The proposed system adopts a solar sharing architecture, wherein solar-generated electricity is distributed across individual residential units and shared infrastructure such as a centralized hot water system and pool pump. By combining real-world solar resource data and optimization logic under a shared energy distribution model, the proposed system supports a scalable and policy-aligned pathway for sustainable energy deployment in multi-dwelling residential environments.
2.4.1. Rooftop Solar PV System Design
The number of solar panels required for an apartment building depends on its size, total energy consumption, and the rated output of the selected PV modules. Generally, a small apartment building may require 500 to 1000 watts of solar capacity per unit, resulting in a total system demand of 5 to 10 kW for a 10-unit structure. Given that a typical residential solar panel produces around 300–350 watts, meeting this aggregate demand would require approximately 15 to 30 solar panels, depending on the panel wattage and expected system efficiency. Additionally, solar installations have been shown to enhance property value and reduce ongoing utility expenses for residents [
37]. By mid-2024, rooftop solar accounted for 11.3% of Australia’s total electricity generation, delivering approximately 13,479 GWh. The average system size also increased to 9.7 kW, indicating a national trend towards larger-scale rooftop installations, especially in multi-residential settings [
38]. The two main types of rooftop solar system configurations applicable to apartment buildings are as follows:
This study adopts the solar sharing model, where a centralized PV system is installed across the building rooftop to supply both apartment units and common loads using location-specific irradiance data tools [
41,
42]. The adopted approach aligned with strata property governance to avoid the limitations of direct-metered systems in apartment buildings. Solar generation was prioritized for common loads, with surplus energy allocated to apartment units based on demand.
The design of the rooftop PV system was based on detailed irradiance analysis and real-time data representative of the Joondalup region (31.95° S, Western Australia). Seasonal solar variability was accounted for, with daily generation per installed kW ranging from 8.88 kWh in summer to 3.44 kWh in winter, as observed in Perth’s empirical irradiance profiles [
43]. A fixed panel tilt angle of 27° facing true north was adopted, aligning with best practices to maximize annual generation potential [
44].
To ensure technically and economically viable integration, system sizing was carried out using October 2024 irradiance data representing spring with stable meteorological conditions. Each apartment exhibits a distinct daily energy consumption pattern based on appliance-level usage, occupancy schedules, and behavioral assumptions. The apartment-level loads range from 4.538 kWh to 8.284 kWh, resulting in a cumulative apartment demand of 68.95 kWh. The common area load, comprising shared infrastructure, is 156.6 kWh for the same 24 h period. This total demand forms the basis for sizing the rooftop PV system and evaluating the energy balance within the building energy management model. This value was computed from individual appliance ratings and usage patterns. A peak solar availability of 6 h/day was assumed, resulting in a required system capacity of 37.59 kW to meet a total daily load of 225.55 kWh
High-efficiency Jinko 400 W monocrystalline panels (20% efficiency) were selected, requiring an effective panel area of 187.95 m
2 under Standard Test Conditions. A rooftop footprint of 200 m
2 was allocated based on the spatial constraints typical of Australian apartment buildings, confirming installation feasibility after accounting for structural allowances [
45,
46]. Solar generation was calculated using irradiance profiles obtained over multiple representative periods, specifically from October 2024 to May 2025, to capture seasonal variability and ensure accurate modeling across different climatic conditions.
where efficiency
of 0.2 and performance ratio
of 0.85 considering the temperature losses, inverter efficiency, wiring etc.
2.4.2. Battery Energy Storage System
The BESS in this study is modeled as a shared community asset, centrally installed and jointly accessible for both apartment-level demand and common area loads, including flexible EV charging. The system enables time-shifted use of excess solar energy, maximizing local renewable utilization and minimizing peak grid consumption.
The battery is assumed to be third-party owned, a structure increasingly prevalent in embedded network business models, enabling centralized energy storage deployment while minimizing the need for unit-specific ownership and control infrastructure. The modeling was based on empirical benchmarks, specifically referencing Tesla Powerwall deployments in Australian and European contexts [
47]. The baseline specifications incorporated into the optimization framework are summarized in
Table 2.
Community batteries are not constrained by specific timeframes for charging and discharging. Unlike some storage systems that have designated periods for energy input and output, community batteries offer flexibility in terms of when they can charge and discharge. Battery operation follows a cost-optimized logic, where charging is prioritized from rooftop solar PV generation, with grid energy used as a secondary source when solar availability is insufficient. Charging and discharging actions are scheduled dynamically using a MILP framework, which ensures optimal source allocation at each hourly time step across a 24 h horizon. The integration of battery operations, including both charging and discharging behavior, is embedded within the mathematical optimization model and explained in detail in
Section 2.5. Through this optimized control framework, the battery system enables grid load smoothing, peak shaving, and enhanced utilization of renewable energy resources, while facilitating community energy sharing within the multi-story residential building.
2.5. Energy Allocation Logic
The primary objective of this approach is to enhance community energy sharing and reduce the overall cost of electricity consumption, providing economic benefits to both property owners and tenants. As described in the previous section, the building under consideration operates under a third-party ownership model strata ownership which is responsible for managing the integrated rooftop solar photovoltaic PV and BESS. This section presents the optimized energy management systems, wherein energy resources, including solar PV generation, battery-stored energy, and grid electricity, are dynamically allocated to meet the total building energy demand at the minimum possible cost. The system is formulated as an MILP problem and implemented using the Gurobi Optimizer. The simulation is based on a 24 h synthetic dataset with hourly resolution to capture variations in demand, pricing, and resource availability.
The model operates under a cost-minimizing dispatch framework, in which the least expensive available energy source is selected at each time step. It considers:
The cost of solar energy usage (charged by the strata);
The cost of battery discharge (reflecting maintenance and degradation fees;
Electricity tariff structure 1, employing a TOU pricing scheme that reflects residential demand variability and is particularly suited for households with EVs.
This structure aims to reduce the total energy expenditure for all building occupants while enabling revenue generation for the third-party solar and battery system owner (strata corporation). The model incorporates EV charging based on defined technical specifications; however, it is important to note that the realistic integration of such systems in multi-apartment residential buildings must account for several critical factors. These include the physical layout of the building, the availability of electrical infrastructure, and compliance with national and local standards and regulations related to EV charger installation. In this study, these site-specific implementation constraints have not been explicitly modeled and are instead treated under a set of default assumptions. The focus remains on assessing the operational and economic impacts of EV charging as a flexible load within an optimized energy management framework. The allocation strategy is governed by real-time pricing and can be summarized as follows:
2.5.1. Grid Electricity Pricing
The model adopts the Midday Saver energy plan by Synergy (Australia), which categorizes electricity rates by ToU periods. The tariff structure given in
Table 3 is particularly suitable for residential buildings with integrated EV charging or planning for future integration. The tariff rates used are as follows [
48].
The EMS selects grid energy during lower-cost periods when economically favorable compared to solar or battery discharge.
2.5.2. Battery Discharge Cost and Fairness Constraints
The proposed energy optimization model incorporates a shared battery energy storage system with a total capacity of 40 kWh and a round-trip efficiency of 90%, supporting a maximum charge/discharge rate of 15 kW. Battery access is equitably divided among all apartment units, ensuring fair usage. Each apartment is billed only for its consumption, with charging permitted from either rooftop solar PV or the grid, depending on real-time cost and availability.
To ensure cost transparency and system sustainability, a differentiated pricing mechanism is employed. When the battery is charged from solar energy owned by the strata, no cost is imposed on residents. However, a discharge cost is applied to account for battery degradation and maintenance. Assuming a battery system lifespan of 5000 cycles and a capital cost of AUD $12,000–$16,000, the degradation cost is estimated at $0.078–$0.1/kWh. The model thus applies a discharge pricing range of $0.15–$0.2/kWh, incorporating maintenance and a modest strata margin. This remains economically favorable compared to Synergy’s standard tariffs.
In instances where grid electricity is used for charging (e.g., during super off-peak periods), the actual ToU grid cost is directly charged to users, with no additional degradation cost applied. The selling price is dynamically adjusted based solely on grid input cost, supporting a cost-effective and equitable framework for all residents [
49,
50].
Notably, the battery is also permitted to discharge energy to common property loads, including EV charging, under strata ownership. This design enables broader energy sharing and reflects a more realistic and equitable use of distributed storage resources within the residential community.
2.5.3. Solar Usage and Export Logic
In the proposed energy management framework, solar energy is governed by a third-party ownership structure, wherein the strata corporation functions as the energy provider. Tenants are charged a fixed rate of $0.07/kWh for solar consumption, reflecting the opportunity cost of using the strata-owned rooftop photovoltaic system. This internal rate aligns with the DEBS in Western Australia and is substantially lower than standard retail tariffs, thereby ensuring economic fairness for residents.
The EMS dynamically evaluates the relative cost of solar, battery discharge, and grid electricity to prioritize the most economical source at each time step. Solar energy is preferentially allocated to common loads without charge, thereby maximizing on-site renewable utilization. Excess solar generation beyond the combined demand and battery charging capacity is exported to the grid. The exported energy is priced using DEBS time-of-use tariffs:
$0.10/kWh during peak hours (15:00–21:00) and
$0.02/kWh during off-peak periods, creating a modest revenue stream for the strata [
51,
52].
By integrating real-time energy pricing rather than fixed rule-based dispatch, this model enhances operational realism and supports cost-optimal decision-making. The strategy seeks to reduce overall electricity expenses for residents while ensuring equitable revenue recovery for the system owner, thus promoting a sustainable community energy-sharing model grounded in local energy policy frameworks.
2.5.4. EV Charging
Electric vehicle charging is integrated as a flexible, shared community load operating within a predefined charging window from 6:00 PM to 6:00 AM, aligning with off-peak residential hours and occupant behavior patterns under the adopted time of use tariff structure. The model assumes the installation of four EV charging stations in the common area, accessible to all EV-owning tenants. Each charger is rated at 7.2 kW, resulting in a combined maximum power capacity of 28.8 kW [
53].
The total daily charging energy is set at 100 kWh, based on an average demand of 25 kWh per EV, consistent with mid-sized EV usage in typical urban residential settings. Rather than assigning fixed schedules, the MILP-based optimization model flexibly allocates charging energy across eligible time slots to minimize costs, while remaining within power and energy limits. Although real-world EV charging behavior is not explicitly modeled, the framework allows future integration of empirical data.
EV charging demand can be met using either rooftop solar or grid energy. While grid electricity often becomes the default due to overnight charging periods, the model prioritizes solar if it is cost-effective and available. To ensure fairness, grid energy costs associated with EV charging are computed and equitably divided among EV users, preventing cost split over onto non-EV residents. These developments reflect a more inclusive and realistic approach to energy sharing under a strata ownership framework.
2.6. Mathematical Formulation
The mathematical formulation of the proposed cost-optimized EMS for a multi-story residential building integrates rooftop solar photovoltaic generation, community battery energy storage, and flexible demand side management through shared electric vehicle charging infrastructure. The model aims to deliver optimal energy allocation results that balance technical feasibility and economic efficiency across multiple heterogeneous load profiles within the residential community.
The model’s objective function (3) minimizes the total operational cost including grid energy consumption by apartments and common areas, battery discharge energy usage by apartments, solar usage costs (charged by the strata), minus the revenue generated from exporting excess solar energy to the grid.
The set of decision variables used in the model is presented in
Table 4. These variables are employed in the optimization model to represent the system’s controllable actions at each time step and for each apartment. The allocation of these variables is governed by the model’s constraints to determine the optimal operational strategy.
The following constraints are incorporated into the model to represent the physical relationships between energy resources and individual load profiles. A brief explanation of each constraint is provided below.
For each apartment, the total energy supplied from solar PV, shared battery storage, and the electricity grid must be sufficient to meet the apartment’s total energy demand. This constraint, expressed in (4), ensures that there is no energy shortfall at any time step:
- 2.
Solar Energy Allocation;
The total solar energy utilized for apartment loads, common loads, battery charging, and export to the grid must not exceed the total solar energy generated at each time step. This constraint is formalized in (5)
- 3.
Total Common Load Demand Balance;
The total energy supplied to cover common building loads and EV charging is provided through grid, solar, and battery discharge, which is ensured by (6).
- 4.
Battery Charging Constraint;
Battery charging can be achieved using either solar energy or grid electricity, depending on the cost-effective availability at each time step. Thus, (7) ensures that the total charging power is the sum of both sources:
- 5.
Battery Discharging Sharing Constraint;
Battery energy discharged to apartment units must equal the sum of all individual apartment battery discharges (8).
The total battery discharge at each time step is the sum of discharges for apartment loads and common loads given in (9).
- 6.
State of Charge;
The battery state of charge is dynamically updated at each time step based on the net energy flow into and out of the battery, adjusted for efficiency
η. (10) represents the SOC update, while constraint (11) imposes upper and lower operational limits and (12) constraint sets the initial state of charge (SOC) of the battery energy storage system to 50% of its rated capacity [
54].
- 7.
Battery Capacity Allocation Constraint (Community Energy Sharing);
To promote community-based energy sharing within the residential building, the shared battery is equitably divided among all apartments. Each apartment is restricted to a maximum share of the total battery capacity. This constraint is expressed as (13)
- 8.
EV Charging Daily Demand Constraint;
The total energy (14) delivered to all EV charging stations over the designated charging window must not exceed 100 kWh:
- 9.
EV Charging Power Limit per Hour;
At any time step, the total EV charging power (15) must not exceed the maximum combined power rating of four 7.2 kW chargers:
- 10.
EV Charging Time Constraint;
EV charging is permitted only during the defined off-peak hours (16). Outside these periods, no charging is allowed:
where
- 11.
EV Charger Energy Balance Constraint.
EV charging demand at each time step is met by a combination of grid and solar energy sources. This is ensured by (17),
The formulated constraints collectively ensure the technically feasible and economically optimized operation of the proposed EMS. These include provisions for demand–response activation, equitable community energy sharing, and compliance with physical system limitations such as time-resolved energy balance, battery charging/discharging dynamics, and capacity constraints. The EV charging process is constrained to off-peak periods (6:00 PM–6:00 AM), and both energy and power limits are strictly enforced, ensuring feasible scheduling and infrastructure compliance. Cost fairness is maintained through separate accounting of EV-related grid energy usage, which is distributed exclusively among EV users, thus preventing cross-subsidization.
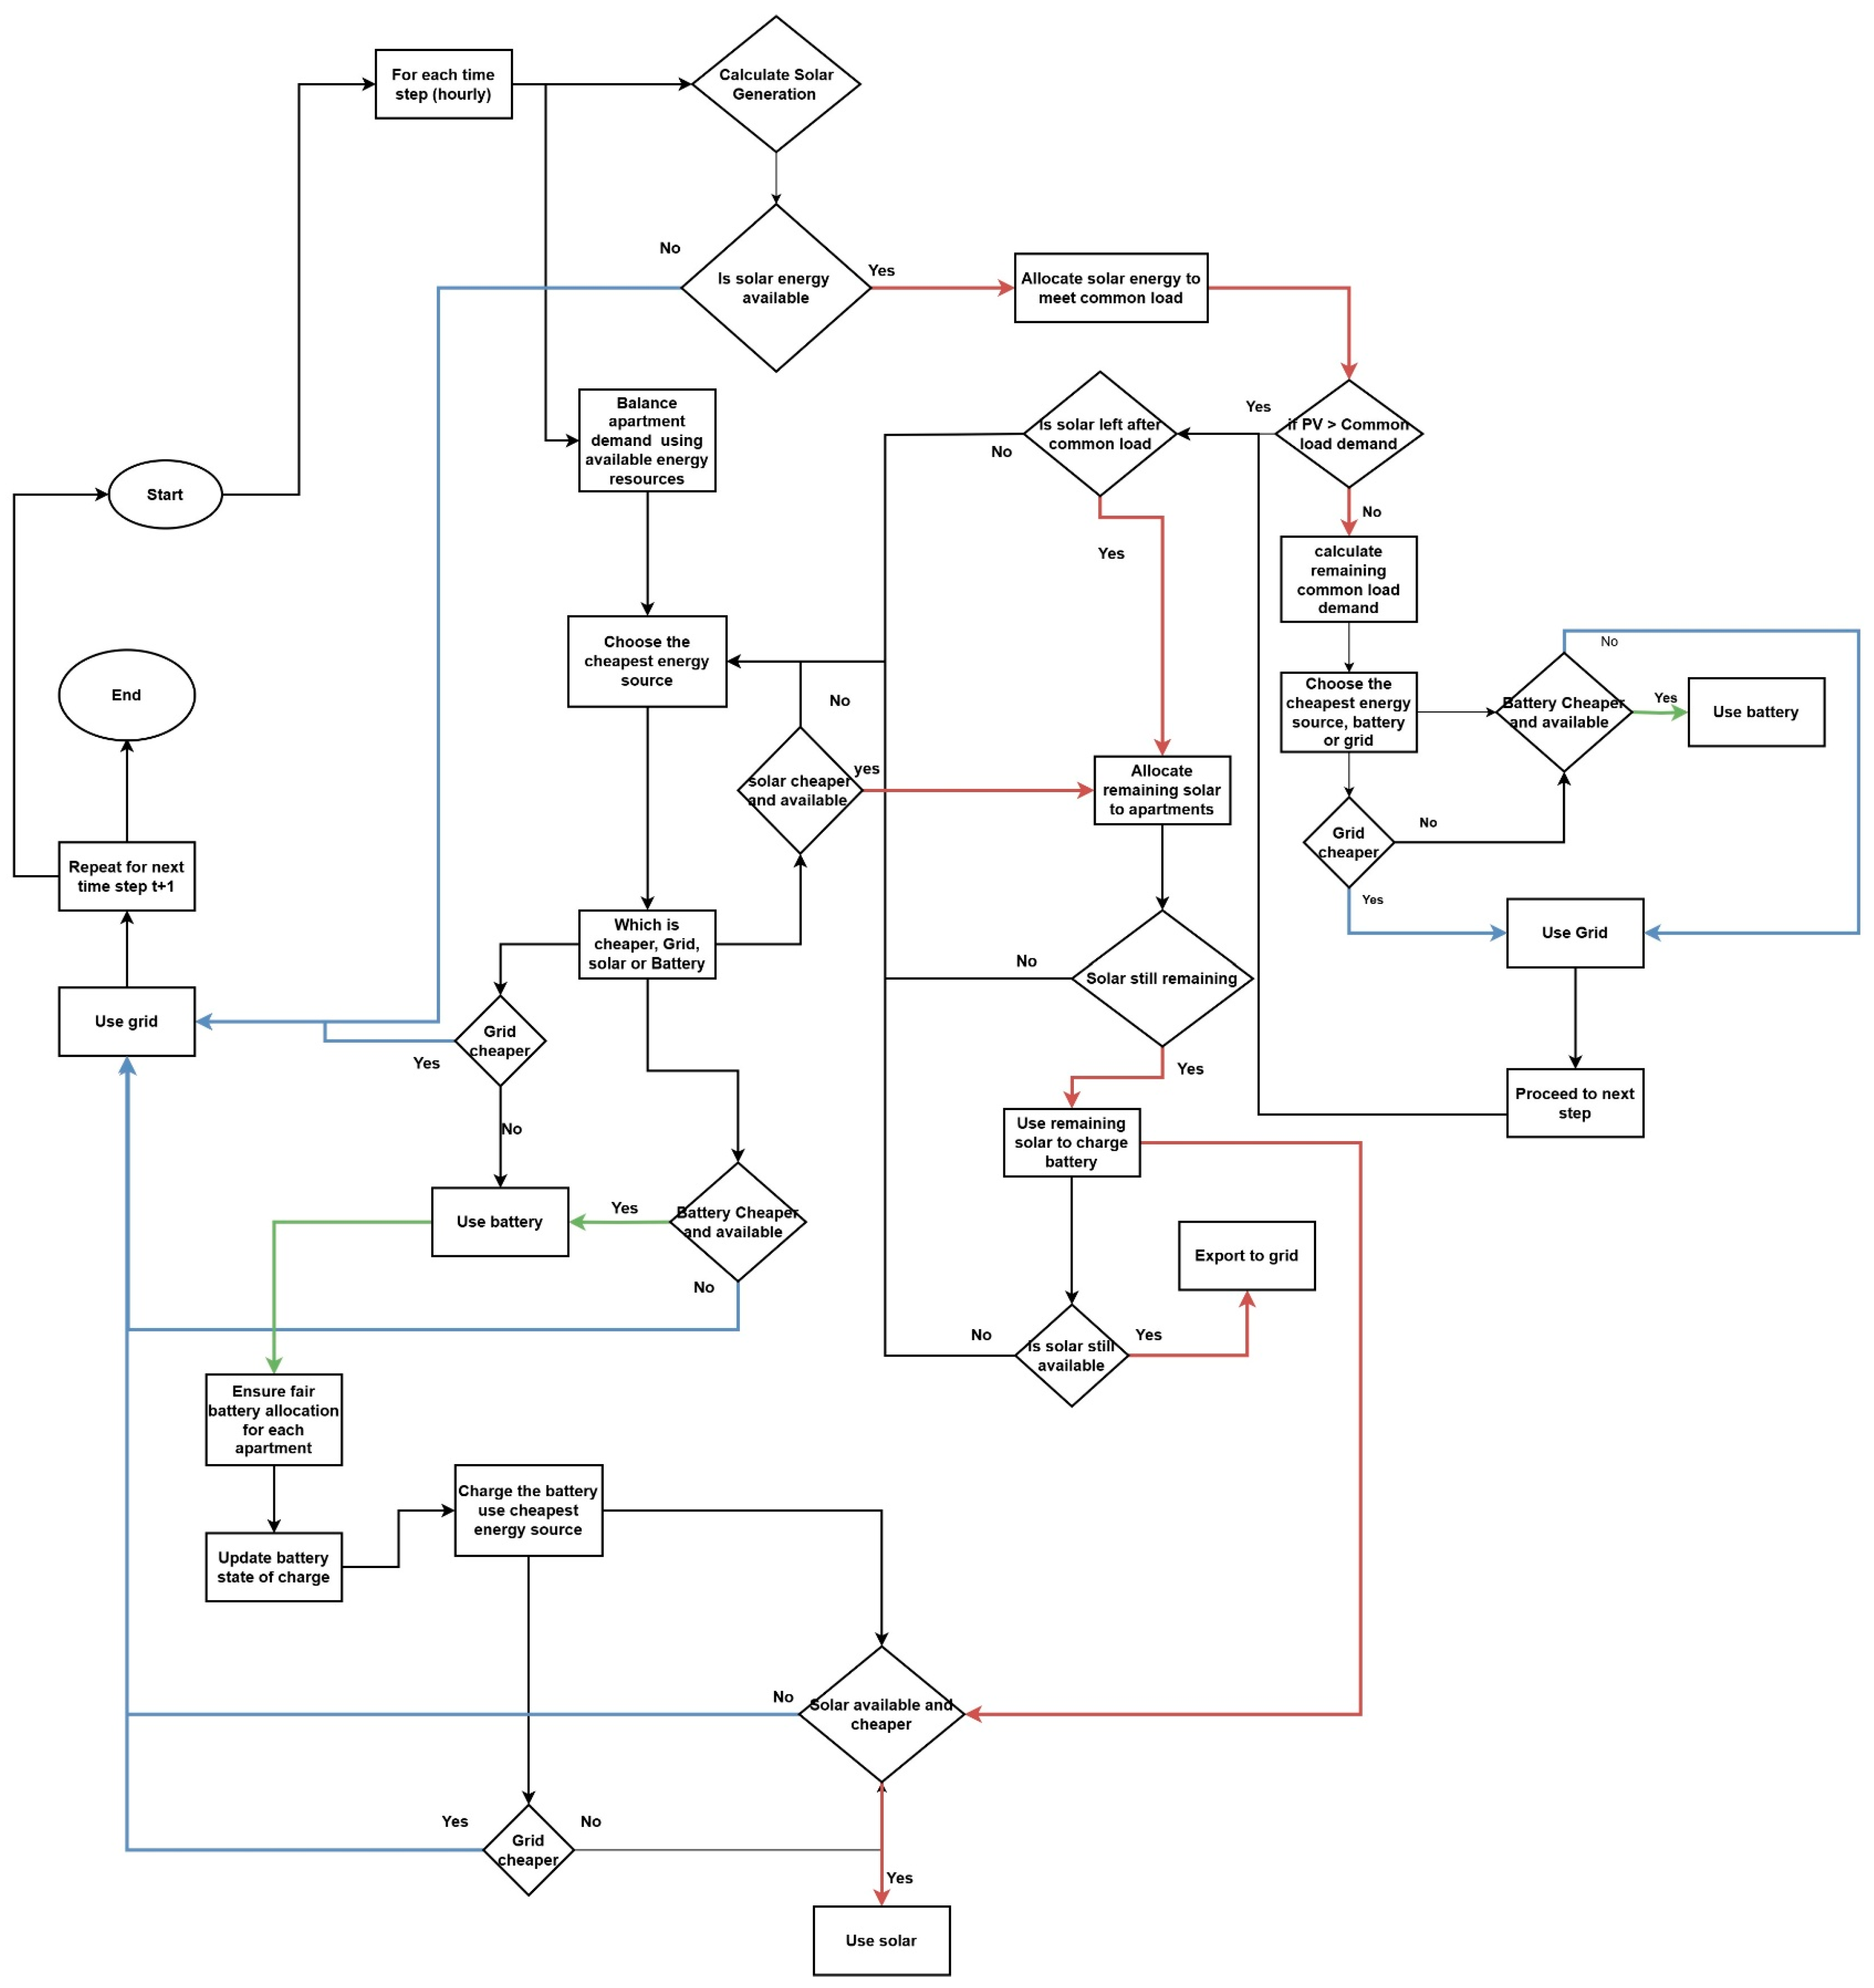
The flowchart in
Figure 2 illustrates the stepwise operational logic governing the hourly energy allocation in the proposed cost-optimized energy management system (EMS) for a multi-story residential building. The system evaluates the cost-effectiveness of available energy resources at each time step and ensures equitable battery usage, schedules EV charging flexibly within the defined overnight window, and incorporates fairness constraints and ownership-specific pricing. This dynamic decision framework ensures cost minimization while supporting demand response, community energy sharing, and grid-friendly operations. To aid interpretation, different arrow colors are used to denote energy flow paths and resource priorities. Red arrows represent the solar allocation path, which prioritizes solar energy in the sequence of meeting common loads, apartment loads, battery charging, and finally export to the grid. Blue arrows indicate the grid allocation path, showing how energy is sourced from the grid when solar and battery resources are either unavailable or economically suboptimal. Green arrows represent the battery usage path, emphasizing the allocation of battery discharge to meet demand and the enforcement of fairness constraints in energy sharing across apartments.
3. Results
This section presents the simulation outcomes of the proposed energy management systems for a multi-story residential building. The model is evaluated to investigate residential energy optimization through the integration of a shared rooftop solar PV system and a community BESS and to explore the potential of advancing community energy sharing within the building as a demand side management mechanism. The results are analyzed based on key performance indicators, including energy resource utilization, battery behavior, grid dependency, daily energy cost per apartment, common load management, and the effectiveness of community energy sharing. A comparative discussion highlights the strengths and limitations of each model, providing insights into the scalability and practical implementation of demand side management strategies and energy sharing frameworks in multi-story residential buildings.
The simulation was conducted over a 24 h time horizon, and the analysis is carried out for two seasonal scenarios using irradiance data for September 2024 (Spring) and February 2025 (Summer). Given that the shared battery is responsible for supplying both apartment and common loads, including EV charging, the battery capacity is increased to 40 kWh. The subsequent results describe the energy distribution across different subsystems.
3.1. Solar Generation and Total Demand Analysis
The 24 h solar generation profile was simulated using seasonal irradiance data for February and September. In both cases,
Figure 3, solar production begins around 5:00–6:00 AM, peaks near 11:00 AM with a maximum output of approximately 29 kW, and declines gradually toward the evening. The total solar energy generation is recorded as 206 kWh in September,
Figure 3a and 229 kWh in February,
Figure 3b, with effective generation spanning about 10 h. During midday, solar output often exceeds the total building demand, enabling surplus allocation for battery charging or export to the grid. The total building demand, however, increases substantially due to the integration of EV charging as a time-flexible load. The model assumes a daily EV charging demand of 100 kWh, shared across four stations, with operation allowed between 18:00 and 06:00 to reflect off-peak hours. Although the total EV energy demand remains fixed, the hourly allocation is optimized through a mixed-integer linear programming (MILP) framework to minimize cost.
In February,
Figure 3b, extended solar availability into late afternoon supports apartment and battery needs more effectively, resulting in a smoother EV charging distribution into early morning hours. In contrast, the narrower solar window in September,
Figure 3, limits early evening supply, leading the model to shift more EV charging to late night and early morning when grid prices are lowest. These results underscore the model’s sensitivity to both solar availability and tariff structures. The inclusion of time-flexible EV charging reshapes hourly demand dynamics and increases grid dependence during low-tariff hours, demonstrating the importance of coordinated scheduling in multi-resource energy systems.
3.2. Battery Behavior
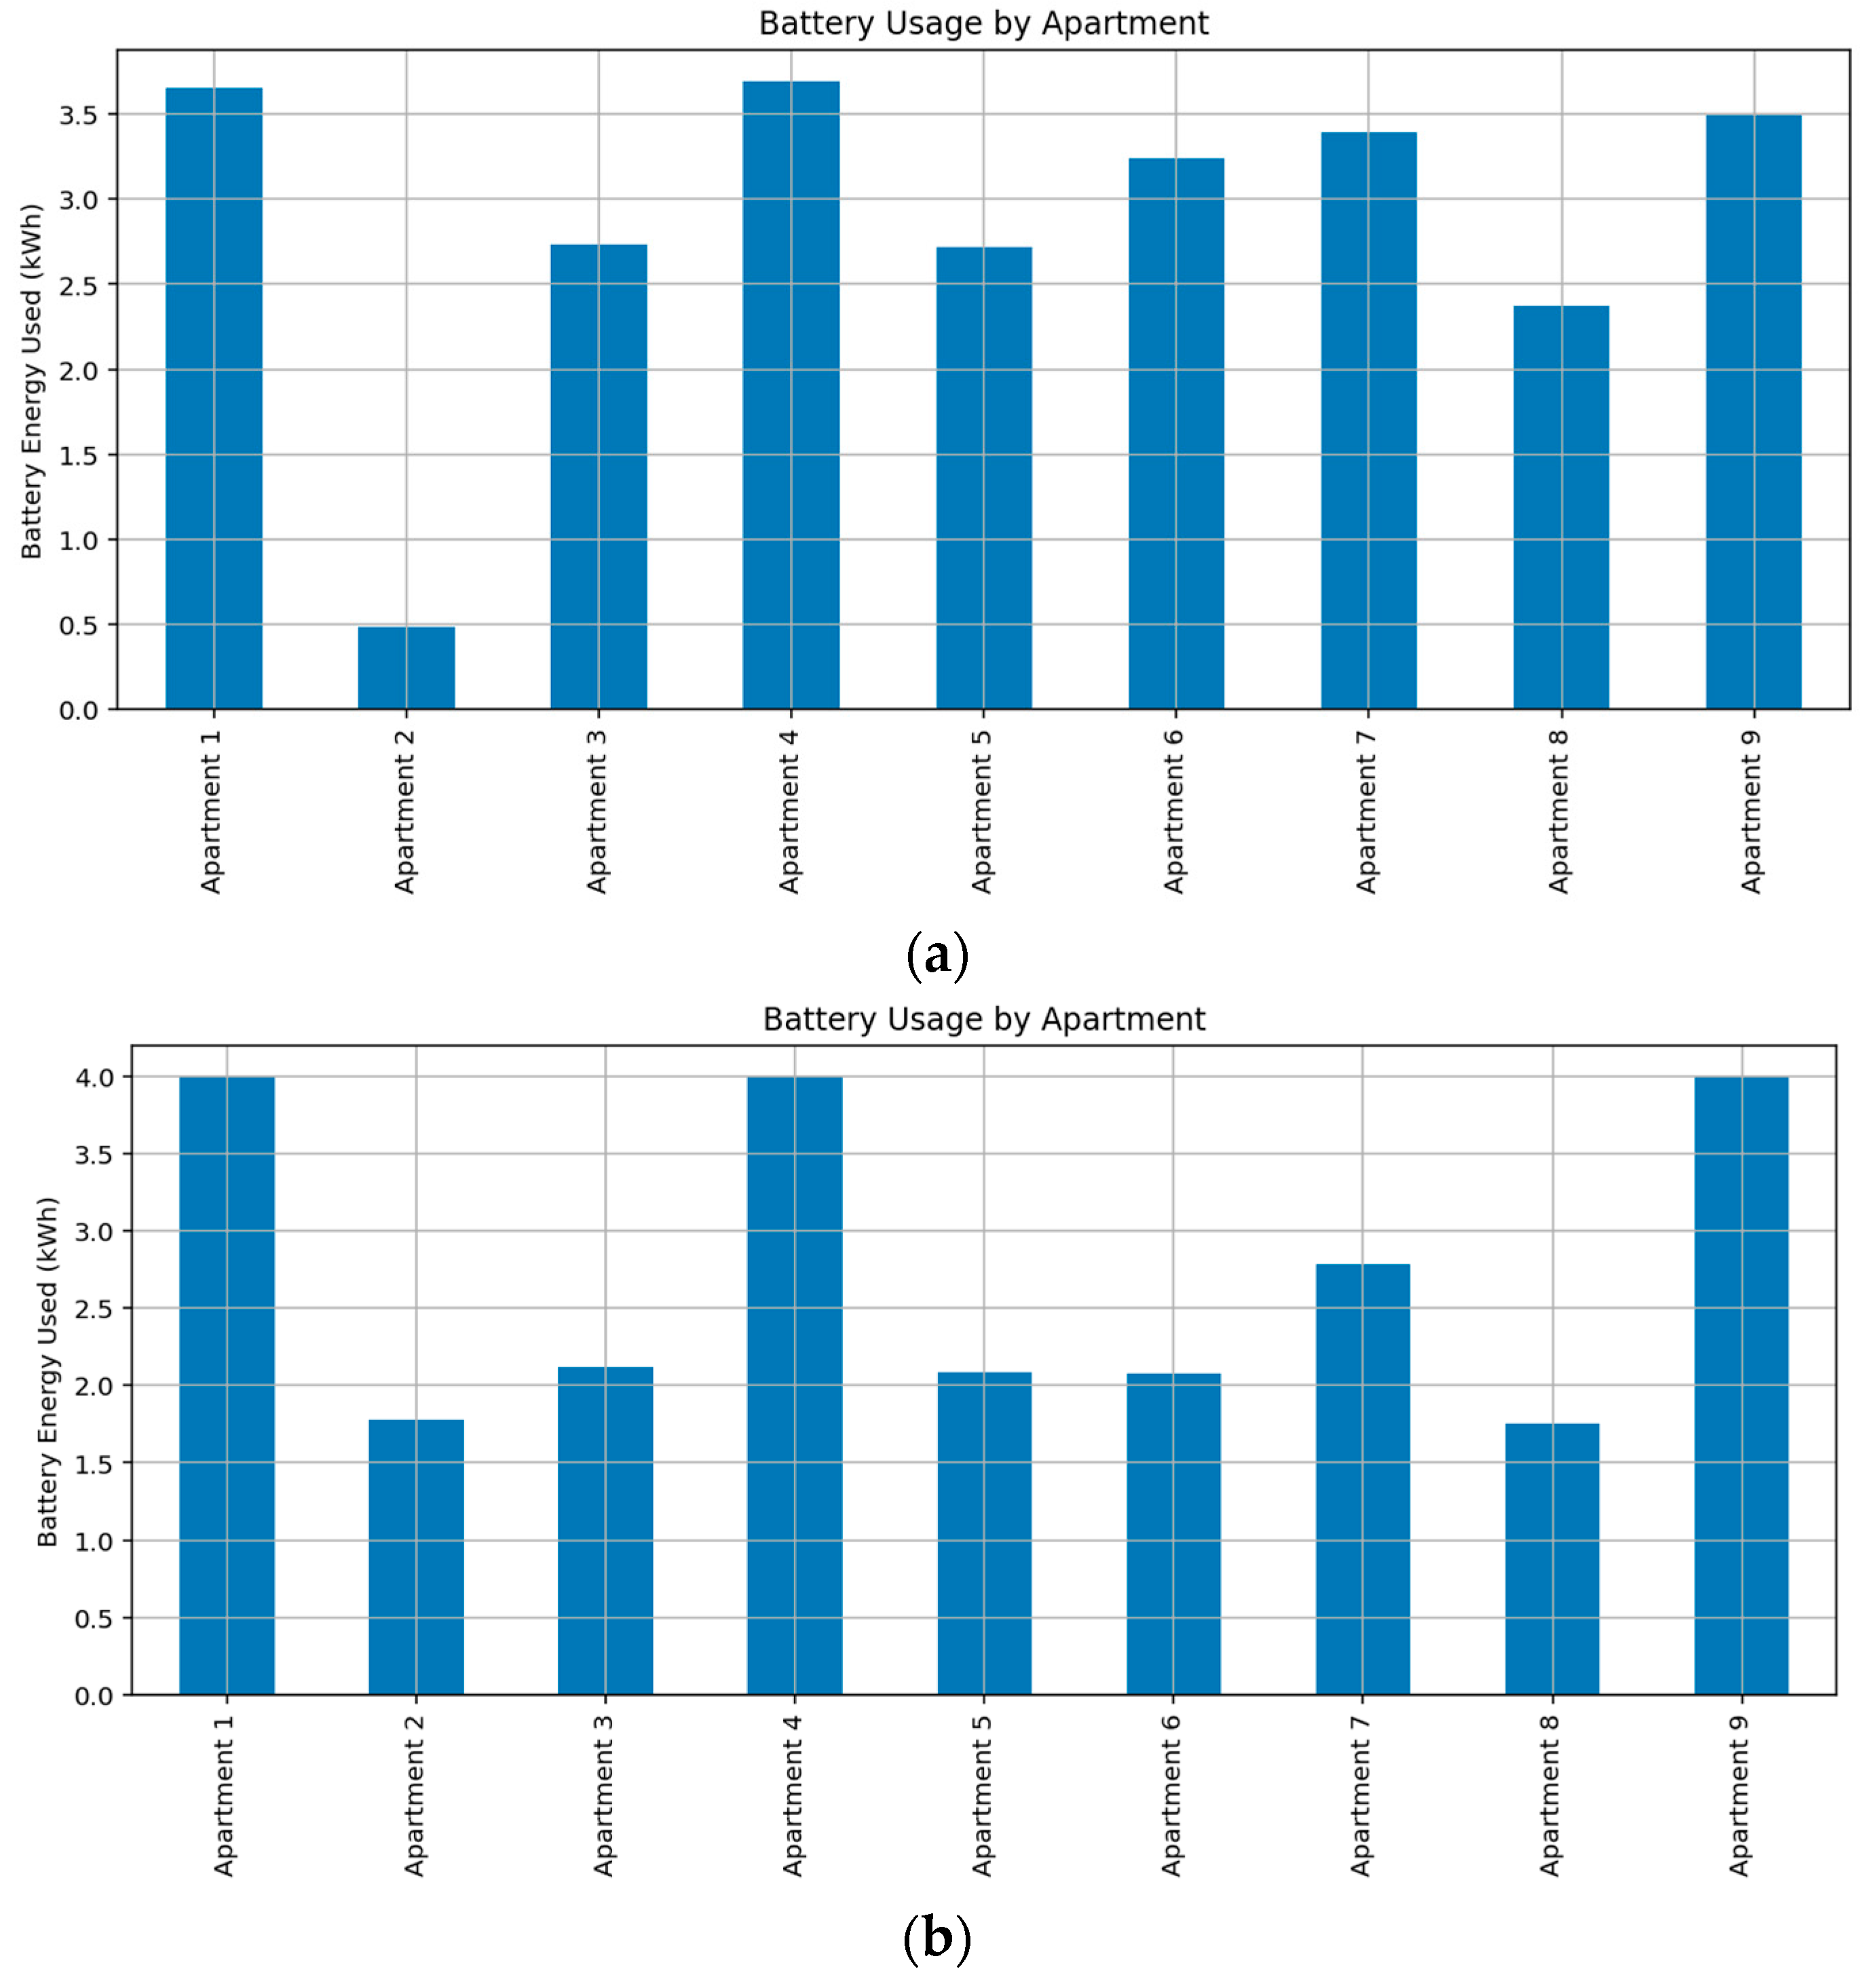
In the optimized energy management model, the shared battery system operates with a total capacity of 40 kWh to accommodate the additional energy requirements arising from EV charging and common area loads. The battery is used to support both individual apartment loads and shared community loads, with discharge prioritized based on real-time pricing and availability. Each apartment is allocated an equal share of the battery, but actual usage differs due to temporal demand variations and source availability. As illustrated in
Figure 4, Apartment 2 shows minimal usage in September (
Figure 4a) but greater reliance on battery energy in February (
Figure 4b), indicating the influence of seasonal load dynamics and solar generation patterns.
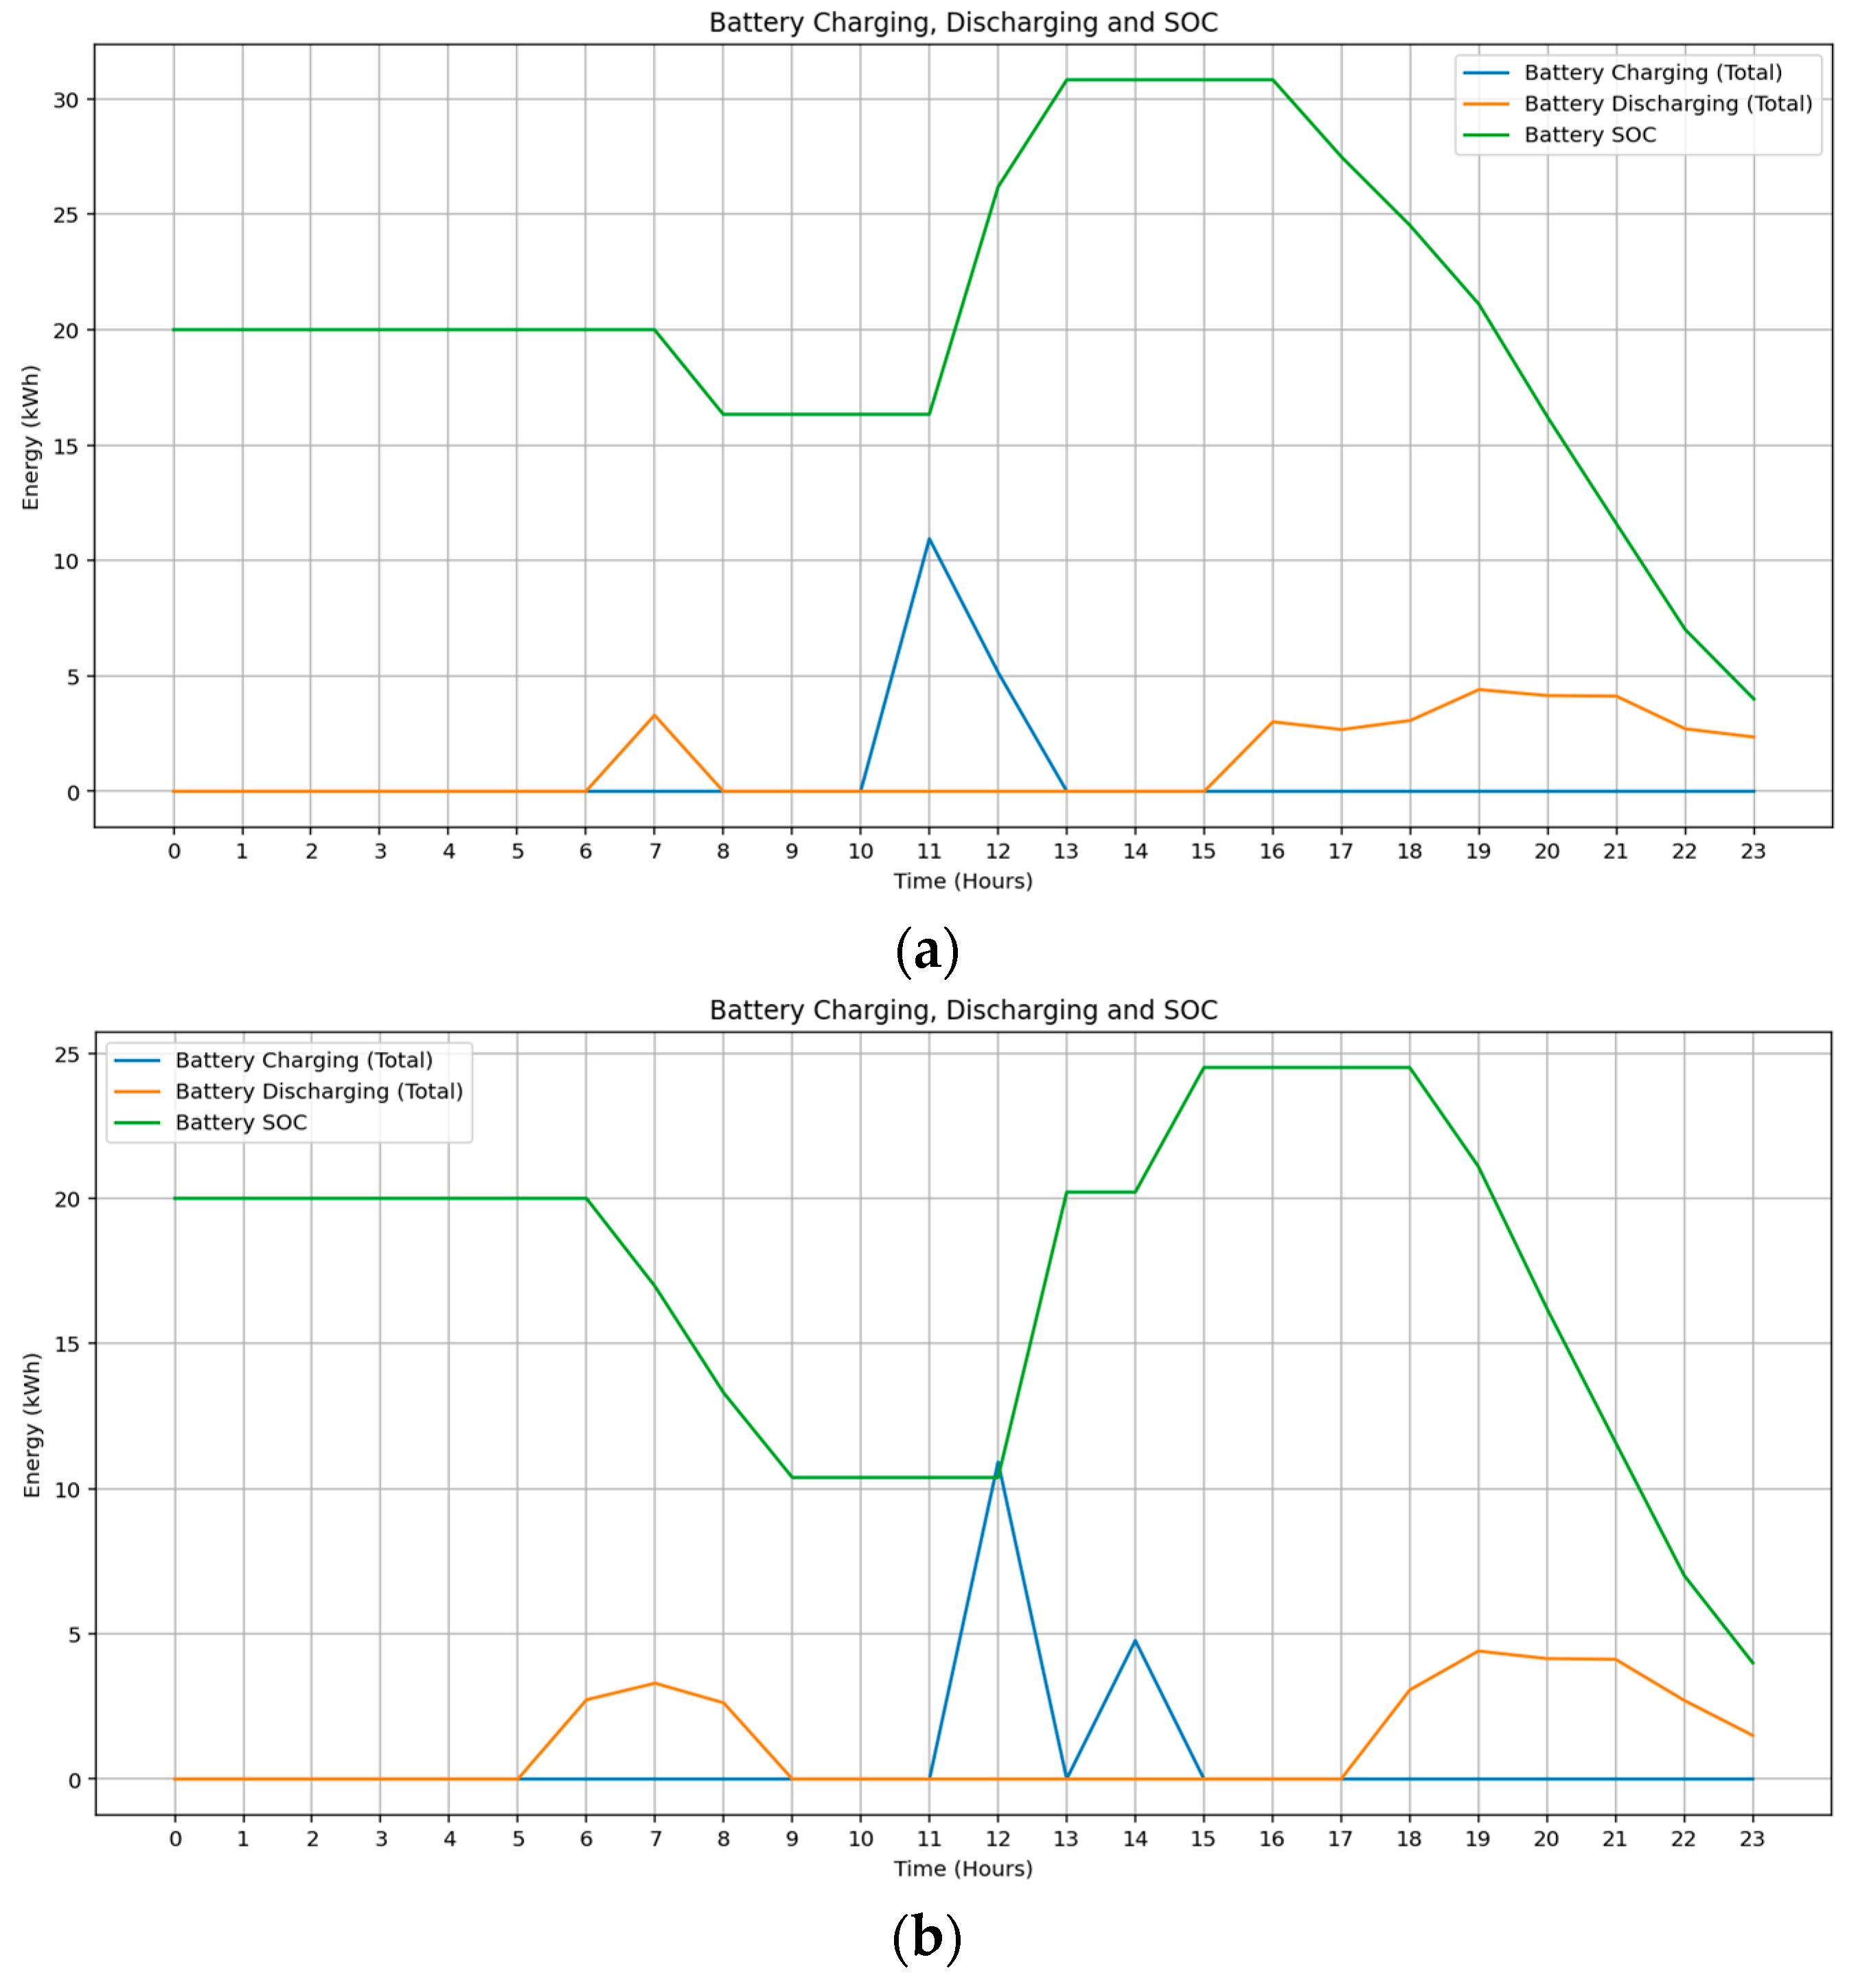
Battery SOC patterns further highlight seasonal effects. As shown in
Figure 5a, September operation is characterized by afternoon discharging commencing around 15:00 hrs, while in February,
Figure 5b, higher solar availability allows the system to maintain SOC during the day and defer discharge until approximately 17 h. The battery is exclusively charged using surplus solar energy in both scenarios, resulting in zero-cost charging while enhancing solar self-consumption and supporting overnight load demands.
3.3. Energy Consumption by Common Loads
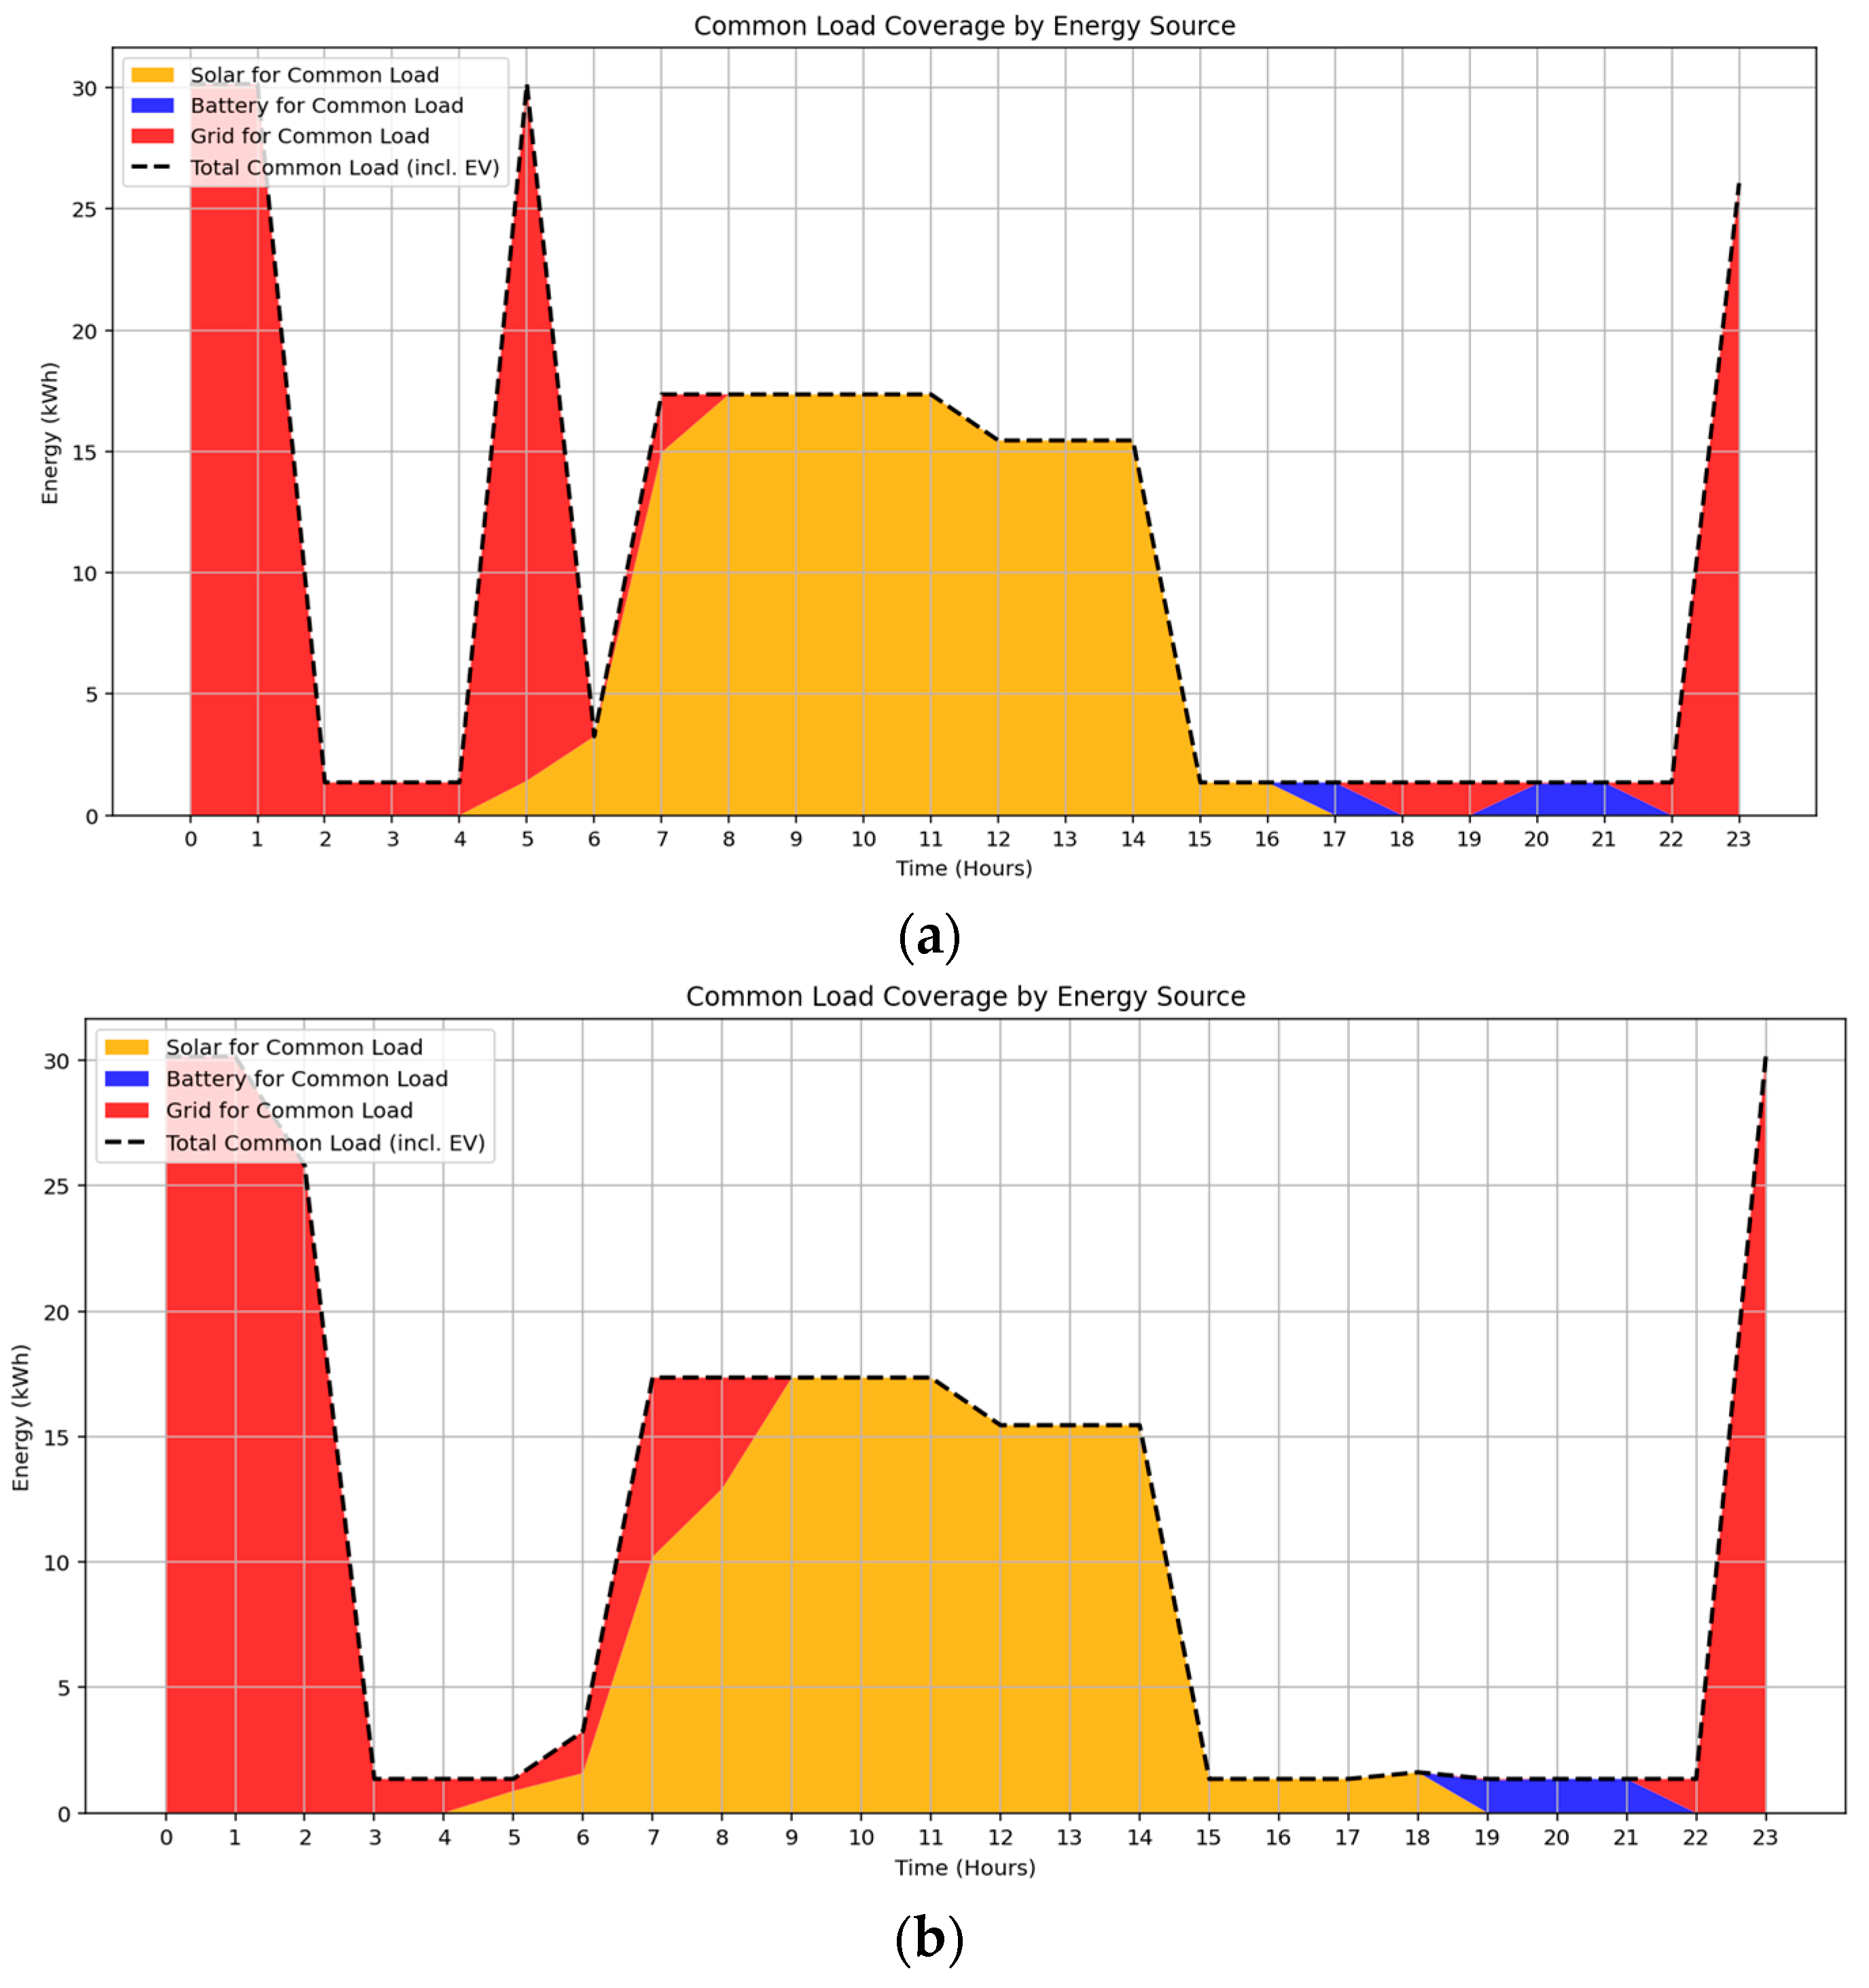
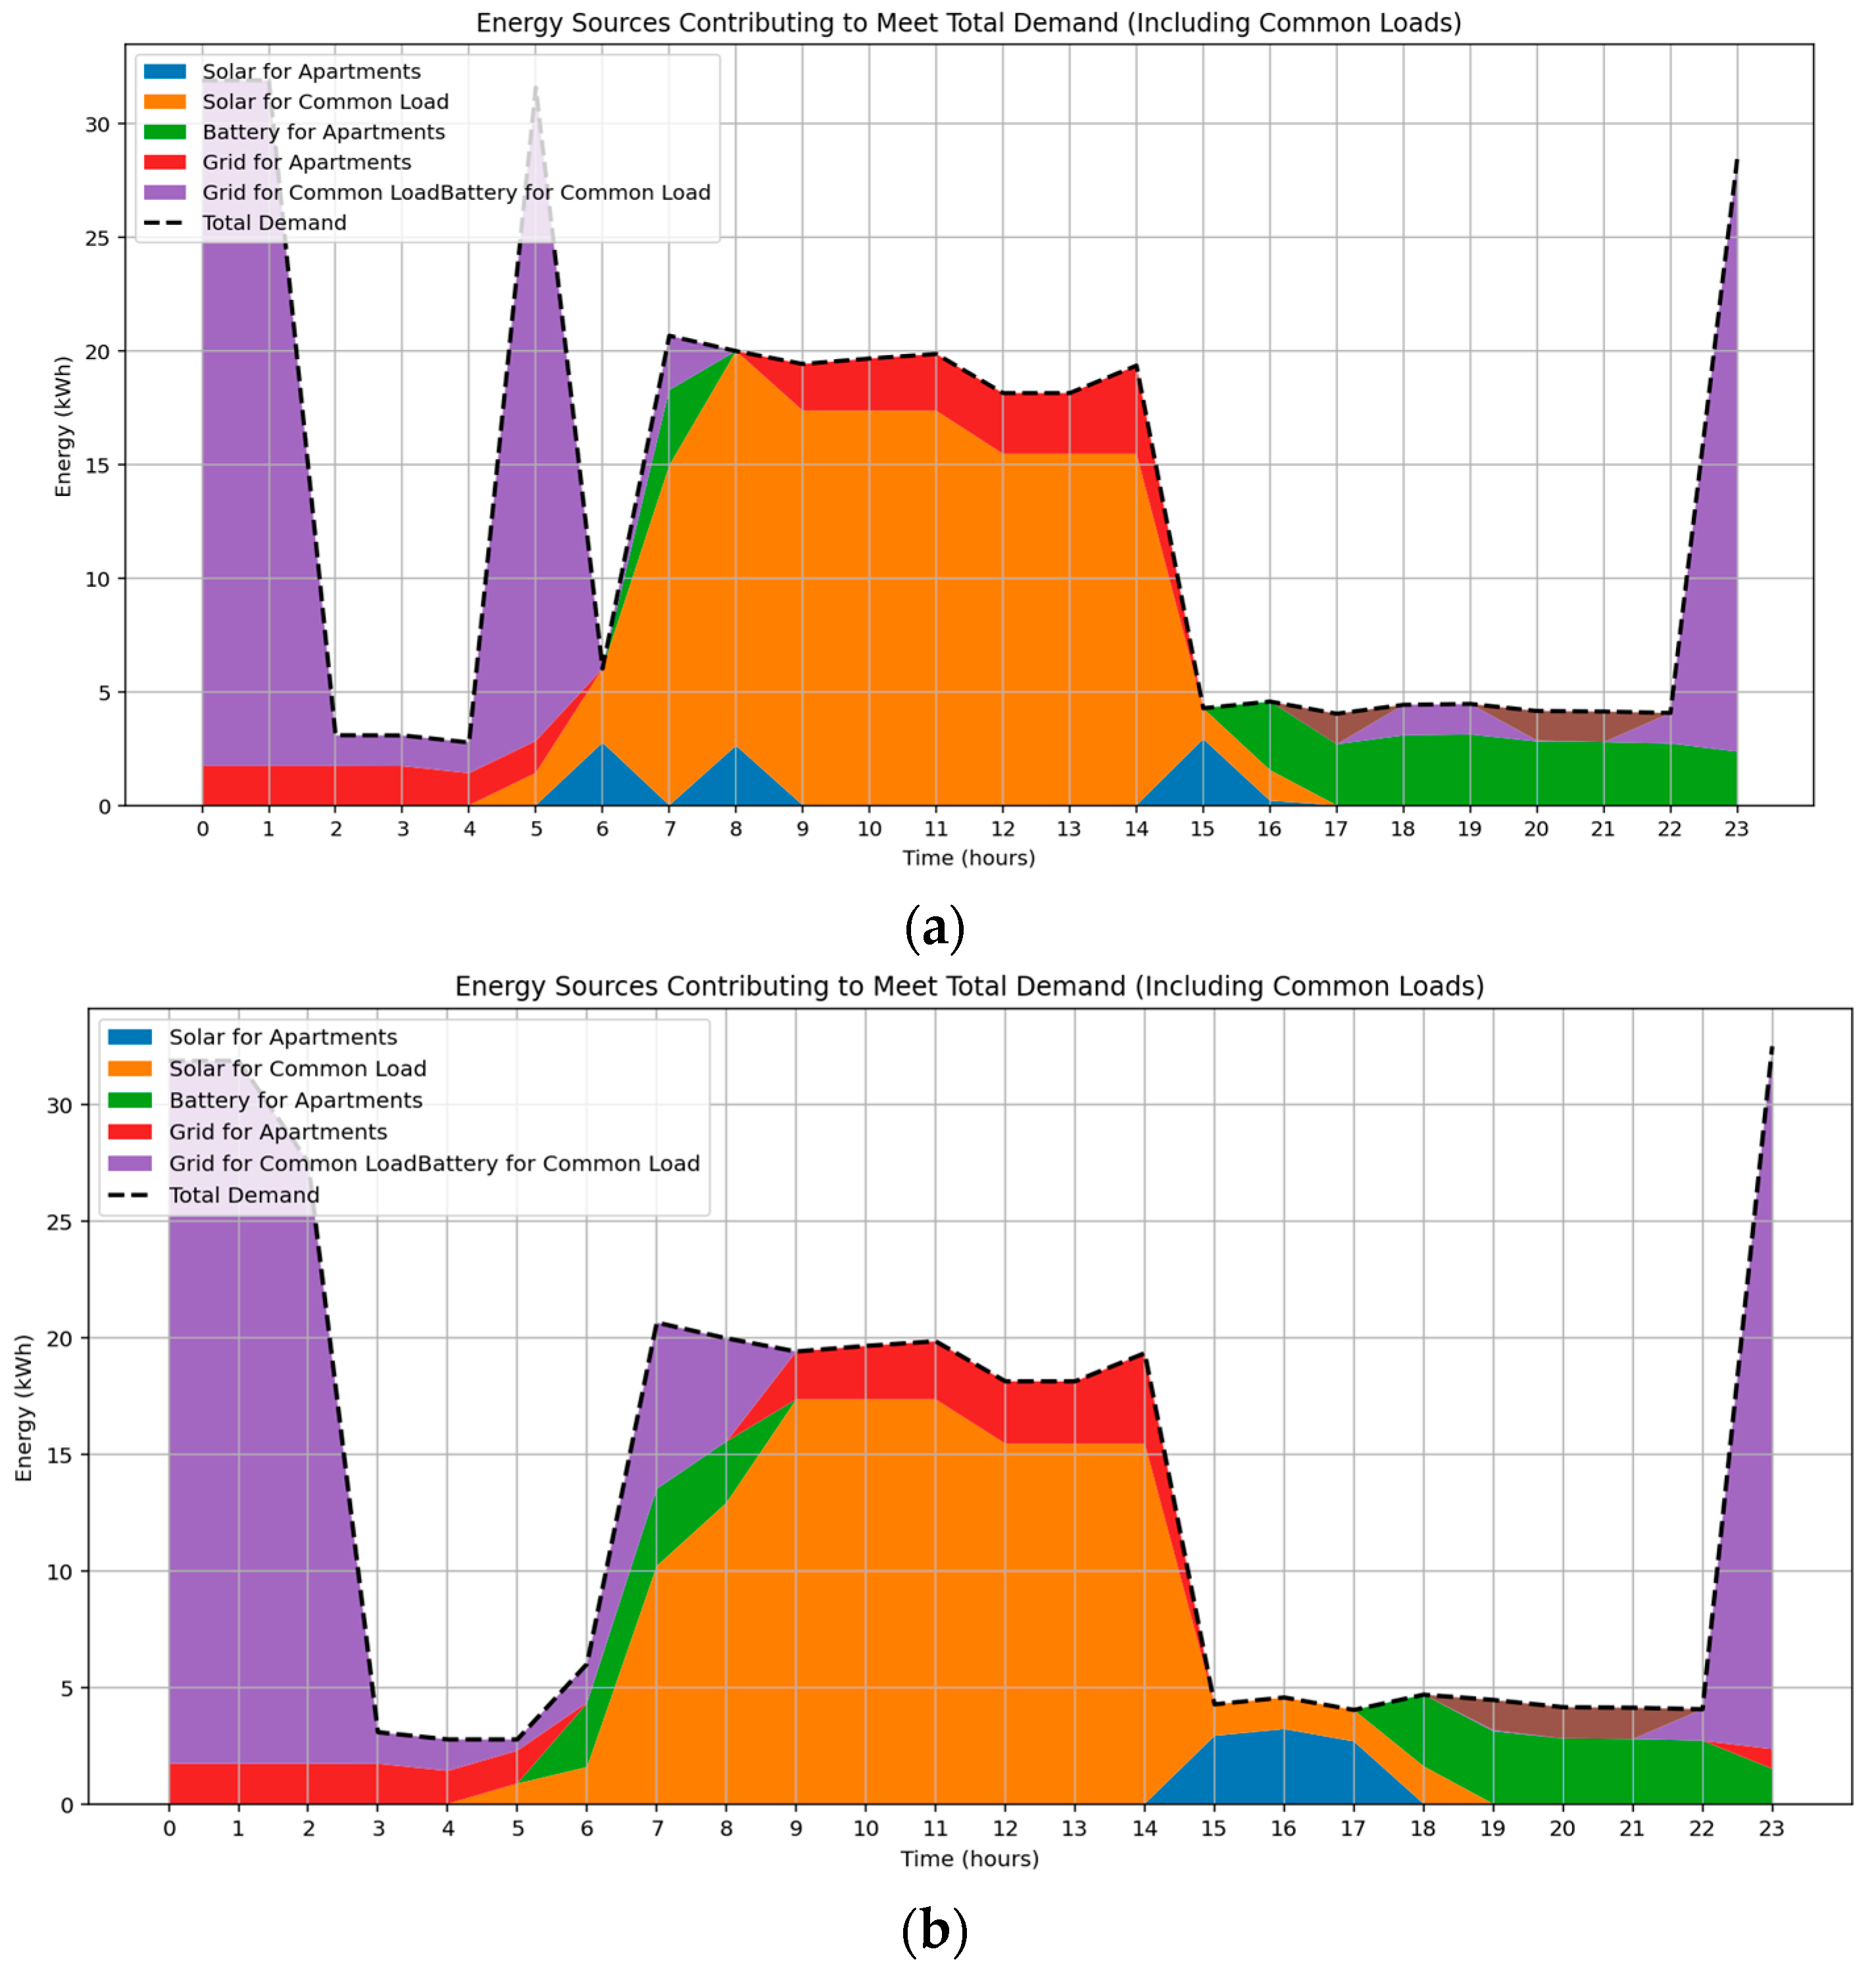
The temporal variation in common load coverage across two seasonal profiles of September and February is illustrated in
Figure 6a,b. As expected, solar energy primarily covers the common load demand during daylight hours, while battery energy supports demand during the evening, offering a cost-effective alternative to grid electricity. The EV charging occurs between 18:00 and 06:00, outside the peak solar window, resulting in increased dependence on grid energy.
The energy source breakdown and associated costs for EV charging and common loads in both seasonal cases are summarized in
Table 5. Despite a higher total solar generation of approximately 229 kWh in summer compared to 206 kWh in spring, the combined energy cost for EV charging and common loads is slightly elevated in summer. This is primarily due to the temporal mismatch between solar availability (daytime hours) and EV charging windows (18:00–06:00), which fall outside peak solar production periods. Although EV charging is scheduled during super off-peak and off-peak tariff periods to reduce cost, most of the energy demand is still fulfilled by the grid.
Additionally, the uneven alignment between solar generation and flexible load periods results in less efficient solar integration. In summer, delayed morning solar availability and increased demand during specific intervals contribute to higher operational costs. These findings demonstrate that total solar generation is not the sole determinant of cost-effectiveness. Instead, demand timing, battery state-of-charge dynamics, and tariff structures significantly influence the overall economic performance of the energy system.
3.4. Optimized Energy Consumption Across Apartments
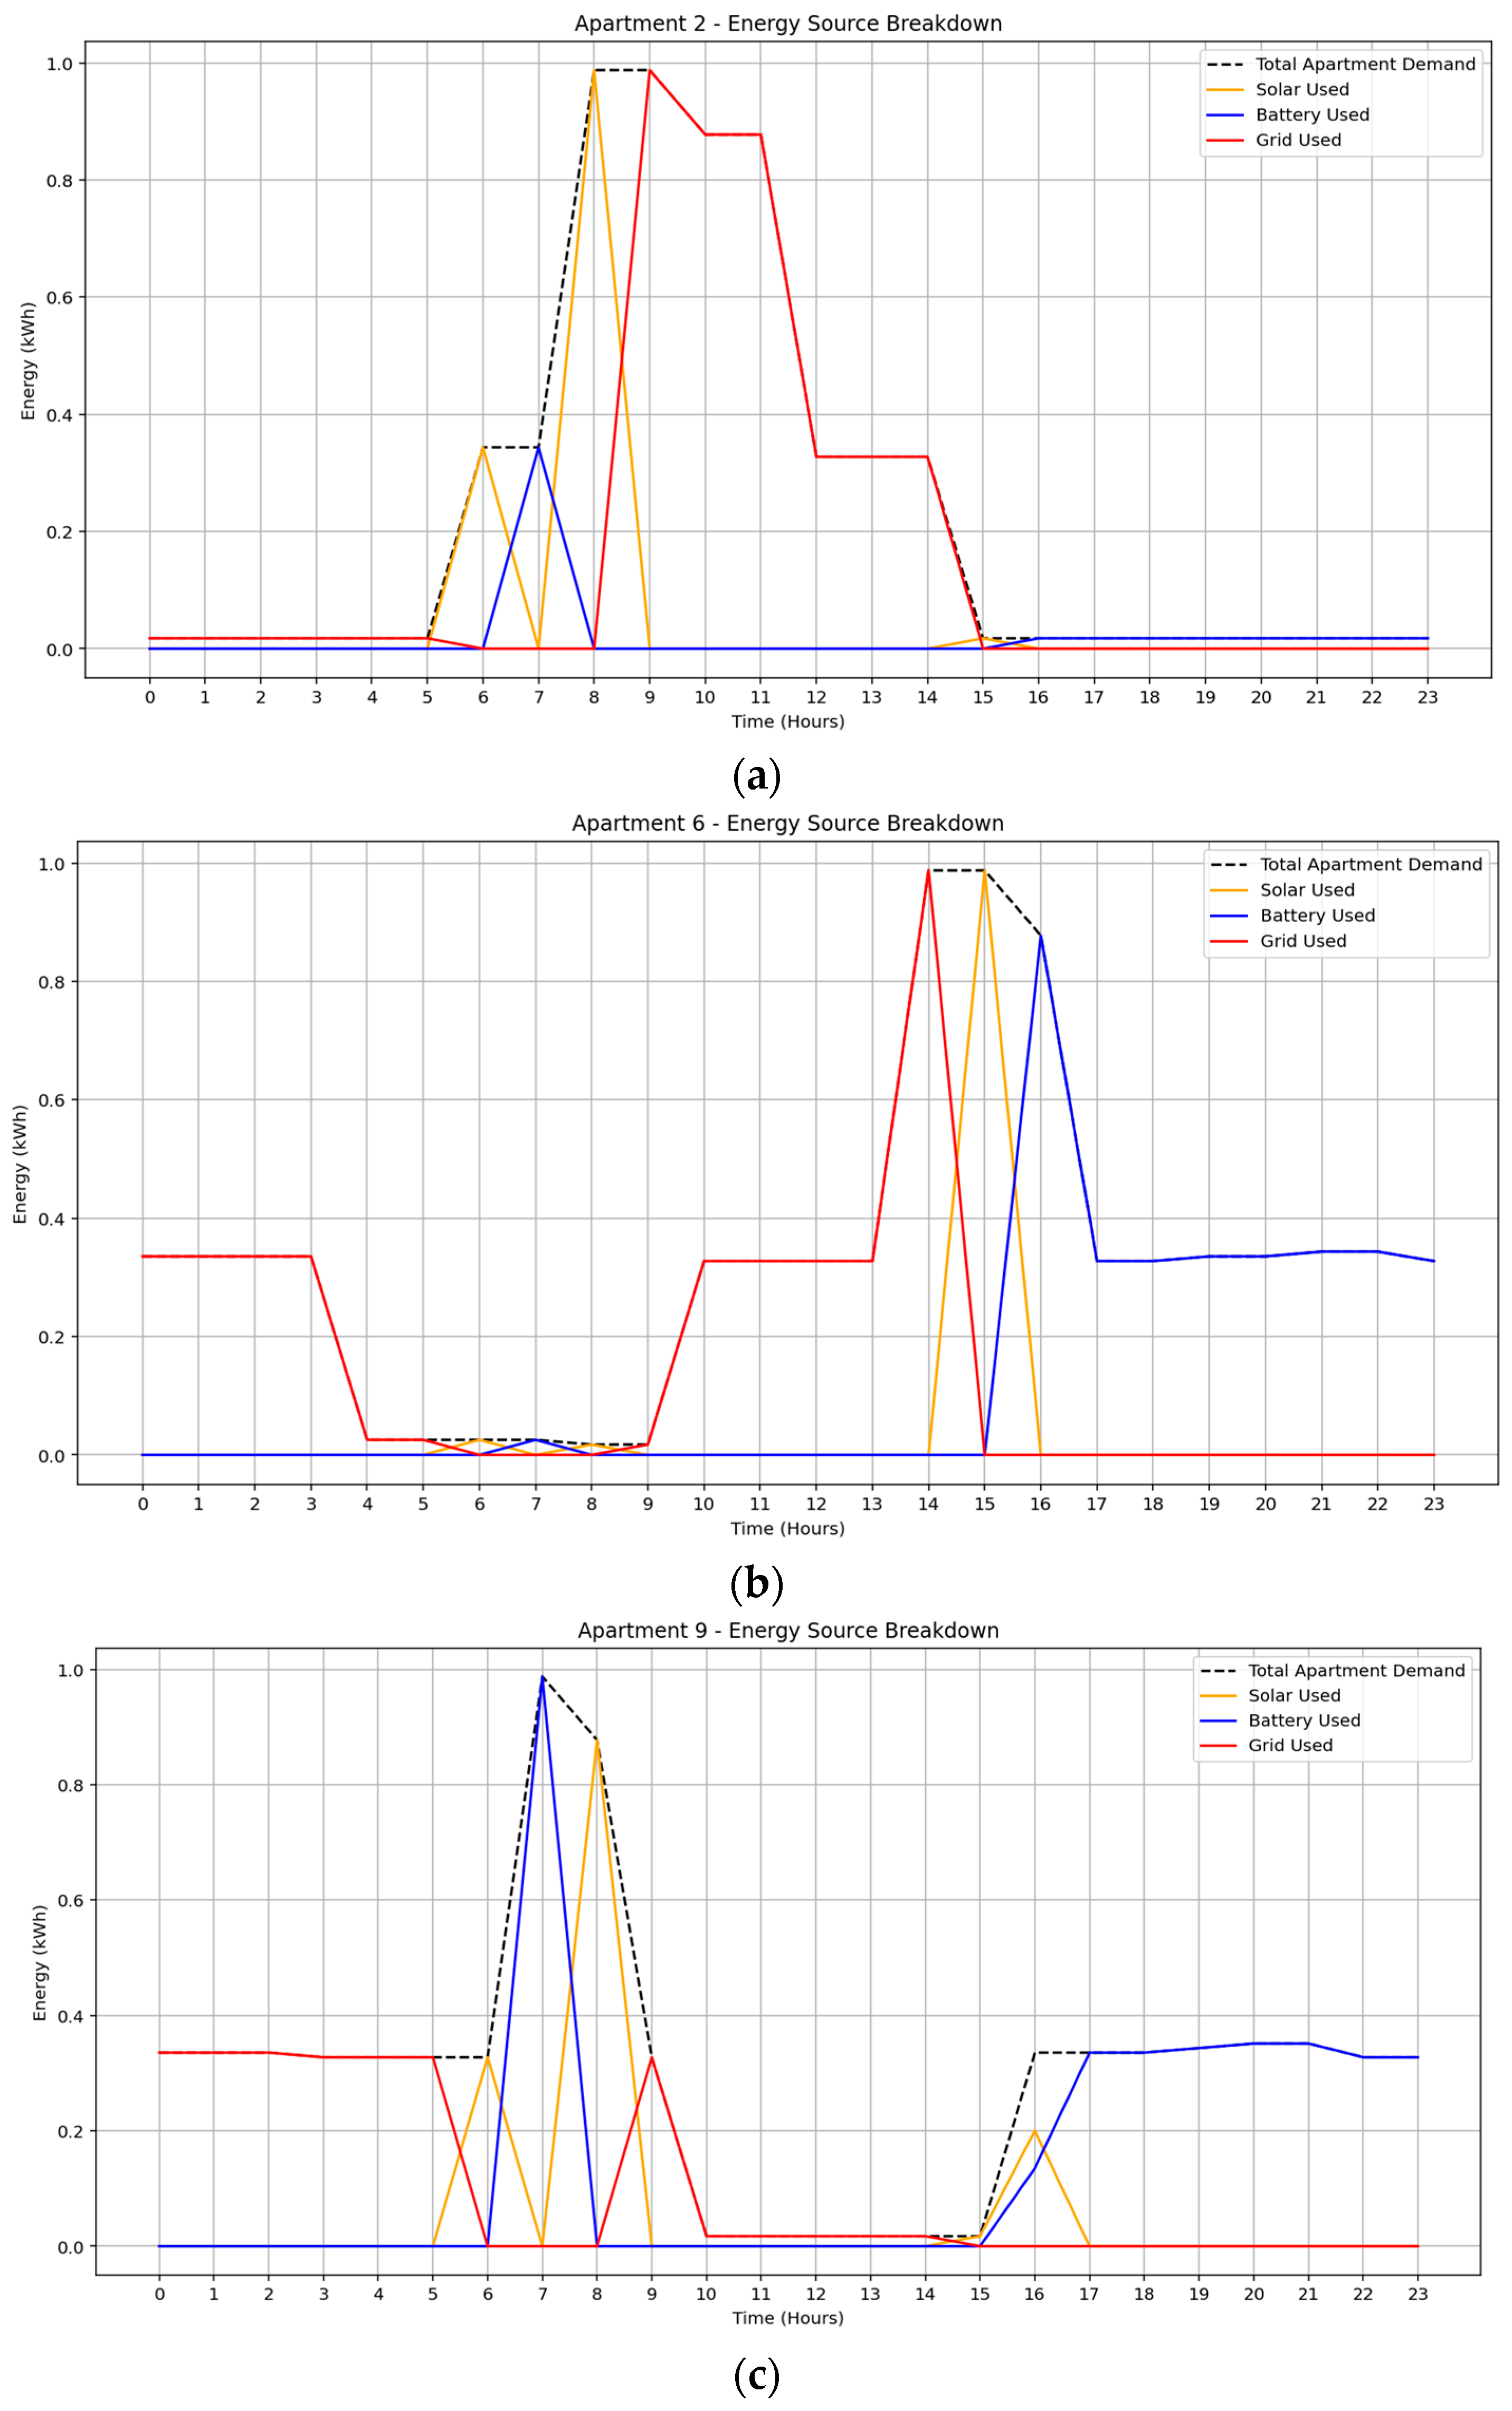
In the September 2024 solar irradiance scenario, the MILP-optimized energy management system effectively minimized grid dependency by dynamically allocating the most cost-effective energy source at each time step.
Figure 7a–c presents the energy breakdown for three distinct apartment units, 2, 6, and 9, each exhibiting varied load behaviors.
Apartment 2 showed moderate reliance on grid electricity, particularly during daytime hours, with limited battery and solar utilization, suggesting lower appliance flexibility. Apartment 6, in contrast, relied primarily on battery discharge with supplementary grid support, indicating a more strategic use of stored energy. Apartment 9 demonstrated balanced usage across solar, battery, and grid resources, nearly exhausting its battery allocation, thereby reflecting a highly flexible demand profile and enhanced participation in community energy sharing.
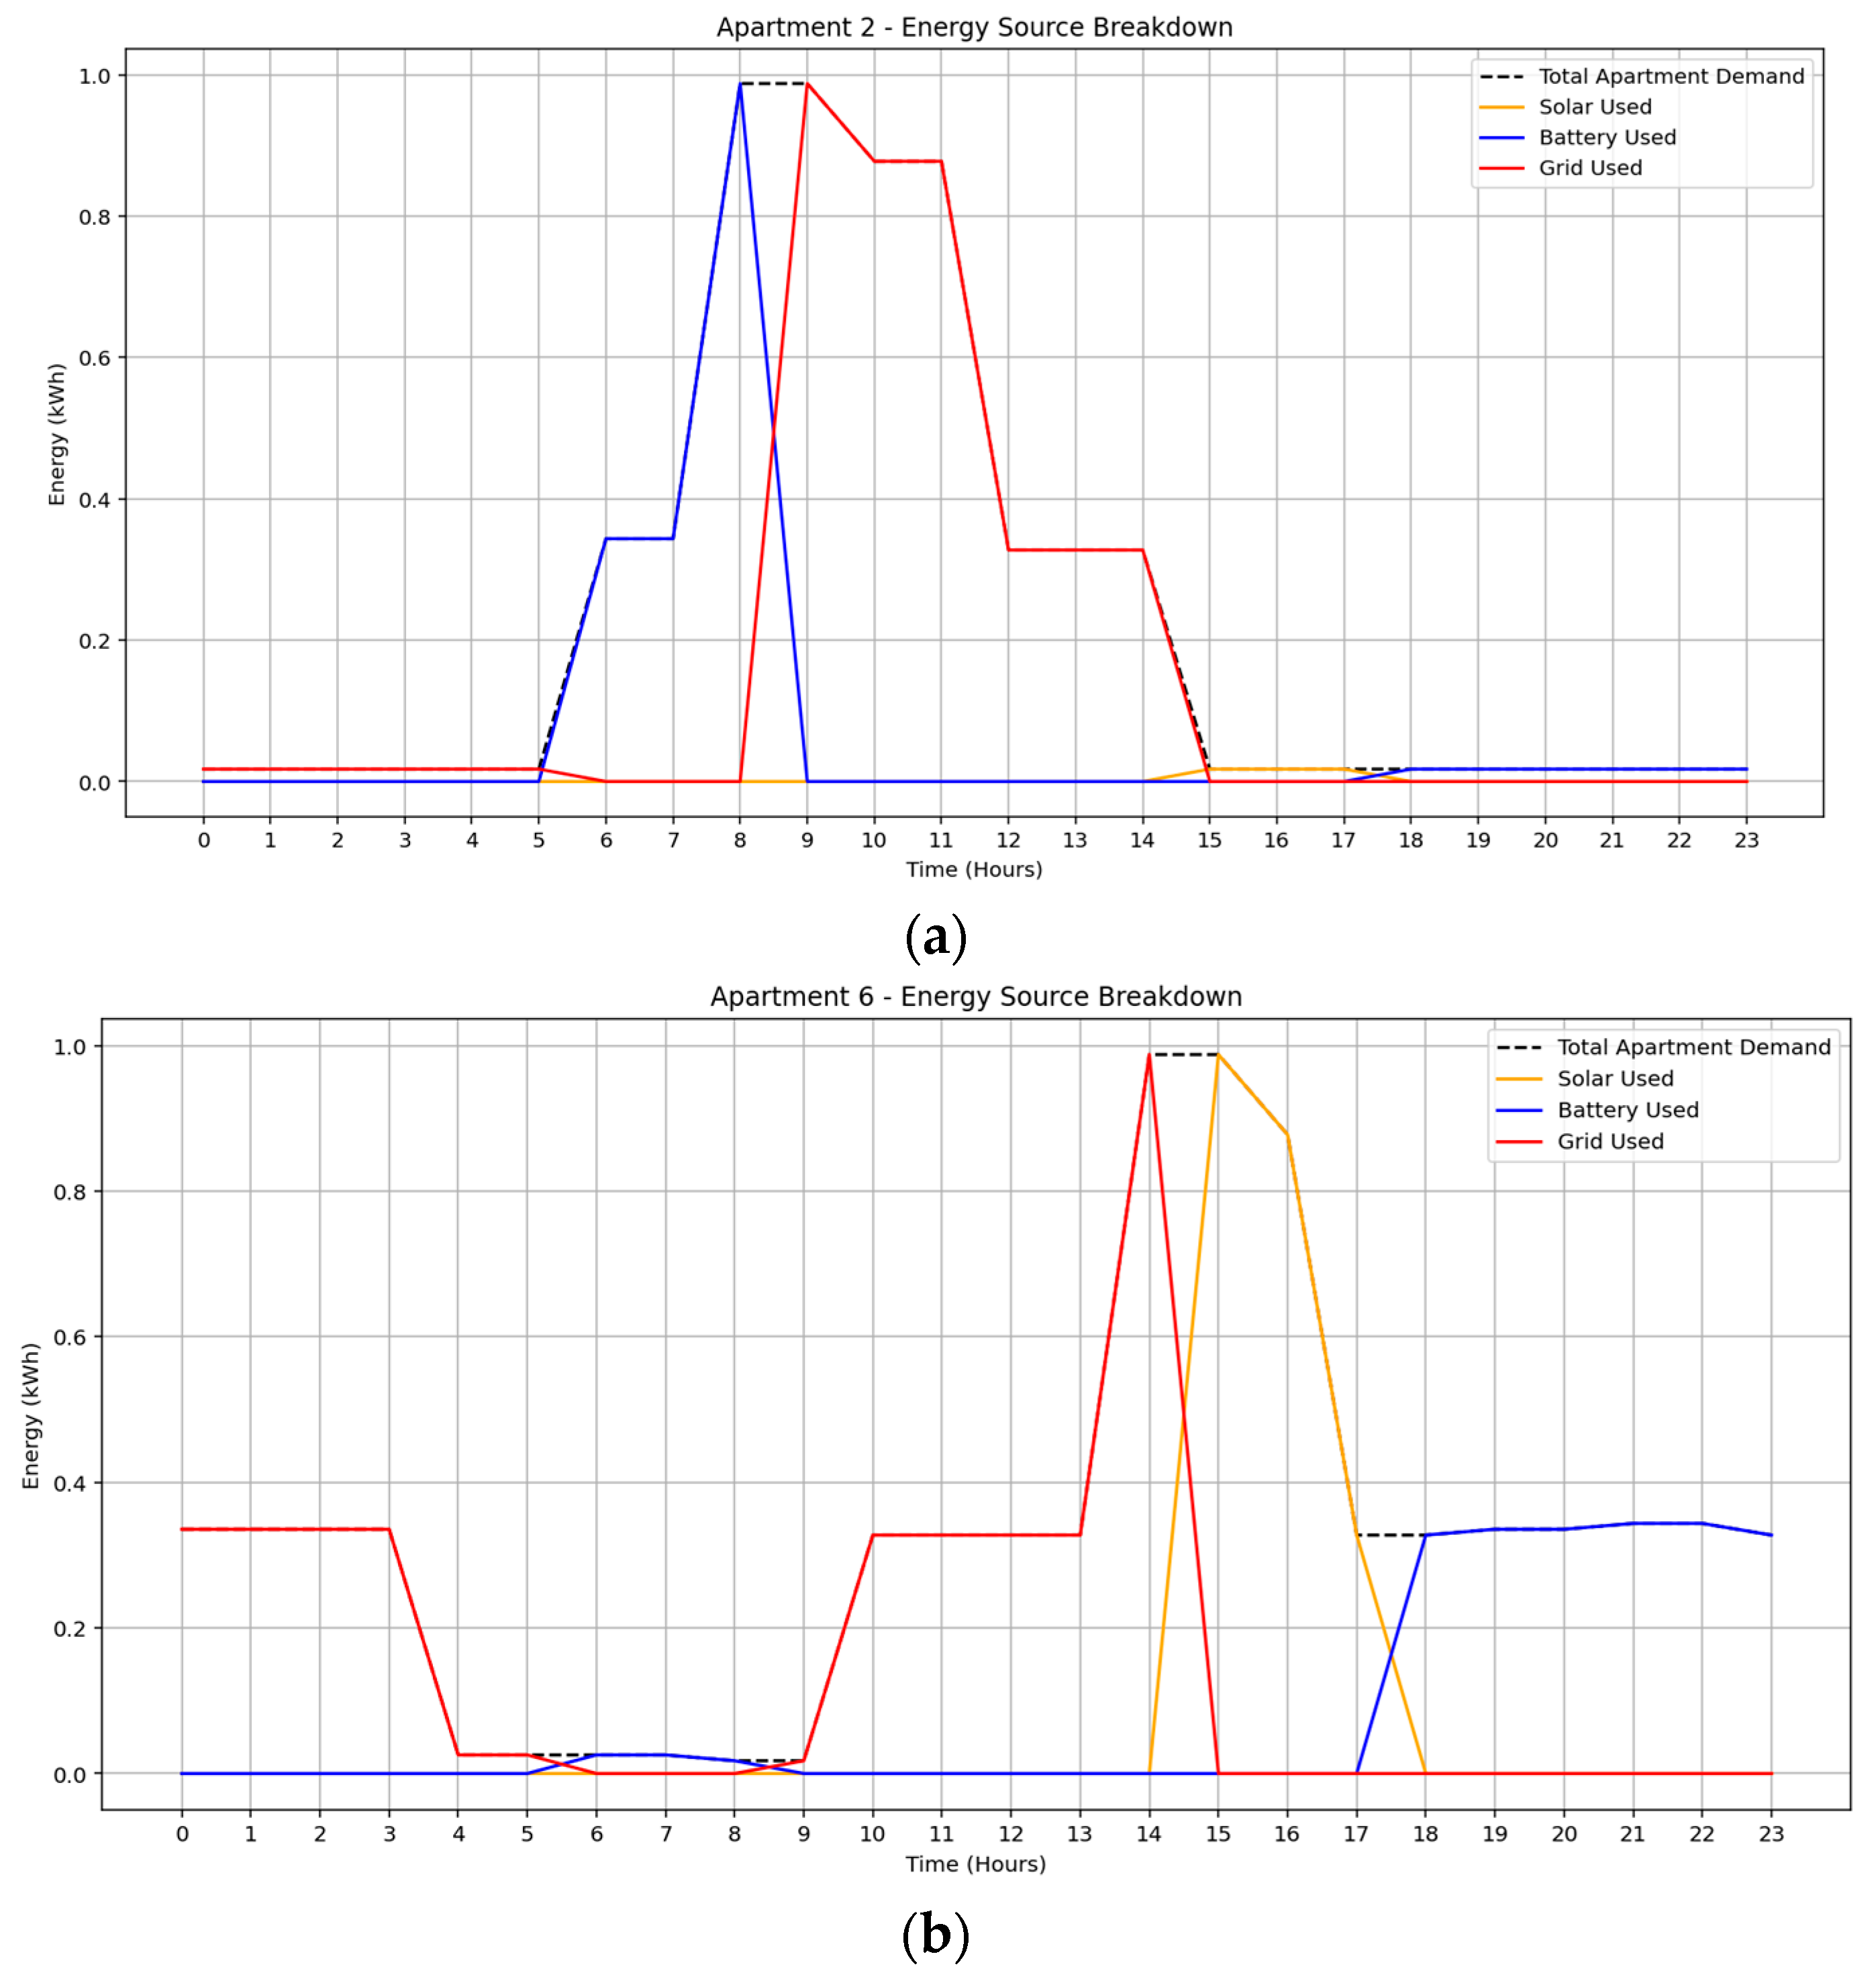
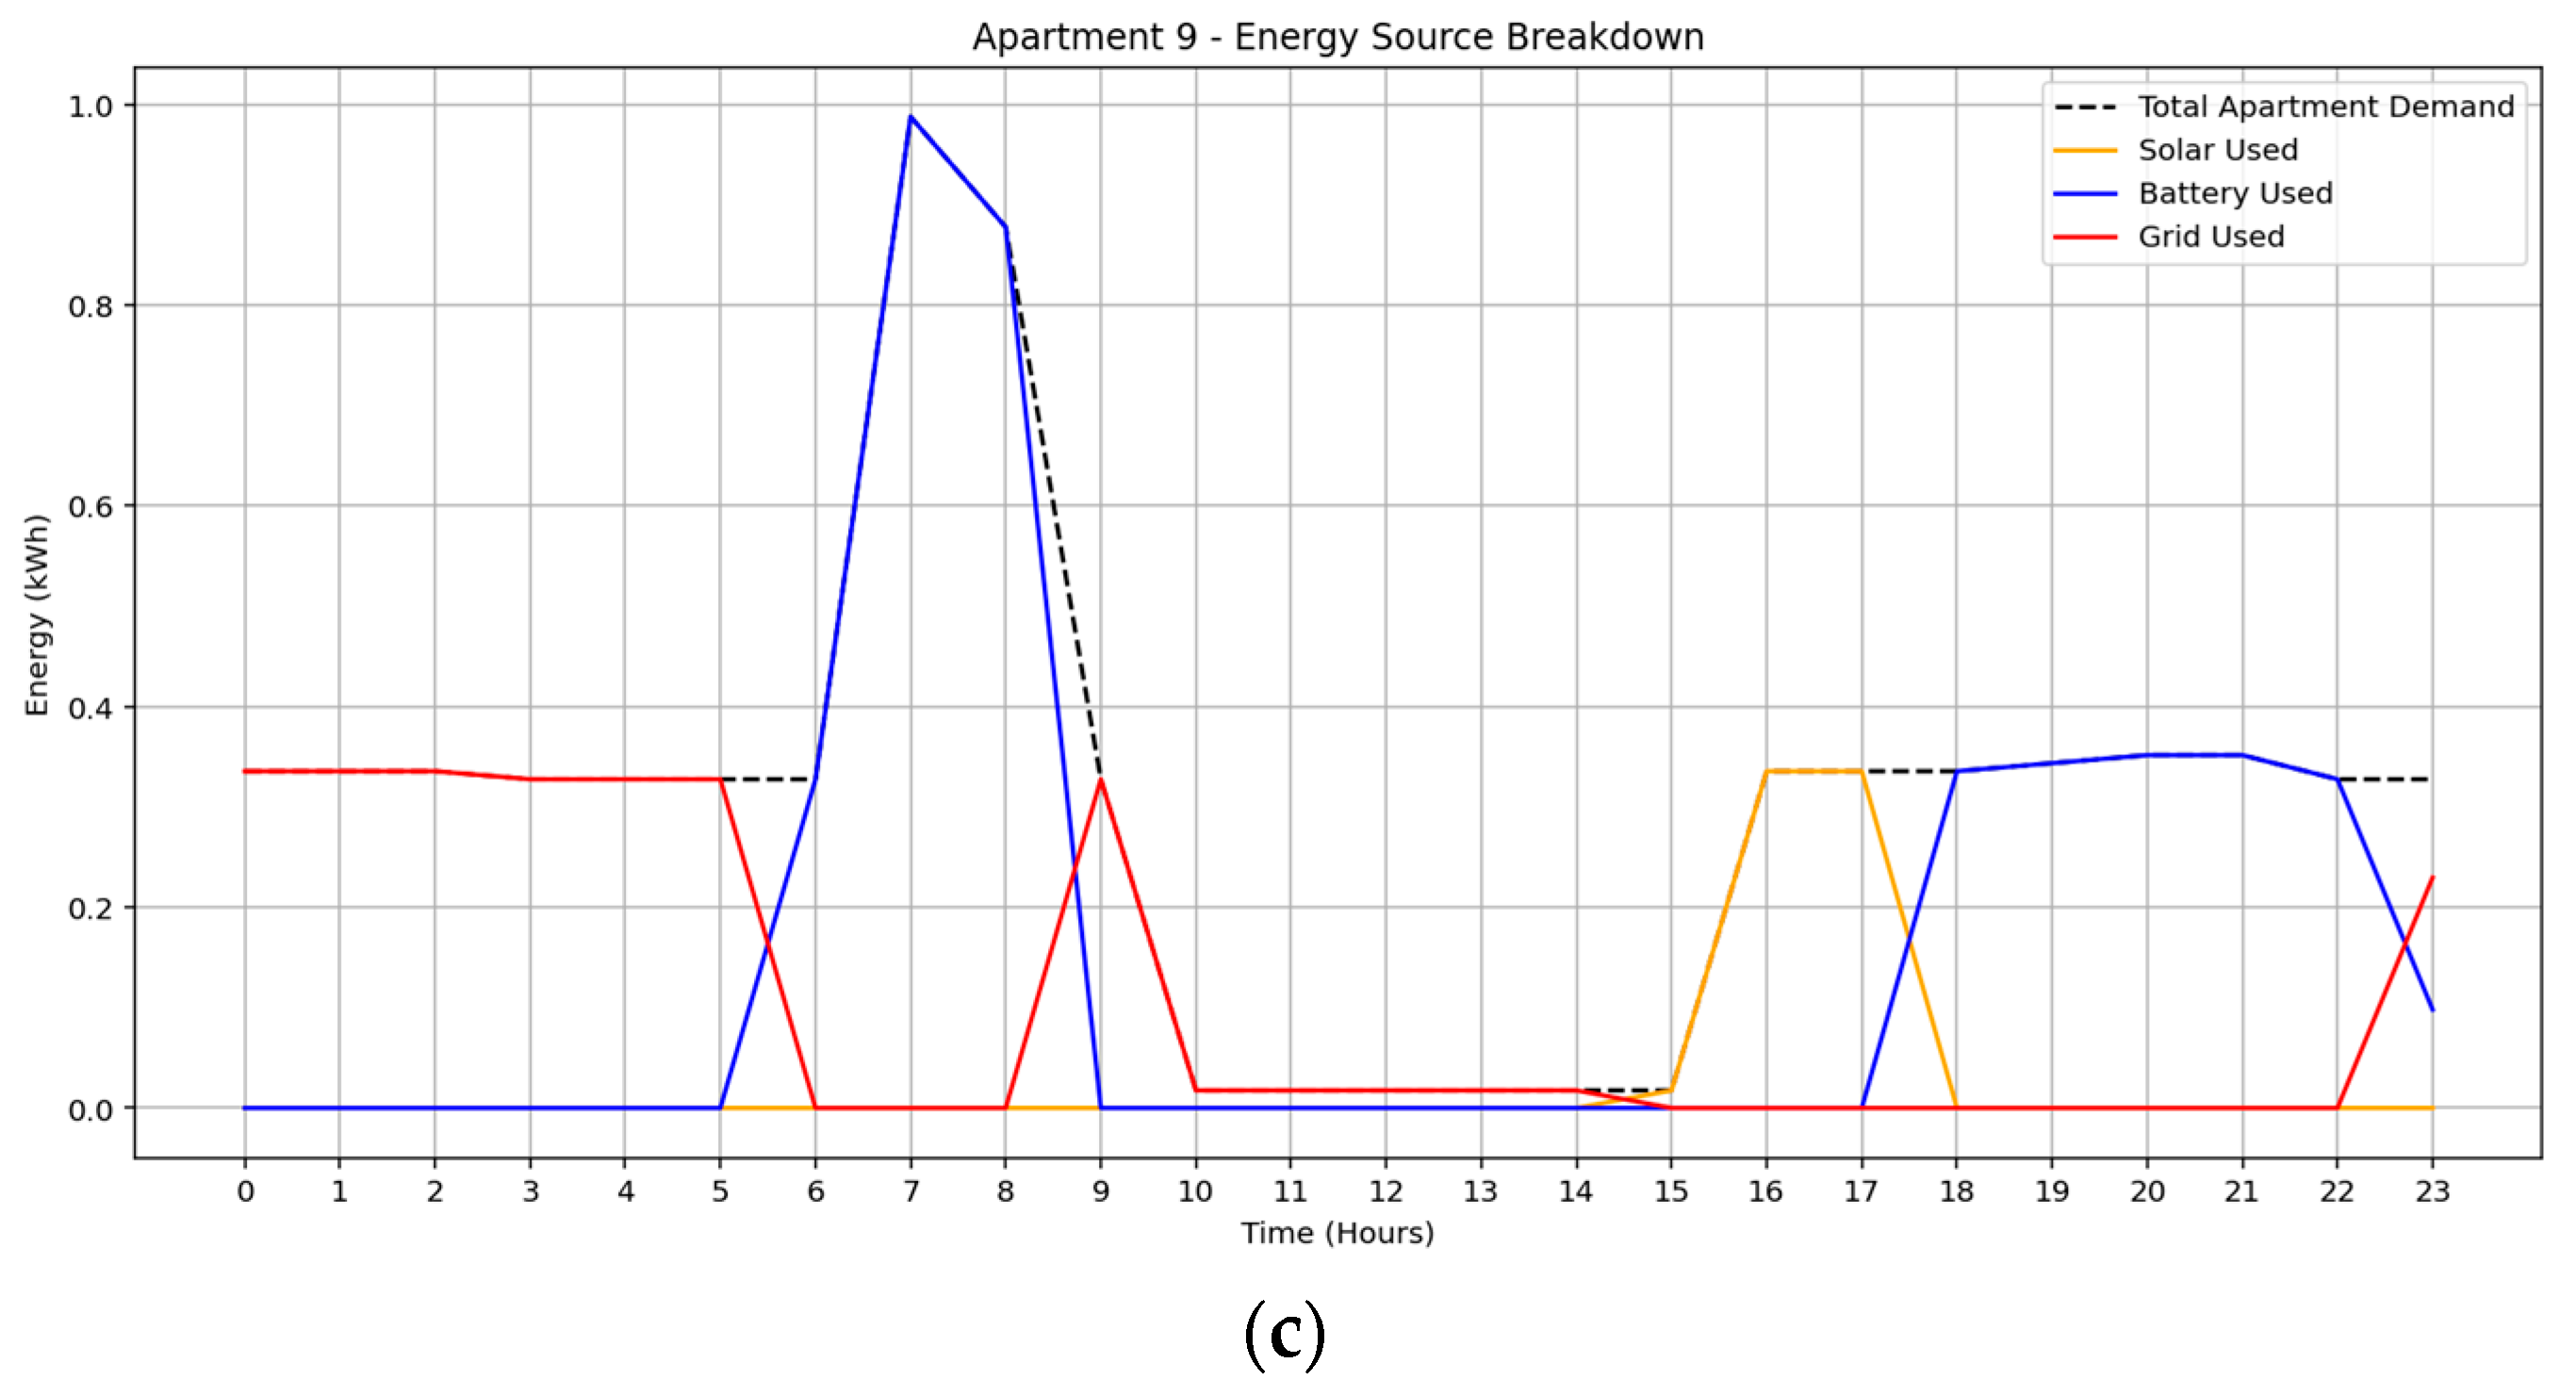
Under the February 2025 solar irradiance scenario in
Figure 8a–c, apartment 2 exhibited the highest grid dependency primarily between 09:00 and 14:00, with limited solar and moderate early-morning battery usage, resulting in a total energy cost of
$0.64. Apartment 6 demonstrated a more balanced mix, utilizing 2.19 kWh from solar, 2.08 kWh from battery, and 3.71 kWh from the grid. Grid reliance was concentrated early in the day, while battery discharge compensated for reduced solar availability after 16:00, yielding a total cost of
$0.97. Apartment 9 achieved the highest battery utilization (4.00 kWh), with moderate grid use (2.63 kWh) and minimal solar (0.69 kWh), incurring a daily cost of
$1.18. These results underscore the impact of consumption flexibility and energy availability on both source allocation and cost outcomes.
Table 6 summarizes apartment-level energy costs under September and February solar irradiance conditions. The costs are broken down into local energy usage (solar and battery) and grid electricity. Seasonal differences in solar availability and demand timing influence cost variation across apartments. February’s extended daylight hours enable greater battery charging and reduce grid reliance, while September sees higher grid usage during evening peaks. The results reflect the model’s ability to adapt energy allocation dynamically, ensuring cost efficiency despite varying load profiles and seasonal conditions.
3.5. Distributional Analysis of Total Residential Energy Consumption
The seasonal variation in energy source allocation for a multi-apartment residential building under optimized energy management is illustrated in
Figure 9a,b. The integration of EV charging as a shared flexible load increases total energy demand and elevates grid electricity usage, particularly during early morning and late evening hours aligned with low-tariff periods. In September, solar energy is primarily available around midday, covering daytime common loads, while battery discharge supports evening apartment demand. Grid energy is predominantly used during non-solar hours to meet EV and common load requirements. In contrast, the February profile with longer solar duration and higher irradiance enables extended use of solar energy for both apartment and common loads, reducing grid reliance. Battery discharge is shifted to early morning and post-sunset hours, complementing solar availability. These outcomes demonstrate the optimization model’s responsiveness to solar variation, pricing signals, and flexible load integration, achieving a cost-effective and low-carbon operational strategy.
3.6. Grid Electricity Utilization Across Seasonal Profiles
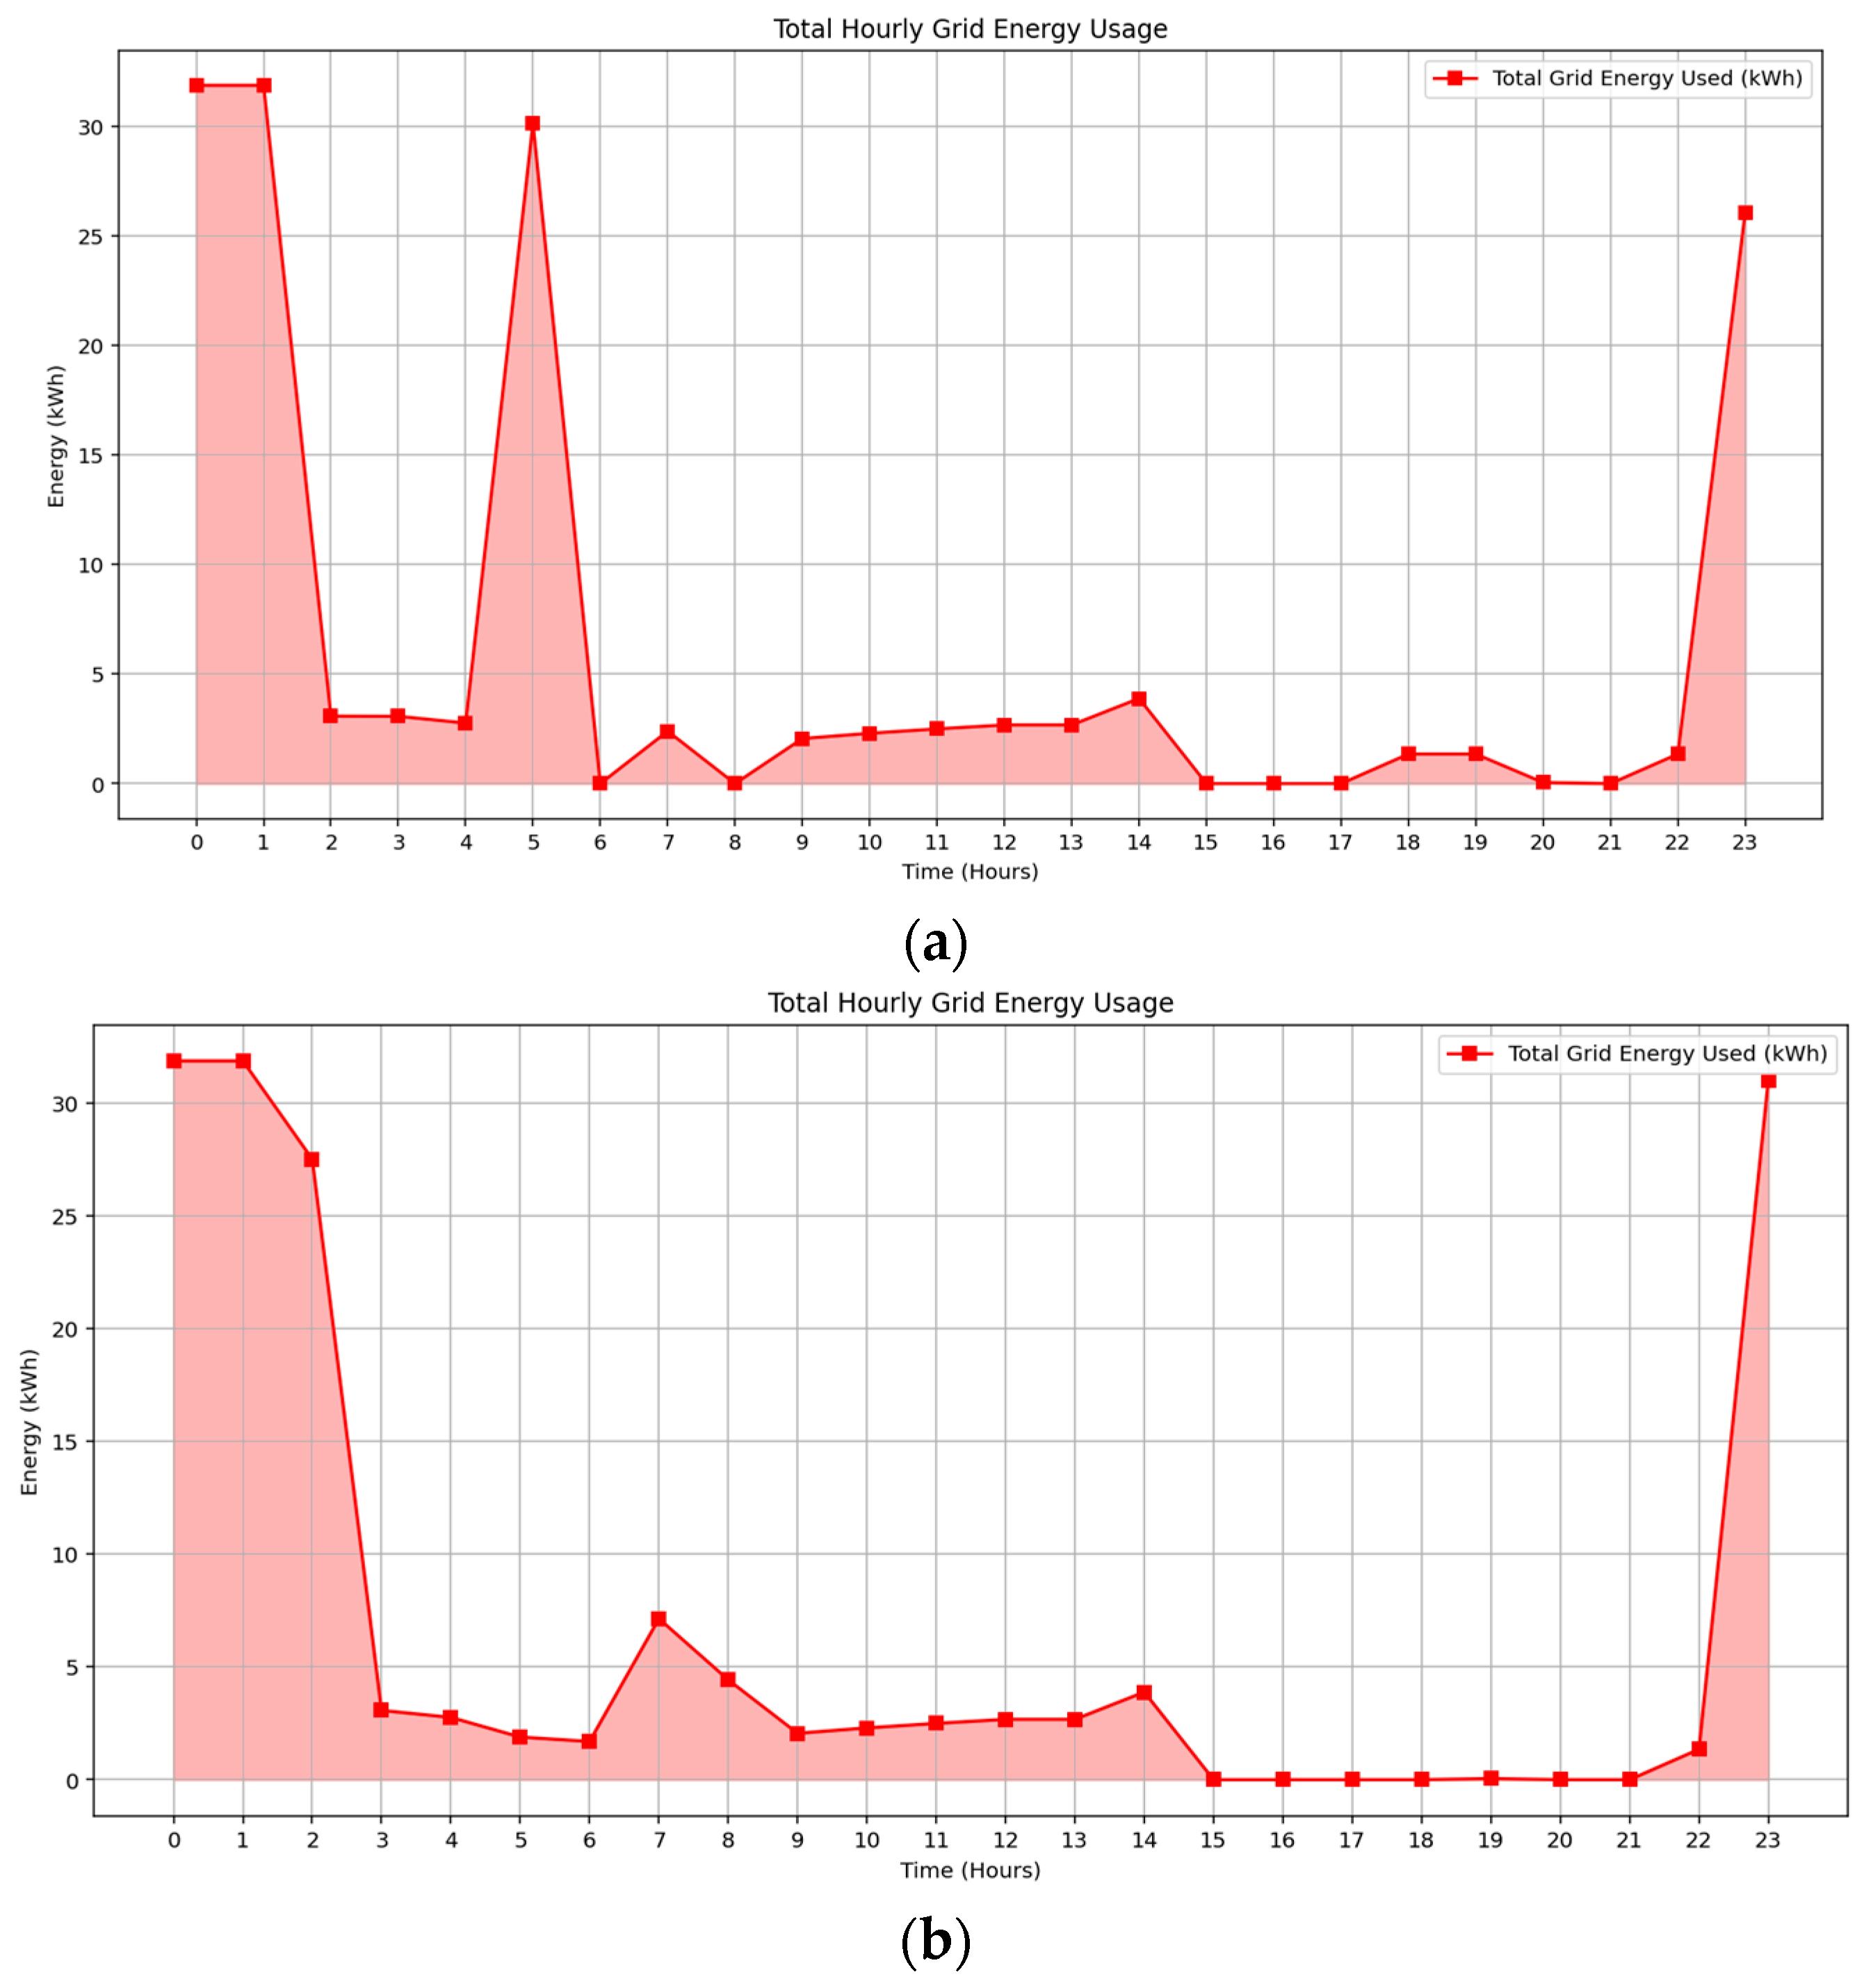
Simulation results confirm that the observed increase in grid electricity consumption is primarily driven by the integration of EV charging stations, with peak usage occurring during early morning and late evening hours aligned with low-tariff periods.
Figure 10a,b, illustrate hourly grid consumption under September and February irradiance profiles, highlighting consistent usage during super off-peak tariff windows. In September, grid energy supports unmet apartment demand during midday and post-sunset periods due to limited solar availability. February demonstrates slightly higher grid usage overall, attributed to early-morning common load demand, particularly from pool pumps and hot water systems prior to solar generation onset. Despite increased grid reliance, the optimization model effectively utilizes time-of-use pricing and flexible scheduling to minimize operational costs while maintaining seasonal adaptability.
3.7. Analysis of Excess Solar Energy Export Under Seasonal Variability
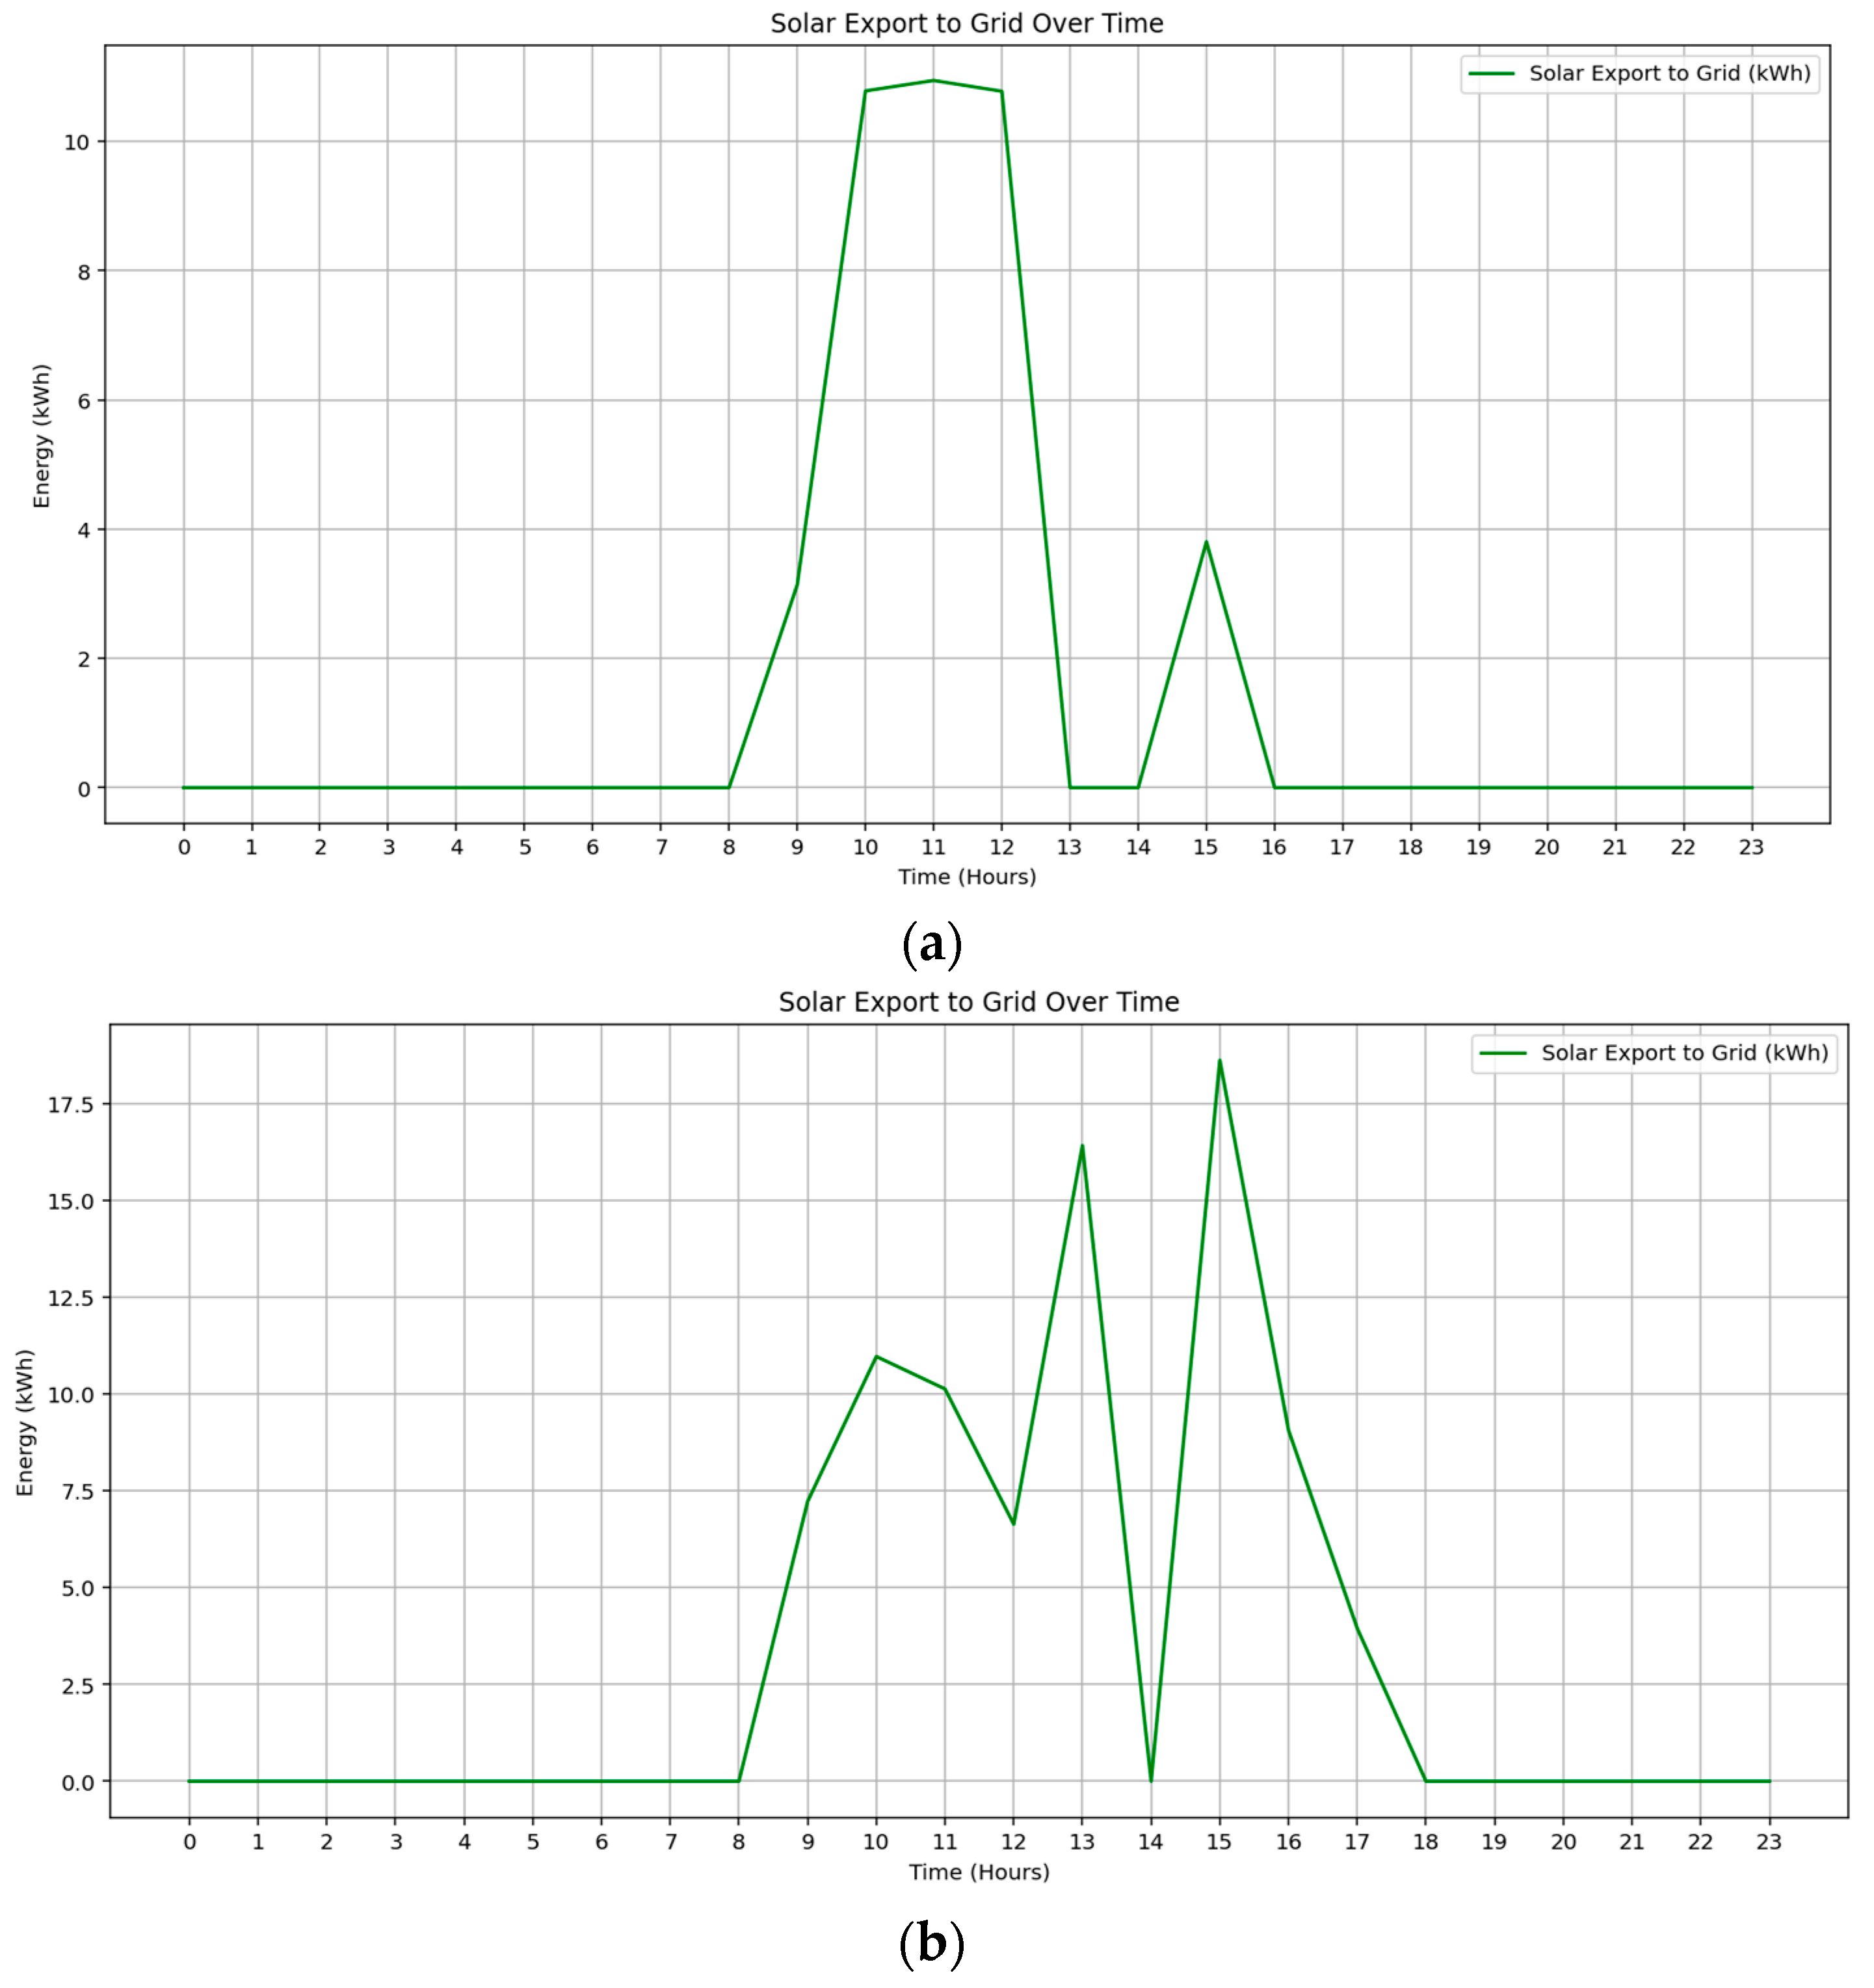
The seasonal comparison of solar export is presented in
Figure 11a,b, demonstrating the model’s adaptive capability to optimize surplus energy allocation. In September, solar export peaks at approximately 10.8 kWh/hour between 10:00 and 13:00, yielding a total revenue of
$1.09. The low export volume reflects the model’s prioritization of internal demand, including apartment and EV loads. Conversely, the February scenario exhibits higher export activity, with hourly peaks exceeding 15 kWh and total revenue reaching
$4.19. This increase is attributed to longer daylight duration and enhanced solar generation. These results confirm that the MILP-based optimization model dynamically schedules solar exports to enhance economic return while maximizing local renewable energy utilization.
3.8. EV Charging Demand
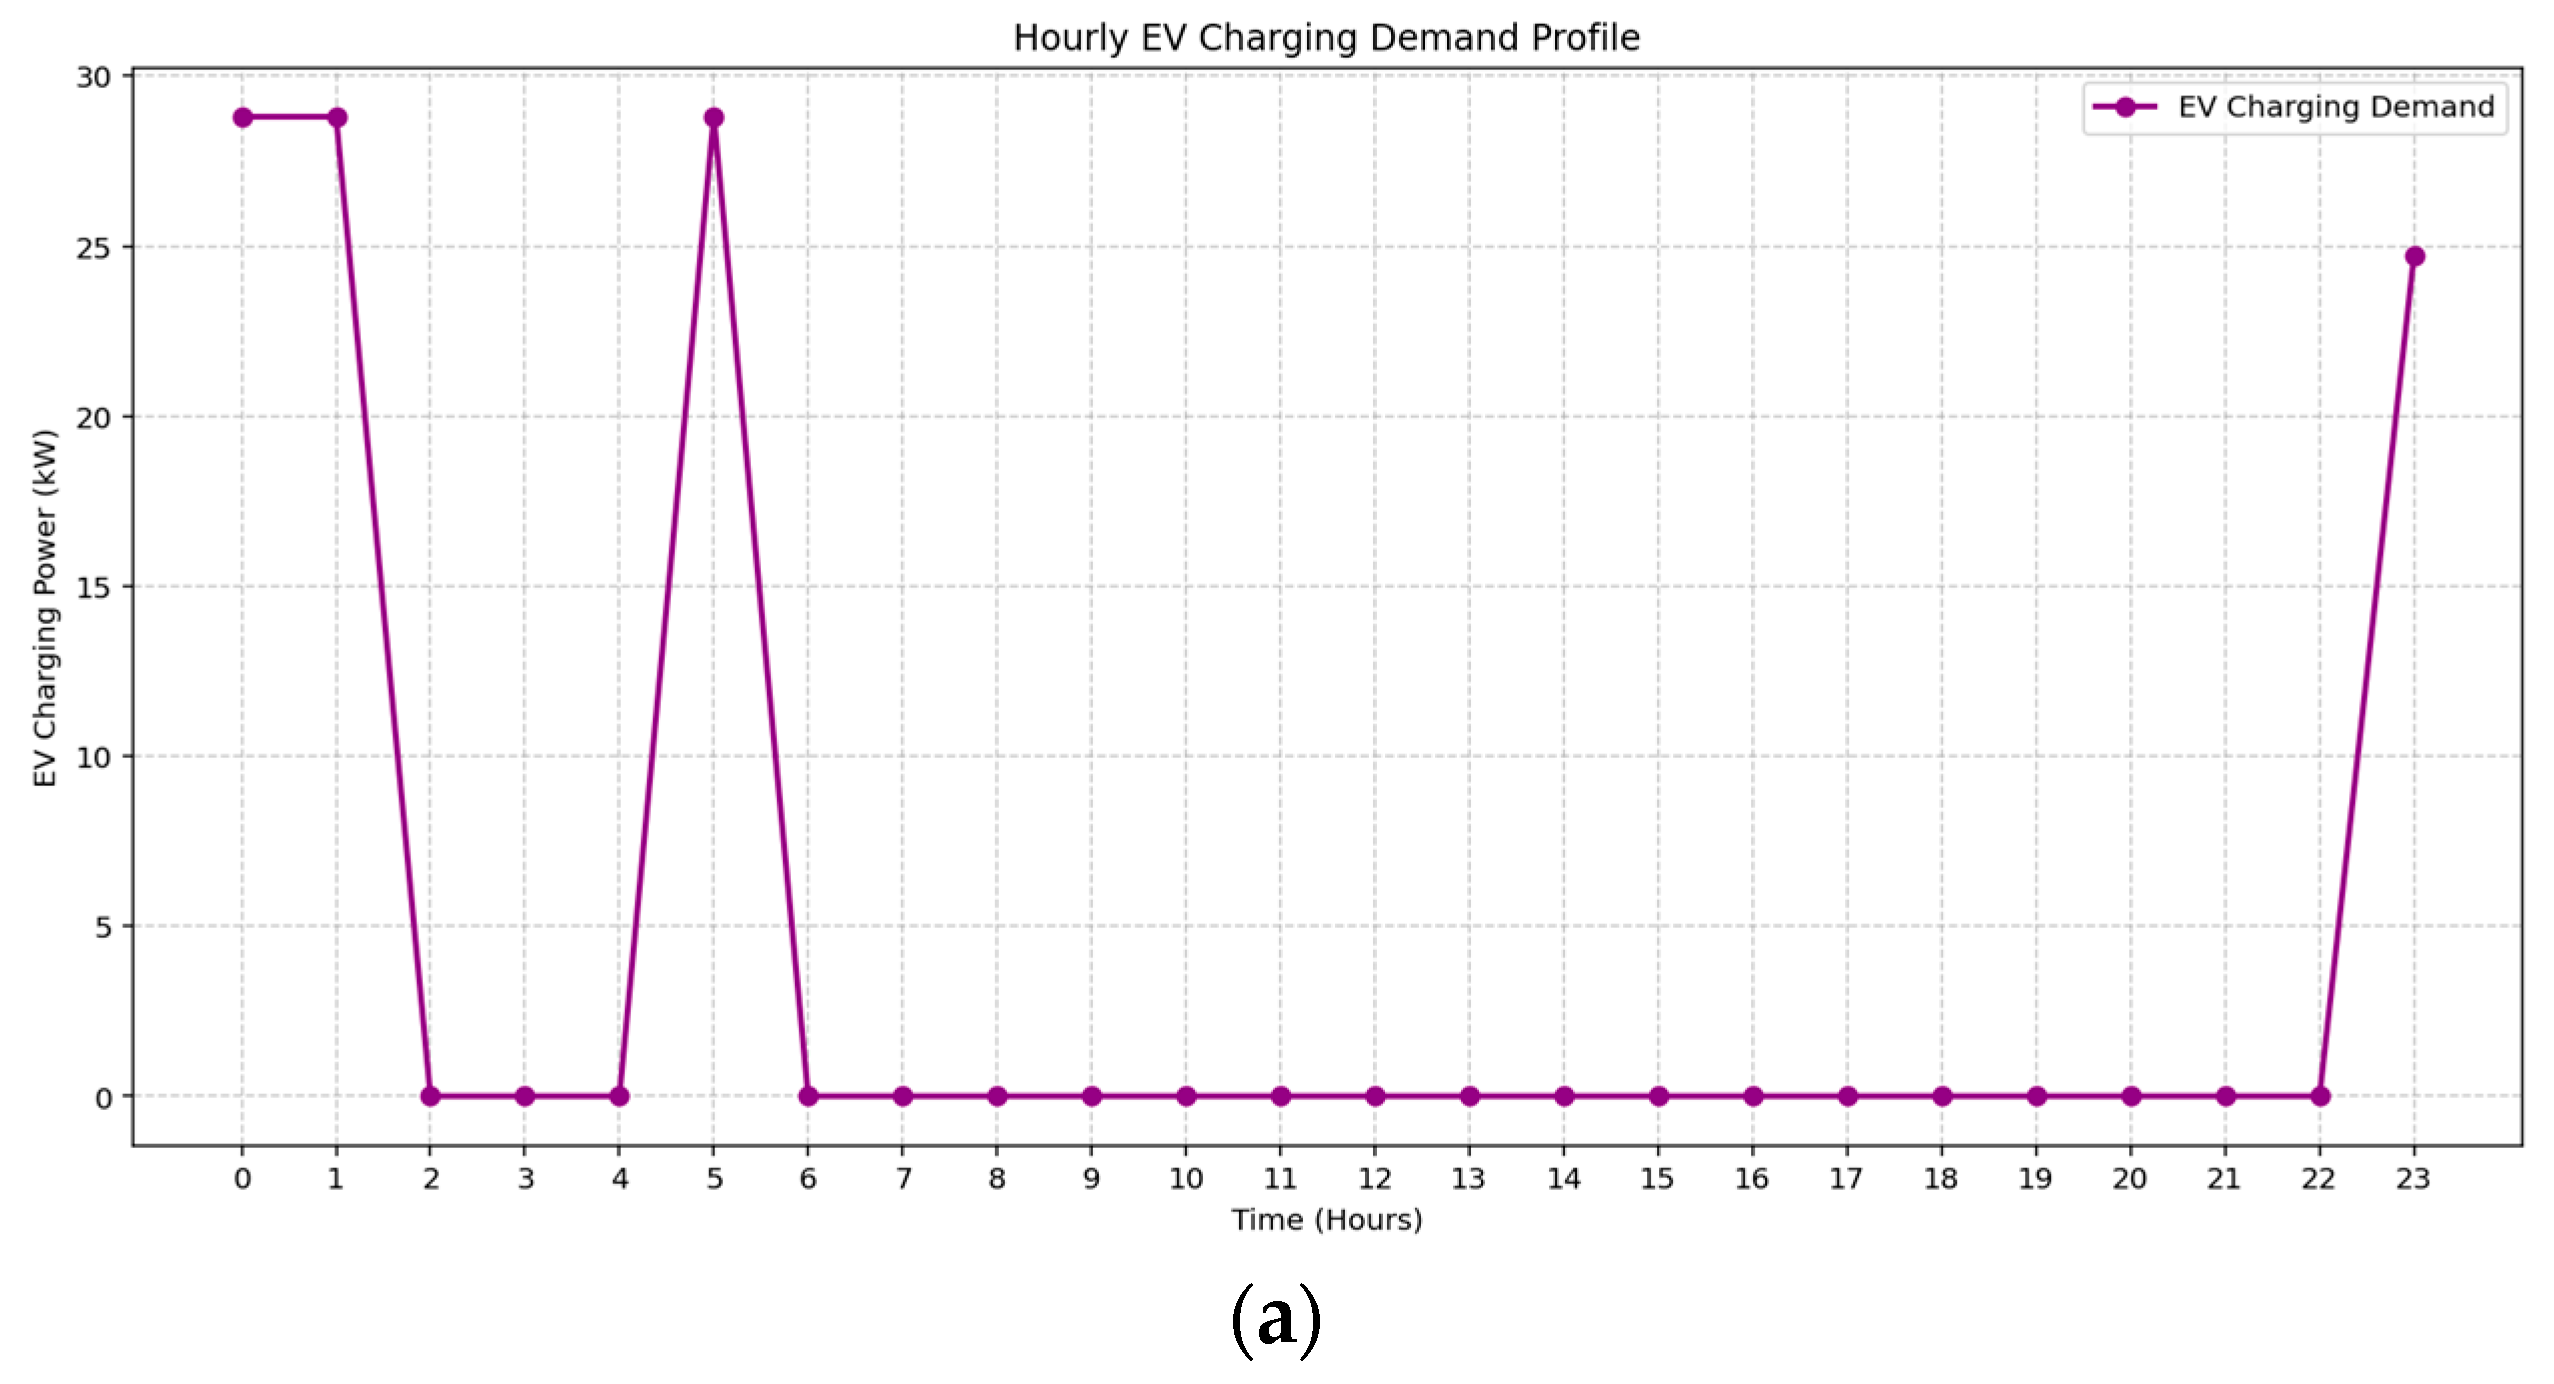
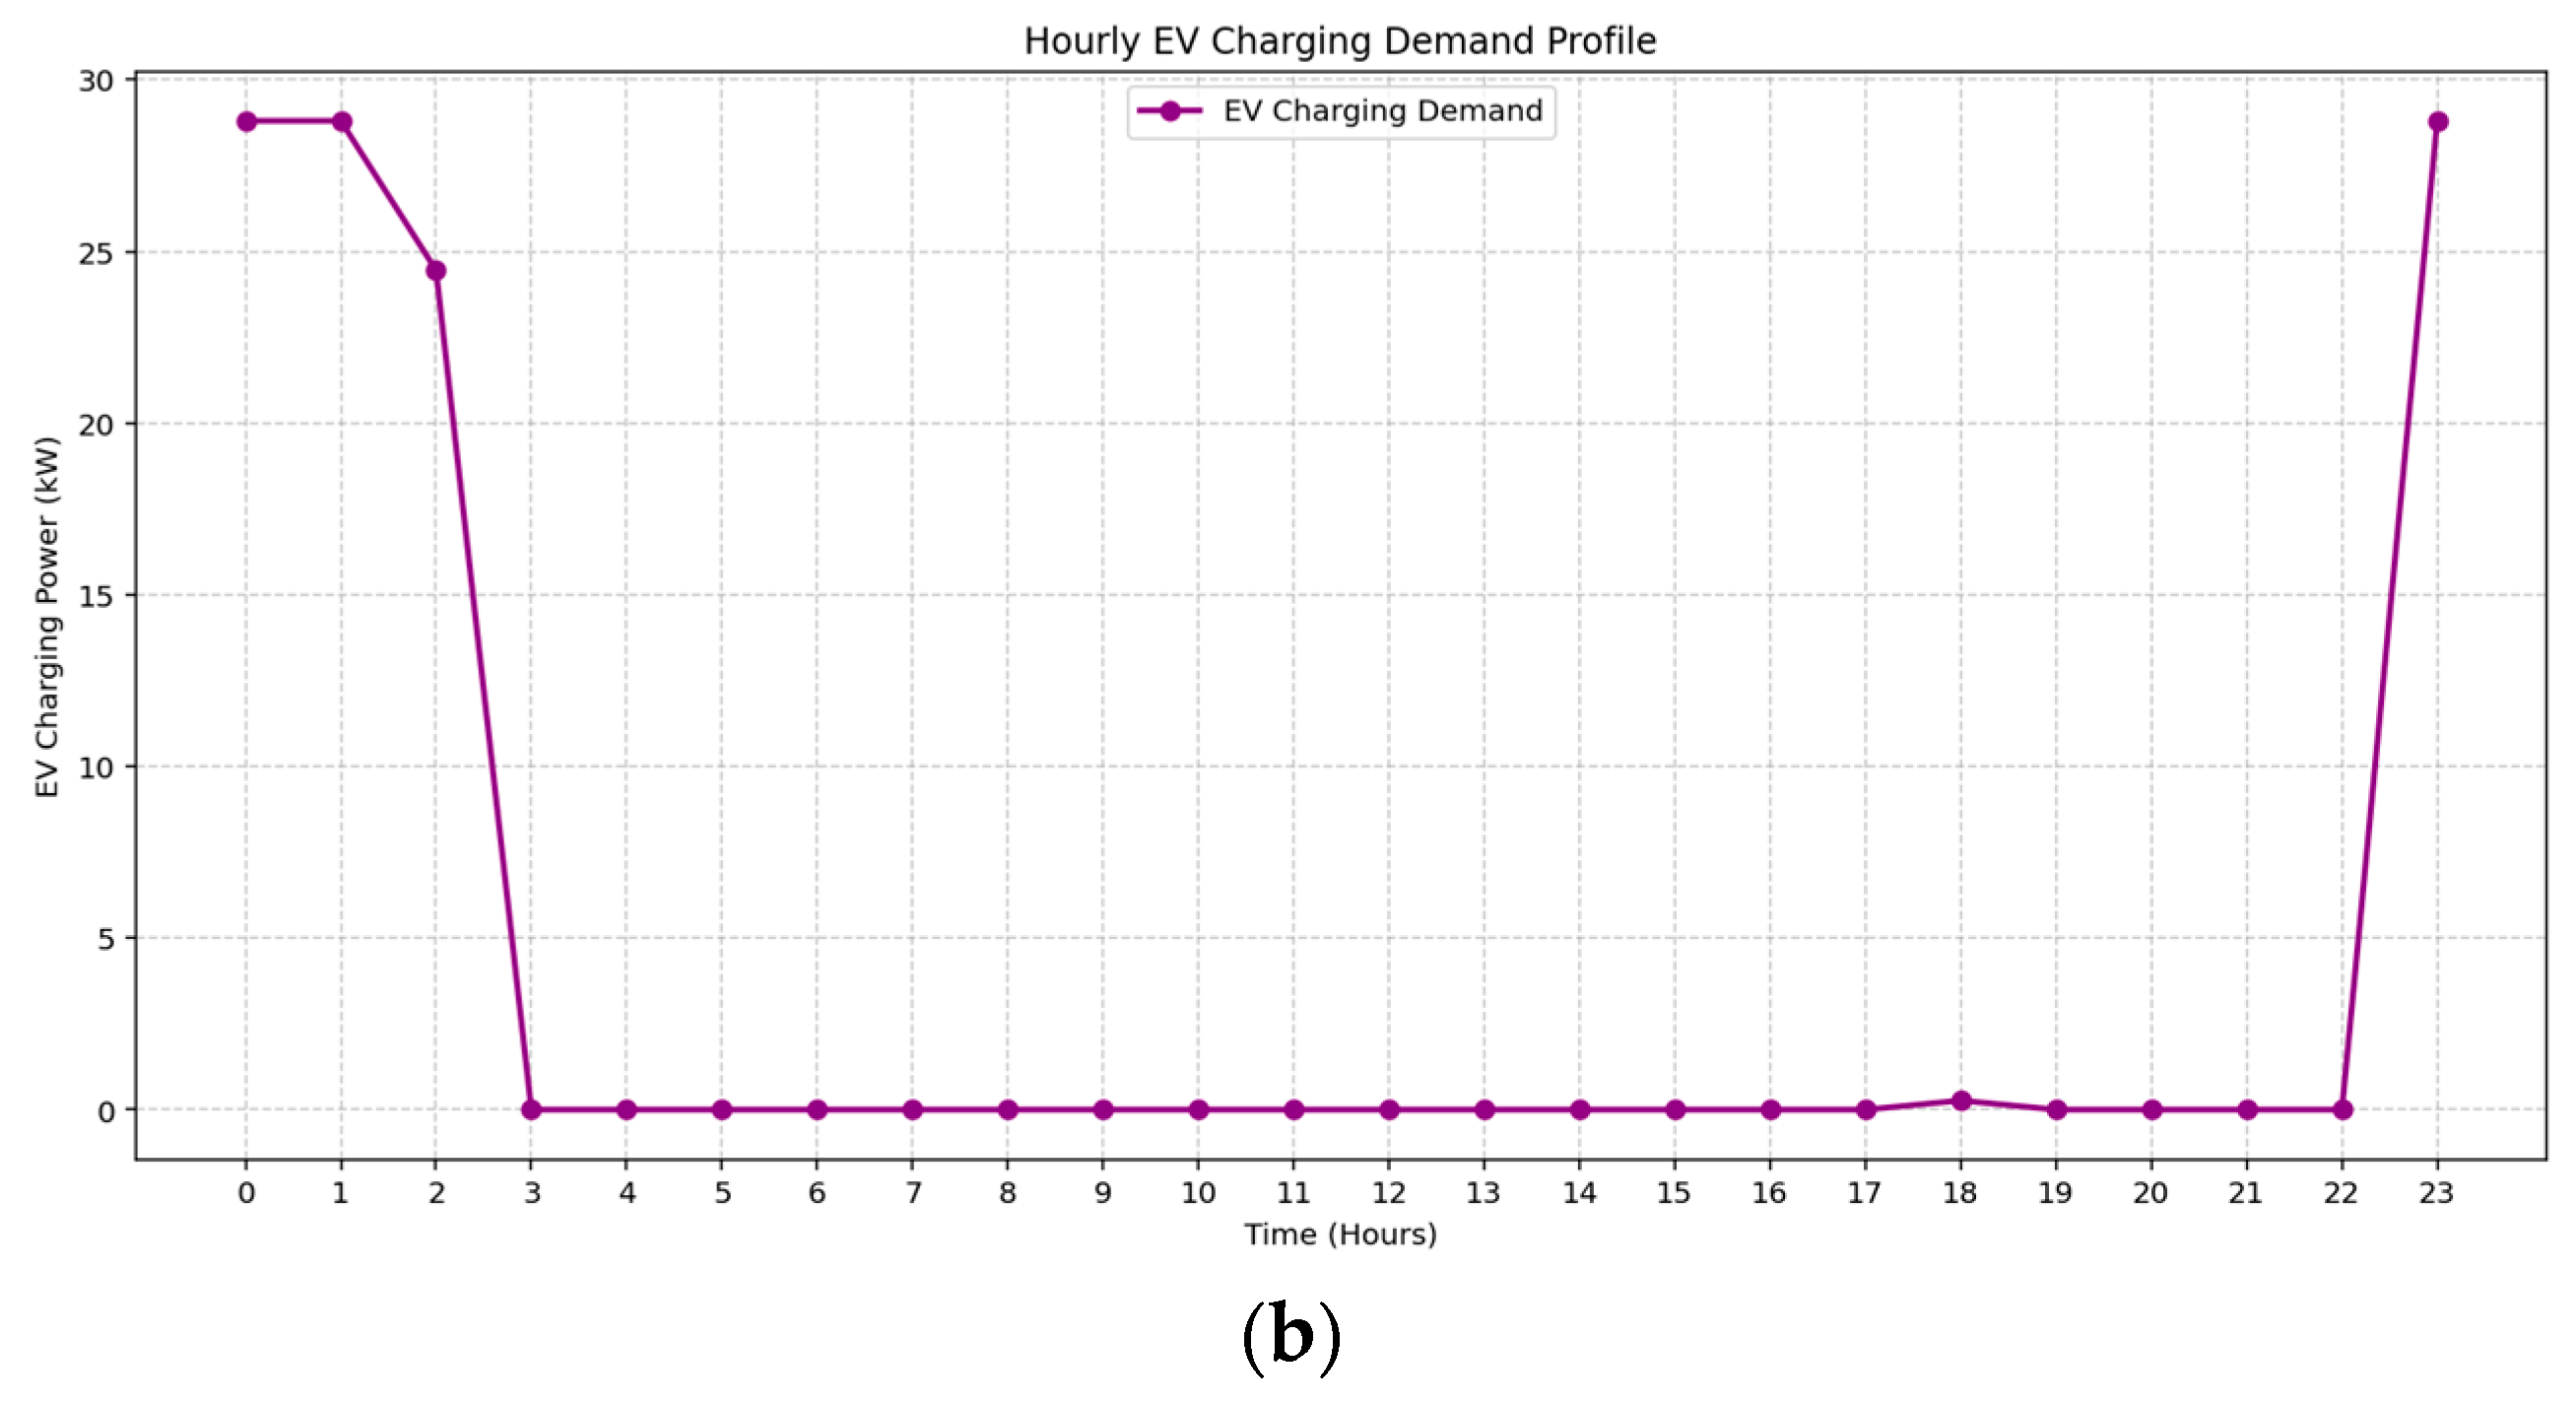
The 24 h distribution of EV charging demand under two seasonal profiles is illustrated in
Figure 12a,b. In both cases, the optimization model demonstrates effective flexible scheduling aligned with the time-of-use tariff structure. During Spring, EV charging is concentrated during super off-peak hours, particularly at midnight, 05:00, and 23:00, minimizing cost while avoiding overlapping with solar generation periods. Summer exhibits a denser charging pattern between 00:00 and 03:00 and again at 23:00, reflecting improved coordination with local PV availability and reducing conflicts with daytime loads. These patterns highlight the model’s capability to align EV charging with tariff windows and demand dynamics to ensure operational efficiency.
4. Discussion
Integration of EV charging as a flexible load into the multi-story residential building energy optimization model demonstrates the robustness and adaptability of the MILP-based control strategy under varying seasonal conditions. The optimized scheduling and allocation of energy resources achieved efficient operation over the 24 h period, minimizing total energy costs and delivering benefits to both the property owner and residents. This scenario shows improved utilization of the community-shared battery, highlighting increased reliance on local energy sources and a more balanced use of grid electricity primarily during super off-peak hours for EV charging.
Table 7 provides a summary of energy cost components for two seasonal scenarios. In the September scenario (Spring), lower solar irradiance led to a reduced solar export revenue of
$1.09 and limited solar energy availability during key load hours. This directly impacted the common load cost, which escalated to
$24.84, as a large portion of the EV and facility loads had to be met from the grid. However, apartment energy costs remained moderate at
$8.21, reflecting effective prioritization of solar and battery resources for residential demand. The total building energy cost reached
$31.92, which corresponds precisely to the MILP model’s optimal objective value, indicating accurate formulation and convergence of the optimization. In the February scenario (Summer), enhanced solar irradiance and broader daytime distribution resulted in higher solar export revenue (
$4.19) and improved self-consumption. Although common load costs increased slightly to
$25.98, primarily due to EV charging demands outside solar hours, this was effectively offset by export gains, reducing the total building cost to
$29.95. The apartment energy cost remained stable at
$7.44, highlighting consistent residential demand patterns. To assess the techno-economic benefit of the proposed optimization framework, a comparative evaluation was conducted between the optimized energy allocation scenario and a baseline case where the apartment relies solely on grid electricity. For Apartment 3, which has a total daily energy demand of 8.28 kWh, the calculated electricity bill under full grid reliance using Synergy’s Midday Saver Time-of-Use tariff amounts to AUD 1.62/day. In contrast, under the proposed optimization model incorporating rooftop solar PV, battery storage, and flexible load scheduling, the daily energy cost was reduced to AUD 1.06 in spring (Day A) and AUD 1.00 in summer (Day B). This reflects a cost reduction of approximately 34–38%, highlighting the value of integrated energy management strategies in multi-residential buildings.
The MILP optimization framework effectively managed complex energy flows by strategically shifting EV charging to lower tariff rates, enforcing equal battery capacity allocation to apartments, reducing dependency on grid electricity during peak hours and capitalizing on time-sensitive solar export tariffs. Overall, the results confirm that the inclusion of EV charging as a time-flexible demand component significantly enhances the realism and effectiveness of the energy optimization framework. The model successfully supports both economic and low-carbon performance across the entire multi-story residential system.
Conventional energy management systems in residential buildings often rely on static allocation rules, fixed scheduling, or non-optimized heuristics that do not dynamically respond to real-time energy prices, solar availability, or flexible demand behavior. These traditional approaches typically assume uniform load patterns and allocate energy resources (e.g., solar PV or battery discharge) based on pre-defined priorities without optimization. In contrast, the proposed Mixed-Integer Linear Programming (MILP) optimization framework introduces a dynamic and cost-aware decision-making mechanism that responds to hourly fluctuations in demand, solar generation, and electricity tariffs. Unlike conventional systems, the MILP model optimally allocates energy from solar PV, battery storage, and the grid to minimize operational costs; Ensures fairness and ownership-specific constraints, particularly in shared battery systems; Adapts to seasonal variability, improving solar self-consumption under both high and low irradiance conditions. Moreover, by quantifying energy flows and economic outcomes at each time step, the proposed MILP framework enables precise techno-economic evaluation, offering a replicable model for scalable community energy sharing in multi-story buildings.
To enhance the applicability of the proposed energy management model, several future research directions are identified. These include integrating real-time occupant behavior and appliance-level monitoring for improved demand-side management accuracy; enabling flexible appliance scheduling supported by user-centric incentives; introducing peer-to-peer energy trading mechanisms to facilitate localized energy exchange; and incorporating architectural and infrastructure considerations for EV and battery integration to address spatial and regulatory constraints.
5. Conclusions
This study addresses a critical challenge in urban energy management by optimizing demand-side strategies within the complex operational context of multi-story residential buildings. These environments are typified by shared infrastructure, diverse occupant behavior, and variable load profiles, which complicate traditional energy management practices. The proposed framework integrates rooftop photovoltaic (PV) systems, smart appliances, shared community battery storage, and grid electricity into a behind-the-meter community energy-sharing model. Optimization is achieved using a Mixed-Integer Linear Programming (MILP) approach, which minimizes total electricity costs over a 24 h horizon. The model incorporates appliance-level scheduling, time-of-use (ToU) pricing reflective of Western Australian tariffs, equitable battery allocation, flexible electric vehicle (EV) charging, and surplus solar export mechanisms. The framework was validated using two representative seasonal irradiance scenarios, September (spring) and February (summer), to evaluate performance under varying solar conditions. Results demonstrate that greater solar availability enhances on-site energy utilization and reduces grid dependency. The load profiles were developed using real smart appliance specifications and realistic residential behavior archetypes, improving the model’s applicability. Furthermore, ownership-aware constraints and individualized apartment billing were introduced to ensure equitable energy cost allocation, promoting transparency between tenants and strata-managed property owners.
Overall, the findings highlight the potential of community-based energy management systems to significantly support decarbonization objectives, enhance grid resilience, and facilitate the transition toward net-zero energy buildings. This research provides a strong foundation for future advancements in intelligent, equitable, and community-empowered residential energy systems.
